

Occurrence, Distribution and Ecological Risk Assessment of Contaminants in Baiyangdian Lake, China

1
Key Laboratory of Urban Environment and Health, Key Laboratory of Urban Metabolism of Xiamen, Institute of Urban Environment, Chinese Academy of Sciences, Xiamen 361021, China
2
University of Chinese Academy of Sciences, Beijing 100049, China
*
Author to whom correspondence should be addressed.
Water 2022, 14(21), 3352; https://doi.org/10.3390/w14213352
Submission received: 8 September 2022
/
Revised: 19 October 2022
/
Accepted: 20 October 2022
/
Published: 22 October 2022
(This article belongs to the Special Issue Pollution Control and Ecological Restoration in Freshwater and Marine Systems)
Abstract
:Understanding the ecosystem risk of contaminants in the surface water of lakes in scenic areas is important for environmental management. Here, a comprehensive ecological risk assessment evaluation method was established to assess the ecological risk of 14 water quality indicators of Baiyangdian Lake in the spring, summer, and autumn. The results show that the indices of ammonia nitrogen and permanganate exceed the Class III standard limit for water quality. Baiyangdian Lake is generally in a state of mesotrophication, and some areas are slightly eutrophic; the degree of eutrophication is higher in the summer and autumn than in the spring. The lake water at the inlet is eutrophic and polluted, with an inferior water quality. Heavy metals are almost not detected in Baiyangdian Lake. The heavy metal pollution indices of Nanliuzhuang and Caiputai are slightly higher than those of other areas. The ecological risk quotient of petroleum is high. The comprehensive ecological risk of the Baiyangdian Lake is at Level 4, owing to the continuous development of aquaculture and tourism in recent years. We should start the monitoring, management, and strengthening of water quality supervision to achieve the ecological and environmental planning goals of Baiyangdian Lake.
1. Introduction
Lakes have a variety of ecological functions, such as regulating and storing water, improving water quality, providing habitats for animals, regulating local climate, and providing drinking water and food for humans. Across the world, especially in developing countries, because of developments from urbanization, population increases, and industrial developments, huge environmental pressures have been placed on lake water environments, resulting in the pollution of lake water environments and the degradation of their ecological functions [1]. Carrying out an ecological risk assessment of the environmental pollution in lake water is within the premise of the effective management of lake water environments. Countries all over the world have begun to pay attention to the research on ecological risks. At first, the results of ecological risk research were mainly used to analyze the possibility of accidents and their consequences [2,3]. Later, ecological risk receptors were extended to human health, mainly to evaluate the possible harm and consequences of risk substances to human health [4,5]. In the 1990s, ecological risk receptors expanded from human health to the ecosystem itself and the multiple species in it, and an ecological risk assessment framework was eventually proposed [6,7]. In 1992, the USEPA promulgated the Ecological Risk Assessment Framework and, in 1998, issued the Ecological Risk Assessment Guidelines [8]. In 2003, the European Union issued the Risk Assessment Technical Guidance Document. The role of ecological risk assessment has gradually become prominent.
Conventional water pollution indicators, including eutrophication, heavy metals, and organic pollutants in major river systems, have been widely investigated in lake water assessments in recent years [9,10]. For instance, the evaluation and interpretation of complex water quality data in Baiyangdian Lake have been reported [11]. The integration of water quality indices was adopted for assessing the surface water quality of Qaroun Lake, Egypt [12]. Moreover, the environmental risk of the upper rivers of Baiyangdian Lake has been assessed [13]. However, this ecological risk assessment only focused on organic pollutants, heavy metals, and eutrophication. The investigation of a comprehensive risk assessment of organic and inorganic indicators in lake water is scarce.
As the largest shallow lake in the North China Plain, Baiyangdian Lake plays an important role in regulating the climate, replenishing the groundwater, and maintaining the ecological balance. However, in recent years, due to global climate change and disorderly development, Baiyangdian Lake has experienced a decrease in water inflow, a shrinkage of wetland area, sediment deposition, frequent water pollution incidents, and a decline in biodiversity. Protecting and controlling the ecological environment of Baiyangdian Lake are of great significance to promoting the completion of the overall planning of the Xiongan New Area, which is a concentrated place bearing Beijing’s non-capital functions. Therefore, the pollution problem of Baiyangdian Lake is typical in ecological risk assessments, and solving its environmental problems is of great significance to the development of China. A series of data accumulated by the local government of Baiyangdian Lake provided the basis for research on solving these problems.
Thus, this study aimed (1) to build a comprehensive ecological risk assessment system for lake water environments, and (2) to take Baiyangdian Lake as an example and to analyze its water indicators to explore the level and the spatial distribution of its ecological risk.
2. Methods
2.1. Study Area
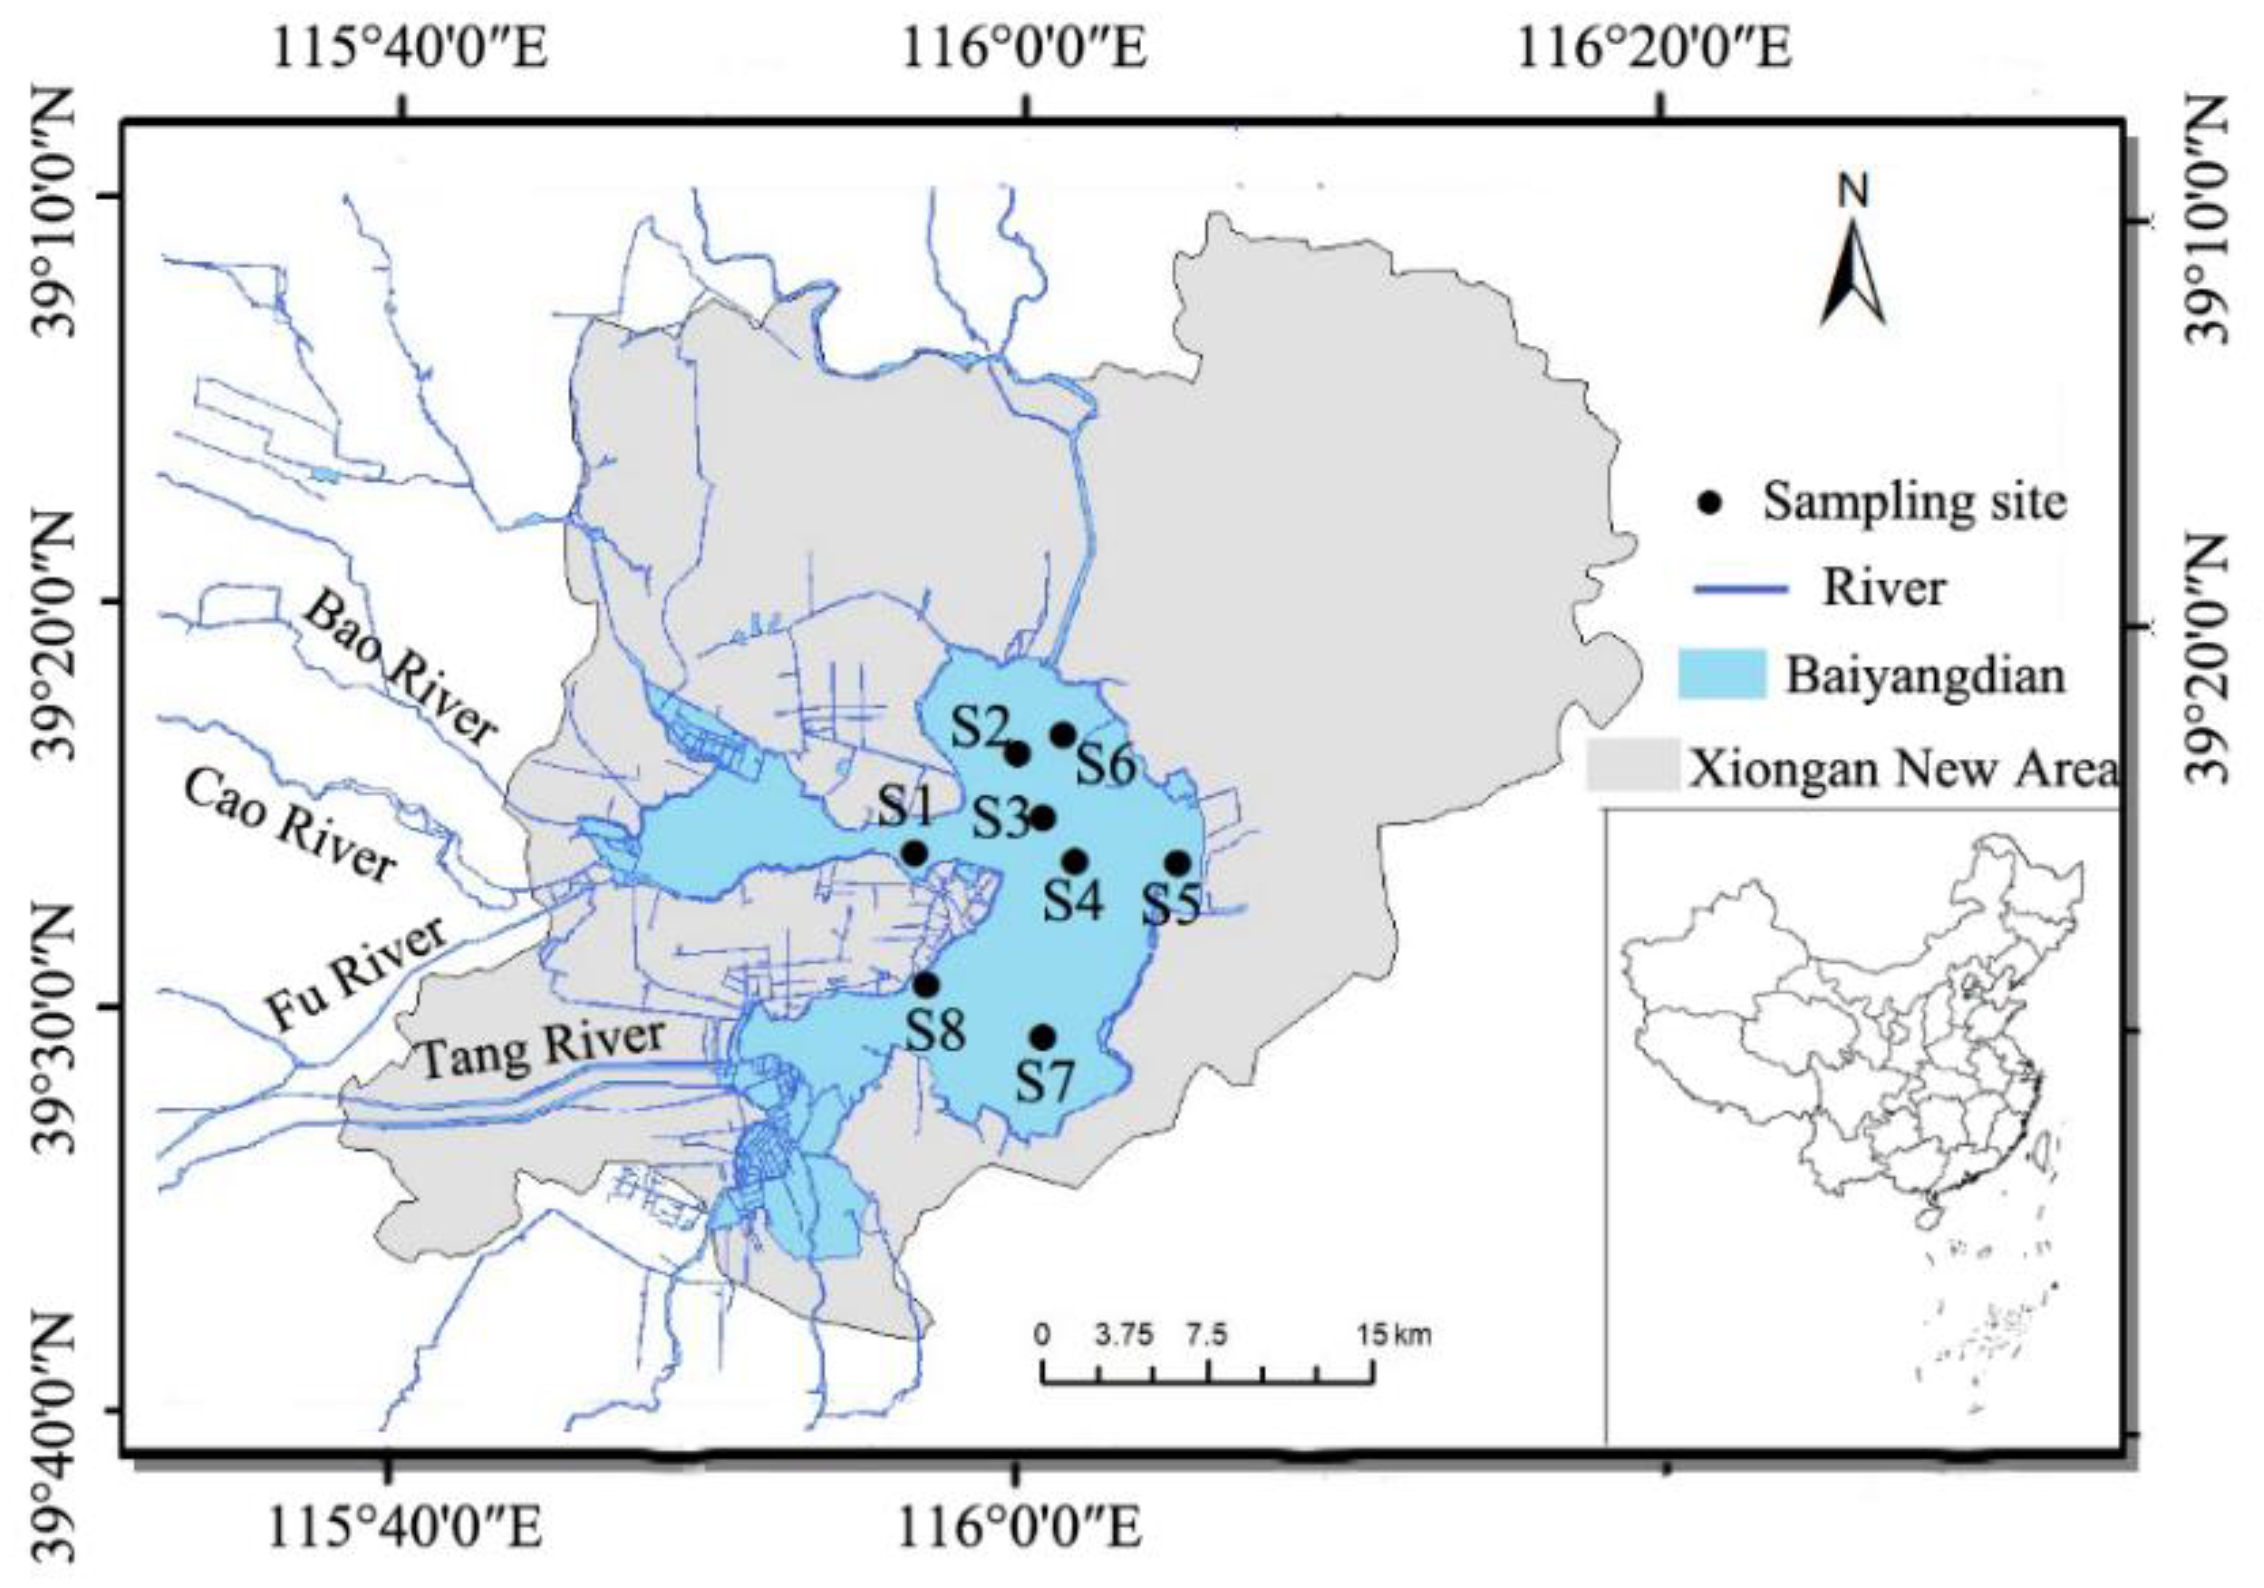
Baiyangdian Lake is the largest freshwater shallow lake in the North China Plain, which is in the warm, temperate, and semi-humid continental monsoon climate zone. The annual average air temperature here is 12.2 °C, with an extreme maximum temperature of 40.7 °C and an extreme minimum temperature of −26.7 °C. The annual average precipitation and evaporation are 529.7 mm and 993.0 mm, respectively. The lake covers a total area of 366 km2, with a watershed area of 3.12 × 10⁴ km2. The lake’s bottom elevation is 3.6 m. The multi-year average elevation of the lake surface is 10.50 m. The maximum and the average water depth are 6.0 m and 3.6 m, respectively. The terrain of the basin is complex, with mountains, hills, plains, and depressions. The terrain inclines from northwest to southeast, the ground slope is 1:2000, the western half has the highest altitude of 10 m, and the eastern half has the lowest altitude of 5.5 m. Baiyangdian Lake belongs to the Daqing River system. In this river system, there are nine rivers, including Zhulong River, Tang River, Fu River, Cao River, Pu River, Xiaoyi River, and Juma River, flowing into Baiyangdian Lake. Before 2017, Baiyangdian Lake was under the jurisdiction of Baoding City and Cangzhou City in Hebei Province. Since April 1 in 2017, Baiyangdian Lake has become an important ecological lake for the development of the Xiongan New Area.
2.2. Sampling Sites
The distribution of the sampling sites in Baiyangdian Lake is shown in Figure 1. Basic information about the sampling sites is listed in Table 1. In this study, lake water samples were collected from 8 sites, which were controlled by the state and the province and were selected to analyze and evaluate the water quality of Baiyangdian Lake. S1 is Nanliuzhuang, which is located downstream from Fu River, Cao River, Bao River, and Ping River. S2 is Shaochedian, which is located in the core area of the national nature reserve. S3 is Wangjiazhai, which is located in the livestock and poultry breeding area. S4 is Guangdian Zhangzhuang, which is located in the aquaculture area. S5 is Zaolinzhuang, which is located at the outlet of Baiyangdian Lake. S6 is Quantou, which is located in the duck and fish breeding area. S7 is Caiputai, which is located in the still water accumulation area. S8 is Duancun, which is located at the inlet of Tang River.
2.3. Data Sources and Quality Assurance
The data for this study were obtained from the water quality data measured in the spring (April), summer (July), and autumn (October) seasons at 8 typical monitoring sites in Baiyangdian Lake, which were provided by the Department of Ecology and Environment of Hebei Provincial. According to the frequency of detection in water environments, the water pollution indicators in this study were determined, and a total of 14 water quality indicators in 4 categories were selected: conventional water pollution indicators including pH; dissolved oxygen (DO); transparency (SD); chemical oxygen demand (CODcr); five-day biochemical oxygen demand (BOD5) and permanganate index (CODMn), which were used to reflect water quality; eutrophication indicators including total phosphorus (TP) and ammonia nitrogen (NH4+-N), which were used to reflect the nutritional status of water quality; the heavy metal pollution index, including lead (Pb), cadmium (Cd), chromium (Cr), arsenic (As), and mercury (Hg), which can reflect the pollution status of heavy metals in water; and petroleum as the organic pollution index.
Overlying water (0.5 m depth) was collected according to the technical specification for the design of a water quality sampling scheme (HJ 495-2009). All samples were collected in duplicate from each site. The collected water samples were stored in an icebox and transported to the laboratory. The pH and DO of the water samples were measured in situ. The water detection methods are shown in Table 2. For quality assurance and control, the recoveries of each spiked sample, field blank, and duplicate sample were analyzed. Sufficient recoveries were achieved for all.
2.4. Single-Factor Ecological Risk Assessment Methods
The single-factor evaluation method was used to evaluate the ecological risk of Baiyangdian Lake’s water quality. This method is the main method for classifying water quality. At the same time, the main pollution factors can be accurately judged using the evaluation results [14].
The superstandard multiple indices, which are the excessive times compared with the standard limits of Class III in the National Standard for Water Quality, were used to characterize the status of the water pollution indicators [15]. The superstandard multiple indices were not calculated for the pH value and the DO. The equation to calculate the superstandard multiple index of each indicator is as follows:
The standard limits of routine items from the basic items of the surface water environmental quality standards are shown in Table 3:
The comprehensive eutrophic state index [16] was used to characterize the eutrophication status of Baiyangdian Lake. The equation for the comprehensive eutrophic state index is as follows:
where is the comprehensive eutrophic state index, Wj is the relative weight of the eutrophic state index of the jth indicator, and TLI(j) is the eutrophic state index of the jth indicator.
Taking the concentration of Chla as the benchmark indicator, the normalized correlation weight calculation formula of the jth indicator is as follows:
where rij is the correlation coefficient between the jth indicator and the concentration of Chla in Chinese lakes, and m is the number of eutrophication indicators.
The correlations rij and rij2 between the benchmark indicator and other indicators of Chinese lakes (reservoirs) are shown in Table 4:
The equations for calculating the eutrophic state indices of the eutrophication indicators are as follows:
where the unit of Chla is mg/m3, the unit of SD is m, and the unit of other indicators are mg/L.
According to the TLI(∑) value, the eutrophic degree of Baiyangdian Lake was classified, and the classification standards are shown in Table 5.
The comprehensive pollution index was used to evaluate the heavy metal pollution status. The comprehensive pollution index is widely applicable to water bodies and can reflect the comprehensive pollution degree of different heavy metal elements at each monitoring site [17,18]. The formulae for calculating the comprehensive pollution index are as follows:
where Pi is the single-factor pollution index of heavy metal element i, Ci is the measured concentration of heavy metal element i (mg/L), Si is the standard value for the concentration of heavy metal i (mg/L) (using the value of class I standard from the Chinese National Surface Water Environmental Quality Standard), n is the number of heavy metal elements, and I is the water quality comprehensive pollution index. When I ≤ 1, it means that the water area is free of heavy metal pollution; when 1 < I ≤ 2, it means that the water area is slightly polluted by heavy metals; when 2 < I ≤ 3, it means that the water area is moderately polluted with heavy metals; and when I > 3, it indicates that the water area is heavily polluted with heavy metals.
The risk quotient (RQ) was used to evaluate the organic pollution status. The RQ is based on chemistry and ecotoxicology, with strong operability and clear conclusions. It has been widely used in ecological risk assessment [19]. The formula for calculating the risk quotient RQ is as follows:
where MEC is the measured environmental concentration and PNEC is the predicted no-effect concentration. When RQ exceeds 1.0, the risk is high. When RQ ranges from 0.01 to 0.1 or from 0.1 to 1, the risk is low or medium, respectively. The PNEC values for chemical indicators in this study were obtained from acute toxicity data, evaluation factors, and the literature. Toxicity data of various chemical pollutants in water were obtained from the US Environmental Protection Agency EPAECOTOX database (Available online: http://www.epa.gov/eco-tox/, accessed on 1 October 2021).
2.5. Comprehensive Ecological Risk Assessment Method
A comprehensive evaluation of the ecological risk of Baiyangdian Lake was carried out using the barrel principle. This principle refers to the fact that, if a wooden barrel is composed of many wooden boards of different lengths, its water-holding function does not depend on the length of the longest wooden board or on the average length of the wooden board but on the length of the shortest plank. The evaluation results of conventional water quality, eutrophication, and heavy metal and organic pollution indicators were classified, and the highest risk of various water quality indicators was used as the comprehensive ecological risk. Table 6 shows the comprehensive ecological risk levels.
3. Results
3.1. Occurrence and Distribution of Contaminants in Lake Surface Water
As shown in Table 7, 89%, 83%, and 83% of the water pollution factors in Baiyangdian Lake were detected in the spring, summer, and autumn, respectively. Among them, the detected concentrations of the CODMn, the TP, and the NH4 were all high, in mg/L, and the detected concentrations of the metal pollution factors were all low, in μg/L. The concentration of the CODMn reached both its highest maximum value and highest mean value in the summer. The TP did not show a difference in its concentration across the three seasons. The NH4 also reached its highest mean concentration in the summer.
3.2. Conventional Pollution Index in Ecological Risk Assessment
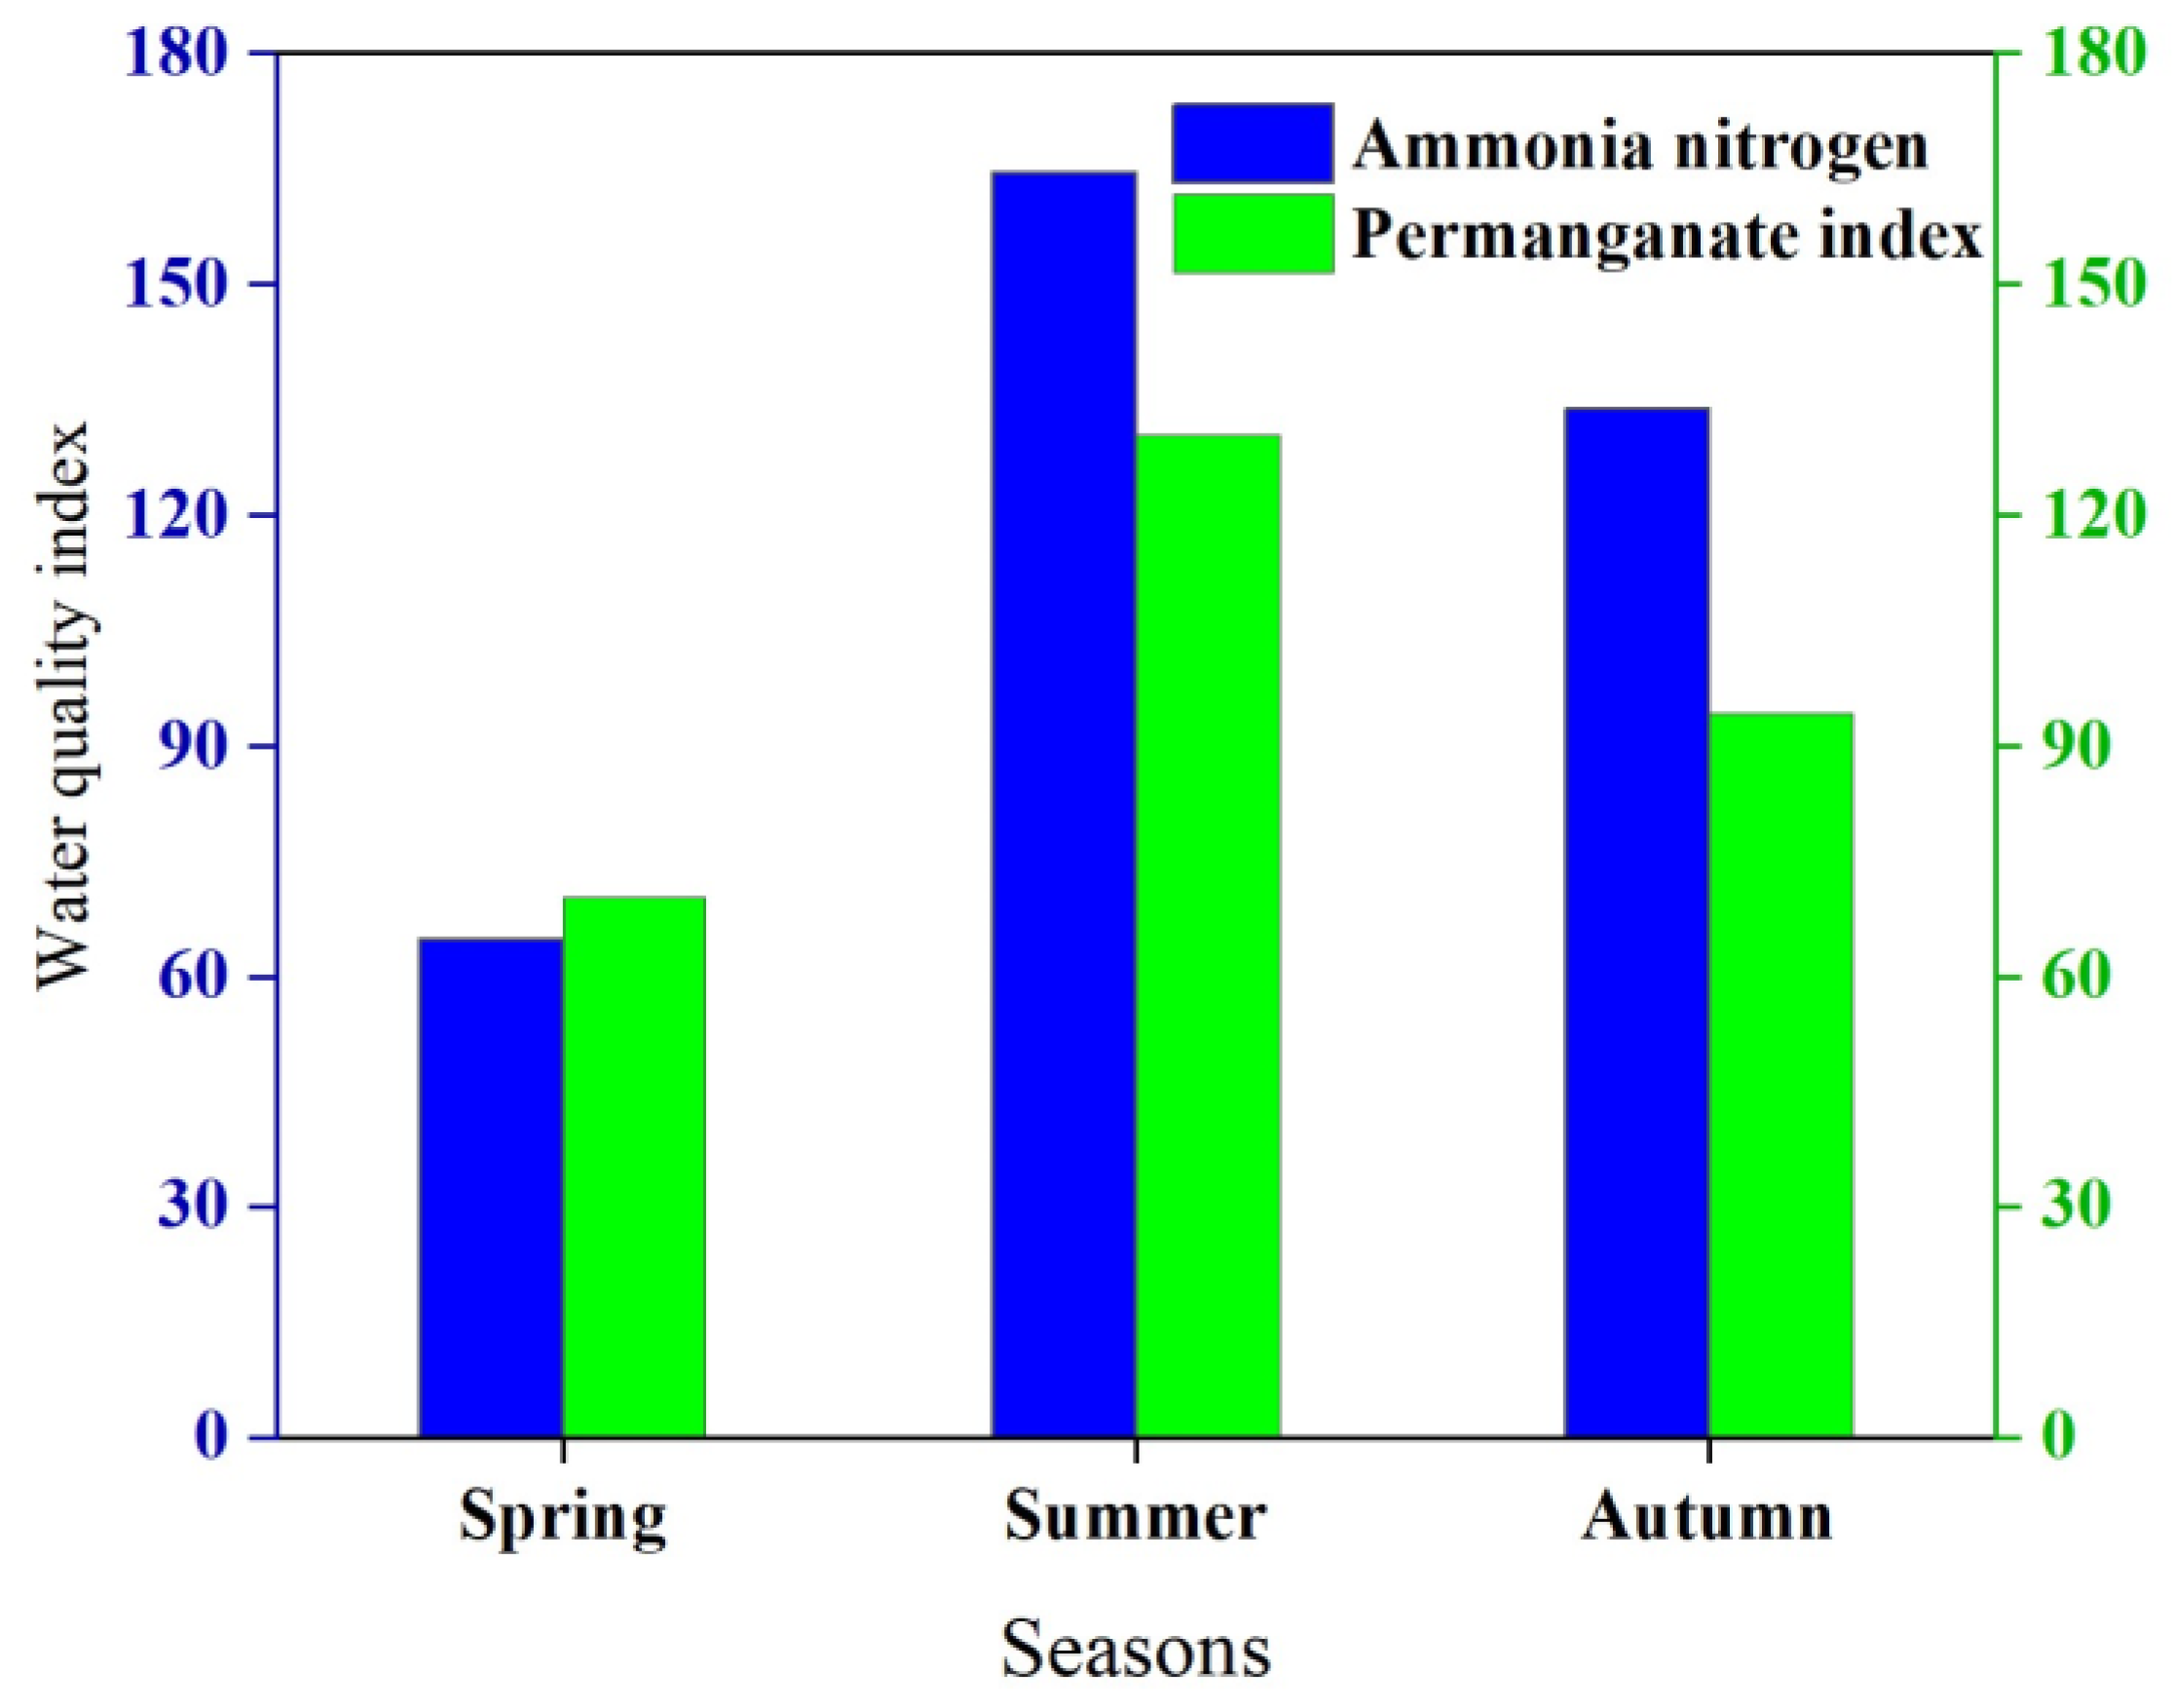
According to the calculation results of the superstandard multiple indices, the NH4 and the CODMn exceeded the standard limit of Class III water quality. In the summer, the rates by which the limit was exceeded for NH4 and CODMn were 164.6% and 130.4%, respectively. In the winter, the rates which the limit was exceeded for NH4 and CODMn were 133.8% and 94.3%, respectively. Among them, the rates by which the standard was exceeded were highest in the summer, and those of these two water pollution indicators exceeded 100%. Moreover, the autumn season also had a high rate by which the standard was exceeded, and that of ammonia nitrogen exceeded 100% (Figure 2). According to the classification of various indicators in the comprehensive ecological risk assessment, the ecological risk of this indicator was at Level 4.
3.3. Eutrophication Index in Ecological Risk Assessment
The eutrophication status exhibited obvious spatial–temporal heterogeneity among the eight sampling sites in the Baiyangdian water in the spring, summer, and autumn, as shown in Figure 3a–c, respectively. The highest TLI(∑) was 59.2 at S1 in the spring and 55.7 at S1 in the autumn. Sites S1 and S8 showed mild and medium eutrophic degree, respectively. In the spring, sites S2, S3, S4, and S5 all showed low eutrophic degree, with the TLI(∑) at 19.2, 18.9, 17.3, and 15.6, respectively. The lowest average TLI(∑) was 26.1 in the spring. Eutrophication index was higher at the inlet than at the outlet.
The evaluation results of the comprehensive nutrient index show that the Baiyangdian water has a medium eutrophic degree, while some areas are mildly eutrophic. The degree of eutrophication is higher in the summer and autumn, but lower in the spring. According to the classification of various indicators in the comprehensive ecological risk assessment, the ecological risks of this indicator in the spring, summer, and autumn are in Level 1, Level 2, and Level 2, respectively.
3.4. Heavy Metal in Ecological Risk Assessment
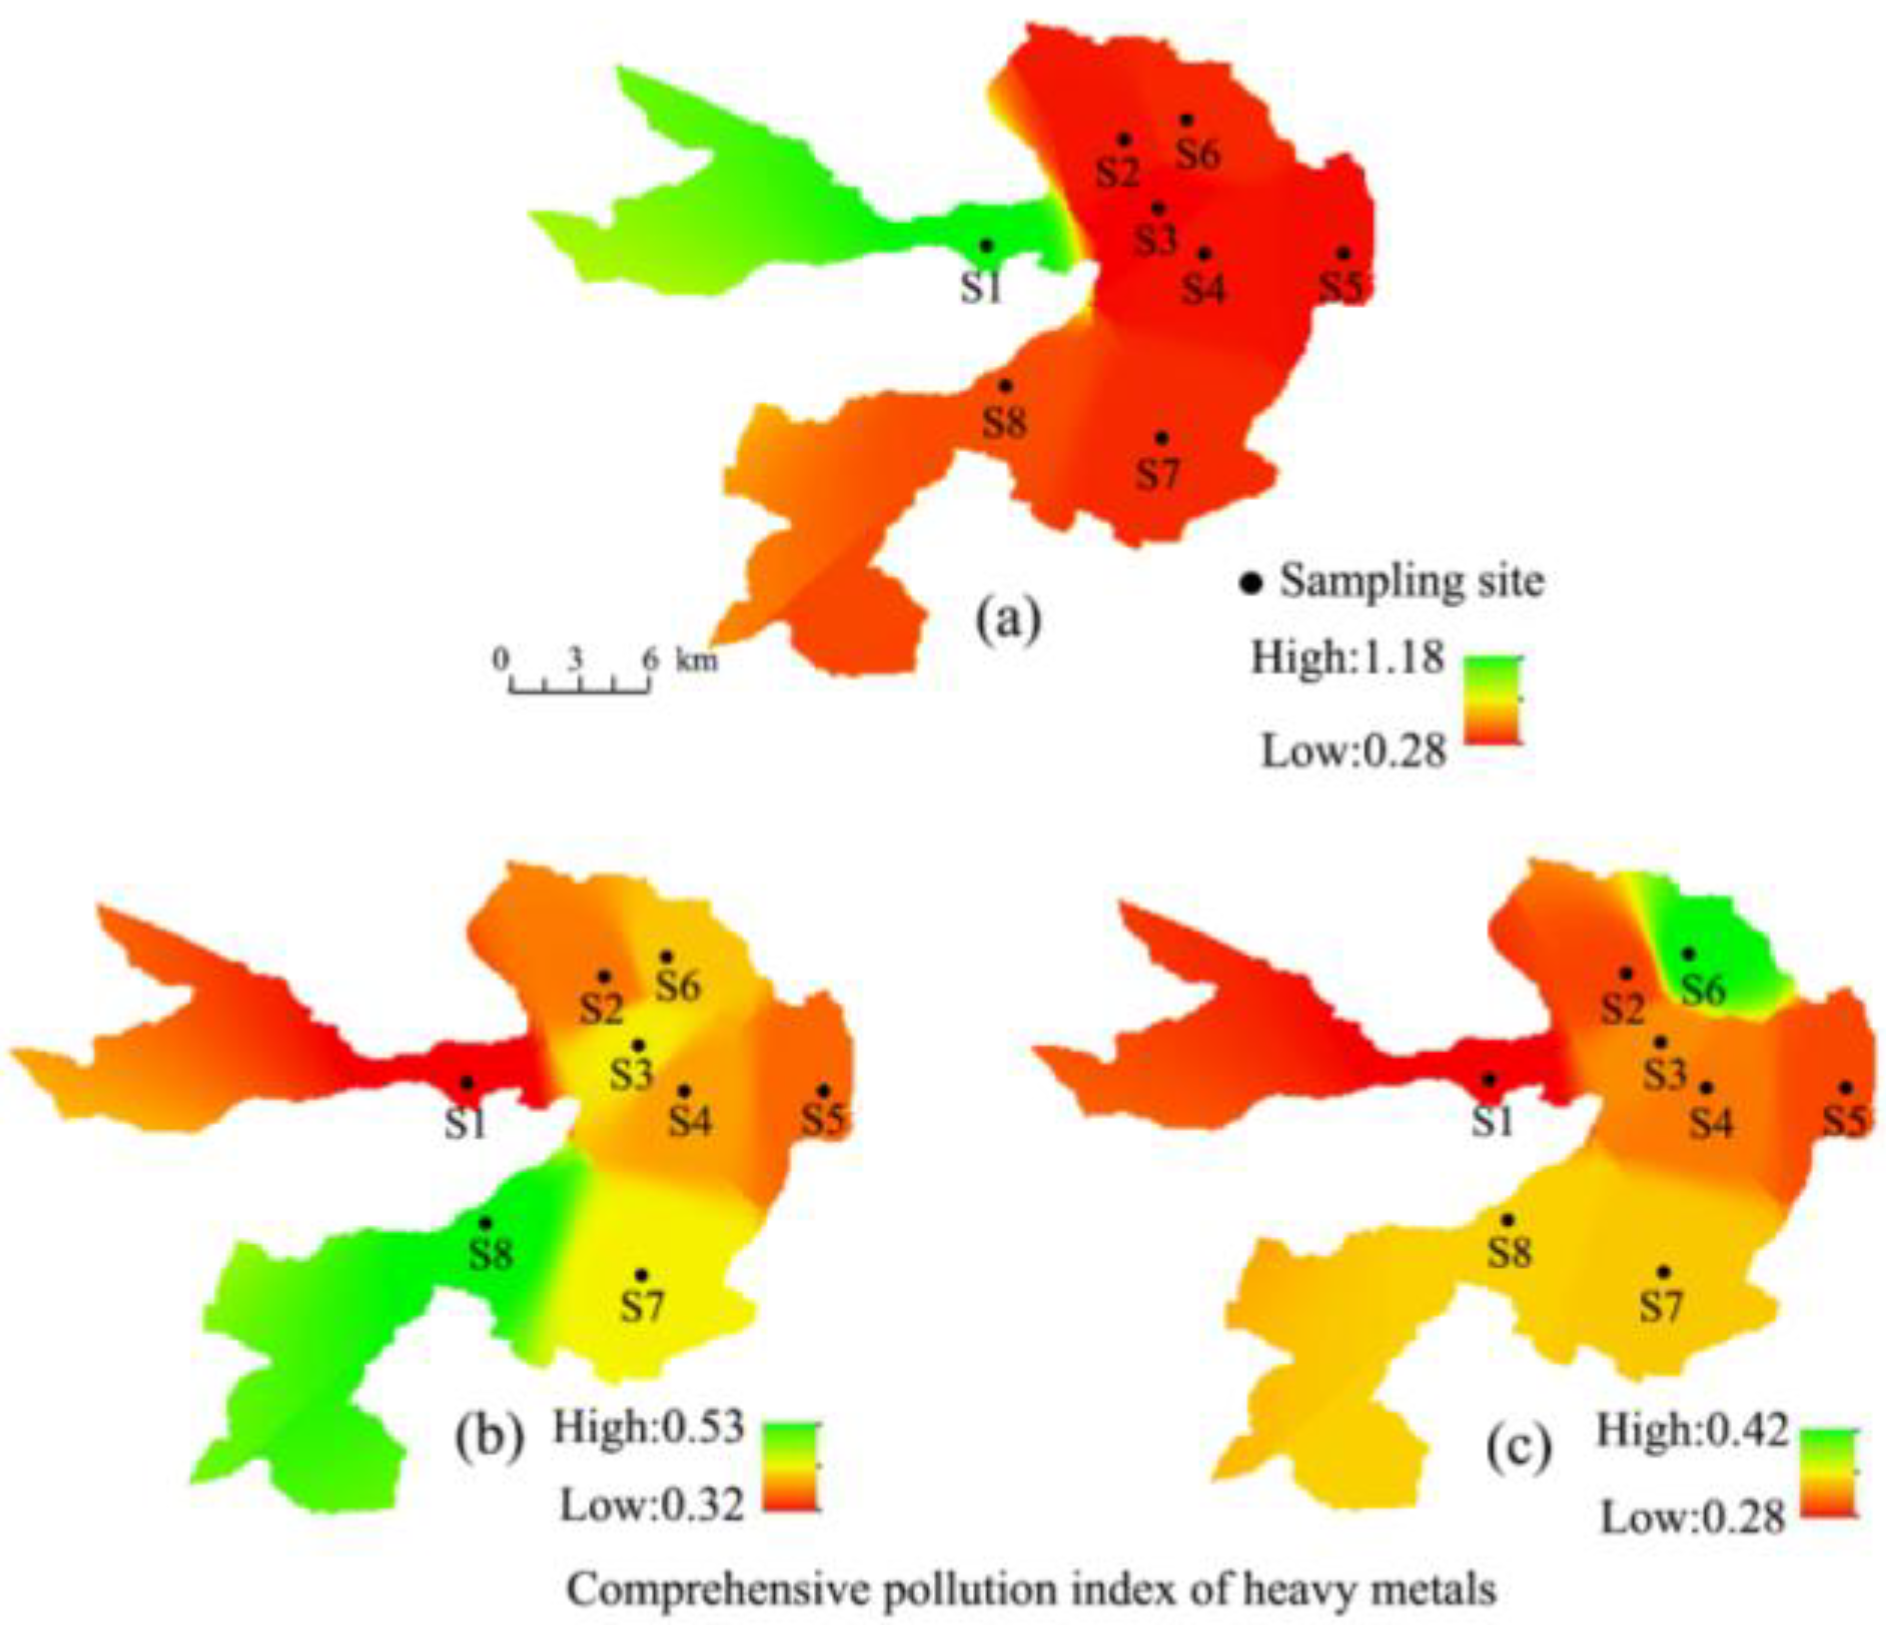
The comprehensive pollution index of heavy metals (Pb, Cd, Cr, As, and Hg) in Baiyangdian Lake at each sampling site in the spring, summer, and autumn are shown in Figure 4. The comprehensive pollution index at site S1 was greater than 1.0 in the spring, which demonstrated light pollution level. The comprehensive pollution indices of other sampling sites in different seasons were all less than 1.0, indicating that Baiyangdian Lake was almost not polluted by heavy metals. The single-factor pollution indices of the three elements Cd, Cr, and As were relatively high (Table 8. The comprehensive pollution index of the whole lake was relatively high in the spring. In terms of spatial distribution, the heavy metal pollution indices of sites S1 and S8 were slightly higher than those of other sites.
According to the classification of various indicators in the comprehensive ecological risk assessment, the ecological risks of heavy metals in the spring, summer, and autumn were in Level 2, Level 1, and Level 1, respectively.
3.5. Organic Pollutants in Ecological Risk Assessment
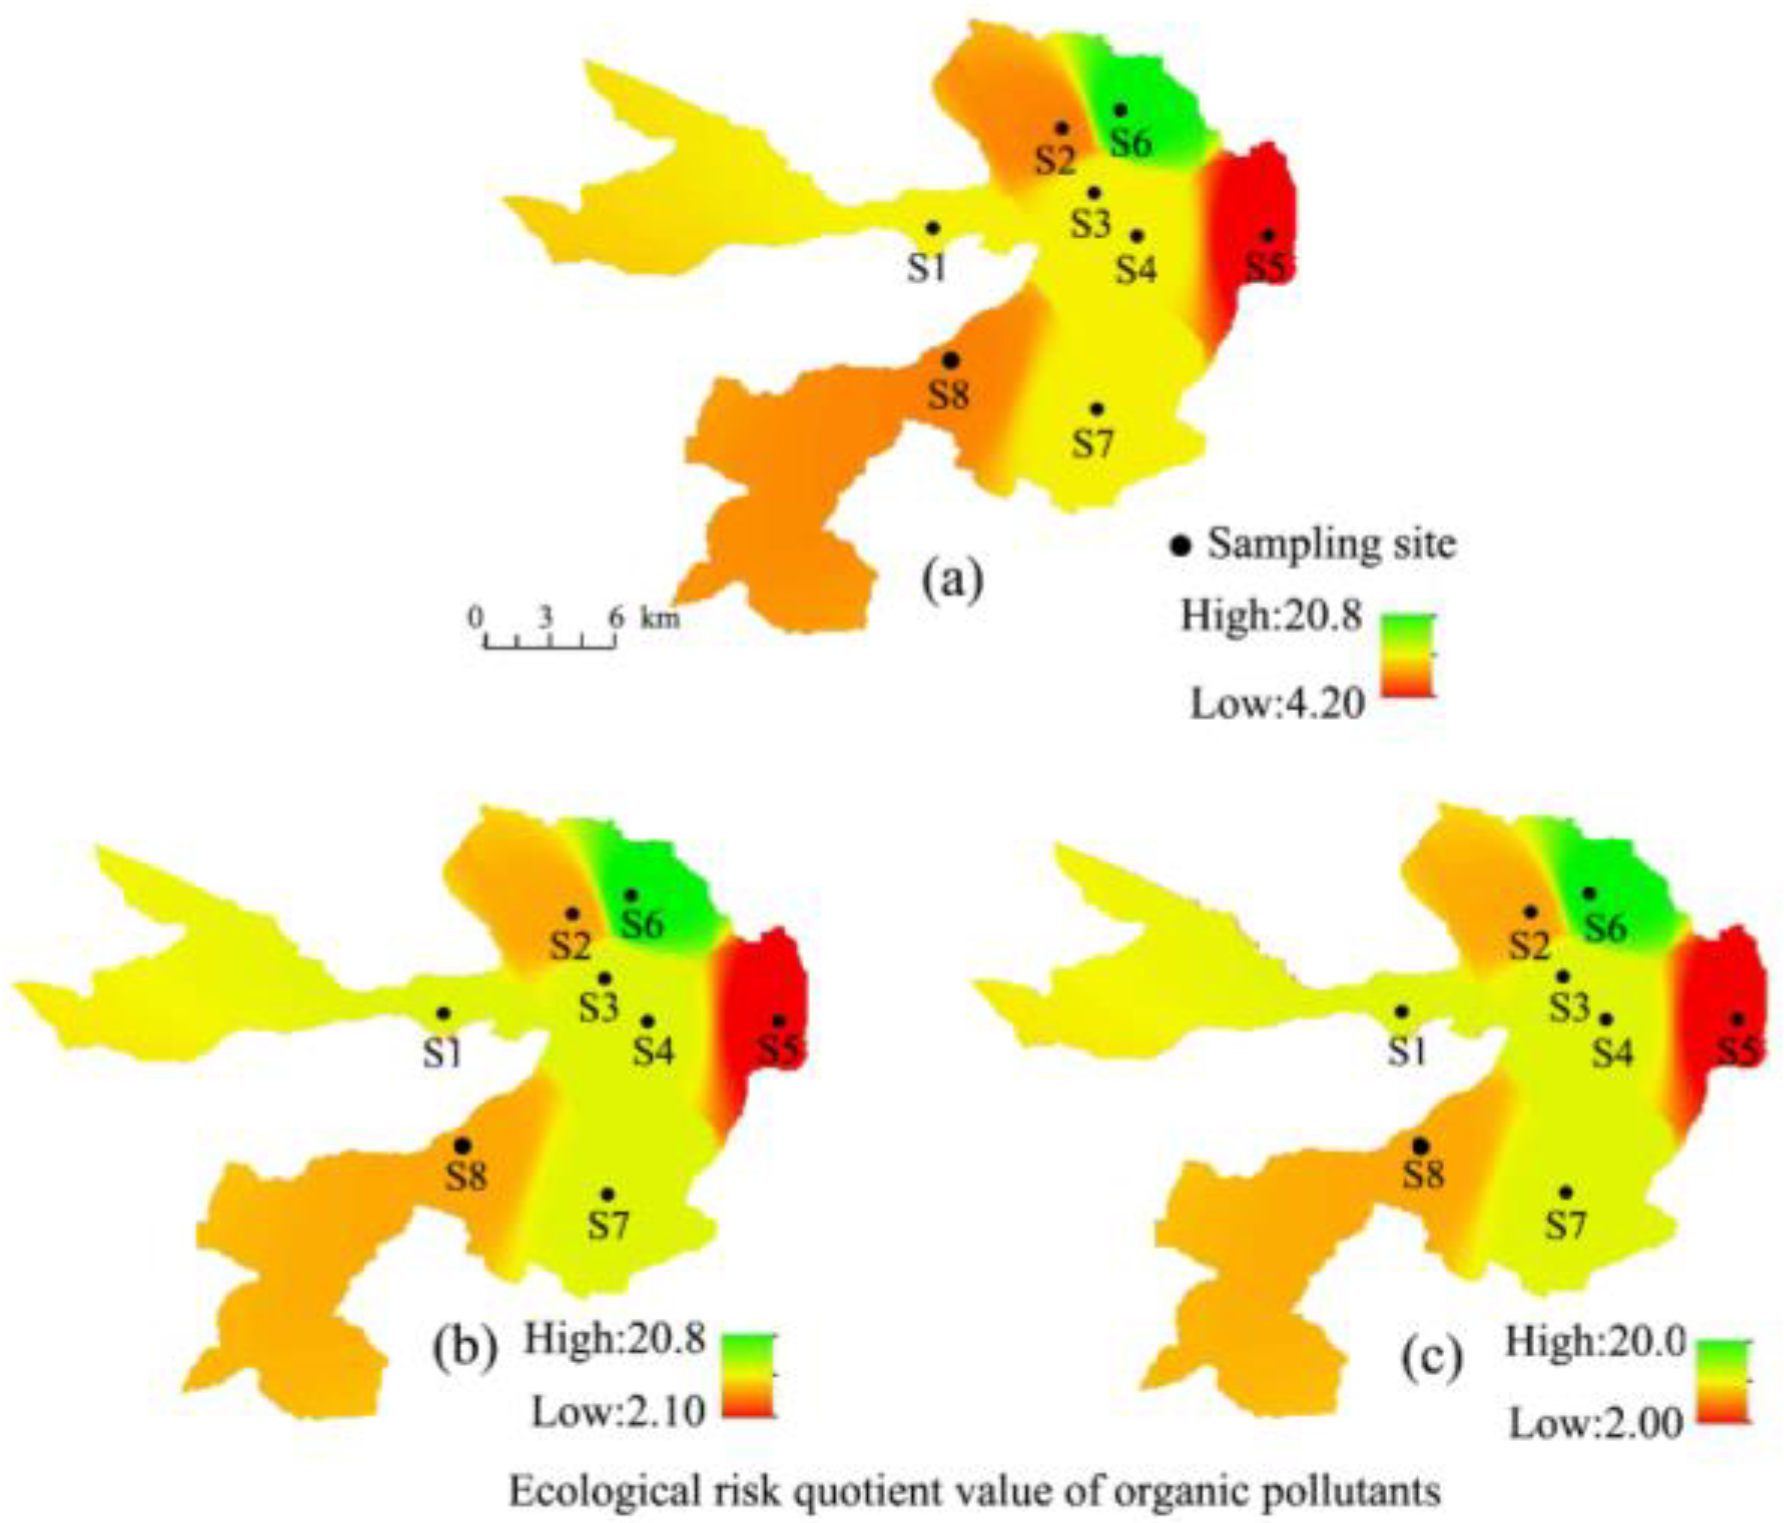
Figure 5 shows the risk quotient of organic pollutants. The ecological risk assessment of petroleum at each sampling site of Baiyangdian Lake in the spring, summer, and autumn was high risk (RQ > 1). Site S6 showed the highest risk quotient, with values of 20.8, 20.8, and 20.0 in the spring, summer, and autumn, respectively. According to the classification of various indicators in the comprehensive ecological risk assessment, the ecological risks of this indicator in the spring, summer, and autumn were all at Level 4.
3.6. Comprehensive Ecological Risk Assessment
The ecological risk of the conventional water quality index was at Level 4. The ecological risks of the eutrophication index in the spring, summer, and autumn were at Level 1, Level 2, and Level 2, respectively. The ecological risks of the heavy metal index in the spring, summer, and autumn were at Level 2, Level 1, and Level 1, respectively. The ecological risks of the chemical pollution indicators in the spring, summer, and autumn were all at Level 4. It was inferred that the comprehensive ecological risk of the Baiyangdian water was at Level 4, according to the barrel principle.
4. Discussion
To reasonably reflect the pollution degree of water or soil, the Nemerow pollution index method is used as a comprehensive evaluation of the pollution degree of various pollutants in water or soil. However, the types of pollutants evaluated are mainly inorganic pollutants [20]. In order to obtain a more comprehensive understanding of the ecological and environmental status of the Baiyangdian River Basin, the current study also incorporates data on organic pollutants and physicochemical indicators (e.g., pH). However, no biological indicators are considered. Compared to conventional water ecological risk assessment, the comprehensive risk assessment in this study is more comprehensive because it not only takes the aquatic physicochemical condition into consideration but also introduces organic pollutants into the evaluation. Moreover, different trophic-level organisms, such as fish, benthic animals, plankton, and aquatic vegetation, could be included in the monitoring scope in the future.
Baiyangdian Lake has the characteristics of small net flow, slow flow rate, poor self-purification ability, small environmental capacity, and vulnerability to local pollution [21]. As shown in the results, the water pollution in Baiyangdian Lake presents the characteristics of compound type and locality. The compound type is mainly due to the coexistence of organic pollution and eutrophication. At the sampling sites of Baiyangdian, the dominant water pollutants were CODMn, NH4, and TP. The detected concentrations of CODMn, NH4, and TP were all high, measured in mg/L. The mean concentrations of the detected indicators in the surface water in the autumn were higher than those in the summer. Heavy metal was also not investigated in Poyang Lake [22]. To summarize, it can be concluded that the river water has a strong water self-purification ability in the summer, and it is easier to reduce the distribution of water pollution during that season [23]. The water quality factor not only reflects the water pollution level but also has a regulating effect on water quality. Balance in the pH value guarantees a virtuous cycle is maintained for the aquatic ecosystem. Too much acidity or too much alkalinity would cause damage to the aquatic ecosystem. Most of the sampling sites in this study were eutrophic. Among them, the eutrophication of S1’s surface water was relatively serious. That could be attributed to the source input and the hydrological characteristics of the water body. The distribution of precipitation in the Baiyangdian area is relatively uniform, the dilution of water pollutants by precipitation is not very different, and the river runoff varies with the upstream inflow. The pollution originates from the industrial and domestic sewage in the upper reaches as well as from the domestic, fishery and agricultural sewage in the lake. Feed for cage fish contains a lot of nitrogen and phosphorus, but only a small amount is eaten by the fish, and most of the remainder enters the lake water. Wastewater from duck farming goes directly into the water, resulting in excess nitrogen and phosphorus discharges. In addition, in recent years, the management of tourist motor ships has not been standardized. The main sources of pollutants in Baiyangdian Lake are oil pollution from cruise ships, petroleum fuel, and garbage generated by tourists. It is urgent to take measures and to carry out various comprehensive treatments, such as strengthening the operation and management of tourist transport motor ships, optimizing plant configuration, establishing a plant purification system, controlling external input, and removing nutrients. There is almost no heavy metal pollution in the water body of Baiyangdian Lake, while the ecological risk of petroleum pollution is high. Other relevant studies in Baiyangdian Lake also showed that pollution due to petroleum hydrocarbons in the surface water is relatively serious [24]. Its regional distribution characteristics are affected by geographical and environmental factors, and human activities [25,26].
5. Conclusions
A comprehensive ecological risk assessment index system was established based on the basic theory of traditional ecological risk assessment, aiming at collecting conventional water pollution indicators, eutrophication indicators, heavy metal pollution index, and organic chemical pollution index. The case study of the ecological risk assessment of the lake water in the plain area of the Baiyangdian basin was carried out for the administration of water quality. The results indicate that the comprehensive ecological risk of the Baiyangdian water is high, mainly caused by petroleum pollution. Permanganate index, ammonia nitrogen, and total phosphorus are the dominant indicators in the river water. The average value of the water pollution indicators in the autumn is higher than that in the summer. The Nanliuzhuang close to the contaminated tributary (Fu River) is in a situation of being seriously eutrophic. Therefore, risk management should be controlled by different levels and divisions. Moreover, strengthening the management of tourist transport motor ships and optimizing plant configuration could preferentially control the water quality.
Author Contributions
Conceptualization, S.H.; data curation, S.H., M.L. and D.C.; formal analysis, S.H., M.L., L.S. and D.C.; funding acquisition, L.S.; investigation, L.S. and D.C.; methodology, S.H., L.S. and D.C.; project administration, L.S. and D.C.; resources, L.S. and D.C. All authors have read and agreed to the published version of the manuscript.
Funding
This research was supported by the National Natural Science Foundation of China (71874174) and the Strategic Priority Research Program of the Chinese Academy of Sciences (XDA23030201).
Data Availability Statement
The data used to support the findings of this study are available from the corresponding author.
Acknowledgments
The authors thank the University of Chinese Academy of Sciences and the Institute of Urban Environment, Chinese Academy of Sciences for their support of this study.
Conflicts of Interest
The authors declare no conflict of interest.
References
- Cai, F.; Cao, C.; Qi, H.S.; Su, X.Z.; Lei, G.; Liu, J.H.; Zhao, S.H.; Liu, G.; Zhu, K. Rapid migration of mainland China’s coastal erosion vulnerability due to anthropogenic changes. J. Environ. Manag. 2022, 319, 115632. [Google Scholar] [CrossRef] [PubMed]
- Zhu, Z.Y.; Mei, Z.K.; Xu, X.Y.; Feng, Y.Z.; Ren, G.X. Landscape Ecological Risk Assessment Based on Land Use Change in the Yellow River Basin of Shannxi, China. Int. J. Environ. Res. Public Health 2022, 19, 9547. [Google Scholar] [CrossRef] [PubMed]
- Zhou, P.; Zeng, D.; Wang, X.T.; Tai, L.Y.; Zhou, W.W.; Zhuoma, Q.D.; Lin, F.W. Pollution Levels and Risk Assessment of Heavy Metals in the Soil of a Landfill Site: A Case Study in Lhasa, Tibet. Int. J. Environ. Res. Public Health 2022, 19, 10704. [Google Scholar] [CrossRef] [PubMed]
- Wang, D.Z.; Zhang, H.H.; Zhu, W.Z.; Zhang, X.L.; Yang, Q.; Liu, M.; Chen, Q.G. Characteristics and Health Risk Assessment of Heavy Metal Pollution in Haikou Bay and Adjacent Seas. Int. J. Environ. Res. Public Health 2022, 19, 7896. [Google Scholar] [CrossRef]
- Xu, Z.; Shi, M.Y.; Yu, X.M.; Liu, M.D. Heavy Metal Pollution and Health Risk Assessment of Vegetable–Soil Systems of Facilities Irrigated with Wastewater in Northern China. Int. J. Environ. Res. Public Health 2022, 19, 9835. [Google Scholar] [CrossRef]
- Lu, J.; Wu, J.; Zhang, C.; Zhang, Y.X.; Lin, Y.C.; Luo, Y.M. Occurrence, distribution, and ecological-health risks of selected antibiotics in coastal waters along the coastline of China. Sci. Total Environ. 2018, 644, 1469–1476. [Google Scholar] [CrossRef]
- Teng, Y.G.; Zuo, R.; Xiong, Y.N.; Wu, J.; Zhai, Y.Z.; Su, J. Risk assessment framework for nitrate contamination in groundwater for regional management. Sci. Total Environ. 2019, 697, 134102. [Google Scholar] [CrossRef]
- Sorensen, M.T.; Margolin, J.A. Ecological risk assessment guidance and procedural documents: An annotated compilation and evaluation of reference materials. Hum. Ecol. Risk Assess. 1998, 4, 1085–1101. [Google Scholar] [CrossRef]
- Noori, R.; Ansari, E.; Jeong, Y.W.; Aradpour, S.; Maghrebi, M.; Hosseinzadeh, M. Hyper-Nutrient Enrichment Status in the Sabalan Lake, Iran. Water 2021, 13, 2874. [Google Scholar] [CrossRef]
- Mollo, V.M.; Nomngongo, P.N.; Ramontja, J. Evaluation of Surface Water Quality Using Various Indices for Heavy Metals in Sasolburg, South Africa. Water 2022, 14, 2375. [Google Scholar] [CrossRef]
- Zhao, Y.; Xia, X.H.; Yang, Z.F.; Wang, F. Assessment of water quality in Baiyangdian Lake using multivariate statistical techniques. Procedia Environ. Sci. 2012, 13, 1213–1226. [Google Scholar] [CrossRef] [Green Version]
- Gad, M.; Abou El-Safa, M.M.; Farouk, M.; Hussein, H.; Alnemari, A.M.; Elsayed, S. Integration of Water Quality Indices and Multivariate Modeling for Assessing Surface Water Quality in Qaroun Lake, Egypt. Water 2021, 13, 2258. [Google Scholar] [CrossRef]
- Guan, X.; Ren, X.; Tao, Y.; Chang, X.; Li, B. Study of the Water Environment Risk Assessment of the Upper Reaches of the Baiyangdian Lake, China. Water 2022, 14, 2557. [Google Scholar] [CrossRef]
- Wang, Y.L.; Wei, W.; Qin, J.F. Study on single factor evaluation system of water quality based on intimate value method. Sci. Innov. 2022, 23, 83–86. (In Chinese) [Google Scholar]
- Hu, Q.J. Application of attribute identification model based on superscalar multiple method in surface water quality assessment. Jiangsu Water Conserv. 2021, 5, 31–36. (In Chinese) [Google Scholar]
- Li, Z.Y.; Zhang, H.J. Trophic state index and its correlation with lake parameters. Acta Sci. Circumstantiae 1993, 13, 391–397. (In Chinese) [Google Scholar] [CrossRef]
- Chen, M.X.; Xiong, G.Y.; Zhang, J.P. Comprehensive assessment and spatial-temporal evolution analysis of water quality in Xiangjiang River BasiN. Environ. Eng. 2019, 37, 83–90, 104. (In Chinese) [Google Scholar]
- Wang, X.X.; Zhang, M.X.; Xu, B.B. Joint application of fuzzy identification index and correspondence analysis method in water quality assessment. J. Environ. Sci. 2012, 32, 1227–1235. (In Chinese) [Google Scholar]
- Hernando, M.; Mezcua, M.; Fernandez-Alba, A.R.; Barcelo, D. Environmental risk assessment of pharmaceutical residues in wastewater effluents, surface waters and sediments. Talanta 2006, 69, 334–342. [Google Scholar] [CrossRef]
- Huang, L.L.; Rad, S.; Xu, L.; Gui, L.Y.; Song, X.H.; Li, Y.H.; Wu, Z.Q.; Chen, Z.B. Heavy Metals Distribution, Sources, and Ecological Risk Assessment in Huixian Wetland, South China. Water 2020, 12, 431. [Google Scholar] [CrossRef] [Green Version]
- Zhang, H.X.; Shen, Y.M.; Tang, J. Hydrodynamics and water renewal in the Pearl River Estuary, China: A numerical study from the perspective of water age. Ocean Eng. 2021, 237, 109639. [Google Scholar] [CrossRef]
- Xie, Z.; Jiang, Y.; Zhang, H. Assessing heavy metal contamination and ecological risk in Poyang Lake area, China. Environ. Earth Sci. 2016, 75, 549. [Google Scholar] [CrossRef]
- Zhou, L.; Sun, W.; Han, Q.; Chen, H.; Chen, H.; Jin, Y.; Tian, Z. Assessment of Spatial Variation in River Water Quality of the Baiyangdian Basin (China) during Environmental Water Release Period of Upstream Reservoirs. Water 2020, 12, 688. [Google Scholar] [CrossRef] [Green Version]
- Wang, Y.Z.; Liu, M.Z.; Dai, Y.; Luo, Y.; Zhang, S.L. Health and ecotoxicological risk assessment for human and aquatic organism exposure to polycyclic aromatic hydrocarbons in the Baiyangdian Lake. Environ. Sci. Pollut. Res. 2020, 28, 574–586. [Google Scholar] [CrossRef] [PubMed]
- Sun, S.K.; Yin, Y.L.; Wu, P.T.; Wang, Y.B.; Luan, X.B.; Li, C. Geographical Evolution of Agricultural Production in China and Its Effects on Water Stress, Economy, and the Environment: The Virtual Water Perspective. Water Resour. 2019, 55, 4014–4029. [Google Scholar] [CrossRef]
- Wang, L.J.; Bie, W.J.; Li, H.C.; Liao, T.H.; Ding, X.X.; Wu, G.F.; Fei, T. Small Water Body Detection and Water Quality Variations with Changing Human Activity Intensity in Wuhan. Remote Sens. 2022, 14, 200. [Google Scholar] [CrossRef]
Figure 1.
Map of the sampling sites in Baiyangdian Lake.

Figure 2.
Standard rates by which the Baiyangdian water quality index was exceeded.

Figure 3.
Eutrophication index in the spring (a), summer (b), and autumn (c).

Figure 4.
Comprehensive pollution index in the spring (a), summer (b), and autumn (c).

Figure 5.
Risk quotient in the spring (a), summer (b), and autumn (c).


Table 1.
Location of the sampling sites in Baiyangdian Lake.
| Site | Site Location | Geographic Location (N, E) | |
|---|---|---|---|
| S1 | Nanliuzhuang | 115°56′41.23″ | 38°54′11.46″ |
| S2 | Shaochedian | 115°59′54.15″ | 38°56′40.21″ |
| S3 | Wangjiazhai | 116°00′42.24″ | 38°55′05.18″ |
| S4 | Guangdianzhangzhuang | 116°01′46.95″ | 38°54′00.64″ |
| S5 | Zaolinzhuang | 116°05′1.6″ | 38°54′00.32″ |
| S6 | Quantou | 116°01′21.44″ | 38°57′08.80″ |
| S7 | Caiputai | 116°00′46.69″ | 38°49′41.61″ |
| S8 | Duancun | 115°57′07.76″ | 38°50′55.28″ |
Table 2.
Testing methods and instruments for the water quality samples.
| Test Items | Test Method | Test Standard | Instrument |
|---|---|---|---|
| NH4 | Nessler’s reagent pectrophotometry | HJ 535-2009 | UV spectrophotometry TU-1990 |
| CODMn | Potassium dichromate | GB 11914-89 | Automatic burette |
| Pb | Atomic absorption spectroscopy | GB 7475-87 | Atomic absorption spectrophotometer ZEEnit 700P |
| Cd | Atomic absorption spectroscopy | GB 7475-87 | Atomic absorption spectrophotometer ZEEnit 700P |
| Cr | Atomic absorption spectroscopy | HJ 757-2015 | Atomic absorption spectrophotometer ZEEnit 700P |
| As | Atomic fluorescence spectrometry | HJ 764-2015 | Atomic fluorescence spectrophotometer AFS-8530 |
| Hg | Atomic fluorescence spectrometry | GB 23113-2017 | Atomic fluorescence spectrophotometer AFS-8530 |
| Volatile phenol | 4-aminoantipyrene spectrometry | HJ 503-2009 | Spectrophotometric T8000-ph |
| Cyanide | Spectrophotometry | HJ 484-2009 | Spectrophotometric PhotoTek 6000 |
| Fluoride | Visual colorimetry | GB 7482-87 | Visual colorimetric JC-F-260 |
| Anionic active agent | Methylene blue spectrophotometric | GB 7494-1987 | Spectrophotometric TD-270 |
Table 3.
Limits for the standard items of the environmental quality standards for surface water.
| Number | Main Factors | Ⅰ | Ⅱ | Ⅲ | Ⅳ | Ⅴ |
|---|---|---|---|---|---|---|
| 1 | pH | 6.5~8.5 | 5.5~6.5 8.5~9 6 | <5.5 >9 | ||
| 2 | NH4 (mg/L) | ≤0.02 | ≤0.02 | ≤0.2 | ≤0.5 | >0.5 |
| 3 | CODMn (mg/L) | ≤1.0 | ≤2.0 | ≤3.0 | ≤10 | >10 |
| 4 | Pb (mg/L) | ≤0.005 | ≤0.01 | ≤0.05 | ≤0.1 | >0.1 |
| 5 | Cd (mg/L) | ≤0.0001 | ≤0.001 | ≤0.01 | ≤0.01 | >0.01 |
| 6 | Cr (mg/L) | ≤0.005 | ≤0.01 | ≤0.05 | ≤0.1 | >0.1 |
| 7 | As (mg/L) | ≤0.005 | ≤0.01 | ≤0.05 | ≤0.05 | >0.05 |
| 8 | Hg (mg/L) | ≤0.00005 | ≤0.0005 | ≤0.001 | ≤0.001 | >0.001 |
| 9 | Volatile phenol (mg/L) | ≤0.001 | ≤0.001 | ≤0.002 | ≤0.01 | >0.01 |
| 10 | Cyanide (mg/L) | ≤0.001 | ≤0.01 | ≤0.05 | ≤0.1 | >0.1 |
| 11 | Fluoride (mg/L) | ≤1.0 | ≤1.0 | ≤1.0 | ≤2.0 | >2.0 |
| 12 | Anionic active agent (mg/L) | - | ≤0.1 | ≤0.3 | ≤0.3 | >0.3 |
Table 4.
The values rij and rij2 of the correlation between some indicators of lakes (reservoirs) and the concentration of Chla in China [14].
Table 4.
The values rij and rij2 of the correlation between some indicators of lakes (reservoirs) and the concentration of Chla in China [14].
| Indicators | TP | TN | SD | CODMn |
|---|---|---|---|---|
| rij | 0.84 | 0.82 | −0.83 | 0.83 |
| rij2 | 0.7056 | 0.6724 | 0.6889 | 0.6889 |
Table 5.
Classification standards of eutrophic degree.
| Eutrophic Degree | |
|---|---|
| Low eutrophic | <30 |
| Medium eutrophic | 30–50 |
| High eutrophic | >50 |
| Mildly eutrophic | 50–60 |
| Moderately eutrophic | 60–70 |
| Severely eutrophic | >70 |
Table 6.
Comprehensive ecological risk levels.
| Comprehensive Ecological Risk Level | Conventional Indicators | Eutrophic Degree | Comprehensive Pollution Index | Risk Quotient |
|---|---|---|---|---|
| Level 1 | I | Low eutrophic | No pollution | Ultra-low risk |
| Level 2 | II | High eutrophic | Slightly polluted | Low risk |
| Level 3 | III | Moderately eutrophic | Polluted | Medium risk |
| Level 4 | IV | Severely eutrophic | Heavy pollution | High risk |
Table 7.
Range and mean concentrations of the contaminants detected in the water in the spring, summer, and autumn.
Table 7.
Range and mean concentrations of the contaminants detected in the water in the spring, summer, and autumn.
| Spring | Summer | Autumn | |||||
|---|---|---|---|---|---|---|---|
| Range a | Mean | Range | Mean | Range | Mean | ||
| Conventional factors | pH | 7.9–8.8 | 8.3 | 7.9–8.3 | 8.1 | 7.9–8.6 | 8.2 |
| SD | 15.0–120.0 | 68.1 | 20.0–120.0 | 56.5 | 30.0–100.0 | 57.5 | |
| DO | 6.4–9.9 | 7.9 | 3.2–9.3 | 5.7 | 5.7–9.6 | 7.1 | |
| COD | 23.2–35.2 | 28.6 | 20.6–57.2 | 36.1 | 22.3–48.7 | 34.5 | |
| BOD | 1.2–2.3 | 1.6 | 1.1–3.0 | 2.1 | 1.5–1.9 | 1.7 | |
| CODMn (mg/L) | 3.8–6.6 | 5.0 | 4.6–12.2 | 7.9 | 5.3–9.1 | 7.0 | |
| Nutrient pollution factors | TP (mg/L) | 0.1–0.2 | 0.1 | 0.1–0.2 | 0.1 | n.d.–0.2 | 0.1 |
| NH4 (mg/L) | 0.2–0.6 | 0.3 | 0.4–0.6 | 0.5 | 0.2–0.6 | 0.4 | |
| Metal pollution factors | Pb (μg/L) | 0.2–1.2 | 0.5 | n.d. | n.d. | n.d. | n.d. |
| Cd (μg/L) | n.d. b | n.d. | n.d. | n.d. | n.d. | n.d. | |
| Cr (μg/L) | 2.0–2.0 | 2.0 | 2.0–2.0 | 2.0 | 2.0–2.0 | 2.0 | |
| As (μg/L) | 1.4–2.5 | 1.8 | 2.4–7.6 | 4.9 | 1.6–2.9 | 2.4 | |
| Hg (μg/L) | n.d. | n.d. | n.d. | n.d. | n.d. | n.d. | |
| Organic pollution factor | Volatile phenol (μg/L) | 0.2–0.2 | 0.2 | 0.2–0.2 | 0.2 | 0.2–0.2 | 0.2 |
| Cyanide (μg/L) | 2.0–2.0 | 2.0 | 2.0–2.0 | 2.0 | 2.0–2.0 | 2.0 | |
| Fluoride (mg/L) | 0.5–0.7 | 0.6 | 0.4–0.8 | 0.7 | 0.7–0.8 | 0.7 | |
| Petro (μg/L) | 10.0–50.0 | 28.8 | 5.0–50.0 | 27.5 | 5.0–50.0 | 27.5 | |
| Anionic active agent (μg/L) | 74.0–98.0 | 88.8 | 75.0–94.0 | 85.0 | 25.0–66.0 | 35.3 | |
Notes: a Range: minimum–maximum; b n.d.: not detected.
Table 8.
Comprehensive pollution index of heavy metals in Baiyangdian river water.
| Season | Sampling Sites | Single Factor Pollution Index (Pi) | Comprehensive Pollution Index (I) | Degree of Pollution | ||||
|---|---|---|---|---|---|---|---|---|
| Pb | Cd | Cr | As | Hg | ||||
| Spring | S1 | 0.420 | 4.100 | 0.400 | 0.570 | 0.400 | 1.178 | slightly polluted |
| S2 | 0.064 | 0.300 | 0.400 | 0.318 | 0.400 | 0.296 | no pollution | |
| S3 | 0.042 | 0.300 | 0.400 | 0.274 | 0.400 | 0.283 | no pollution | |
| S4 | 0.060 | 0.300 | 0.400 | 0.304 | 0.400 | 0.293 | no pollution | |
| S5 | 0.052 | 0.300 | 0.400 | 0.294 | 0.400 | 0.289 | no pollution | |
| S6 | 0.110 | 0.300 | 0.400 | 0.360 | 0.400 | 0.314 | no pollution | |
| S7 | 0.096 | 0.300 | 0.400 | 0.388 | 0.400 | 0.317 | no pollution | |
| S8 | 0.234 | 0.300 | 0.400 | 0.506 | 0.400 | 0.368 | no pollution | |
| Summer | S1 | 0.009 | 0.300 | 0.400 | 0.474 | 0.400 | 0.317 | no pollution |
| S2 | 0.009 | 0.300 | 0.400 | 0.696 | 0.400 | 0.361 | no pollution | |
| S3 | 0.009 | 0.300 | 0.400 | 0.976 | 0.400 | 0.417 | no pollution | |
| S4 | 0.009 | 0.300 | 0.400 | 0.790 | 0.400 | 0.380 | no pollution | |
| S5 | 0.009 | 0.300 | 0.400 | 0.646 | 0.400 | 0.351 | no pollution | |
| S6 | 0.009 | 0.300 | 0.400 | 0.888 | 0.400 | 0.399 | no pollution | |
| S7 | 0.009 | 0.300 | 0.400 | 0.998 | 0.400 | 0.421 | no pollution | |
| S8 | 0.009 | 0.300 | 0.400 | 1.520 | 0.400 | 0.526 | no pollution | |
| Autumn | S1 | 0.009 | 0.300 | 0.400 | 0.312 | 0.400 | 0.284 | no pollution |
| S2 | 0.009 | 0.300 | 0.400 | 0.372 | 0.400 | 0.296 | no pollution | |
| S3 | 0.009 | 0.300 | 0.400 | 0.474 | 0.400 | 0.317 | no pollution | |
| S4 | 0.009 | 0.300 | 0.400 | 0.446 | 0.400 | 0.311 | no pollution | |
| S5 | 0.009 | 0.300 | 0.400 | 0.374 | 0.400 | 0.297 | no pollution | |
| S6 | 0.009 | 0.300 | 0.400 | 0.512 | 0.860 | 0.416 | no pollution | |
| S7 | 0.009 | 0.300 | 0.400 | 0.570 | 0.400 | 0.336 | no pollution | |
| S8 | 0.009 | 0.300 | 0.400 | 0.586 | 0.400 | 0.339 | no pollution | |
Publisher’s Note: MDPI stays neutral with regard to jurisdictional claims in published maps and institutional affiliations. |
© 2022 by the authors. Licensee MDPI, Basel, Switzerland. This article is an open access article distributed under the terms and conditions of the Creative Commons Attribution (CC BY) license (https://creativecommons.org/licenses/by/4.0/).
Share and Cite
MDPI and ACS Style
He, S.; Lin, M.; Shi, L.; Chen, D. Occurrence, Distribution and Ecological Risk Assessment of Contaminants in Baiyangdian Lake, China. Water 2022, 14, 3352. https://doi.org/10.3390/w14213352
AMA Style
He S, Lin M, Shi L, Chen D. Occurrence, Distribution and Ecological Risk Assessment of Contaminants in Baiyangdian Lake, China. Water. 2022; 14(21):3352. https://doi.org/10.3390/w14213352
Chicago/Turabian StyleHe, Sinan, Mengjing Lin, Longyu Shi, and Dingkai Chen. 2022. "Occurrence, Distribution and Ecological Risk Assessment of Contaminants in Baiyangdian Lake, China" Water 14, no. 21: 3352. https://doi.org/10.3390/w14213352
Note that from the first issue of 2016, this journal uses article numbers instead of page numbers. See further details here.