

Comparison of High-Resolution Satellite Precipitation Products in Sub-Saharan Morocco
by
 , , ,
, , ,
Mariame Rachdane
1,*,
El Mahdi El Khalki
2,
Mohamed Elmehdi Saidi
1,
Mohamed Nehmadou
3,
Abdellatif Ahbari
4 and
Yves Tramblay
5 1
Geo-Resources, Geo-Environment and Civil Engineering Laboratory, Cadi Ayyad University, Marrakesh 40000, Morocco
2
International Water Research Institute, Mohammed VI Polytechnic University (UM6P), Benguerir 43150, Morocco
3
Hydraulic Basin Agency of Souss Massa, Agadir 80000, Morocco
4
Hydraulic Basin Agency of Draa Oued Noun, Guelmim 81000, Morocco
5
HydroSciences Montpellier, University Montpellier, CNRS, IRD, 34090 Montpellier, France
*
Author to whom correspondence should be addressed.
Water 2022, 14(20), 3336; https://doi.org/10.3390/w14203336
Submission received: 2 September 2022
/
Revised: 6 October 2022
/
Accepted: 18 October 2022
/
Published: 21 October 2022
(This article belongs to the Section Hydrology)
Abstract
:Precipitation is a crucial source of data in hydrological applications for water resources management. However, several regions suffer from limited data from a ground measurement network. Remotely sensed data may provide a viable alternative for these regions. This study aimed to evaluate six satellite products (GPM-F, CHIRPS, PERSIANN-CCS-CDR, GPM-L, GPM-E and PDIR-Now), with high spatio-temporal resolution, in the sub-Saharan regions of Morocco. Precipitation observation data from 33 rain-gauge stations were collected and used over the period from September 2000 to August 2020. The assessment was performed on three temporal scales (daily, monthly and annually) and two spatial scales (pixel and basin scales), using different quantitative and qualitative statistical indices. The results showed that the GPM-F product performed the best, according to the different evaluation metrics, up to events with 40 mm/day, while the GPM near real-time products (GPM-E and GPM-L) were better at detecting more intense rainfall events. At the daily time scale, GPM-E and GPM-L and, on monthly and annual scales, CHIRPS and PERSIANN-CCS-CDR, provided satisfactory precipitation estimates. Moreover, the altitude-based analysis revealed a bias increasing from low to high altitudes. The continental and mountainous basins showed the lowest performance compared to the other locations closer to the Atlantic Ocean. The evaluation based on the latitudes of rain gauges showed a decrease of bias towards the most arid zones. These results provide valuable information in a scarcely gauged and arid region, showing that GPM-F could be a valuable alternative to rain gauges.
1. Introduction
Recently, satellite data, and, more specifically, precipitation estimation data, have become more and more relevant for hydro-climatic studies. The high spatio-temporal resolution and the near global availability of these data sources are the main reasons for this recourse [1,2]. Conventional precipitation measurement methods, such as rain gauge and ground-based weather radar, remain very limited, especially for developing countries, areas with complex topography and oceans [3,4,5], in addition to data quality issues and maintenance costs [6]. For all climatological purposes, the World Meteorological Organization recommends one rain gauge per 900 km2 in lowland areas and per 250 km2 in areas with complex topography [7]. Developing countries with widely dispersed rain gauges are still far from reaching these criteria [8,9,10].
Since the launch of the Tropical Rainfall Measuring Mission (TRMM) [11], in 1997, by the National Aeronautics and Space Administration (NASA) and the Japan Aerospace Exploration Agency (JAXA), satellite-based precipitation measurements have been rapidly developed. Several precipitation estimation products were launched afterwards and became freely available. e.g., Global Satellite Mapping of Precipitation (GSMaP) [12], Precipitation Estimation from Remotely Sensed Information using Artificial Neural Networks (PERSIANN) [13], Climate Hazards Group Infrared Precipitation with Stations (CHIRPS) [14], and The Integrated Multi-satellitE Retrievals for Global Precipitation Measurement (IMERG) [15]. However, satellite precipitation products (SPPs) are affected by uncertainties and biases, due to errors in retrieval algorithms, measurements, and biased correction processes. In addition, the accuracy of precipitation estimation algorithms is affected by the topography and climatic conditions of the monitored area [16,17,18]. Their performance varies from region to another, and under different climatic conditions [19]. To understand their advantages and limitations, these new data sources have been extensively studied and compared with observed data at the global scale as follows: in Africa [20,21,22], in America [23,24], in Europe [2,6,25,26], and in Asia [27,28,29,30].
In Morocco, different studies have carried out the evaluation of SPPs in different regions and applications. For drought monitoring, Hadria et al. [31] tested the TRMM product over the whole country at an annual scale. They found that this product showed a very strong correlation with the observed data. This correlation improved for long-term annual average precipitation. For hydrological modeling, Tramblay et al. [21] evaluated five SPPs in the Makhazine catchment, located in the north of Morocco. They found that the TRMM-3B42 v7 product was the closest to the observed data and reproduced the monthly flow dynamics at the basin scale well, despite poor performance at the daily scale. For the same application, Karmouda et al. [32] evaluated three high spatial resolution products (PESIANN- Cloud Classifcation System (CCS), CHIRPS and TRMM 3B42) in the Ouergha basin (Northern Morocco). They found that CHIRPS and TRMM showed a strong improvement on a monthly scale, and the CHIRPS product outperformed the other products in reproducing the observed flow. El Alaoui El Fels et al. [33] also tested the CHIRPS product for Rainfall Frequency Analysis in the Tensift basin. The results showed good agreement between observed and estimated data at the monthly scale, which improved even more with the use of a bias correction model. For flood simulation, Saouabe et al. [34] and Ouaba et al. [35] evaluated and used the IMERG product in the Tensift sub-basins, and concluded that these products could be an alternative for flow estimation in ungauged basins. For rainfall applications, Milewski et al. [36] evaluated the TRMM product over several catchments in Northern Morocco, and the results showed that the research product outperformed the near real- time product and both overestimated precipitation in an arid environment and underestimated it at high altitudes. Recently, Salih et al. [37] evaluated seven satellite products in the Tensift basin and found that the PERSIANN-CDR product was the most efficient and could, therefore, be used to study climate change in this region.
The sub-Saharan region in South Morocco remains less studied in terms of assessing satellite-based rainfall efficiency, especially for different time steps. Furthermore, most of the studies previously mentioned have assessed the SPPs at the monthly time step. To fill this gap, our study focused on this southern region, which is characterized by an arid climate. It is exposed to an increased aridity in summer and a greater spatial-temporal variability of rainfall than Northern Morocco. However, this context of aridity does not preclude the risks of flooding in this region. Flash floods can occur and are generally of short duration [38], causing significant material and human damage. For example, the Aouerga Wadi in the Souss basin has experienced three devastating floods in the last decade (2010, 2014 and 2018) that caused a lot of damage [39]. More recently, in 2019, the village of Tizert experienced a heavy flash flood that resulted in the deaths of at least seven people on a soccer field [40]. These extreme events could be accentuated by the impact of climate change [41], and this, as well as the fact that the region has significant economic dependence on its natural resources [42], require fundamental knowledge and monitoring of precipitation at a finer resolution.
The objective of our study was to evaluate six high resolution satellite products in sub-Saharan regions of Morocco that are characterized by a sparse gauge network and are exposed to extreme events. The evaluation of these different satellite data not only allows determination of the most suitable products for this study area, but also for specific applications (water resources management or monitoring and prediction of extreme events) in the region. These new data sources have never been tested in sub-Saharan Morocco, with the exception of the CHIRPS product that has been tested on a monthly scale for climate change assessment in the Chtouka Aït Baha region [43]. Our evaluation concerns a longer time period, from 2000 to 2020, in contrast to the majority of the aforementioned studies, that only addressed a shorter period of evaluation (usually less than 10 years). This limitation could be affected by the different satellite sensors, as well as the different retrieval algorithms used [44]. This time-series extension aimed to increase the reliability of the results, as well as determine the performance and adaptability of these products so as to exploit and use them in these sub-Saharan areas.
2. Study Area and Data Sets
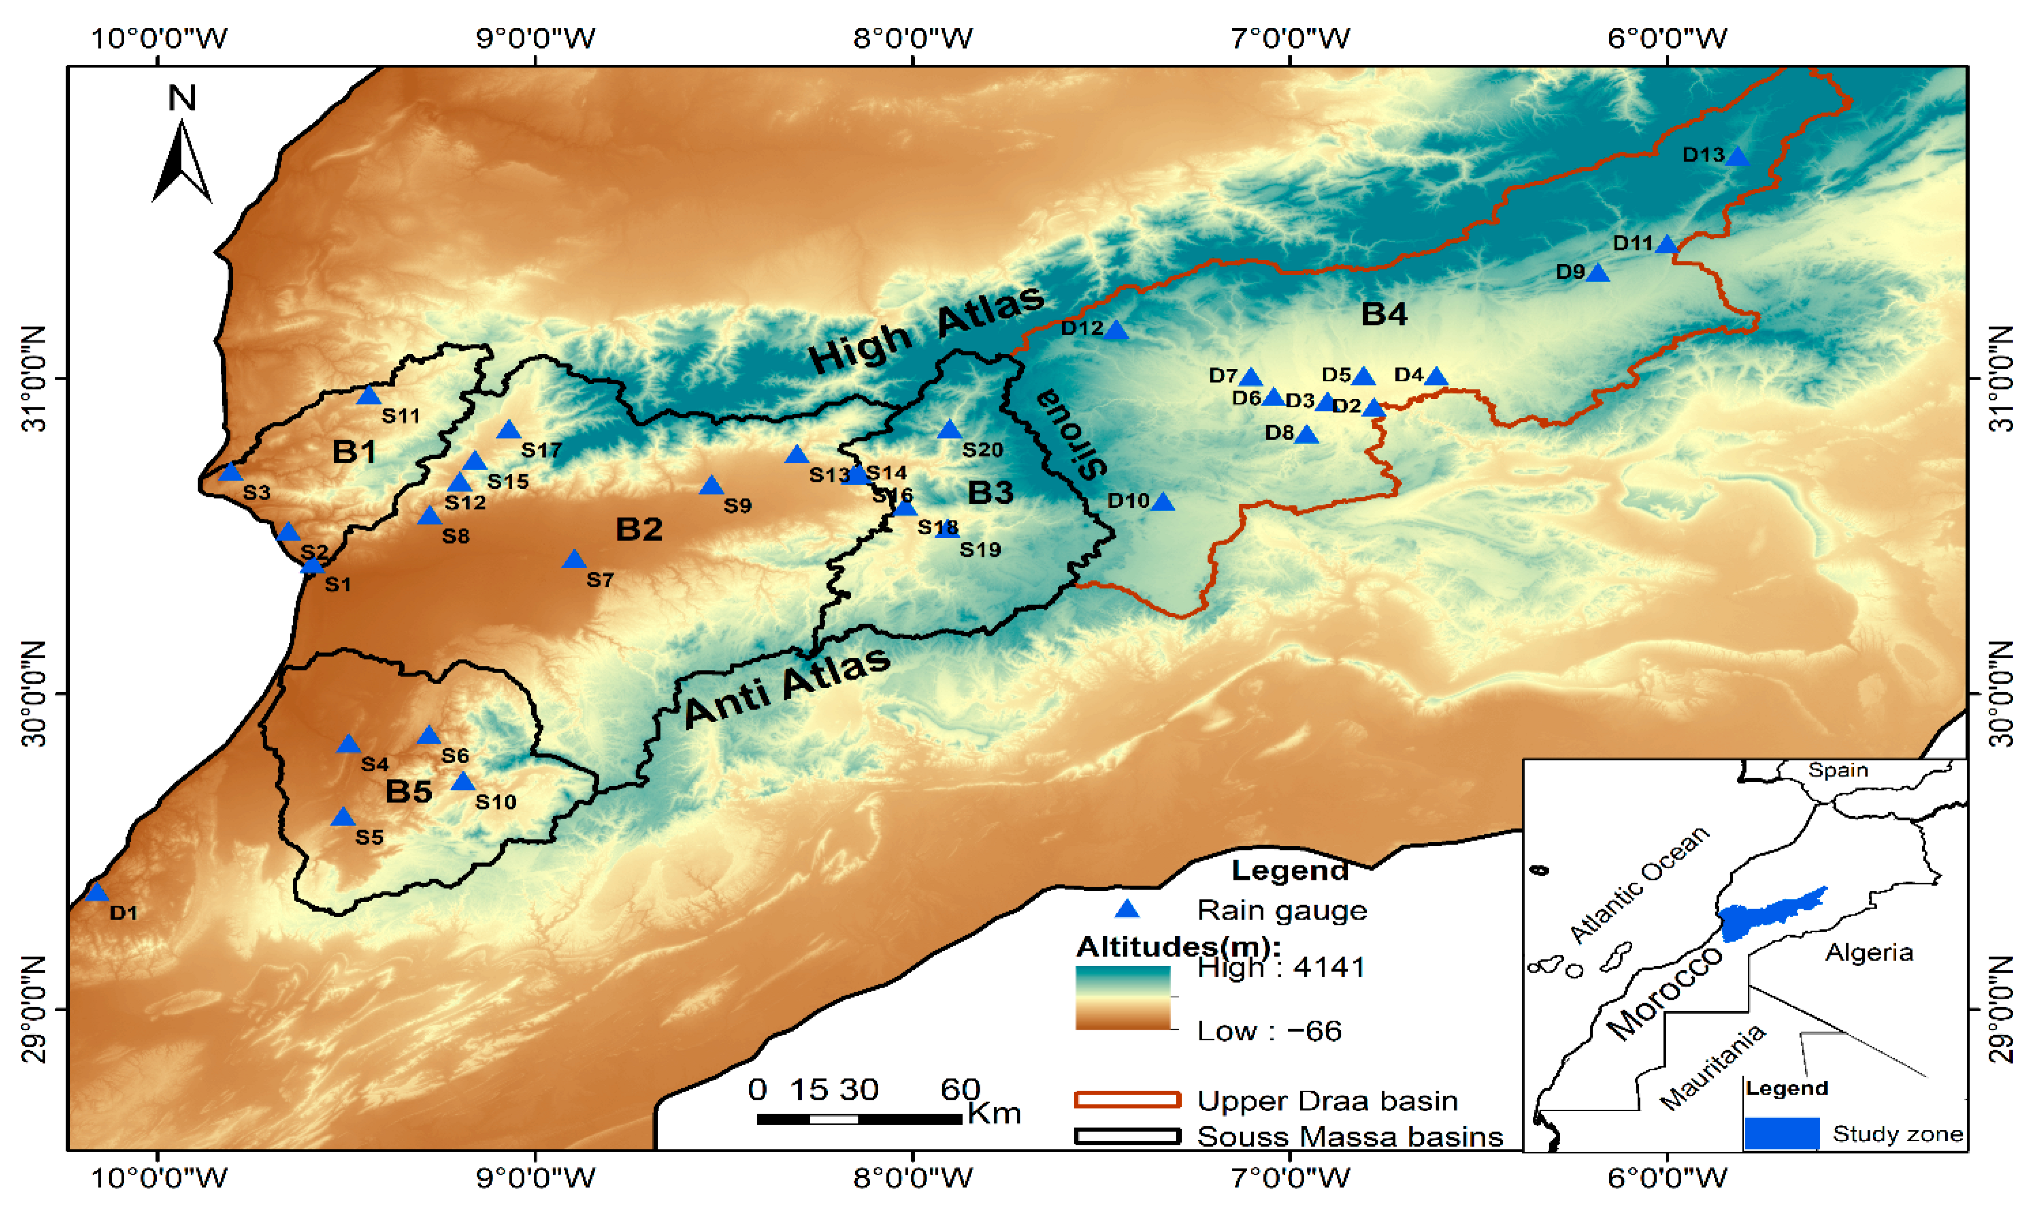
The study area concerns the Souss Massa and the Upper Draa basins. It is located in the south of Morocco, between latitudes 32° N and 29.3° N and longitudes 9.88° W and 5.5° W. It is limited by the High Atlas Mountains in the North, the Sahara in the South, Algeria in the East, and the Atlantic Ocean in the West (Figure 1).
The Souss Massa basin is drained by the Oued Souss and, in the south, by the Oued Massa. The basin is characterized by a semi-arid to arid climate. High altitudes and coastal areas receive more rainfall than low altitude and continental areas. Annual rainfall varies from 100 mm in the plains to 600 mm in the High Atlas Mountains. Temperatures are mild and regular, with an annual average of 20 °C. The climate is influenced by the Canary cold stream and the mountainous barrier of the Anti-Atlas, which constitutes a protection against the southern winds [41,45,46].
The Upper Draa basin constitutes the upstream part of the largest basin in Morocco (Draa basin), with the tributaries of Dades, Ouarzazate and Aït Douchen. These tributaries drain the southern slopes of the central High Atlas and the northern slopes of the Anti-Atlas. This part represents the mountainous area of the Draa basin. The high mountains are characterized by a subhumid climate, while the low altitudes have an arid climate with low precipitation, about 116 mm/year [47]. The presence of, and SW-NE orientation of, the Siroua Massif (the link between the High Atlas and the Anti-Atlas) poses an obstacle to oceanic influences, which means the Saharan influences are felt much further east [48].
In general, the climate of the study area is influenced by: latitude (increasing aridity from north to south), altitude (colder climatic conditions in mountainous areas), and longitude (increasing continentality from west to east, due to the distance from the Atlantic Ocean) [45,49]. On this basis, the study region is divided into five basins (Figure 1): B1, semi-arid and oceanic; B2, sub-oceanic and sub-arid; B3, semi-continental and sub-arid; B4, sub-arid and continental; B5, sub-oceanic and arid.
2.1. Ground Observations
A total of 33 rain gauge stations were used to evaluate the satellite products in this study. Of these, 20 stations were from the Souss Massa Hydraulic Basin Agency (ABHSM) and the remaining stations (13) were from the Draa Oued Noun Hydraulic Basin Agency (ABHDON). These two agencies provide data on a daily time scale. Table 1 shows the coordinates, as well as the percentage of missing values, in each station calculated at a daily time step. A rate of 20% missing data was considered a threshold not to be exceeded for the total records [50]. These missing values were not considered in the evaluation. To not disturb the evaluation and to guarantee its reliability, the missing days in each station were also excluded from the satellite data. The availability of observed data only at the daily scale forced us to start the evaluation at this scale, despite the availability of most satellite products in a sub-daily time scale.
2.2. Satellite Rainfall Products
In this study, we evaluated six satellite products, of which three belong to the GPM (Global Precipitation Measurement) mission, two others are developed by the Center for Hydrometeorology and Remote Sensing (CHRS), and one is developed by USGS (United States Geological Survey) and CHC (Climate Hazards Center). The choice of these products was based on their availability (Open access), their high spatial-temporal resolutions and their large spatial coverages. Table 2 summarizes the characteristics of these data sources. Among these products, 3 are based on satellite data only (GPM-E, GPM-L and PDIR) and three combine satellite and gauge data (CHIRPS, GPM-F, PERSIANN-CCS-CDR).
- GPM products
The GPM mission is the successor of the Tropical Rainfall Measurement Mission (TRMM). It was launched in 2014 by NASA and JAXA with many improvements, especially in terms of resolution and spatial coverage. The GPM mission measures precipitation using a constellation of satellites from different providers and a main calibration satellite (GPM-Core) to produce near real-time precipitation estimates [15]. Version 06 is the most recent version, merging early precipitation estimates collected by the TRMM satellite mission (2000–2014) with more recent precipitation estimates collected during the GPM satellite operation (2014–present) [15,51].
This product provides data in three runs: early (4 h after observation time), late (14 h after observation time) and final (3.5 months after observation time). The main difference between the early and the late run is that IMERG Early only has forward propagation (extrapolation forward in time), and is not corrected by observed data. The final step uses monthly rainfall station data from the Global Precipitation Climatology Centre (GPCC) to calibrate the data and create research-level products [15].
The three products of the GPM- IMERG V06 mission were downloaded from the following NASA site: «https://gpm.nasa.gov/data-access/downloads/gpm» (accessed on 16 June 2022).
- CHRS products
The CHRS at the University of California, Irvine (UCI) [13] produces five products of the PERSIANN family using an Artificial Neural Network (ANN) model: PERSIANN [52], PERSIANN-CCS [53], PERSIANN-CDR [54], PERSIANN-CCS-CDR [55] and PDIR-Now [56]. PERSIANN-CCS-CDR and PDIR-Now are the two products evaluated in this study. The PERSIANN-CCS-CDR product combines the two algorithms used in the PERSIANN-CCS and PERSIANN-CDR products in order to produce a product with both very fine spatial resolution and large temporal coverage. Most products that provide fine resolution estimates only cover a short period of record. This product uses Gridded satellite infrared data (GridSat-B1) and NOAA (National Oceanic and Atmospheric Administration) Climate Prediction Center (CPC-4 km) IR product as input data and is adjusted by the Global Precipitation Climatology Project (GPCP V2. 3) [55]. The PDIR product is a near real-time product with a short latency of 15–60 min, which is very suitable for near real-time hydrological applications, like flood prediction. It is intended to replace the PERSIANN-CCS product [56]. The main data used in the estimation of this product is the IR data provided by the Climate Prediction Center (CPC) at the National Weather Service. It merges 11-μm brightness temperature (Tb) data from all available geostationary satellites into a single half-hourly Tb IR field at 4 km spatial resolution [56].
These two products were downloaded from the Portal platform [57] «https://chrsdata.eng.uci.edu» (accessed on 16 June 2022).
- CHIRPS v2.0 product
The CHIRPS satellite precipitation product is developed by the US Geological Survey and the Climate Hazards Group at the University of California, Santa Barbara [14]. The main data sources used to estimate the CHIRPS product are as follows: Monthly precipitation climatology CHPClim; quasi-global geostationary thermal infrared (IR) satellite observations from the (CPC) IR, and the National Climatic Data Center (NCDC) B1 IR; the Tropical Rainfall Measuring Mission (TRMM) 3B42 product from NASA; atmospheric model rainfall fields from the NOAA Climate Forecast System; version 2 of the reanalysis product (CFSv2); in situ precipitation observations obtained from a variety of sources, including national and regional meteorological services [58].
The data was downloaded from the site: «https://www.chc.ucsb.edu/data/chirps» (accessed on 16 June 2022).
All the SPPs were downloaded on a daily step, from 1 September 2000 to 31 August 2020, and were converted into monthly and annual time steps. The choice of the study period was based on both the availability of observed data and the availability of the satellite products.
3. Methods
Two spatial scales were adopted to evaluate the performance of these products:
- Pixel scale
Given the limited number of rain-gauge stations, as well as their dispersion in the study area, the “point-to-pixel” approach [22,59,60,61] was adopted in this study to evaluate satellite products, instead of the “pixel-to-pixel” approach (e.g., [62]), which consists of interpolating the station measurements into gridded data of the same spatial resolution as the evaluated product. Interpolation could produce unrealistic estimations for regions with a widely sparse and uneven number of rain gauges [19,63,64,65]. The study in [66] evaluated the three IMERG products using the two aforementioned approaches and found that both methods (the point-to-pixel or pixel-to-pixel) yielded very similar results. In addition, the high spatial resolution of the products used in this study would not influence the relevance of the evaluation.
- Basin scale
In order to minimize the error due to interpolation, basin-averaged analysis [29,30] was used to examine the accuracy of each product over the five selected basins. It should be noted that precipitation data measured on the ground are very scattered in our study area, so the creation of a spatialized reference dataset, via spatial interpolation methods. for instance, could be very complicated and could introduce additional bias.
For both spatial scales, the evaluation was done over the period from September 2000 to August 2020, on three temporal scales (daily, monthly, annually), using quantitative (continuous) and qualitative (categorical) statistical indices (Table 3):
3.1. Continuous Metrics
Four statistical indices widely used to evaluate satellite products [67,68,69] were used to quantitatively evaluate these products (Table 3): (1) CC (correlation coefficient), which measures the degree of linear association between estimated and observed precipitation; (2) RBias (relative bias), which describes the systematic bias between the precipitation estimated by each product and the observed precipitation. Negative bias values indicate an underestimation of precipitation, while positive values indicate an overestimation; (3) RMSE (root-mean-square error) and (4) MAE (mean absolute error) [70]. These last two indices are similar or, rather, have the same objectives. They measure the average magnitude of the error between estimated and observed precipitation. RMSE is very sensitive to outliers, while MAE is less sensitive to extreme values [71]. The study of [72] shows that RMSE is inappropriate for assessing model performance and favors the use of MAEs, while [2] found that RMSE and relative bias are the most appropriate to select the best performing product in hydrological modeling, and [73] suggest that RMSE is more relevant to represent model performance than MAE when the error distribution is expected to be Gaussian, but conclude that a combination of metrics is often necessary to assess model performance. To that end, we used both metrics in this evaluation. All indices were normalized by the mean of the observed data, and used as relative metrics. This was in order to compare the station results, and to eliminate the effect of the unit and its sensibility to change [71,74].
3.2. Categorical Metrics
The detection ability of the products was also evaluated using three categorical indices: the Probability of Detection (POD), the False Alarm Ratio (FAR) and the Critical Success Index (CSI) (Table 3). The indices were calculated, based on a contingency table (Table 4), between the satellite-based rainfall and the observed data. The POD measures the fraction of observed events that are correctly detected by the product. The FAR measures the ratio of events detected by the product but not really produced, and CSI is an overall reflection of a product’s ability to detect real precipitation events [70]. These three indices were measured on a daily time scale. A threshold of 1 mm/d, suggested by many previous studies [3,75,76], was used as a rain/no rain threshold, and to determine the capacity of these products over different intensity intervals. Five precipitation intensity classes, from the World Meteorological Organization [77], were modified and adapted to our study climate (Table 5).
4. Results
4.1. Evaluation at the Pixel Scale
4.1.1. Performance of Continuous Metrics
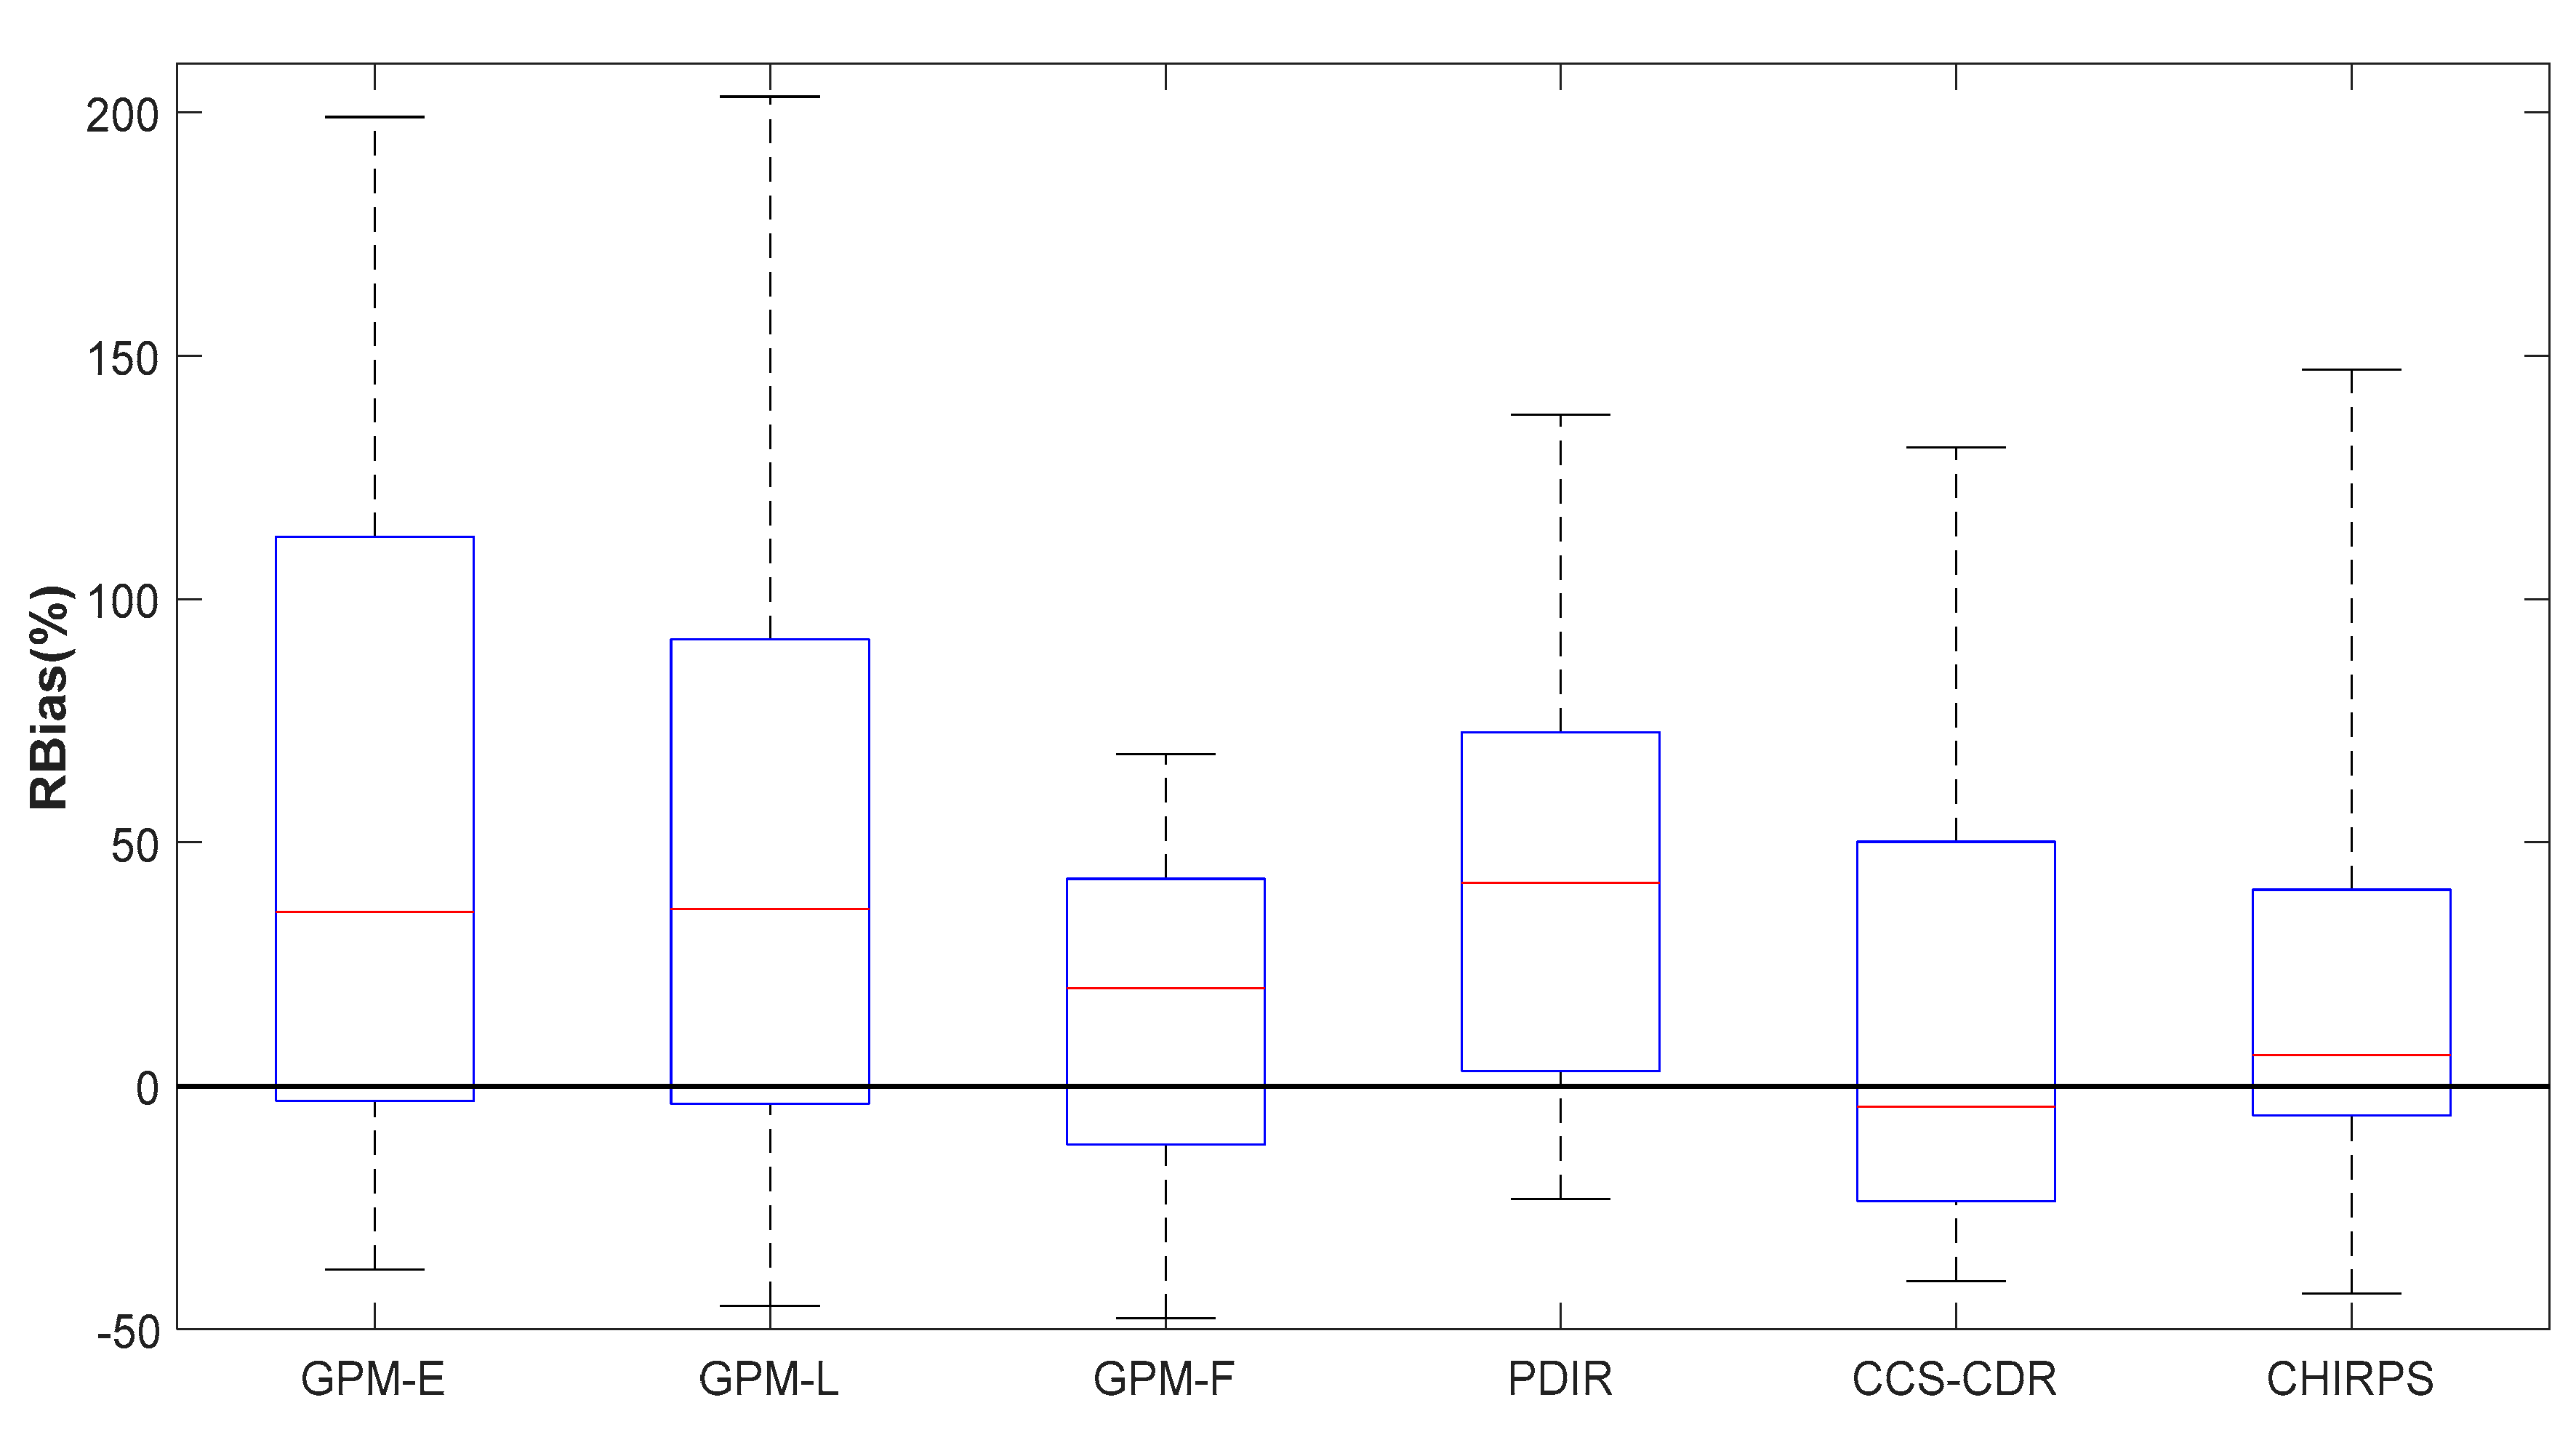
For all stations, the uncorrected products (GPM-E, GPM-L, PDIR) overestimated precipitation with similar median bias (35.7%, 36.3%, 41.6%). The GPM-E product had the largest interval variation, followed by the GPM-L product and then the PDIR product. The corrected products showed a smaller bias. The CCS-CDR showed the lowest bias (slight underestimation with a median of −4.2%). The GPM-F and the CHIRPS overestimated precipitation with a median bias of 20% and 6.3%, respectively (Figure 2).
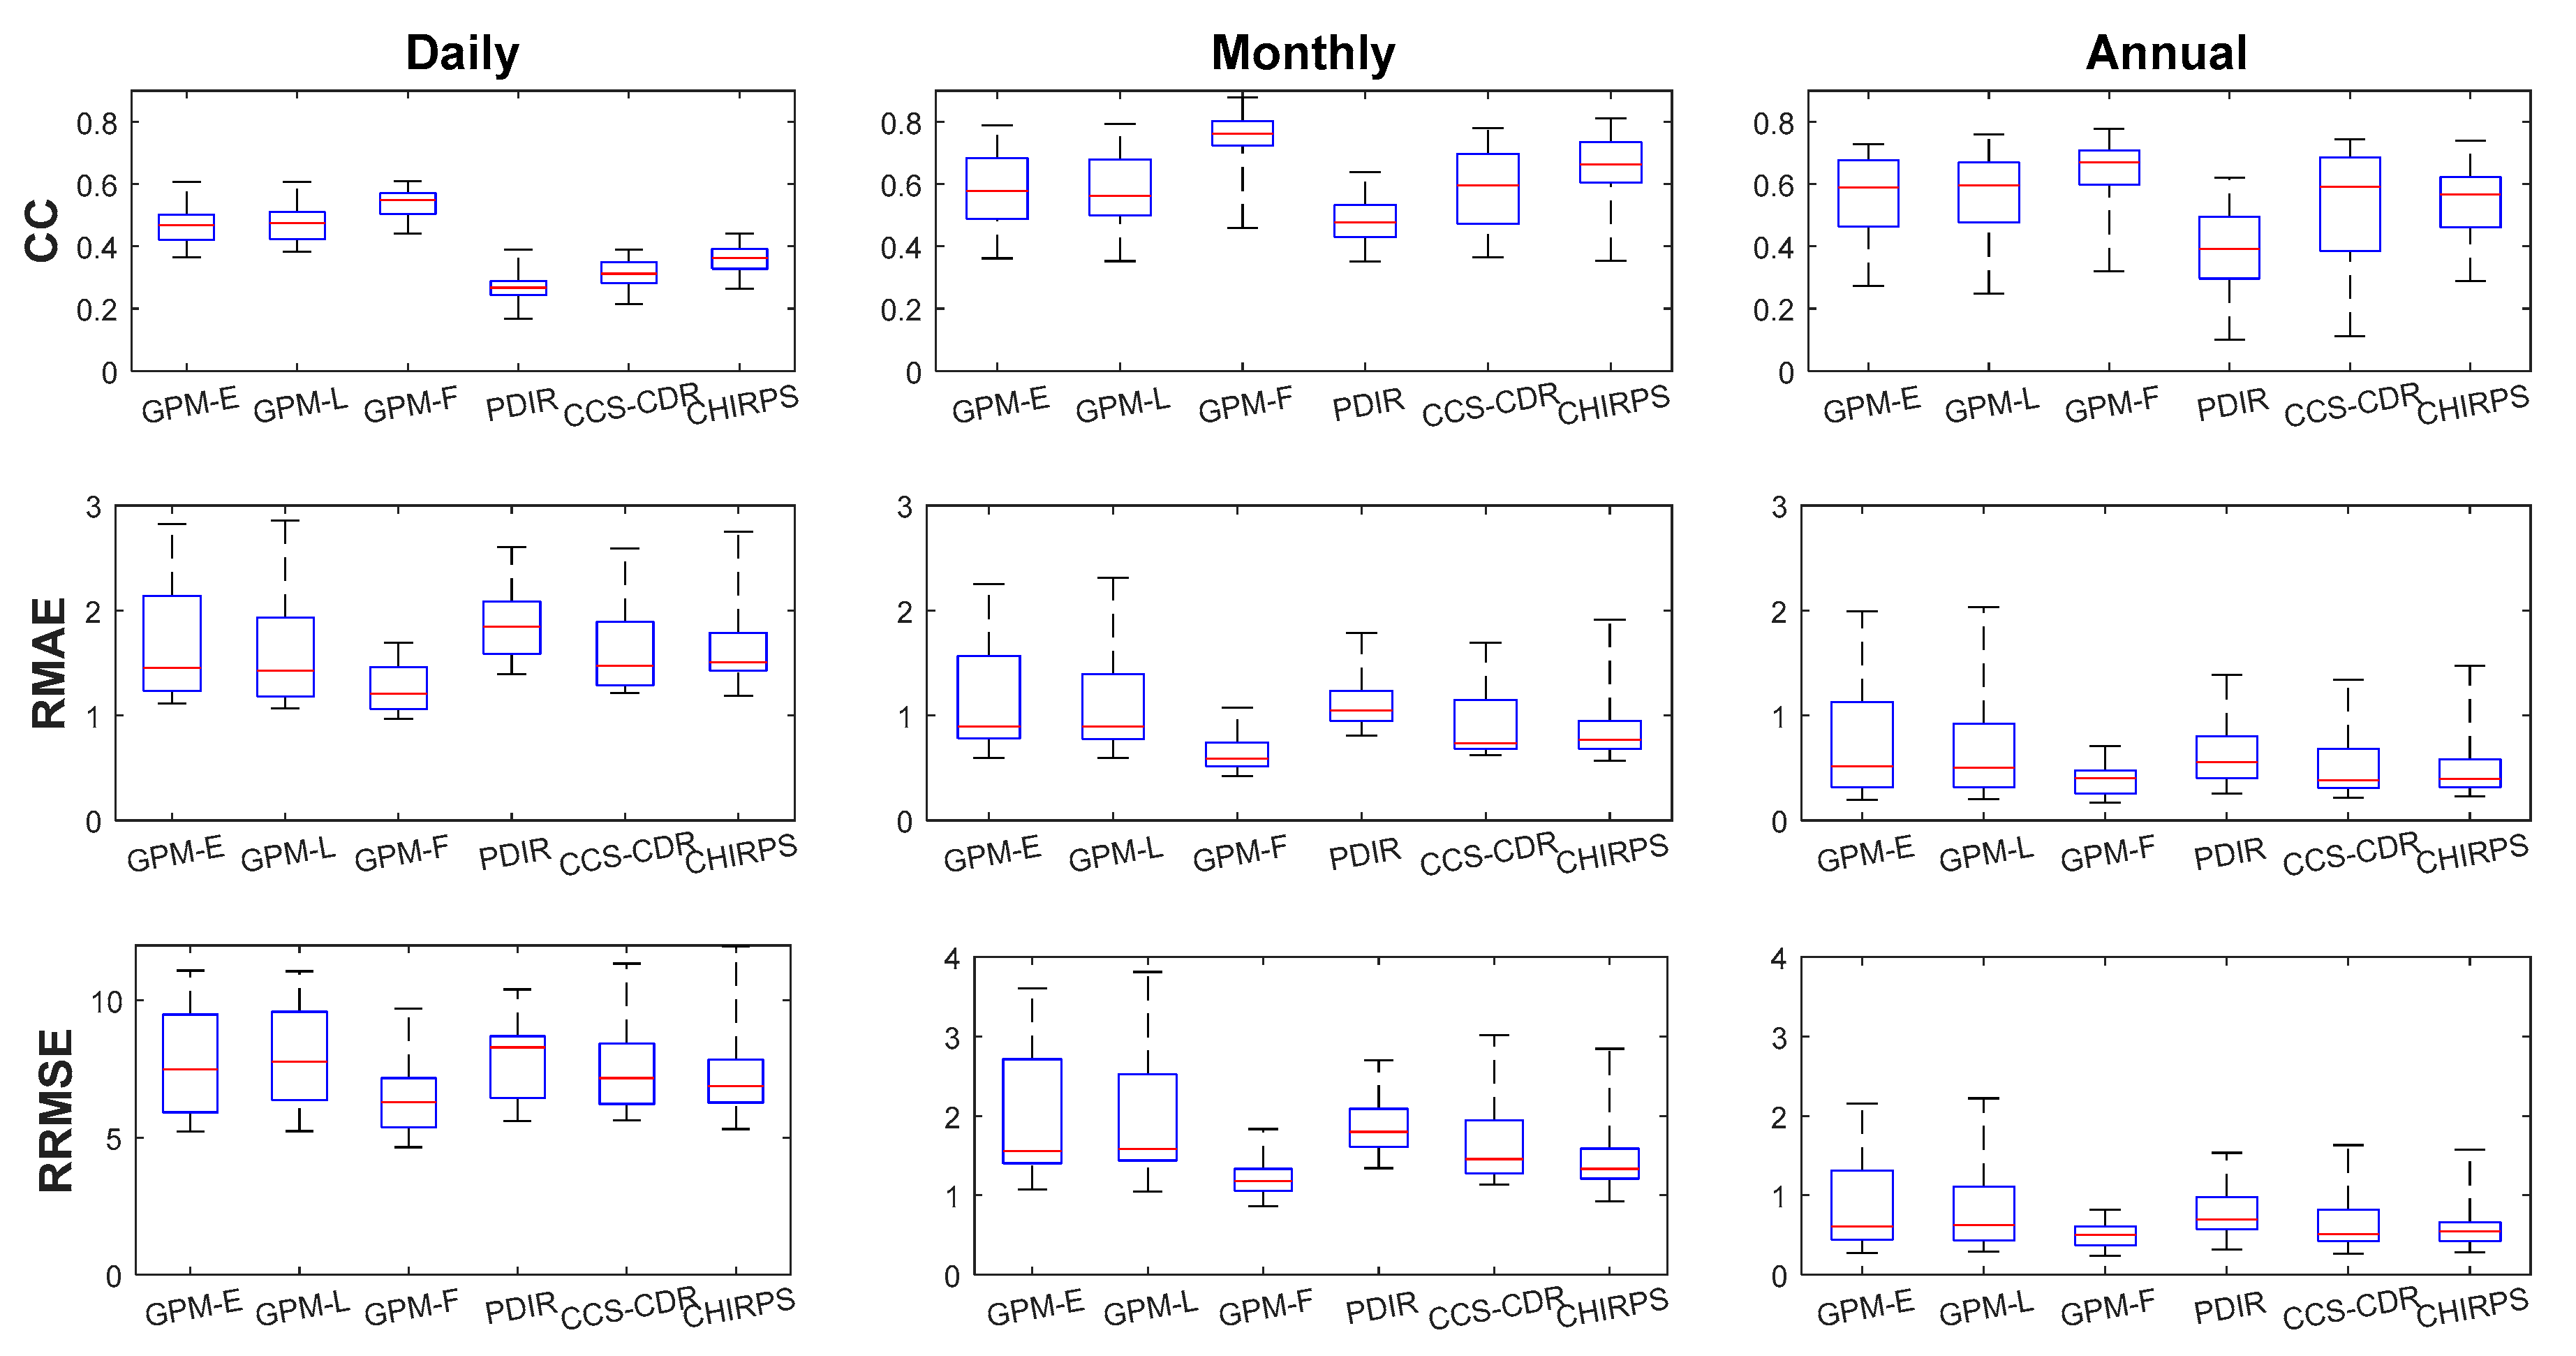
Figure 3 shows the correlation coefficient (CC), RMAE and RRMSE for the different satellite estimates against the ground observations. The median correlations ranged from 0.27 to 0.79 for all three scales: daily, monthly, and annually. The daily scale had the lowest values with a median between 0.27 and 0.55, depending on the satellite product, which improved more at the monthly scale (0.48–0.79) than at the annual scale (0.39–0.66). The medians of relative mean absolute error (RMAE) varied between 1.2 and 1.5 at the daily scale. This interval decreased at the monthly scale (0.58–1). It decreased even more at the annual scale (0.38–0.55). The RRMSE also showed a remarkable improvement when moving from daily to annual scale. The GPM-F product performed well at all the scales. It had the highest CC and the lowest RMAE and RRMSE values, followed by the GPM-E and GPM-L products, which outperformed the other products at the daily scale, despite being uncorrected products. At the monthly and annual scales, the corrected products took second ranking, notably the CHIRPS and the CCS-CDR products. The PDIR product was last in terms of performance at all the scales.
- Evolution of continuous metrics according to altitudes
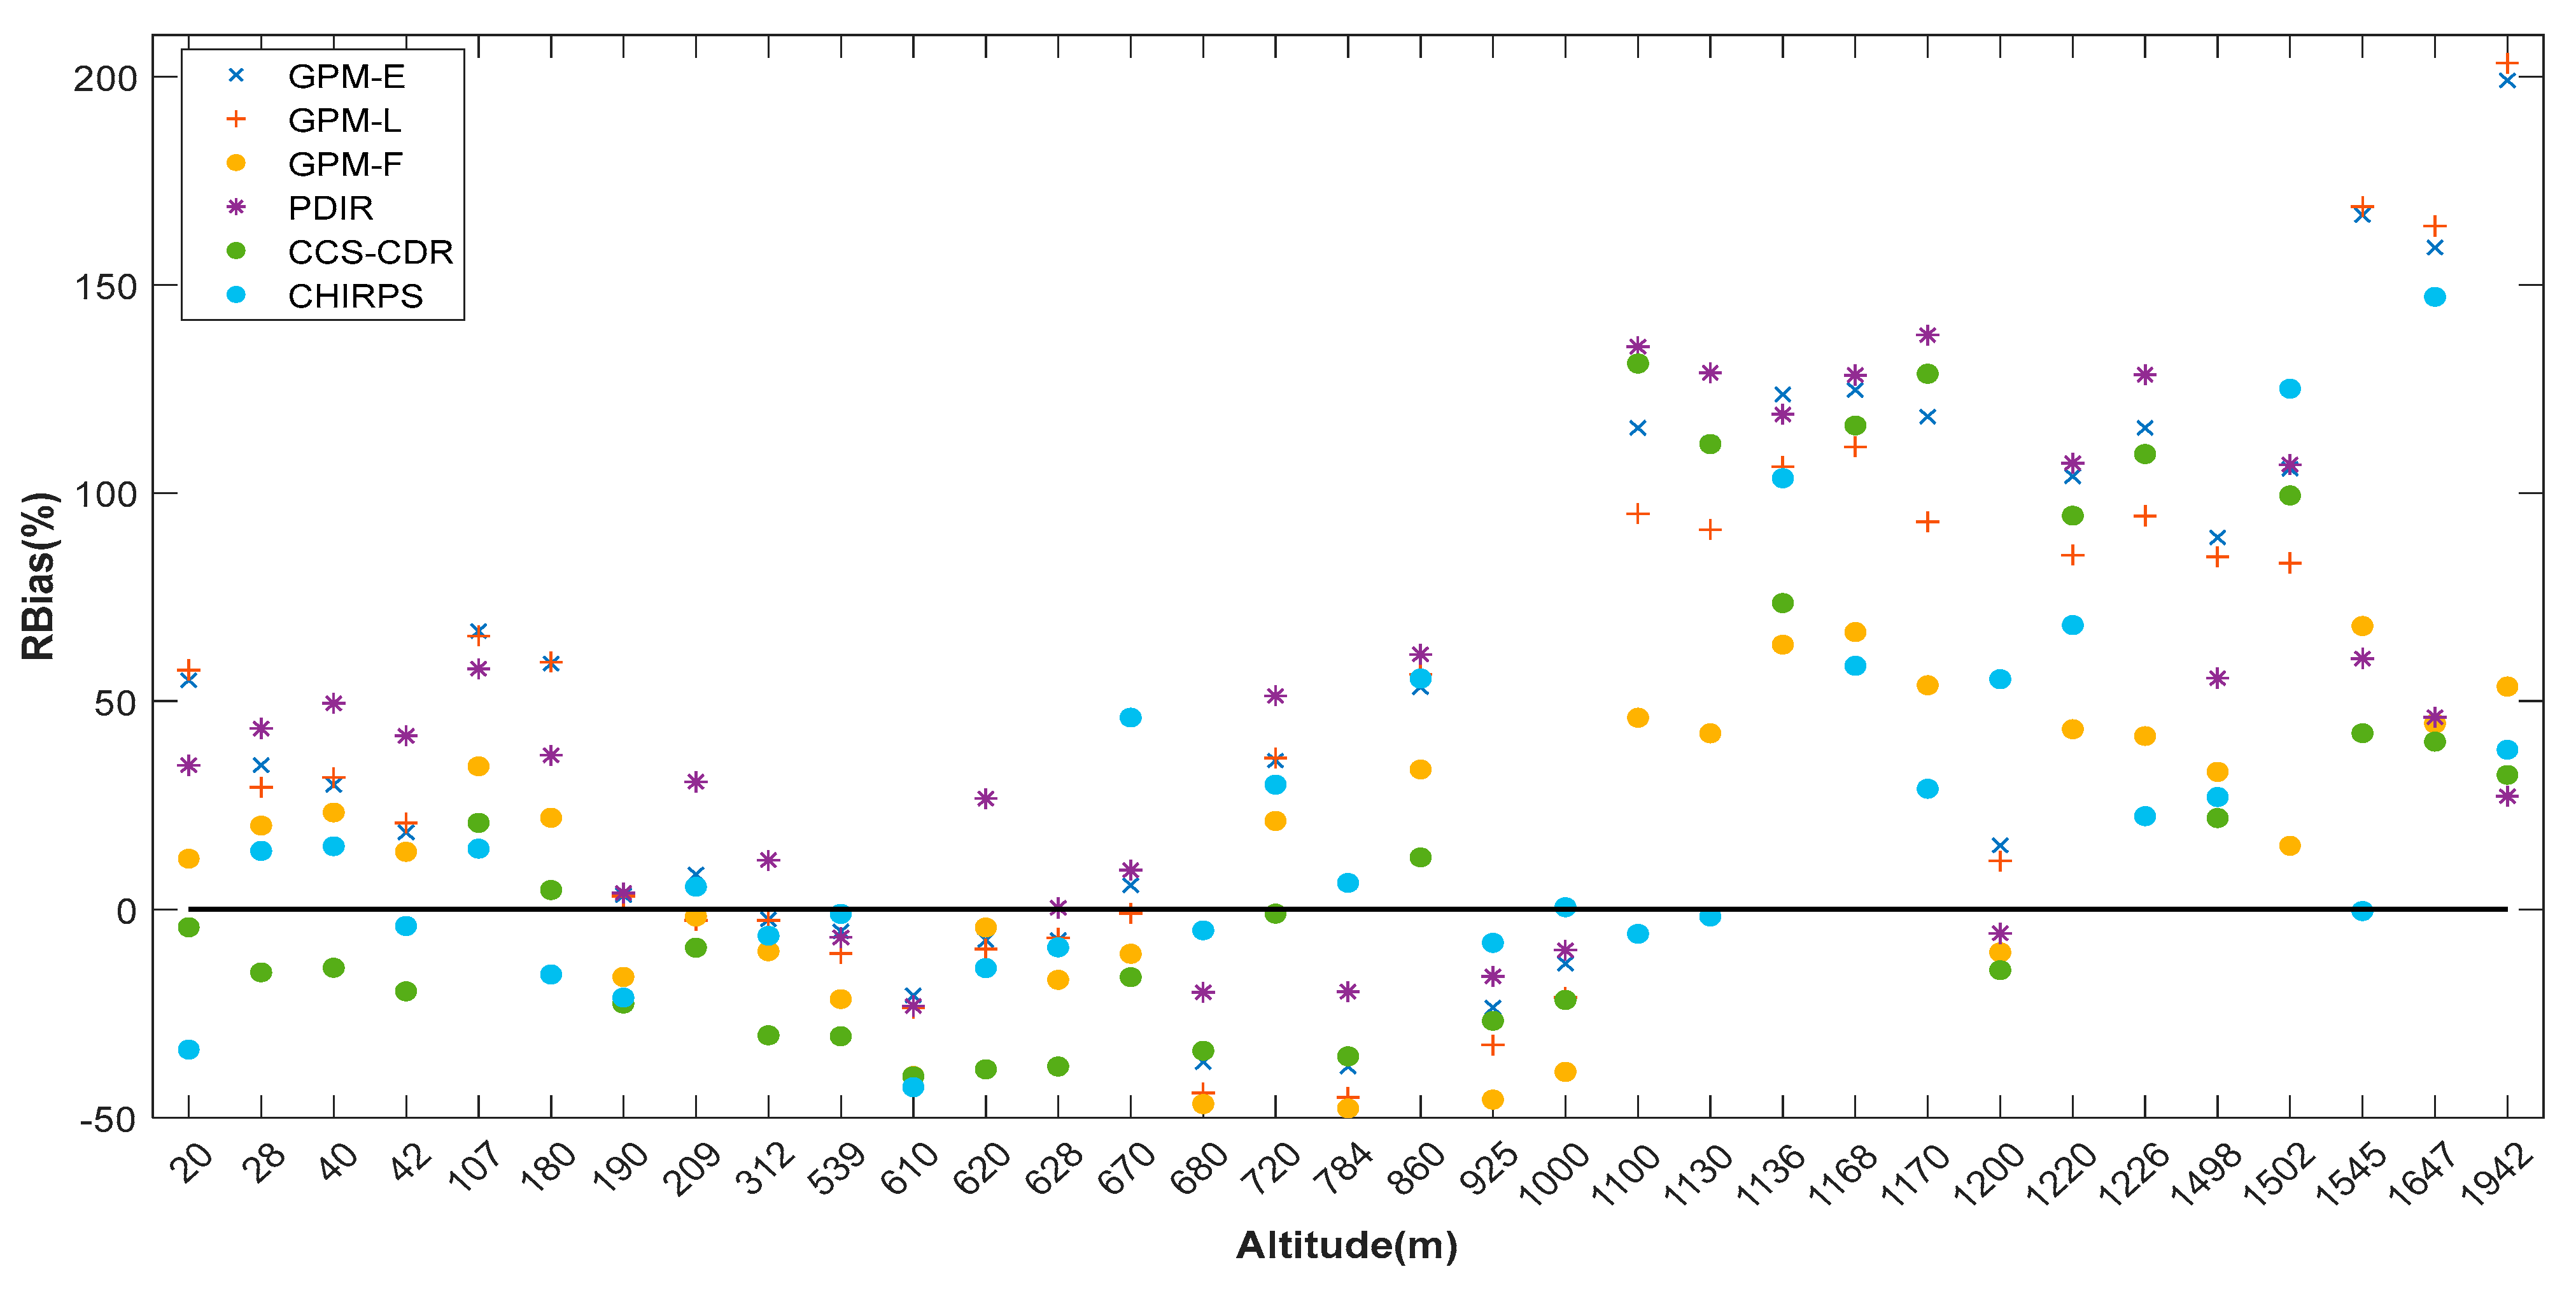
In this section, we analyzed the variation of the continuous metrics according to the altitudes. Figure 4 shows the relative bias of each product, according to the altitudes from the lowest (20 m) altitude to the highest (1942 m). We observed that, for low altitudes, most of the products moderately overestimated the observed precipitation. For the piedmont part (539–1000 m), there was generally an underestimation, except for two stations (Aguenza (720 m) and Amssoul (860 m), which showed a moderate overestimation for all products. For high altitudes (above 1000 m), there was a very strong overestimation of precipitation, reaching 200% for both GPM-E and GPM-L products. However, generally, and for all altitudes, the GPM-F, CHIRPS and CCS-CDR products were the closest to the observed data. The two other GPM products (GPM-E and GPM-L), and the PDIR products, were the most biased, especially for high altitudes.
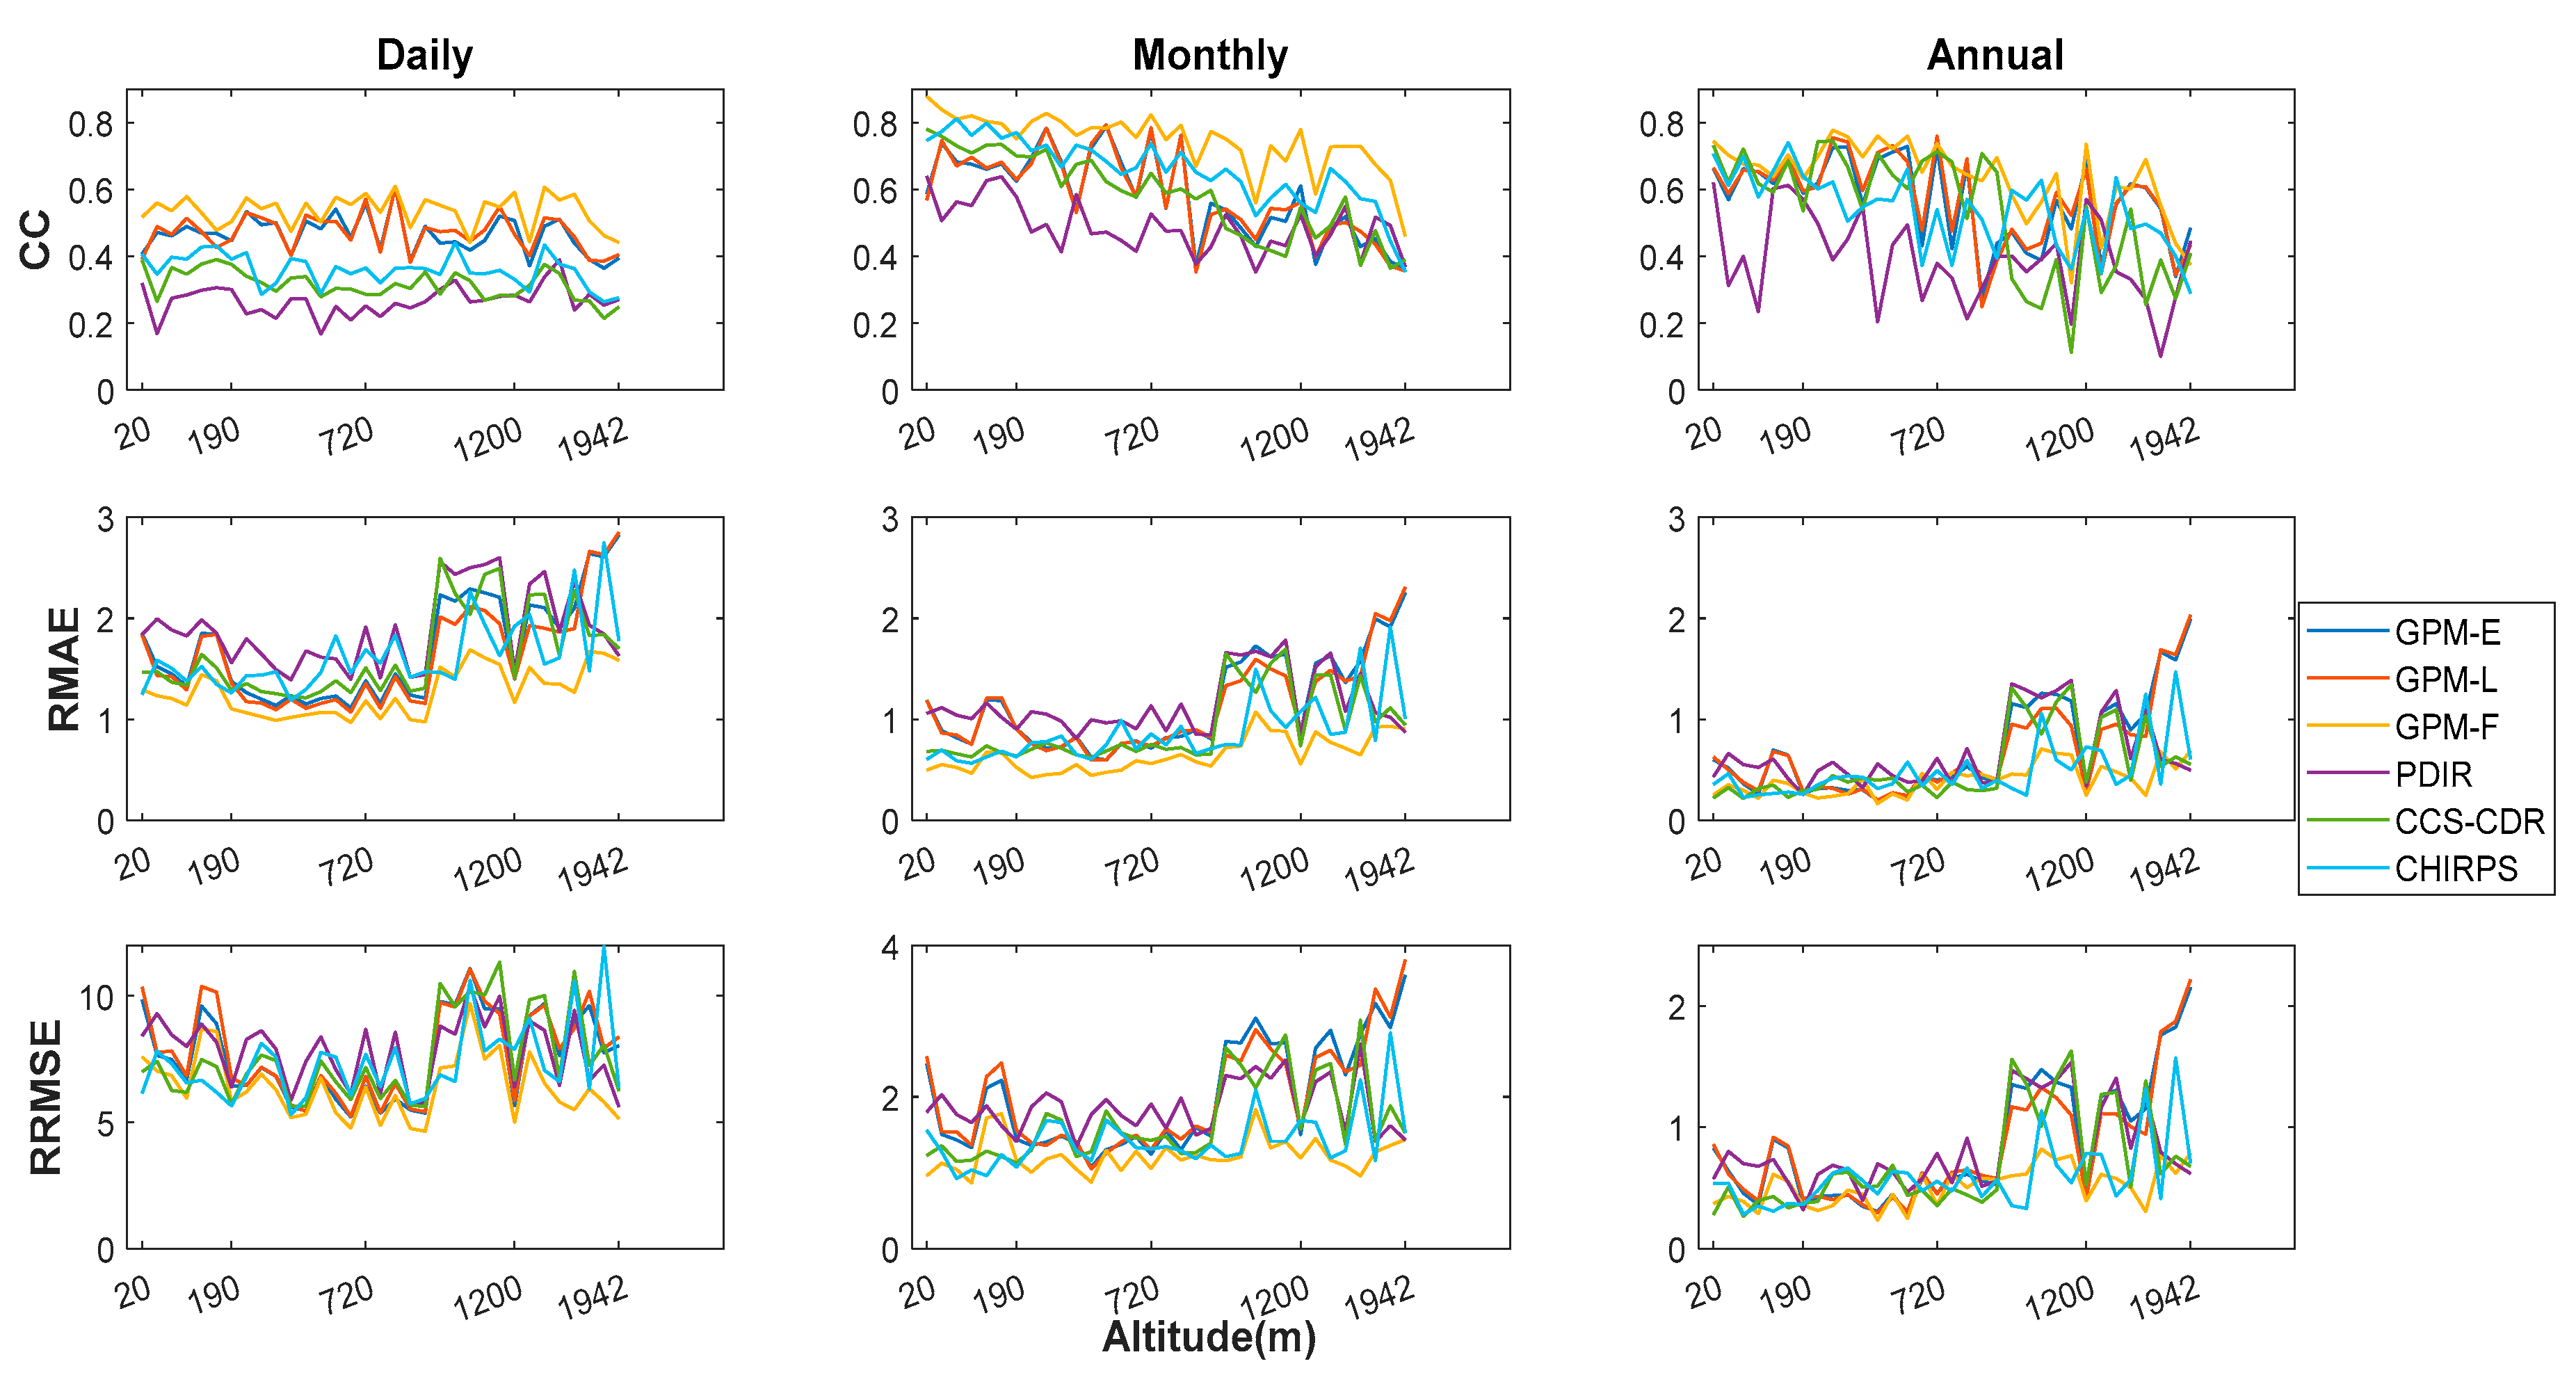
We found that the correlation did not show a very precise trend at the daily scale (Figure 5). On the other hand, the RMAE and the RRMSE showed an increasing trend towards the high altitudes, except for one station, Iguidi station (1200 m), which gave a lower RMAE and RRMSE, in spite of its high altitude. At the monthly and annual scales, the CC decreased towards higher altitudes, while the RMAE and RRMSE increased (especially for altitudes above 1000 m), except for the aforementioned station. The GPM products showed the highest correlation at the daily scale and had the lowest relative errors (RMAE and RRMSE). The PDIR product was the least performing at all the scales and for all the metrics.
- Evolution of continuous metrics according to latitudes
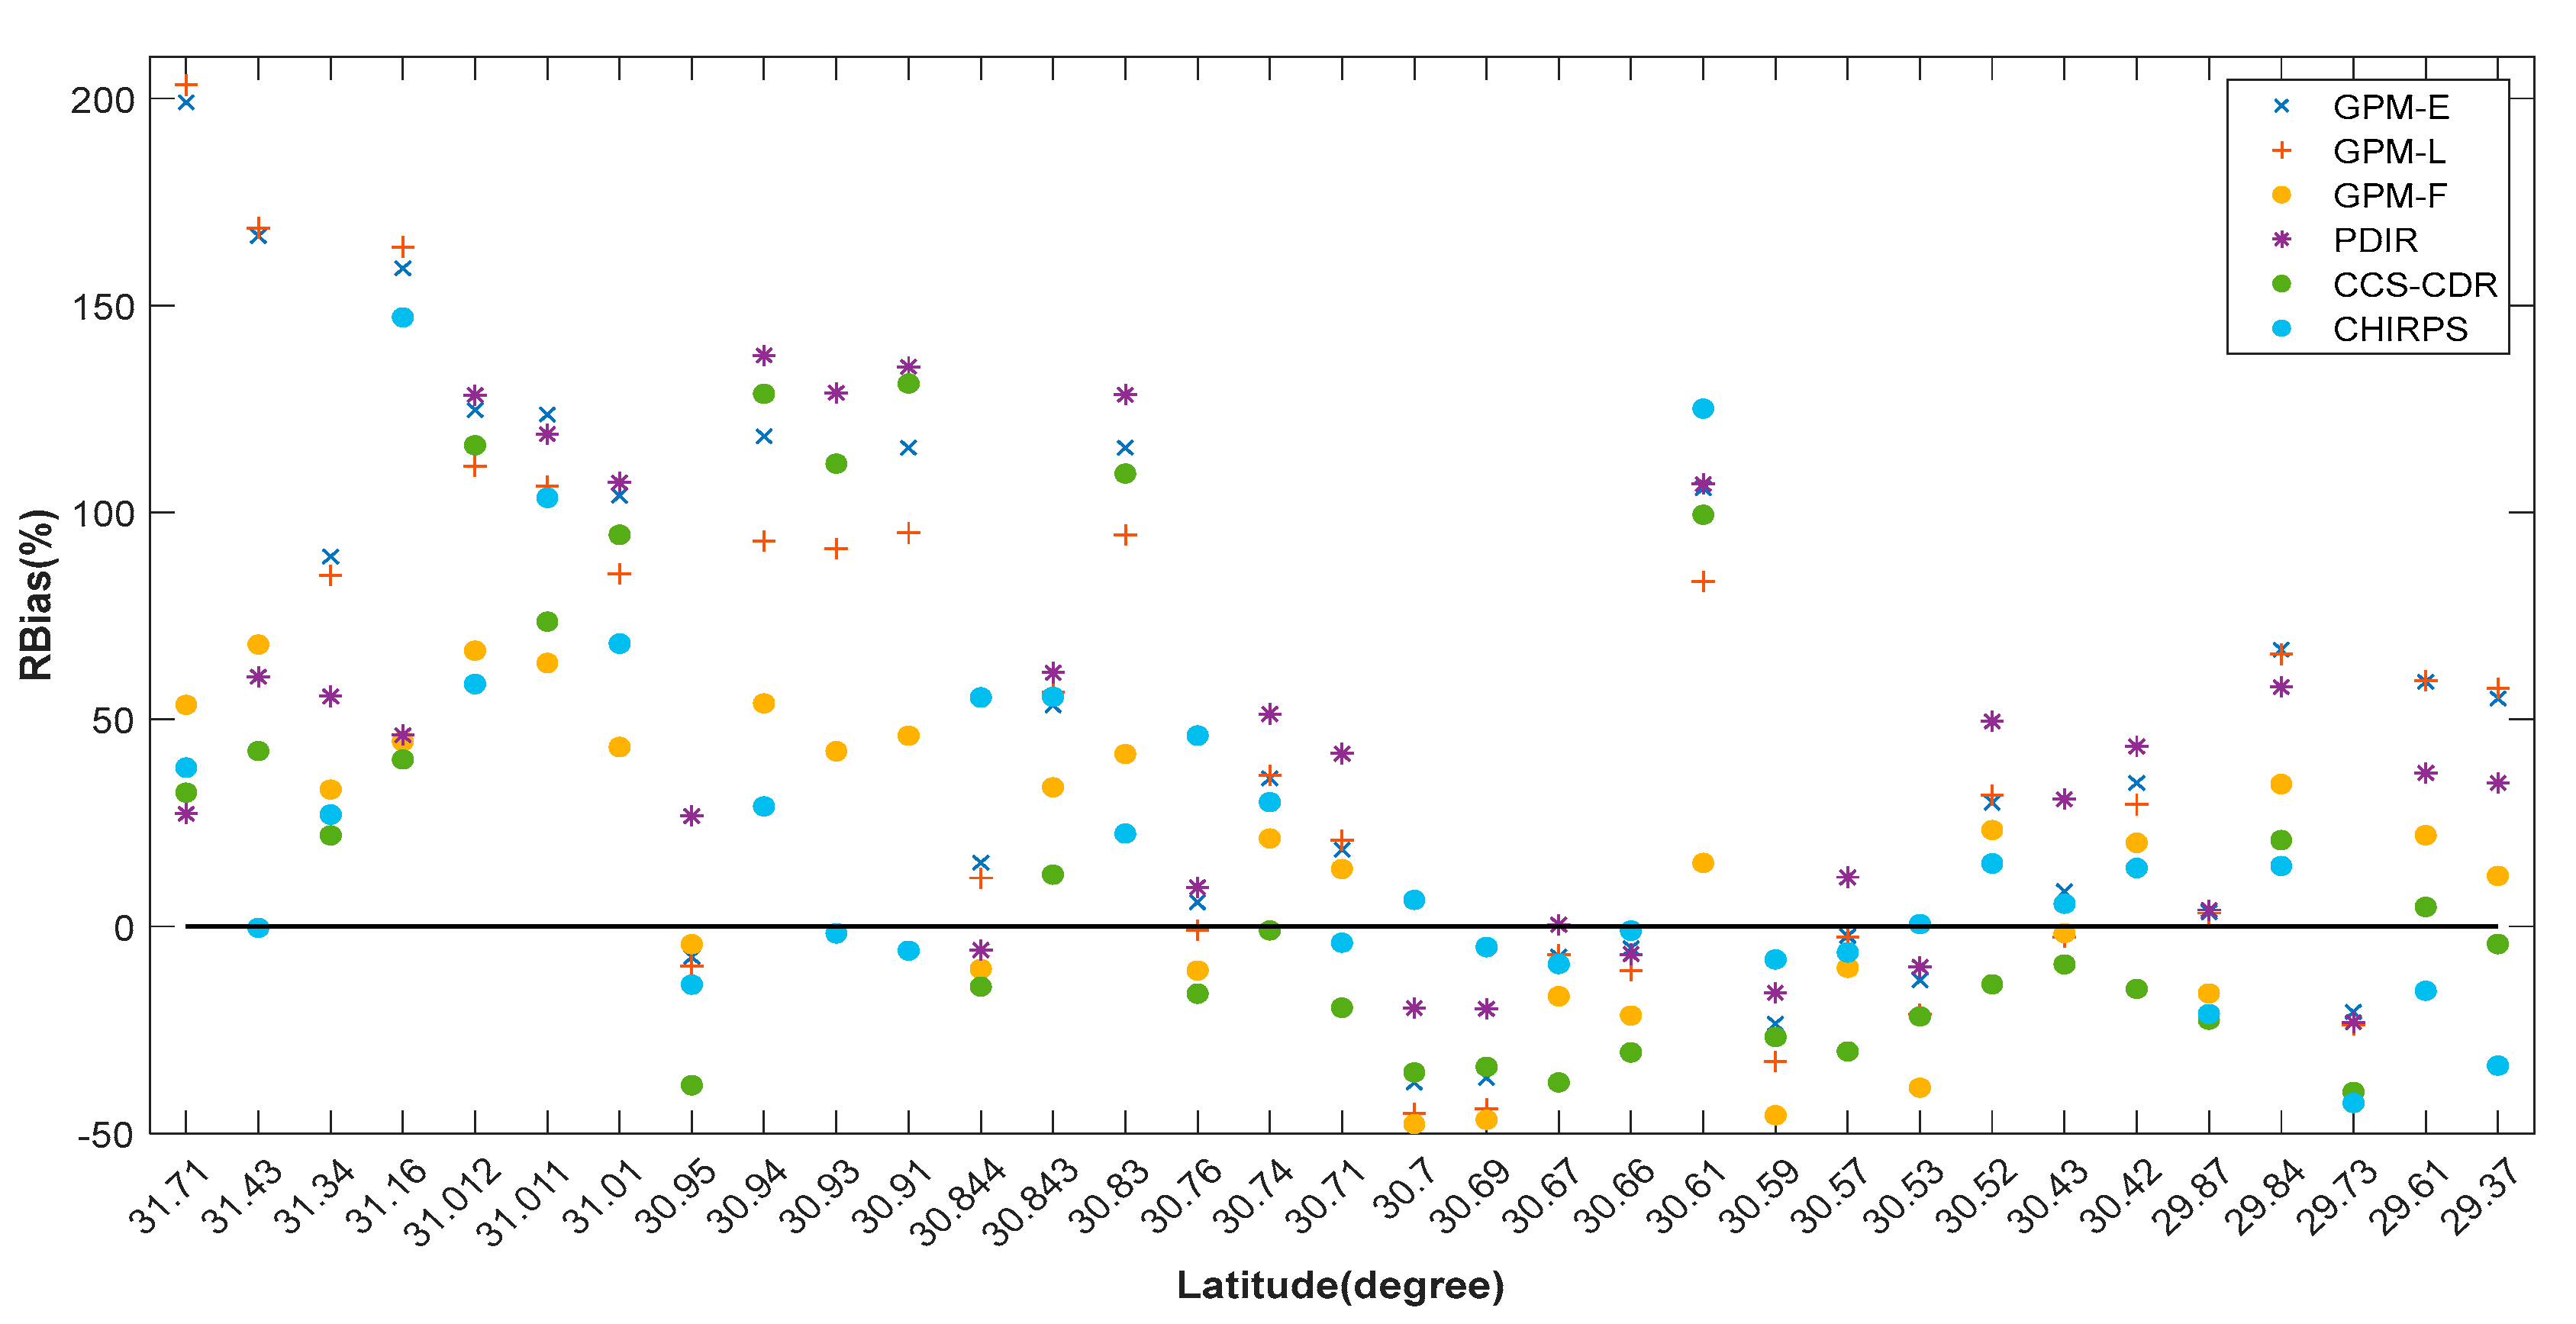
The variation of relative bias according to the latitudes, i.e., from the north to the south of the study area, showed that, generally, the relative bias decreased from north to south for all the products (Figure 6). The exception was the Imdghar N’Izdar station (30.61°), which was influenced by its high altitude (1502 m) and, therefore, showed a remarkable overestimation of precipitation.
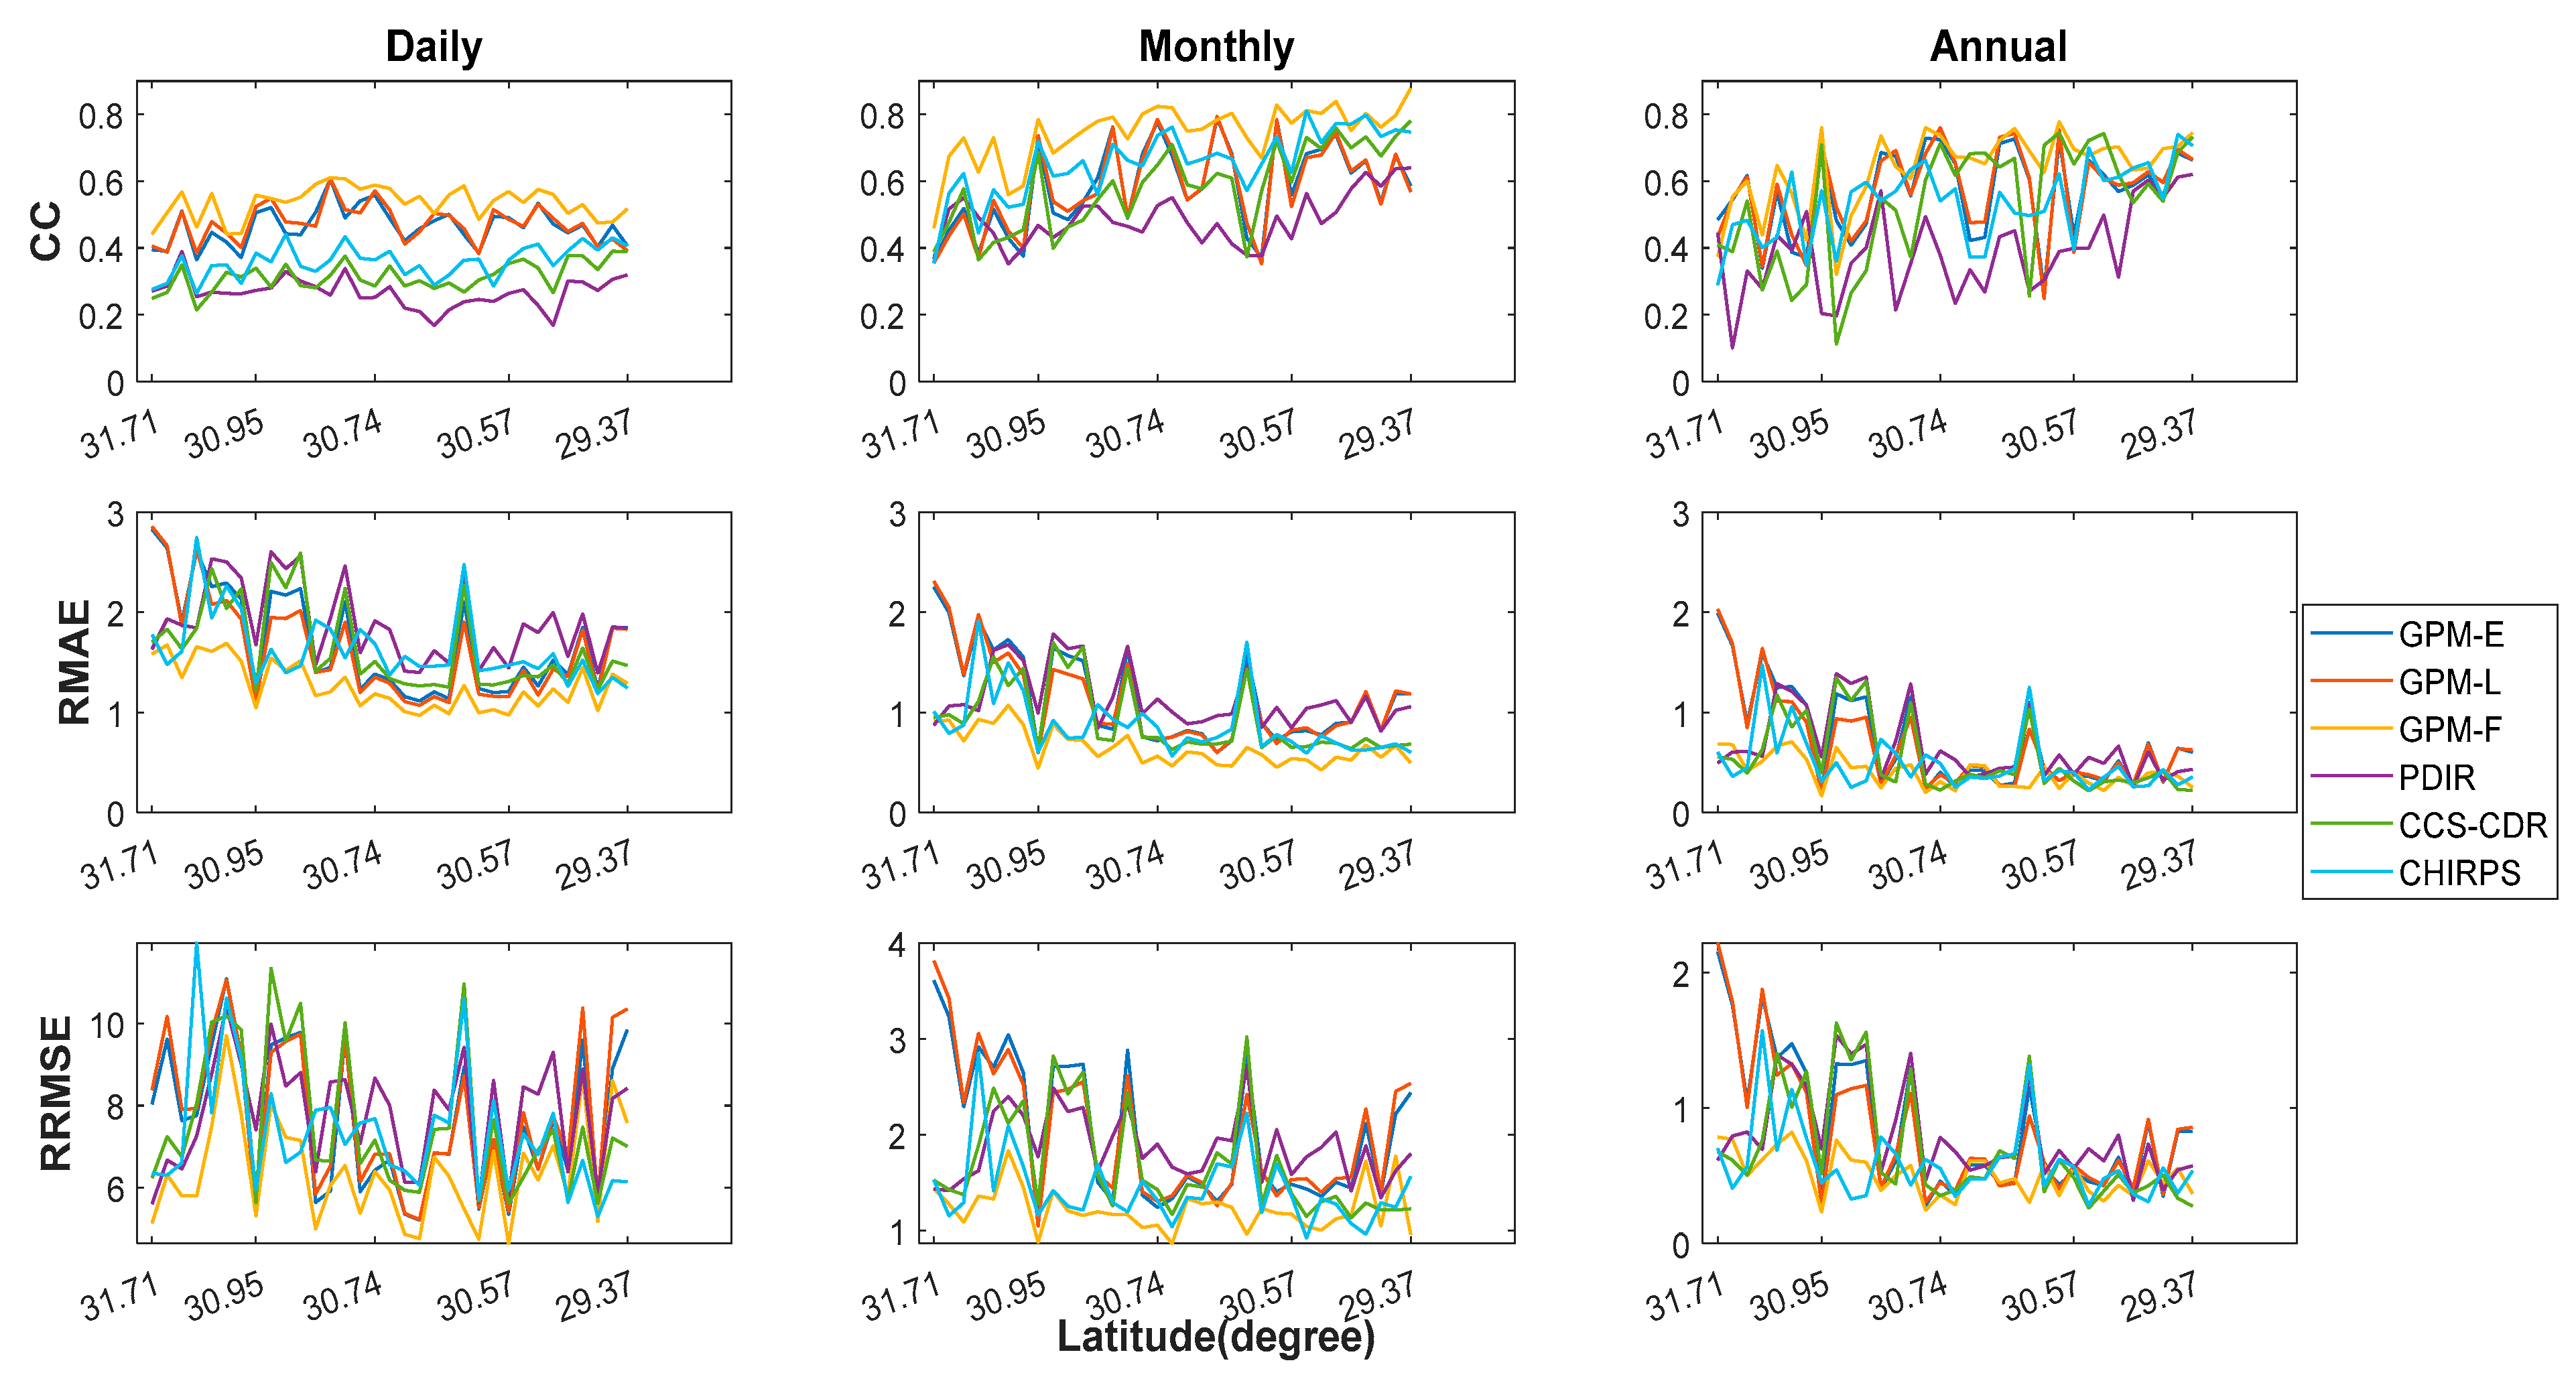
Figure 7 shows the continuous statistical indices as a function of latitude. The correlation increased from north to south at monthly and annual scales, while at the daily scale, the trend was not easily visible. The RMAE and RRMSE showed the same variation with a much greater amplification of the RRMSE index, due to influence by outliers. For stations located in the extreme south (above 30.62), the RMAE and RRMSE were lower, especially at the monthly and annual scales. However, for the other stations (below 30.61), we noticed a very large variation of these two metrics. These were also influenced by the orographic effect. In Figure 7, we notice two peaks for each plot of RMAE and RRMSE. These peaks correspond to the stations Tahrbilte and Imdghar N’Izdar, whose altitudes are 1226 m and 1502 m, respectively. The altitude might be the reason for the large errors recorded in these two stations.
4.1.2. Ability of the Satellite Products to Detect Different Precipitation Intensities
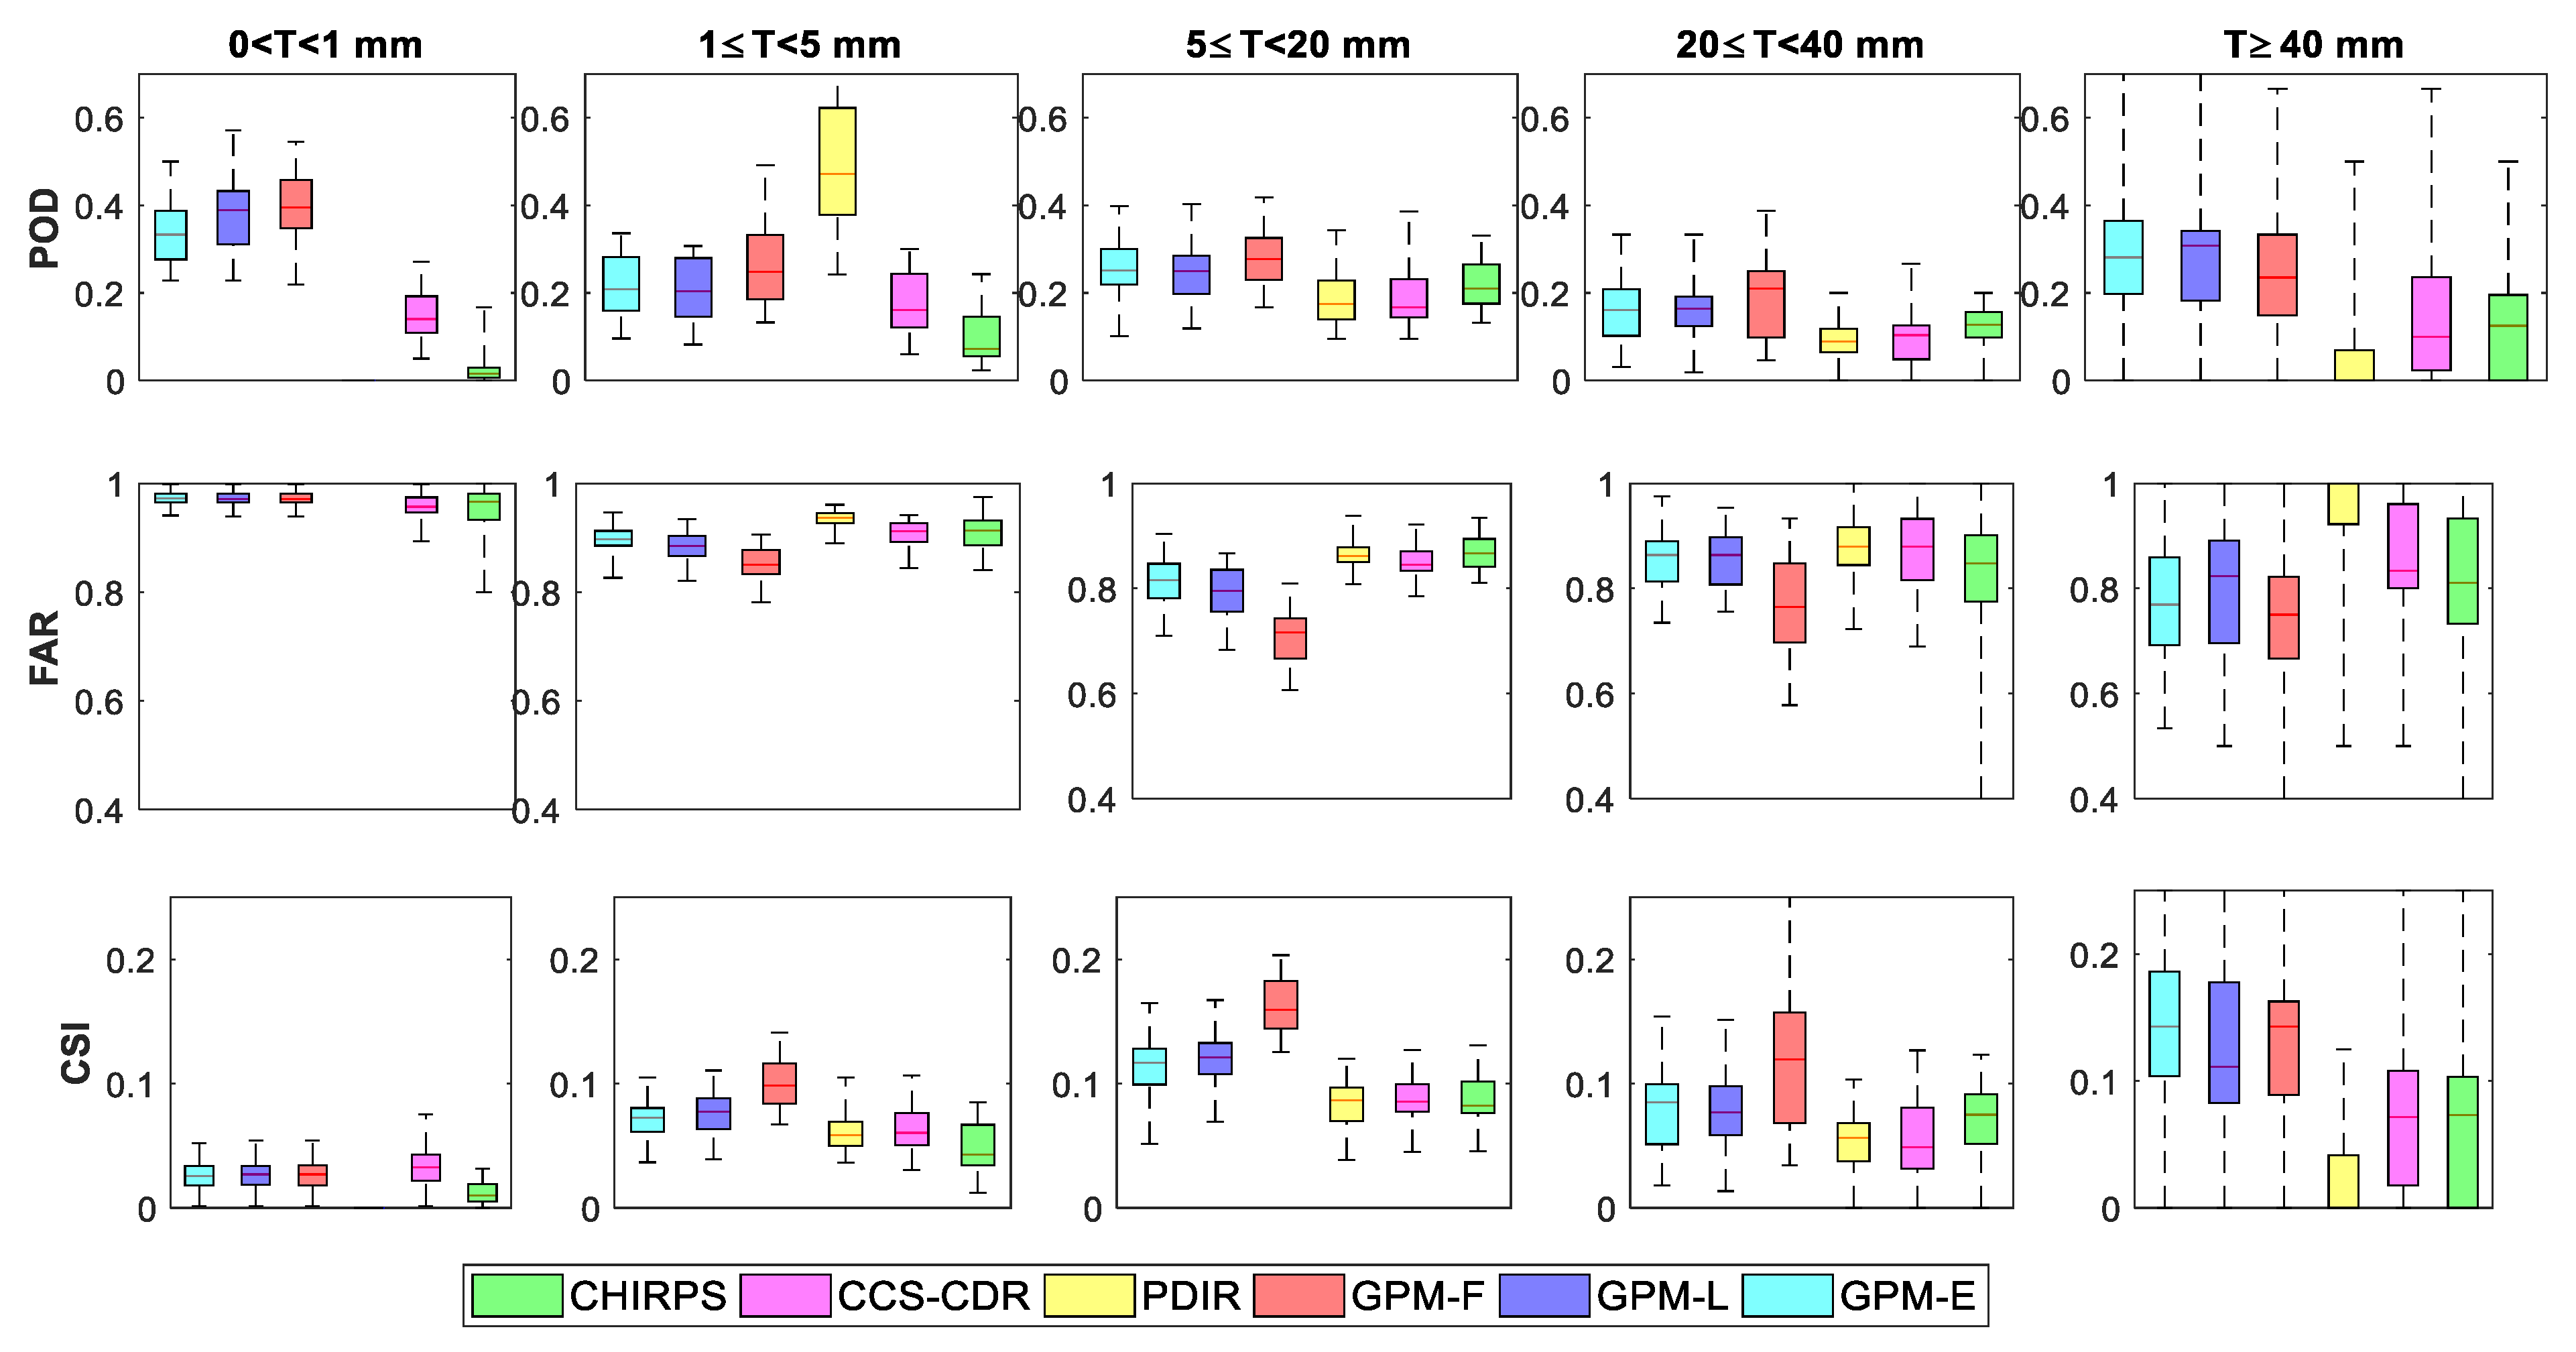
The categorical metrics for the five intensity classes were studied for the six satellite products. The results showed that all products gave a low probability of detection, which did not exceed 0.4 in median for almost all products and the adopted intensities (Figure 8). The three GPM products had a higher POD compared to the other products. The GPM-F product performed better for intensities below 40 mm/d. The two GPM-L and GPM-E products outperformed, respectively, the GPM-F product for daily amounts above or equal to 40 mm/d. The CCS-CDR and CHIRPS products showed closer results, with the CCS-CDR product performing better for intensities below 5 mm/day and the CHIRPS product performing much better for intensities above 5 mm/day. The PDIR product was the least performing for the majority of intensity classes, except for the class between 1 and 5 mm/d, where it outperformed all the other products with a median of 0.47. This product did not detect intensities between 0 and 1 mm/d, or intensities greater than or equal to 40 mm/d, where the median over all events was almost equal to 0. This was clearly demonstrated by the CSI results, which also incorporated the false alarms detected by the satellite product. The GPM-F product was the best performer and the PDIR product was the worst in terms of performance. The false alarm ratio (FAR) showed that all products had a high false alarm rate, especially for low intensities (<5 mm/d). The GPM-F product always showed the best results, followed by the other two near real-time GPM products. The CCS-CDR and CHIRPS products showed similar results for low intensities, which improved much more when moving to high intensities for the CHIRPS product.
4.2. Evaluation at the Basins Scale
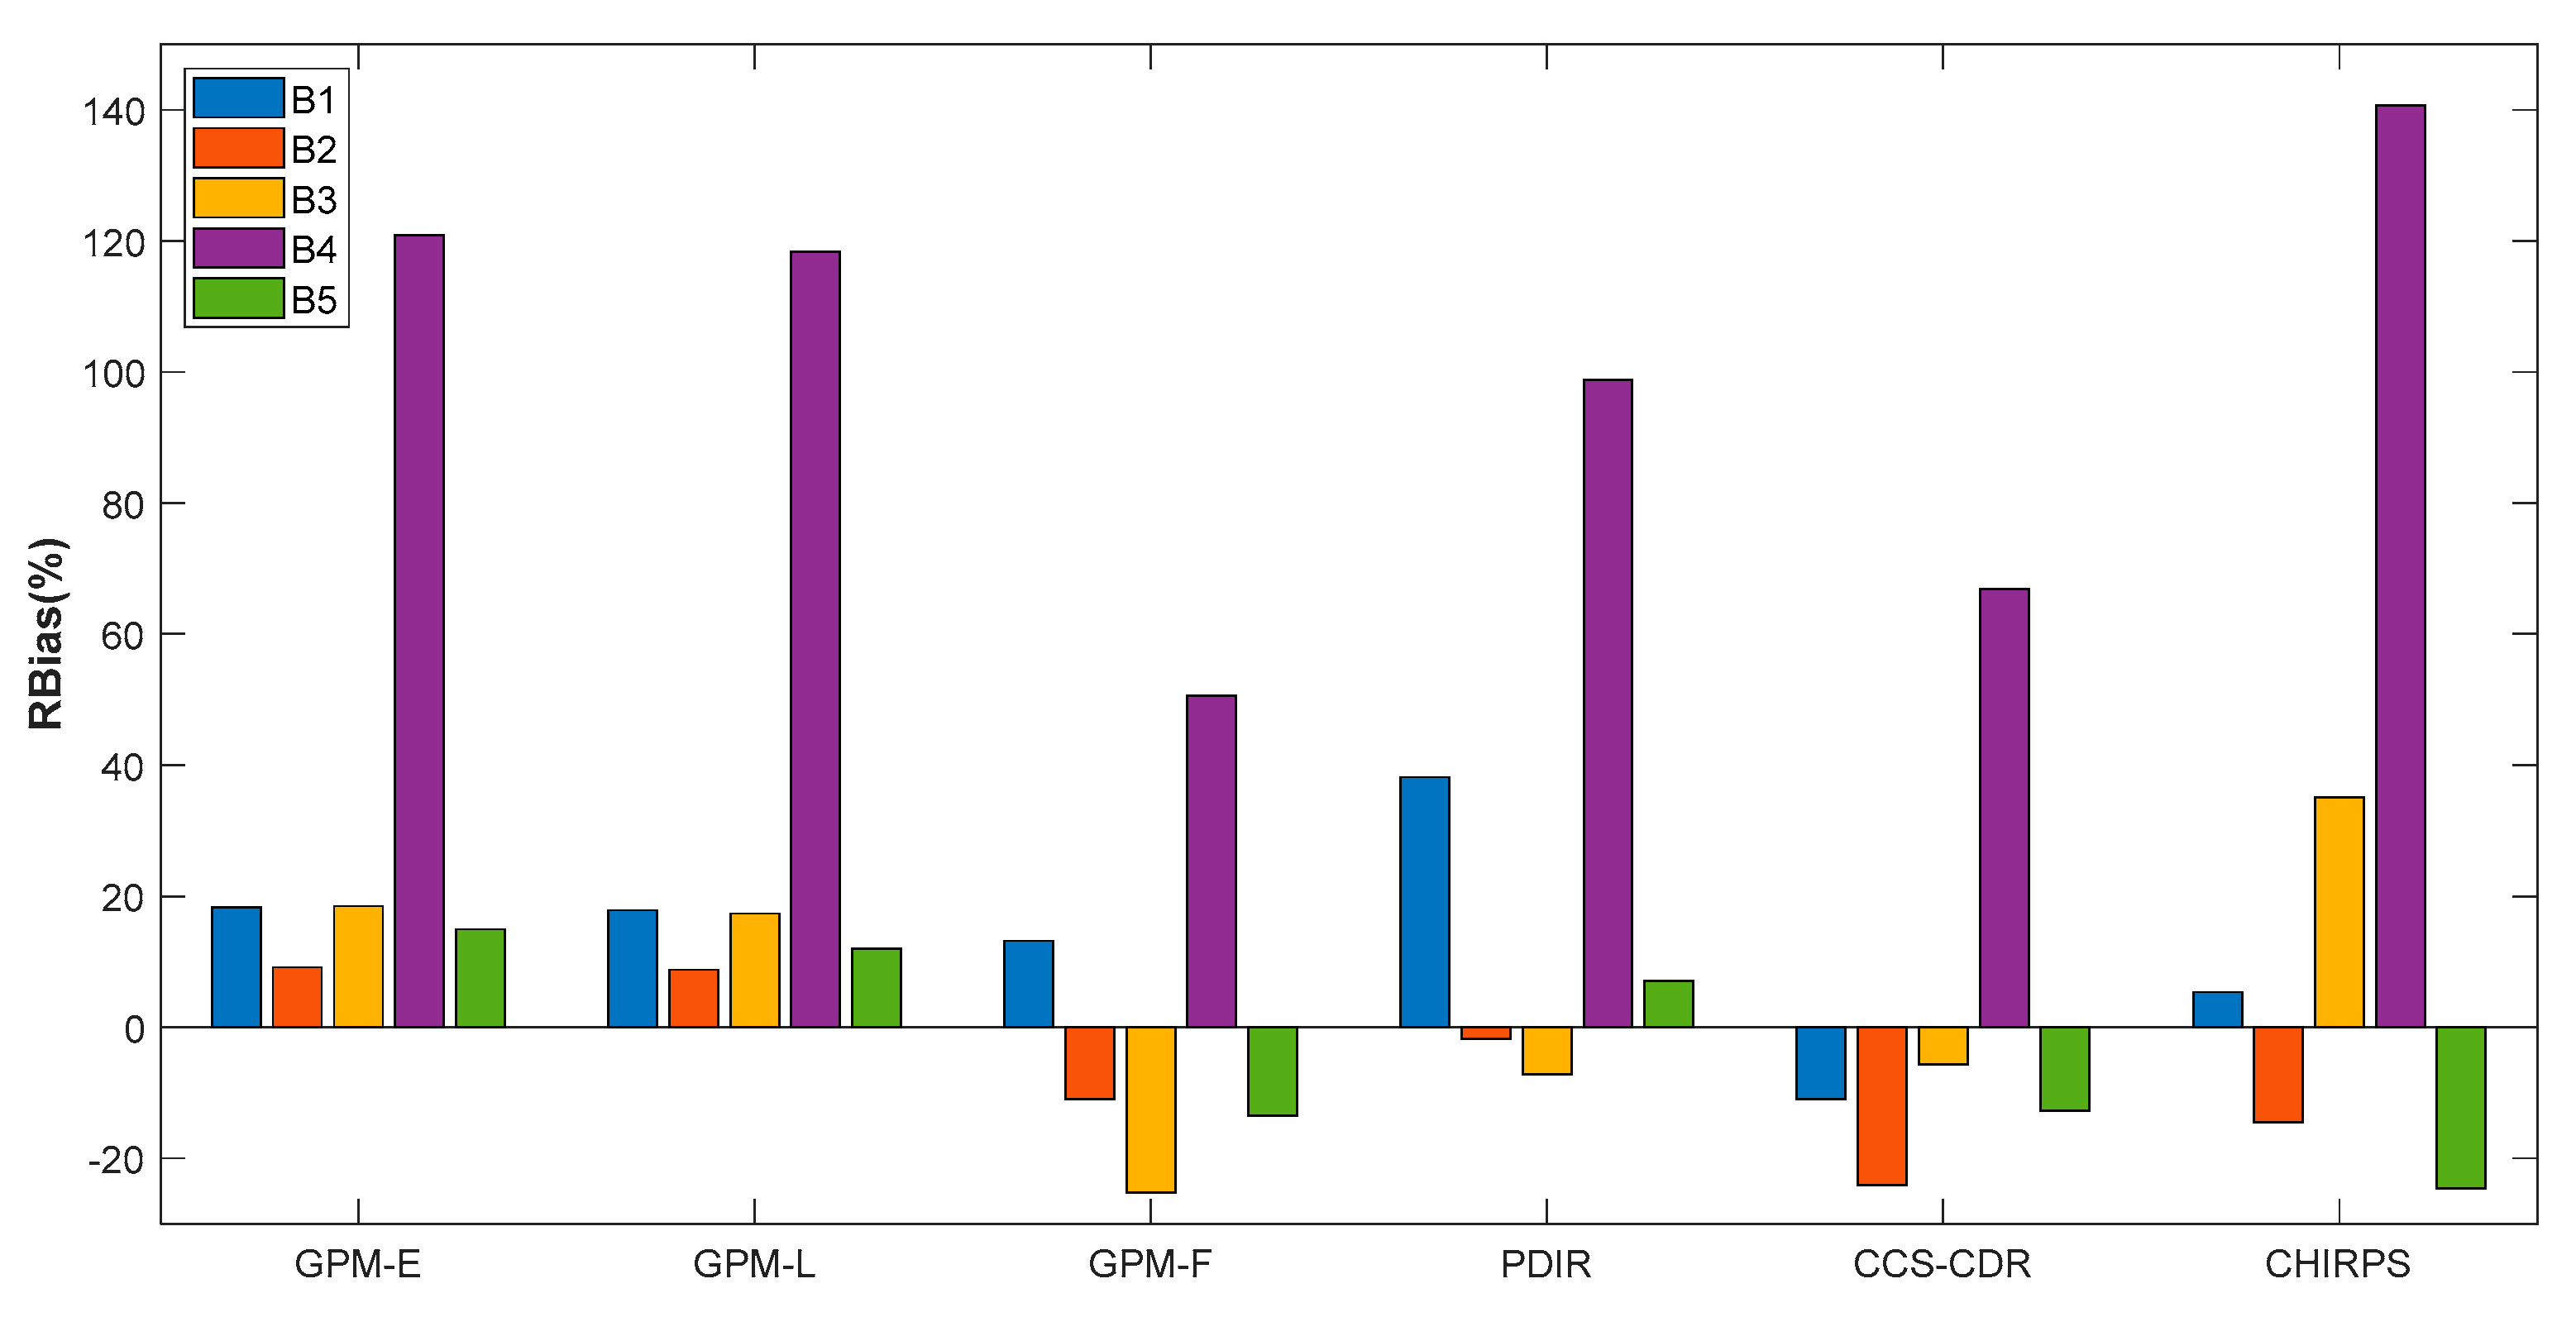
The evaluation was also carried out at the scale of five basins, selected according to their aridity and distance from the ocean. Figure 9 shows the relative bias between satellite and observed data over the entire study period. The two products, GPM-E and GPM-L, overestimated precipitation for all basins. The other products performed differently from one basin to another. Basin 4 recorded the largest bias regardless of the product. The CHIRPS product was strongly biased for this basin, followed by the two products, GPM-E and GPM-L, which showed almost similar bias and, then, the PDIR, CCS-CDR and GPM-F, respectively. The other basins showed smaller bias, ranging from −25% to 38%. Overall, the GPM-F and CCS-CDR products showed the best performance across all basins.
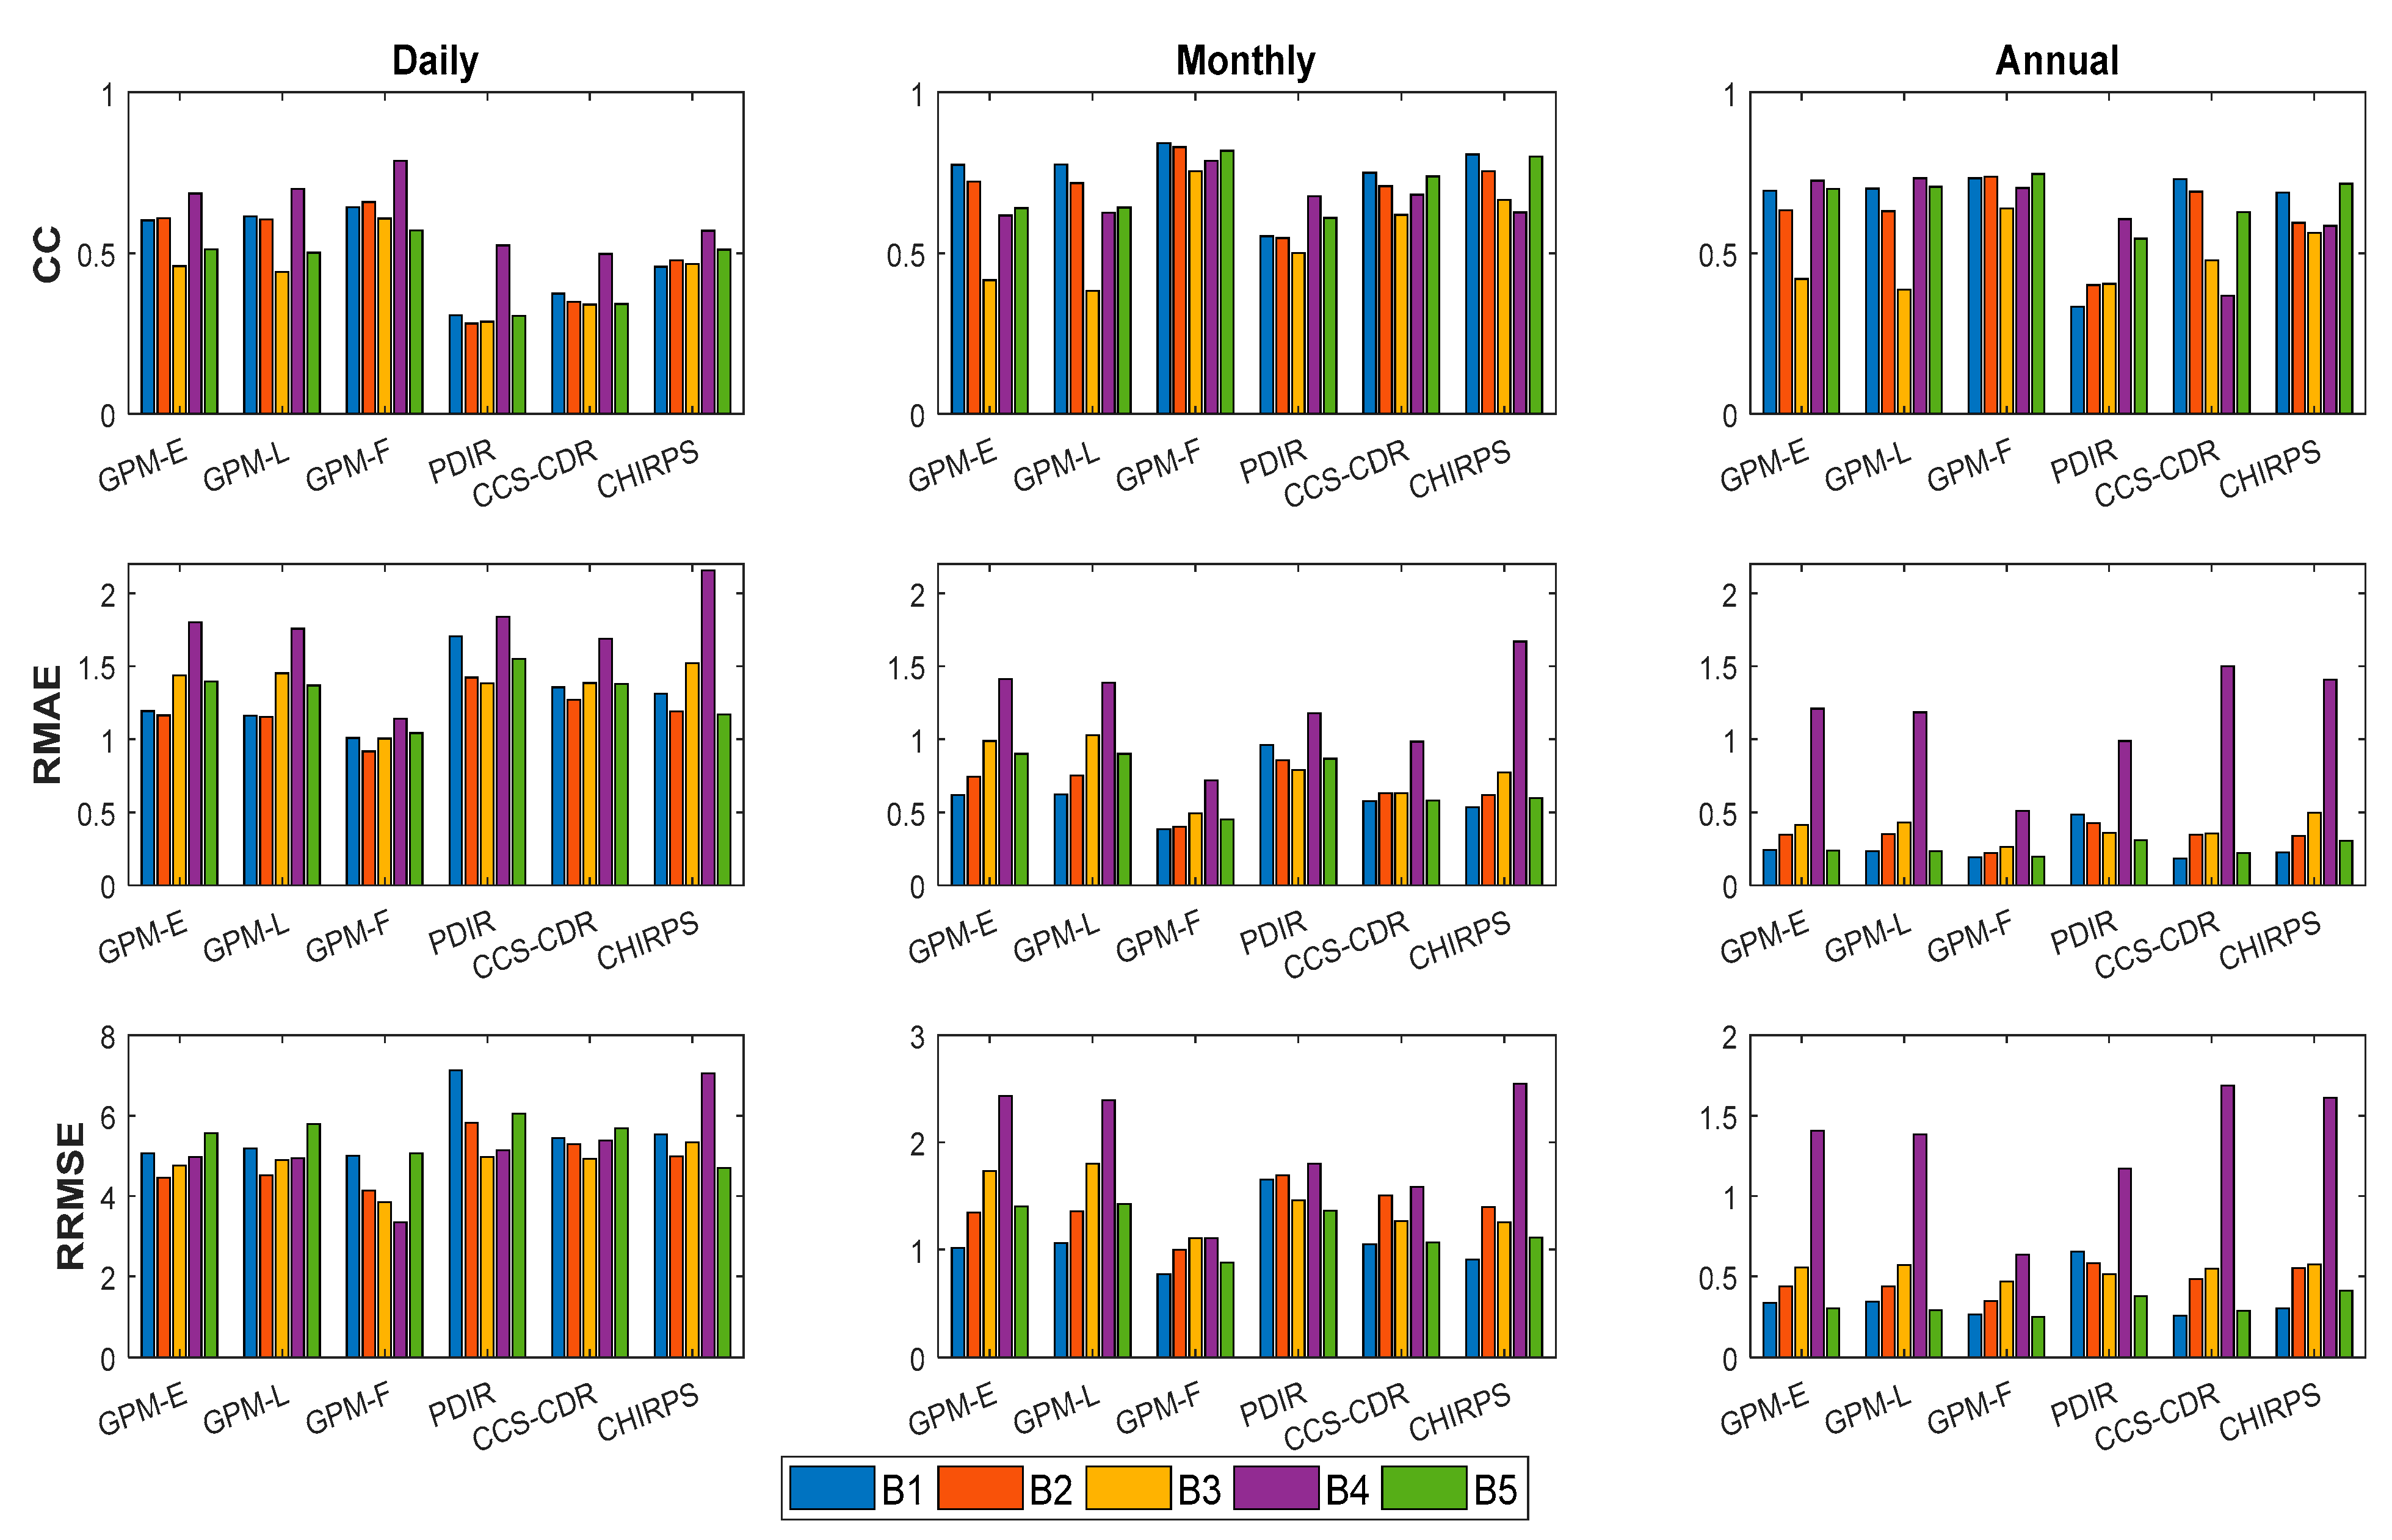
The results of CC, RMAE and RRMSE for each basin (Figure 10), showed that at the daily scale, the GPM products exhibited higher correlation coefficients than the other products for all the five basins. The GPM-F product performed well, with CC ranging from 0.57 (basin 5) to 0.787 (basin 4). Indeed, basin 4 was the most correlated with the observed data for all products at the daily scale, but it showed a higher RMAE as well. The correlation was improved much more at the monthly scale than at the annual scale. At the monthly scale, the GPM-F product was the most correlated with the observed data for all basins (correlation coefficients from 0.75 to 0.84), followed by the CHIRPS (0.62–0.80) and CCS-CDR (0.61–0.75), then the two products, GPM-E and GPM-L, which showed very close results (0.38–0.77). The PDIR product was the least correlated with observations (0.5–0.6) compared to the other products, with the exception of basin 3, for which it had a higher correlation coefficient than that obtained by GPM near real-time (GPM-E and GPM-L). At the annual scale, the correlations decreased for the CHIRPS and CCS-CDR products. They showed results closer to GPM-E for the majority of the areas. The PDIR product was, once again, the least performing at this scale for almost all the basins. The results in basin 4 showed the highest bias, especially at the annual and monthly scales. Despite good correlation coefficients (at the daily time step), it showed the highest RMAE and RRMSE for all the products used. The other basins were more or less close to each other in terms of performances. Basin 3 also presented a lower performance, showing weaker correlations at all temporal scales and for the majority of products, as well as a more noticeable bias at the monthly scale, especially for the GPM products.
5. Discussion
In this study, the evaluation of the six SPPs was based on continuous statistical indices to quantitatively evaluate these products, as well as categorical indices that were used to determine their detection capabilities. The evaluation was carried out on three temporal scales, daily, monthly and annually, as well as at two spatial scales, at the scale of the pixel located above the rain-gauge and at the scale of five different basins, by comparing the mean precipitation of the rain gauges located in each basin with the average of the satellite pixels that covered the basin.
- At the pixel scale
We used 33 rain gauges to evaluate the different satellite products in this study covering the time period from 2000 to 2020. The results showed that the corrected products with observed data had the lowest bias (Figure 2), compared to the near-real-time products. The lowest correlations with observed data were obtained at the daily scale (Figure 3), which were improved (for all products) at the monthly scale. The decrease in performance for the annual scale was possibly due to the number of observations, which corresponded to just 20 observations, compared to 240 observations for the monthly scale, in the context of strong inter-annual variability. The GPM-F product was the best performing product at all time scales, and other studies have also found that the GPM-F product performs well compared to other products. Over Saudi Arabia, Mahmoud et al. (2018) [78] and Mahmoud et al. (2020) [79] evaluated the three versions of the IMERG product and also found that the GPM-F was the most accurate over the country and could, therefore, be used as a complement to ground-based measurements. Over Iran, Keikhosravi-Kiany et al. (2022) [80] evaluated four products and found that the GPM IMERG and TRMM outperformed Chirps in estimating precipitation amounts. Similar results with GPM-F were found in China, Malaysia and Pakistan and [3,81,82]. In the present study, this product showed the highest correlations, as well as the lowest values of RMAE and RRMSE, for all the time scales. Moreover, the other two GPM products even exceeded the corrected products on a daily basis. However, at the monthly and annual scales, the corrected products (CHIRPS and CCS-CDR) improved their performance and ranked second, after the GPM-F product. The PDIR showed the lowest performances at all scales, followed by the GPM-E and GPM-L products at the annual and monthly scales. The two products, GPM-E and GPM-L, showed very similar results, with these results being similar to [3].
To understand the effect of the topography, the continentality and the aridity on the performance of the satellite products, different statistical indices were calculated according to these three factors. The evolution according to the altitudes (Figure 4 and Figure 5) showed that the relative bias increased strongly towards the higher altitudes. However, stations with low altitudes that were located close to the ocean (Figure S1), moderately overestimated the observed precipitation. This area has complex weather conditions, influenced, in particular, by seasonal frontal systems causing rainfall. For the middle altitudes, the products showed varied behavior but, generally, they exhibited a moderate underestimation. In contrast, the stations located in the high altitudes showed a strong overestimation, more specifically for the uncorrected products. The large overestimation observed in these regions might have been due to several factors, the sub-cloud evaporation being one of them, i.e., in arid regions where the atmosphere is very warm, precipitation may be evaporated before reaching the surface, thus leading to an overestimation by satellite [83]. The presence of cold clouds may contribute to an overestimation of precipitation by products [19], since the algorithms to estimate precipitation from space are based primarily on the temperature at the top of the cloud. The Cold Cloud Duration (CCD), i.e., the length of time a pixel remains below a given threshold, is assumed to be linearly related to the occurrence of rain [84]. However, some cold clouds can be non-rainy, like cirrus clouds. The presence of snow at high altitudes may be another factor, either contributing to the clogging of the rain gauges, and, therefore, underestimation of the observed rainfall, or a misidentification of snow as rain, since they have a similar microwave signature [85]. This is consistent with the findings of [86] for medium and high altitudes over Morocco. On the other hand, the results of [25] over Italy, found that satellite data underestimated the ground measurements of precipitation, and that there was higher underestimation in high-elevation areas. The trends of RMAE and RRMSE also showed an increase from low to high altitudes (Figure 5) at all scales. The correlation also decreased, especially at monthly and annual scales. According to [87], over a watershed in the north of Morocco, and [78], similar results were found regarding the increase of bias and decrease of correlation towards higher altitudes.
Regarding the evaluation by latitude, the correlation exhibited a tendency to increase towards the most arid areas for both monthly and annual scales. The error (Bias, RMAE and RRMSE) also decreased when moving towards these areas (Figure 6 and Figure 7), which showed that these products performed well in arid regions in detecting rainy events. Several studies have shown that some products perform better during the dry season than the rainy season in terms of bias, e.g., [88]. This may be due to the presence of intense, and especially irregular rainfall concentrated in this period [88]. It may also be due to the presence of snow in the northern part with high altitudes, and the performance of these products decreases in the presence of snow, as mentioned before.
The detection capacity was calculated using three detection indices (POD, FAR and CSI) by adopting a threshold of 1 mm/day, and according to altitude, longitude and latitude. The results are presented in supplementary material (Figures S3–S5). The PDIR product outperformed the other products in terms of detection probability, which was not expected; especially as it was the least performing product for other metrics. To better understand these results and distinguish the origin of this improvement, we adopted different intensity classes (Figure 8). The results demonstrated that all these products had a low detection capacity in the adopted intervals. POD and CSI did not exceed 0.4 in median, and the false alarm ratios were very high, and could reach up to 1 in median. This was the case for PDIR at an intensity ≥ 40 mm/d. The high FAR values for all intensities might have mainly been due to the sub-cloud evaporation present in these sub-arid regions. Similar results were found by [89] regarding the false alarm ratio in an arid climate (United Arab Emirates), and by [90] across the complex topographical and climatic gradients of Chile, where their results showed that the majority of the evaluated products exhibited poor performance at event detection, as well as having very high false alarm ratios in different intensity intervals. The GPM products were the best performing, especially the GPM-F product for almost all classes lower than 40 mm/day and the other GPM products (GPM-L and GPM-E) for extreme intensities (≥ 40 mm/day), while the PDIR product showed the lowest results. The relative bias was calculated for each precipitation intensity (Figure S6), and the results showed that all these products strongly overestimated low intensities, and they underestimated in other intervals of high intensities, especially for intensities ≥ 40 mm/d. The two GPM near real-time products performed better in this interval. Similar results were found by [81], when comparing 3 satellite products over Malaysia, who found that all SPPs underestimated extreme (>50 mm/day) precipitation classes, but overestimated moderate to heavy (1–50 mm/day) precipitation events. This overestimation of low intensities and underestimation of high intensities was also reported in the study of [89] over the United Arab Emirates, and may be due to sub-cloud evaporation for low intensities, and the low frequency of high intensities in a semi-arid/arid context, where underestimation or non-detection of a single event can be responsible for very large error. This study agreed with previous studies [90,91] and emphasized the importance of using different thresholds or intensity classes to evaluate satellite products, rather than just one threshold to determine the occurrence of precipitation.
- At the basin scale
Overall, at the basin scale, the products showed similar performances to those obtained at the pixel level. The GPM-F product consistently performed best for all the five basins. The PDIR product exhibited the poorest performance. At the daily scale, the GPM products performed better than the other products, although the performance of its early version was reduced at the monthly scale, where CHIRPS and CCS-CDR ranked after the GPM-F product. At the annual scale, the GPM-E and GPM-L products showed very close results to CHIRPS and CCS-CDR for the majority of basins. Basin 4 showed the highest bias for all products (Figure 9), while the other basins showed a lower bias that varied from one product to another, between −25.26% and 38.18%. Overall, basins 3 and 4 exhibited the lowest results; basin 3 in terms of correlation and basin 4 in terms of bias. These two basins are mountainous watersheds, with the highest altitudes (Figure 1).
The detection capability was also calculated for the five basins. The results showed that for a threshold of 1 mm/d (Figure S7), which determined rain/no rain days, the three GPM products showed similar results with POD between 0.42 and 0.8, which confirmed their already shown good performances at the daily scale. The GPM-F product also exhibited the lowest FAR, as well as the highest CSI coefficients, for all basins. By using the five different intensity classes (Figures S8–S10), the GPM-F product performed better for intensities below 40 mm/d. For intensities ≥ 40 mm/d, the other GPM products outperformed it for basin 4, in which they recorded a very high POD and CSI, which reached 1.
In comparison with the results obtained at the pixel scale, the correlation coefficients were improved at the daily scale for all the products. They varied between 0.28 and 0.79 at the basin scale, while at the pixel scale they varied between 0.26 and 0.55. At the monthly scale, the correlation coefficients ranged between 0.38 and 0.84 for the basins, and between 0.47 and 0.76 at the pixel scale. For the annual scale, they varied between 0.33–0.75 at the basin scale and between 0.39–0.67 at the pixel scale. The detection probability was also improved at the basin scale; it surpassed that obtained at the pixel scale for all thresholds, as well as for the selected products, especially the GPM-F product. Its detection probabilities reached 0.79, 0.58, 0.47 and 0.44 for the thresholds 0–1, 1–5, 5–20 and 20–40 mm/d, respectively. For the threshold ≥40 mm/d, the other near real-time GPM products performed better, especially for basin 4.
6. Conclusions and Perspectives
In this study, we evaluated six satellite precipitation products with a high spatial and temporal resolution, i.e., GPM-F, CHIRPS, CCS-CDR, GPM-L, GPM-E and PDIR-Now. These products were evaluated against ground-based datasets in sub-Saharan Morocco for the period from September 2000 to August 2020. Temporally, the analysis was performed at daily, monthly and annual scales, and spatially at both basin and pixel scales. Several quantitative and qualitative statistical indices were used and the SPPs performances were evaluated according to the altitude, latitude and the continentality of the rain-gauge. The main findings of the study were that the GPM-F product showed the most satisfactory results for all time scales and for both spatial scales, followed by the CHIRPS and CCS-CDR products at the monthly and annual scales, and by the GPM-E and GPM-L products at the daily scale. The PDIR product exhibited the poorest performance. Spatially, all products had a lower performance at high altitudes; the bias increased, and the correlation decreased at higher altitudes. The evaluation, according to the latitudes, i.e., from north to south, showed an increase of correlation and decrease of bias towards the most arid zones of the region. Furthermore, the GPM products performed well in terms of detection capacity for both spatial scales. The best performing product, for almost all intensities below 40 mm per day, was the GPM-F. The other products, GPM-L and GPM-E, had better skills for higher intensities (≥40 mm/d). Compared to oceanic basins, the continental and mountainous basins showed the lowest results in terms of correlation and bias. The other basins presented very similar results, according to the rainfall product considered. At the daily scale, the SPPs performed better at the regional scale (basin) than at the pixel scale, especially in terms of correlation and detection probability.
In summary, the geographical position and the topography clearly affected the performance of the satellite precipitation products to reproduce rainfall patterns. The results suggest they are appropriate for these arid environments, especially the GPM-F product that could be used for water resources management and GPM-E for near real-time flood warnings. The statistical results obtained on a daily scale for different basins are very encouraging for the use of these products in hydrological studies, notably for rainfall–runoff modeling. To this end, we strongly recommend investigating and studying these new data sources for the different natural hazards linked to precipitation, such as floods, droughts, and landslides, especially in regions where the observed network is highly dispersed and based only on a daily time series, such as in the study region.
Supplementary Materials
The following supporting information can be downloaded at: https://www.mdpi.com/article/10.3390/w14203336/s1, Figure S1: The relative bias of the satellite estimates according to the rain-gauge longitudes; Figure S2: Continuous metrics according to longitudes for the daily, monthly and annual scales; Figure S3: Categorical indices according to the rain-gauge altitudes, for a threshold of 1 mm/d; Figure S4: Categorical indices according to the rain-gauge longitudes, for a threshold of 1 mm/d; Figure S5: Categorical indices according to the rain-gauge latitudes, for a threshold of 1 mm/d; Figure S6: Median of the relative bias over all rain-gauge stations for each intensity class; Figure S7: Categorical metrics for each product at the basin scale, for a threshold of 1 mm/d; Figure S8: The probability of detection (POD) for each product and for the five intensity classes at the basin scale; Figure S9: The false alarm ratio (FAR) for each product and for the five intensity classes at the basin scale; Figure S10: The critical success index (CSI) for each product and for the five intensity classes at the basin scale.
Author Contributions
Conceptualization, M.R., E.M.E.K., M.E.S. and Y.T.; methodology, M.R., E.M.E.K., M.E.S. and Y.T.; writing—original draft preparation, M.R., E.M.E.K. and M.E.S.; writing—review and editing, M.R., E.M.E.K., M.E.S., M.N., A.A. and Y.T. All authors have read and agreed to the published version of the manuscript.
Funding
This research received no external funding.
Data Availability Statement
All relevant data are included in the paper or its Supplementary Materials.
Acknowledgments
The authors express their gratitude to the Hydraulic Basin Agency of Souss Massa and the Hydraulic Basin Agency of Draa Oued Noun for providing the observed data required for this study.
Conflicts of Interest
The authors declare no conflict of interest.
References
- Camici, S.; Ciabatta, L.; Massari, C.; Brocca, L. How Reliable Are Satellite Precipitation Estimates for Driving Hydrological Models: A Verification Study over the Mediterranean Area. J. Hydrol. 2018, 563, 950–961. [Google Scholar] [CrossRef]
- Camici, S.; Massari, C.; Ciabatta, L.; Marchesini, I.; Brocca, L. Which Rainfall Score Is More Informative about the Performance in River Discharge Simulation? A Comprehensive Assessment on 1318 Basins over Europe. Hydrol. Earth Syst. Sci. 2020, 24, 4869–4885. [Google Scholar] [CrossRef]
- Shen, Z.; Yong, B.; Yi, L.; Wu, H.; Xu, H. From TRMM to GPM, How Do Improvements of Post/near-Real-Time Satellite Precipitation Estimates Manifest. Atmos. Res. 2022, 268, 106029. [Google Scholar] [CrossRef]
- Kidd, C.; Huffman, G. Global Precipitation Measurement. Meteorol. Appl. 2011, 18, 334–353. [Google Scholar] [CrossRef]
- Li, Z.; Yang, D.; Hong, Y. Multi-Scale Evaluation of High-Resolution Multi-Sensor Blended Global Precipitation Products over the Yangtze River. J. Hydrol. 2013, 500, 157–169. [Google Scholar] [CrossRef]
- Chiaravalloti, F.; Brocca, L.; Procopio, A.; Massari, C.; Gabriele, S. Assessment of GPM and SM2RAIN-ASCAT Rainfall Products over Complex Terrain in Southern Italy. Atmos. Res. 2018, 206, 64–74. [Google Scholar] [CrossRef]
- WMO (World Meteorological Organization). Guide to Hydrological Practice: WMO-No. 168; WMO: Geneva, Switzerland, 2008; Volume I, ISBN 9789263101686. [Google Scholar]
- Salio, P.; Paula, M.; García, Y.; Vila, D. Evaluation of High-Resolution Satellite Precipitation Estimates over Southern South America Using a Dense Rain Gauge Network. Atmos. Res. 2015, 163, 146–161. [Google Scholar] [CrossRef]
- Liu, Z.; Wang, H.; Huang, J.; Zhuo, L. Data Mining of Remotely-Sensed Rainfall for a Large-Scale Rain Gauge Network Design. IEEE J. Sel. Top. Appl. Earth Obs. Remote Sens. 2021, 14, 12300–12311. [Google Scholar] [CrossRef]
- Cantoni, E.; Tramblay, Y.; Grimaldi, S.; Salamon, P.; Dakhlaoui, H.; Dezetter, A.; Thiemig, V. Hydrological Performance of the ERA5 Reanalysis for Flood Modeling in Tunisia with the LISFLOOD and GR4J Models. J. Hydrol. Reg. Stud. 2022, 42, 101169. [Google Scholar] [CrossRef]
- Huffman, G.J.; Adler, R.; Bolvin, D.; Nelkin, E. The TRMM Multi-Satellite Precipitation Analysis (TMPA). In Satellite Rainfall Applications for Surface Hydrology; Springer: Dordrecht, The Netherlands, 2010; pp. 3–22. [Google Scholar] [CrossRef]
- Kubota, T.; Hashizume, H.; Shige, S.; Okamoto, K.; Aonashi, K.; Takahashi, N.; Ushio, T.; Kachi, M. Global Precipitation Map Using Satelliteborne Microwave Radiometers by the GSMaP Project: Production and Validation. In Proceedings of the 2006 IEEE International Symposium on Geoscience and Remote Sensing, Denver, CO, USA, 31 July–4 August 2006; Volume 45, pp. 2584–2587. [Google Scholar] [CrossRef]
- Sorooshian, S.; Hsu, K.L.; Gao, X.; Gupta, H.V.; Imam, B.; Braithwaite, D. Evaluation of PERSIANN System Satellite-Based Estimates of Tropical Rainfall. Bull. Am. Meteorol. Soc. 2000, 81, 2035–2046. [Google Scholar] [CrossRef]
- Funk, C.; Peterson, P.; Landsfeld, M.; Pedreros, D.; Verdin, J.; Shukla, S.; Husak, G.; Rowland, J.; Harrison, L.; Hoell, A.; et al. The Climate Hazards Infrared Precipitation with Stations—A New Environmental Record for Monitoring Extremes. Sci. Data 2015, 2, 150066. [Google Scholar] [CrossRef] [PubMed] [Green Version]
- Huffman, G.J.; Bolvin, D.T.; Braithwaite, D.; Hsu, K.L.; Joyce, R.J.; Kidd, C.; Nelkin, E.J.; Sorooshian, S.; Stocker, E.F.; Tan, J.; et al. Integrated Multi-Satellite Retrievals for the Global Precipitation Measurement (GPM) Mission (IMERG). Adv. Glob. Chang. Res. 2020, 67, 343–353. [Google Scholar] [CrossRef]
- Kabite Wedajo, G.; Kebede Muleta, M.; Gessesse Awoke, B. Performance Evaluation of Multiple Satellite Rainfall Products for Dhidhessa River Basin (DRB), Ethiopia. Atmos. Meas. Tech. 2021, 14, 2299–2316. [Google Scholar] [CrossRef]
- Roushdi, M. Spatio-Temporal Assessment of Satellite Estimates and Gauge-Based Rainfall Products in Northern Part of Egypt. Clim. Artic. 2022, 10, 134. [Google Scholar] [CrossRef]
- Chen, H.; Yong, B.; Kirstetter, P.E.; Wang, L.; Hong, Y. Global Component Analysis of Errors in Three Satellite-Only Global Precipitation Estimates. Hydrol. Earth Syst. Sci. 2021, 25, 3087–3104. [Google Scholar] [CrossRef]
- Hussain, Y.; Satgé, F.; Hussain, M.B.; Martinez-Carvajal, H.; Bonnet, M.P.; Cárdenas-Soto, M.; Roig, H.L.; Akhter, G. Performance of CMORPH, TMPA, and PERSIANN Rainfall Datasets over Plain, Mountainous, and Glacial Regions of Pakistan. Theor. Appl. Climatol. 2017, 131, 1119–1132. [Google Scholar] [CrossRef]
- Mashingia, F.; Mtalo, F.; Bruen, M. Validation of Remotely Sensed Rainfall over Major Climatic Regions in Northeast Tanzania. Phys. Chem. Earth 2014, 67–69, 55–63. [Google Scholar] [CrossRef]
- Tramblay, Y.; Thiemig, V.; Dezetter, A.; Hanich, L. Evaluation of Satellite-Based Rainfall Products for Hydrological Modelling in Morocco. Hydrol. Sci. J. 2016, 61, 2509–2519. [Google Scholar] [CrossRef]
- Fenta, A.A.; Yasuda, H.; Shimizu, K.; Ibaraki, Y.; Haregeweyn, N.; Kawai, T.; Belay, A.S.; Sultan, D.; Ebabu, K. Evaluation of Satellite Rainfall Estimates over the Lake Tana Basin at the Source Region of the Blue Nile River. Atmos. Res. 2018, 212, 43–53. [Google Scholar] [CrossRef]
- Paredes-Trejo, F.; Barbosa, H.; dos Santos, C.A.C. Evaluation of the Performance of SM2RAIN-Derived Rainfall Products over Brazil. Remote Sens. 2019, 11, 1113. [Google Scholar] [CrossRef] [Green Version]
- Moura Ramos Filho, G.; Hugo Rabelo Coelho, V.; da Silva Freitas, E.; Xuan, Y.; Brocca, L.; das Neves Almeida, C. Regional-Scale Evaluation of 14 Satellite-Based Precipitation Products in Characterising Extreme Events and Delineating Rainfall Thresholds for Flood Hazards. Atmos. Res. 2022, 276, 106259. [Google Scholar] [CrossRef]
- Rossi, M.; Kirschbaum, D.; Valigi, D.; Mondini, A.C.; Guzzetti, F. Comparison of Satellite Rainfall Estimates and Rain Gauge Measurements in Italy, and Impact on Landslide Modeling. Climate 2017, 5, 90. [Google Scholar] [CrossRef] [Green Version]
- Alfieri, L.; Avanzi, F.; Delogu, F.; Gabellani, S.; Bruno, G.; Campo, L.; Libertino, A.; Massari, C.; Tarpanelli, A.; Rains, D.; et al. High-Resolution Satellite Products Improve Hydrological Modeling in Northern Italy. Hydrol. Earth Syst. Sci. 2022, 26, 3921–3939. [Google Scholar] [CrossRef]
- Guo, H.; Chen, S.; Bao, A.; Behrangi, A.; Hong, Y.; Ndayisaba, F.; Hu, J.; Stepanian, P.M. Early Assessment of Integrated Multi-Satellite Retrievals for Global Precipitation Measurement over China. Atmos. Res. 2016, 176–177, 121–133. [Google Scholar] [CrossRef]
- Liu, C.Y.; Aryastana, P.; Liu, G.R.; Huang, W.R. Assessment of Satellite Precipitation Product Estimates over Bali Island. Atmos. Res. 2020, 244, 105032. [Google Scholar] [CrossRef]
- Shayeghi, A.; Azizian, A.; Brocca, L. Reliability of Reanalysis and Remotely Sensed Precipitation Products for Hydrological Simulation over the Sefidrood River Basin, Iran. Hydrol. Sci. J. 2020, 65, 296–310. [Google Scholar] [CrossRef]
- Saddique, N.; Muzammil, M.; Jahangir, I.; Sarwar, A.; Ehtesham, A.; Ammar Aslam, R.; Christian, B. Hydrological Evaluation of 14 Satellite-Based, Gauge-Based and Reanalysis Precipitation Products in a Data-Scarce Mountainous Catchment. Hydrol. Sci. J. 2022, 67, 436–450. [Google Scholar] [CrossRef]
- Hadria, R.; Boudhar, A.; Ouatiki, H.; Lebrini, Y.; Elmansouri, L.; Gadouali, F.; Hayat Lionboui, H.L.; Benabdelouahab, T. Combining Use of TRMM and Ground Observations of Annual Precipitations for Meteorological Drought Trends Monitoring in Morocco. Am. J. Remote Sens. 2019, 7, 25. [Google Scholar] [CrossRef]
- Karmouda, N.; Kacimi, I.; ElKharrim, M.; Brirhet, H.; Hamidi, M. Geo-Statistical and Hydrological Assessment of Three Satellite Precipitation Products over Ouergha Basin (Northern Morocco). Arab. J. Geosci. 2022, 15, 235. [Google Scholar] [CrossRef]
- El Alaoui El Fels, A.; Saidi, M.E.; Alam, M.J. Bin Rainfall Frequency Analysis Using Assessed and Corrected Satellite Precipitation Products in Moroccan Arid Areas. The Case of Tensift Watershed. Earth Syst. Environ. 2022, 6, 391–404. [Google Scholar] [CrossRef]
- Saouabe, T.; El Khalki, E.M.; Saidi, M.E.M.; Najmi, A.; Hadri, A.; Rachidi, S.; Jadoud, M.; Tramblay, Y. Evaluation of the GPM-IMERG Precipitation Product for Flood Modeling in a Semi-Arid Mountainous Basin in Morocco. Water 2020, 12, 2516. [Google Scholar] [CrossRef]
- Ouaba, M.; El Khalki, E.M.; Saidi, M.E.; Alam, M.J. Bin Estimation of Flood Discharge in Ungauged Basin Using GPM-IMERG Satellite-Based Precipitation Dataset in a Moroccan Arid Zone. Earth Syst. Environ. 2022, 6, 541–556. [Google Scholar] [CrossRef]
- Milewski, A.; Elkadiri, R.; Durham, M. Assessment and Comparison of TMPA Satellite Precipitation Products in Varying Climatic and Topographic Regimes in Morocco. Remote Sens. 2015, 7, 5697–5717. [Google Scholar] [CrossRef] [Green Version]
- Salih, W.; Chehbouni, A.; Epule, T.E. Evaluation of the Performance of Multi-Source Satellite Products in Simulating Observed Precipitation over the Tensift Basin in Morocco. Remote Sens. 2022, 14, 1171. [Google Scholar] [CrossRef]
- Saidi, M.E. Genèse et Propagation Des Crues En Milieu Sub-Aride : Exemple de l’Oued Souss (Maroc) (Flood’s Genesis and Propagation in Sub-Arid Environment as Exemplified by Oued Souss (Morrocco)). Bull. Assoc. Geogr. Fr. 1994, 71, 94–111. [Google Scholar] [CrossRef]
- Oulghazi, A.; Ennassiri, B.; El-amrani, A. Crues Torrentielles de l’ Oued Aouerga Dans La Commune Ouled Dahhou: Mécanismes, Impact et Mesures d’ Aménagement (Maroc). J. Afr. Stud. Nile Basin 2022, 14, 289–306. [Google Scholar]
- Azedou, A.; Khattabi, A.; Lahssini, S. Characterizing Fluvial Geomorphological Change Using Google Earth Engine (GEE) to Support Sustainable Flood Management in the Rural Municipality of El Faid. Arab. J. Geosci. 2022, 15, 413. [Google Scholar] [CrossRef]
- Souss Massa Hydraulic Basin Agency (ABHSM). Etude de Modélisation de L’impact des Changements Climatiques sur les Ressources en Eau au Niveau du Bassin Hydraulique de Sous Massa; Unpublished internal document of ABHSM; ABHSM: Agadir, Morocco, 2019. [Google Scholar]
- Attar, O.; Brouziyne, Y.; Bouchaou, L.; Chehbouni, A. A Critical Review of Studies on Water Resources in the Souss-Massa Basin, Morocco: Envisioning a Water Research Agenda for Local Sustainable Development. Water 2022, 14, 1355. [Google Scholar] [CrossRef]
- Seif-Ennasr, M.; Zaaboul, R.; Hirich, A.; Caroletti, G.N.; Bouchaou, L.; El Morjani, Z.E.A.; Beraaouz, E.H.; McDonnell, R.A.; Choukr-Allah, R. Climate Change and Adaptive Water Management Measures in Chtouka Aït Baha Region (Morocco). Sci. Total Environ. 2016, 573, 862–875. [Google Scholar] [CrossRef]
- Bai, L.; Shi, C.; Li, L.; Yang, Y.; Wu, J. Accuracy of CHIRPS Satellite-Rainfall Products Over. Remote Sens. 2018, 10, 362. [Google Scholar] [CrossRef] [Green Version]
- Abahous, H.; Sifeddine, A.; Bouchaou, L.; Ronchail, J.; EL Morjani, Z.E.A.A.; Yassine, A.B.; Kenny, L. Inter-Annual Variability of Precipitation in the Souss Massa Region and Linkage of the North Atlantic Oscillation. J. Mater. Environ. Sci. 2017, 9, 2023–2031. [Google Scholar]
- Ait Brahim, Y.; Seif-Ennasr, M.; Malki, M.; N’da, B.; Choukrallah, R.; El Morjani, Z.E.A.; Sifeddine, A.; Abahous, H.; Bouchaou, L. Assessment of Climate and Land Use Changes: Impacts on Groundwater Resources in the Souss-Massa River Basin. In The Handbook of Environmental Chemistry; Springer: Cham, Switzerland, 2017; Volume 53, pp. 121–142. [Google Scholar] [CrossRef]
- Mostakim, L.; El Qorchi, F.; Guennoun, F.Z.; Moutaouakil, S.; Berger, E.; Ghamizi, M. Morphometric Assessment of Two Watersheds of High Atlas of Morocco Using Remote Sensing and GIS Techniques: What Is the Impact on Surface Water Availability? J. Geogr. Inf. Syst. 2021, 13, 631–642. [Google Scholar] [CrossRef]
- Agoussine, M.; El, M.; Saidi, M.; Igmoullan, B. Reconnaissance Des Ressources En Eau Du Bassin d’ Ouarzazate(Sud-Est Marocain). Bull. Inst. Sci. Rabat Sect. Sci. Terre 2004, 26, 81–92. [Google Scholar]
- Draa Oued Noun Hydraulic Basin Agency (ABHDON). Etude de Modélisation de l’impact des Changements Climatiques sur les Ressources en Eau au Niveau des Bassins de Draa Oued Noune; Unpublished internal document of ABHDON; ABHDON: Guelmim, Morocco, 2018. [Google Scholar]
- Zhanming, W.; Ke, Z.; Xianwu, X.; Hong, Z.; Yang, H.; Jonathan, J.G. Water Balance-Based Actual Evapotranspiration Reconstructionfrom Ground and Satellite Observations over the ConterminousUnited States. Water Resour. Res. 2015, 64, 929. [Google Scholar] [CrossRef]
- Hou, A.Y.; Kakar, R.K.; Neeck, S.; Azarbarzin, A.A.; Kummerow, C.D.; Kojima, M.; Oki, R.; Nakamura, K.; Iguchi, T. The Global Precipitation Measurement Mission. Bull. Am. Meteorol. Soc. 2014, 95, 701–722. [Google Scholar] [CrossRef]
- Hsu, K.L.; Gao, X.; Sorooshian, S.; Gupta, H.V. Precipitation Estimation from Remotely Sensed Information Using Artificial Neural Networks. J. Appl. Meteorol. 1997, 36, 1176–1190. [Google Scholar] [CrossRef]
- Hong, Y.; Hsu, K.L.; Sorooshian, S.; Gao, X. Precipitation Estimation from Remotely Sensed Imagery Using an Artificial Neural Network Cloud Classification System. J. Appl. Meteorol. 2004, 43, 1834–1852. [Google Scholar] [CrossRef] [Green Version]
- Ashouri, H.; Hsu, K.L.; Sorooshian, S.; Braithwaite, D.K.; Knapp, K.R.; Cecil, L.D.; Nelson, B.R.; Prat, O.P. PERSIANN-CDR: Daily Precipitation Climate Data Record from Multisatellite Observations for Hydrological and Climate Studies. Bull. Am. Meteorol. Soc. 2015, 96, 69–83. [Google Scholar] [CrossRef] [Green Version]
- Sadeghi, M.; Nguyen, P.; Naeini, M.R.; Hsu, K.; Braithwaite, D.; Sorooshian, S. PERSIANN-CCS-CDR, a 3-Hourly 0.04° Global Precipitation Climate Data Record for Heavy Precipitation Studies. Sci. Data 2021, 8, 157. [Google Scholar] [CrossRef]
- Nguyen, P.; Ombadi, M.; Gorooh, V.A.; Shearer, E.J.; Sadeghi, M.; Sorooshian, S.; Hsu, K.; Bolvin, D.; Ralph, M.F. Persiann Dynamic Infrared–Rain Rate (PDIR-Now): A near-Real-Time, Quasi-Global Satellite Precipitation Dataset. J. Hydrometeorol. 2020, 21, 2893–2906. [Google Scholar] [CrossRef]
- Nguyen, P.; Shearer, E.J.; Tran, H.; Ombadi, M.; Hayatbini, N.; Palacios, T.; Huynh, P.; Braithwaite, D.; Updegraff, G.; Hsu, K. The CHRS Data Portal, an Easily Accessible Public Repository for PERSIANN Global Satellite Precipitation Data. Sci. Data 2019, 6, 180296. [Google Scholar] [CrossRef] [PubMed] [Green Version]
- Funk, C.; Peterson, P.J.; Landsfeld, M.F.; Pedreros, D.H.; Verdin, J.P.; Rowland, J.D.; Romero, B.E.; Husak, G.J.; Michaelsen, J.C.; Verdin, A.P. A Quasi-Global Precipitation Time Series for Drought Monitoring. U.S. Geol. Surv. Data Ser. 2014, 832, 4. [Google Scholar]
- Diem, J.E.; Hartter, J.; Ryan, S.J.; Palace, M.W. Validation of Satellite Rainfall Products for Western Uganda. J. Hydrometeorol. 2014, 15, 2030–2038. [Google Scholar] [CrossRef]
- Gebere, S.B.; Alamirew, T.; Merkel, B.J.; Melesse, A.M. Performance of High Resolution Satellite Rainfall Products over Data Scarce Parts of Eastern Ethiopia. Remote Sens. 2015, 7, 11639–11663. [Google Scholar] [CrossRef] [Green Version]
- Zhou, Z.; Guo, B.; Xing, W.; Zhou, J.; Xu, F.; Xu, Y. Comprehensive Evaluation of Latest GPM Era IMERG and GSMaP Precipitation Products over Mainland China. Atmos. Res. 2020, 246, 105132. [Google Scholar] [CrossRef]
- Jiang, S.H.; Zhou, M.; Ren, L.L.; Cheng, X.R.; Zhang, P.U. Evaluation of Latest TMPA and CMORPH Satellite Precipitation Products over Yellow River Basin. Water Sci. Eng. 2016, 9, 87–96. [Google Scholar] [CrossRef] [Green Version]
- Li, J.; Heap, A.D. A Review of Spatial Interpolation Methods for Environmental Scientists. Aust. Geol. Surv. Organ. 2008, 68, 154. Available online: https://planet.uwc.ac.za/nisl/BCB_BIM_honours/Course_Documents_2016/Spatial_Interpolation_statistics_methods.pdf (accessed on 15 June 2022).
- Scheel, M.L.M.; Rohrer, M.; Huggel, C.; Santos Villar, D.; Silvestre, E.; Huffman, G.J. Evaluation of TRMM Multi-Satellite Precipitation Analysis (TMPA) Performance in the Central Andes Region and Its Dependency on Spatial and Temporal Resolution. Hydrol. Earth Syst. Sci. 2011, 15, 2649–2663. [Google Scholar] [CrossRef] [Green Version]
- Satgé, F.; Bonnet, M.P.; Gosset, M.; Molina, J.; Hernan Yuque Lima, W.; Pillco Zolá, R.; Timouk, F.; Garnier, J. Assessment of Satellite Rainfall Products over the Andean Plateau. Atmos. Res. 2016, 167, 1–14. [Google Scholar] [CrossRef]
- Tan, M.L.; Samat, N.; Chan, N.W.; Roy, R. Hydro-Meteorological Assessment of Three GPM Satellite Precipitation Products in the Kelantan River Basin, Malaysia. Remote Sens. 2018, 10, 1011. [Google Scholar] [CrossRef] [Green Version]
- Beck, H.E.; Vergopolan, N.; Pan, M.; Levizzani, V.; van Dijk, A.I.J.M.; Weedon, G.P.; Brocca, L.; Pappenberger, F.; Huffman, G.J.; Wood, E.F. Global-Scale Evaluation of 22 Precipitation Datasets Using Gauge Observations and Hydrological Modeling. Adv. Glob. Chang. Res. 2017, 69, 625–653. [Google Scholar] [CrossRef]
- Ghozat, A.; Sharafati, A.; Hosseini, S.A. Long-Term Spatiotemporal Evaluation of CHIRPS Satellite Precipitation Product over Different Climatic Regions of Iran. Theor. Appl. Climatol. 2020, 143, 211–225. [Google Scholar] [CrossRef]
- Saeedi, M.; Sharafati, A.; Brocca, L.; Tavakol, A. Estimating Rainfall Depth from Satellite-Based Soil Moisture Data: A New Algorithm by Integrating SM2RAIN and the Analytical Net Water Flux Models. J. Hydrol. 2022, 610, 127868. [Google Scholar] [CrossRef]
- Wilks, D.S. Statistical Methods in the Atmospheric Sciences; Academic Press: Cambridge, MA, USA, 2011; Volume 100, ISBN 9780127519661. [Google Scholar]
- Li, J.; Heap, A.D. A Review of Comparative Studies of Spatial Interpolation Methods in Environmental Sciences: Performance and Impact Factors. Ecol. Inform. 2011, 6, 228–241. [Google Scholar] [CrossRef]
- Willmott, C.J.; Matsuura, K. Advantages of the Mean Absolute Error (MAE) over the Root Mean Square Error (RMSE) in Assessing Average Model Performance. Clim. Res. 2005, 30, 79–82. [Google Scholar] [CrossRef]
- Chai, T.; Draxler, R.R. Root Mean Square Error (RMSE) or Mean Absolute Error (MAE)?—Arguments against Avoiding RMSE in the Literature. Geosci. Model Dev. 2014, 7, 1247–1250. [Google Scholar] [CrossRef] [Green Version]
- Polong, F.; Pham, Q.B.; Anh, D.T.; Rahman, K.U.; Shahid, M.; Alharbi, R.S. Evaluation and Comparison of Four Satellite-Based Precipitation Products over the Upper Tana River Basin. Int. J. Environ. Sci. Technol. 2022, 3942, 1–16. [Google Scholar] [CrossRef]
- Tian, Y.; Peters-Lidard, C.D.; Choudhury, B.J.; Garcia, M. Multitemporal Analysis of TRMM-Based Satellite Precipitation Products for Land Data Assimilation Applications. J. Hydrometeorol. 2007, 8, 1165–1183. [Google Scholar] [CrossRef]
- Yong, B.; Chen, B.; Tian, Y.; Yu, Z.; Hong, Y. Error-Component Analysis of TRMM-Based Multi-Satellite Precipitation Estimates over Mainland China. Remote Sens. 2016, 8, 440. [Google Scholar] [CrossRef] [Green Version]
- WMO (World Meteorological Organization). Guide to Meteorological Instruments and Methods of Observation (WMO-8, Updated 2018); WMO: Geneva, Switzerland, 2014; ISBN 9789263100085. [Google Scholar]
- Mahmoud, M.T.; Al-zahrani, M.A.; Sharif, H.O. Assessment of Global Precipitation Measurement Satellite Products over Saudi Arabia. J. Hydrol. 2018, 559, 1–12. [Google Scholar] [CrossRef]
- Mahmoud, M.; Mohammed, S.; Hamouda, M.; Mohamed, M. Temporal Assessment of the GPM Satellite Rainfall Products across Extremely Arid Regions Temporal Assessment of the GPM Satellite Rainfall Products across Extremely Arid Regions. E3S Web Conf. 2020, 167, 6. [Google Scholar] [CrossRef]
- Keikhosravi-Kiany, M.S.; Masoodian, S.A.; Balling, R.C.; Darand, M. Evaluation of Tropical Rainfall Measuring Mission, Integrated Multi-Satellite Retrievals for GPM, Climate Hazards Centre InfraRed Precipitation with Station Data, and European Centre for Medium-Range Weather Forecasts Reanalysis v5 Data in Estimating Prec. Int. J. Climatol. 2022, 42, 2039–2064. [Google Scholar] [CrossRef]
- Leong, M.; Santo, H. Comparison of GPM IMERG, TMPA 3B42 and PERSIANN-CDR Satellite Precipitation Products over Malaysia. Atmos. Res. 2018, 202, 63–76. [Google Scholar] [CrossRef]
- Anjum, M.N.; Ding, Y.; Shangguan, D.; Ahmad, I.; Ijaz, M.W.; Farid, H.U.; Yagoub, E.; Zaman, M.; Adnan, M. Performance Evaluation of Latest Integrated Multi-Satellite Retrievals for Global Precipitation Measurement (IMERG) over the Northern Highlands of Pakistan. Atmos. Res. 2018, 205, 134–146. [Google Scholar] [CrossRef]
- Dinku, T.; Ceccato, P.; Connor, S.J. Challenges of Satellite Rainfall Estimation over Mountainous and Arid Parts of East Africa. Int. J. Remote Sens. 2011, 32, 5965–5979. [Google Scholar] [CrossRef]
- Toté, C.; Patricio, D.; Boogaard, H.; Van Der Wijngaart, R.; Tarnavsky, E.; Funk, C. Evaluation of Satellite Rainfall Estimates for Drought and Flood Monitoring in Mozambique. Remote Sens. 2015, 7, 1758–1776. [Google Scholar] [CrossRef] [Green Version]
- Wang, N.; Liu, C.; Nesdis, N.; Park, C.; Zipser, E. TRMM 2A12 Land Precipitation Product—Status and Future Plans. J. Meteorol. Soc. Jpn. 2009, 87, 237–253. [Google Scholar] [CrossRef] [Green Version]
- Gadouali, F.; Messouli, M. Evaluation of Multiple Satellite-Derived Rainfall Products over Morocco. Hydrol. Sci. Technol. 2020, 10, 72–89. [Google Scholar] [CrossRef]
- Ouatiki, H.; Boudhar, A.; Tramblay, Y.; Jarlan, L.; Benabdelouhab, T.; Hanich, L.; El Meslouhi, M.R.; Chehbouni, A. Evaluation of TRMM 3B42 V7 Rainfall Product over the Oum Er Rbia Watershed in Morocco. Climate 2017, 5, 1. [Google Scholar] [CrossRef]
- Habitou, N.; Morabbi, A.; Ouazar, D.; Bouziane, A.; Hasnaoui, M.D.; Sabri, H. CHIRPS Precipitation Open Data for Drought Monitoring: Application to the Tensift Basin, Morocco. J. Appl. Remote Sens. 2022, 14, 034526. [Google Scholar] [CrossRef]
- Alsumaiti, T.S.; Hussein, K.; Ghebreyesus, D.T.; Sharif, H.O. Performance of the CMORPH and GPM IMERG Products over the United Arab Emirates. Remote Sens. 2020, 12, 1426. [Google Scholar] [CrossRef]
- Zambrano-Bigiarini, M.; Nauditt, A.; Birkel, C.; Verbist, K.; Ribbe, L. Temporal and Spatial Evaluation of Satellite-Based Rainfall Estimates across the Complex Topographical and Climatic Gradients of Chile. Hydrol. Earth Syst. Sci. 2017, 21, 1295–1320. [Google Scholar] [CrossRef]
- Hossain, F.; Huffman, G. Investigating Error Metrics for Satellite Rainfall Data at Hydrologically Relevant Scales. J. Hydrometeorol. 2008, 9, 563–575. [Google Scholar] [CrossRef]
Figure 1.
Location of the study area and rain gauges network. B1-B5: Basins.

Figure 2.
Boxplot of relative bias for the six evaluated products.

Figure 3.
Boxplot of three continuous metrics at daily, monthly and annual time scales.

Figure 4.
The relative bias of the satellite estimates according to the rain-gauge altitudes.

Figure 5.
Continuous metrics according to altitudes for the daily, monthly and annual scales.

Figure 6.
The relative bias of the satellite estimates according to the rain-gauge latitudes.

Figure 7.
Continuous metrics according to the rain-gauge latitudes for the daily, monthly and annual scales.
Figure 7.
Continuous metrics according to the rain-gauge latitudes for the daily, monthly and annual scales.

Figure 8.
Boxplot of categorical metrics for five different intensity classes.

Figure 9.
Relative bias of the six products for the five basins.

Figure 10.
Continuous metrics for the five basins at the daily, monthly and annual scales.


Table 1.
Coordinates of the stations used in this study and their missing values rate. ID: Identification of rain gauge, where S for Souss and D for Draa, Lat is Latitude, Long is longitude, and Z is altitude.
Table 1.
Coordinates of the stations used in this study and their missing values rate. ID: Identification of rain gauge, where S for Souss and D for Draa, Lat is Latitude, Long is longitude, and Z is altitude.
| ABHSM | ABHDON | ||||||||||
|---|---|---|---|---|---|---|---|---|---|---|---|
| Stations | ID | Long | Lat | Z (m) | Missing Values (%) | Stations | ID | Long | Lat | Z (m) | Missing Values (%) |
| ABHSM | S1 | −9.59° W | 30.42° N | 28 | 5.04 | IFNI | D1 | −10.16° W | 29.37° N | 20 | 10.8 |
| Imi Miki | S2 | −9.65° W | 30.52° N | 40 | 0.63 | Mansour Eddahbi | D2 | −6.78° W | 30.91° N | 1100 | 5.35 |
| Tamri | S3 | −9.81° W | 30.71° N | 42 | 0.12 | Ouarzazate Centre | D3 | −6.90° W | 30.93° N | 1130 | 0.99 |
| Youssef Ben Tachafine | S4 | −9.49° W | 29.85° N | 107 | 2.41 | Tinouar | D4 | −6.61° W | 31.01° N | 1136 | 2.42 |
| Ouijjane | S5 | −9.51° W | 29.61° N | 180 | 2.14 | Tiflite | D5 | −6.80° W | 31.01° N | 1168 | 0.52 |
| N’guerf | S6 | −9.28° W | 29.87° N | 190 | 1.56 | Aman-Ntini | D6 | −7.04° W | 30.95° N | 1170 | 1.05 |
| Pont Taroudant | S7 | −8.90° W | 30.43° N | 209 | 1.53 | Agouillal | D7 | −7.10° W | 31.01° N | 1220 | 1.72 |
| Dkhila | S8 | −9.28° W | 30.57° N | 312 | 2.01 | Taherbilte | D8 | −6.95° W | 30.83° N | 1226 | 0.93 |
| Imi El Kheng | S9 | −8.53° W | 30.67° N | 539 | 1.04 | Ifre | D9 | −6.18° W | 31.34° N | 1498 | 16.87 |
| Amaghouz | S10 | −9.19° W | 29.73° N | 610 | 0.11 | Imdghar N’izdar | D10 | −7.34° W | 30.61° N | 1502 | 0.94 |
| Tassila | S11 | −9.44° W | 30.95° N | 620 | 2.98 | Ait Mouted | D11 | −6.00° W | 31.43° N | 1545 | 2.64 |
| Abdelmoumen | S12 | −9.20° W | 30.68° N | 628 | 0.96 | Agouim | D12 | −7.46° W | 31.16° N | 1647 | 6.53 |
| Lamded | S13 | −8.31° W | 30.76° N | 670 | 8.01 | M’semrir | D13 | −5.81° W | 31.71° N | 1942 | 11.29 |
| Pont Aoulouz | S14 | −8.16° W | 30.70° N | 680 | 7.19 | ||||||
| Aguenza | S15 | −9.16° W | 30.74° N | 720 | 1.34 | ||||||
| Aoulouz | S16 | −8.14° W | 30.70° N | 784 | 7.64 | ||||||
| Amsoul | S17 | −9.07° W | 30.84° N | 860 | 2.67 | ||||||
| Immerguen | S18 | −8.02° W | 30.60° N | 925 | 5.72 | ||||||
| Taliouine | S19 | −7.91° W | 30.53° N | 1000 | 9.12 | ||||||
| Iguidi | S20 | −7.90° W | 30.84° N | 1200 | 5.56 | ||||||
Table 2.
Summary of satellite precipitation products used in this study.
| Product | Denoted as | Spatial Resolution | Finest Temporal Resolution | Spatial Coverage | Latency | Period |
|---|---|---|---|---|---|---|
| GPM IMERG-Early V06 | GPM-E | 0.1° × 0.1° | 30 min | 60° N–60° S | 4 h | June 2000–Now |
| GPM IMERG-Late V06 | GPM-L | 0.1° × 0.1° | 30 min | 60° N–60° S | 14 h | June 2000–Now |
| GPM IMERG-Final V06 | GPM-F | 0.1° × 0.1° | 30 min | 60° N–60° S | 3.5 months | June 2000–Now |
| PDIR-Now | PDIR | 0.04° × 0.04° | 1 h | 60° N–60° S | 15–60 min | March 2000–Now |
| PERSIANN-CCS-CDR | CCS-CDR | 0.04° × 0.04° | 3 h | 60° N–60° S | 3–3.5 months | January 1983–Now |
| CHIRPS v2.0 | CHIRPS | 0.05 ° × 0.05 ° | 1 day | 50° N–50° S | 3 weeks | January 1981–Now |
Table 3.
List of Continuous and Categorical metrics used in this study. Gi: the gauge observation; Si: the satellite precipitation estimation; S: the mean satellite precipitation estimation; G: the mean gauge observation; N: the sample size; A–C: see the contingency table (Table 4).
Table 3.
List of Continuous and Categorical metrics used in this study. Gi: the gauge observation; Si: the satellite precipitation estimation; S: the mean satellite precipitation estimation; G: the mean gauge observation; N: the sample size; A–C: see the contingency table (Table 4).
| Statistical Index | Formula | Range | Optimum Value | |
|---|---|---|---|---|
| Continuous metrics | Correlation coefficient | −1 to 1 | 1 | |
| Relative bias | 0 to + ∞ | 0 | ||
| Relative root mean square error | 0 to + ∞ | 0 | ||
| Relative mean absolute error | 0 à + ∞ | 0 | ||
| Categorical metrics | Probability of Detection | 0 to 1 | 1 | |
| False alarm ratio | 0 to 1 | 0 | ||
| Critical success index | 0 to 1 | 1 | ||
Table 4.
Contingency table for categorical metrics. A: corresponds to an event detected by the satellite product and the rain gauge; B corresponds to an event detected only by the satellite product; C corresponds to an event detected by the rain gauge but not by the satellite product; D corresponds to an event not detected by the rain gauge nor by the satellite product.
| Observation | |||
| Yes | No | ||
| Satellite Product | Yes | A: Hits | B: False |
| No | C: Misses | D: Rejection | |
Table 5.
Classification of rainfall events according to their daily intensity. [a, b]: the interval includes the values strictly between a and b. [a, b]: The interval includes values greater than, or equal to a and strictly less than b.
Table 5.
Classification of rainfall events according to their daily intensity. [a, b]: the interval includes the values strictly between a and b. [a, b]: The interval includes values greater than, or equal to a and strictly less than b.
| Rainfall Event | Intensity in mm/d |
|---|---|
| Light rain | [0, 1] |
| Moderate rain | [1, 5] |
| Medium rain | [5, 20] |
| Heavy rain | [20, 40] |
| Extreme rain | ≥40 |
Publisher’s Note: MDPI stays neutral with regard to jurisdictional claims in published maps and institutional affiliations. |
© 2022 by the authors. Licensee MDPI, Basel, Switzerland. This article is an open access article distributed under the terms and conditions of the Creative Commons Attribution (CC BY) license (https://creativecommons.org/licenses/by/4.0/).
Share and Cite
MDPI and ACS Style
Rachdane, M.; Khalki, E.M.E.; Saidi, M.E.; Nehmadou, M.; Ahbari, A.; Tramblay, Y. Comparison of High-Resolution Satellite Precipitation Products in Sub-Saharan Morocco. Water 2022, 14, 3336. https://doi.org/10.3390/w14203336
AMA Style
Rachdane M, Khalki EME, Saidi ME, Nehmadou M, Ahbari A, Tramblay Y. Comparison of High-Resolution Satellite Precipitation Products in Sub-Saharan Morocco. Water. 2022; 14(20):3336. https://doi.org/10.3390/w14203336
Chicago/Turabian StyleRachdane, Mariame, El Mahdi El Khalki, Mohamed Elmehdi Saidi, Mohamed Nehmadou, Abdellatif Ahbari, and Yves Tramblay. 2022. "Comparison of High-Resolution Satellite Precipitation Products in Sub-Saharan Morocco" Water 14, no. 20: 3336. https://doi.org/10.3390/w14203336
Note that from the first issue of 2016, this journal uses article numbers instead of page numbers. See further details here.