
Research on the Sustainable Development of the Bistrita Ardeleana River through the Resizing of Weirs
by
 ,
,
Aurelian Cosmin Moldovan
1,*,
Valer Micle
1,*,
Tomi Alexandrel Hrăniciuc
2,* and
Nicolae Marcoie
2 1
Faculty of Materials and Environmental Engineering, Department of Environment Engineering and Entrepreneurship of Sustainable Development, Technical University of Cluj-Napoca, 103-105 Muncii Blvd., 400641 Cluj-Napoca, Romania
2
Faculty of Hydrotechnics, Geodesy and Environmental Engineering, “Gheorghe Asachi” Technical University of Iasi, Dimitrie Mangeron Blvd. nr. 65, 70050 Iasi, Romania
*
Authors to whom correspondence should be addressed.
Water 2022, 14(20), 3333; https://doi.org/10.3390/w14203333
Submission received: 7 September 2022
/
Revised: 14 October 2022
/
Accepted: 15 October 2022
/
Published: 21 October 2022
(This article belongs to the Section Hydraulics and Hydrodynamics)
Abstract
:The layout of water resources and the complex and rational use of them have an important role in the socioeconomic activities of an urban settlement. Transversal hydrotechnical constructions such as weirs reduce the longitudinal connectivity of rivers and streams, affecting river biodiversity as well as water quality. This paper presents an alternative method that will help restore connectivity. In order to choose the best solution, topographical measurements were taken with a total topographical station, and a professional drone was used to obtain an updated orthophoto plan. After processing the data obtained in the field, engineering software capable of simulating flow, sediment transport, and water quality in rivers was used. With the help of the software, two hypotheses were realized: hypothesis A, the case with only one weir in place, and hypothesis B, when we have the proposed case with the lowering of the height of the weir’s crest and the construction of three new control weirs downstream of it. In conclusion, the lowering of the current weir’s crest and the construction downstream of it of three new weirs of low height would have a favorable effect from an ecological and a morphological point of view, without very big consequences on the disturbance of the flow from a hydraulic point of view.
1. Introduction
The layout of water resources and the complex and rational use of them have an essential role in economic and social activity. The arrangement of a water course represents the totality of the engineering works performed in the reception basin and in the riverbed, in order to eliminate or reduce the direct and indirect negative effects of the natural, uncontrolled flow of water. The hydrotechnical constructions in the riverbed have the purpose of controlling the flow regime to modify or strengthen the riverbed artificially in order to obtain a stable bed over a period of time as long as possible [1].
The deterioration of the ecological health of streams flowing through urban areas has become a significant research topic in freshwater ecology. Environmental degradation due to anthropogenic actions causes a progressive decrease in aquatic biodiversity. With the intention of minimizing the impact of ecological degradation on the aquatic biodiversity in the water bodies located in the urban areas of towns, ecosystem restoration is used as a tool in different countries to mitigate and restore water bodies in urban areas [2].
Returning to the original state of the river, or as close to the natural state as possible, refers to a set of actions completed to restore the environmental health of a degraded watercourse. Alternatively, it can also be said that restoration is an attempt to recover some of the ecosystem services that are so important to society. The recovery of the ecological health of a degraded watercourse may include projects aimed at improving fish habitat, water quality, or river recreation [2,3,4].
A degraded stream is defined as a river that does not function to its biological hydrological potential [5].
The quality of the water in rivers is important because it is a vital resource for us. Its quality depends on the integrity of water bodies and the quality of life in rivers. Transversal hydrotechnical constructions (weirs, dams, etc.) reduce the longitudinal connectivity of rivers and streams, affecting the biodiversity of rivers and implicitly the water quality [6,7].
Any intervention in the riverbed that influences the flow rate, the sediment transport, the morphology of the riverbed, or the migration of the biota determines its longitudinal fragmentation. Rivers are complex systems whose habitats and species are continuously distributed from spring to spill and are permanently interconnected, and their integrity depends on maintaining the connection between them [7].
The construction of transversal works on a watercourse, such as dams and weirs, results in significant changes in the way ecosystems on the river function. They interrupt the longitudinal connectivity of rivers with effects on the hydrological regime and the migration of biota and they influence the transport of alluvial material threatening the natural balance between the erosion process and the accretion process in the coastal area. [7,8]. Downstream, the thalweg is subject to a degradation process. Dams and weirs not only affect these hydraulic variables but also simplify the habitats of fish and macro-invertebrates, and some of them fail to adapt to the new conditions of the aquatic environment [2,9,10,11]. Transverse constructions obstruct the longitudinal movements of these aquatic organisms in the process of feeding and reproduction, which leads to a decrease in their population [7,9,10,11]; in our case, the endangered fish species that are protected by law are the Mediterranean barbel (Barbus meridionalis) and the Danubian longbarbel gudgeon (Gobio uranoscopus). Other creatures protected by law that live in the aquatic environment are the crested newt (Triturus cristatus) and the Yellow-bellied toad (Bombina variegata) [12].
The removal of transversal constructions will significantly contribute to the restoration of the water course. The sediments deposited upstream will be washed away, and part of them will be deposited in the section of the degraded thalweg downstream by the hydrotechnical work [9]. The discontinuity of the thalweg slope upstream and downstream of the weir will gradually disappear. The removal of transversal hydrotechnical structures, in particular of weirs, is a common approach to restore the longitudinal connectivity of a river and improve the fragmented habitats of fish and macro-invertebrates [10,13]. Weir removal has been used successfully in England [14], Italy [4], and the United States; the latter has spent over USD 1 billion on river restoration [3], with the removal of transversal hydrotechnical constructions being practiced in South Korea as well [10].
In the territory of the city of Bistrita, there are eight such transversal hydrotechnical constructions; four of them are weirs with a height greater than 1 m, and four have a height below 1 m. Currently, some of the existing weirs no longer provide the services that they were designed for because they are no longer functional; they are in an advanced state of degradation or even destroyed. Therefore, rehabilitation/modification works or even their complete removal are required.
Alternative green or green-grey methods or green infrastructure can be defined as a network of natural or semi-natural areas strategically planned and created in order to manage situations such as high water (floods, flash floods), favor the migration of aquatic fauna, and many others related to the quality of the environment in the urban area [15].
The main benefits of alternative methods can be:
- the restoration/improvement of longitudinal connectivity of the aquatic environment and riparian ecosystems;
- increased aquatic biodiversity;
- restoring normal fish migration processes;
- improving the condition of the fish population, both qualitatively and quantitatively;
- increased benefits for recreational fishing;
- improving water quality;
- reducing the risk of flooding in the local area, while ensuring that the risk of flooding is not increased downstream.
During 1998–2008, 166 papers regarding the management of hydrotechnical constructions built in the riverbed were published globally. Out of the 166 published articles, 143 had as their main subject the removal of hydrotechnical constructions located in riverbeds. In recent years, (2009–2018) a very large number of articles have been published about the restoration of watercourses; with regard to the removal of hydrotechnical constructions, a number of 381 articles have been published [13].
In the last 20 years in Europe, the restoration of a water course to improve its qualitative or environmental status had to meet the legislative objectives of the European Union such as Directive 2000/60/EC—the framework of the Community policy in the field of water. These legislative efforts and the necessary actions are ultimately aimed at increasing the heterogeneity of ecosystems and the processes of hyporheic exchange [16,17].
Given the growing international concern about water and environmental sustainability that has led to the development and acceleration of the practice and science of river restoration, we tried to have meetings with specialists in water management. During our meetings, we found that they were no strangers to environmentally friendly methods or green infrastructure. They also claimed that they have some problems or difficulties in starting green or ecological hydrotechnical constructions, such as:
- starting the project takes too much time;
- high costs;
- lack of workforce, etc.
The purpose of this paper is to provide a solution regarding the quality management of water, namely, the sustainable management of the aquatic environment in rivers, especially of water bodies in the urban area of towns where human activities have a significant impact.
2. Materials and Methods
2.1. Location and Particularities of the Studied Area
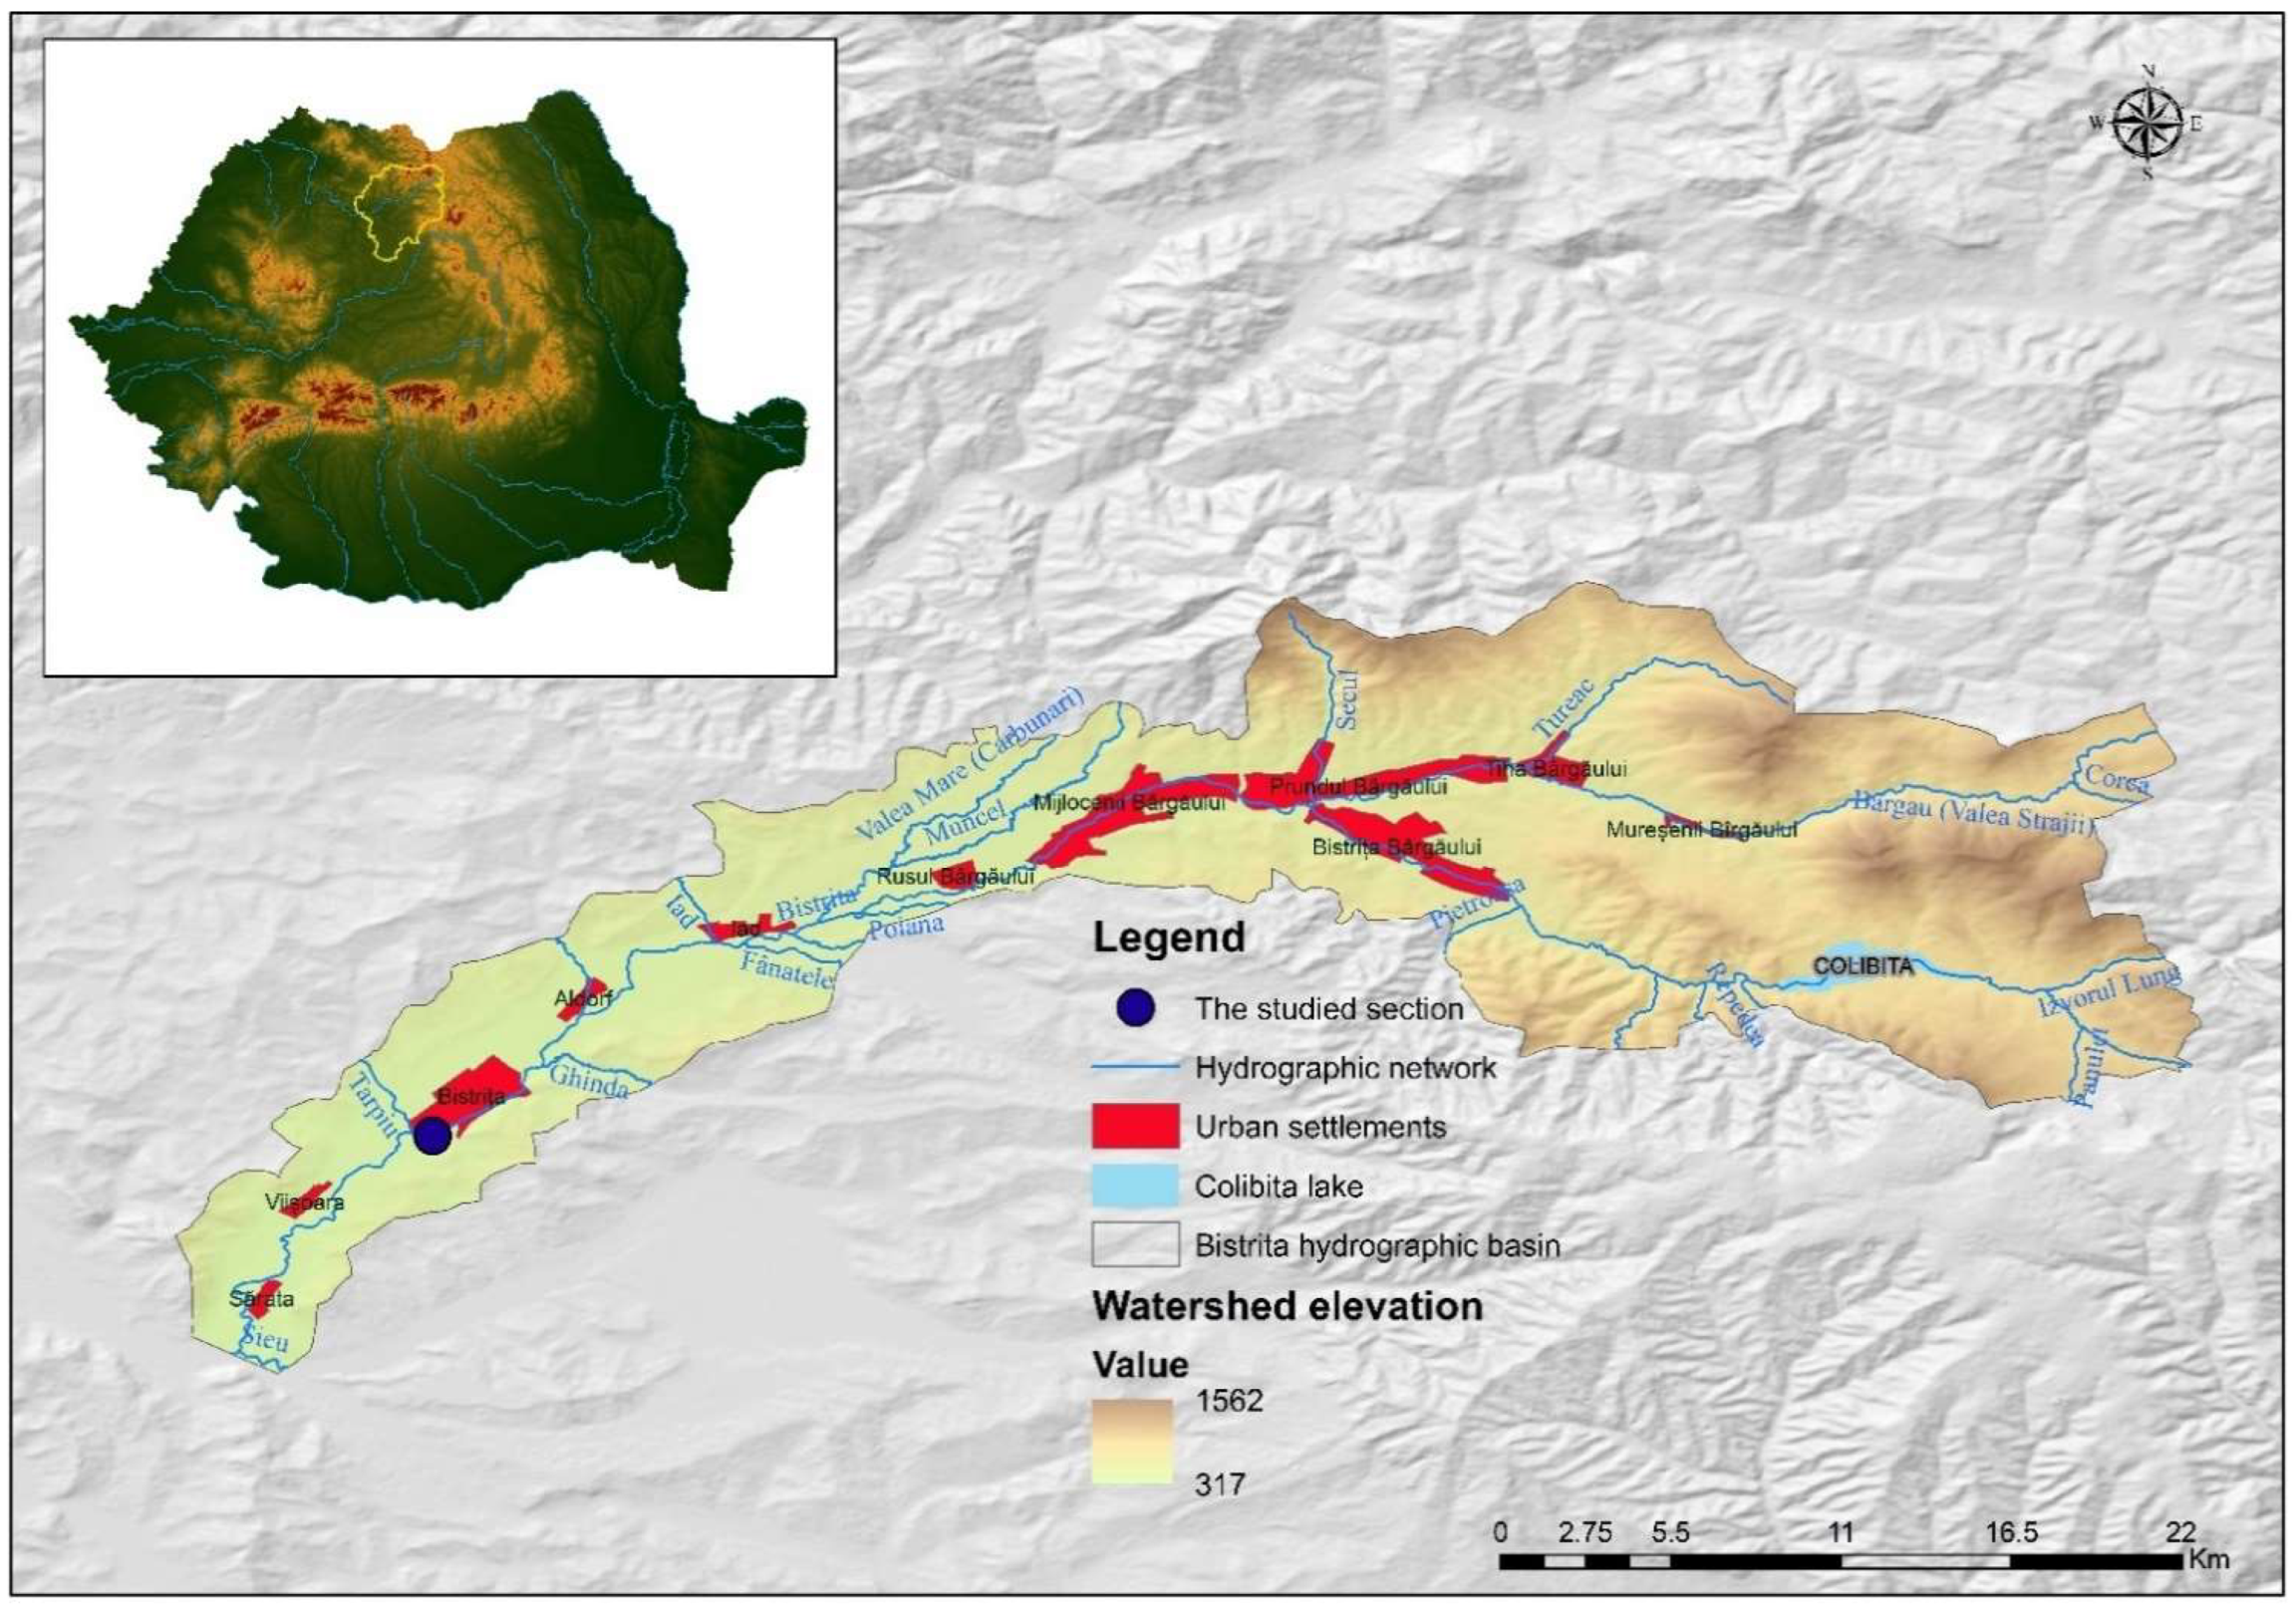
The water course studied in this paper is located in Bistrita-Nasaud County, North-West of Romania. The Bistrita River is a right tributary of the Sieu water course, both of which are part of the Somesul Mare river basin. The hydrographic basin of the Bistrita Ardeleana watercourse has an area of 650 km2, it springs from the central group of the Eastern Carpathians, and subsequently, its riverbed crosses the hills of Bistrita, continuing through the Bistrita depression [18]. The Bistrita hydrographic basin incorporates the Tanase, Bargau, and Bistrita hydrographic sub-basins [19]. The weir that is the main objective of this article is located at 10,866 km per watercourse, upstream of the confluence of the Bistrita river with the Sieu river (Figure 1).
The climatic regime of the studied area is given by the effect of maritime polar air masses from the west during the cold period of the year, with shorter transitional seasons compared to those in the south of the country, and with warm and rather humid summers. Air temperatures have annual average values between 0–2 °C on mountain peaks, between 8–8.5 °C in the South-West area, and 9.1 °C in Bistrita municipality [20].
The Bistrita River has undergone distinctive anthropic transformations. The changes in the water course began around the 15th century when the inhabitants consolidated the fortifications of the entire city with water ditches and stone walls. For greater safety, they were doubled by ditches with water, 2–3 m deep and 30–35 m wide [21].
Two exceptional floods were recorded in the hydrographic basin of the Bistrita Ardeleana River, the first one in 1932 when the hydrometric station Bistrita registered a level of 5.2 m, and the flood registered on 13 May 1970, the level being 3.64 m with a flow of 618 m3/sec. [22,23,24,25]. These levels or flows have not been recorded until now due to the construction of the Colibita lake dam, which has the role of mitigating floods in the hydrographic basin of the Bistrita Ardeleana river.
Following the events of 1970, the decision was taken to promote the following constructions with the role of flood mitigation or flood defense:
- regularization of the Bistrita River and its tributaries as well as upstream and downstream bank defense;
- the construction of dykes with the role of defense against floods downstream and upstream of the city of Bistrita;
- landslide stabilization works on the left bank of the river, downstream of the Jelnei bridge [24].
Regarding the historical minimum flow, we can say that it had been recorded before the hydrotechnical constructions with the role of flood mitigation or flood defense were promoted. Between 1950 and 1965, the average monthly minimum annual flows were calculated, resulting in a value of 1.82 m3/s. The average daily minimum annual flow rates were also calculated, resulting in a value of 0.99 m3/s, and the historical daily minimum flow recorded at the Bistrita hydrometric station on the Bistrita Ardeleana River was on 31 January 1954 with a value of 0.135 m3/s [23,25].
2.2. Methods Used
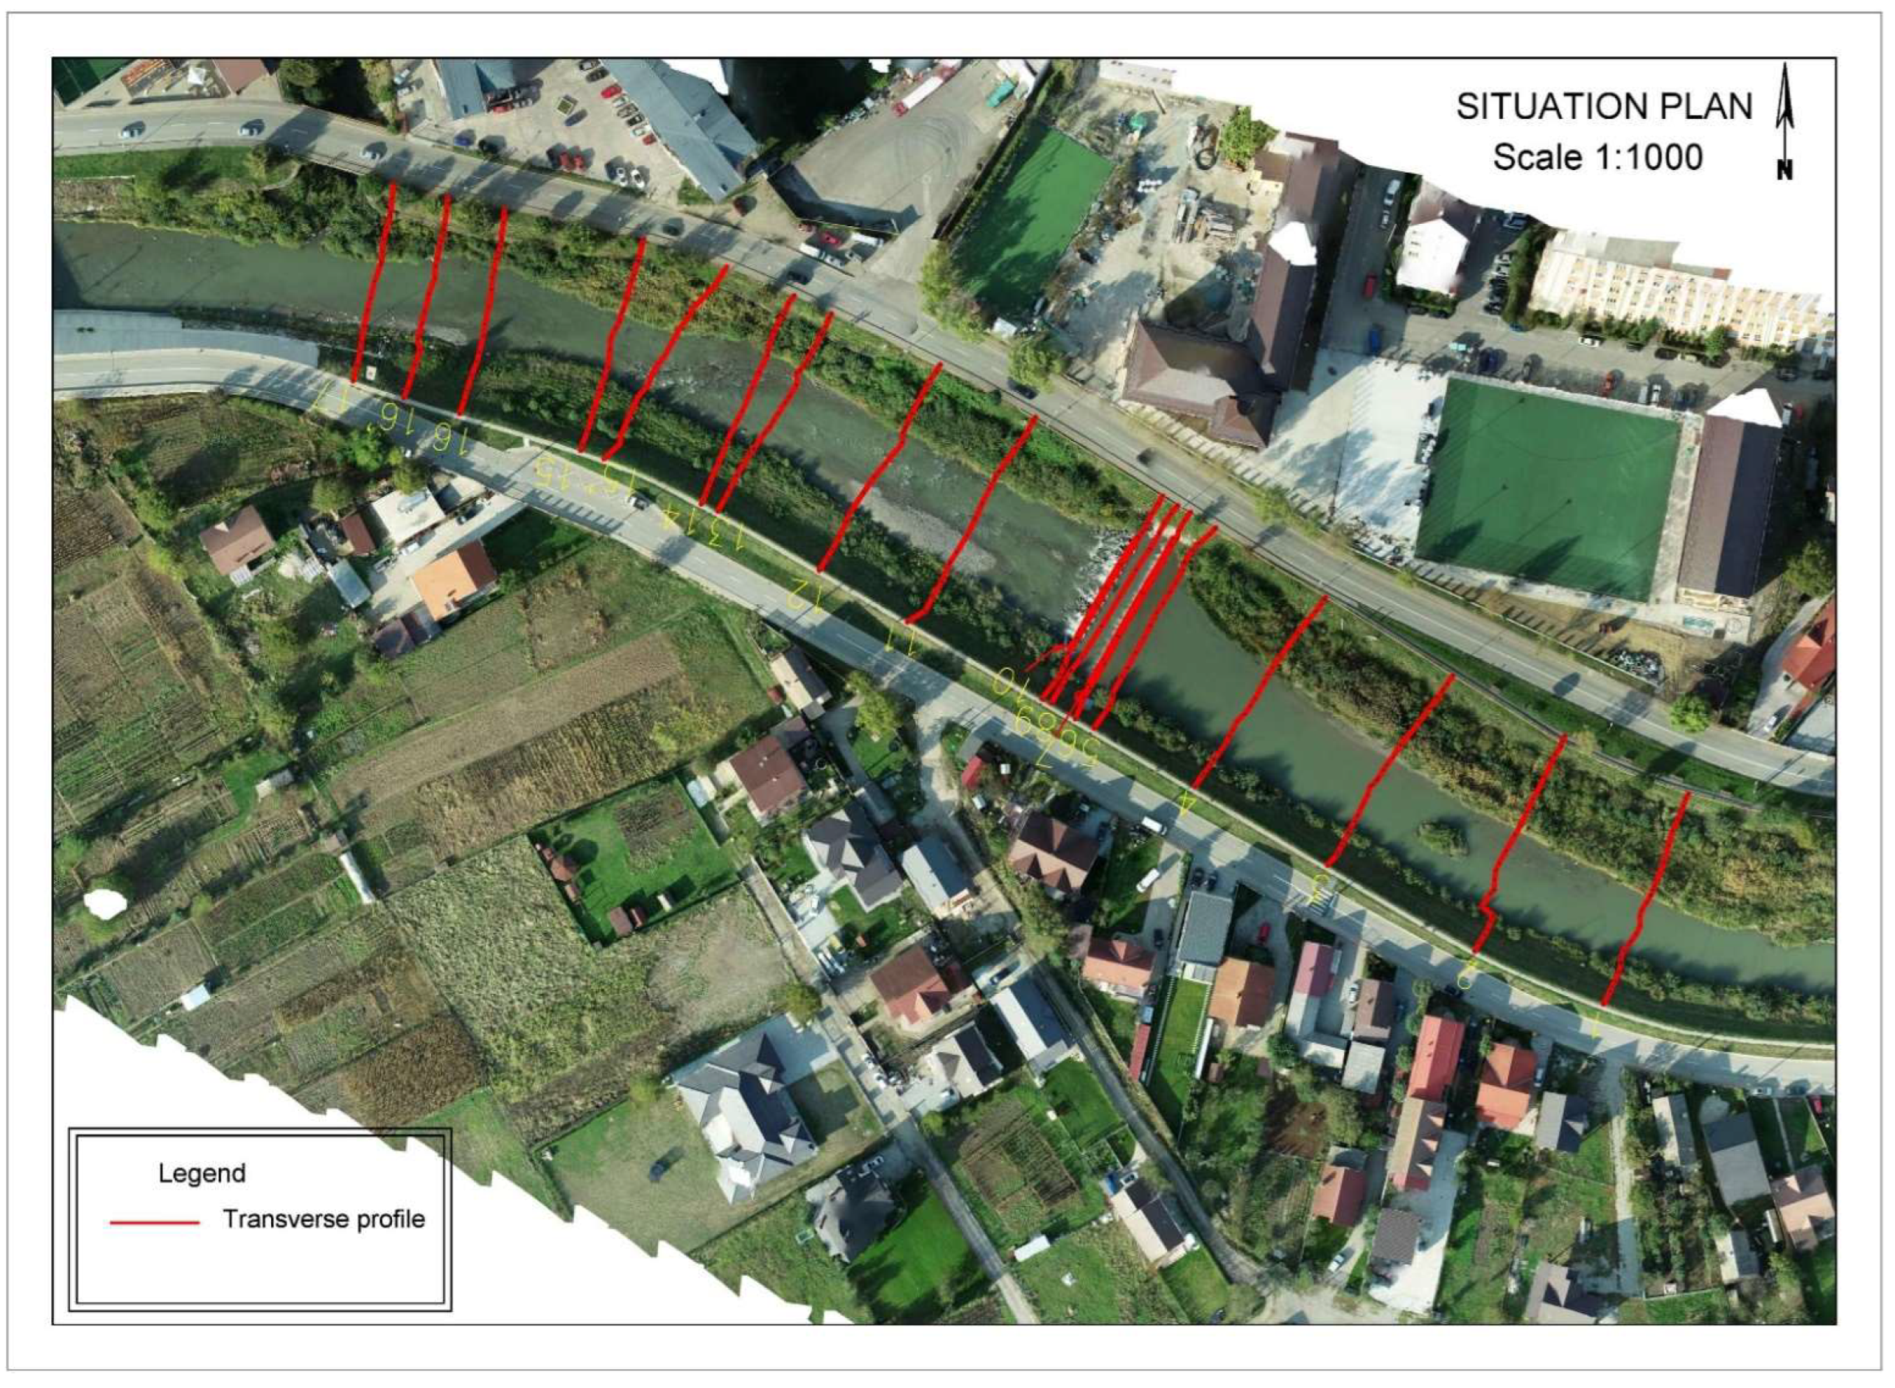
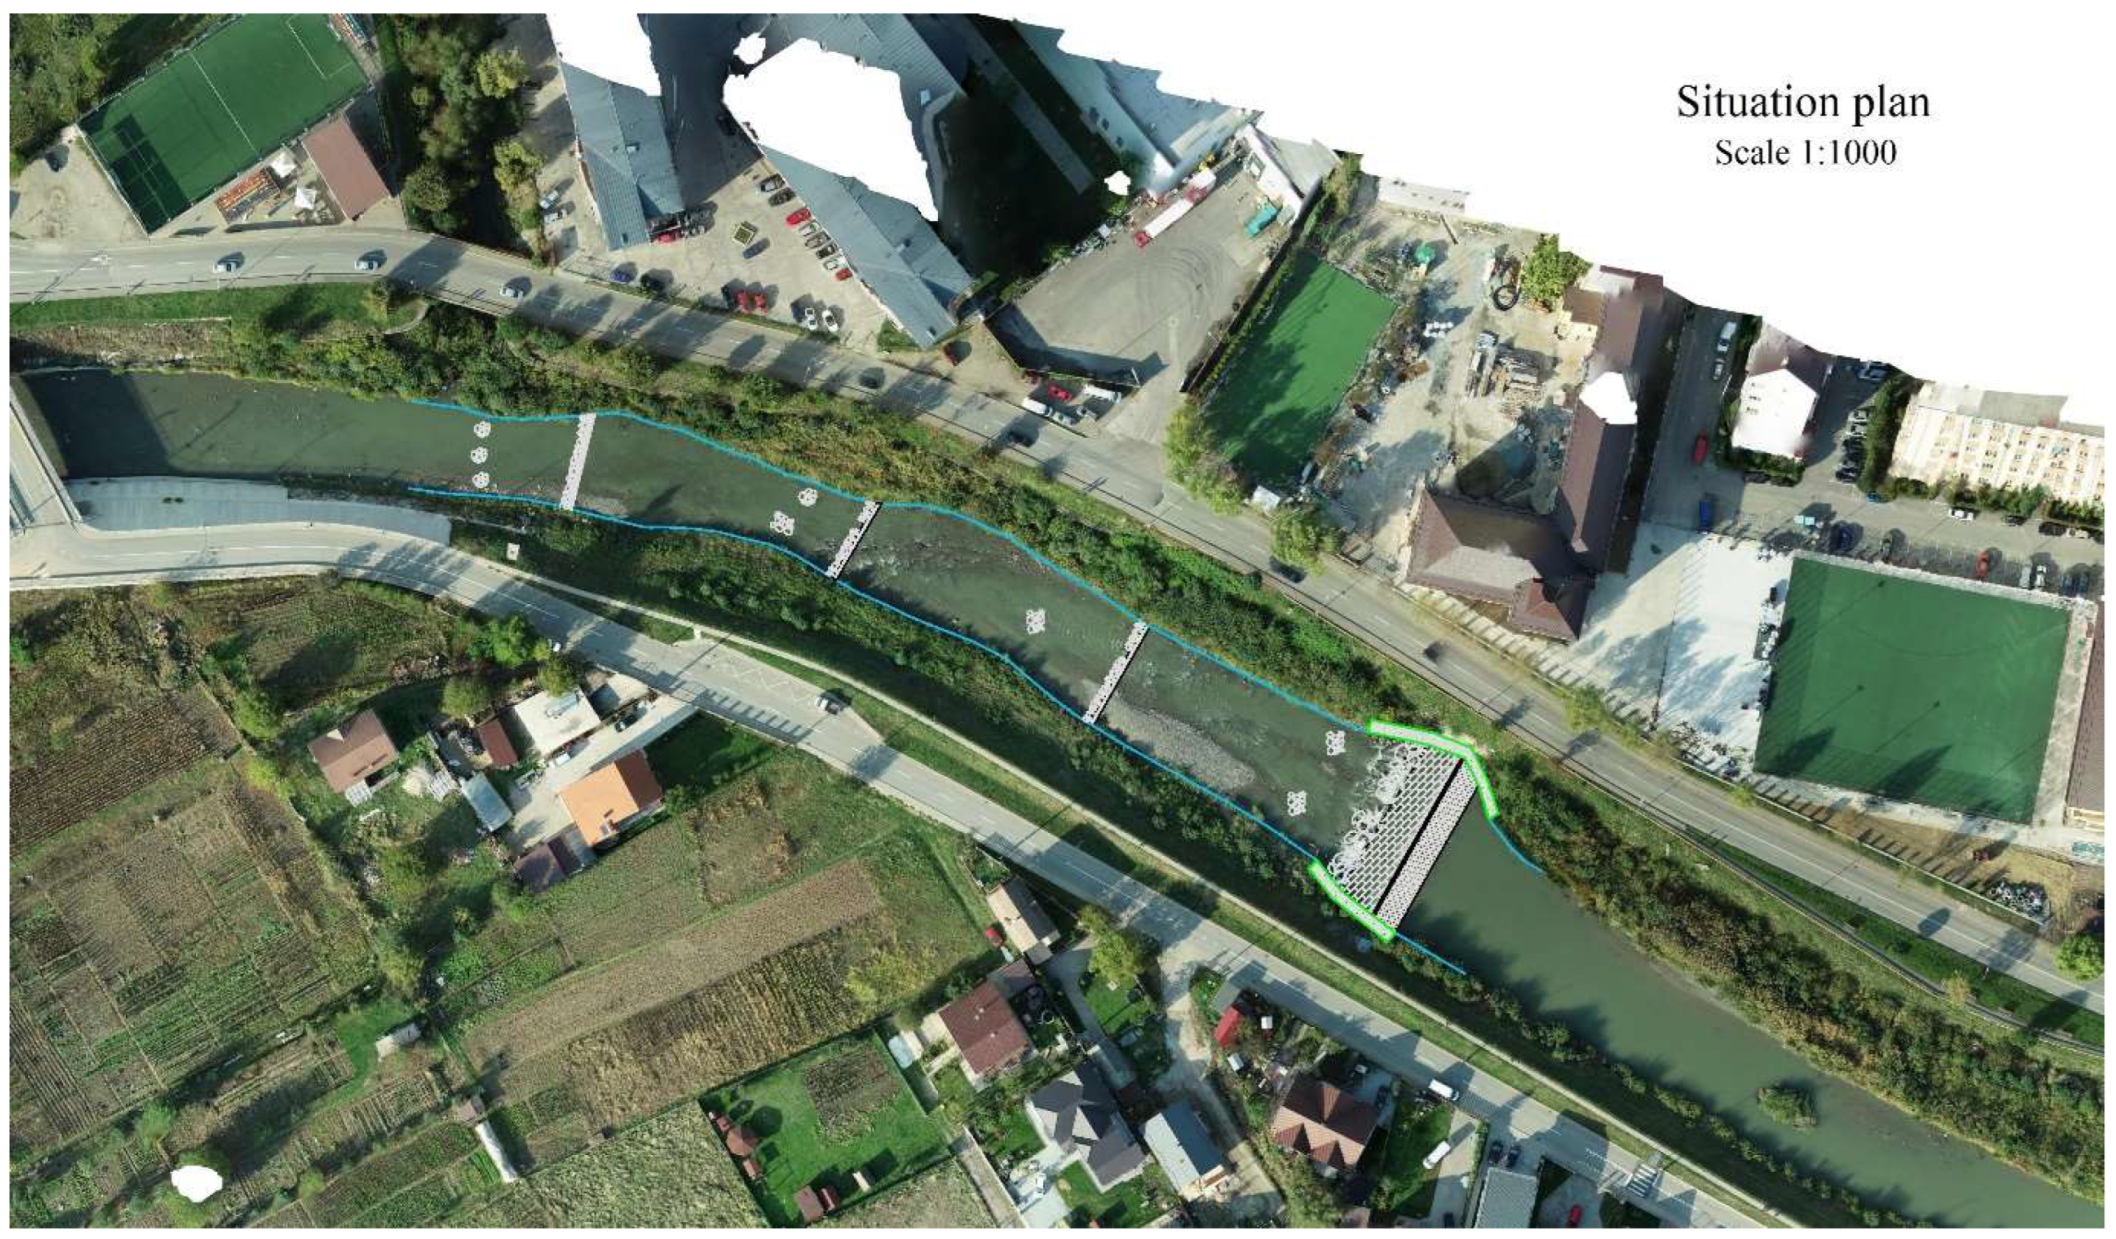
In order to start the research and obtain an updated orthophotoplan and an image of the weir as real as possible, topographical measurements were carried out with the Leica FlexLine TS 07 total station and flights with the Phantom 4 Pro v 2.0 drone (produced by the Chinese company DJI based in Shenzhen). ProfLT v 10.3 software was used to process the topographic data collected in the field and create the transverse and longitudinal profiles; 19 transverse profiles and one longitudinal profile were produced (Figure 2).
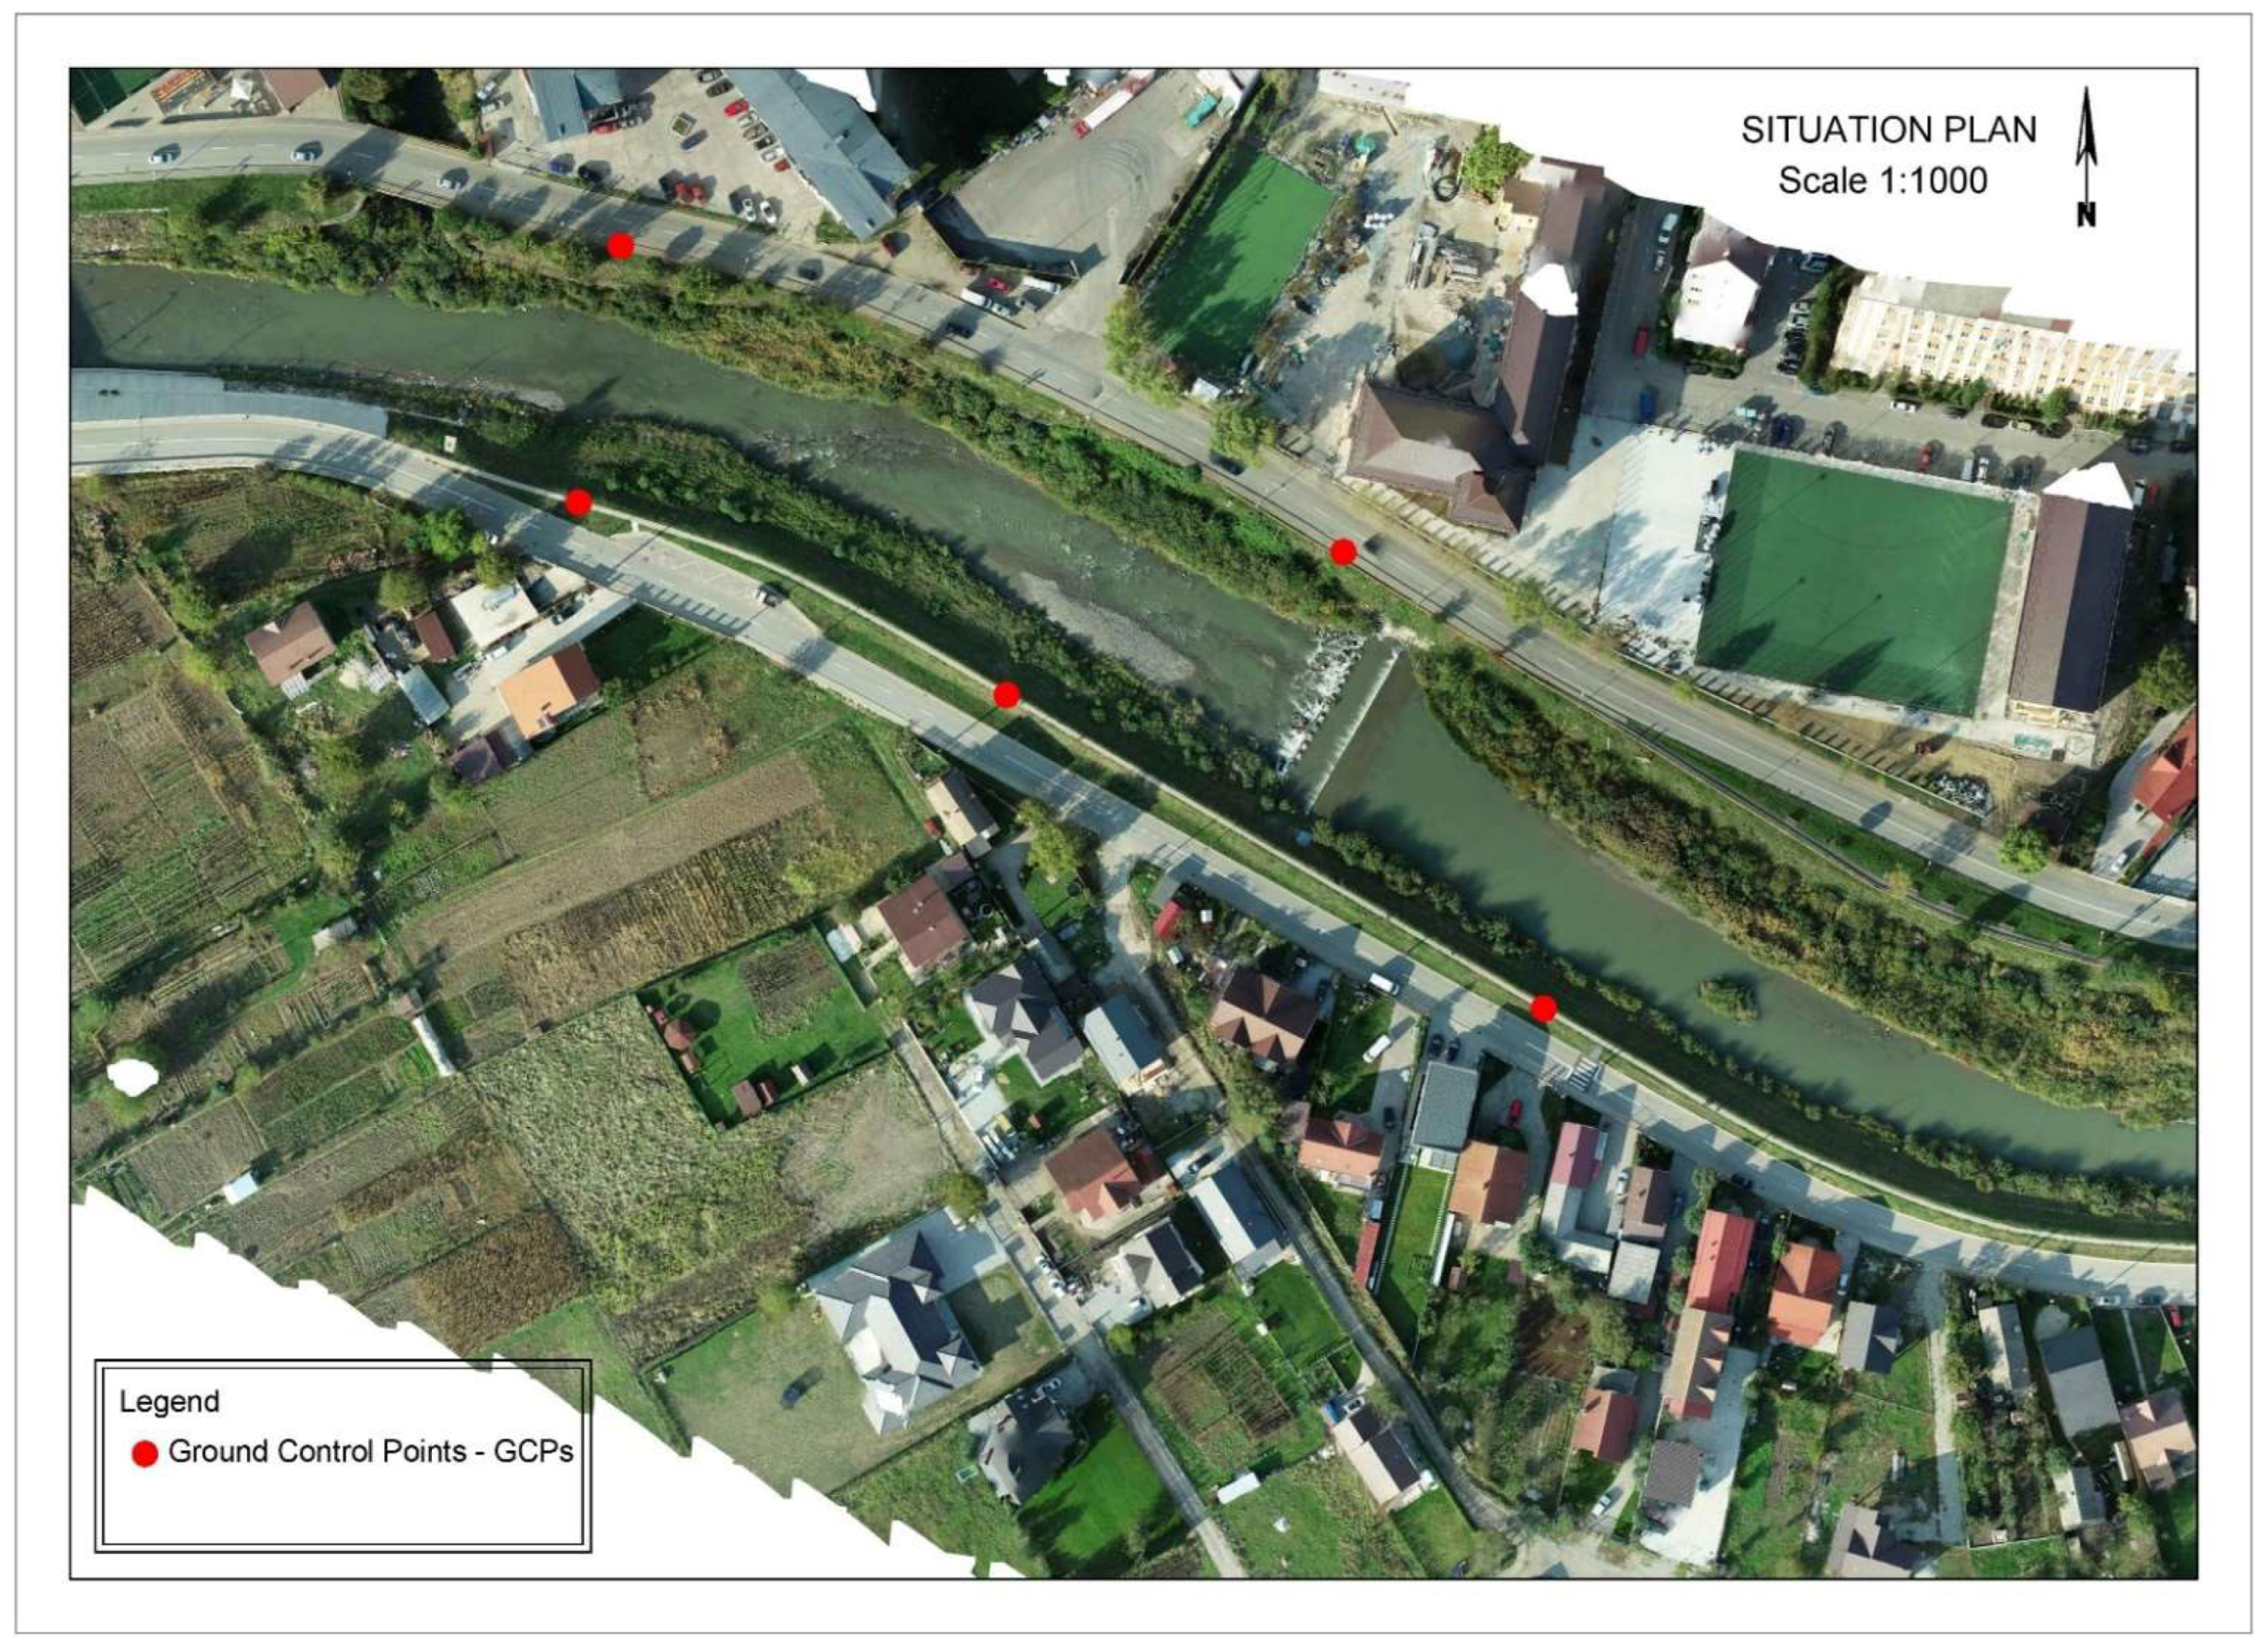
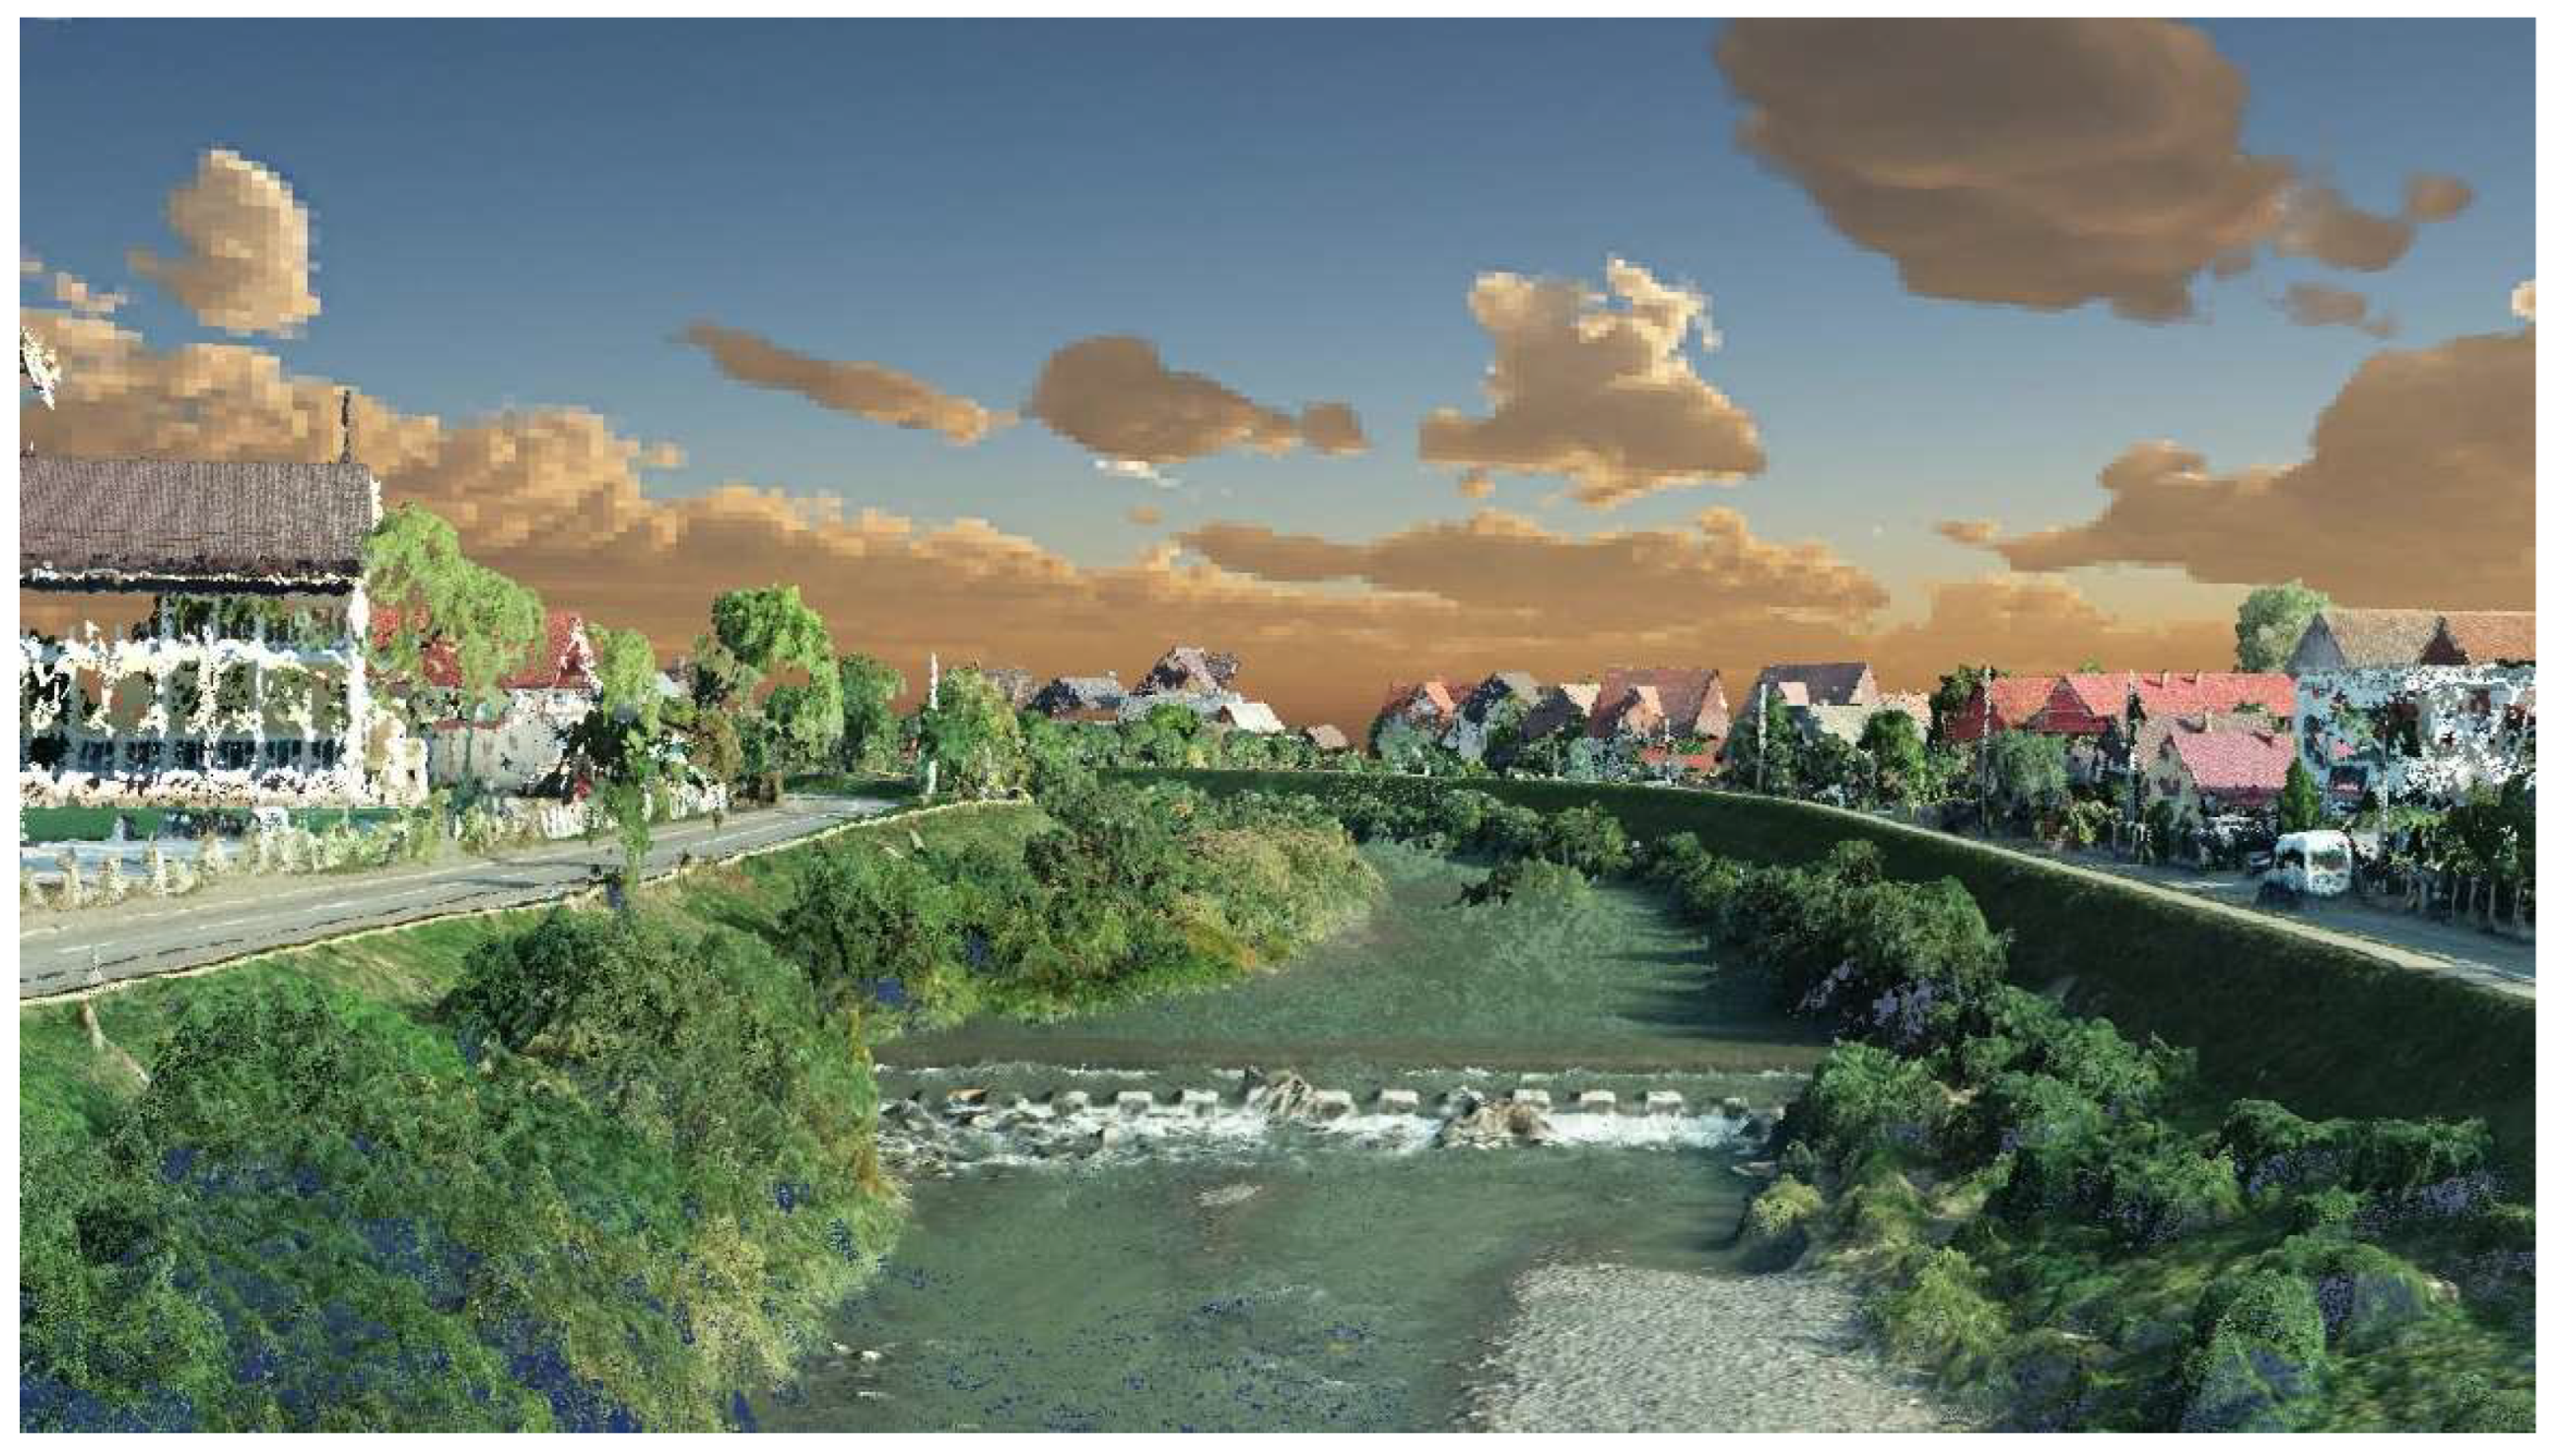
The processing of aerial images collected with the DJI Phantom 4 Pro v 2.0 professional drone was carried out using the Agisoft Metashape: Professional Edition v 1.7.1 program (64-bit), where GCPs (Ground Control Points) have been identified and marked in each image, manually, to achieve the most accurate georeferencing [26]. Five GCPs (Ground Control Points) were used for georeferencing images using the Rover GNSS South Galaxy G1equipment (Figure 3). Additionally, with the help of the drone, it was possible to create a 3D model of the area, due to the cloud of points obtained from the aerial images (Figure 4).
Considering the data obtained and their interpretation with the help of processing software, it was possible to identify a method or solution that can be promoted to restore the longitudinal connectivity of the river. To map the area studied, ArcGIS 10.6 software was used. The graphical representation of the existing situation and the identified solution was created with the help of AutoCAD Map 3D 2012 software. Based on the data obtained, hydraulic modeling was carried out. The purpose of hydraulic modeling was to identify the hydraulic parameters (water depth, water velocity, level) for the studied sector. In order to ensure that the hydrotechnical construction proposed by us is an alternative to the existing construction, two hydraulic models were carried out, for the existing hydrotechnical construction and for the hydrotechnical construction, identified by us as an alternative solution, which will facilitate the migration of fish and invertebrates upstream. The length of the analyzed section was 315 m.
Regarding the hydraulic modeling, the MIKE 11 software was used, which is an engineering software capable of simulating flow, sediment transport, and water quality in rivers. We managed to identify a method for reducing the height of the existing weir. The mathematical equations that form the basis of the modeling are the Saint Venant equations in the one-dimensional, two-dimensional, and three-dimensional systems.
In the one-dimensional system they are:
The continuity Equation (1) [27]:
The momentum Equation (2) is [27]:
where: the integrated cross-sectional area is called A and the integrated discharge Q, b is the full width of the channel, t is the time, x is the positive axis of water flow, g is the gravitational acceleration, and q is lateral inflow per unit width, in to these equations leads to the basic equations used in MIKE 11 [27]:
The modeling in the two hypotheses was carried out for three flows measured in the transverse profile of the riverbed at the Bistrita hydrometric station and was calculated by the Bistrita Hydrological Station:
- Q = 3.56 m3/s represents the summer flow recorded in June 2022, a period with a significant precipitation deficit;
- Q = 8.37 m3/s is the average annual flow calculated for the year 2021;
- Q = 128 m3/s represents an extreme flood flow recorded in 2020, this being one of the maximum flows recorded in the last 10 years on the Bistrita river [23].
The results were displayed using the Mike View program. The modeling is of the 1D type, so the results were displayed both as a graphic form in a longitudinal profile or a cross-section, such as the water level, but also in tabular forms, such as, for example, the depth of the water, but also other parameters that interest us, the speed of the water in different sections. After creating the two hydraulic models, the results were compared between the current situation and the proposed one.
What would this solution to restore the longitudinal connectivity of the aquatic ecosystem imply? For starters, the proposed construction will be built downstream to upstream; that is, towards the location of the weir. In the first part, three weirs with a foundation in thalweg of 1 m will be built and they will have a maximum height of 0.3 m to the thalweg elevation.
The distance between the three weirs is 1.5 times the width of the riverbed in the analyzed section. From the topographic measurements taken in the field (transverse and longitudinal profiles) we have identified that the average width of the minor riverbed in the studied section is 29 m., so the distance between the thresholds will be 43.5 m. Subsequently, downstream of the bed check weirs, large stones will be placed below to reduce the risk of under-wash, causing instability to the structures. After the completion of the bed check weirs, the partial demolition works of the existing weir will begin (Figure 5).
The original weir extends over a width of 13.21 m, with a total height of 1.54 m. Upstream of it, there is an accumulation of alluvial material of approximately 879.7 m3. In order not to affect the population of fish and other living things in the aquatic environment, large bags filled with earth will be installed downstream to stop the alluvium produced during the partial demolition works. The partial demolition works refer to the reduction in the height of the weir. The weir will be reduced by 1.04 m, reaching a maximum height of 0.4 m. Thus, this weir becomes the fourth weir of low height. Downstream of the new hydrotechnical construction, large stones will be placed, just like at the three weirs of low height downstream.
In order to prevent possible bank erosion that would endanger the dykes that defend against floods in the immediate vicinity of weir number 4, it was proposed the arrangement with large stones and install rolls with broken stone and living material on the banks.
The technical solution proposed by us is not 100% environmentally friendly, that is, a green one, but we can consider it a green-gray one that helps to reconnect the ecosystem upstream and downstream of the weir.
3. Results
Table 1 shows the mileage of the main sections of the hydrodynamic model. The existing weir consists of several sections starting from P5 to P9. Section P6 represents the crest of the dam which also has the highest elevation, and as such, only section P6 has been included in the table as the most representative.
As previously mentioned, the modeling was performed for three flows that have the values Q = 3.56 m3/s, which represents the summer flow recorded in June 2022, Q = 8.37 m3/s is the average annual flow calculated for the year 2021, and Q = 128 m3/s represents an extreme flood flow recorded in 2020, this being one of the maximum flows recorded in the last 10 years on the Bistrita river [23], both for the case where we have only one weir, the existing one, and for the proposed case with the lowering of the crest of the existing weir and the construction of three new weirs of low height downstream of it.
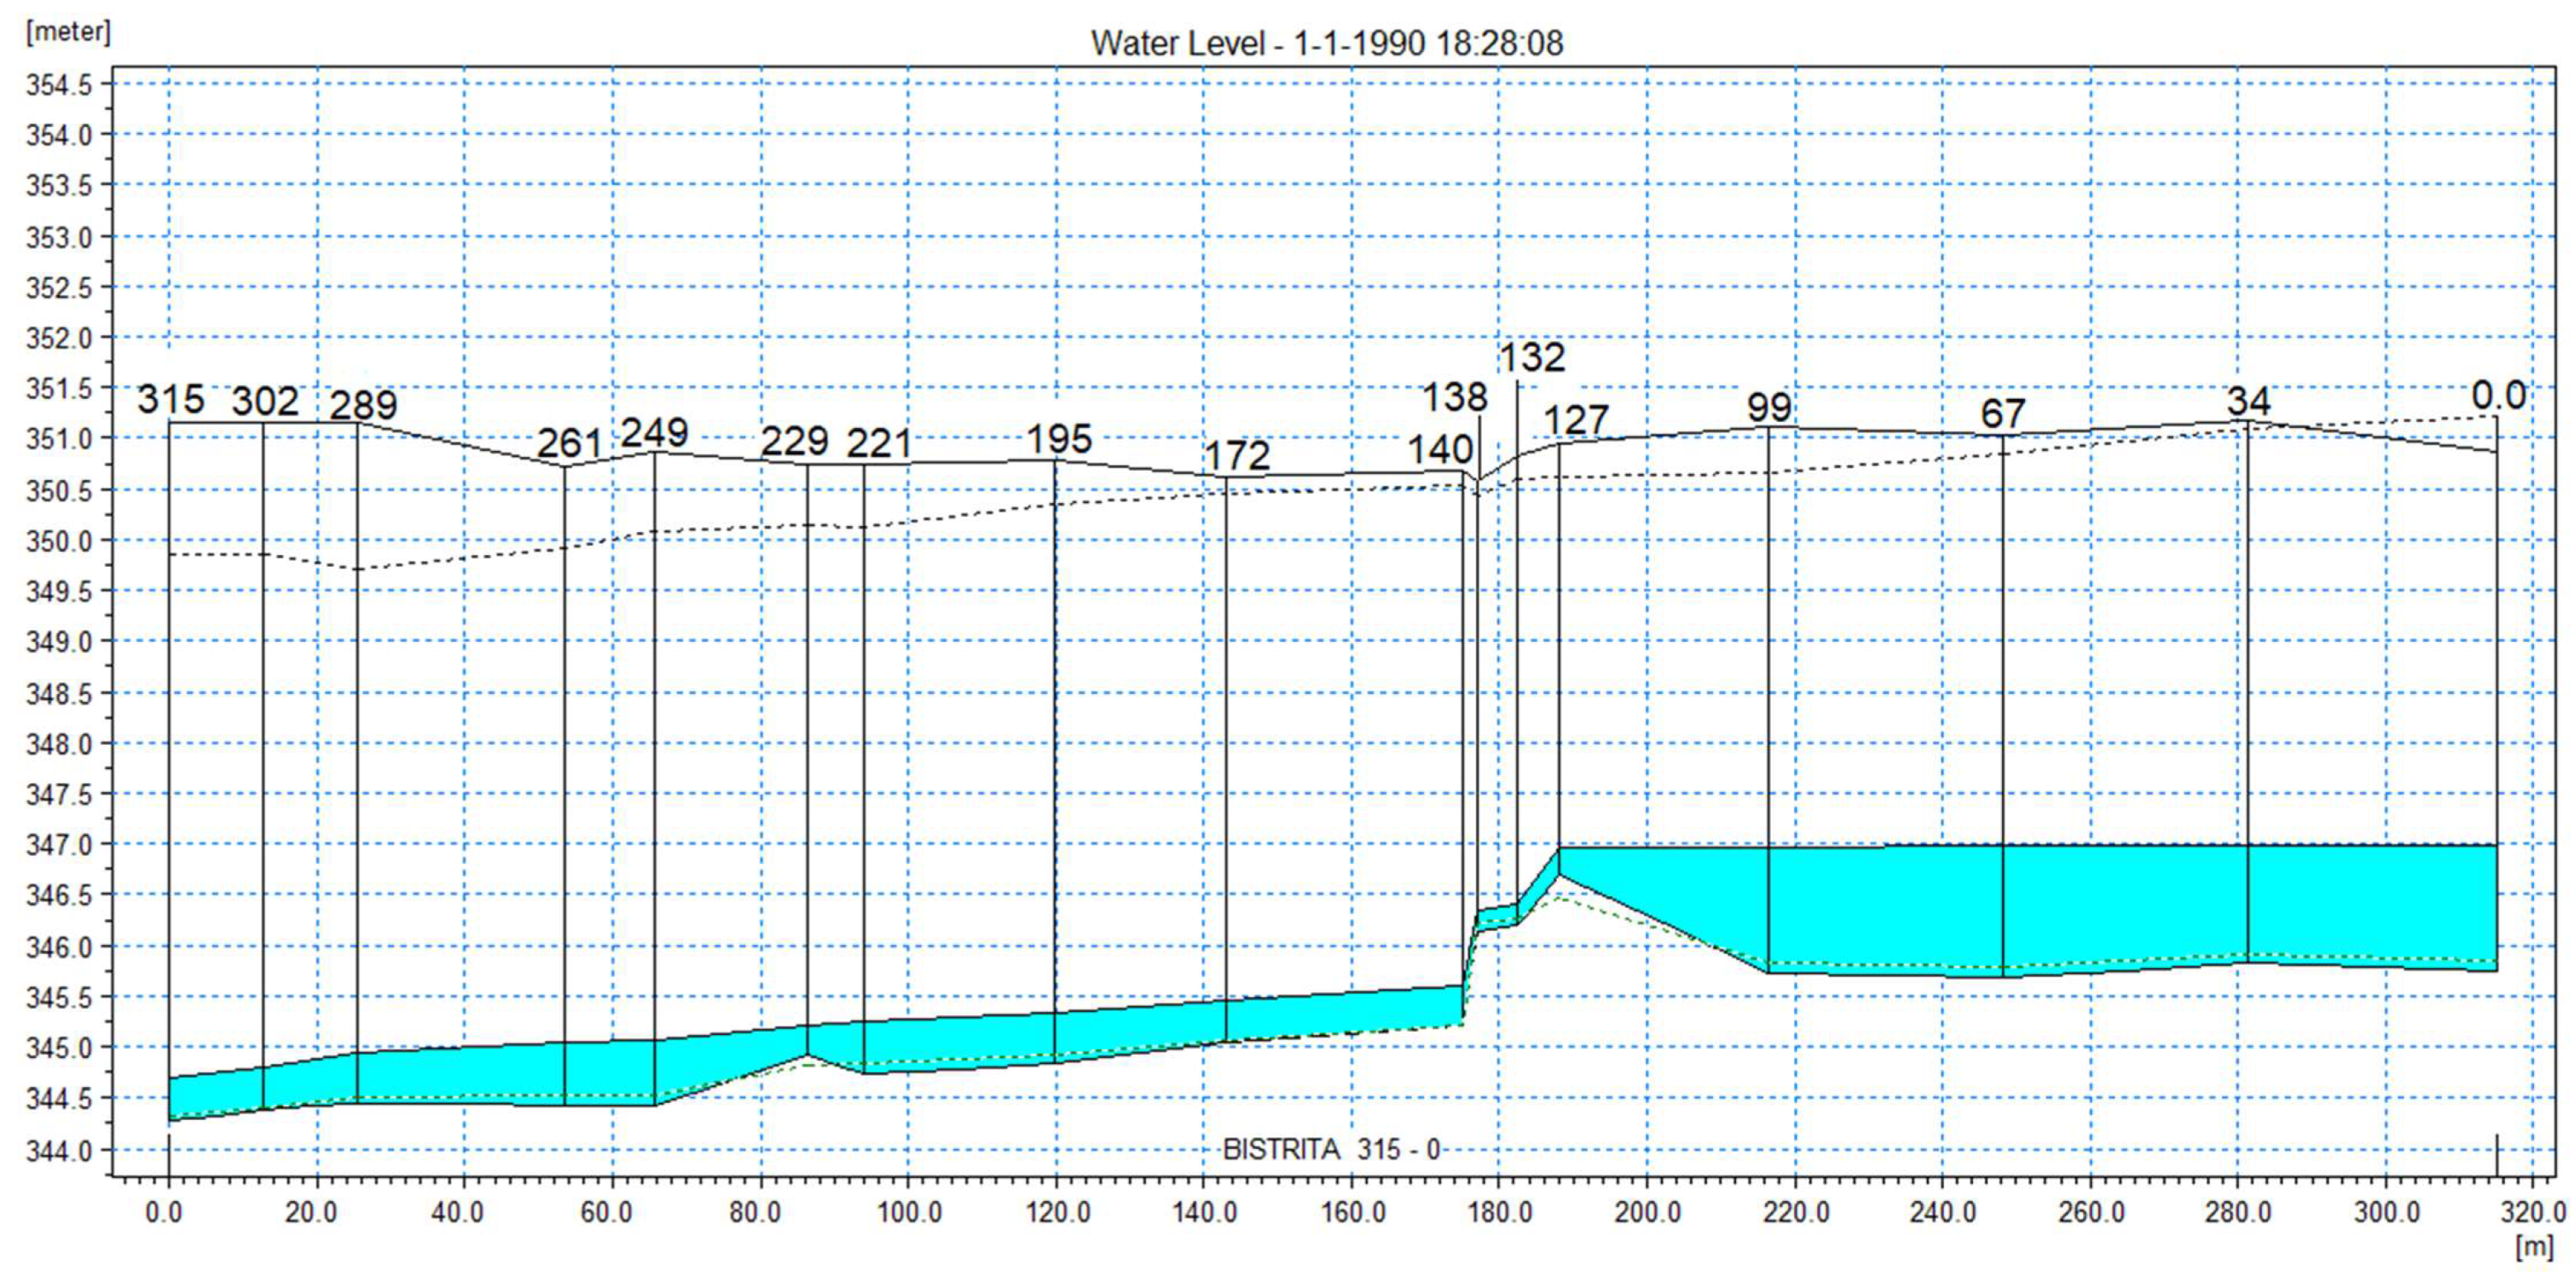
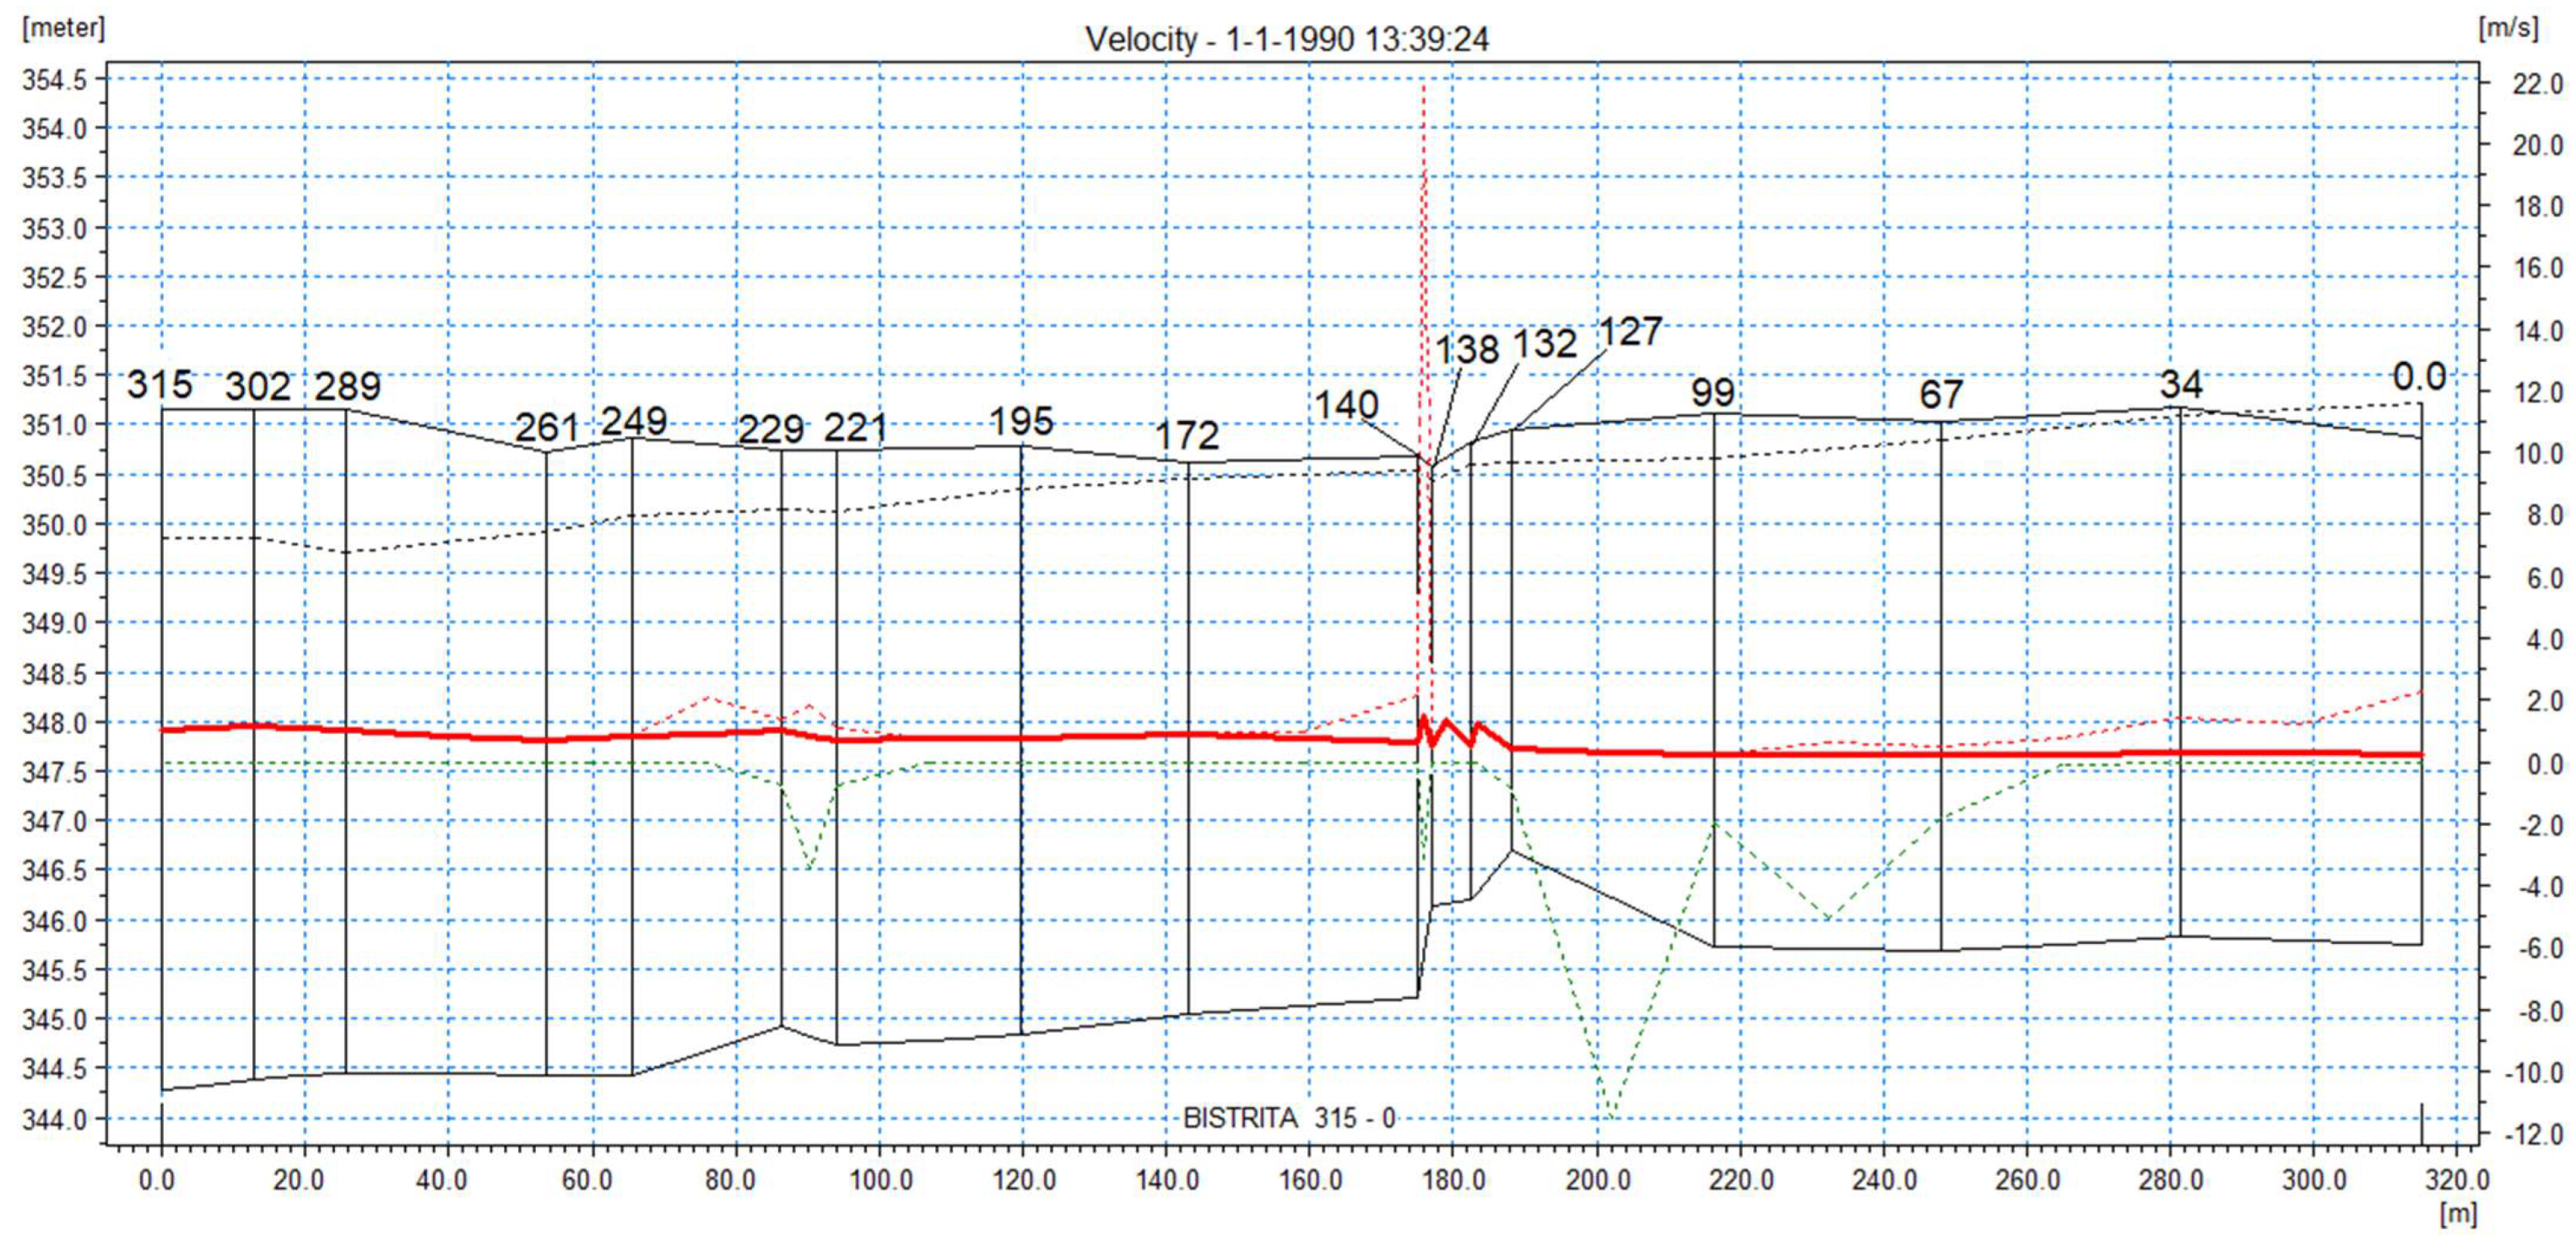
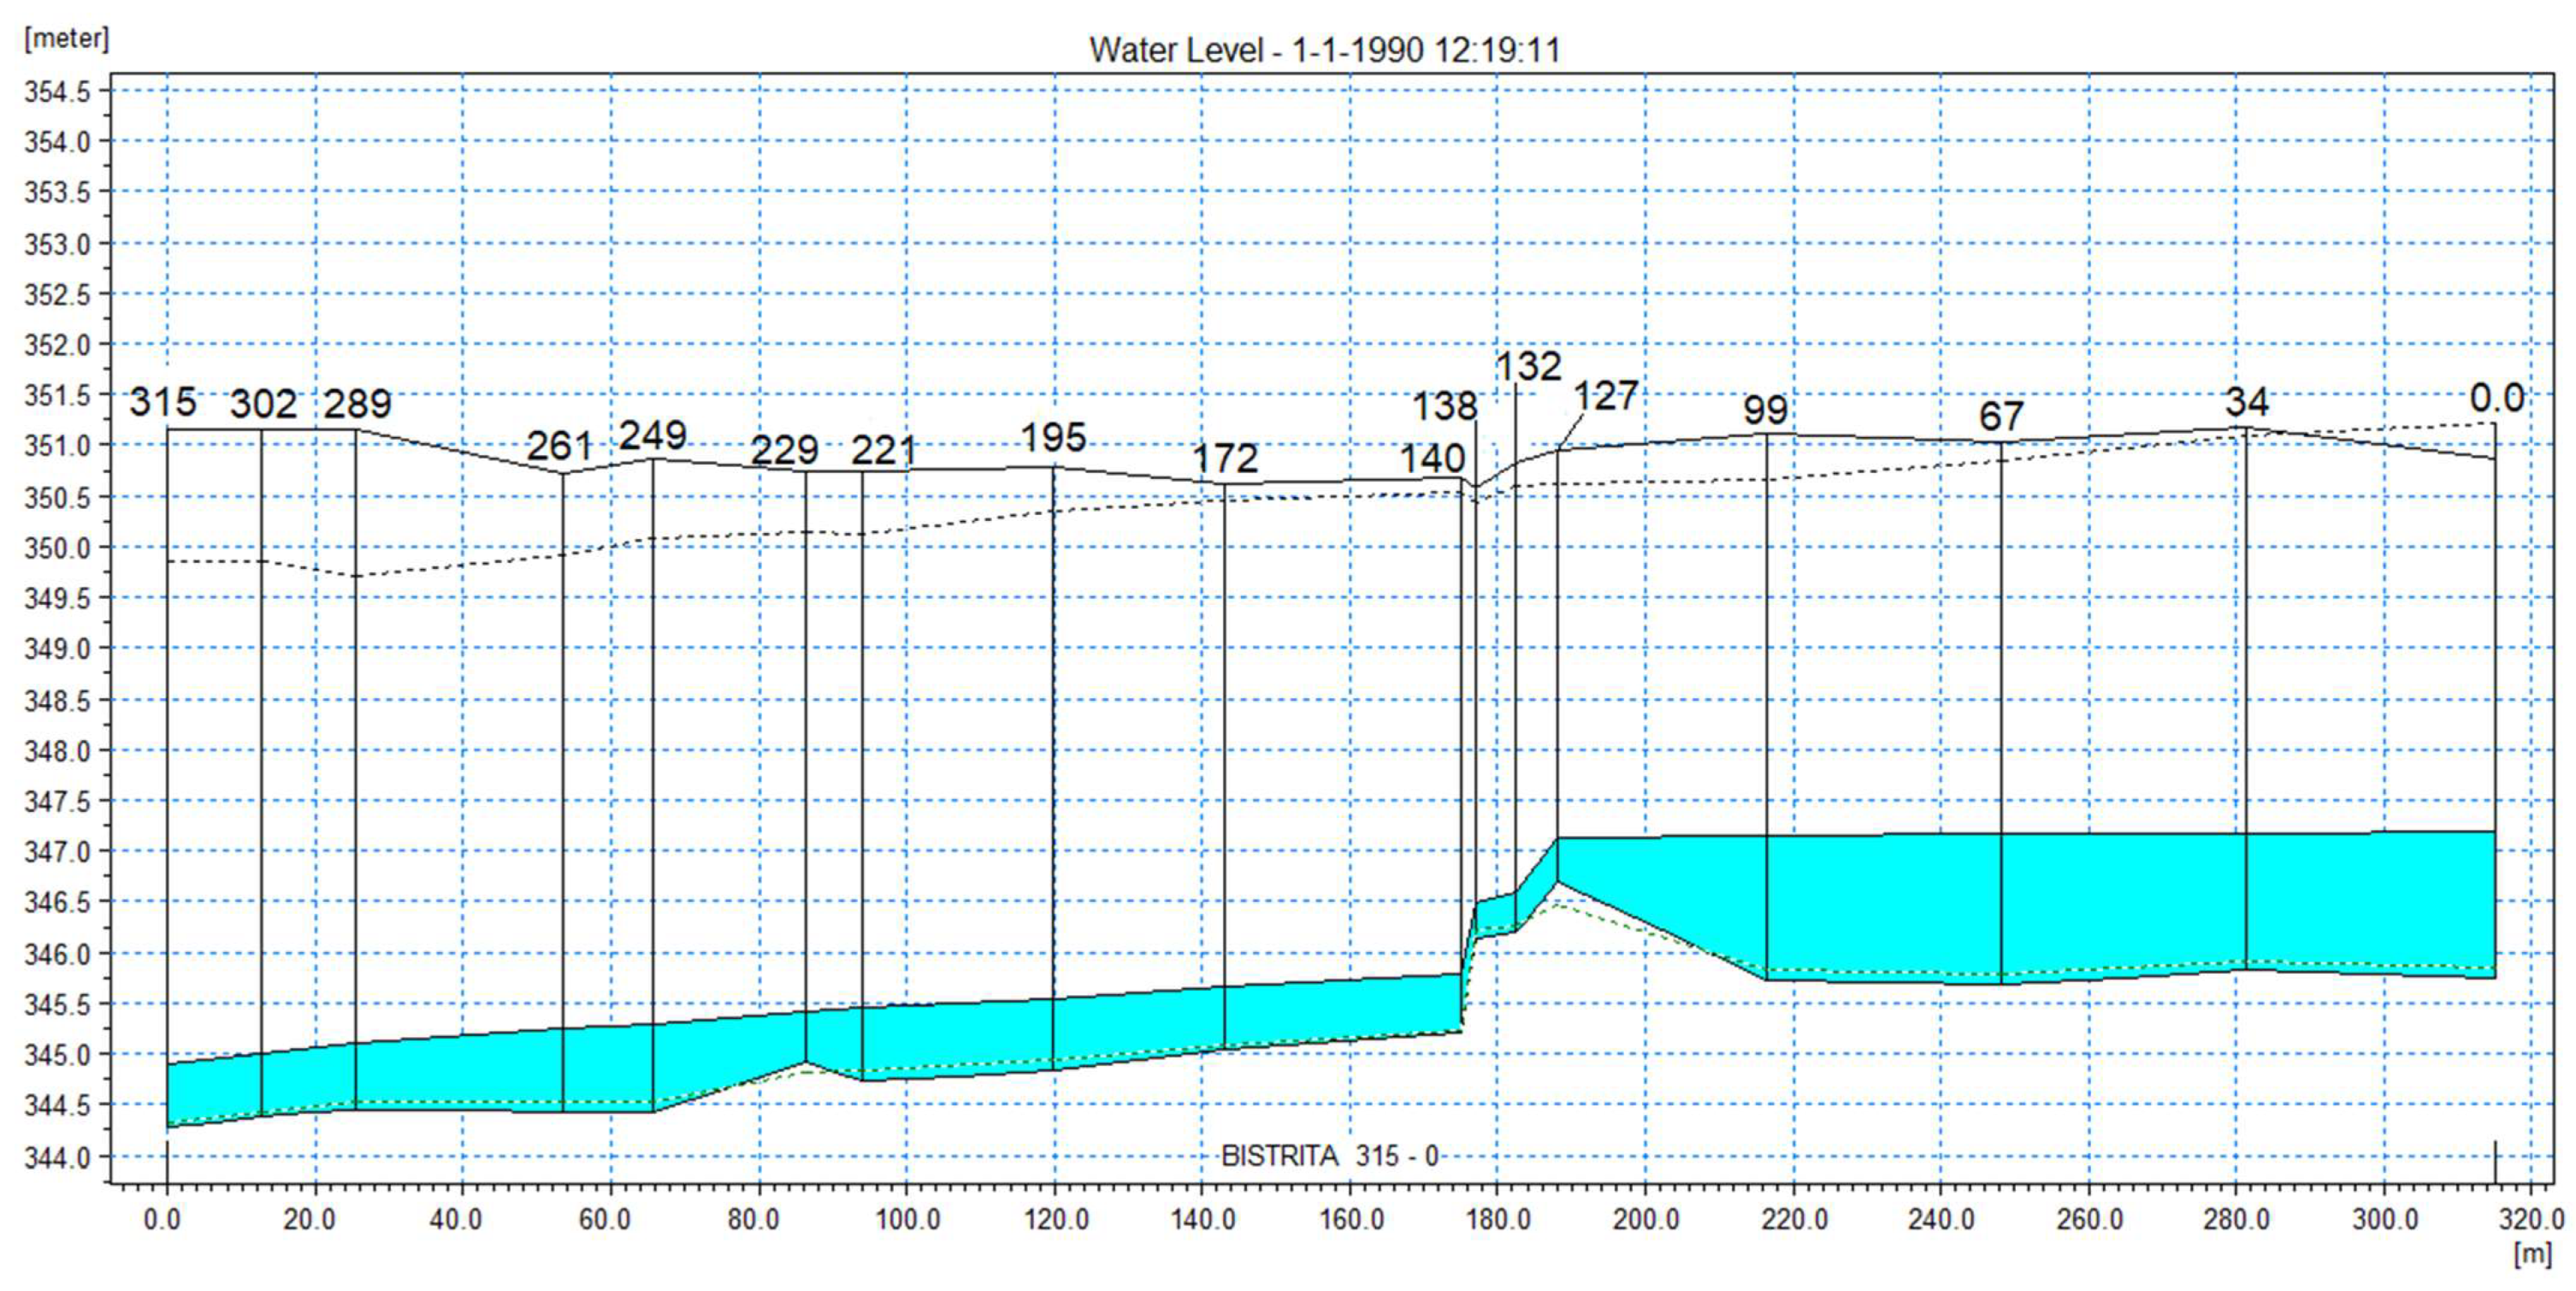
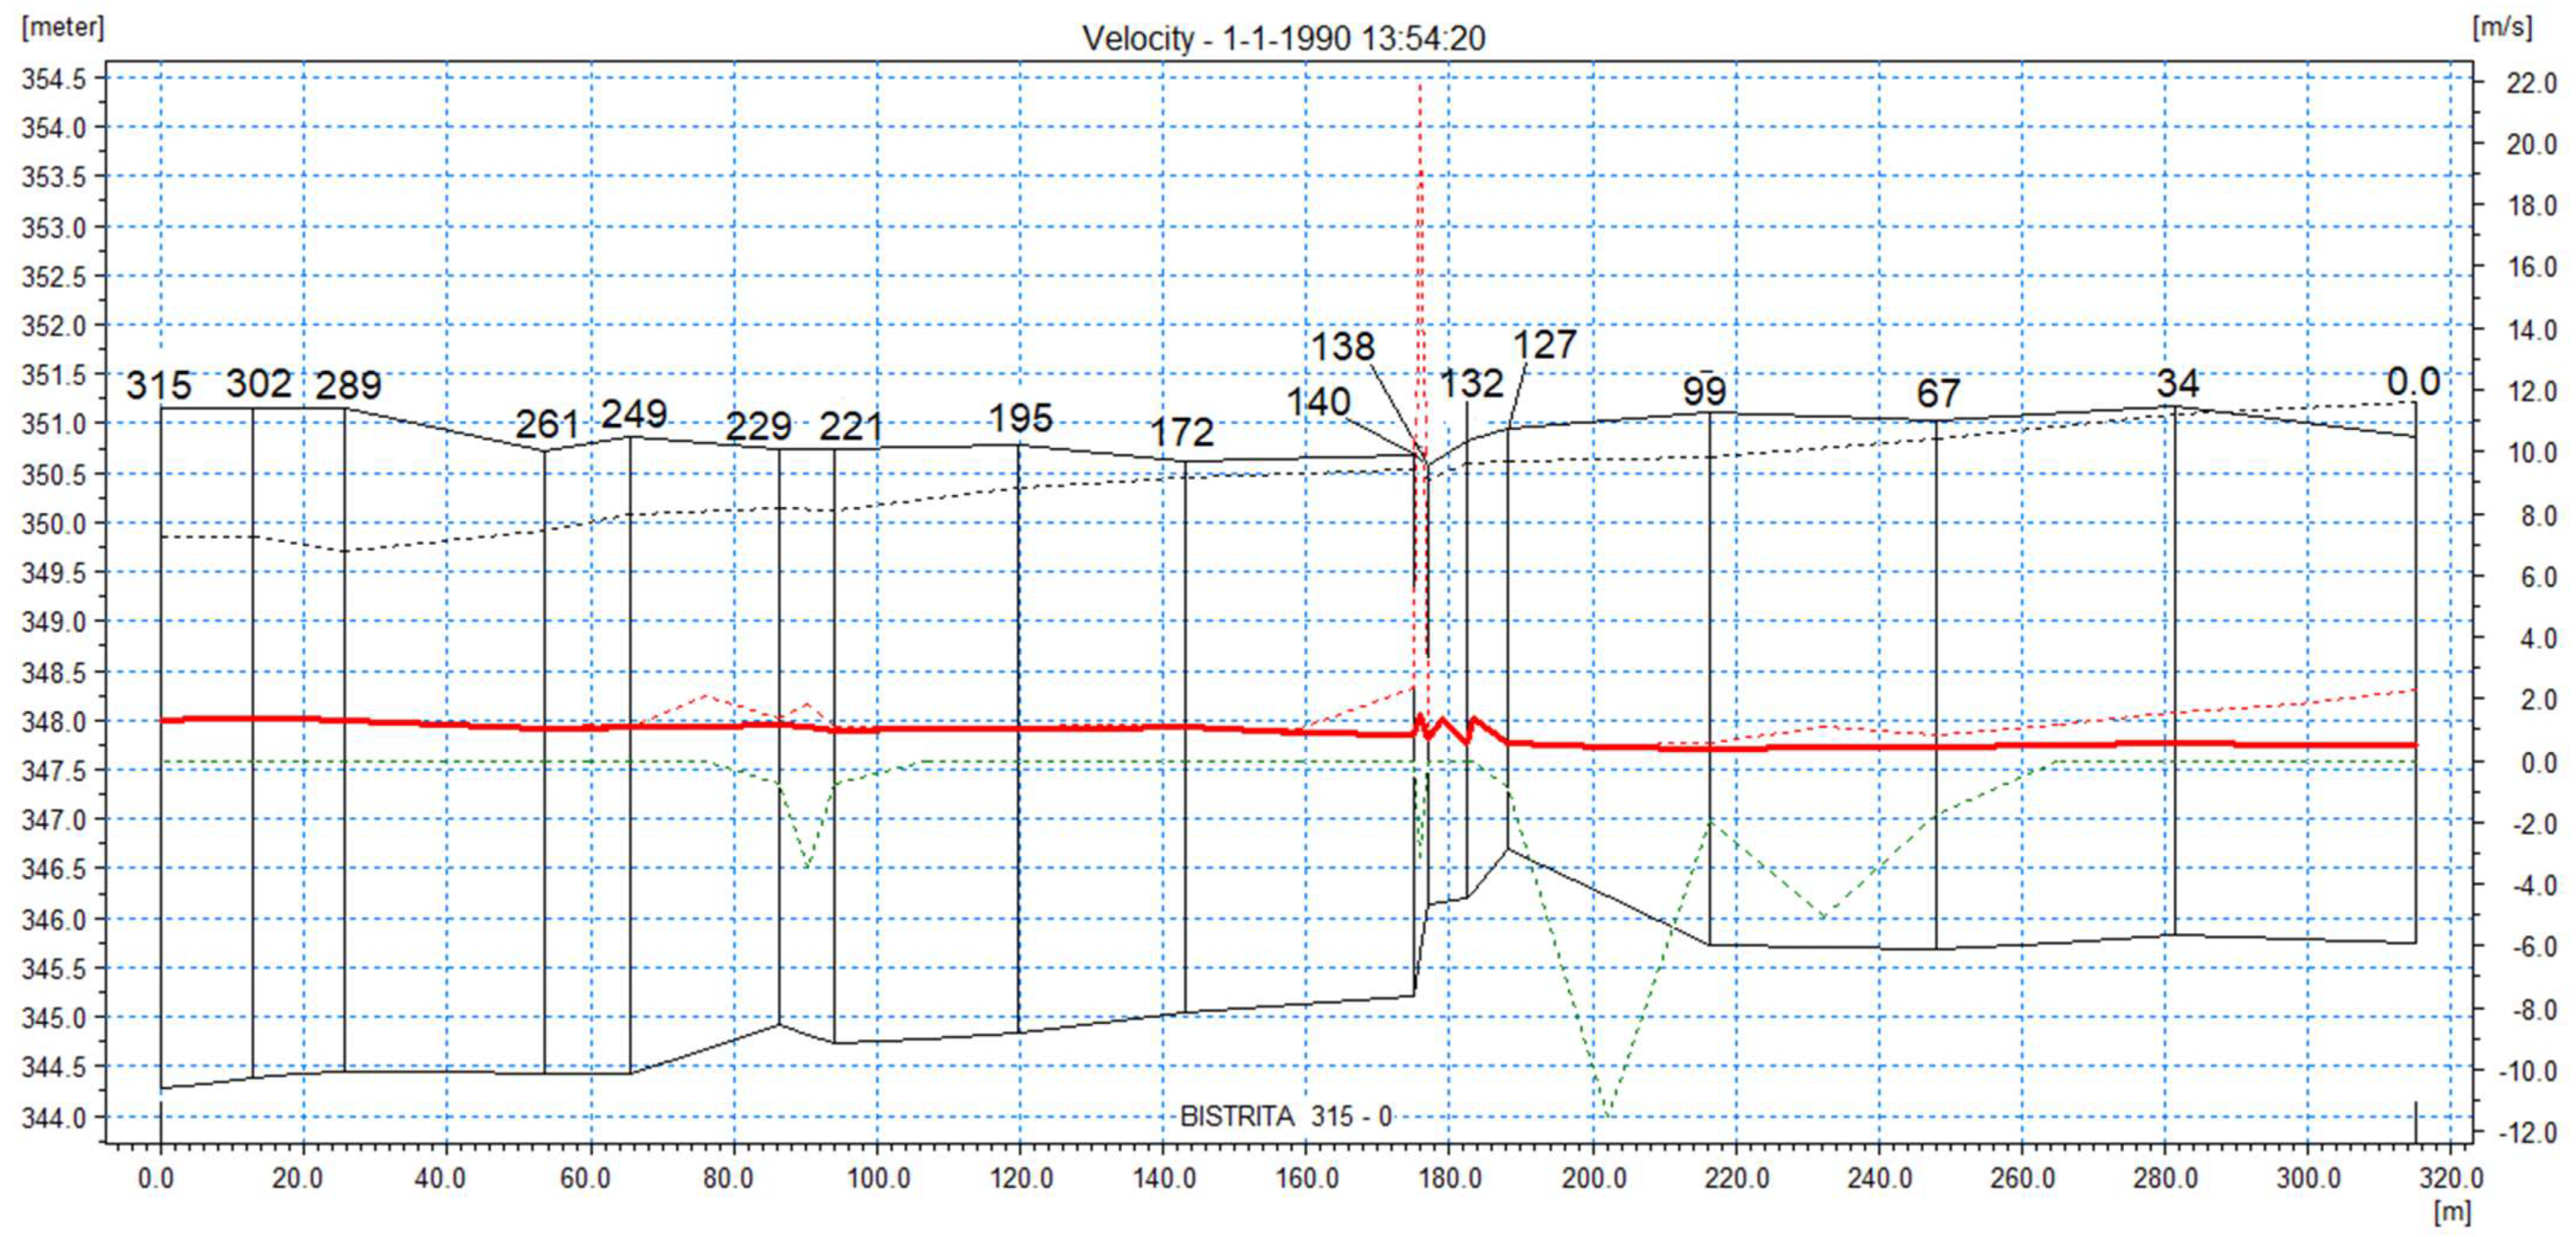
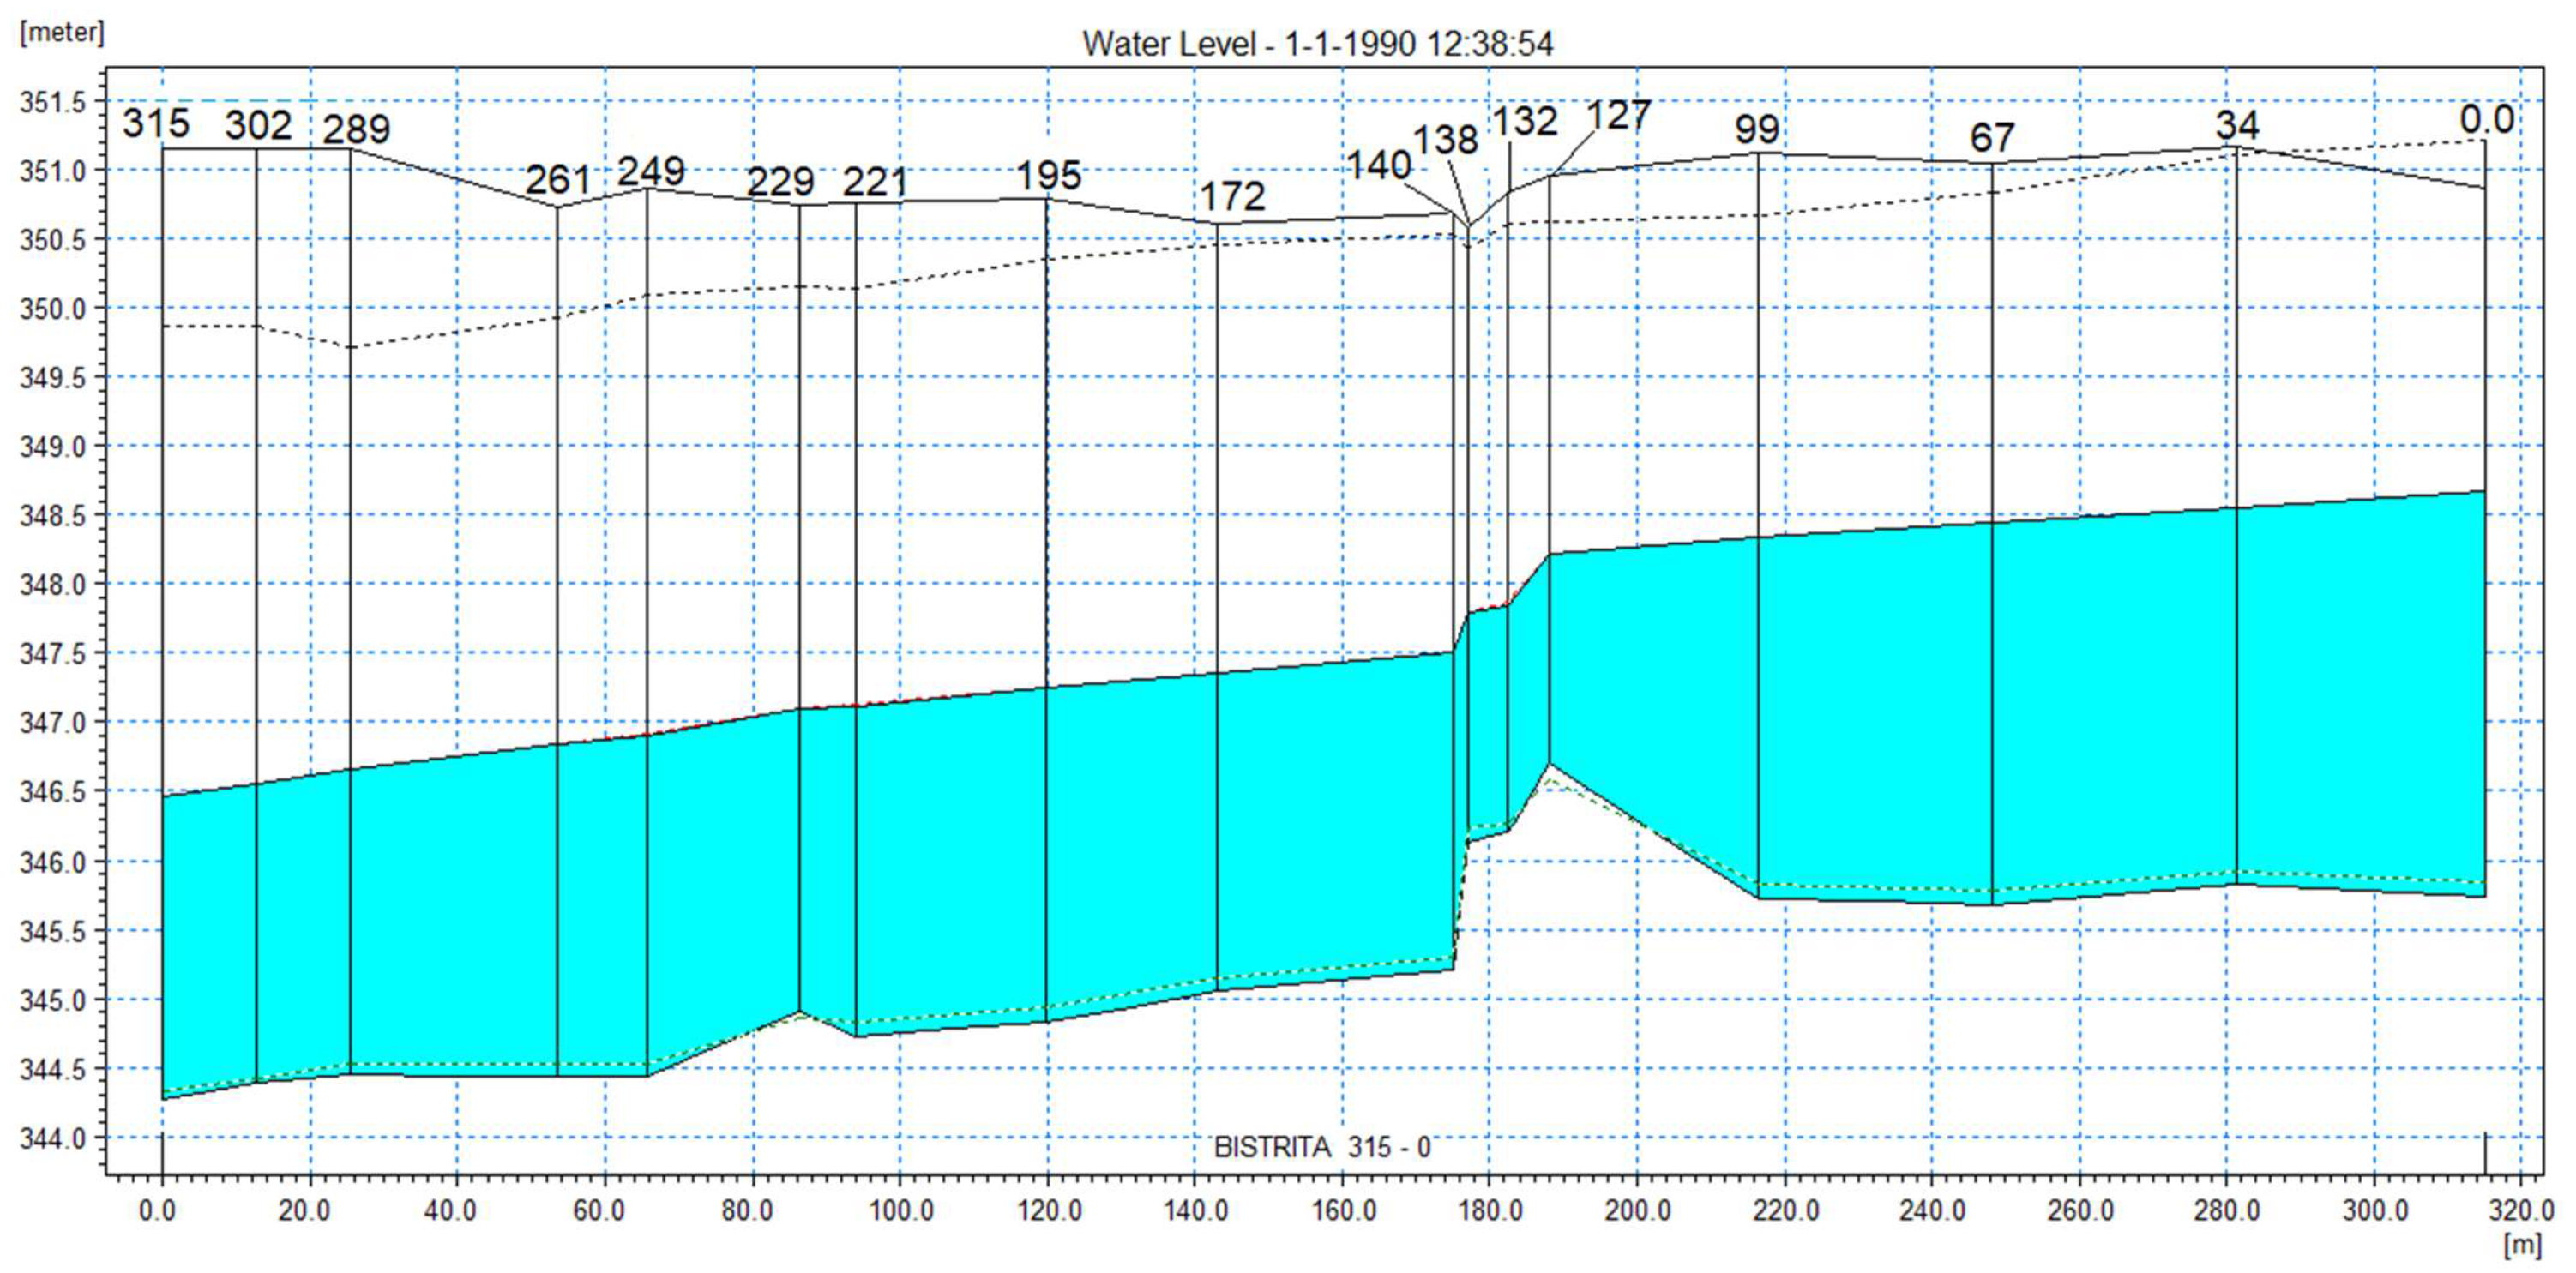
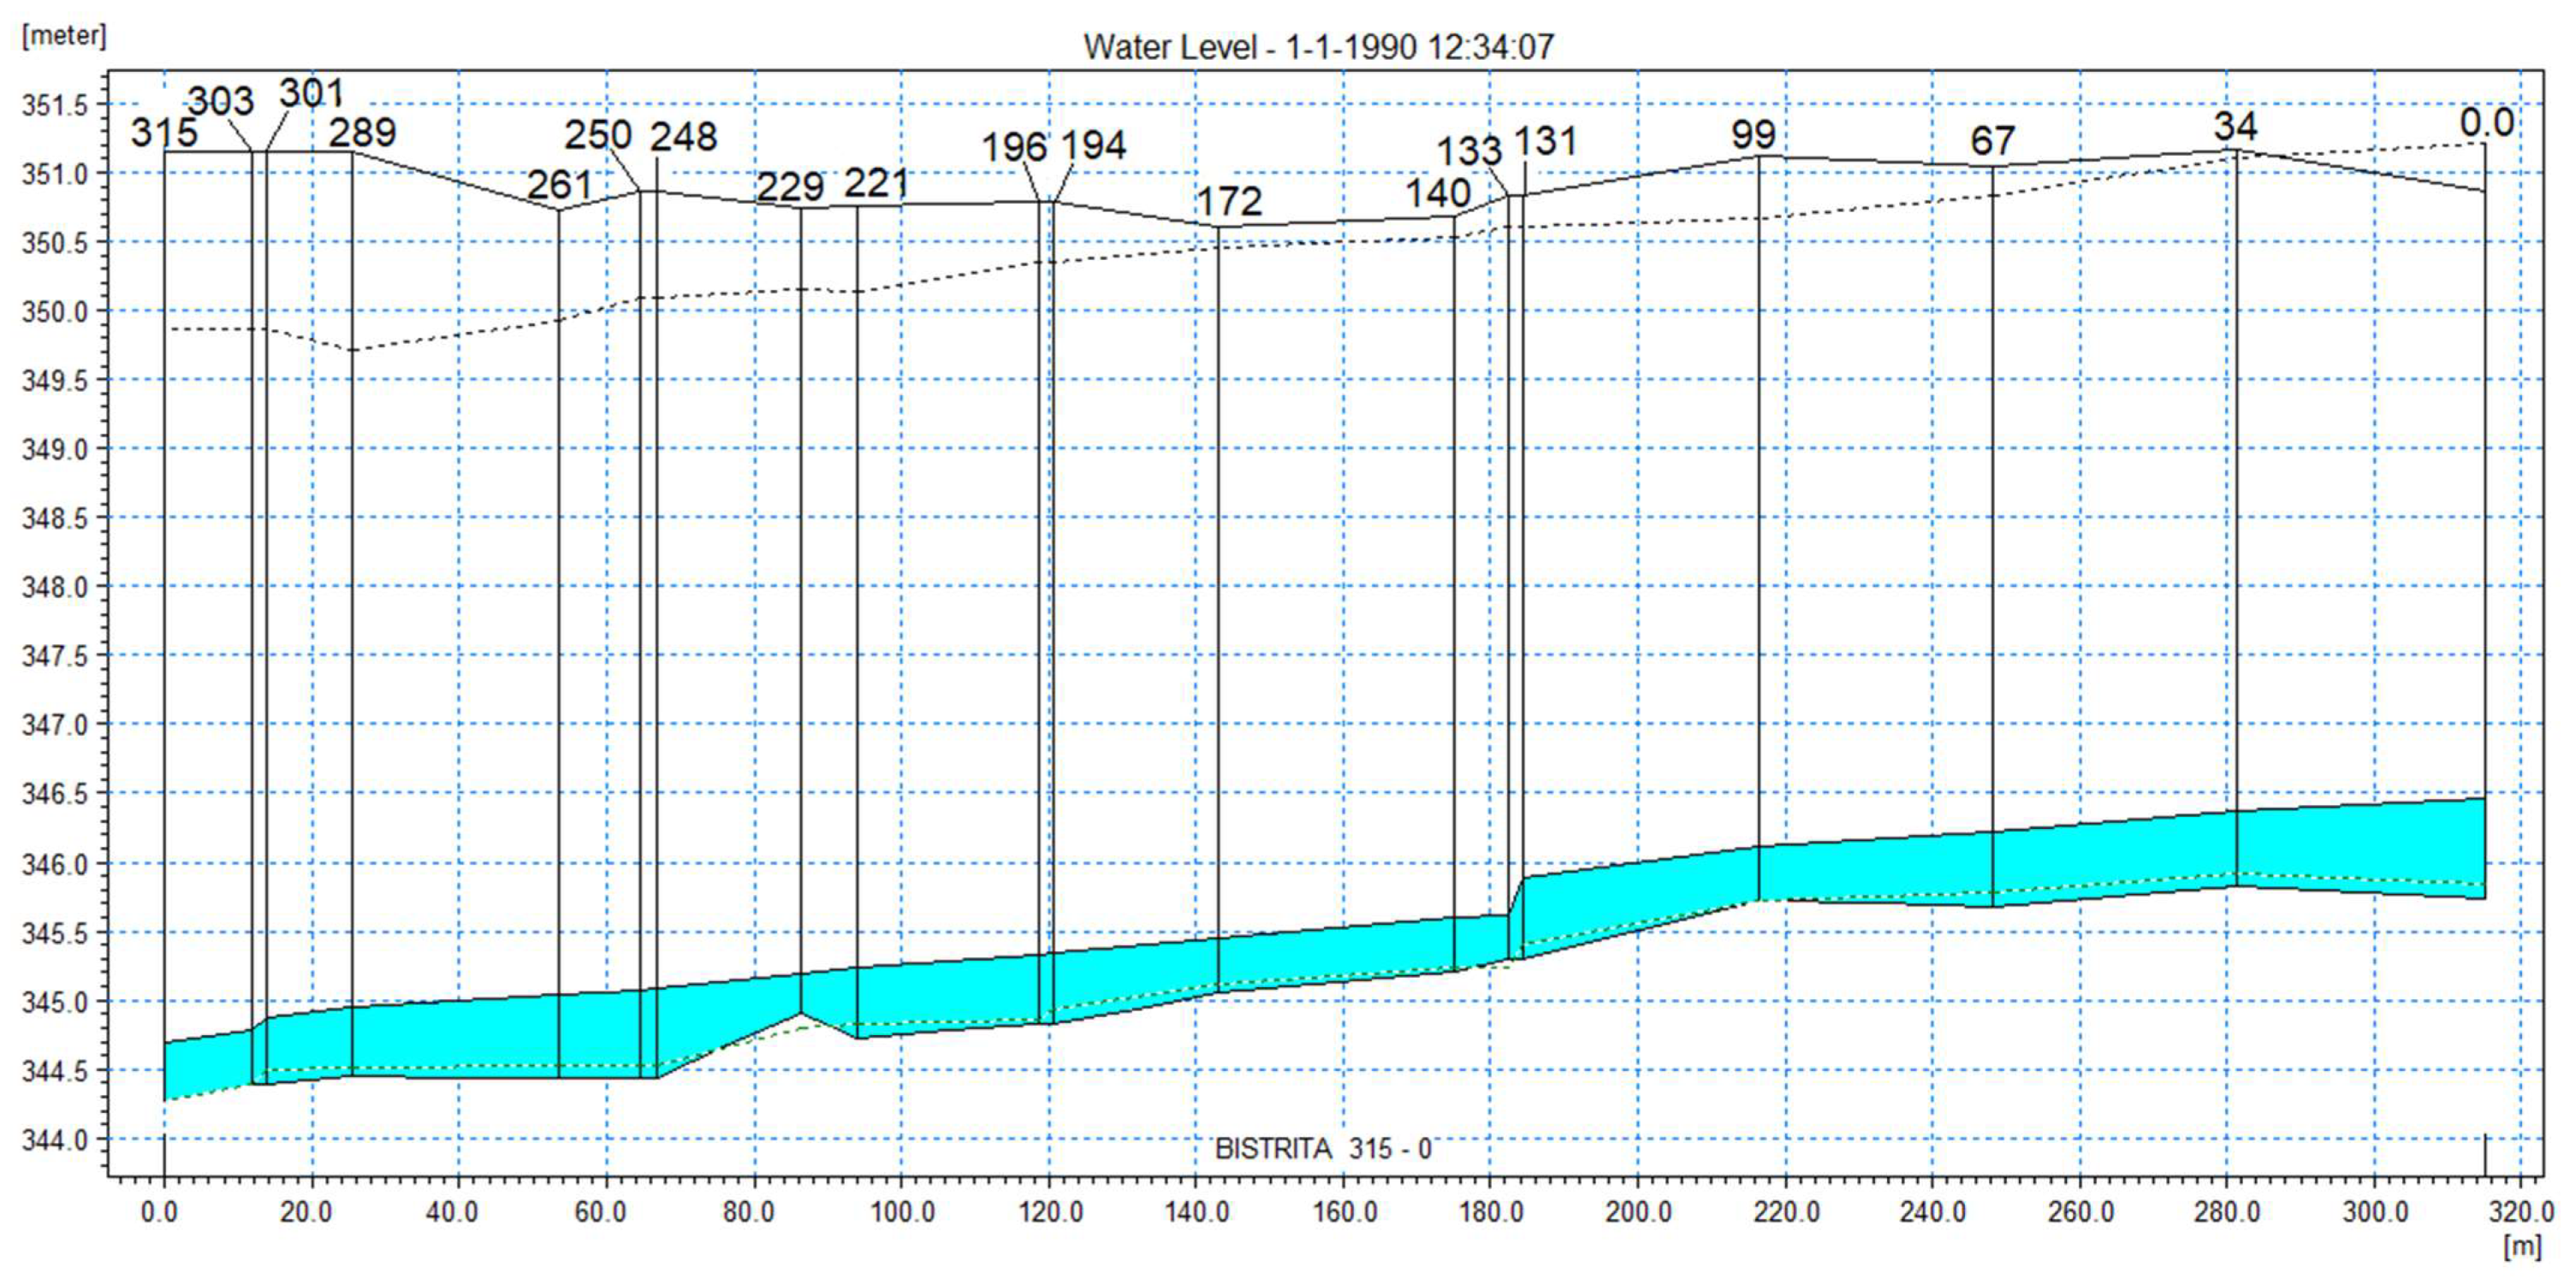
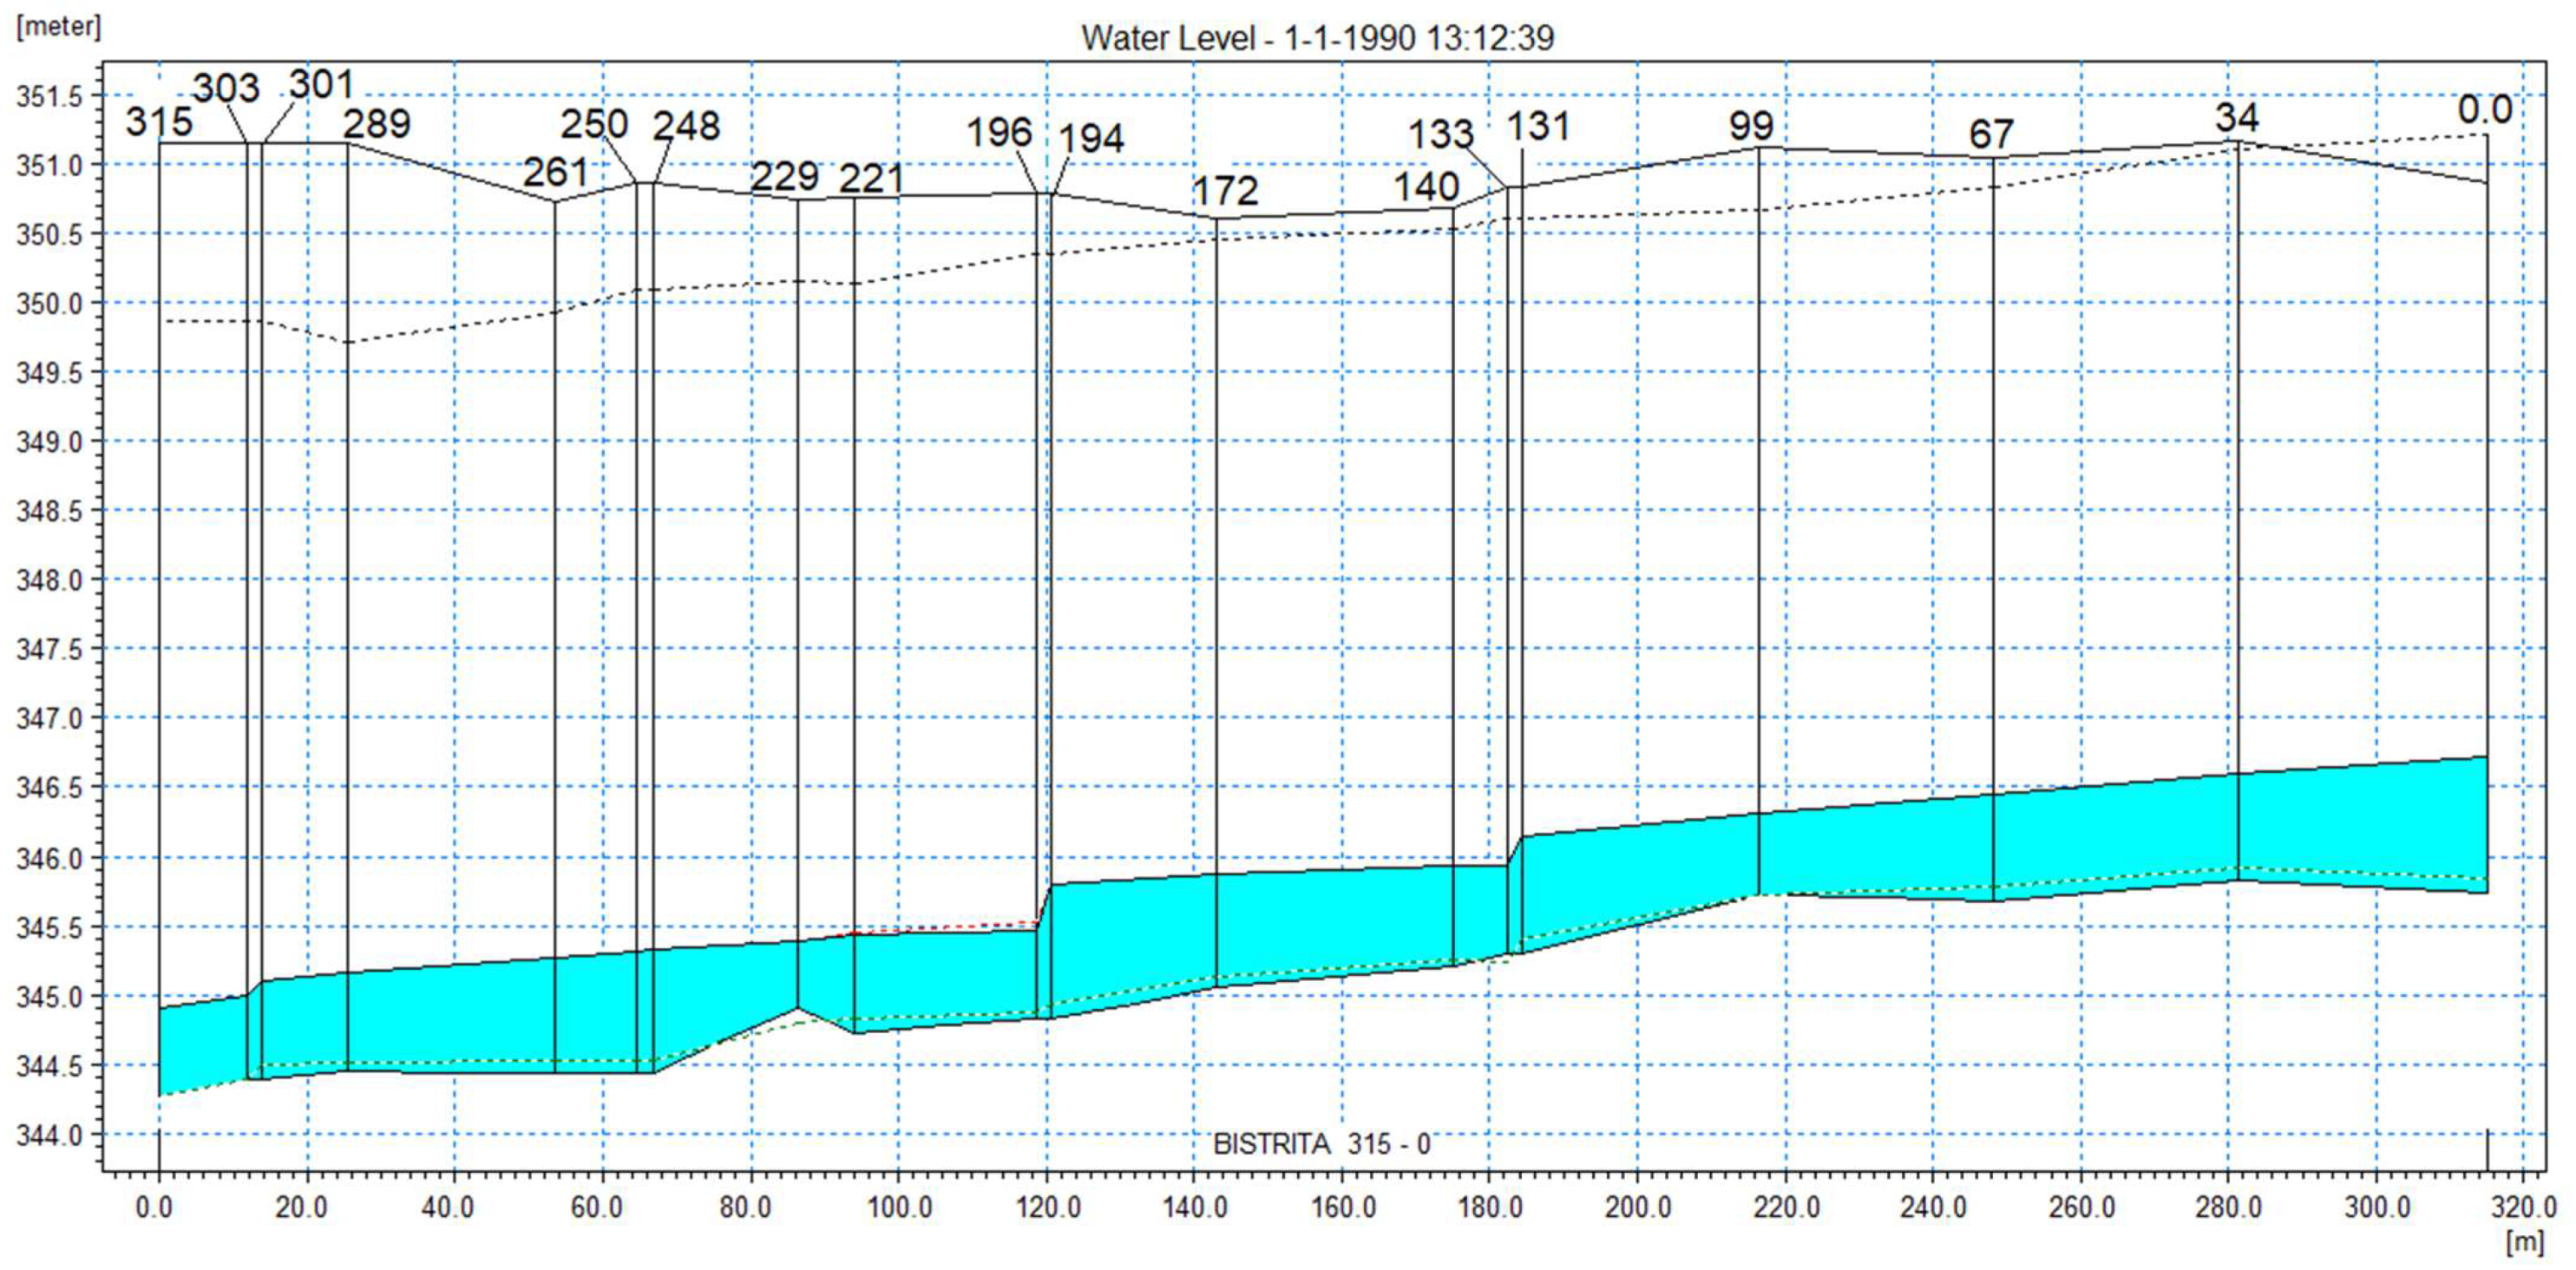
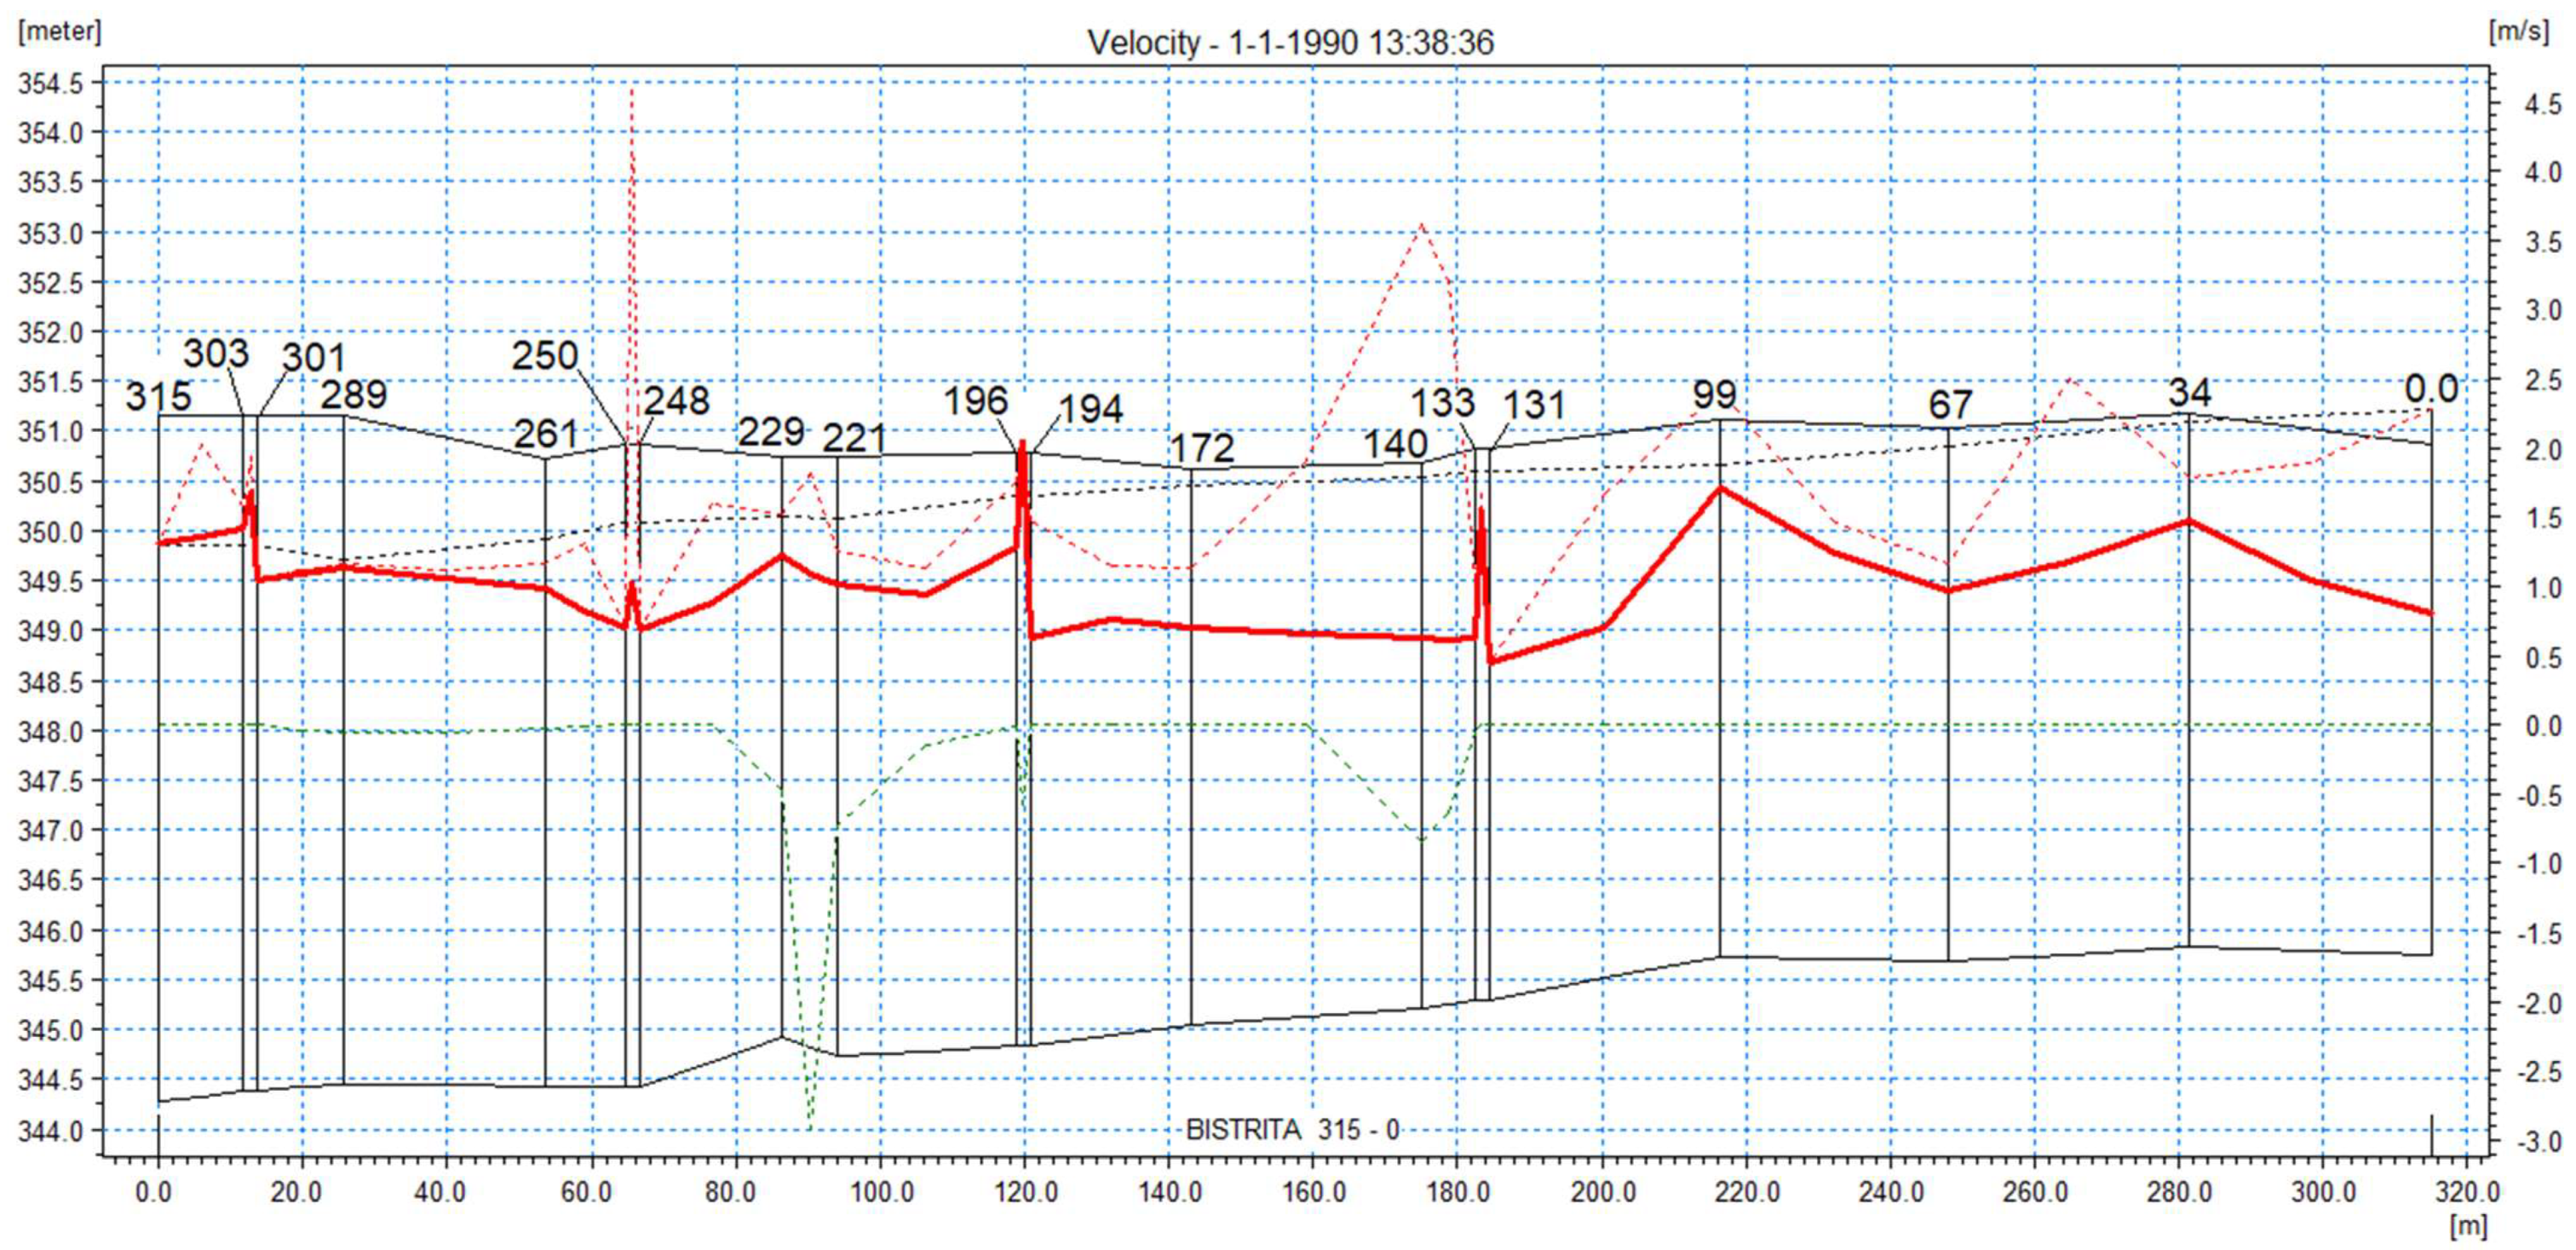
The dotted or continuous lines that can be found in the graphs of both studied cases have the following meanings:
- -
- the black solid line from the top represents the right bank of the river
- -
- the dotted black line represents the left bank of the river
- -
- the black solid line from the bottom represents the shape of the thalweg
- -
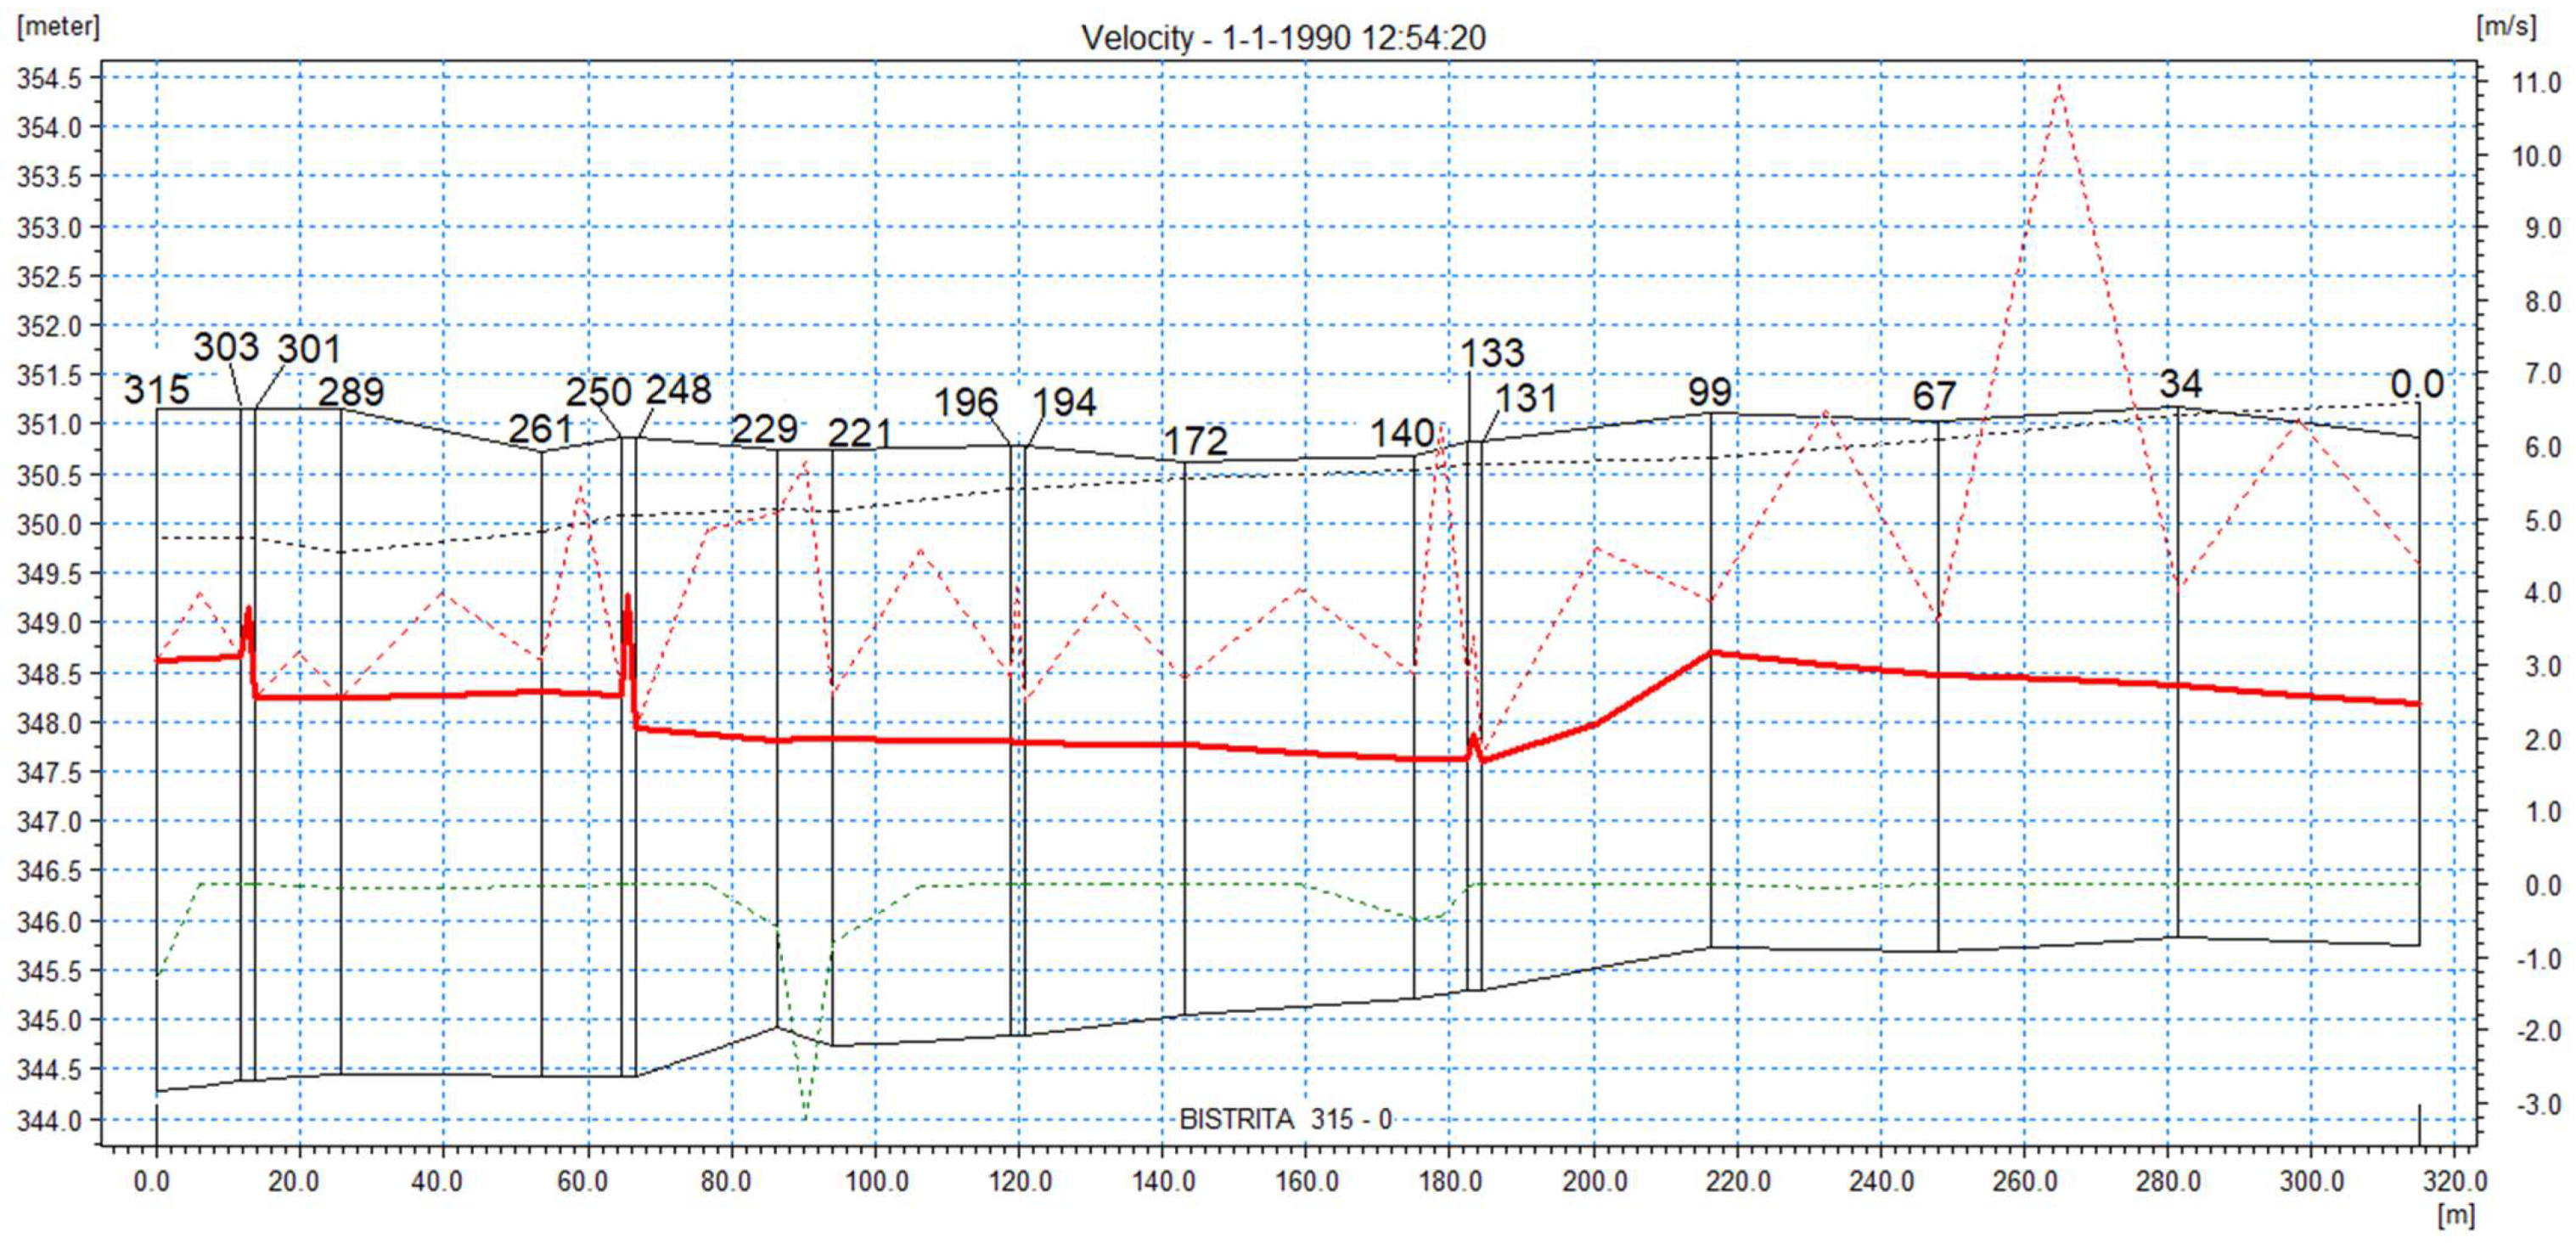
- the red solid line represents the actual water velocities in the section after the flood has stabilized
- -
- the red dotted line represents the maximum speed in the section, the first moment of the flood (the program performs the hydraulic modeling with the dry riverbed)
- -
- the green dashed line represents the minimum speed of the flood.
3.1. Hydraulic Modeling on the Bistrita River, for the Case Where There Is Only One Weir, the Existing One
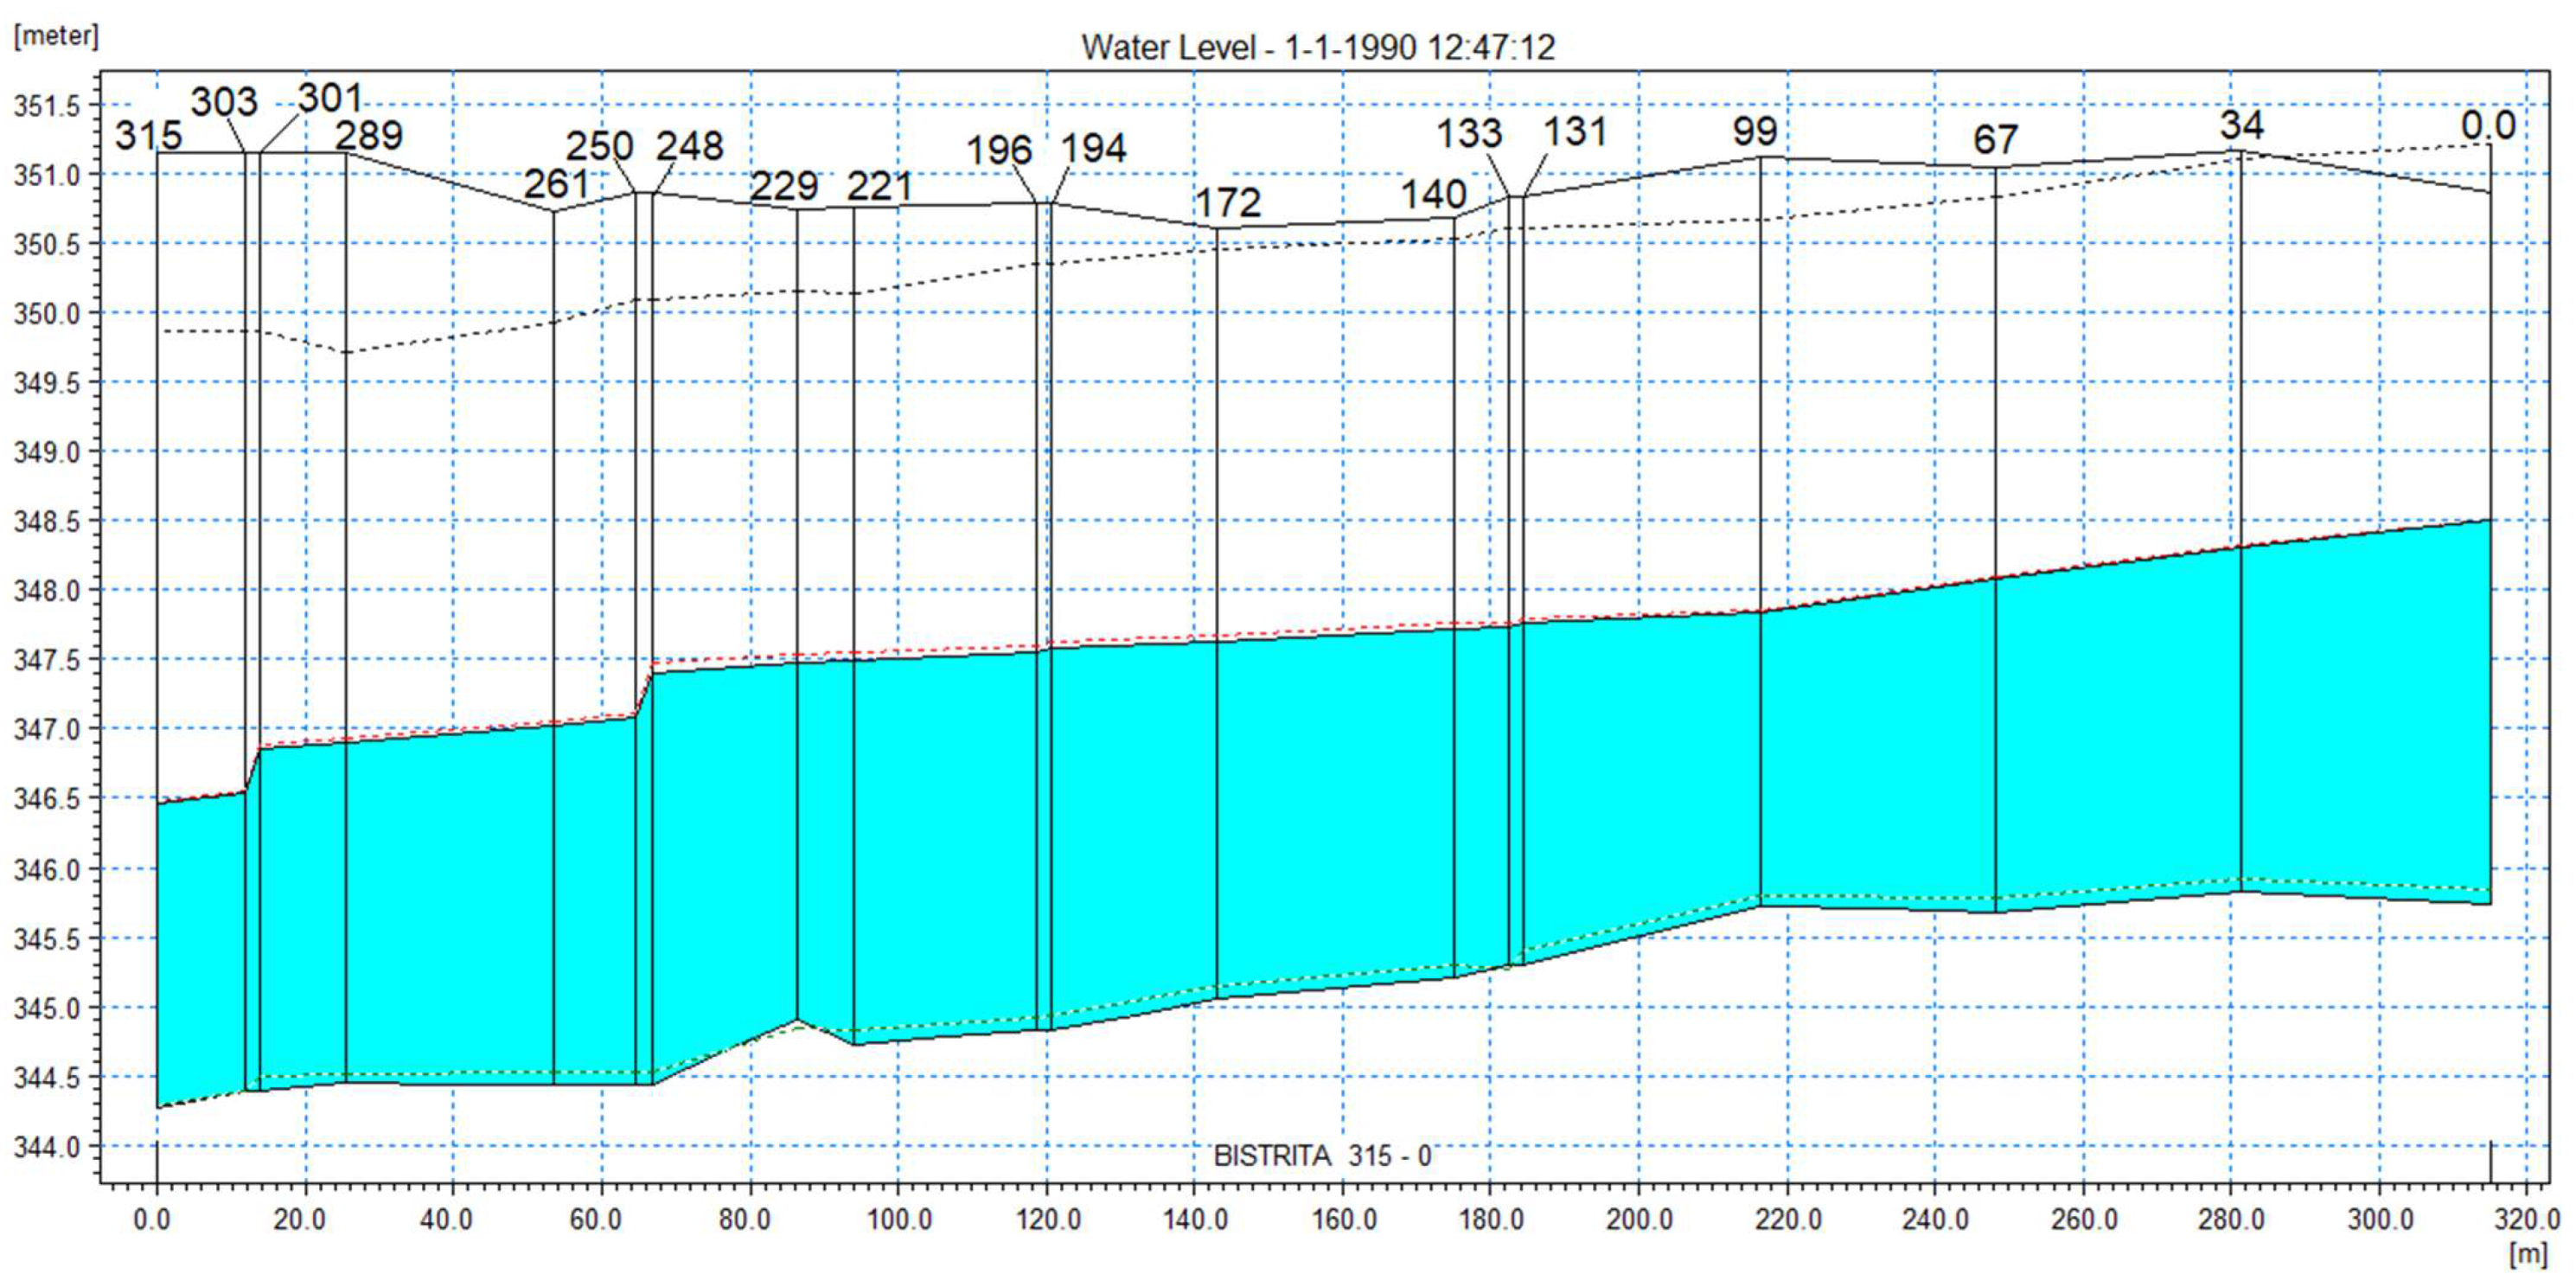
In Figure 6, there is the water level in the longitudinal profile for the flow Q = 3.56 m3/s.
In Figure 7, there is the speed of the water in the longitudinal profile for Q = 3.56 m3/s.
In Figure 8, there is the water level in the longitudinal profile for the flow Q = 8.37 m3/s.
In Figure 9, there is the speed of the water in the longitudinal profile for Q = 8.37 m3/s
In Figure 10, there is the water level in the longitudinal profile for the flow Q = 128 m3/s.
In Figure 11, there is the speed of water in the longitudinal profile for Q = 128 m3/s.
In Table 2, you can see the depth and speed of the water in the considered sections for the three simulated flows in the hypothetic present situation with the existing weir.
3.2. Hydraulic Modeling on the Bistrita River for the Proposed Case with the Lowering of the Crest of the Existing Weir and the Construction of Three New Weirs of Low Height Downstream of it
In Figure 12, there is the water level in the longitudinal profile for the flow Q = 3.56 m3/s.
In Figure 13, there is the speed of water in the longitudinal profile for Q = 3.56 m3/s.
In Figure 14, there is the water level in the longitudinal profile for the flow Q = 8.37 m3/s.
In Figure 15, there is the speed of water in the longitudinal profile for Q = 8.37 m3/s.
In Figure 16, there is the water level in the longitudinal profile for the flow Q = 128 m3/s.
In Figure 17, there is the speed of water in the longitudinal profile for Q = 128 m3/s
In Table 3, you can see the depth and speed of the water in the sections taken into account for the three flows simulated in the hypothesis with the construction of the three new weirs of low height and the reduction in the height of the existing one.
4. Discussion
Analyzing the results for the two cases, we can draw the following conclusions from a hydraulic point of view.
In the section of the existing weir, section P6, in the current situation when the weir is higher (A), the water depth is lower than case B, when its height is reduced. During summer flows, with low values, the depth of the water increases over the ridge of the weir when its height decreases.
Due to the high height of the existing weir upstream of it, a backwater is created, and a small reservoir is formed. Because of this, the speed of water on the crest of the weir is lower than in the proposed situation, and also in the upstream sections of the weir, the water velocity is lower than in hypothesis B for all three flows. A big disadvantage from an ecological point of view is this high height of the weir because the migration of fish upstream is undertaken with great difficulty or not at all in the current situation, especially since the water depth is also lower, particularly in the case of small summer flows. At the extreme flow rate of 128 m3/s, there is still a drop in the water level next to this weir, as it can be seen in Figure 10, and as such, the water speed is higher because of this drop, compared to case B, in which the water level becomes uniform in this section at this flow rate, and due to the decrease in the height of the weir, the fall disappears, and the velocity becomes lower and uniform. For high flows, it is an advantage from the fish migration point of view because we have a higher depth and low velocity over this weir, and so it is easier for the fauna to migrate upstream and at high flows. The uniformization of the level is also valid for small, summer flows, as it can be seen from the longitudinal profiles for the proposed situation.
Downstream, near the three downstream low-height weirs, the depth of the water does not vary much in the proposed case compared to the current case. The depth variations are very small. Due to the small local falls that form next to the weirs at low flows, the speed increases a little compared to the current case, but the variations are small; we do not have very large increases, from which we can conclude that the water flow in these sections is not disturbed.
Additionally, between the weirs of low height, both depth and speed variations are very small, so that the construction of the weirs does not disturb the flow from a hydraulic point of view, and so the migration of fish would not suffer either. The weirs created with small heights reduce the water speed between them, calming the flow, as it can be seen from the variation of speeds (a small decrease in speed is observed) in the respective sections between the weirs.
In conclusion, the lowering of the crest of the current weir and the construction of three new weirs of low height downstream of it would have a favorable effect from an ecological but also a morphological point of view, without very large implications on the disturbance of the flow in terms of from a hydraulic point of view.
5. Conclusions
A degraded stream is a river that does not work to its full potential. Weirs bring about significant changes in the functioning of river ecosystems. They influence the flow rate, sediment transport, water speed, and morphology of the riverbed, so they directly affect the habitats of fish and invertebrates.
We can say that the elimination or resizing of transversal hydrotechnical constructions such as weirs will significantly contribute to the longitudinal connectivity of ecosystems.
The technical solution identified by us for the studied area would contribute to restoring the fragmented ecosystem. Following the hydraulic modeling of the current situation as well as the solution we proposed, we were able to see some differences in terms of water speed and water depth in the studied section. The differences in water speed and depth would have an ecologically as well as morphologically favorable effect, with no large implications for the disruption of the flow from a hydraulic point of view.
The proposed hydrotechnical construction is not 100% green. The purpose of this construction is to help or restore the longitudinal connectivity of the fragmented ecosystem. This method could also be used for existing waterfalls (cascades) along the entire length of the water course, especially in the sections located outside the localities. The maintenance costs of the construction are relatively low.
Author Contributions
Conceptualization, A.C.M. and T.A.H.; methodology, A.C.M., V.M., T.A.H. and N.M.; software, A.C.M., T.A.H. and N.M.; validation, A.C.M., V.M., T.A.H. and N.M.; formal analysis, A.C.M.; investigation, A.C.M. and V.M.; resources, A.C.M.; data curation, A.C.M. and T.A.H.; writing—original draft preparation, A.C.M.; writing—review and editing, V.M., T.A.H. and N.M.; supervision, V.M. and N.M. All authors have read and agreed to the published version of the manuscript.
Funding
This research received no external funding.
Data Availability Statement
Not applicable.
Conflicts of Interest
The authors declare no conflict of interest.
References
- Blăgoi, O.; Mitroi, A. Soluții Moderne și Clasice Pentru Lucrări de Protecție pe Cursurile de Apă; Editura Performatica: Iasi, Romania, 2013; p. 6. [Google Scholar]
- Kim, J.-J.; Atique, U.; An, K.-G. Long-Term Ecological Health Assessment of a Restored Urban Stream Based on Chemical Water Quality, Physical Habitat Conditions and Biological Integrity. Water 2019, 11, 114. [Google Scholar] [CrossRef] [Green Version]
- Palmer, M.; Allan, J.D.; Meyer, J.; Bernhardt, E.S. River Restoration in the Twenty-First Century: Data and Experiential Future Efforts. Restor. Ecol. 2007, 15, 472–481. [Google Scholar] [CrossRef] [Green Version]
- Wohl, E.; Lane, S.N.; Wilcox, A.C. The science and practice of river restoration. Water Resour. Res. 2015, 51, 5974–5997. [Google Scholar] [CrossRef] [Green Version]
- Cristescu, C. Morfologia Albiilor şi Conceptul de Restaurare a Râurilor. Ph.D. Thesis, Transilvania University, Brasov, Romania, February 2006. [Google Scholar] [CrossRef]
- Howard, A.; Coulthard, T.; Knight, D. The potential impact of green agendas on historic river landscapes: Numerical modelling of multiple weir removal in the Derwent Valley Mills world heritage site, UK. Geomorphology 2017, 293, 37–52. [Google Scholar] [CrossRef] [Green Version]
- Stanciu, E.; Runceanu, G. (Eds.) Refacerea Conectivității Longitudinale a Râurilor și Pâraielor din România. Ghid Pentru Obținerea Aprobărilor Necesare Pentru Implementarea Proiectelor de Refacere; Fundația pentru Arii Protejate: Brasov, Romania, 2019; pp. 5, 12. Available online: https://www.carpathia.org/wp-content/uploads/2019/01/Manual-Conectivitate_Rauri-LIFE.pdf (accessed on 15 July 2020).
- Mury, A.; Jeanson, M.; Collin, A.; James, D.; Etienne, S. High Resolution Shoreline and Shelly Ridge Monitoring over Stormy Winter Events: A Case Study in the Megatidal Bay of Mont-Saint-Michel (France). J. Mar. Sci. Eng. 2019, 7, 97. [Google Scholar] [CrossRef] [Green Version]
- Im, D.; Kang, H.; Kim, K.-H.; Choi, S.-U. Changes of river morphology and physical fish habitat following weir removal. Ecol. Eng. 2011, 37, 883–892. [Google Scholar] [CrossRef]
- Kim, S.K.; Choi, S.-U. Ecological evaluation of weir removal based on physical habitat simulations for macroinvertebrate community. Ecol. Eng. 2019, 138, 362–373. [Google Scholar] [CrossRef]
- Staentzel, C.; Kondolf, G.M.; Schmitt, L.; Combroux, I.; Barillier, A.; Beisel, J.-N. Restoring fluvial forms and processes by gravel augmentation or bank erosion below dams: A systematic review of ecological responses. Sci. Total Environ. 2020, 706, 135743. [Google Scholar] [CrossRef] [PubMed]
- Catalogul habitatelor, speciilor si siturilor Natura 2000 in Romania. Editor: Fundația Centru Național pentru Dezvoltare Durabilă: Bucuresti, Romania, 2013; pp. 57, 90–92, 101, 102, 107, 343, 344; Available online: https://www.academia.edu/44052643/Catalogul_habitatelor_speciilor_si_siturilor_Natura_2000_in_Romania_2015_ (accessed on 9 June 2020).
- Lavelle, A.M.; Chadwick, M.A.; Chadwick, D.D.A.; Pritchard, E.G.; Bury, N.R. Effects of Habitat Restoration on Fish Communities in Urban Streams. Water 2021, 13, 2170. [Google Scholar] [CrossRef]
- Humphreys, A.; Gough, P.; Powell, S.; Wilson, D. Chapters 12. Removing or Passing Barriers. Available online: https://www.therrc.co.uk/manual-river-restoration-techniques%20/ (accessed on 2 June 2020).
- Shakya, R.; Ahiablame, L. A Synthesis of Social and Economic Benefits Linked to Green Infrastructure. Water 2021, 13, 3651. [Google Scholar] [CrossRef]
- Perkins, D.M.; Hull, T.; Bubb, N.; Cunningham, A.; Glackin, R.; Glen, T.; Smith, S.; Davies, B. Putting the ‘Beaver’ Back in Beverley Brook: Rapid Shifts in Community Composition following the Restoration of a Degraded Urban River. Water 2021, 13, 3530. [Google Scholar] [CrossRef]
- Schirmer, M.; Luster, J.; Linde, N.; Perona, P.; Mitchell, E.A.D.; Barry, D.A.; Hollender, J.; Cirpka, O.A.; Schneider, P.; Vogt, T.; et al. Morphological, hydrological, biogeochemical and ecological changes and challenges in river restoration; the Thur River case study. Hydrol. Earth Syst. Sci. 2014, 18, 2449–2462. [Google Scholar] [CrossRef] [Green Version]
- Ieleicz, M.; Pătraru, I. Geografia Fizică a României; Editura Universitară: Bucuresti, Romania, 2005; Volume I, pp. 208, 209, 236. Available online: https://www.emag.ro/geografia-fizica-a-romaniei-clima-apa-vegetatie-soluri-ileana-georgeta-patru-liliana-zaharia-razvan-oprea-9789737490650/pd/DZW022BBM/ (accessed on 29 May 2017).
- Tivadar, A. Contribuții la Istoria Alimentării cu apă a Orașului Bistrița; Editura Tipomur: Târgu Mureș, Romania, 1995. [Google Scholar]
- Sofronie, C. Amenajări Hidrotehnice în Bazinul Hidrografic Someș-Tisa; Editura Gloria: Cluj-Napoca, Romania, 2000; pp. 123–124. [Google Scholar]
- Duda, V.; Gaiu, C.; Klein, G. Cultură și Civilizație la Bistrița, 2nd ed.; Editura Refresh Time: Bistrita, Romania, 2015; pp. 22–24. Available online: https://www.scoala1bistrita.ro/reviste/cultura_si_civilizatie_la_bistrita_gimnaziu.pdf (accessed on 17 February 2020).
- Moldovan, C.; Silaghi, R. The Morphological Impact of the Colibița Hydrotehnical System on the Bistrita Ardeleana Riverbed. In Proceedings of the Air and Water—Components of the Environment, Cluj-Napoca, Romania, 20 March 2021; pp. 89–94. [Google Scholar] [CrossRef]
- Rapoart hidrometric al debitelor de apă pe râul Bistrița la stația hidrometrică Bistrița; Sistemul de Gospodărire al Apelor: Bistrița, Romania, 2020, 2021, 2022.
- Pop, M.; Steicu, V. Studiu Privind Inundabilitatea Orașului Bistrița—Jud. Bistrița-Năsăud; No.135, Oficiul de Gospodărire al Apelor: Cluj, Romania, 1972; pp. 5–8. [Google Scholar]
- Diaconu, S.; Stănculescu, C. Râurile României—Monografie Hidrologică; Editura Institutul de Meteorlogie și Hidrologie: București, Romania, 1971; pp. 142–146, 212–213. [Google Scholar]
- Șmuleac, A.; Șmuleac, L.; Man, T.; Popescu, C.; Imbrea, F.; Radulov, I.; Adamov, T.; Pașcalău, R. Use of Modern Technologies for the Conservation of Historical Heritage in Water Management. Water 2020, 12, 2895. [Google Scholar] [CrossRef]
- MIKE 11, A Modelling System for Rivers and Channels, Reference Manual, Danish Hydraulic Institute 2017. p. 425. Available online: https://manuals.mikepoweredbydhi.help/2017/Water_Resources/Mike_11_ref.pdf (accessed on 26 September 2022).
Figure 1.
The Bistrita Ardeleana River Basin: location, limits, hypsometry, hydrographic networks.

Figure 2.
The hydraulic network and the position of the cross sections plotted in the orthophotoplan.
Figure 2.
The hydraulic network and the position of the cross sections plotted in the orthophotoplan.

Figure 3.
Representation on the orthophoto plane of the five ground control points (GCP); they were used for georeferencing the images.
Figure 3.
Representation on the orthophoto plane of the five ground control points (GCP); they were used for georeferencing the images.

Figure 4.
The 3D image at the weir created using the clouds of points obtained from measurements with the professional drone.
Figure 4.
The 3D image at the weir created using the clouds of points obtained from measurements with the professional drone.

Figure 5.
Graphical representation of the identified alternative method.

Figure 6.
Water level for flow Q = 3.56 m3/s, summer flow recorded in June 2022. For the case where there is only one weir, the existing one.
Figure 6.
Water level for flow Q = 3.56 m3/s, summer flow recorded in June 2022. For the case where there is only one weir, the existing one.

Figure 7.
Water speed for flow Q = 3.56 m3/s, summer flow recorded in June 2022. For the case where there is only one weir, the existing one.
Figure 7.
Water speed for flow Q = 3.56 m3/s, summer flow recorded in June 2022. For the case where there is only one weir, the existing one.

Figure 8.
Water level for flow Q = 8.37 m3/s, the average annual flow calculated for the year 2021. For the case where there is only one weir, the existing one.
Figure 8.
Water level for flow Q = 8.37 m3/s, the average annual flow calculated for the year 2021. For the case where there is only one weir, the existing one.

Figure 9.
Water speed for flow Q = 8.37 m3/s, the average annual flow calculated for the year 2021. For the case where there is only one weir, the existing one.
Figure 9.
Water speed for flow Q = 8.37 m3/s, the average annual flow calculated for the year 2021. For the case where there is only one weir, the existing one.

Figure 10.
Water level for flow Q = 128 m3/s, representing an extreme flood flow recorded in 2020. For the case where there is only one weir, the existing one.
Figure 10.
Water level for flow Q = 128 m3/s, representing an extreme flood flow recorded in 2020. For the case where there is only one weir, the existing one.

Figure 11.
Water speed for flow Q = 128 m3/s, representing an extreme flood flow recorded in 2020. For the case where there is only one weir, the existing one.
Figure 11.
Water speed for flow Q = 128 m3/s, representing an extreme flood flow recorded in 2020. For the case where there is only one weir, the existing one.

Figure 12.
Water level for flow Q = 3.56 m3/s, summer flow recorded in June 2022. For the proposed case with the lowering of the crest of the existing weir and the construction of three new weirs of low height downstream of it.
Figure 12.
Water level for flow Q = 3.56 m3/s, summer flow recorded in June 2022. For the proposed case with the lowering of the crest of the existing weir and the construction of three new weirs of low height downstream of it.

Figure 13.
Water speed for flow Q = 3.56 m3/s, summer flow recorded in June 2022. For the proposed case with the lowering of the crest of the existing weir and the construction of three new weirs of low height downstream of it.
Figure 13.
Water speed for flow Q = 3.56 m3/s, summer flow recorded in June 2022. For the proposed case with the lowering of the crest of the existing weir and the construction of three new weirs of low height downstream of it.

Figure 14.
Water level for flow Q = 8.37 m3/s, the average annual flow calculated for the year 2021. For the proposed case with the lowering of the crest of the existing weir and the construction of three new weirs of low height downstream of it.
Figure 14.
Water level for flow Q = 8.37 m3/s, the average annual flow calculated for the year 2021. For the proposed case with the lowering of the crest of the existing weir and the construction of three new weirs of low height downstream of it.

Figure 15.
Water speed for flow Q = 8.37 m3/s, the average annual flow calculated for the year 2021. For the proposed case with the lowering of the crest of the existing weir and the construction of three new weirs of low height downstream of it.
Figure 15.
Water speed for flow Q = 8.37 m3/s, the average annual flow calculated for the year 2021. For the proposed case with the lowering of the crest of the existing weir and the construction of three new weirs of low height downstream of it.

Figure 16.
Water level for flow Q = 128 m3/s, representing an extreme flood flow recorded in 2020. For the proposed case with the lowering of the crest of the existing weir and the construction of three new weirs of low height downstream of it.
Figure 16.
Water level for flow Q = 128 m3/s, representing an extreme flood flow recorded in 2020. For the proposed case with the lowering of the crest of the existing weir and the construction of three new weirs of low height downstream of it.

Figure 17.
Water speed for flow Q = 128 m3/s, representing an extreme flood flow recorded in 2020. For the proposed case with the lowering of the crest of the existing weir and the construction of three new weirs of low height downstream of it.
Figure 17.
Water speed for flow Q = 128 m3/s, representing an extreme flood flow recorded in 2020. For the proposed case with the lowering of the crest of the existing weir and the construction of three new weirs of low height downstream of it.


Table 1.
Mileage of the main sections of the model.
| Section | Kilometer (m) |
|---|---|
| P1 | 0.00 |
| P2 | 33.61 |
| P3 | 66.92 |
| P4 | 98.58 |
| P6 (existent crest of weir) | 131.69 |
| P10 | 139.96 |
| P11 | 171.89 |
| P12 (proposed crest of weir 1) | 195.24 |
| P13 | 220.92 |
| P14 | 228.51 |
| P15′ (proposed crest of weir 2) | 249.33 |
| P15 | 261.45 |
| P16 | 289.49 |
| P16′ (proposed crest of weir 3) | 302.28 |
| P17 | 315 |
Table 2.
The depth and velocity of the water in each cross-section for all simulated flows. For the case where there is only one weir, the existing one.
Table 2.
The depth and velocity of the water in each cross-section for all simulated flows. For the case where there is only one weir, the existing one.
| Section/Q | Q = 3.56 m3/s | Q = 8.37 m3/s | Q = 128 m3/s | ||||
|---|---|---|---|---|---|---|---|
| Section | Kilometer (m) | Water Depth (m) | Water Velocity (m/s) | Water Depth (m) | Water Velocity (m/s) | Water Depth (m) | Water Velocity (m/s) |
| P1 | 0.00 | 1.242 | 0.243 | 1.443 | 0.467 | 2.933 | 2.178 |
| P2 | 33.61 | 1.155 | 0.312 | 1.346 | 0.555 | 2.724 | 2.273 |
| P3 | 66.92 | 1.294 | 0.21 | 1.48 | 0.414 | 2.756 | 2.198 |
| P4 | 98.58 | 1.252 | 0.206 | 1.434 | 0.394 | 2.618 | 2.163 |
| P6 (existing weir) | 131.69 | 0.209 | 1.254 | 0.396 | 1.341 | 1.633 | 3.139 |
| P10 | 139.96 | 0.4 | 0.621 | 0.593 | 0.819 | 2.301 | 1.928 |
| P11 | 171.89 | 0.403 | 0.894 | 0.607 | 1.062 | 2.308 | 2.259 |
| P12 | 195.24 | 0.506 | 0.778 | 0.717 | 1.044 | 2.423 | 2.357 |
| P13 | 220.92 | 0.525 | 0.724 | 0.723 | 0.978 | 2.389 | 2.532 |
| P14 | 228.51 | 0.301 | 1.021 | 0.497 | 1.161 | 2.182 | 2.493 |
| P15′ | 249.33 | 0.633 | 0.809 | 0.858 | 1.085 | 2.478 | 3.138 |
| P15 | 261.45 | 0.608 | 0.687 | 0.82 | 1.03 | 2.412 | 3.007 |
| P16 | 289.49 | 0.48 | 1.058 | 0.665 | 1.289 | 2.206 | 2.976 |
| P16′ | 302.28 | 0.405 | 1.16 | 0.607 | 1.381 | 2.162 | 3.088 |
| P17 | 315 | 0.419 | 1.03 | 0.628 | 1.304 | 2.194 | 3.053 |
Table 3.
The depth and velocity of the water in each cross-section for all simulated flows. For the proposed case with the lowering of the crest of the existing weir and the construction of three new weirs of low height downstream of it.
Table 3.
The depth and velocity of the water in each cross-section for all simulated flows. For the proposed case with the lowering of the crest of the existing weir and the construction of three new weirs of low height downstream of it.
| Section/Q | Q = 3.56 m3/s | Q = 8.37 m3/s | Q = 128 m3/s | ||||
|---|---|---|---|---|---|---|---|
| Section | Kilometer (m) | Water Depth (m) | Water Velocity (m/s) | Water Depth (m) | Water Velocity (m/s) | Water Depth (m) | Water Velocity (m/s) |
| P1 | 0.00 | 0.721 | 0.548 | 0.979 | 0.801 | 2.762 | 2.464 |
| P2 | 33.61 | 0.552 | 1.129 | 0.781 | 1.48 | 2.488 | 2.719 |
| P3 | 66.92 | 0.533 | 0.655 | 0.77 | 0.972 | 2.398 | 2.873 |
| P4 | 98.58 | 0.391 | 1.472 | 0.595 | 1.712 | 2.114 | 3.166 |
| P6/existing weir | 131.69 | 0.322 | 1.53 | 0.635 | 1.544 | 2.433 | 2.059 |
| P10 | 139.96 | 0.399 | 0.622 | 0.726 | 0.62 | 2.521 | 1.701 |
| P11 | 171.89 | 0.4 | 0.907 | 0.824 | 0.765 | 2.579 | 1.905 |
| P12/weir 1 proposed | 195.24 | 0.497 | 1.032 | 0.631 | 2.137 | 2.721 | 1.932 |
| P13 | 220.92 | 0.51 | 0.758 | 0.71 | 1.011 | 2.755 | 2 |
| P14 | 228.51 | 0.283 | 1.113 | 0.48 | 1.221 | 2.562 | 1.971 |
| P15′/weir 2 proposed | 249.33 | 0.638 | 0.789 | 0.88 | 1.041 | 2.649 | 3.963 |
| P15 | 261.45 | 0.616 | 0.674 | 0.843 | 0.99 | 2.591 | 2.643 |
| P16 | 289.49 | 0.493 | 0.998 | 0.711 | 1.134 | 2.457 | 2.542 |
| P16′/weir 3 proposed | 302.28 | 0.399 | 1.679 | 0.6 | 1.679 | 2.153 | 3.776 |
| P17 | 315 | 0.419 | 1.03 | 0.628 | 1.304 | 2.194 | 3.053 |
Publisher’s Note: MDPI stays neutral with regard to jurisdictional claims in published maps and institutional affiliations. |
© 2022 by the authors. Licensee MDPI, Basel, Switzerland. This article is an open access article distributed under the terms and conditions of the Creative Commons Attribution (CC BY) license (https://creativecommons.org/licenses/by/4.0/).
Share and Cite
MDPI and ACS Style
Moldovan, A.C.; Micle, V.; Hrăniciuc, T.A.; Marcoie, N. Research on the Sustainable Development of the Bistrita Ardeleana River through the Resizing of Weirs. Water 2022, 14, 3333. https://doi.org/10.3390/w14203333
AMA Style
Moldovan AC, Micle V, Hrăniciuc TA, Marcoie N. Research on the Sustainable Development of the Bistrita Ardeleana River through the Resizing of Weirs. Water. 2022; 14(20):3333. https://doi.org/10.3390/w14203333
Chicago/Turabian StyleMoldovan, Aurelian Cosmin, Valer Micle, Tomi Alexandrel Hrăniciuc, and Nicolae Marcoie. 2022. "Research on the Sustainable Development of the Bistrita Ardeleana River through the Resizing of Weirs" Water 14, no. 20: 3333. https://doi.org/10.3390/w14203333
Note that from the first issue of 2016, this journal uses article numbers instead of page numbers. See further details here.