
Using Deep Learning to Formulate the Landslide Rainfall Threshold of the Potential Large-Scale Landslide

1
Department of Soil and Water Conservation, National Pingtung University of Science and Technology, Pingtung 912, Taiwan
2
Department of Civil Engineering, National Pingtung University of Science and Technology, Pingtung 912, Taiwan
*
Author to whom correspondence should be addressed.
Water 2022, 14(20), 3320; https://doi.org/10.3390/w14203320
Submission received: 26 September 2022
/
Revised: 15 October 2022
/
Accepted: 17 October 2022
/
Published: 20 October 2022
(This article belongs to the Special Issue Natural Disasters Occurrence, Reduction, and Restoration in Mountain Regions)
Abstract
:The complex and extensive mechanism of landslides and their direct connection to climate change have turned these hazards into critical events on a global scale, which can have significant negative influences on the long-term sustainable development of nations. Taiwan experiences numerous landslides on different scales almost every year. However, Typhoon Morakot (2009), with large-scale landslides that trapped people, demonstrated the importance of an early warning system. The absence of an effective warning system for landslides along with the impossibility of its accurate monitoring highlighted the necessity of landslide rainfall threshold prediction. Accordingly, the prediction of the landslide rainfall threshold as an early warning system could be an effective tool with which to develop an emergency evacuation protocol. The purpose of this study is to present the capability of the deep learning algorithm to determine the distribution of landslide rainfall thresholds in a potential large-scale landslide area and to assess the distribution of recurrence intervals using probability density functions, as well as to assist decision makers in early responses to landslides and reduce the risk of large-scale landslides. Therefore, the algorithm was developed for one of the potential large-scale landslide areas (the Alishan D098 sub-basin), Taiwan, which is classified as a Type II Landslide Priority Area. The historical landslide data, maximum daily rainfall, 11 topographic factors from 2004 to 2017, and the Keras application programming interface (API) python library were used to develop two deep learning models for landslide susceptibility classification and landslide rainfall threshold regression. The predicted result shows the lowest landslide rainfall threshold is located primarily in the northeastern downstream of the Alishan catchment, which poses an extreme risk to the residential area located upstream of the landslide area, particularly if large-scale landslides were to be triggered upstream of Alishan. The landslide rainfall threshold under controlled conditions was estimated at 780 mm/day (20-year recurrence interval), or 820 mm/day (25-year recurrence interval). Since the frequency of extreme rainfall events caused by climate change is expected to rise in the future, the overall landslide rainfall threshold was considered 980 mm/day for the entire area.
1. Introduction
Landslides are natural hazards that cause loss of life and heavy financial and economic damage to residential areas all over the world. Therefore, investigating the effective factors of landslides for planning and providing management solutions in sensitive areas is essential.
Landslides generally occur under the influence of physical, human, and climatic factors [1]. Among all factors, intense rainfall is highly significant [2], and is thus considered a crucial factor in the implementation of early warning systems for landslides [3]. Formulation approaches used for the landslide rainfall threshold are mainly divided into the empirical and the deterministic approaches. The empirical approach generally is defined based on empirical formulae proposed in previous studies [4,5]. Since empirical formulae are provided for a specific study area, their application is constrained to areas with similar characteristics and properties. In addition, landslide precipitation threshold prediction through empirical formulae with insufficient raw data leads to unreliable results with larger confidence prediction intervals. On the other hand, the deterministic approach has mainly been presented by models, such as slope stability models or artificial intelligence models [3,6,7,8].
The main point of these models is to require sufficient physical parameters or factors to analyze and obtain optimized results; otherwise, despite multiple analyses at various time points, the result will be suboptimal. The most important challenge in landslide prediction through statistical-based methods is access to the location and date of landslides, factors of landslide occurrence, and controlling factors such as topography, geology, soil, and land cover [9].
The topography of the watershed is diverse, complex, and heterogeneous, and these different factors establish different conditions for landslide occurrence. Geology, topography, and soil type are requisite factors for formulating the landslide rainfall threshold [4]. Research has shown that high-risk landslide areas are mainly located within high altitudes, steep slopes, high curvature, barren lands, loose geology or lithology, and near river systems or roadsides [10,11,12]. In order to predict high-risk landslide areas, first, the landslide precipitation for the entire area should be determined, which is difficult when there is insufficient information.
Deep learning has evolved gradually in recent years as a result of technological advances in software and hardware computer equipment, such as the advent of tensor and graphics processing units (TPUs and GPUs). Moreover, as landslide control factors limit the capability of traditional machine learning methods [13], deep learning can be a wiser choice due to some of its advantages, including: (i) its capability to be used in multiple fields; (ii) ability to extract inherent and deep features easily; (iii) ability to distinguish effective information and obtain optimal parameters to construct models (iv) without requiring prior knowledge or hypotheses [14]; and (v) capability of accepting a higher sample size without manually constructing and (vi) selecting feature layers [15]. Various studies have applied deep learning techniques for landslide analysis [16,17,18], landslide susceptibility analysis [19,20,21,22], and landslide displacement predictions [23,24], and have proved the accuracy of these methods compared to traditional methods. Similarly, traditional machine learning methods compared to empirical approaches and physical modeling have provided highly efficient and accurate landslide disaster warning models [25]. Multiple studies employed precipitation data and artificial intelligence methods to develop landslide displacement prediction methods [1,2,3,5,6,7,8,9,13,14,15,26,27,28,29,30,31,32,33].
Recent studies attempted to enhance the reliability of landslide displacement prediction models through machine learning algorithms [26,27].
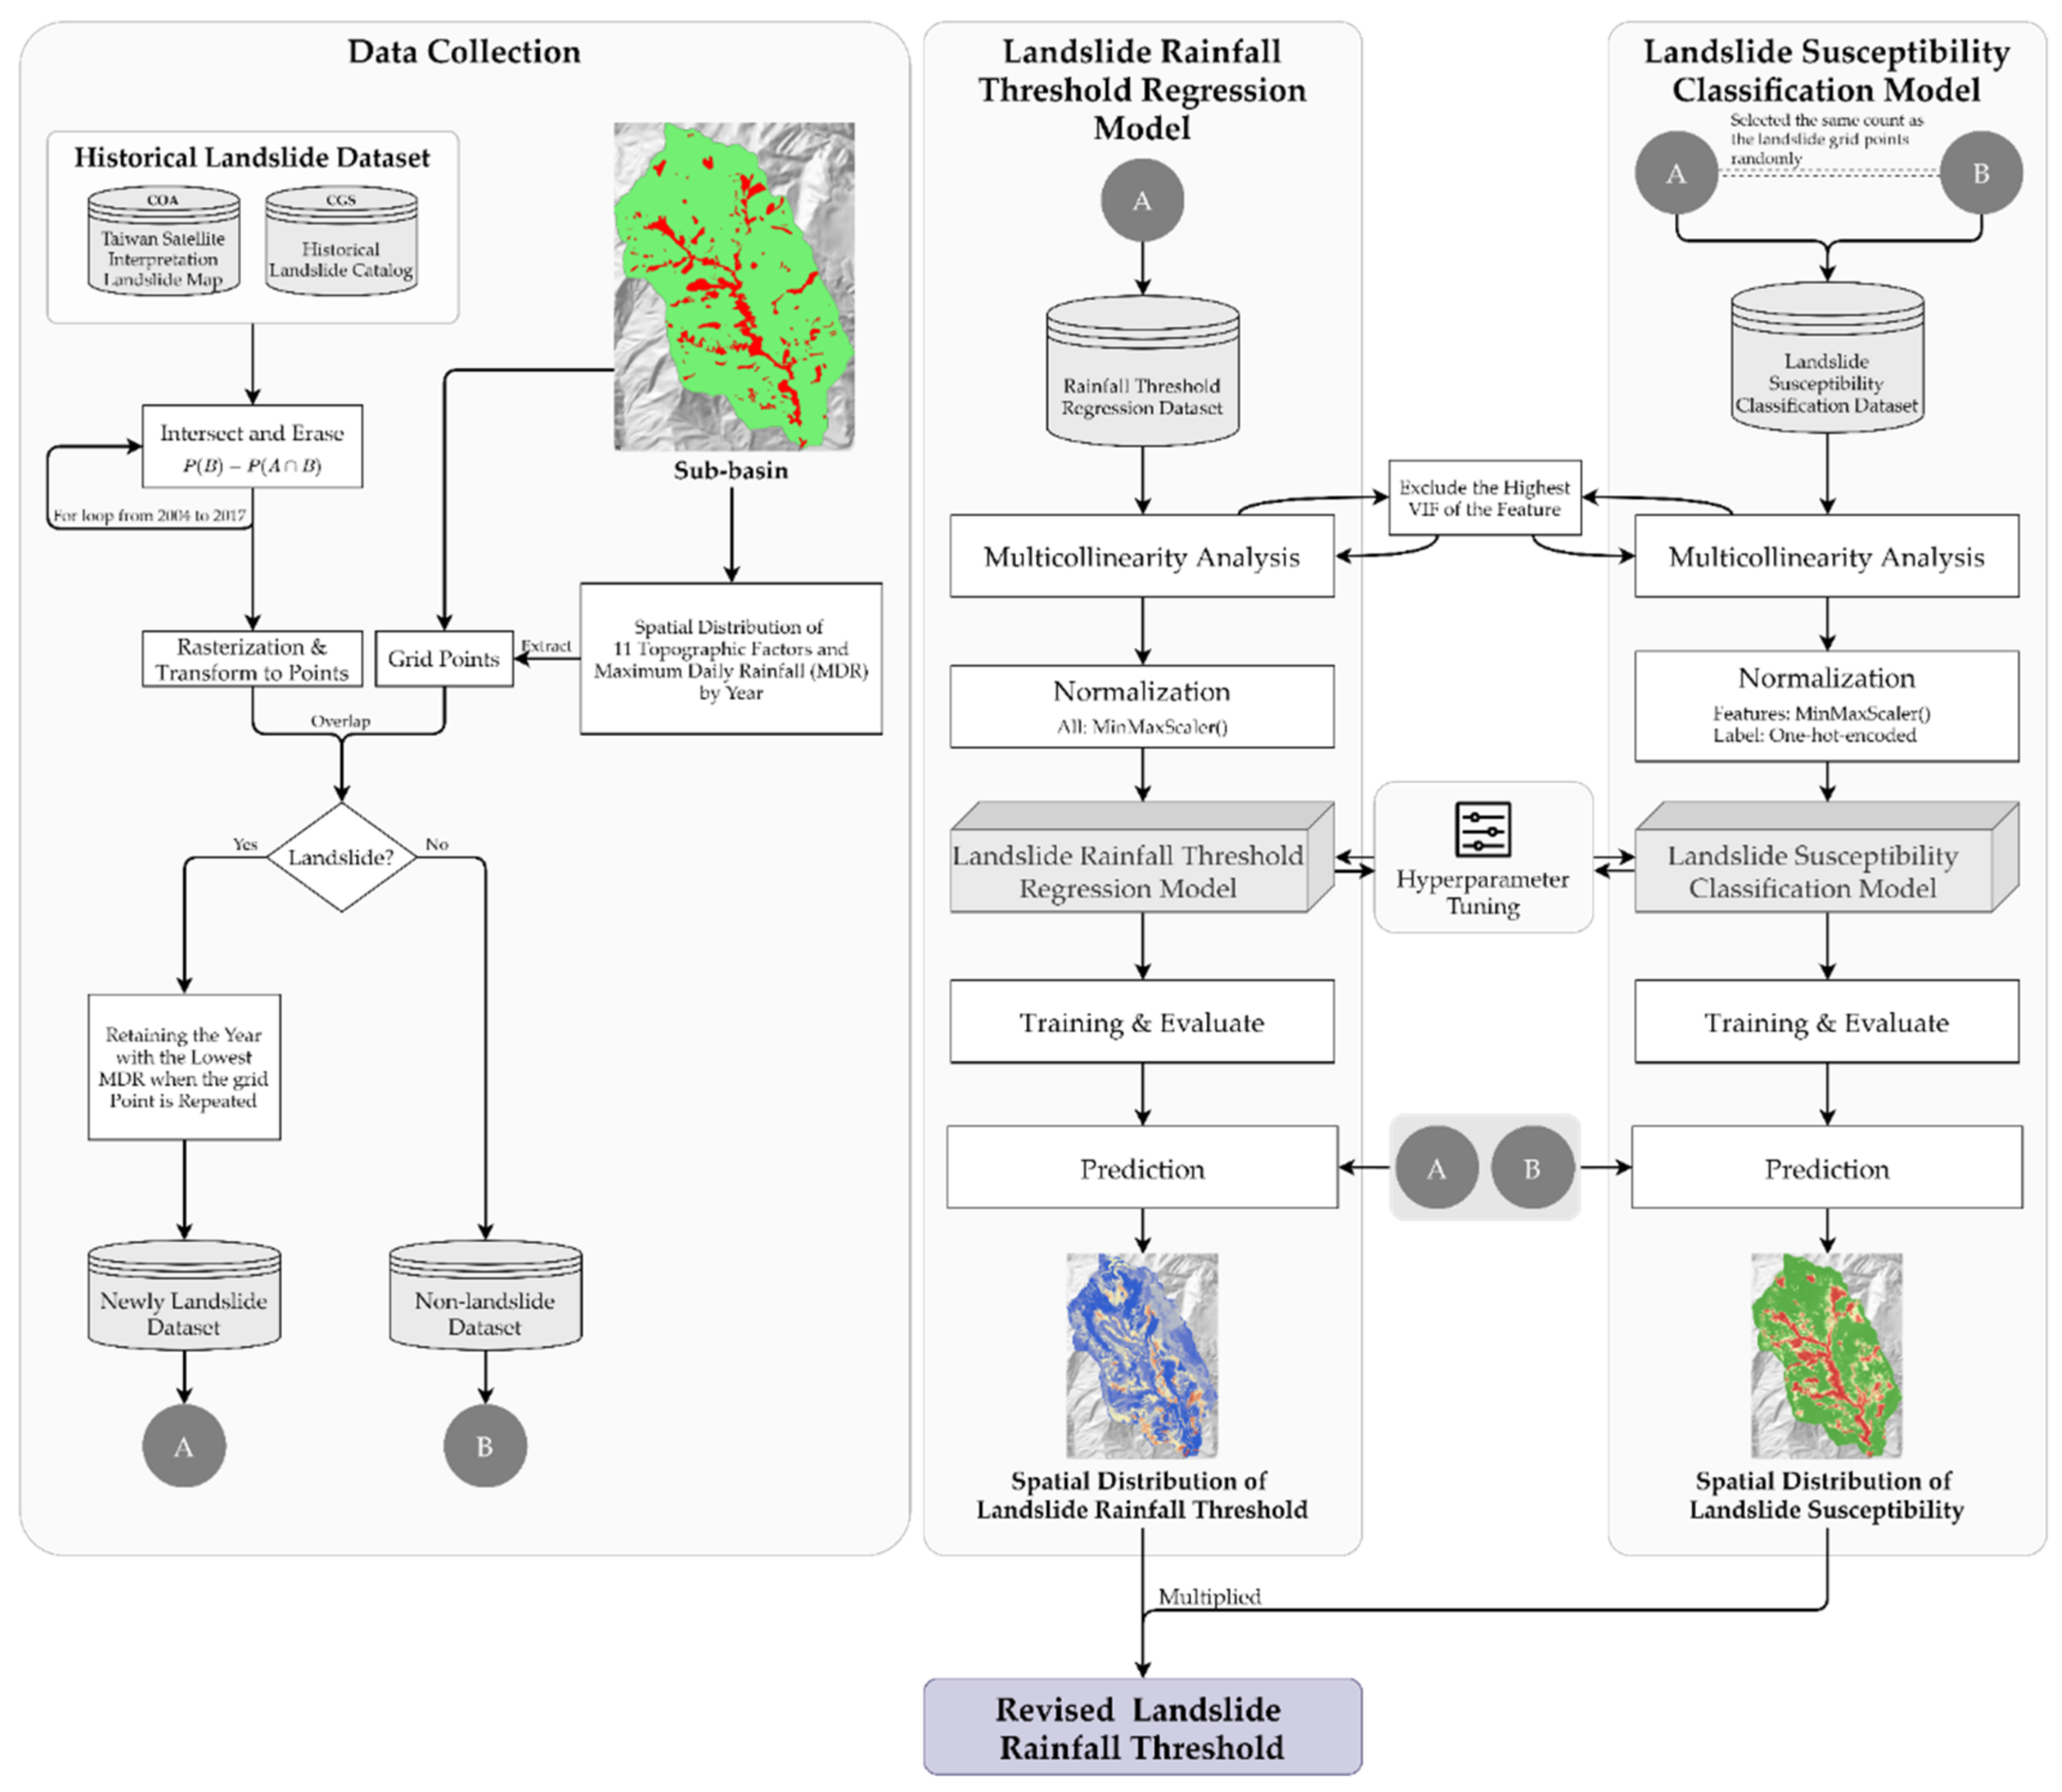
Although landslides in Taiwan have been studied for a long time, landslide hazards came into prominence in 2009 coincidentally with Typhoon Morakot, which trapped people. Due to the large population of Taiwan compared to the area of the country, concern was raised about potential property damage and fatalities in residential areas. On the other hand, the lack of landslide prediction and warning systems adds to this concern. Therefore, this paper attempts to assist responsible authorities in taking emergency evacuation decisions by introducing a model of estimation of the landslide rainfall threshold. This study combined the advantages of empirical approaches (with sufficient raw data) and deterministic approaches (with high resolution and high accuracy); in addition, we used a deep learning model to establish the landslide susceptibility and the landslide rainfall threshold map of potential large-scale landslide area for Alishan D098. To indicate the range with a “highly landslide potential and lower rainfall threshold”, the critical rainfall threshold should be considered in landslide susceptibility. Therefore, the prediction results of the two models were multiplied to obtain the revised landslide rainfall threshold. The deep learning model parameters were chosen through hyperparameter tuning with a Keras tuner to probe and choose the model with the highest score (low validation loss score). Missing values were interpolated on the basis of historical landslide data. Figure 1 shows the workflow of this study.
2. Study Area
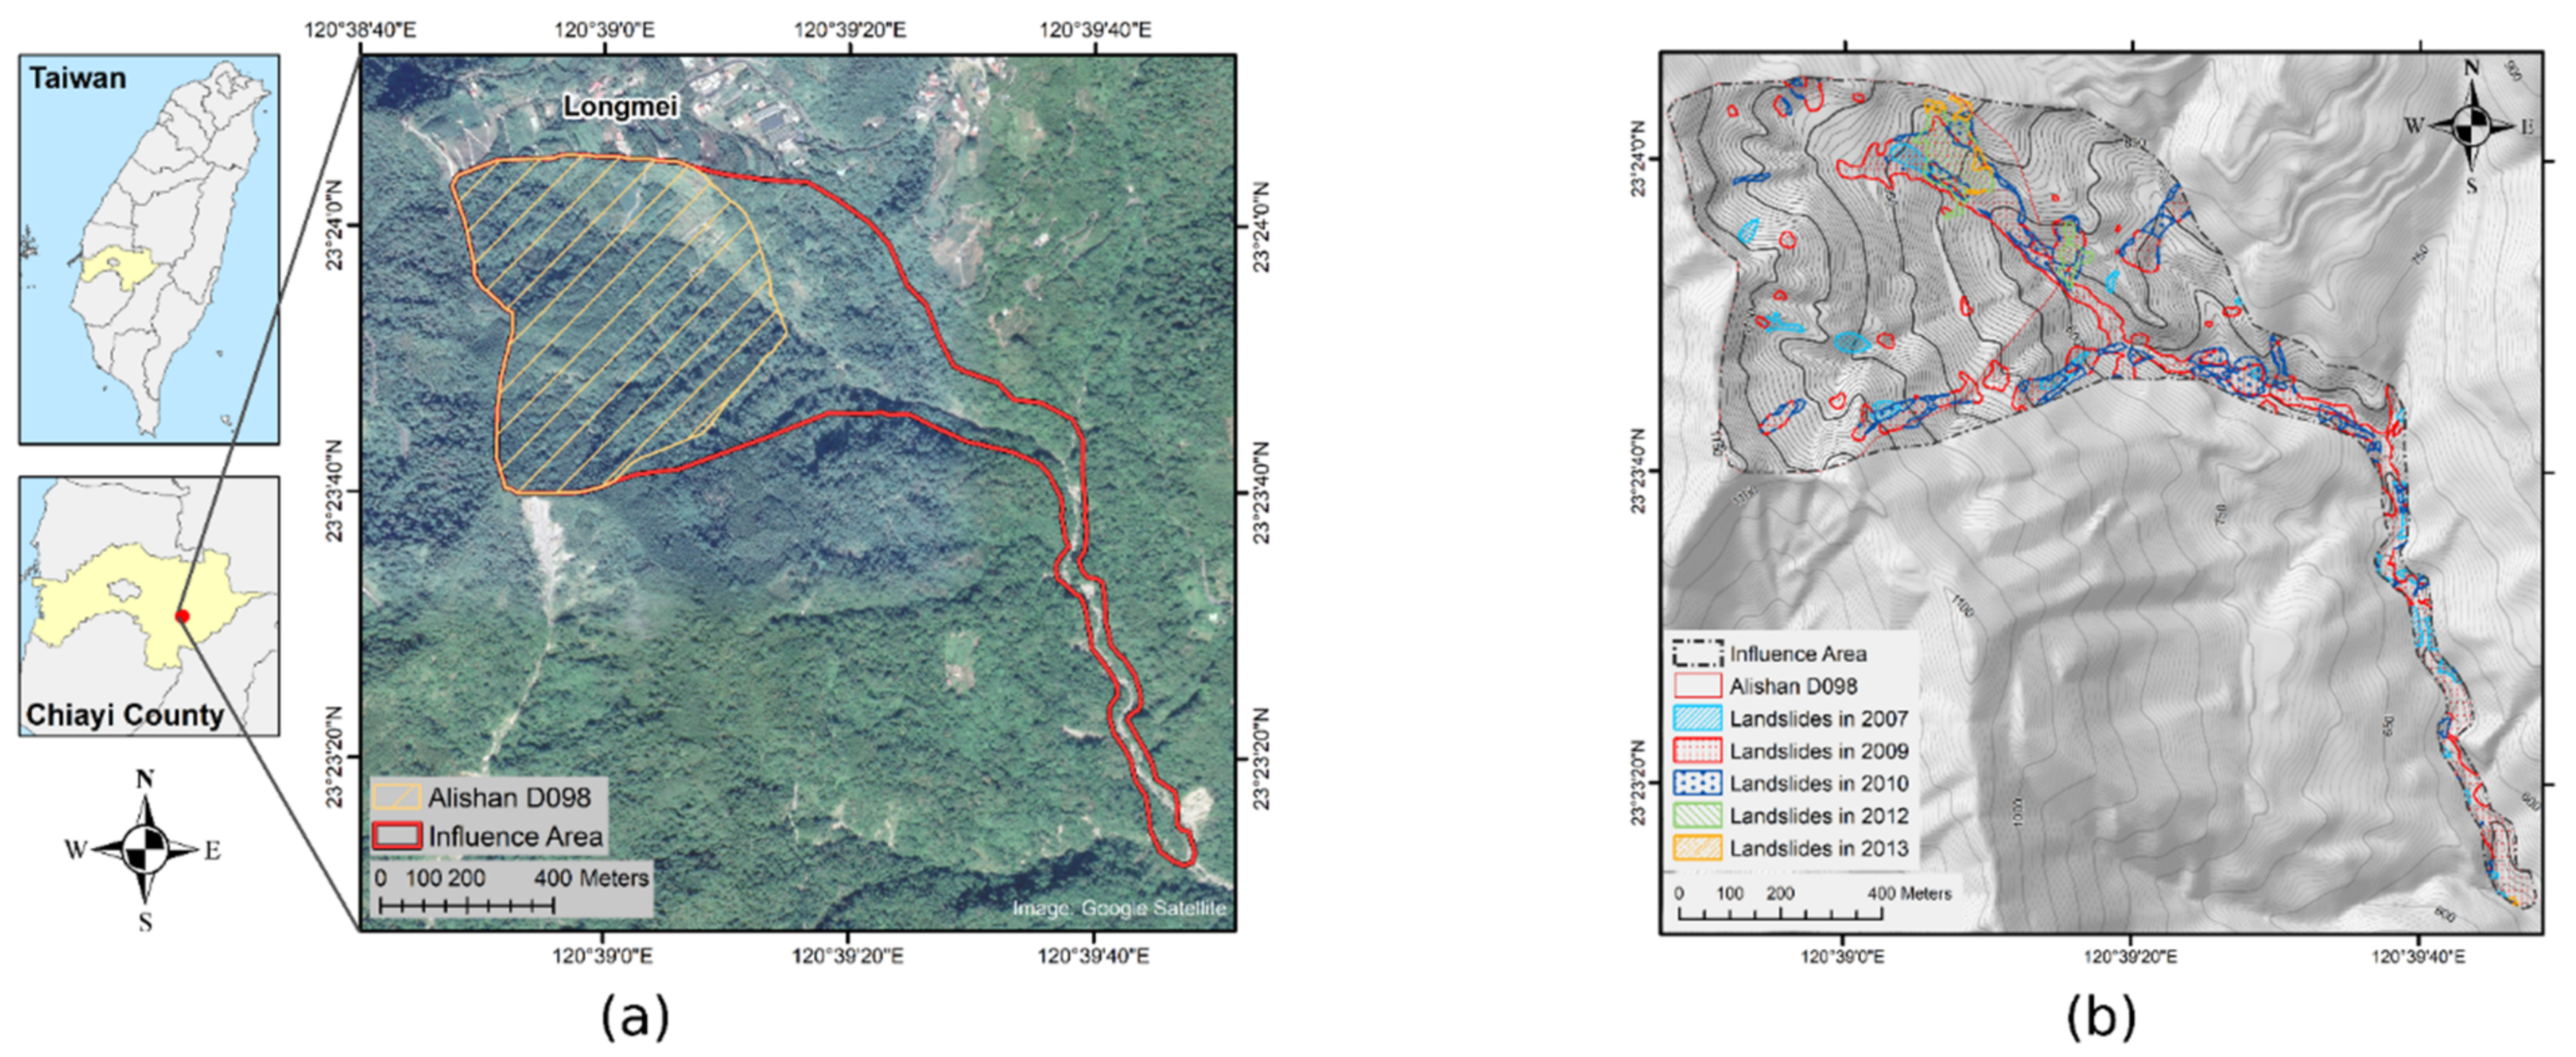
The study area was Alishan D098 (Figure 1) in southwestern Taiwan, which is known as the Laitou Landslide Area, located upstream of the Tsengwen Reservoir Watershed. It serves as a reference area for potential large-scale landslide areas affecting Gongxin Village, Fanlu Township, and Shanmei Village in Chiayi County’s Alishan Township (Figure 2a). The potential area is approximately 42.9 hectares, with a downstream influence area of 74.2 hectares; landslide occurrence along the river is the debris flow type [34,35]. The geological formation is primarily Changchihkeng, which consists of sandstone and sand-shale interbedding lithology, and the Laitou Fault runs through this area from the northwest to southeast, resulting in relatively fragmented geology [36].
Landslides have previously occurred in the northeast of Alishan D098, trapping ten residents during Typhoon Morakot in 2009 [37]. The recent multiphase regulation [38] has stabilized this area. The Soil and Water Conservation Bureau classified the area as a Type II Landslide Priority Area, which can be described by potential large-scale landslide objects without overlapping with existing debris-flow-protected targets [35].
3. Materials and Methods
3.1. Data Collection
Historical landslide datasets, including the Taiwan Satellite Interpretation Landslide Map provided by the Council of Agriculture (COA) from 2003 to 2017, and the Historical Landslide Catalog, provided by the Central Geological Survey (CGS) from 2003 to 2010, with all polygon vector data types, were used in this study. First, the landslide area was analyzed in 2003 and 2004. To obtain the overlapping area, the Intersect tool (ArcGIS 10.8) was employed afterward, and the overlapping area in 2004 was eliminated by the Erase tool to establish the new landslide area for the same year. The process was repeated year after year to generate all vector data of landslide areas from 2004 to 2017. After that, we converted it to grid data with the same resolution as the DEM (5 × 5 m) to obtain point data and finally created new landslide grid points.
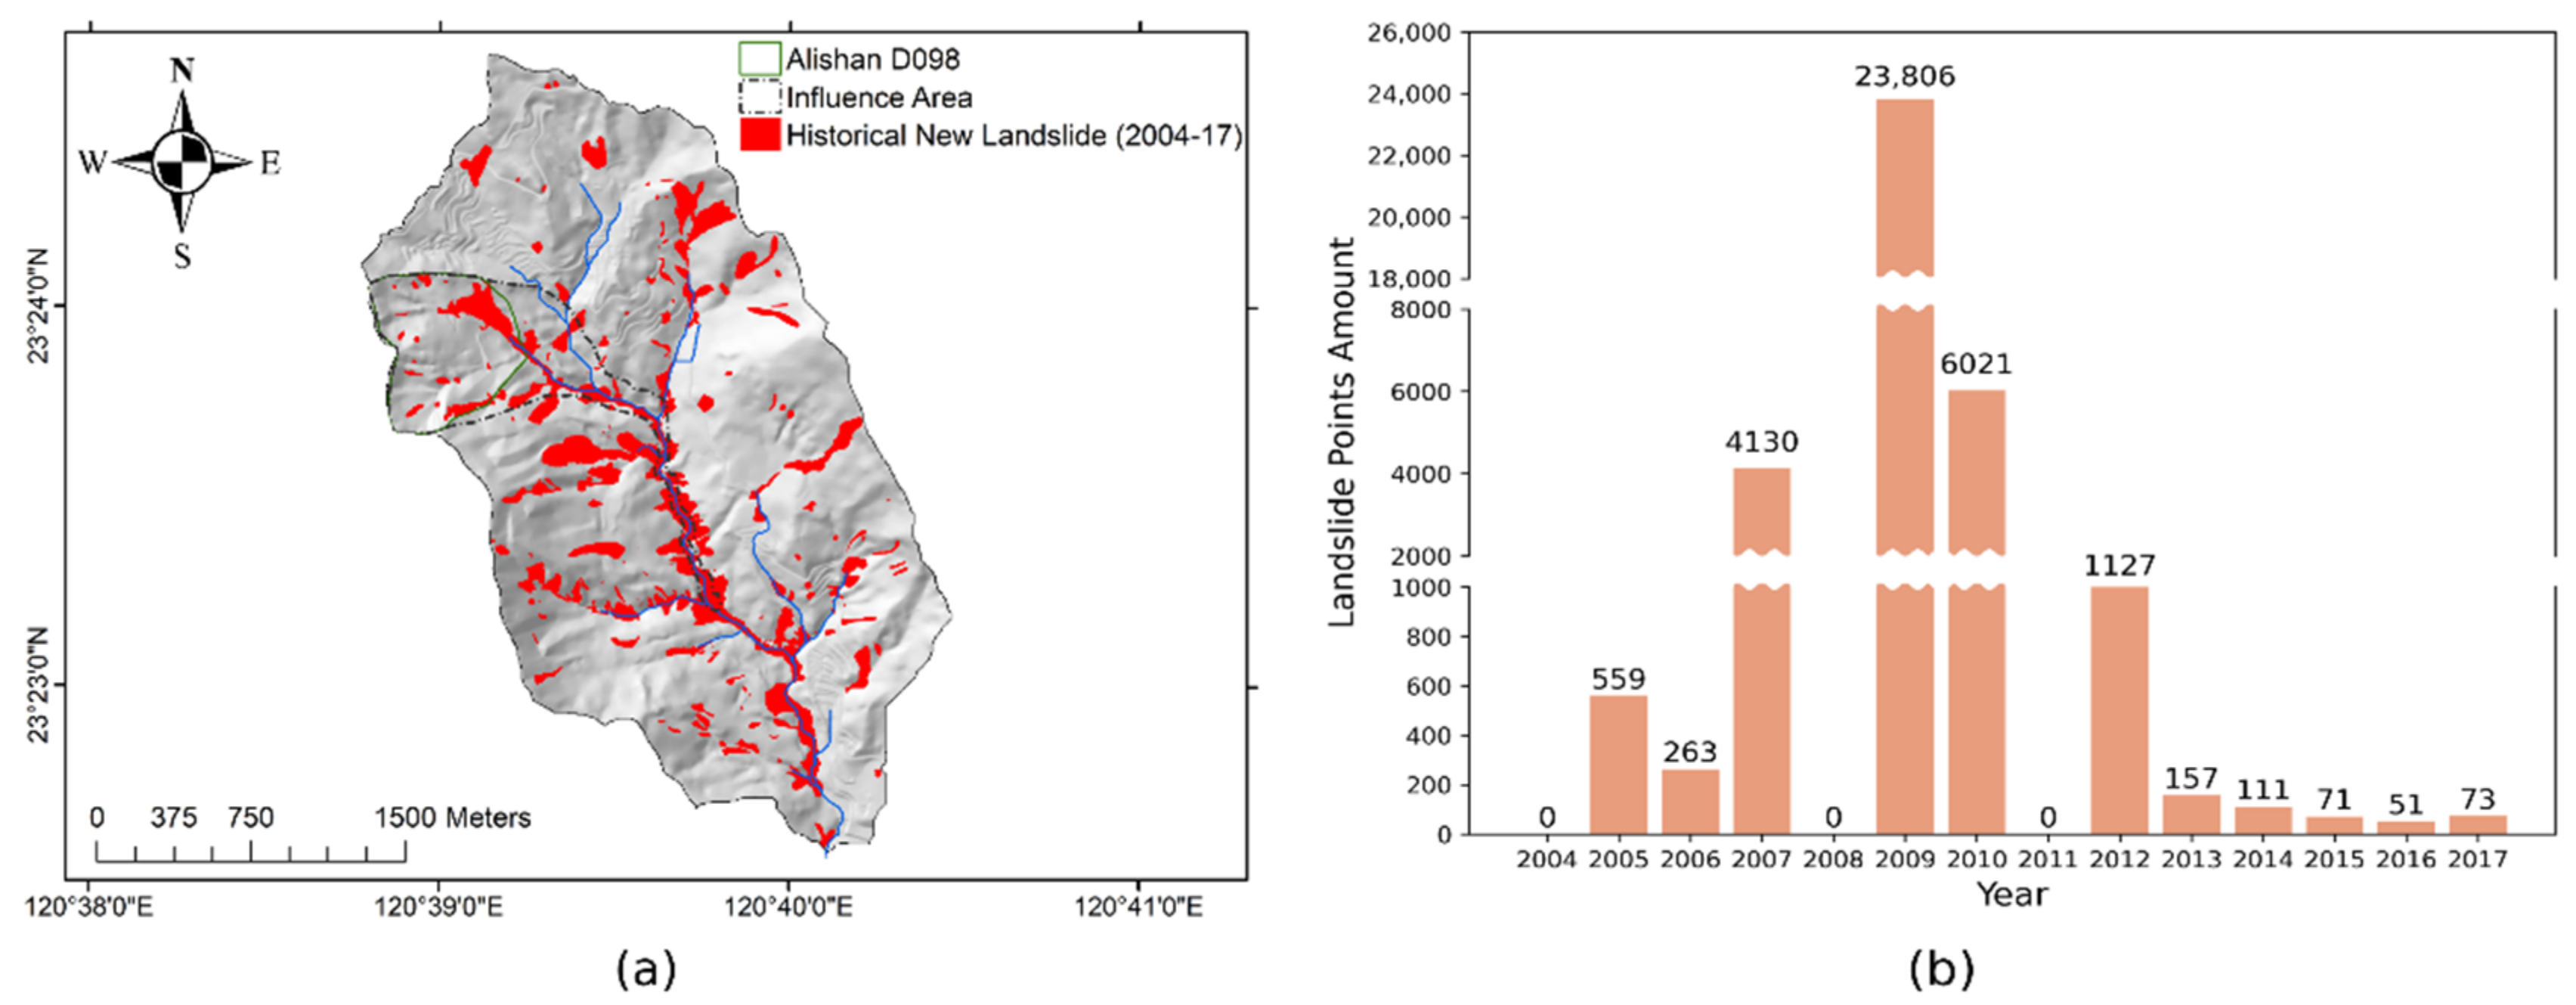
The analysis result shows the new landslide grid points in Alishan D098 and its influence area were calculated at about 7000 grid points, which is considered insufficient. As a result, new landslide grid points in the sub-basin where the influence area is located were added to augment the dataset (Figure 3a). The bar chart illustrates new landslide grid points in the sub-basin (Figure 3b) from 2004 to 2017, with a total of 36,369 grid points. The highest frequency occurred in 2009, with 23,806 grid points (equivalent to an increase of 59.5 hectares of new landslide area) in the basin as a result of Typhoon Morakot’s heavy rainfall. In 2004, 2008, and 2011, there were no landslide increases. Moreover, a significant decline in landslide occurrence has been observed since 2013.
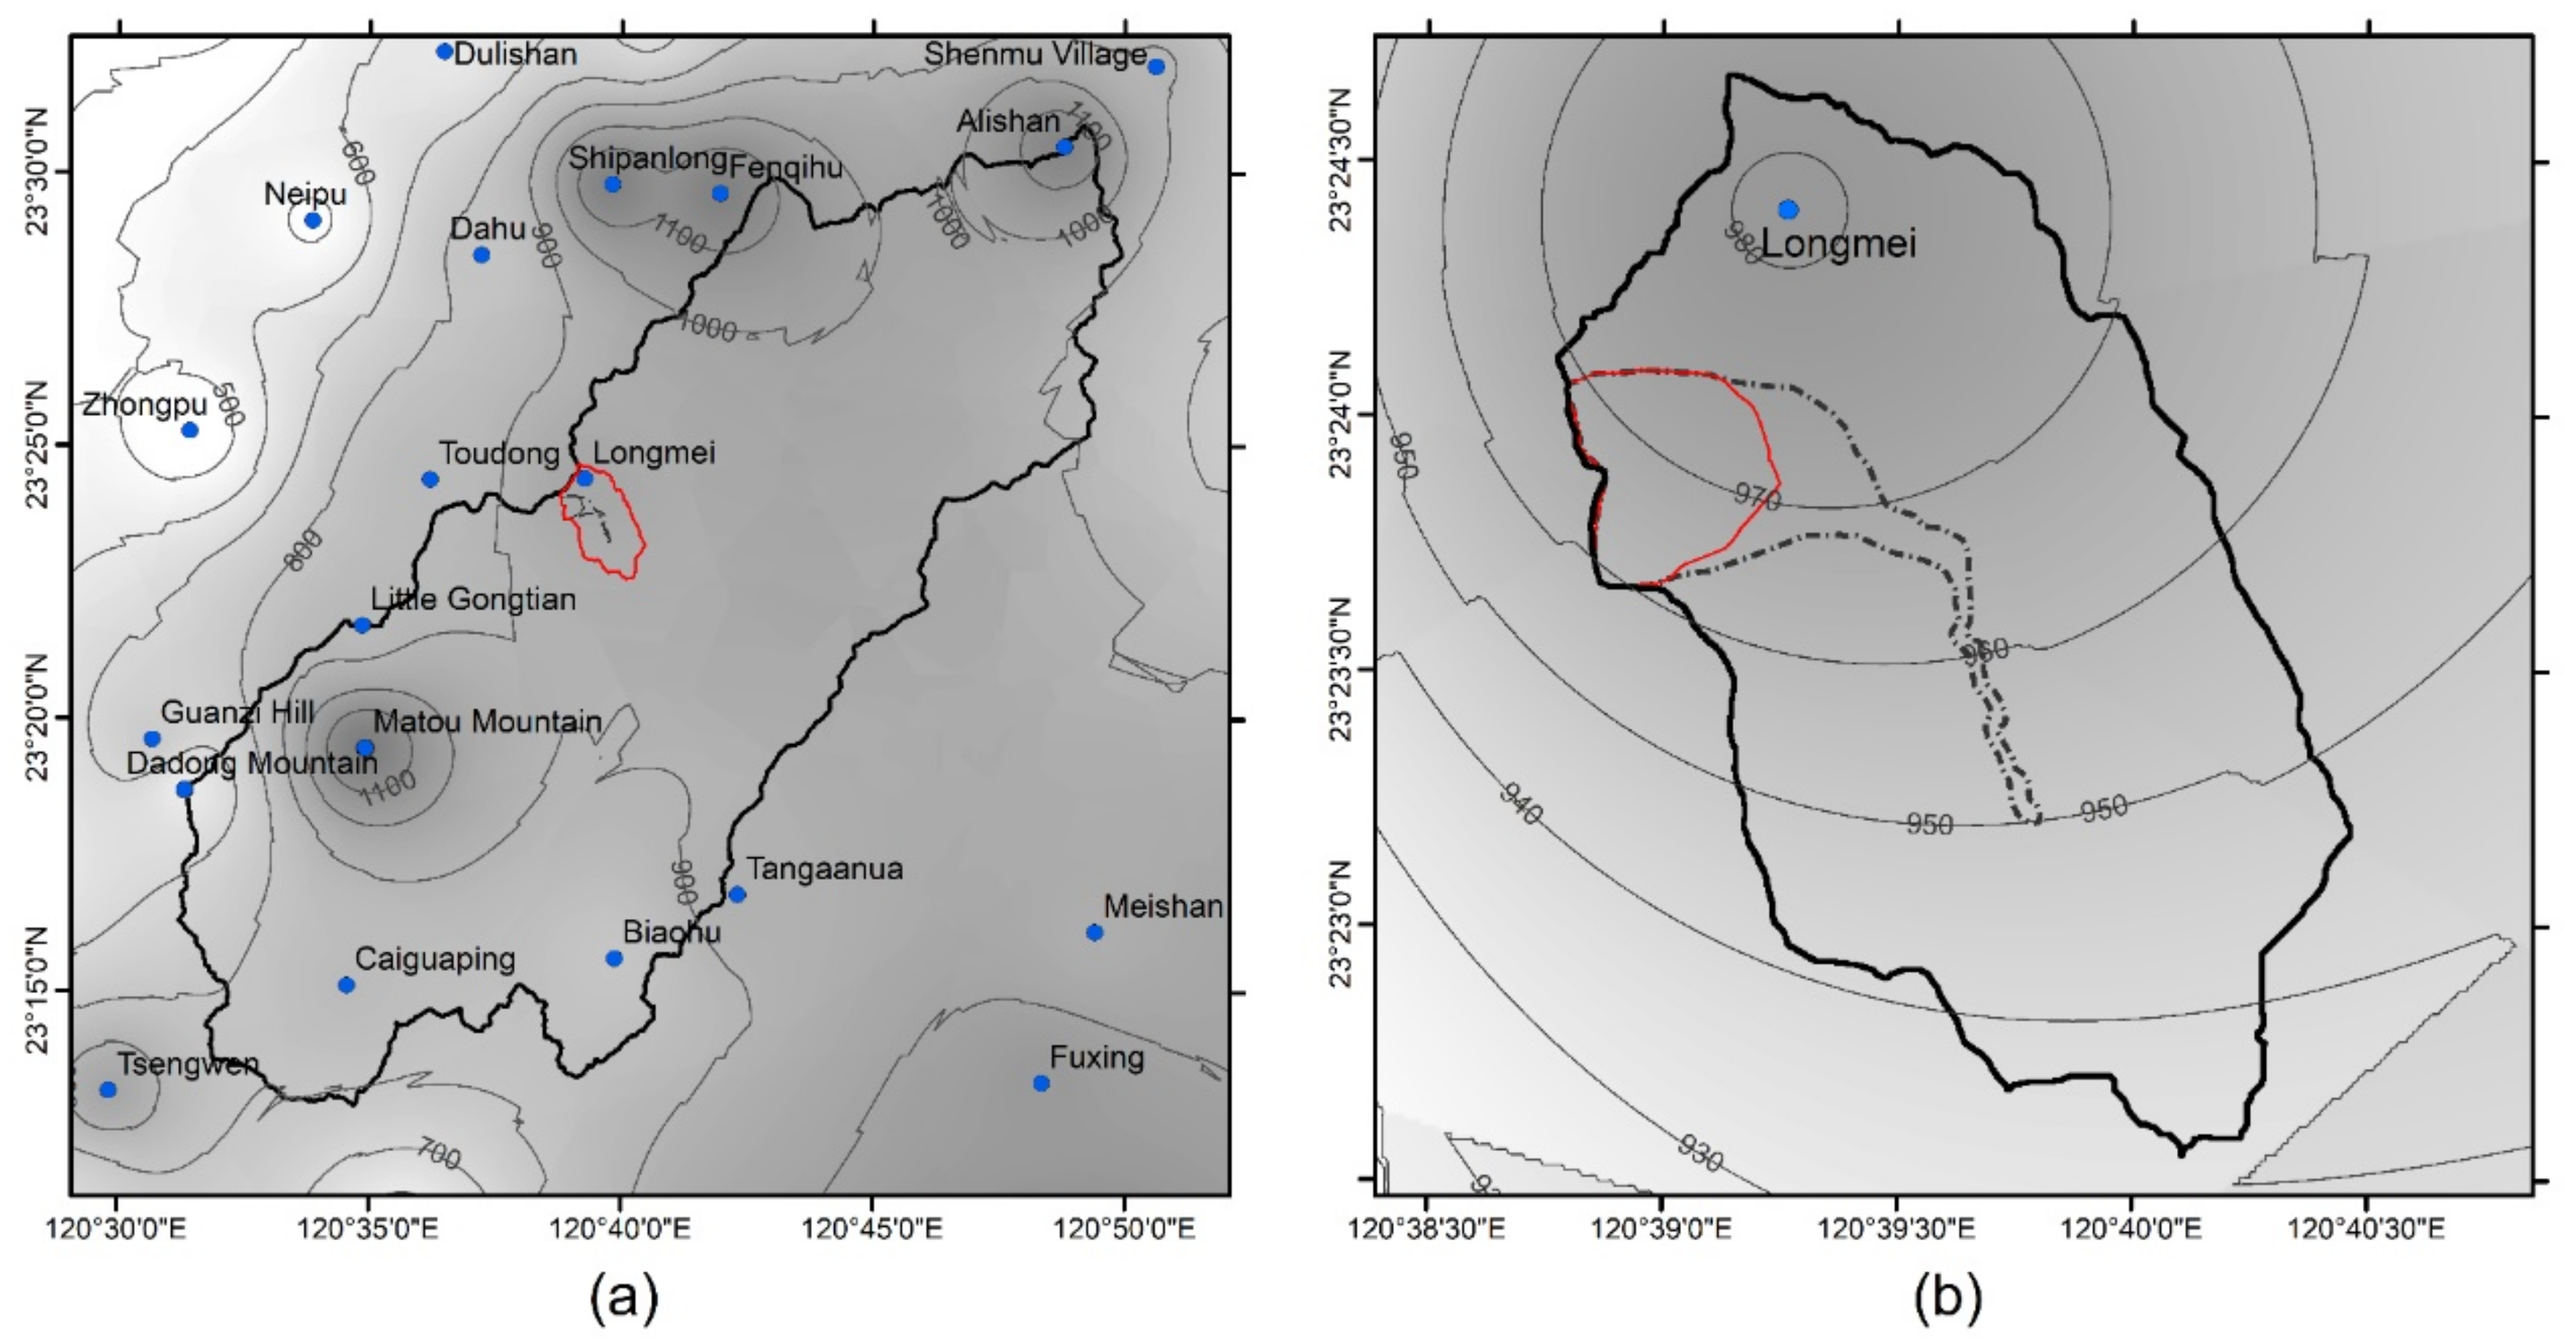
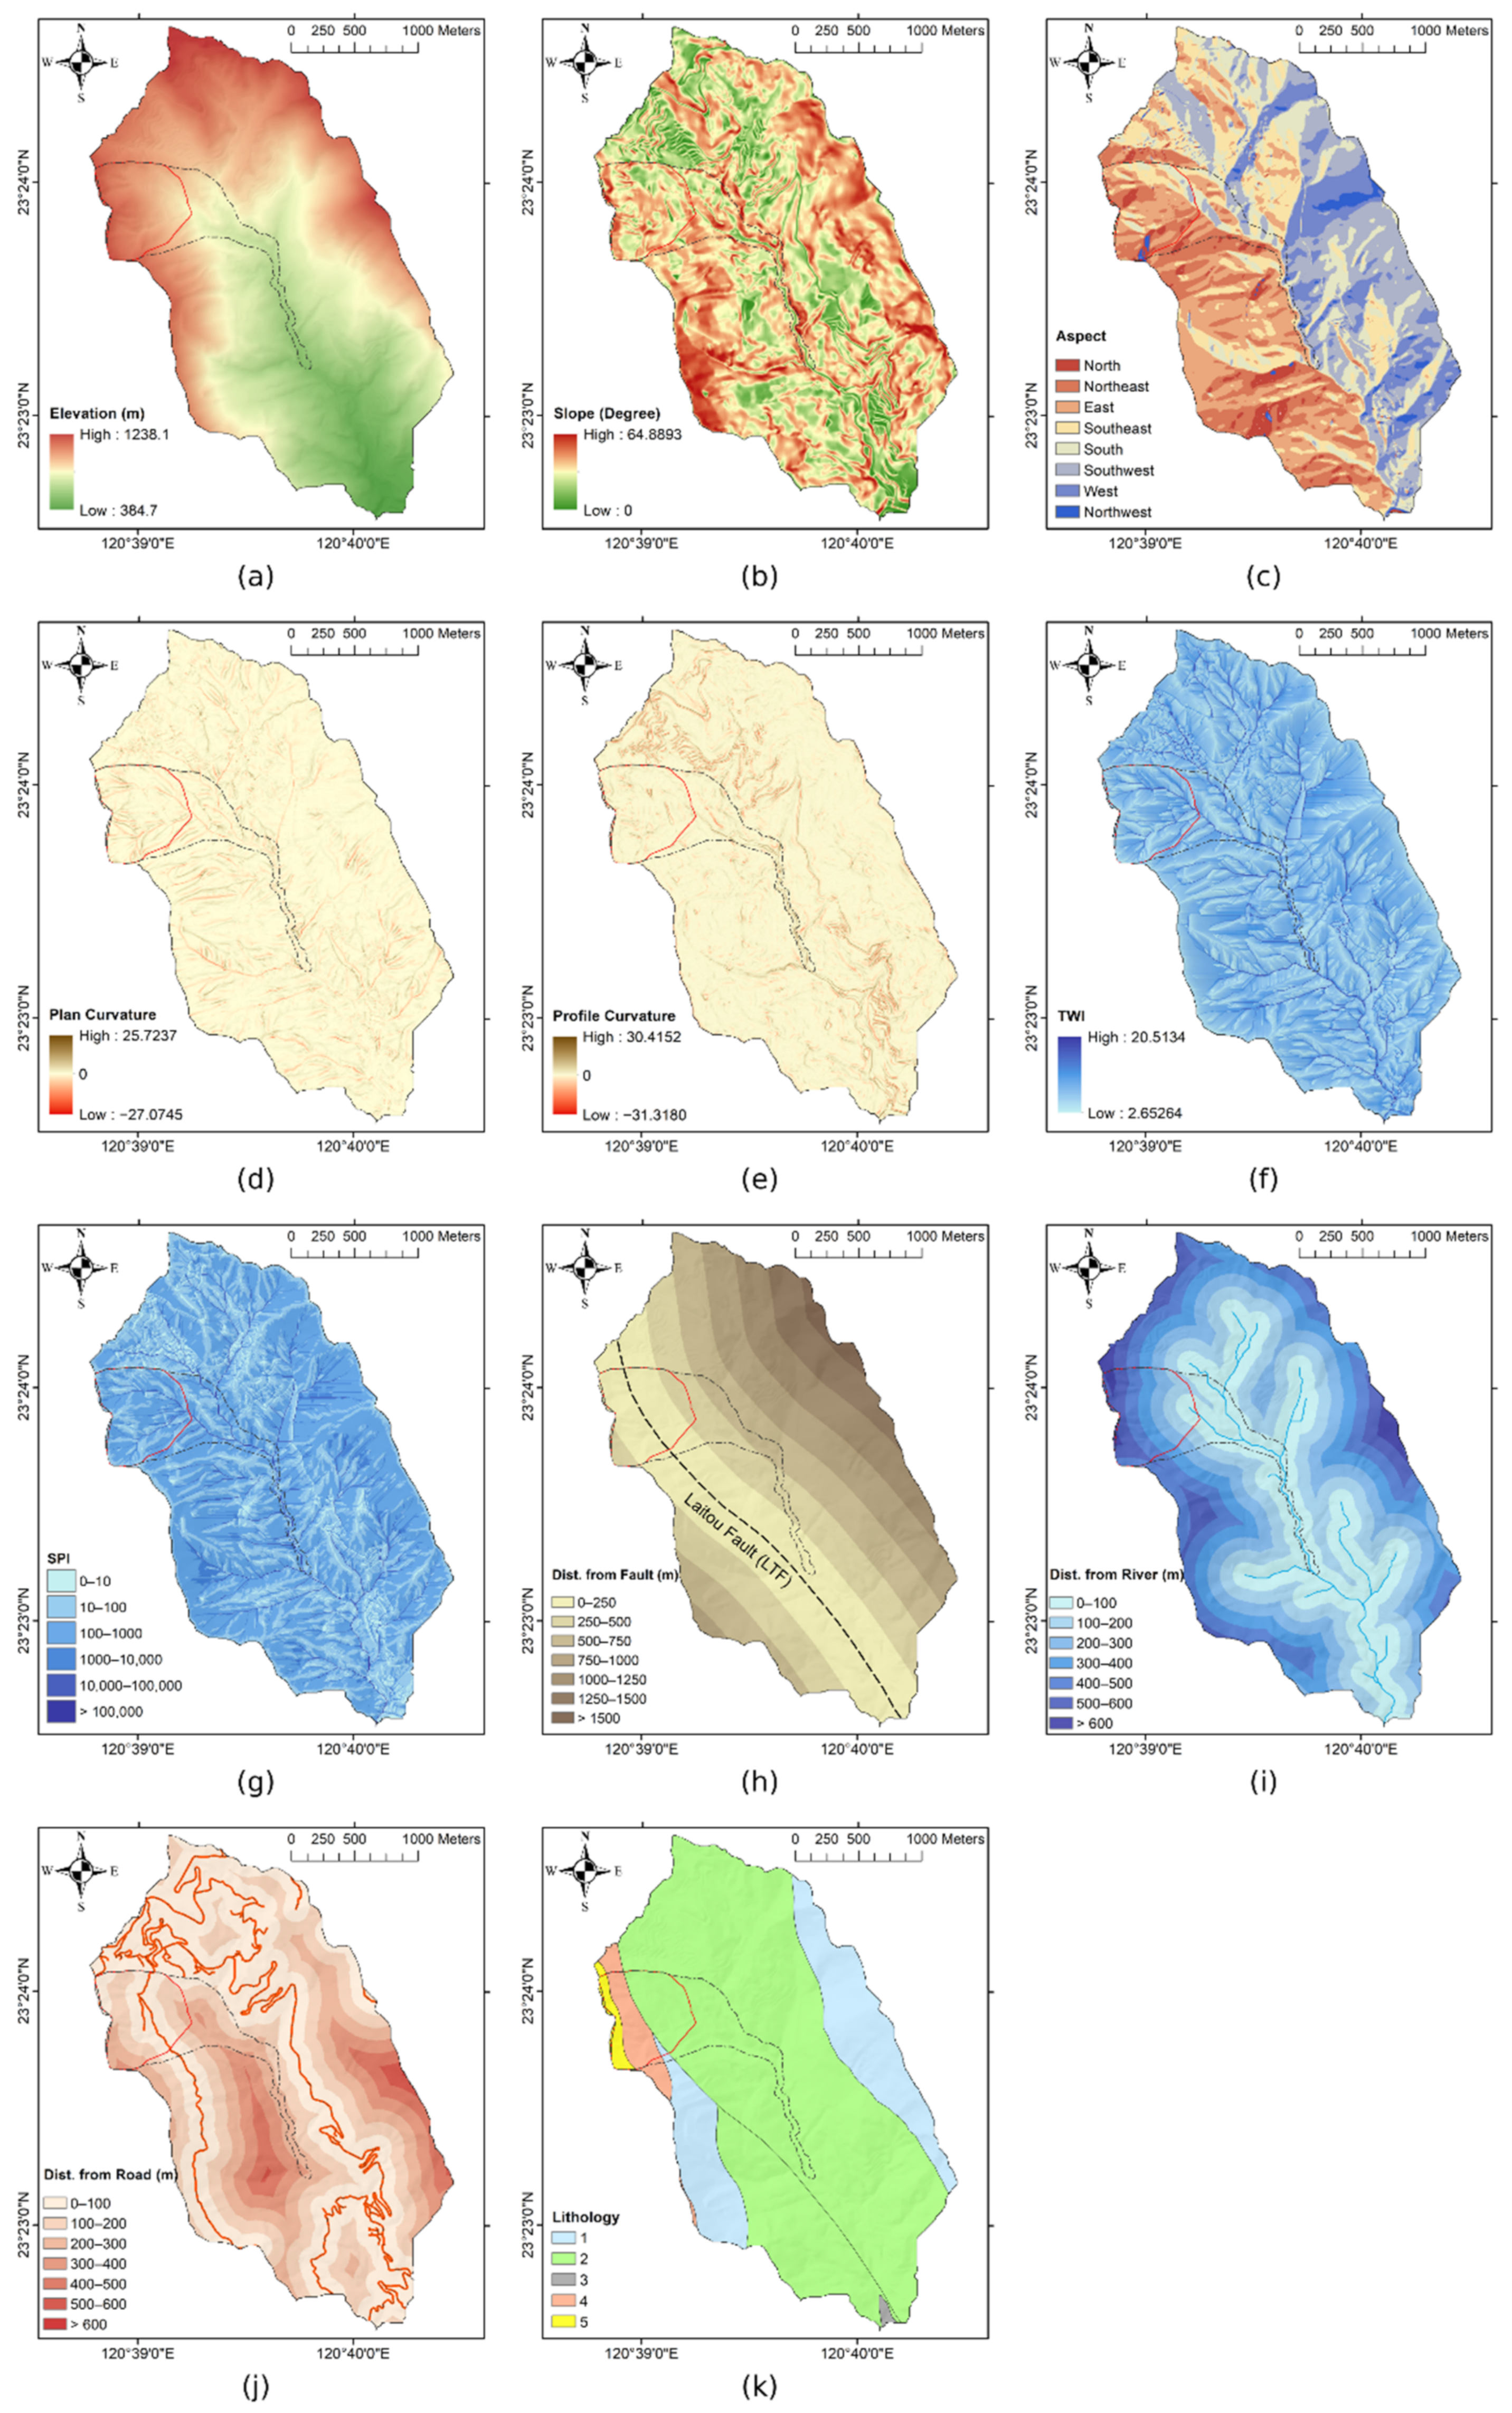
Based on literature research [18,22,39,40,41,42], 11 topographic factors were chosen (Table 1). The annual maximum daily rainfall (MDR) was collected from local rain gauge stations around Tsengwen Reservoir Watershed by the Central Weather Bureau (CWB) from 2004 to 2017 and was interpolated using inverse distance weighted (IDW) for conversion into spatial distribution grids (Figure 4a). The values extracted by the Point tool were used to match newly acquired landslide grid points from these grids with the corresponding topographic factors and the MDR. Figure 4b and Figure 5 depict the spatial distribution of 11 topographic factors and the MDR in the sub-basin.
Repeated points in the new landslide grid points dataset represented the landslides that occurred more than once during or after the recovery period due to topography with a high landslide risk. Given that the high-landslide-susceptibility area requires a lower landslide rainfall threshold, the year with the lowest MDR was retained when the grid point was repeated. After filtering, 5243 repeated points were reduced to 31,126 non-repeated points.
The grid points in the sub-basin were used as training and testing datasets for the deep learning models of landslide susceptibility classification and rainfall threshold regression.
The former was the input feature for both the landslide and non-landslide grid points, with the non-landslide grid points having the same count as the landslide grid points chosen at random for dataset balance; the latter was only used for the landslide grid points because the rainfall for the non-trigger landslide was unknown.
3.2. Preprocess
Preprocessing of new landslide grid points was required before model training. Only 11 topography factors were left to be assigned as input features, and the new landslide year of occurrence was considered as the label. The scikit-learn MinMaxScaler function was applied for feature standardization [43], which scaled all input features into a range of 0 to 1. The transformation serves two purposes: the first is to allow the optimization function to converge earlier during iteration, improving model accuracy, and the second is to combine the landslide susceptibility and rainfall threshold regression models, correcting the rainfall threshold once the model prediction is complete. The label was one-hot-encoded for the landslide susceptibility model. To give the lower MDR a large-scale value after transformation in the rainfall threshold regression model, first, the multiplicative inverse of the original MDR was used, and then the reciprocal of the MDR was scaled to a range from 0 to 1 with MinMaxScaler. Therefore:
3.3. Multicollinearity Analysis
The variance inflation factor (VIF) is the ratio of the overall model variance to the variance of a single independent variable model. It is used to determine variable multicollinearity. The VIF formula is shown below [44]:
where Ri2 is the coefficient of multiple determination of regression i.
Although the VIF threshold is still controversial, there is agreement on the maximum threshold. If the VIF of a factor exceeds 10.0 (or tolerance is less than 0.1), it is described as higher multicollinearity, which may have a negative impact on predictive power in multiple regression models [44,45]. The statsmodels was used to calculate the VIF [46]. In this study, the VIF threshold was set to 5 based on previous study recommendations [19,20,21] and considered the condition that exceeding values would be excluded and then reanalyzed until the VIF of all features showed a value of less than 5.
3.4. The Framework of Deep Learning Model
Deep learning is an artificial neural network (ANN) architecture with multiple and continuous layers between the input and output layers, with the number of layers increasing the model’s depth. The weight values stored in the layers are interacted with and transformed in this model to determine the rules via the connection of neurons between layers. The predicted values are expected to match the true values.
Keras API is a Python deep learning library for high-level neural network programming, similar to TensorFlow and PyTorch. However, Keras API can build deep learning models faster and easier [47]. Hale [48] evaluated 11 popular deep learning applications based on usage, interest, and popularity. TensorFlow, Keras, PyTorch, Caffe, and Theano topped the preference list, with Keras being preferred most by deep learning novices. According to a Kaggle survey of data scientists and machine learning engineers, Scikit-learn is the most popular machine and deep learning library, followed by Tensorflow and Keras API [49].
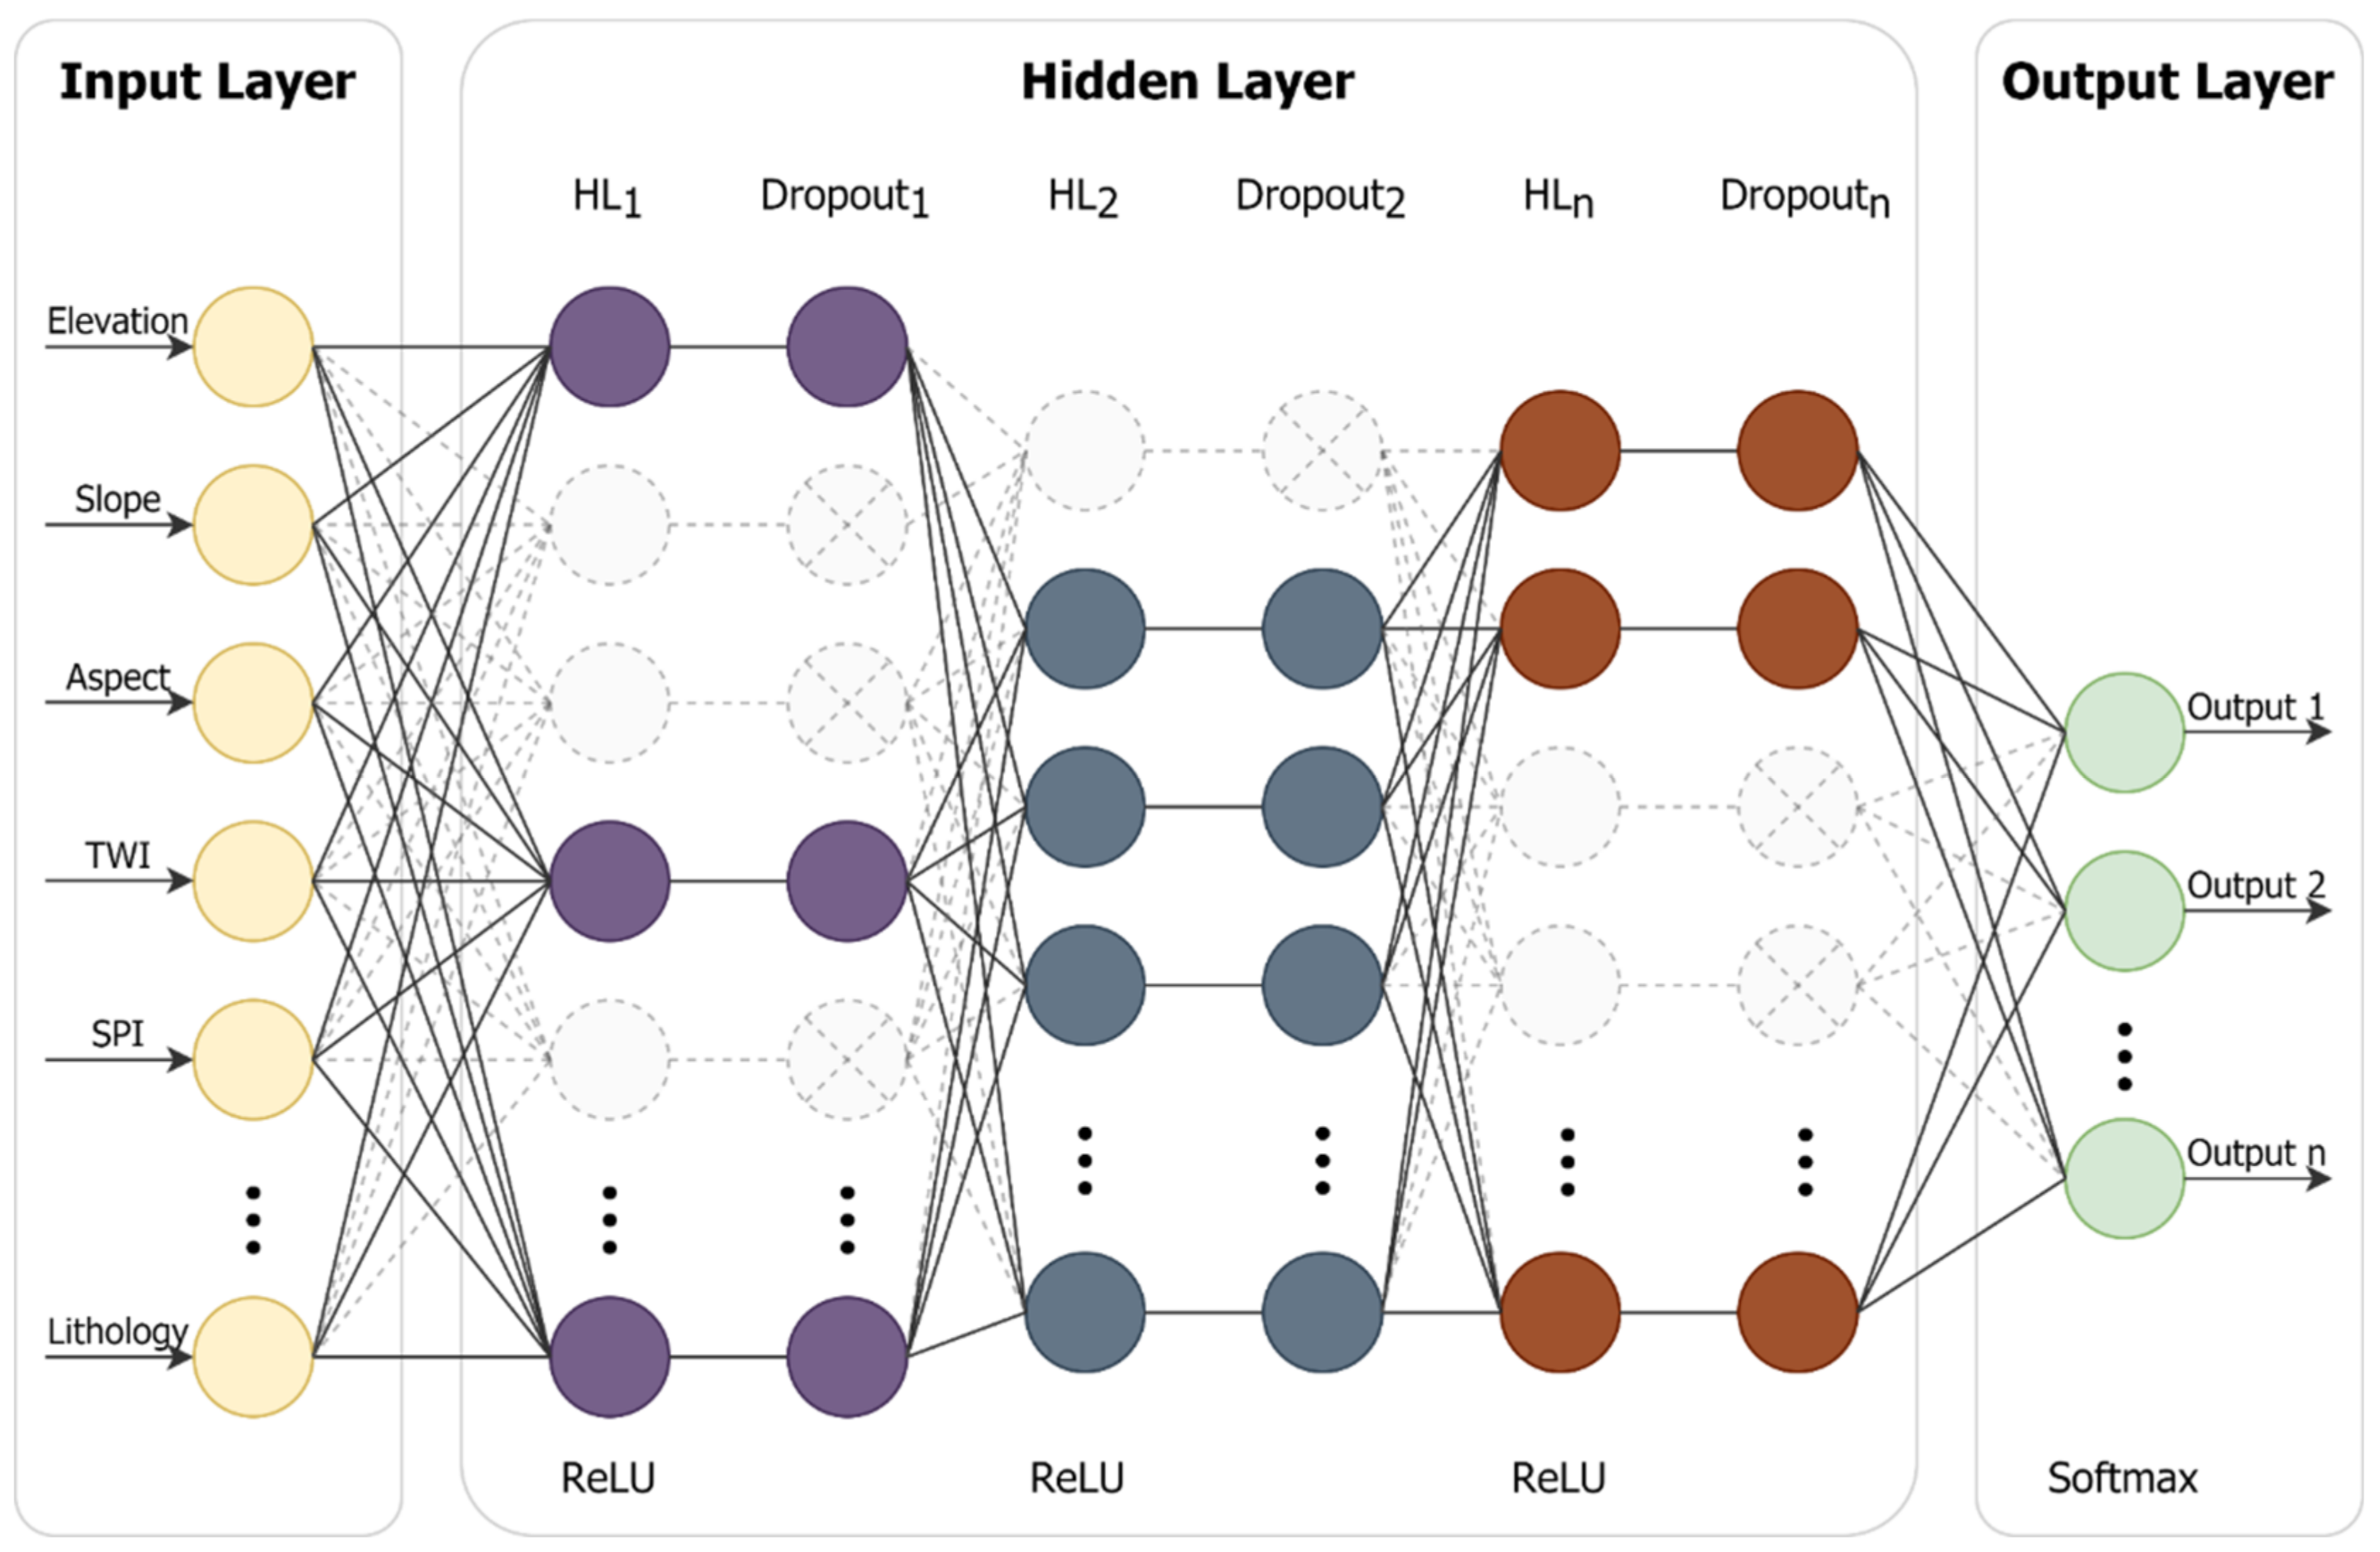
The multilayer perceptron (MLP) in Keras API was used to build the deep learning model in this study. MLP architecture is shown in Figure 6. Moreover, the dropout layer was added after each hidden layer to reduce the model’s overfitting problem; the input value for the dropout layer indicates that the ratio of neurons will not be used in this layer. The normalized exponential function (Softmax), Softplus, Softsign, rectified linear unit (ReLU), hyperbolic tangent (tanh), sigmoid, and exponential are some activation functions provided by Keras API [47]. As a result, different activation functions are appropriate for various layers and purposes. The ReLU function was used for each hidden layer, and the Softmax function was employed for the output layer of the landslide susceptibility model. However, the regression model is usually not required to set the activation function of the output layer, with the output value expected to be between 0 and 1; therefore, Sigmoid was used for the rainfall threshold regression model’s output layer. The ReLU, Softmax, and Sigmoid function formulae are as follows:
where zj is the raw output value of the layer j, and K is the total number of labels. The total percent of the output value in the classification model must be equal to 1.
Stochastic Gradient Descent (SGD), Root Mean Square Propagation (RMSProp), and Adaptive Moment Optimization (Adam) are among the Keras optimizer algorithms. Binary cross-entropy loss (CE, also known as sigmoid cross-entropy loss), mean absolute error (MAE), and mean squared error are among the loss functions (MSE). Setting Adam and MSE as the optimization algorithm and loss function, respectively, yields the highest model predictive accuracy [22]. Therefore, Adam and MSE were assigned to this study.
Adam is an SGD-based algorithm with the added benefits of AdaGrad and RMSProp. It has high computational efficiency and low memory usage. Adam Optimizer’s algorithm functions are as follows [50]:
where is the timestep, m is the first moment vector, is the second moment vector, is the gradients with respect to the stochastic objective at , is the resulting parameter, is the stepsize, , are the exponential decay rates for the moment estimate, and is the value that, to be prevented, must be divided by zero. The final parameter vector is returned when is converged. The suitable parameters for Adam Optimizer are: ; ; , and .
Typically, the epoch is determined by training a model several times and selecting the appropriate epochs from the results. If the epochs are too long or too short, it will result in overfitting for the validation loss or underfitting for the training loss, and the model’s performance will suffer as a result. To improve on this, we set the EarlyStopping function to monitor the validation loss and stopped training if the validation loss was no longer reduced after 10 consecutive training sessions.
3.5. Hyperparameter Tuning
Deep learning model parameters are typically chosen via manual selection based on previous experiences and research, trial and error, grid search, and or random search methods. Although the babysitting and random search are simple and quick, these strategies are not always the most appropriate combination. On the other hand, the grid search will always obtain the best combination; however, it will be time-consuming to search in cases with a large number of combinations. The current study used KerasTuner [51], a Keras hyperparameter tuning library, to determine the parameter of each hyperparameter in the model, such as the number of hidden layers, the neurons of each hidden layer, the dropout rate of each dropout layer, and the stepsize () of the Adam Optimizer, in order to provide the most suitable combination in a short period of time. In addition, the Hyperband Tuner was selected to obtain the best model parameters. The range of hyperparameters for the model defined in this study is listed in Table 2.
3.6. Model Evaluate
The model was tested on validation and test datasets to assess the model’s accuracy after training. In this study, the accuracy of the landslide susceptibility model was evaluated using a binary confusion matrix. The model performance evaluation metrics used the OA, which is defined as the ratio of all true predicted data (TP + TN) to all data; precision, which is defined as the ratio of true positive data predicted by the model (TP) to all true data predicted by the model (TP + FP); and recall, which is defined as the ratio of true positive data predicted by the model (TP) to all actual true data (TP + FN):
In addition, some common indices for evaluation were selected, such as the F-score, Cohen’s kappa coefficient (κ), and Matthews correlation coefficient (MCC). The F-score was proposed by van Rijsbergen in 1979, and introduced by Chinchor [52] in 1992. The formula of the F-score is the following:
where is the relative importance of the precision and recall; if , the precision is as important as the recall, meaning the F1 score, as well as the harmonic mean of the precision and recall [53].
Matthews introduced the MCC classification accuracy index in 1975 (in the range of −1 to 1). If the value is close to 1, it represents the best and most consistent classification accuracy; a score close to 0 indicates poor classification accuracy, and a score close to −1 shows an inconsistent difference between the true and predicted classification accuracy. According to Chicco et al. [54], the MCC can provide more realistic and informative results than the commonly used Cohen’s kappa coefficient and Brier score. Chicco and Jurman [55] also demonstrated that the MCC will receive a higher score when the confusion matrix categories have high precision, whereas the accuracy and F-score in imbalanced datasets are prone to over-optimism. The formulae for Cohen’s kappa coefficient (κ) and MCC are as follows [54]:
The rainfall threshold regression model was evaluated using MAE, root mean square error (RMSE), and mean absolute percentage error (MAPE). MAE and RMSE are used to compute model error, while MAPE is used to calculate the model accuracy. The formulae for the three metrics are as follows:
where A(i) is the actual value of data i, P(i) is the predicted value of data i, and n is the total of the dataset.
All models in this study were built using Desktop PC with Intel Core i7, Processor 3.20 GHz, 40 GB RAM, and python language 3.9.7 through Spyder IDE 5.1.5 compiler.
4. Results and Discussion
4.1. Correlation and Multicollinearity between Factors
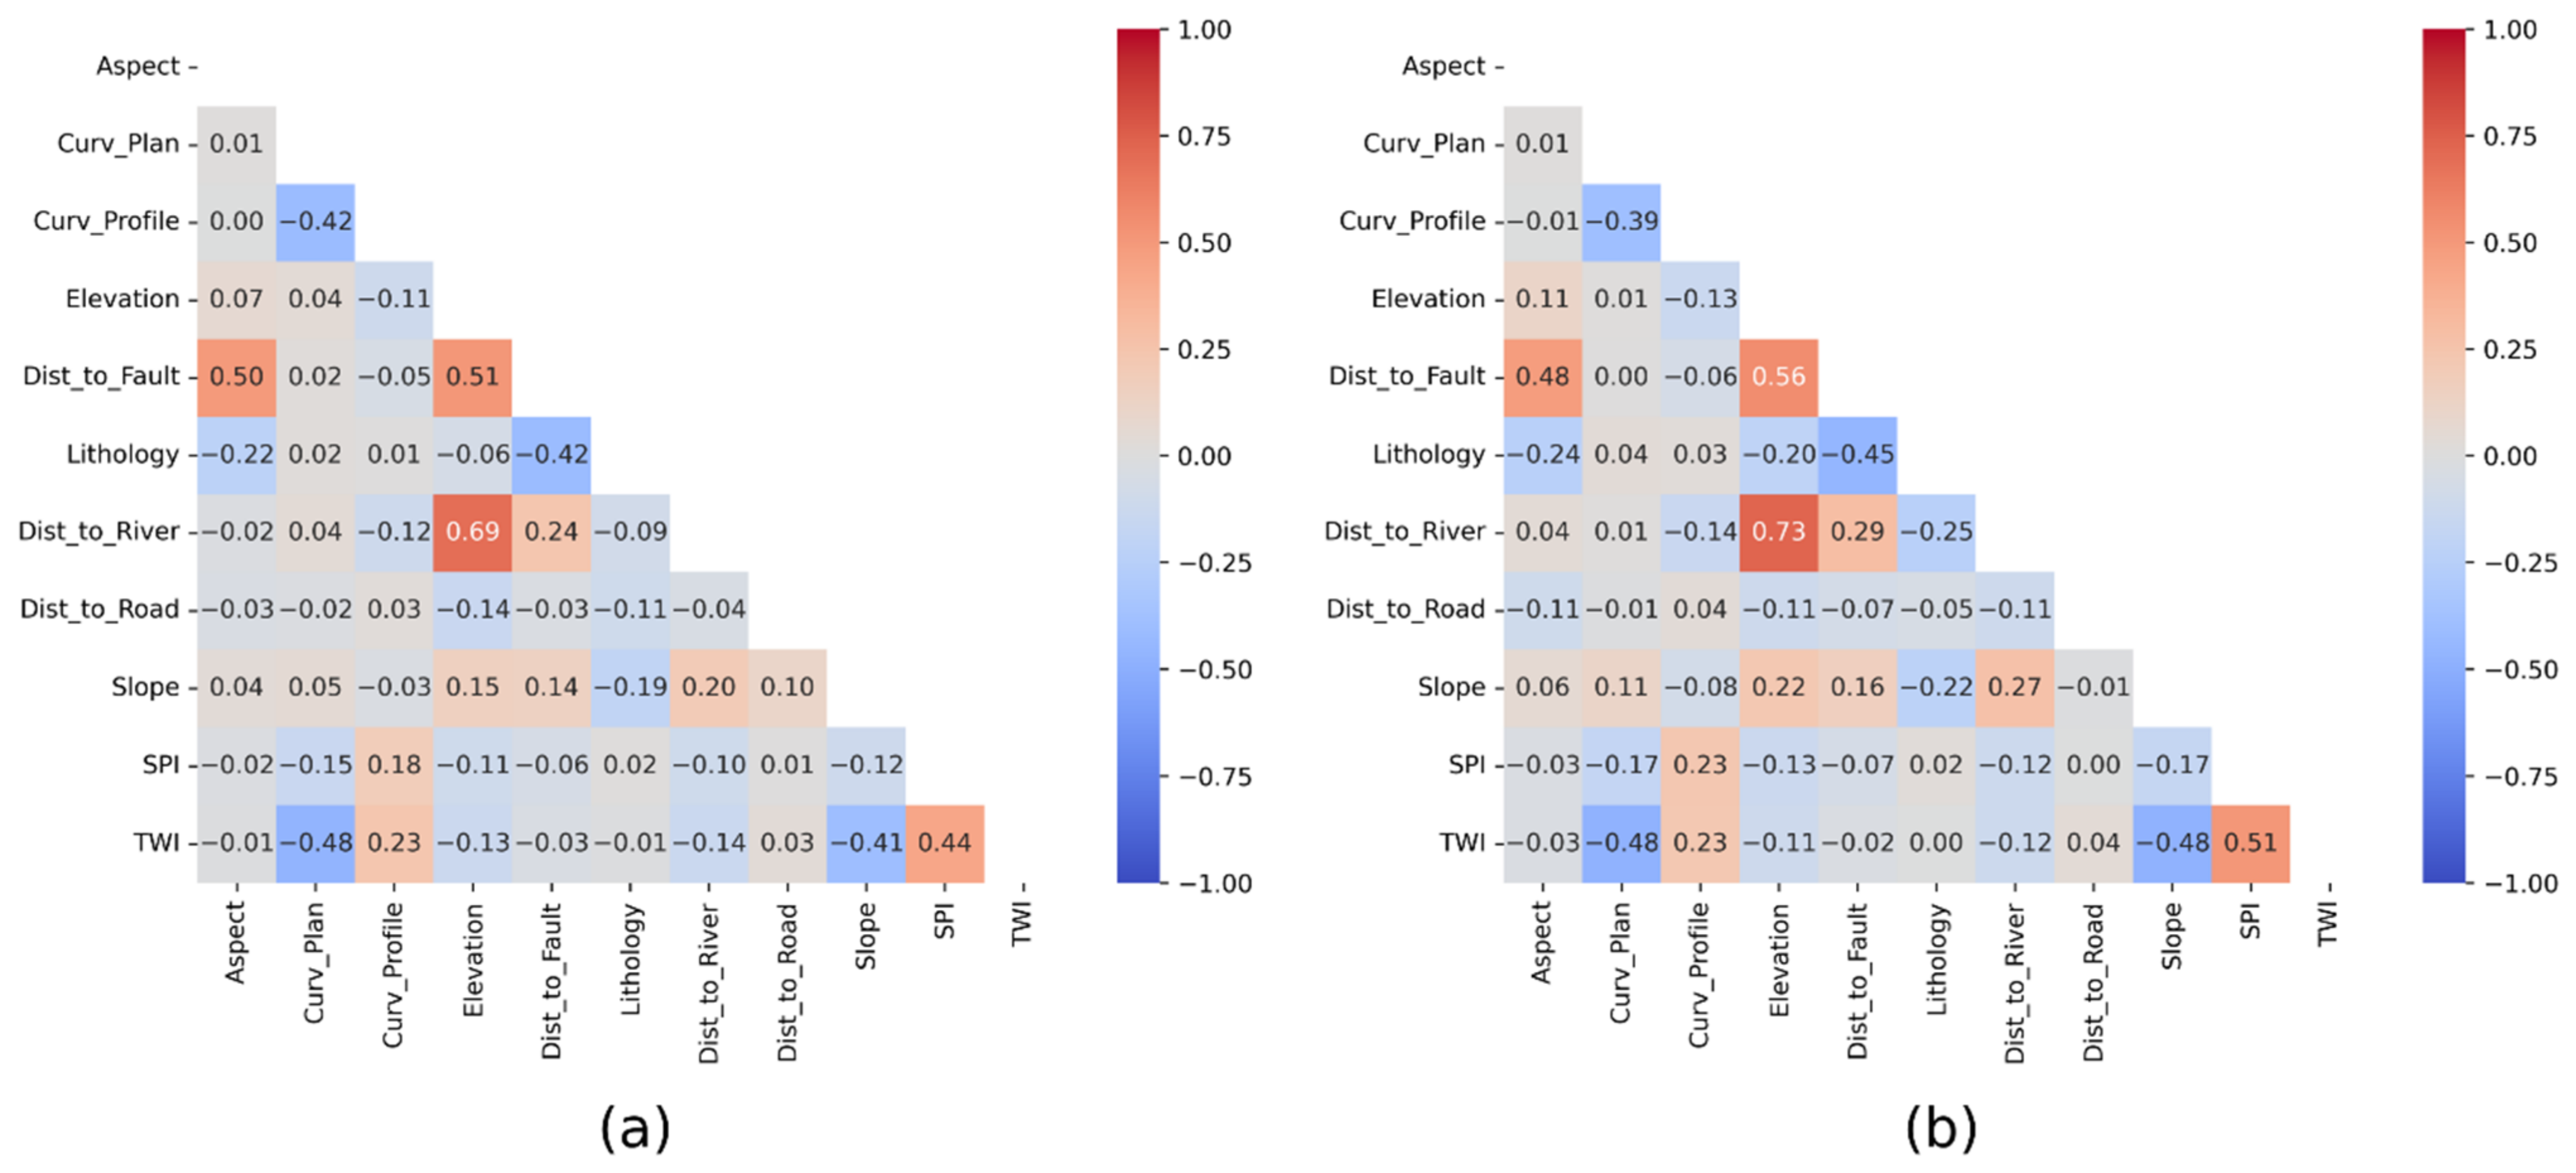
First, the correlation between factors was investigated by using the Pearson correlation coefficients (PCCs). PCCs close to 1 or −1 represent the probability of extreme multicollinearity while PCCs close to 0 indicate almost no multicollinearity between factors. The results (Figure 7) show that the highest PCCs between factors were observed in elevation/distance to river, elevation/distance to fault, SPI/TWI, and aspect/distance to fault, with both PCCs being greater than 0.5 or less than −0.5. Table 3 shows the results of the multicollinearity analysis. The VIFs of 11 terrain factors were all less than 5, with the highest being 2.916 and 3.330 in elevation, and the second being 2.444 and 2.492 in distance from the fault. The distance to the road was the lowest. All factors were used for model training and prediction based on the VIF results.
4.2. Result of Hyperparameter Tuning
Table 4 shows the top three validation loss score combinations based on model hyperparameter results. The validation loss score of the best combination for the landslide susceptibility classification model was 0.0801; the architecture contained four hidden layers with 108, 84, 100, and 112 neurons, and the dropout rate of the dropout layers was 0.05, 0.25, 0.45, and 0.3, respectively. Additionally, the stepsize of the Adam Optimizer was 0.000874, and the validation accuracy was 90%; this combination was the same as the second. The validation loss score of the best combination for the rainfall threshold regression model was 0.0675, which had four hidden layers with 124, 128, 36, and 72 neurons, respectively, and the dropout rate of the dropout layers was 0.2, 0.2, 0.25, and 0.1, respectively, and the stepsize of the Adam Optimizer was 0.001889. The combination with the best validation loss score was applied as the model parameter in the study based on the results.
4.3. Training and Evaluated Results
The total dataset was split into train and test datasets in the ratio of 70% to 30%, respectively. The prediction data were based on all grid points within the study area, with a batch size of 50,200 epochs, and 20% for validation dataset. The model parameters were determined using tuning hyperparameters to produce the best combinations of validation loss scores.
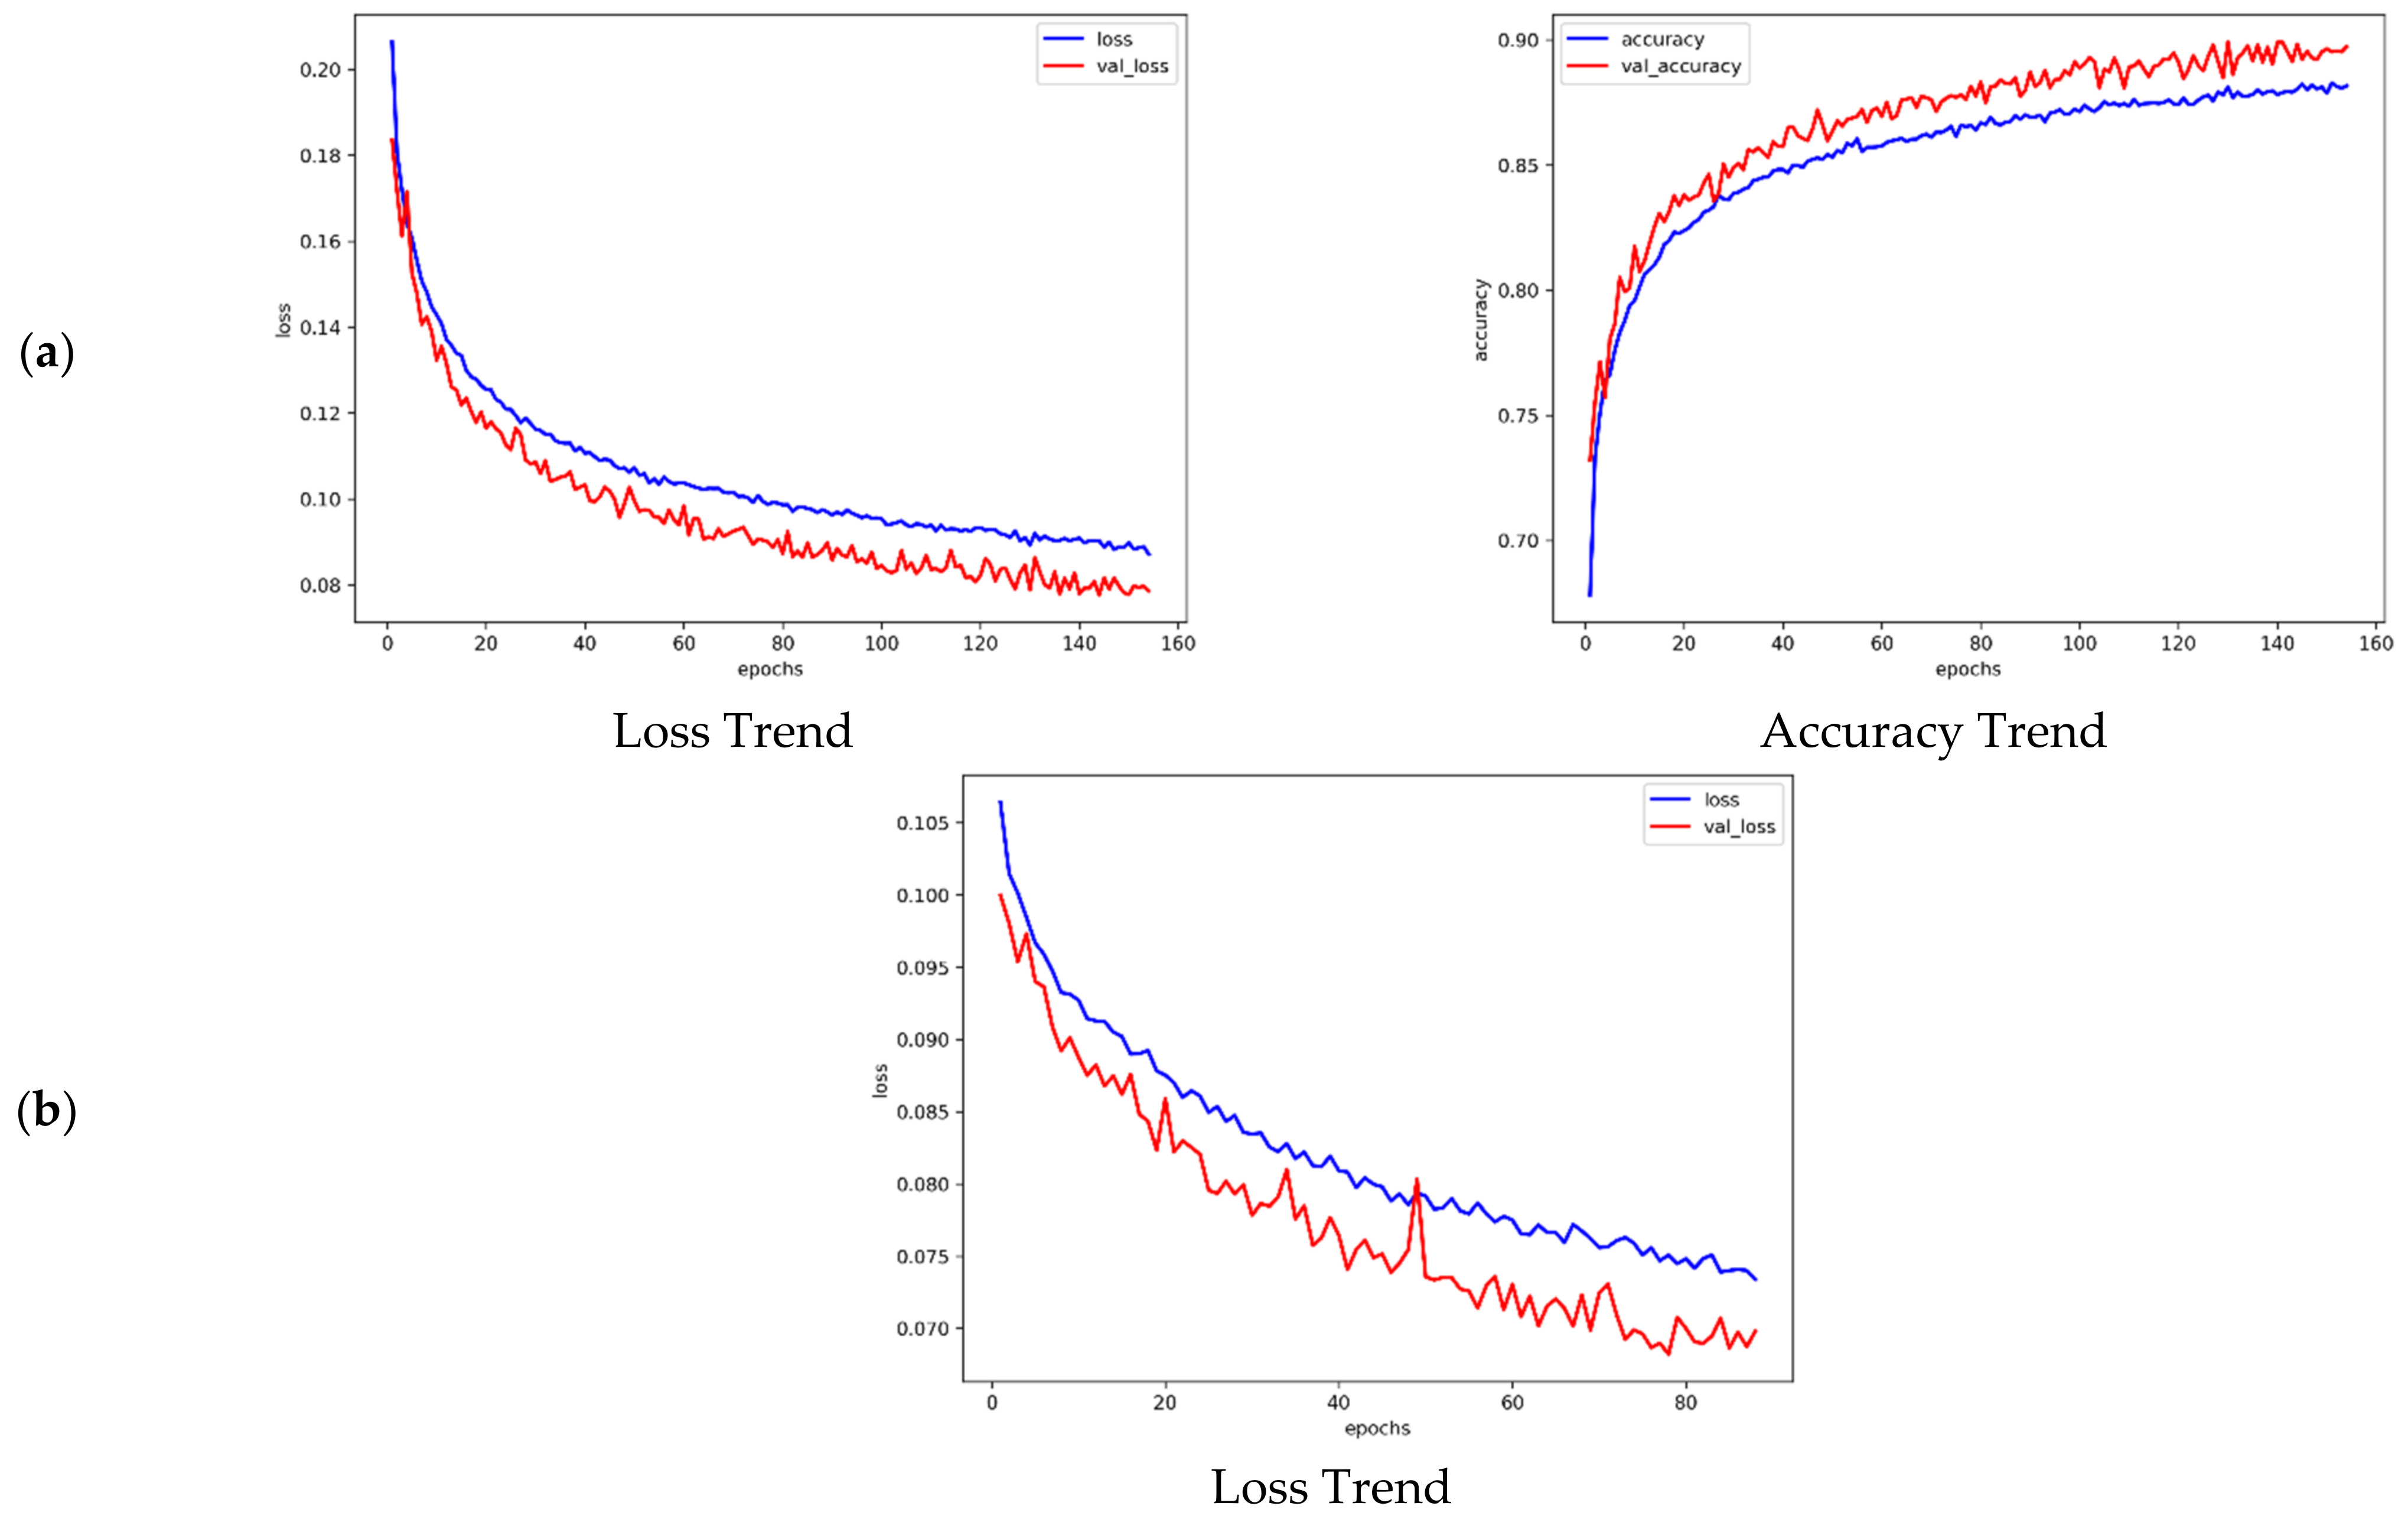
The results for the landslide susceptibility classification model show that the early stopping function ceased during training while the epoch was approaching 155 times (Figure 8a, Table 5). The final accuracy and loss for the training dataset were 0.8816 and 0.0871, respectively, and 0.8973 and 0.0786 for the validation dataset. The overall accuracy, F1 score, Cohen’s kappa, and MCC for the training dataset were 0.9094, 0.9092, 0.8187, and 0.8211, respectively, while the results show 0.8959, 0.8957, 0.7918, and 0.7944 for the test dataset. The high model metric scores indicate the model is able to predict reliable results.
During the rainfall threshold regression model training, the early stop function paused when the epoch reached 89 times (Figure 8b, Table 5). The calculated final loss for the training and validation datasets was 0.0734 and 0.0698, respectively. The MAE, RMSE, and MAPE of the training dataset computed 180.09 mm/day, 228.03 mm/day, and 26.31%, respectively; for the validation dataset, these were 185.98 mm/day, 233.97 mm/day, and 27.16%. The reason for the high MSE and RMSE errors is that the actual rainfall at the time of the landslides could not be captured; therefore, this study assumed that the landslides occurred when precipitation reached the maximum daily rainfall for the year; accordingly, the training results for the model still had errors and uncertainties. Although the model’s results were not perfect, MAPE was calculated at about 27%, which is within an acceptable range. Figure 9 shows the ROC area under curve of training and test models.
4.4. Predicting and Revising Landslide Rainfall Threshold
Generally, when the susceptibility factor shows a higher value and the rainfall threshold factor a lower value, the risk of landslide occurrence is elevated. As a result, the emergency evacuation is triggered earlier.
Therefore, the prediction dataset was used as input for the trained model to calculate the landslide susceptibility factor and rainfall threshold factor with values ranging from 0 to 1.
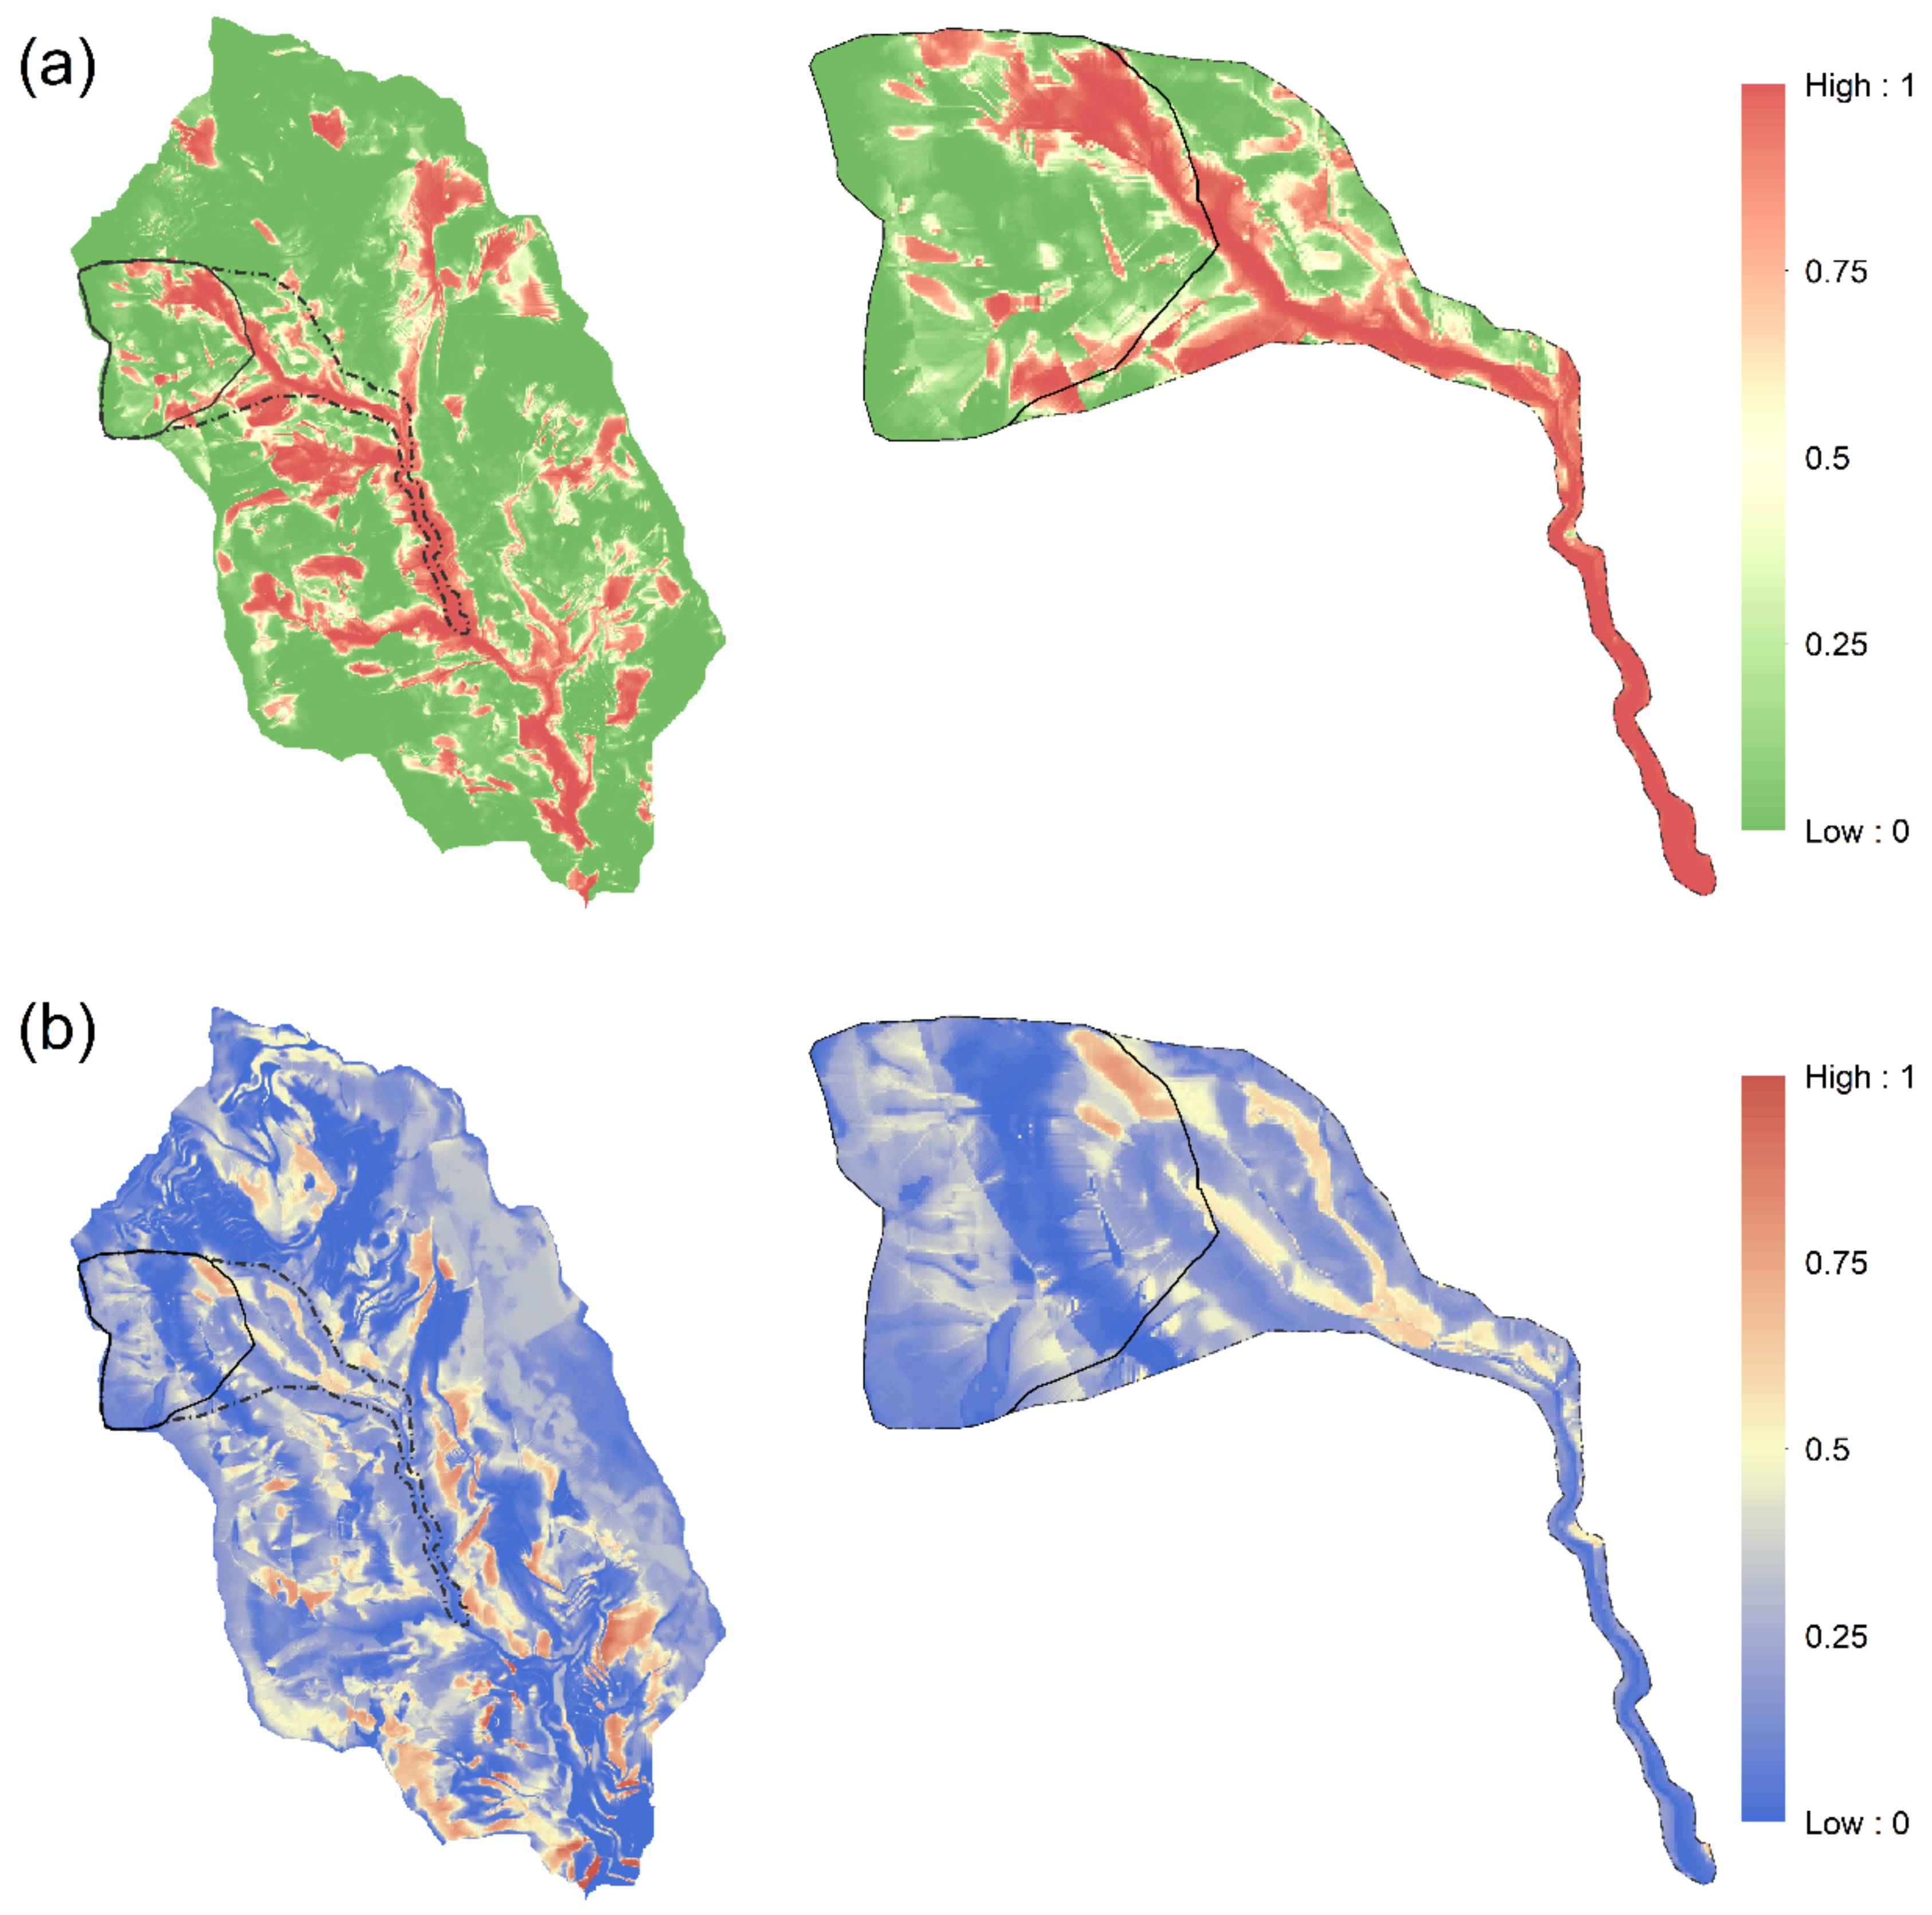
The spatial distribution tagged image file (TIF) for prediction results is from the Geospatial Data Abstraction Library (GDAL) [56] and was mapped in with ArcGIS. Figure 10 shows that the landslide susceptibility factor in the historical landslide area and downstream was higher than in other areas, whereas the high rainfall threshold factor was primarily found in areas with obvious topographic changes.
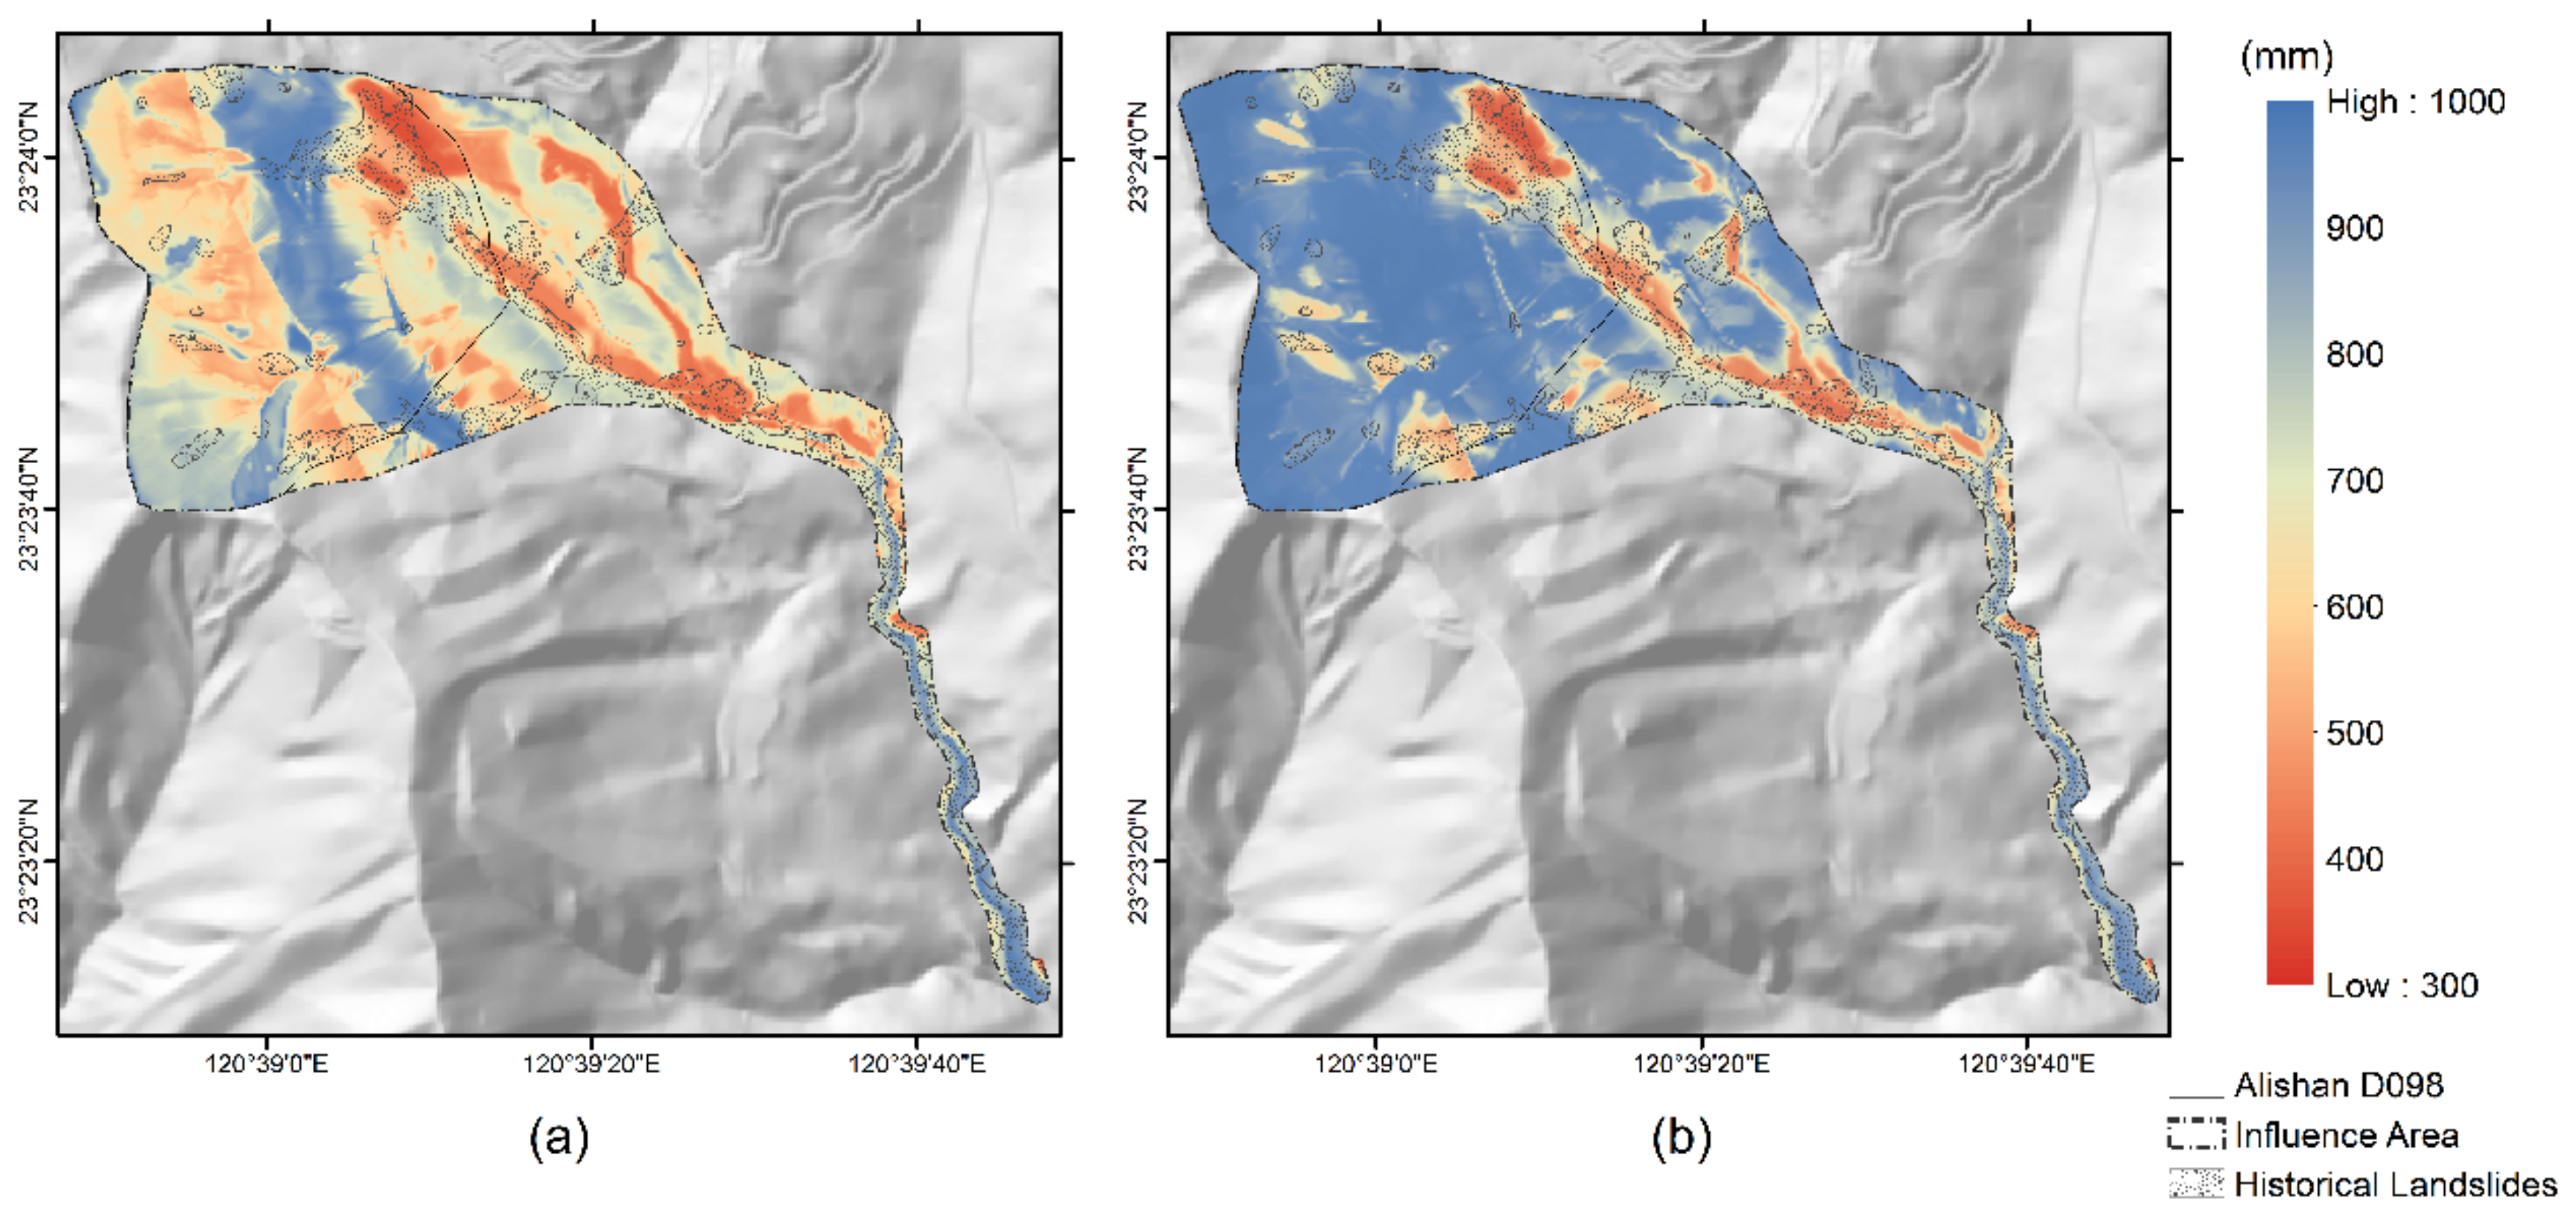
Although the rainfall threshold model’s input data include topographic factors, these factors were excluded from the training data due to missing landslide rainfall values in the non-landslide area, because the rainfall threshold model was only able to estimate the rainfall threshold data in the landslide areas. Accordingly, the training model eliminated topographic features of the non-landslide zone and the prediction results show a lower rainfall threshold value for non-landslide areas. It was assumed that the landslide occurred when rainfall surpassed the highest daily precipitation of the year because the actual precipitation landslide threshold was not known; therefore there was still uncertainty in the training model’s outputs. To obtain the revised landslide rainfall threshold factor, two predictions were multiplied. This method significantly reduces the factor of the area with low landslide susceptibility and low rainfall threshold; as a result, the high coefficient of “high landslide susceptibility and low rainfall threshold” was retained. The result (Figure 11) shows that the lowest landslide rainfall threshold in Alishan D098 was primarily located in the northeast, with a downstream influence area. Due to the area’s high landslide susceptibility but lower rainfall threshold in the prediction results, the MDR ranged from 350 to 780 mm/day after revision. Because of the topography, the western area showed a lower rainfall threshold, but the landslide susceptibility was lower. The original landslide rainfall threshold value of about 600 mm/day was increased to about 900 mm/day after the rainfall threshold was revised.
4.5. Establishing Recurrence Interval Distribution of Revised Landslide Rainfall Threshold
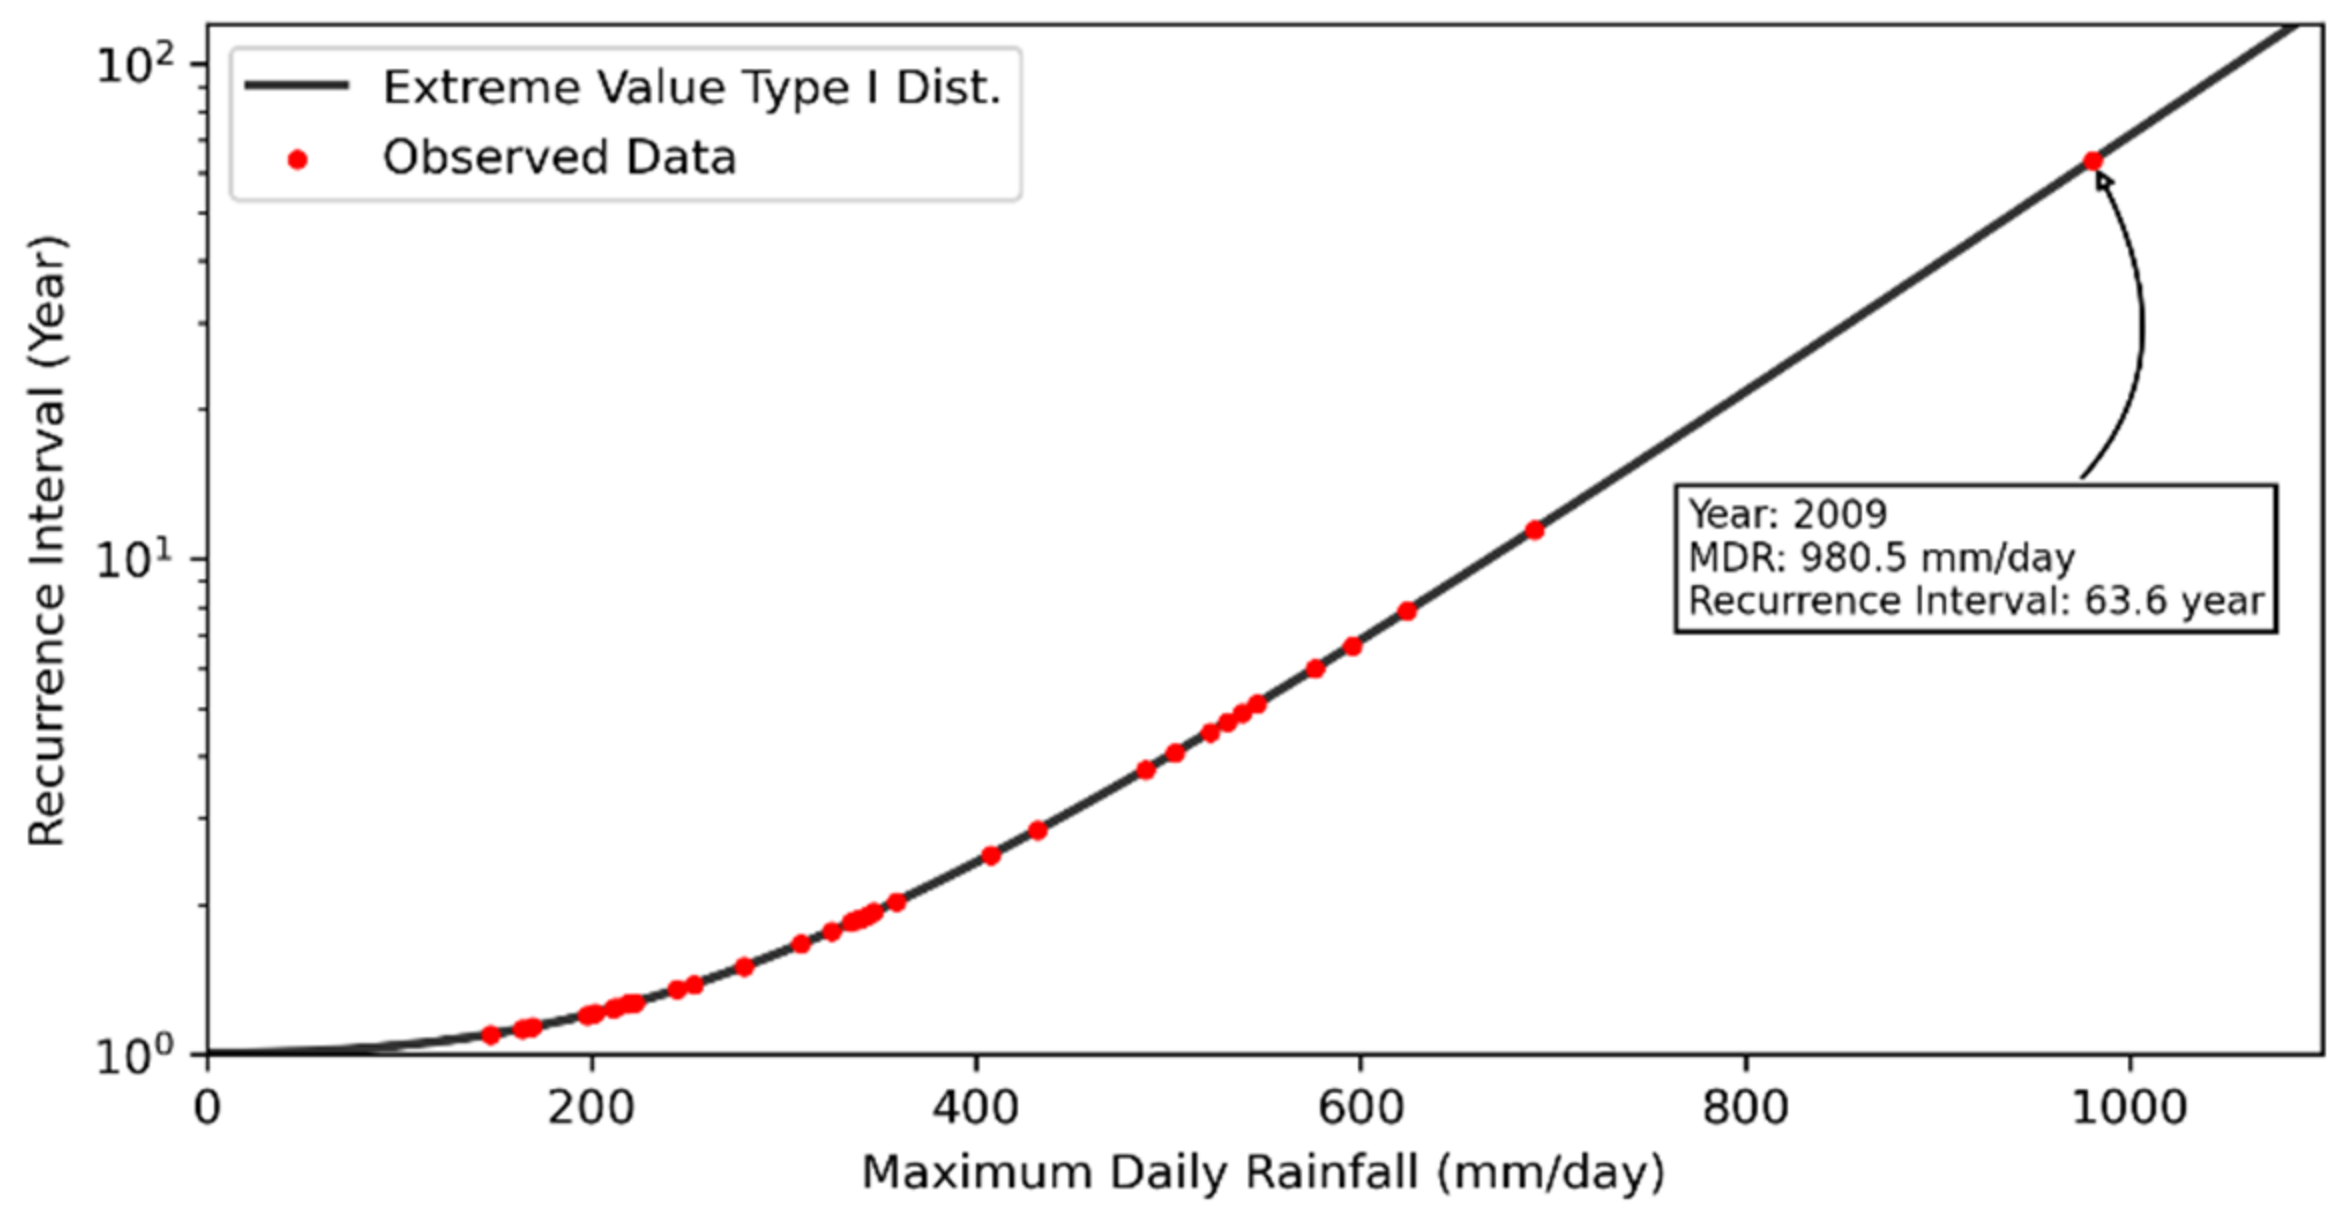
MDR data (from 1989 to 2021) were collected from the Longmei rain gauge station (C1M390), which is located near Alishan D098. The probability density functions, such as Extreme-value Type I, Normal, Pearson Type III, Log-Normal, and Log-Pearson Type III Distribution frequency analysis, were employed for frequency analysis. Moreover, the Kolmogorov–Smirnov Test (K-S Test) was used to examine the suitability. After that, the lowest RMSE among distribution methods was selected to establish the distribution for each corresponding recurrence interval. Since the extreme values of type I distribution showed the lowest RMSE (Table 6) to determine the corresponding recurrence intervals, the revised landslide rainfall threshold values were inputted into this distribution (Figure 12).
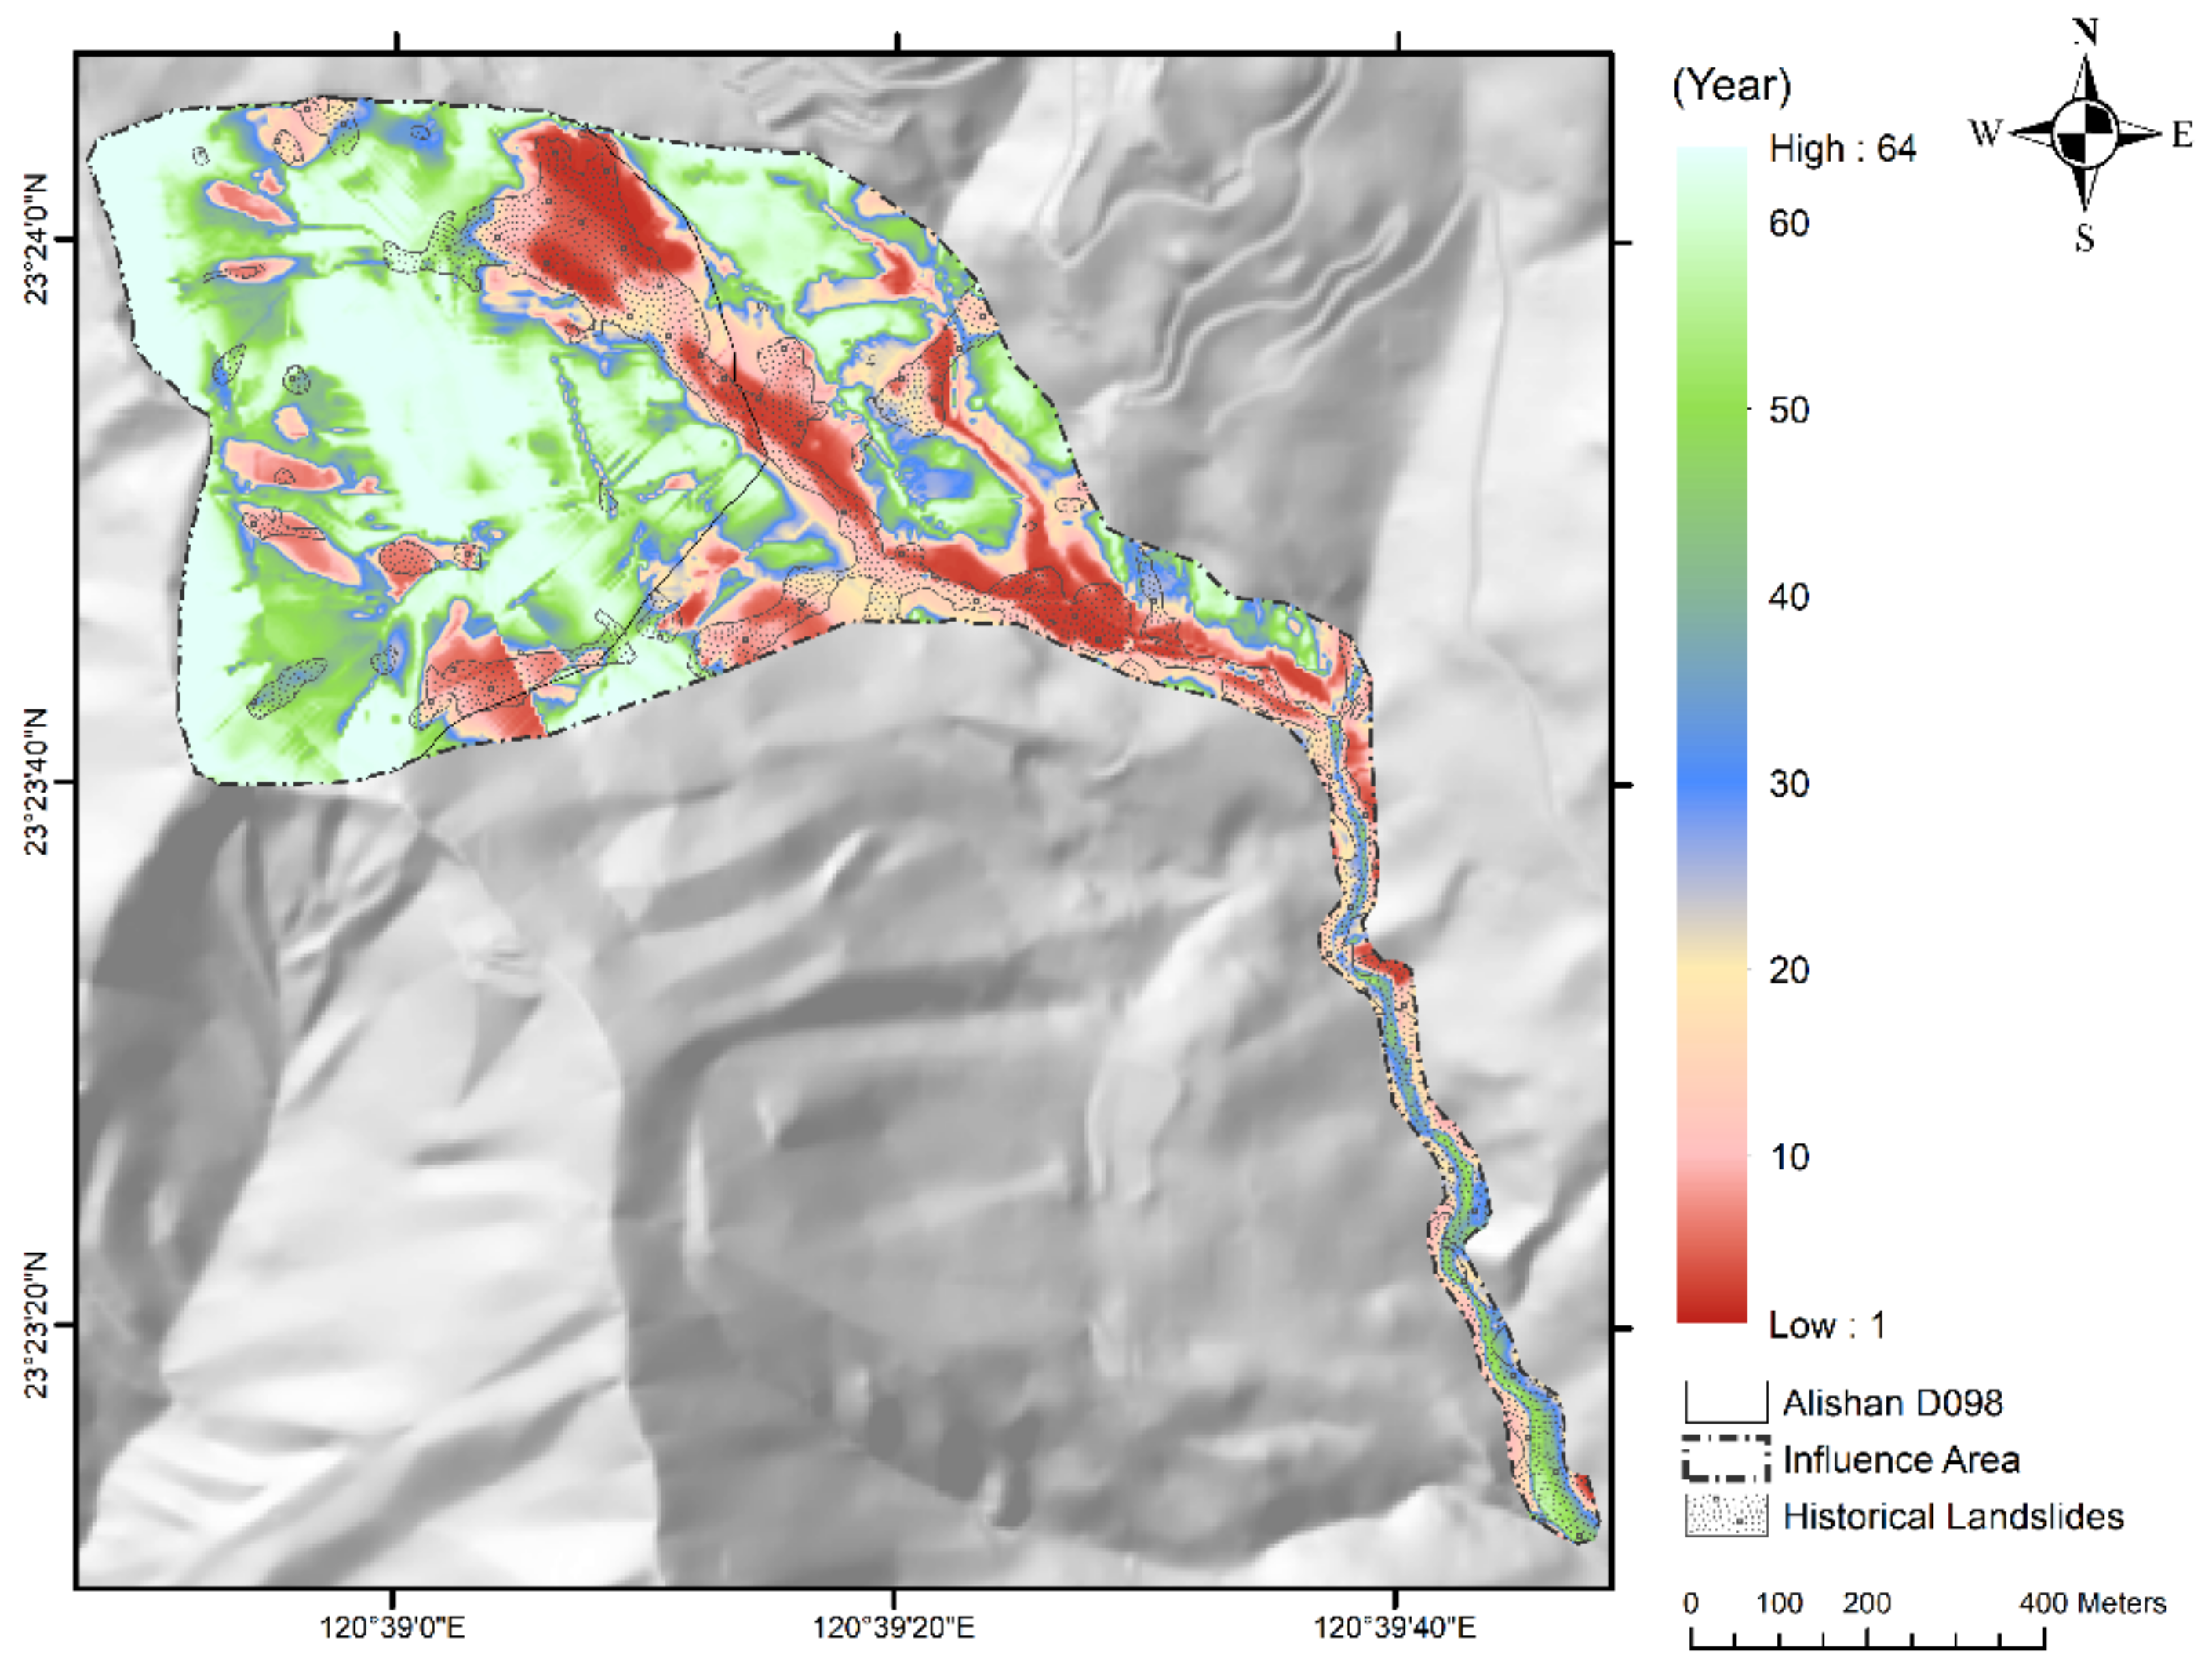
The results (Figure 13) indicate that the lowest landslide rainfall threshold areas are primarily located in the northeastern and downstream in Alishan D098, with a recurrence interval of about 2–20 years, because the area has experienced sporadic landslides since the occurrence of Typhoon Morakot disturbances in 2009. The lowest recurrence interval was observed in the red-colored area (Figure 13), which showed the highest susceptibility to landslides. Thus, landslide management is critical for this area. In addition, the landslide risk in this region will be more crucial when a large-scale landslide occurs in Alishan D098, which could endanger the upstream settlements (Longmei). The MDR of the landslide rainfall threshold was defined as 780 mm/day (about a 20-year recurrence interval) for yellow-colored areas, which eventually increased to 820 mm/day (about a 25-year recurrence interval) for the historical landslide areas that have been managed.
Except for the historical landslide area in the northeast part, the obvious landslide or small-scale landslide was not observed in areas surrounding Alishan D098. The predicted landslide rainfall threshold was around 980.5 mm/day with a recurrence interval of approximately 63.6 years.
Typhoon Morakot’s devastation in 2009 showed climate change impacts in the future will change the MDR. As a result, the landslide rainfall threshold for the entire area was proposed to be 980 mm/day. Table 7 shows the proposed landslide rainfall threshold for the Alishan D098 region.
5. Conclusions
The landslide incidence time series limitation, the limitation of landslide monitoring data, the vagueness of the rainfall threshold for the landslide’s occurrence, and the complexity of topographic factors have made it difficult to predict landslide incidence. Despite numerous types of research, most previous methods for determining the landslide threshold have limitations and errors. As a result, with the advancement of artificial intelligence algorithms, new methods can compensate for the lack of data availability and produce satisfactory results. Recent studies which applied deep learning algorithms to predict or map landslide susceptibility [13,14,20,21,22,39] acknowledged the capability of deep learning and, at the same time, have stated uncertainty in the prediction of landslide hazards due to insufficient data, climate change, and human activities. Moreover, they considered the achievement of satisfactory results to be contingent on future research.
The purpose of the current study was to predict the distribution of landslide susceptibility and rainfall threshold in the influence area of Alishan D098 using a deep learning algorithm. The results indicate the model achieved sufficient efficiency in determining the landslide rainfall threshold. In general, compared to the previous research [19,20], which focused on the effect of precipitation parameters on the occurrence of landslides, this study employed the topographic factors, the historical landslide data, and the maximum daily rainfall. The results show the lowest MDR threshold prediction was about 980.5 mm/day (64-year recurrence interval), decreasing to 820 mm/day in the managed historical landslide area. However, the MDR for the entire Alishan D098 region is anticipated to exceed 980.5 mm/day in the future due to climate change impacts. Therefore, this study proposed the landslide rainfall threshold to be 980 mm/day.
The current research findings are expected to be used to estimate and adjust the landslide rainfall threshold and, as a result, to make an emergency evacuation decision for the region. In addition, the results can be applied for future planning, land management, and policies or strategies for landslide hazard mitigation.
Since this study provides a new model, it faced challenges and limitations. Due to insufficient data in the study area, soil texture was not considered as an input feature in the deep learning models. Furthermore, the amount of rainfall at the time of the landslide could not be accurately calculated. As a result, the maximum daily rainfall for the year was chosen as the rainfall landslide threshold; consequently, the training results of the rainfall regression model were uncertain and showed errors. Therefore, the current study suggests using the model as a reference for other areas with more available data or improving input data through the application of different references, such as satellite data to predict future landslide incidence in this area.
Author Contributions
Conceptualization, J.-L.C.; methodology, J.-L.C. and C.-M.K.; software, J.-L.C. and C.-M.K.; validation, J.-L.C. and C.-M.K.; formal analysis, J.-L.C. and C.-M.K.; investigation, J.-L.C. and C.-M.K.; resources, J.-L.C.; data curation, J.-L.C., C.-M.K. and L.F.; writing—original draft preparation, J.-L.C. and C.-M.K.; writing—review and editing, J.-L.C., C.-M.K. and L.F.; visualization, C.-M.K.; supervision, J.-L.C.; project administration, J.-L.C.; funding acquisition, J.-L.C. All authors have read and agreed to the published version of the manuscript.
Funding
This research was funded by National Science and Technology Council of Taiwan, ROC. grant number MOST 110-2625-M-020-001 and MOST 111-2221-E-002-164.
Data Availability Statement
Taiwan CGS (Central Geological Survey) website provides free access to the geology, lithology, fault and landslide data and CWB (Central Weather Bureau) website provides free access to the rainfall data.
Acknowledgments
The authors gratefully acknowledge the Taiwan SWCB, CGS, and CWB for providing us with free data for use in this study.
Conflicts of Interest
The authors declare no conflict of interest.
References
- Skilodimou, H.; Bathrellos, G.; Koskeridou, E.; Soukis, K.; Rozos, D. Physical and Anthropogenic Factors Related to Landslide Activity in the Northern Peloponnese, Greece. Land 2018, 7, 85. [Google Scholar] [CrossRef] [Green Version]
- Srivastava, S.; Anand, N.; Sharma, S.; Dhar, S.; Sinha, L.K. Monthly Rainfall Prediction Using Various Machine Learning Algorithms for Early Warning of Landslide Occurrence. In Proceedings of the 2020 International Conference for Emerging Technology (INCET), Belgaum, India, 5–7 June 2020; pp. 1–7. [Google Scholar]
- Distefano, P.; Peres, D.J.; Scandura, P.; Cancelliere, A. Brief communication: Introducing rainfall thresholds for landslide triggering based on artificial neural networks. Nat. Hazards Earth Syst. Sci. 2022, 22, 1151–1157. [Google Scholar] [CrossRef]
- Palladino, M.R.; Viero, A.; Turconi, L.; Brunetti, M.T.; Peruccacci, S.; Melillo, M.; Luino, F.; Deganutti, A.M.; Guzzetti, F. Rainfall thresholds for the activation of shallow landslides in the Italian Alps: The role of environmental conditioning factors. Geomorphology 2018, 303, 53–67. [Google Scholar] [CrossRef]
- Weng, M.-C.; Wu, M.-H.; Ning, S.-K.; Jou, Y.-W. Evaluating triggering and causative factors of landslides in Lawnon River Basin, Taiwan. Eng. Geol. 2011, 123, 72–82. [Google Scholar] [CrossRef]
- Teja, T.S.; Dikshit, A.; Satyam, N. Determination of Rainfall Thresholds for Landslide Prediction Using an Algorithm-Based Approach: Case Study in the Darjeeling Himalayas, India. Geosciences 2019, 9, 302. [Google Scholar] [CrossRef] [Green Version]
- Sun, D.; Gu, Q.; Wen, H.; Shi, S.; Mi, C.; Zhang, F. A Hybrid Landslide Warning Model Coupling Susceptibility Zoning and Precipitation. Forests 2022, 13, 827. [Google Scholar] [CrossRef]
- Dou, J.; Yamagishi, H.; Pourghasemi, H.R.; Yunus, A.P.; Song, X.; Xu, Y.; Zhu, Z. An integrated artificial neural network model for the landslide susceptibility assessment of Osado Island, Japan. Nat. Hazards 2015, 78, 1749–1776. [Google Scholar] [CrossRef]
- Tehrani, F.; Santinelli, G.; Herrera, M. A framework for predicting rainfall-induced landslides using machine learning methods Un cadre pour prédire les glissements de terrain induits par les précipitations à l’aide d’un apprentissage automatique. In Proceedings of the XVII ECSMGE-2019 Geotechnical Engineering Foundation of the Future, Reykjavik, Iceland, 1–6 September 2019. [Google Scholar]
- Naseer, S.; Haq, T.U.; Khan, A.; Tanoli, J.I.; Khan, N.G.; Qaiser, F.-u.-R.; Shah, S.T.H. GIS-based spatial landslide distribution analysis of district Neelum, AJ&K, Pakistan. Nat. Hazards 2021, 106, 965–989. [Google Scholar] [CrossRef]
- Wu, C.Y.; Yeh, Y.C. A Landslide Probability Model Based on a Long-Term Landslide Inventory and Rainfall Factors. Water 2020, 12, 937. [Google Scholar] [CrossRef] [Green Version]
- Mind’je, R.; Li, L.H.; Nsengiyumva, J.B.; Mupenzi, C.; Nyesheja, E.M.; Kayumba, P.M.; Gasirabo, A.; Hakorimana, E. Landslide susceptibility and influencing factors analysis in Rwanda. Environ. Dev. Sustain. 2020, 22, 7985–8012. [Google Scholar] [CrossRef]
- Nam, K.; Wang, F. An extreme rainfall-induced landslide susceptibility assessment using autoencoder combined with random forest in Shimane Prefecture, Japan. Geoenvironmental Disasters 2020, 7, 1–16. [Google Scholar] [CrossRef] [Green Version]
- Zhu, L.; Huang, L.; Fan, L.; Huang, J.; Huang, F.; Chen, J.; Zhang, Z.; Wang, Y. Landslide Susceptibility Prediction Modeling Based on Remote Sensing and a Novel Deep Learning Algorithm of a Cascade-Parallel Recurrent Neural Network. Sensors 2020, 20, 1576. [Google Scholar] [CrossRef] [PubMed] [Green Version]
- Zhang, T.; Li, Y.; Wang, T.; Wang, H.; Chen, T.; Sun, Z.; Luo, D.; Li, C.; Han, L. Evaluation of different machine learning models and novel deep learning-based algorithm for landslide susceptibility mapping. Geosci. Lett. 2022, 9, 26. [Google Scholar] [CrossRef]
- Yang, R.; Zhang, F.; Xia, J.; Wu, C. Landslide Extraction Using Mask R-CNN with Background-Enhancement Method. Remote Sens. 2022, 14, 2206. [Google Scholar] [CrossRef]
- Lu, H.; Ma, L.; Fu, X.; Liu, C.; Wang, Z.; Tang, M.; Li, N. Landslides Information Extraction Using Object-Oriented Image Analysis Paradigm Based on Deep Learning and Transfer Learning. Remote Sens. 2020, 12, 752. [Google Scholar] [CrossRef] [Green Version]
- Prakash, N.; Manconi, A.; Loew, S. Mapping Landslides on EO Data: Performance of Deep Learning Models vs. Traditional Machine Learning Models. Remote Sens. 2020, 12, 346. [Google Scholar] [CrossRef] [Green Version]
- Park, S.-J.; Lee, D.-k. Predicting susceptibility to landslides under climate change impacts in metropolitan areas of South Korea using machine learning. Geomat. Nat. Hazards Risk 2021, 12, 2462–2476. [Google Scholar] [CrossRef]
- Saha, S.; Sarkar, R.; Roy, J.; Hembram, T.K.; Acharya, S.; Thapa, G.; Drukpa, D. Measuring landslide vulnerability status of Chukha, Bhutan using deep learning algorithms. Sci. Rep. 2021, 11, 16374. [Google Scholar] [CrossRef] [PubMed]
- Azarafza, M.; Azarafza, M.; Akgün, H.; Atkinson, P.M.; Derakhshani, R. Deep learning-based landslide susceptibility mapping. Sci. Rep. 2021, 11, 24112. [Google Scholar] [CrossRef] [PubMed]
- Nhu, V.-H.; Hoang, N.-D.; Nguyen, H.; Ngo, P.T.T.; Thanh Bui, T.; Hoa, P.V.; Samui, P.; Tien Bui, D. Effectiveness assessment of Keras based deep learning with different robust optimization algorithms for shallow landslide susceptibility mapping at tropical area. Catena 2020, 188, 104458. [Google Scholar] [CrossRef]
- Li, X.; Li, S. Large-Scale Landslide Displacement Rate Prediction Based on Multi-Factor Support Vector Regression Machine. Appl. Sci. 2021, 11, 1381. [Google Scholar] [CrossRef]
- Meng, Q.X.; Wang, H.L.; He, M.J.; Gu, J.J.; Qi, J.; Yang, L.L. Displacement prediction of water-induced landslides using a recurrent deep learning model. Eur. J. Environ. Civ. Eng. 2020, 1–15. [Google Scholar] [CrossRef]
- Orland, E.; Roering, J.J.; Thomas, M.A.; Mirus, B.B. Deep Learning as a Tool to Forecast Hydrologic Response for Landslide-Prone Hillslopes. Geophys. Res. Lett. 2020, 47, e2020GL088731. [Google Scholar] [CrossRef]
- Ma, J.; Xia, D.; Wang, Y.; Niu, X.; Jiang, S.; Liu, Z.; Guo, H. A comprehensive comparison among metaheuristics (MHs) for geohazard modeling using machine learning: Insights from a case study of landslide displacement prediction. Eng. Appl. Artif. Intell. 2022, 114, 105150. [Google Scholar] [CrossRef]
- Ma, J.; Xia, D.; Guo, H.; Wang, Y.; Niu, X.; Liu, Z.; Jiang, S. Metaheuristic-based support vector regression for landslide displacement prediction: A comparative study. Landslides 2022, 19, 2489–2511. [Google Scholar] [CrossRef]
- Li, S.H.; Wu, L.Z.; Huang, J. A novel mathematical model for predicting landslide displacement. Soft Comput. 2020, 25, 2453–2466. [Google Scholar] [CrossRef]
- Shihabudheen, K.V.; Peethambaran, B. Landslide displacement prediction technique using improved neuro-fuzzy system. Arab. J. Geosci. 2017, 10, 502. [Google Scholar] [CrossRef]
- Ma, J.; Tang, H.; Liu, X.; Wen, T.; Zhang, J.; Tan, Q.; Fan, Z. Probabilistic forecasting of landslide displacement accounting for epistemic uncertainty: A case study in the Three Gorges Reservoir area, China. Landslides 2018, 15, 1145–1153. [Google Scholar] [CrossRef]
- Li, H.; Xu, Q.; He, Y.; Deng, J. Prediction of landslide displacement with an ensemble-based extreme learning machine and copula models. Landslides 2018, 15, 2047–2059. [Google Scholar] [CrossRef]
- Krkač, M.; Špoljarić, D.; Bernat, S.; Arbanas, S.M. Method for prediction of landslide movements based on random forests. Landslides 2016, 14, 947–960. [Google Scholar] [CrossRef]
- Wang, L.; Chen, Y.; Huang, X.; Zhang, L.; Li, X.; Wang, S. Displacement prediction method of rainfall-induced landslide considering multiple influencing factors. Nat. Hazards 2022. [Google Scholar] [CrossRef]
- Council of Agriculture. 36 Potential Large-Scale Landslide Areas in 2022. Available online: https://data.coa.gov.tw/open_detail.aspx?id=I20 (accessed on 4 July 2022).
- Tsai, Y.-J.; Syu, F.-T.; Shieh, C.-L.; Chung, C.-R.; Lin, S.-S.; Yin, H.-Y. Framework of Emergency Response System for Potential Large-Scale Landslide in Taiwan. Water 2021, 13, 712. [Google Scholar] [CrossRef]
- Shao, P.-H.; Kao, M.-C. Explanatory Text for the Geological Map of TAIWAN Scale 1:50,000—Zhongpu; Central Geological Survey: Taipei, 2009. [Google Scholar]
- Feng, Z.-Y.; Huang, H.-C.; Huang, J.-J.; Lai, H.-Y. Preliminary Discussion of the Factors Causing Laitou Landslide in Jiayi. J. Soil Water Conserv. 2012, 44, 177–188. [Google Scholar]
- Chen, C.-K.; Lin, B.-S.; Chi, S.-Y.; Chien, Y.-D.; Tsai, M.-F. Sediment Stability Assessment for Large-Scale Landslides Induced by Typhoon Morakot After Remediation in an Upstream Reservoir Watershed. Sinotech Eng. 2015, 182, 25–37. [Google Scholar]
- Wang, H.J.; Zhang, L.M.; Yin, K.S.; Luo, H.Y.; Li, J.H. Landslide identification using machine learning. Geosci. Front. 2021, 12, 351–364. [Google Scholar] [CrossRef]
- Vojtek, M.; Vojteková, J.; Pham, Q.B. GIS-Based Spatial and Multi-Criteria Assessment of Riverine Flood Potential: A Case Study of the Nitra River Basin, Slovakia. ISPRS Int. J. Geo-Inf. 2021, 10, 578. [Google Scholar] [CrossRef]
- Nguyen, K.; Chen, W. DEM- and GIS-Based Analysis of Soil Erosion Depth Using Machine Learning. ISPRS Int. J. Geo-Inf. 2021, 10, 452. [Google Scholar] [CrossRef]
- Chen, S.-C.; Wu, C.-Y. Establishment of Landslide Susceptibility Early Warning Model in National Forest Areas Based on Geo-intrinsic and Hydro-extrinsic Factors. J. Chin. Soil Water Conserv. 2018, 49, 89–97. [Google Scholar] [CrossRef]
- Pedregosa, F.; Varoquaux, G.; Gramfort, A.; Michel, V.; Thirion, B.; Grisel, O.; Blondel, M.; Prettenhofer, P.; Weiss, R.; Dubourg, V.; et al. Scikit-learn: Machine Learning in Python. J. Mach. Learn. Res. 2011, 12, 2825–2830. [Google Scholar]
- Kutner, M.H.; Nachtsheim, C.J.; Neter, J.; Li, W. Applied Linear Statistical Models, 5th ed.; McGraw-Hill/Irwin: New York, NY, USA, 2004. [Google Scholar]
- O’brien, R.M. A Caution Regarding Rules of Thumb for Variance Inflation Factors. Qual. Quant. 2007, 41, 673–690. [Google Scholar] [CrossRef]
- Seabold, S.; Perktold, J. Statsmodels: Econometric and statistical modeling with python. In Proceedings of the 9th Python in Science Conference, Austin, TX, USA, 28 June–3 July 2010. [Google Scholar]
- Chollet, F. Keras: The Python deep learning API. Available online: https://keras.io/ (accessed on 20 December 2021).
- Hale, J. Deep Learning Framework Power Scores 2018. Available online: https://www.kaggle.com/discdiver/deep-learning-framework-power-scores-2018 (accessed on 22 December 2021).
- Kaggle. State of Machine Learning and Data Science 2021. Available online: https://www.kaggle.com/kaggle-survey-2021 (accessed on 23 August 2022).
- Kingma, D.P.; Ba, J. Adam: A Method for Stochastic Optimization. In Proceedings of the ICLR 2015, San Diego, CA, USA, 7–9 May 2015; 2015. [Google Scholar]
- O’Malley, T.; Bursztein, E.; Long, J.; Chollet, F.; Jin, H.; Invernizzi, L. KerasTuner. Available online: https://github.com/keras-team/keras-tuner (accessed on 4 May 2022).
- Chinchor, N. MUC-4 Evaluation Metrics. In Proceedings of the MUC4 92: Conference on Message Understanding, Stroudsburg, PA, USA, 16–18 June 1992; pp. 22–29. [Google Scholar]
- Taha, A.A.; Hanbury, A. Metrics for evaluating 3D medical image segmentation: Analysis, selection, and tool. BMC Med. Imaging 2015, 15, 29. [Google Scholar] [CrossRef] [PubMed] [Green Version]
- Chicco, D.; Warrens, M.J.; Jurman, G. The Matthews Correlation Coefficient (MCC) is More Informative Than Cohen’s Kappa and Brier Score in Binary Classification Assessment. IEEE Access 2021, 9, 78368–78381. [Google Scholar] [CrossRef]
- Chicco, D.; Jurman, G. The advantages of the Matthews correlation coefficient (MCC) over F1 score and accuracy in binary classification evaluation. BMC Genom. 2020, 21, 6. [Google Scholar] [CrossRef] [PubMed]
- GDAL/OGR Contributors. GDAL/OGR Geospatial Data Abstraction Software Library. Available online: https://gdal.org (accessed on 30 August 2022).
Figure 1.
Study workflow for the prediction model.

Figure 2.
(a) Location of the influence area of Alishan D098; (b) the historical landslide areas by years.
Figure 2.
(a) Location of the influence area of Alishan D098; (b) the historical landslide areas by years.

Figure 3.
(a) The new landslide distribution; (b) the number of grid points by year in the sub-basin.
Figure 3.
(a) The new landslide distribution; (b) the number of grid points by year in the sub-basin.

Figure 4.
Spatial distribution of maximum daily rainfall in 2009. (a) Tsengwen Reservoir Watershed; (b) sub-basin where the study area is located.
Figure 4.
Spatial distribution of maximum daily rainfall in 2009. (a) Tsengwen Reservoir Watershed; (b) sub-basin where the study area is located.

Figure 5.
Topographic factors: (a) elevation; (b) slope; (c) aspect; (d) plan curvature; (e) profile curvature; (f) Topographic Wetness Index (TWI); (g) Stream Power Index (SPI); (h) distance from fault; (i) distance from river; (j) distance from road; (k) lithology. 1. Thick-bedded massive sandstone and argillaceous sandstone; 2. sandstone and sand-shale interbedding; 3. bodies of water; 4. massive shale, occasionally with thin-bedded siltstone; 5. siltstone and shale thin interbedding.

Figure 6.
The MLP model architecture.

Figure 7.
Pearson correlation coefficient between factors for training datasets. (a) Landslide susceptibility classification model; (b) rainfall threshold regression model.
Figure 7.
Pearson correlation coefficient between factors for training datasets. (a) Landslide susceptibility classification model; (b) rainfall threshold regression model.

Figure 8.
The accuracy and loss trend of training and validation dataset. (a) Landslide susceptibility classification model; (b) rainfall threshold regression model.
Figure 8.
The accuracy and loss trend of training and validation dataset. (a) Landslide susceptibility classification model; (b) rainfall threshold regression model.

Figure 9.
The ROC area under curve. (a) Training dataset; (b) test dataset.

Figure 10.
The prediction result of the sub-basin and Alishan D098 influence area. (a) Landslide susceptibility classification model; (b) rainfall threshold regression model.
Figure 10.
The prediction result of the sub-basin and Alishan D098 influence area. (a) Landslide susceptibility classification model; (b) rainfall threshold regression model.

Figure 11.
The spatial distribution of landslide rainfall threshold in Alishan D098 influence area. (a) Original result, which did not take the landslide susceptibility into account; (b) revised result, which did take the landslide susceptibility into account.
Figure 11.
The spatial distribution of landslide rainfall threshold in Alishan D098 influence area. (a) Original result, which did not take the landslide susceptibility into account; (b) revised result, which did take the landslide susceptibility into account.

Figure 12.
Extreme-value Type I distribution of Longmei rainfall gauge station.

Figure 13.
The distribution of recurrence interval of revised landslide rainfall threshold in the influence area.
Figure 13.
The distribution of recurrence interval of revised landslide rainfall threshold in the influence area.


Table 1.
The information about factors selected in the study.
| Topography Factors | Data Source | Data Type | Value Range |
|---|---|---|---|
| Elevation | DEM | Continuous | 384.70–1238.10 |
| Slope | DEM | Continuous | 0.00–64.89 |
| Aspect | DEM | Continuous | −1.00–360.00 |
| Plan curvature | DEM | Continuous | −27.07–25.72 |
| Profile curvature | DEM | Continuous | −31.32–30.42 |
| Topographic Wetness Index (TWI) | DEM | Continuous | 2.65–20.51 |
| Stream Power Index (SPI) | DEM | Continuous | 0–4,388,483 |
| Distance to fault | CGS | Continuous | 0.00–1646.15 |
| Distance to river | DEM | Continuous | 0.00–680.66 |
| Distance to road | OpenStreetMap | Continuous | 0.00–610.98 |
| Lithology | CGS | Categorical | n/a |
Table 2.
The range of hyperparameters for the model defined.
| Hyperparameters | Type | Defined Parameters |
|---|---|---|
| Counts of Hidden Layer | Integer | 2–10 |
| Neurons of Hidden Layer | Integer | 4, 8, 12, …, 124, 128 |
| Dropout Rate | Real | 0.00, 0.05, 0.10, …, 0.85, 0.90 |
| Stepsize of Adam Optimizer | Float | 0.0001–0.1 |
Table 3.
The VIF results of each factor for training datasets of landslide susceptibility and rainfall threshold regression model.
Table 3.
The VIF results of each factor for training datasets of landslide susceptibility and rainfall threshold regression model.
| Features | Landslide Susceptibility (n = 62,252) | Rainfall Threshold (n = 31,126) |
|---|---|---|
| Elevation | 2.916 | 3.330 |
| Slope | 1.359 | 1.502 |
| Aspect | 1.435 | 1.381 |
| Plan Curvature | 1.548 | 1.548 |
| Profile Curvature | 1.246 | 1.252 |
| TWI | 1.963 | 2.293 |
| SPI | 1.279 | 1.447 |
| Distance to fault | 2.444 | 2.492 |
| Distance to river | 2.094 | 2.491 |
| Distance to road | 1.060 | 1.041 |
| Lithology | 1.346 | 1.423 |
The variance inflation factor.
Table 4.
Top 3 ranking of hyperparameter tuning results for models.
| Hyperparameters | Landslide Susceptibility Classification | Rainfall Threshold Regression | ||||
|---|---|---|---|---|---|---|
| 1st | 2nd | 3rd | 1st | 2nd | 3rd | |
| Counts of hidden layer | 4 | 4 | 3 | 4 | 4 | 3 |
| Neurons of hidden layer 1 | 108 | 108 | 108 | 124 | 120 | 120 |
| Rate of dropout layer 1 | 0.05 | 0.05 | 0.30 | 0.20 | 0.20 | 0.45 |
| Neurons of hidden layer 2 | 84 | 84 | 96 | 128 | 108 | 84 |
| Rate of dropout layer 2 | 0.25 | 0.25 | 0.45 | 0.20 | 0.70 | 0.05 |
| Neurons of hidden layer 3 | 100 | 100 | 60 | 36 | 28 | 88 |
| Rate of dropout layer 3 | 0.45 | 0.45 | 0.10 | 0.25 | 0.05 | 0.00 |
| Neurons of hidden layer 4 | 112 | 112 | - | 72 | 28 | - |
| Rate of dropout layer 4 | 0.30 | 0.30 | - | 0.10 | 0.40 | - |
| Stepsize of Adam Optimizer | 0.000874 | 0.000874 | 0.000383 | 0.001889 | 0.000669 | 0.000507 |
| Initial epoch | 67 | 23 | 67 | 67 | 67 | 67 |
| Epochs | 200 | 67 | 200 | 200 | 200 | 200 |
| Best step | 91 | 41 | 127 | 83 | 120 | 99 |
| Validation accuracy | 0.8916 | 0.8683 | 0.8652 | n/a | n/a | n/a |
| Score (Validation loss) | 0.0801 | 0.0977 | 0.0998 | 0.0675 | 0.0704 | 0.0710 |
Table 5.
The evaluated result for models.
| Models | Evaluate | Train Dataset | Test Dataset |
|---|---|---|---|
| Landslide Susceptibility Classification | Overall accuracy | 0.9094 | 0.8959 |
| Precision | 0.9118 | 0.8985 | |
| Recall | 0.9094 | 0.8959 | |
| ROC AUC | 0.9633 | 0.9550 | |
| F1 score | 0.9092 | 0.8957 | |
| Cohen’s kappa | 0.8187 | 0.7918 | |
| MCC | 0.8211 | 0.7944 | |
| Rainfall Threshold Regression | MAE | 180.09 | 185.98 |
| RMSE | 228.03 | 233.97 | |
| MAPE | 0.2631 | 0.2716 |
Table 6.
Result of KS-Test and RMSE * by distributions.
| Recurrence Interval | p-Value | RMSE |
|---|---|---|
| Extreme-value Type I Distribution | 0.9995 | 0.0424 |
| Normal Distribution | 0.8510 | 0.0555 |
| Pearson Type III Distribution | 0.9725 | 0.0441 |
| Log-Normal Distribution | 0.9725 | 0.0437 |
| Log-Pearson Type III Distribution | 0.8510 | 0.0840 |
* Root mean square error.
Table 7.
The landslide rainfall threshold of each region as suggested.
| Regions | Condition | Rainfall Threshold (mm/day) | Recurrence Interval (Year) |
|---|---|---|---|
| Northeast Alishan D098 Downstream of Alishan D098 Longmei Settlement | Non-managed | 780 | 20 |
| Has been managed | 820 | 25 | |
| Whole Area | n/a | 980 | 64 |
Publisher’s Note: MDPI stays neutral with regard to jurisdictional claims in published maps and institutional affiliations. |
© 2022 by the authors. Licensee MDPI, Basel, Switzerland. This article is an open access article distributed under the terms and conditions of the Creative Commons Attribution (CC BY) license (https://creativecommons.org/licenses/by/4.0/).
Share and Cite
MDPI and ACS Style
Chiang, J.-L.; Kuo, C.-M.; Fazeldehkordi, L. Using Deep Learning to Formulate the Landslide Rainfall Threshold of the Potential Large-Scale Landslide. Water 2022, 14, 3320. https://doi.org/10.3390/w14203320
AMA Style
Chiang J-L, Kuo C-M, Fazeldehkordi L. Using Deep Learning to Formulate the Landslide Rainfall Threshold of the Potential Large-Scale Landslide. Water. 2022; 14(20):3320. https://doi.org/10.3390/w14203320
Chicago/Turabian StyleChiang, Jie-Lun, Chia-Ming Kuo, and Leila Fazeldehkordi. 2022. "Using Deep Learning to Formulate the Landslide Rainfall Threshold of the Potential Large-Scale Landslide" Water 14, no. 20: 3320. https://doi.org/10.3390/w14203320
Note that from the first issue of 2016, this journal uses article numbers instead of page numbers. See further details here.