
Analyzing the Reliability of Unstructured Data for Urban Rainfall Pattern Studies—A Case Study from Zhengzhou
1
Yellow River Laboratory, Zhengzhou University, Zhengzhou 450001, China
2
Water Resources Department, China Institute of Water Resources and Hydropower Research, Beijing 100038, China
*
Author to whom correspondence should be addressed.
Water 2022, 14(20), 3316; https://doi.org/10.3390/w14203316
Submission received: 31 July 2022
/
Revised: 11 October 2022
/
Accepted: 19 October 2022
/
Published: 20 October 2022
(This article belongs to the Section Urban Water Management)
Abstract
:Due to the insufficient number and uneven distribution of urban rainfall stations, research on urban flooding disasters is limited. With the development of big data research, many scholars have applied big data to natural disaster research. In this paper, we analyzed the reliability of unstructured data from the urban rainfall patterns studies using the measured rainfall data for Zhengzhou City. First, web crawler technology was used on Sina Weibo, one of China’s largest social platforms, to obtain the unstructured data related to rainfall. The fuzzy recognition method was used to analyze the rain patterns of the measured rainfall data and the unstructured data, which verified the reliability of the unstructured data in the analysis of the urban rainfall patterns. Taking Zhengzhou City as an example, it was found that the matching degree of rain pattern recognition results was 45%, between the unstructured data and measured data. This showed that the application of the unstructured data in the analysis of the urban rainfall patterns has a certain degree of reliability.
1. Introduction
With the continuous urbanization of the world, waterlogging caused by urban rainstorms has become a hot topic [1,2,3]. In 2002, torrential rain in central Europe resulted in most of the continent suffering the worst flood in a century. The torrential rain disrupted communications and washed away a large number of houses and roads, and more than 100 lives were lost in the flooding [4]. In 2013, eight states in the central United States were hit by historic floods, which caused urban public transportation failures, communication interruptions, and power interruptions, and left entire cities paralyzed [5]. In 2012, Beijing suffered the strongest torrential rains and floods in 61 years, affecting 1.602 million people and causing RMB 11.64 billion in economic losses [6]. On 20 July 2021, Zhengzhou City, Henan Province, experienced exceptionally heavy rainstorms. The maximum hourly cumulative precipitation value reached 201.9 mm, exceeding its historical extreme value on land. The cumulative precipitation at 24 h was up to 627.4 mm, far exceeding the defined threshold of heavy rain (250 mm accumulated in 24 h). This has caused serious urban waterlogging in Zhengzhou, inflicting huge losses of life and property on the people [7].
Urban rainfall data are important for the study of urban rain flood damage. [8]. However, the number of rainfall stations in cities is small and the distribution is uneven, so the measured data cannot reflect the urban rainfall situation well, which is unfavorable for the study of urban rainstorm patterns and disaster prevention. Following a long-term study, it was found that different rainfall patterns cause different geological disasters, and the relevant measures for disaster prevention can be developed by studying different types of rainfall.
Traditional research on rainstorm patterns is mainly based on the rainfall measured at rainfall stations. According to the existing research, the most commonly used rain patterns include the seven rain patterns identified by Bogomazova in the Soviet Union, including three unimodal rain patterns, one uniform rain pattern and three bimodal rain patterns [9,10]. The Chicago rain pattern was proposed by Keifer and Chu [11,12]. Ou et al. [13] verified the applicability of the Chicago rain pattern in the calculation of urban drainage and proposed that the use of this pattern can provide a reference for the analysis of the rain patterns in a short-duration urban storm. Rain pattern identification methods mainly include a visual estimation and a fuzzy recognition [14]. The visual estimation method is a method using the computer-generated histogram of the patterns, and then identifying the rainfall patterns visually. Although this method is simple and easy to implement, the process is of great variability and prone to human error. The fuzzy recognition method establishes seven kinds of rainfall pattern fuzzy matrices and then calculates the fit degree of each actual rainfall pattern with its respective fuzzy matrix, then it judges the rain pattern, according to the principle of proximity.
The above method uses the measured rainfall data for the calculation and analysis of the rainfall patterns, and it is inevitably affected by insufficient data when it is directly applied to urban storm and flood research. Rainfall data are the basic data for the study of rainstorm disasters. The adequacy of the rainfall data directly affects the accuracy of the rainstorm research [15].
With the continuous development of internet technology, a growing number of people are increasingly willing to reveal their lives on social platforms, which contain a lot of unstructured data that can be further explored. Unstructured data are data that have irregular or incomplete data structures, have no predefined data models, and are not conveniently represented by two-dimensional logic tables in a database. These data include office document formats, texts, images, XML, HTML, various reports, images, audio/video information, etc. [16]. The measured rainfall data and unstructured data belong to two different structures of big data, both of which can reflect the process of a rainfall, and the unstructured data is richer than the measured data. For example, whenever an emergency, such as a rainstorm, flood, or earthquake occurs, a large amount of unstructured data, including texts, pictures, and videos, will emerge on social platforms, as shown in Figure 1.
Using unstructured data to solve the problem of data limitation in urban flood disaster research, has become a hot topic for scholars [17]. Bruijn et al. [18] established a global database of historical and real-time flooding events, based on the Twitter social media platform. Saini et al. [19] analyzed 117 years (1901–2017) of rainfall trends in the West Coast Plain and Hill Agro-Climatic Region, using a rainfall grid dataset, indicating the rainfall regime shift in the region. By analyzing Sina Weibo data after the occurrence of rainstorms and waterlogging disasters, Chen [20] proposed a new idea of supplementing official observation data with Sina Weibo data. Li et al. [21] used web crawler technology to obtain Sina Weibo data with geographic location information. By analyzing the correlation between the number of rainfall-related Sina Weibo posts and the measured rainfall data, they found that by establishing simulated rainfall stations, they could effectively improve the interpolation accuracy of the traditional rainfall stations. Wu et al. [22] used big data to analyze the vulnerability of urban rainstorms and flood disasters. These studies provided new ideas for applying unstructured data to urban flood research. Unstructured data enrich the urban rainfall data and lays a data foundation for urban rainstorm research. The research demonstrates the scientific implications of collecting and using big data to study the urban rainfall patterns. Sina Weibo is a microblogging site in China. Similar to Twitter, it is a broadcast-style social media and networking platform that shares short, real-time information through a follow-up mechanism, based on the sharing, dissemination, and acquisition of user relationship information. Launched on 14 August 2009, Sina Weibo is one of the largest social media platforms in China, with 566 million monthly active users and an average of 246 million daily active users, as of June 2021. In this paper, taking Zhengzhou as an example, the feasibility of using unstructured data to identify the urban rain patterns was determined, based on data from Sina Weibo. Firstly, by editing the web crawler’s code, user nicknames, the release times of blogs, user locations, blog content, and other information were retrieved in the Sina Weibo advanced search result page, and the retrieved pages were parsed and saved as CSV files. Secondly, the feasibility of applying unstructured data to the analysis of rain patterns was verified using the correlation coefficient method. Finally, the fuzzy recognition method was used to identify rainfall patterns, according to both the measured and unstructured rainfall data. The two results were comparatively analyzed, which verified the reliability of applying the unstructured data to the analysis of the urban rainfall patterns.
2. Materials and Methods
2.1. Study Area
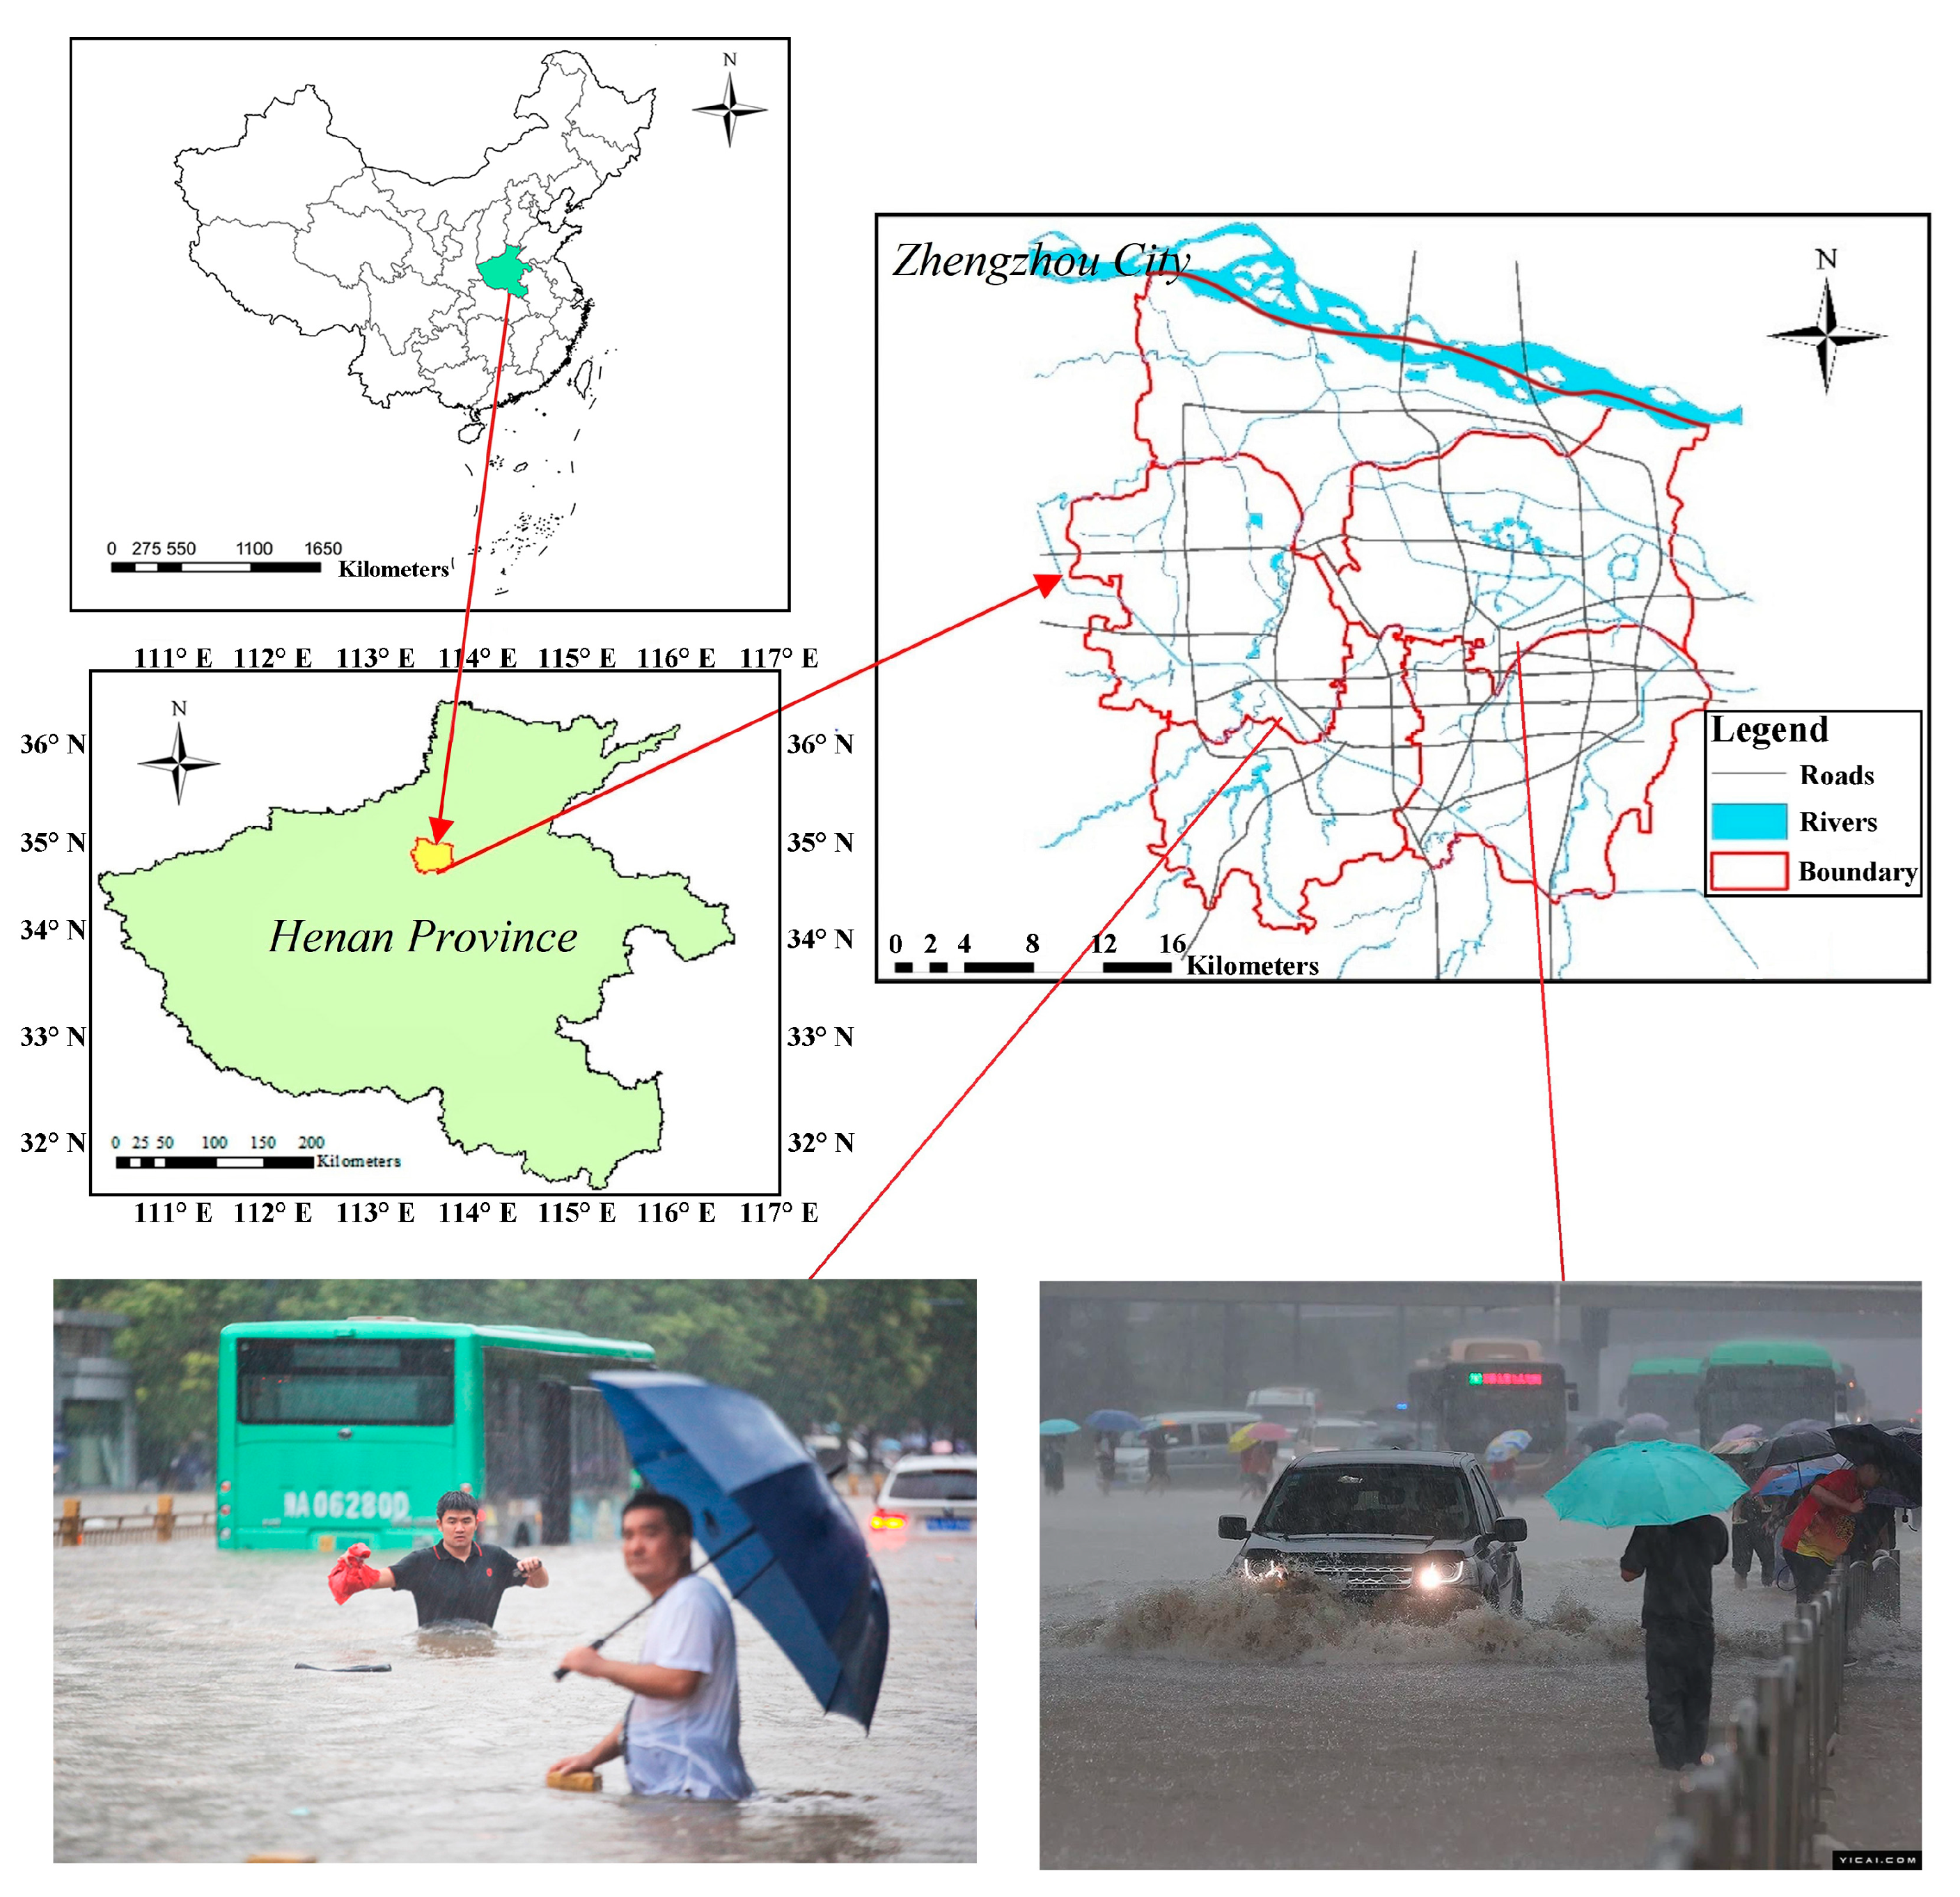
Zhengzhou, in the north-central part of Henan Province, China, is located between 112°42′ and 114°14′ east longitude, and between 34°16′ and 34°58′ north latitude (Figure 2), with an area of about 1181.51 km2. Zhengzhou is a northern temperate continental monsoon climate with a frequent alternation, due to cold and warm air masses. It is a high-risk area for flood disasters and one of the most intensive flood control towns [23]. The average annual precipitation is 625.9 mm. Heavy rains and floods are more frequent in summer, with the rainfall from July to September accounting for 60–70% of the total annual rainfall [24]. According to the statistics, Zhengzhou has suffered more than 15 rainstorms every year since 2006, and each flood disaster has caused more than USD 30 million in economic losses, resulting in serious disaster for the people of Zhengzhou.
In recent years, Zhengzhou has made significant progress in the construction of big data infrastructure. In 2013, it was identified as one of the first 10 pilot cities for the construction of a space–time information-based cloud computing platform for smart cities in China [25]. In 2015, Zhengzhou City achieved full coverage of the 4G mobile communications network in both urban and rural areas, and it completed the construction of a public information resource catalog system, a sharing platform, and a public service platform. In 2016, Zhengzhou ranked 19th among 335 “internet plus” cities in China. The Smart City Research Institute of Zhengzhou University, established in 2016, provides support for the construction, industrial development, and innovation of Zhengzhou’s smart city technology.
2.2. Data Sources
2.2.1. Rainfall
Considering Zhengzhou as a case, the daily rainfall data of fourteen rainfall stations, taken from 2014 to 2018, were collected. The statistical interval of the rainfall data was ten minutes. The data were all digitized rainfall data. The point rainfall data of each station were analyzed using the arithmetic mean method, to obtain the areal rainfall data in Zhengzhou, and the rainfall accuracy was 0.5 mm.
2.2.2. Unstructured Data
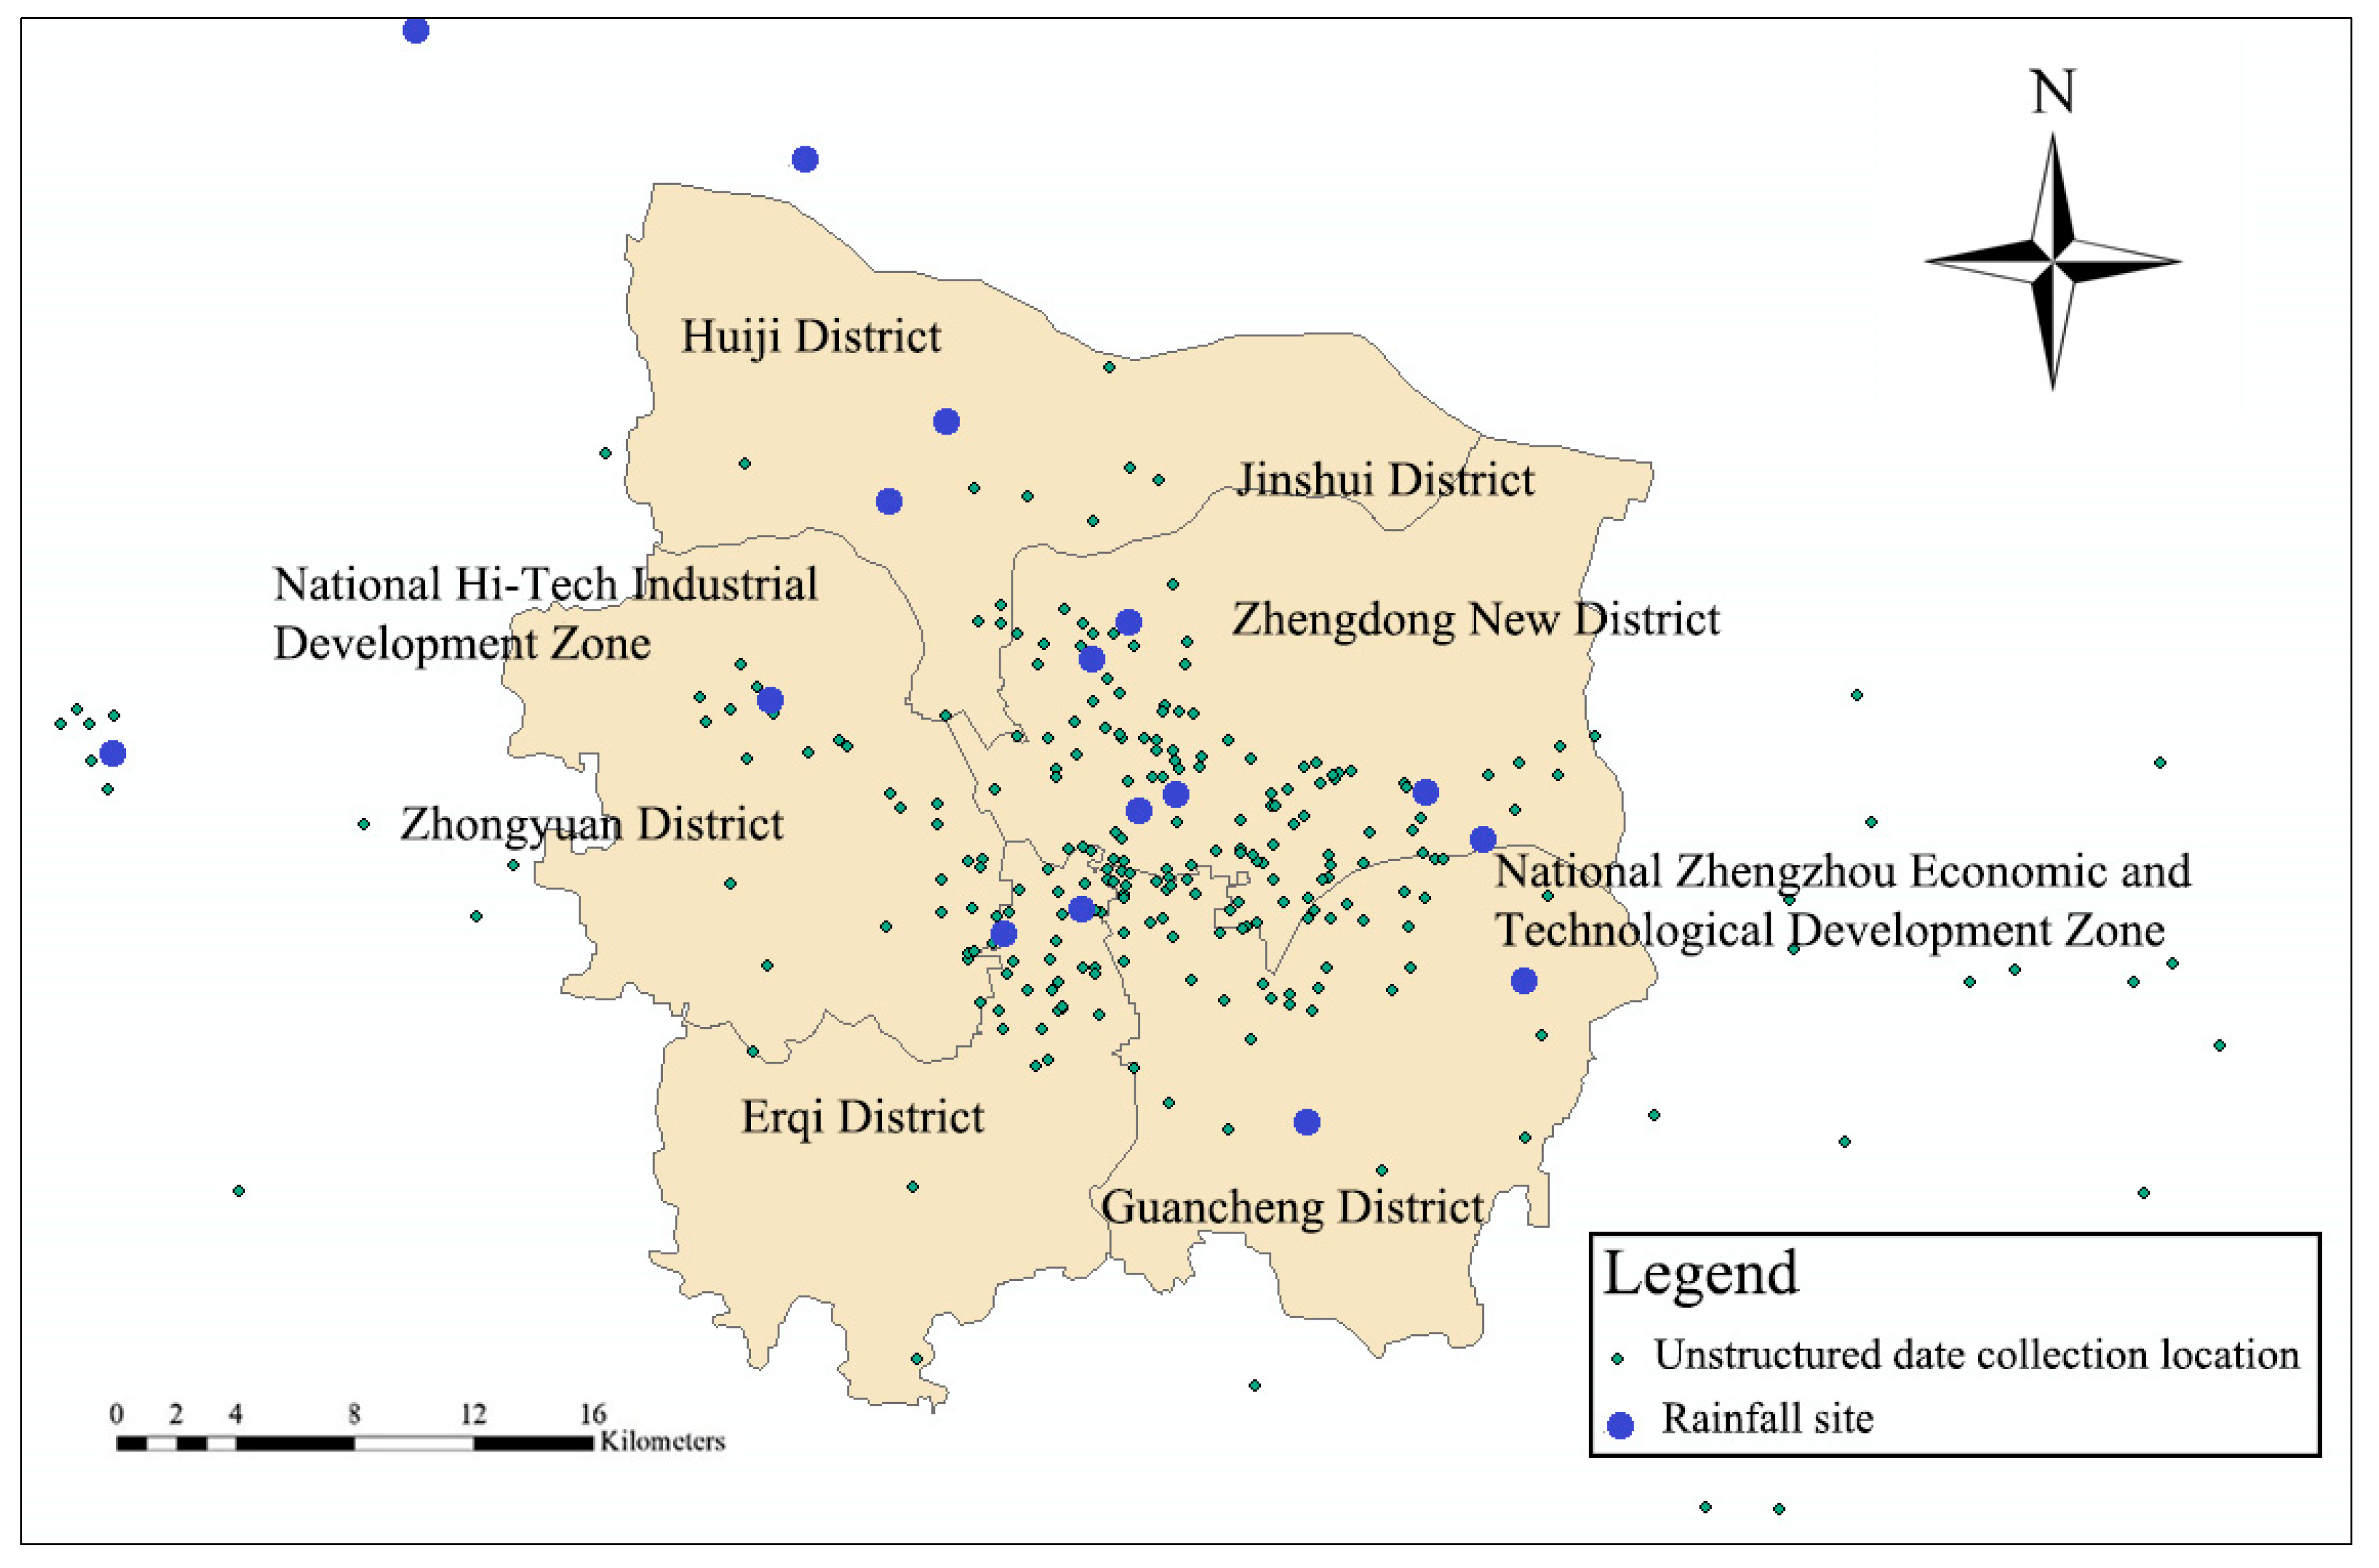
The unstructured data came from Weibo texts that reflected rainfall situations. By using Python programming, a web crawler code was written to crawl Weibo texts related to rainfall in Zhengzhou City, from 2011 to 2018, on the Sina Weibo platform. Then, it deleted the Weibo text that did not reflect rainfall information. The actual rainfall was reflected by the number of microblog texts related to rainfall, during the rainfall process. A geographical distribution map of the rainfall station location, compared to the unstructured data is shown in Figure 3.
2.3. Methodology
2.3.1. Unstructured Data Acquisition Method of the Rainfall Based on Web Crawler Technology
In this study, the web crawler code was written in Python programming, and then the unstructured data of the rainfall in Zhengzhou was crawled on Sina Weibo. A web crawler is a program or script that automatically grabs internet information according to certain rules [26,27,28]. A web crawler starts from an initial webpage URL. Then, it obtains a qualified new webpage URL from the webpage, according to the set criteria. Finally, it saves the qualified webpage, locally, and puts the newly acquired webpage URL in the queue to be crawled until the program ends, either when it reaches the system-set end criteria or no qualified webpage can be crawled. Then, it parses and analyzes the crawled webpage to obtain the data required [29,30,31].
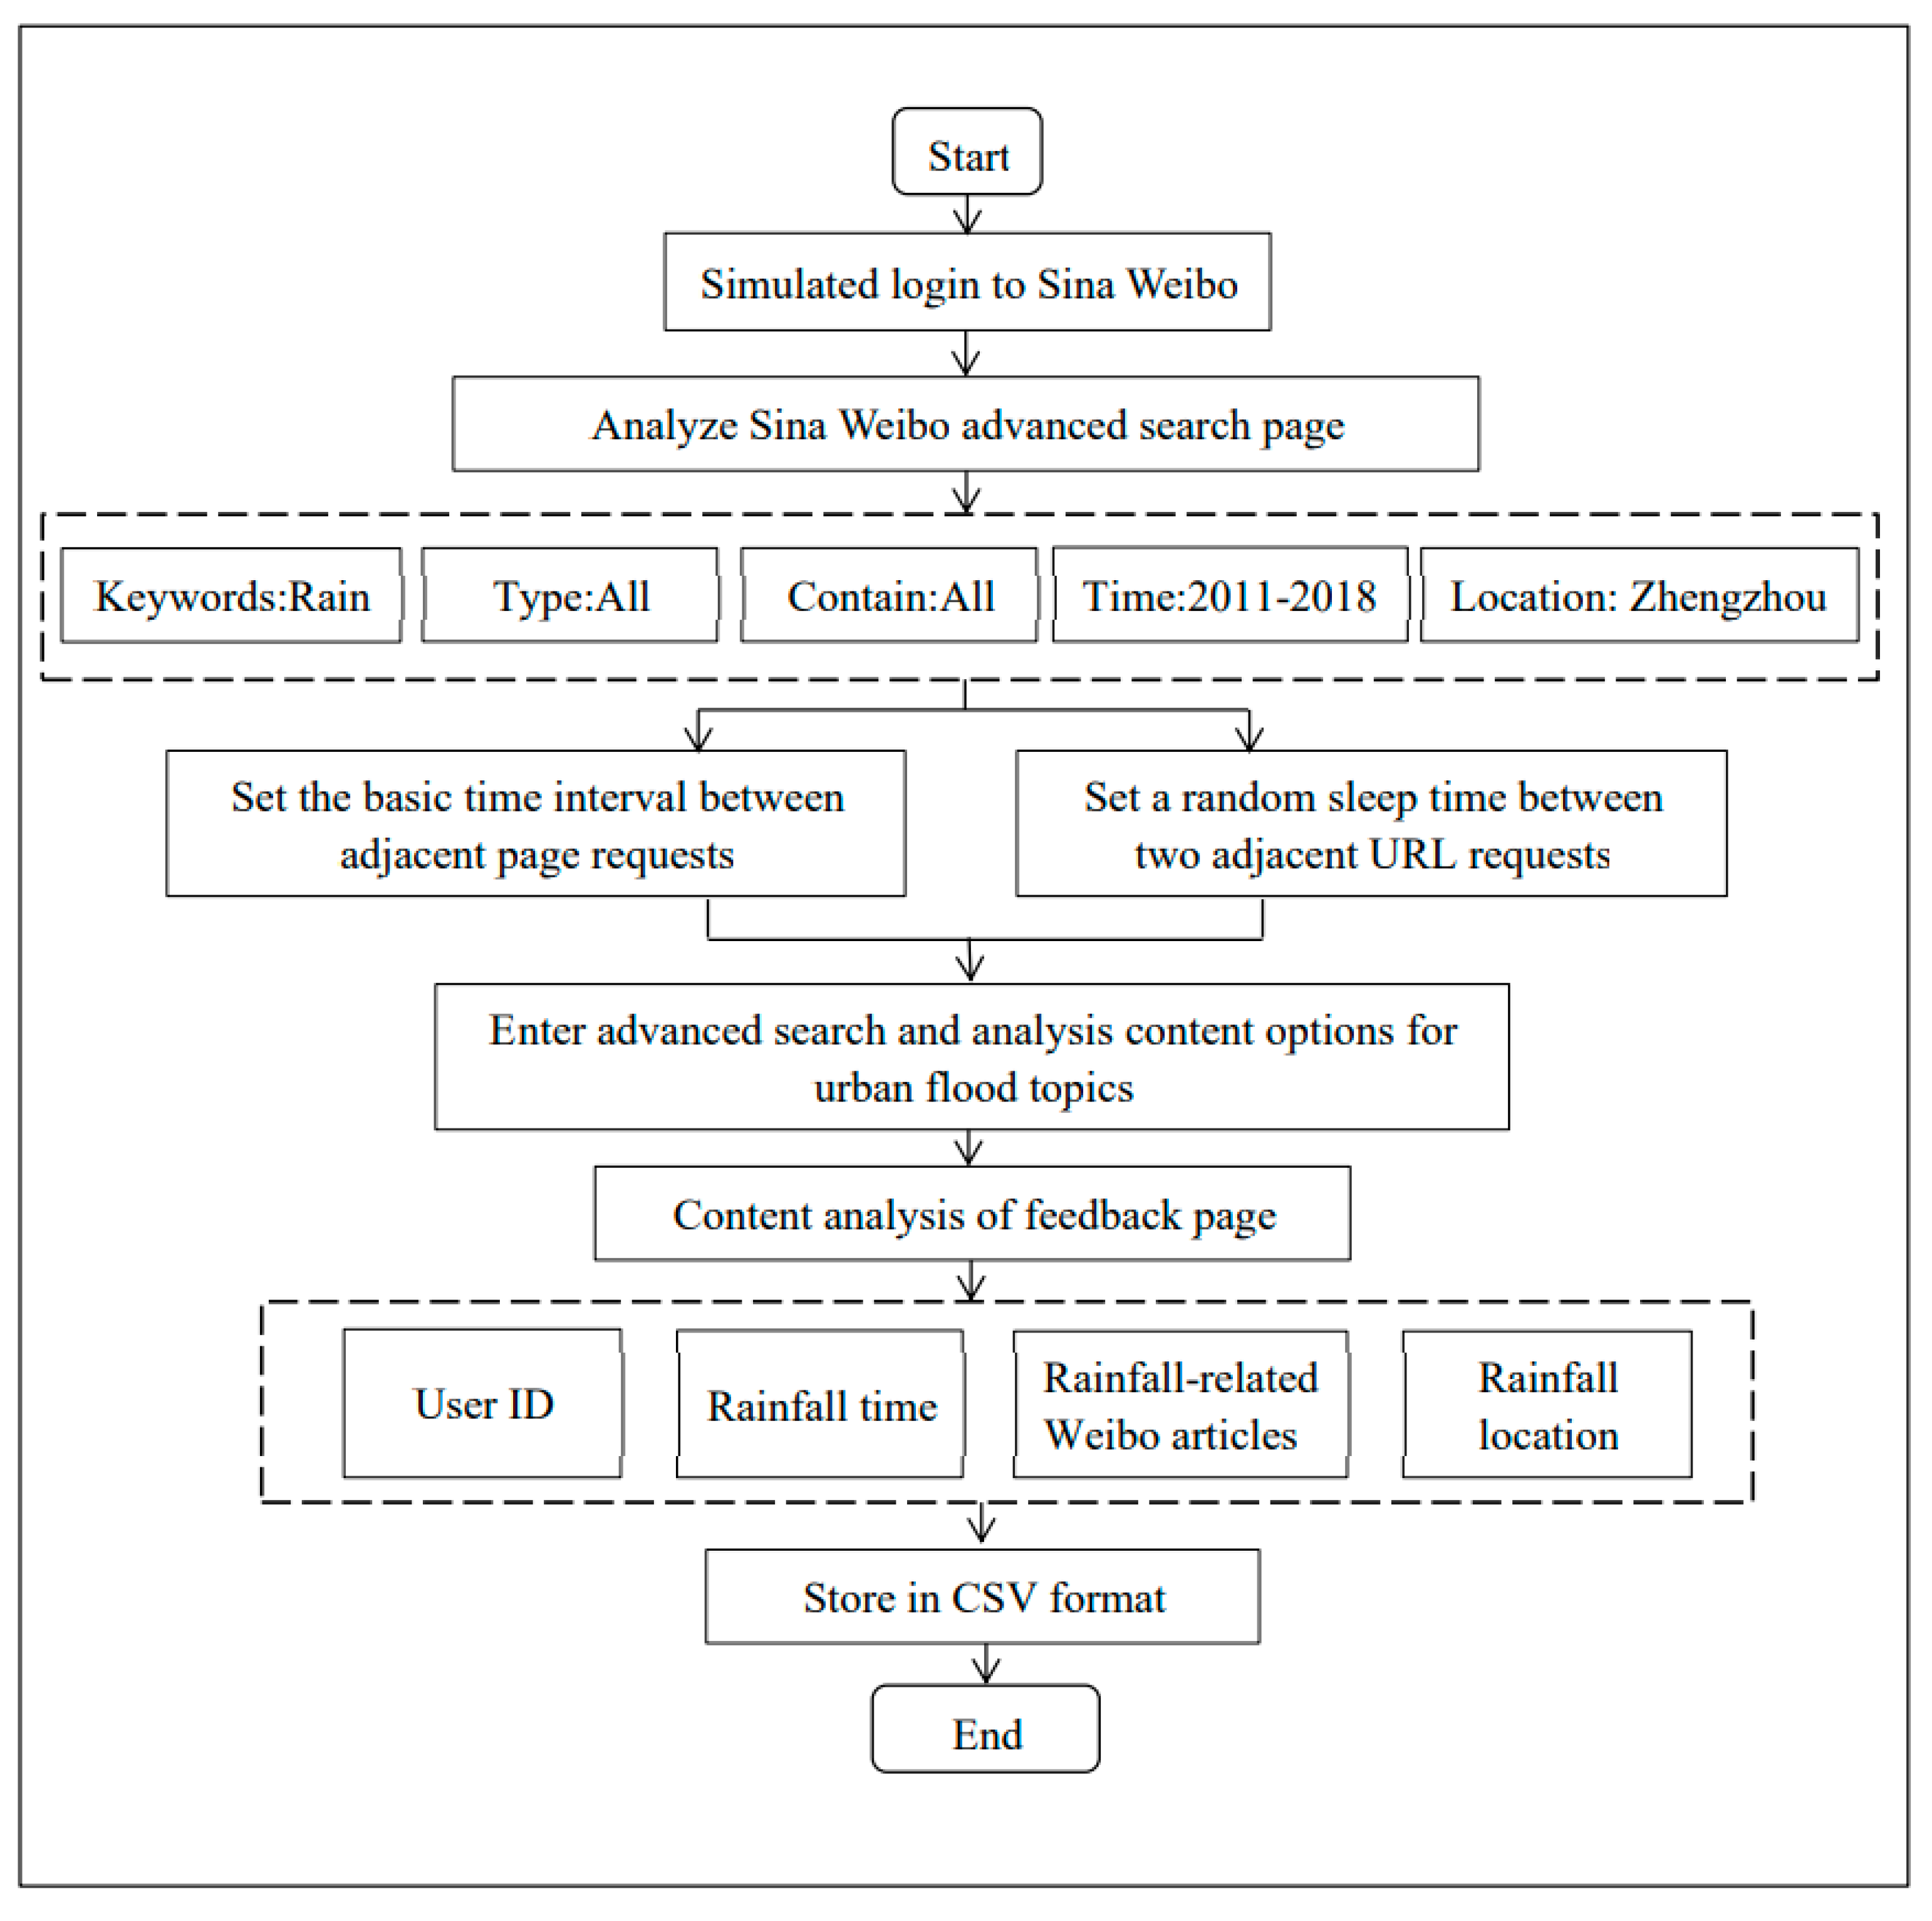
Taking the Sina Weibo platform as an example, the rainfall data crawling steps were as follows: The first step was to simulate an individual account login on Sina Weibo; the second step was to enter the advanced search page of Sina Weibo; the third step was to analyze the advanced search page of Sina Weibo. Taking Zhengzhou as an example, the crawler entered the keyword rain and selected all types and content, the period selected was from 2011 to 2018, and the location was Zhengzhou, Henan. Then, it arrived at the search result page. The fourth step was to parse the search result page. Once all of the webpages on the search result page were obtained, each page was parsed and crawled, then keywords were set to exclude the interference of the irrelevant data, such as “meteor shower” and names with the word “rain”. Finally, the page was written into the result file, which was stored in CSV format. The fifth step was to end the program after all of the search result pages were crawled. A flow chart of the steps taken by the Sina Weibo rainfall data crawler is shown in Figure 4.
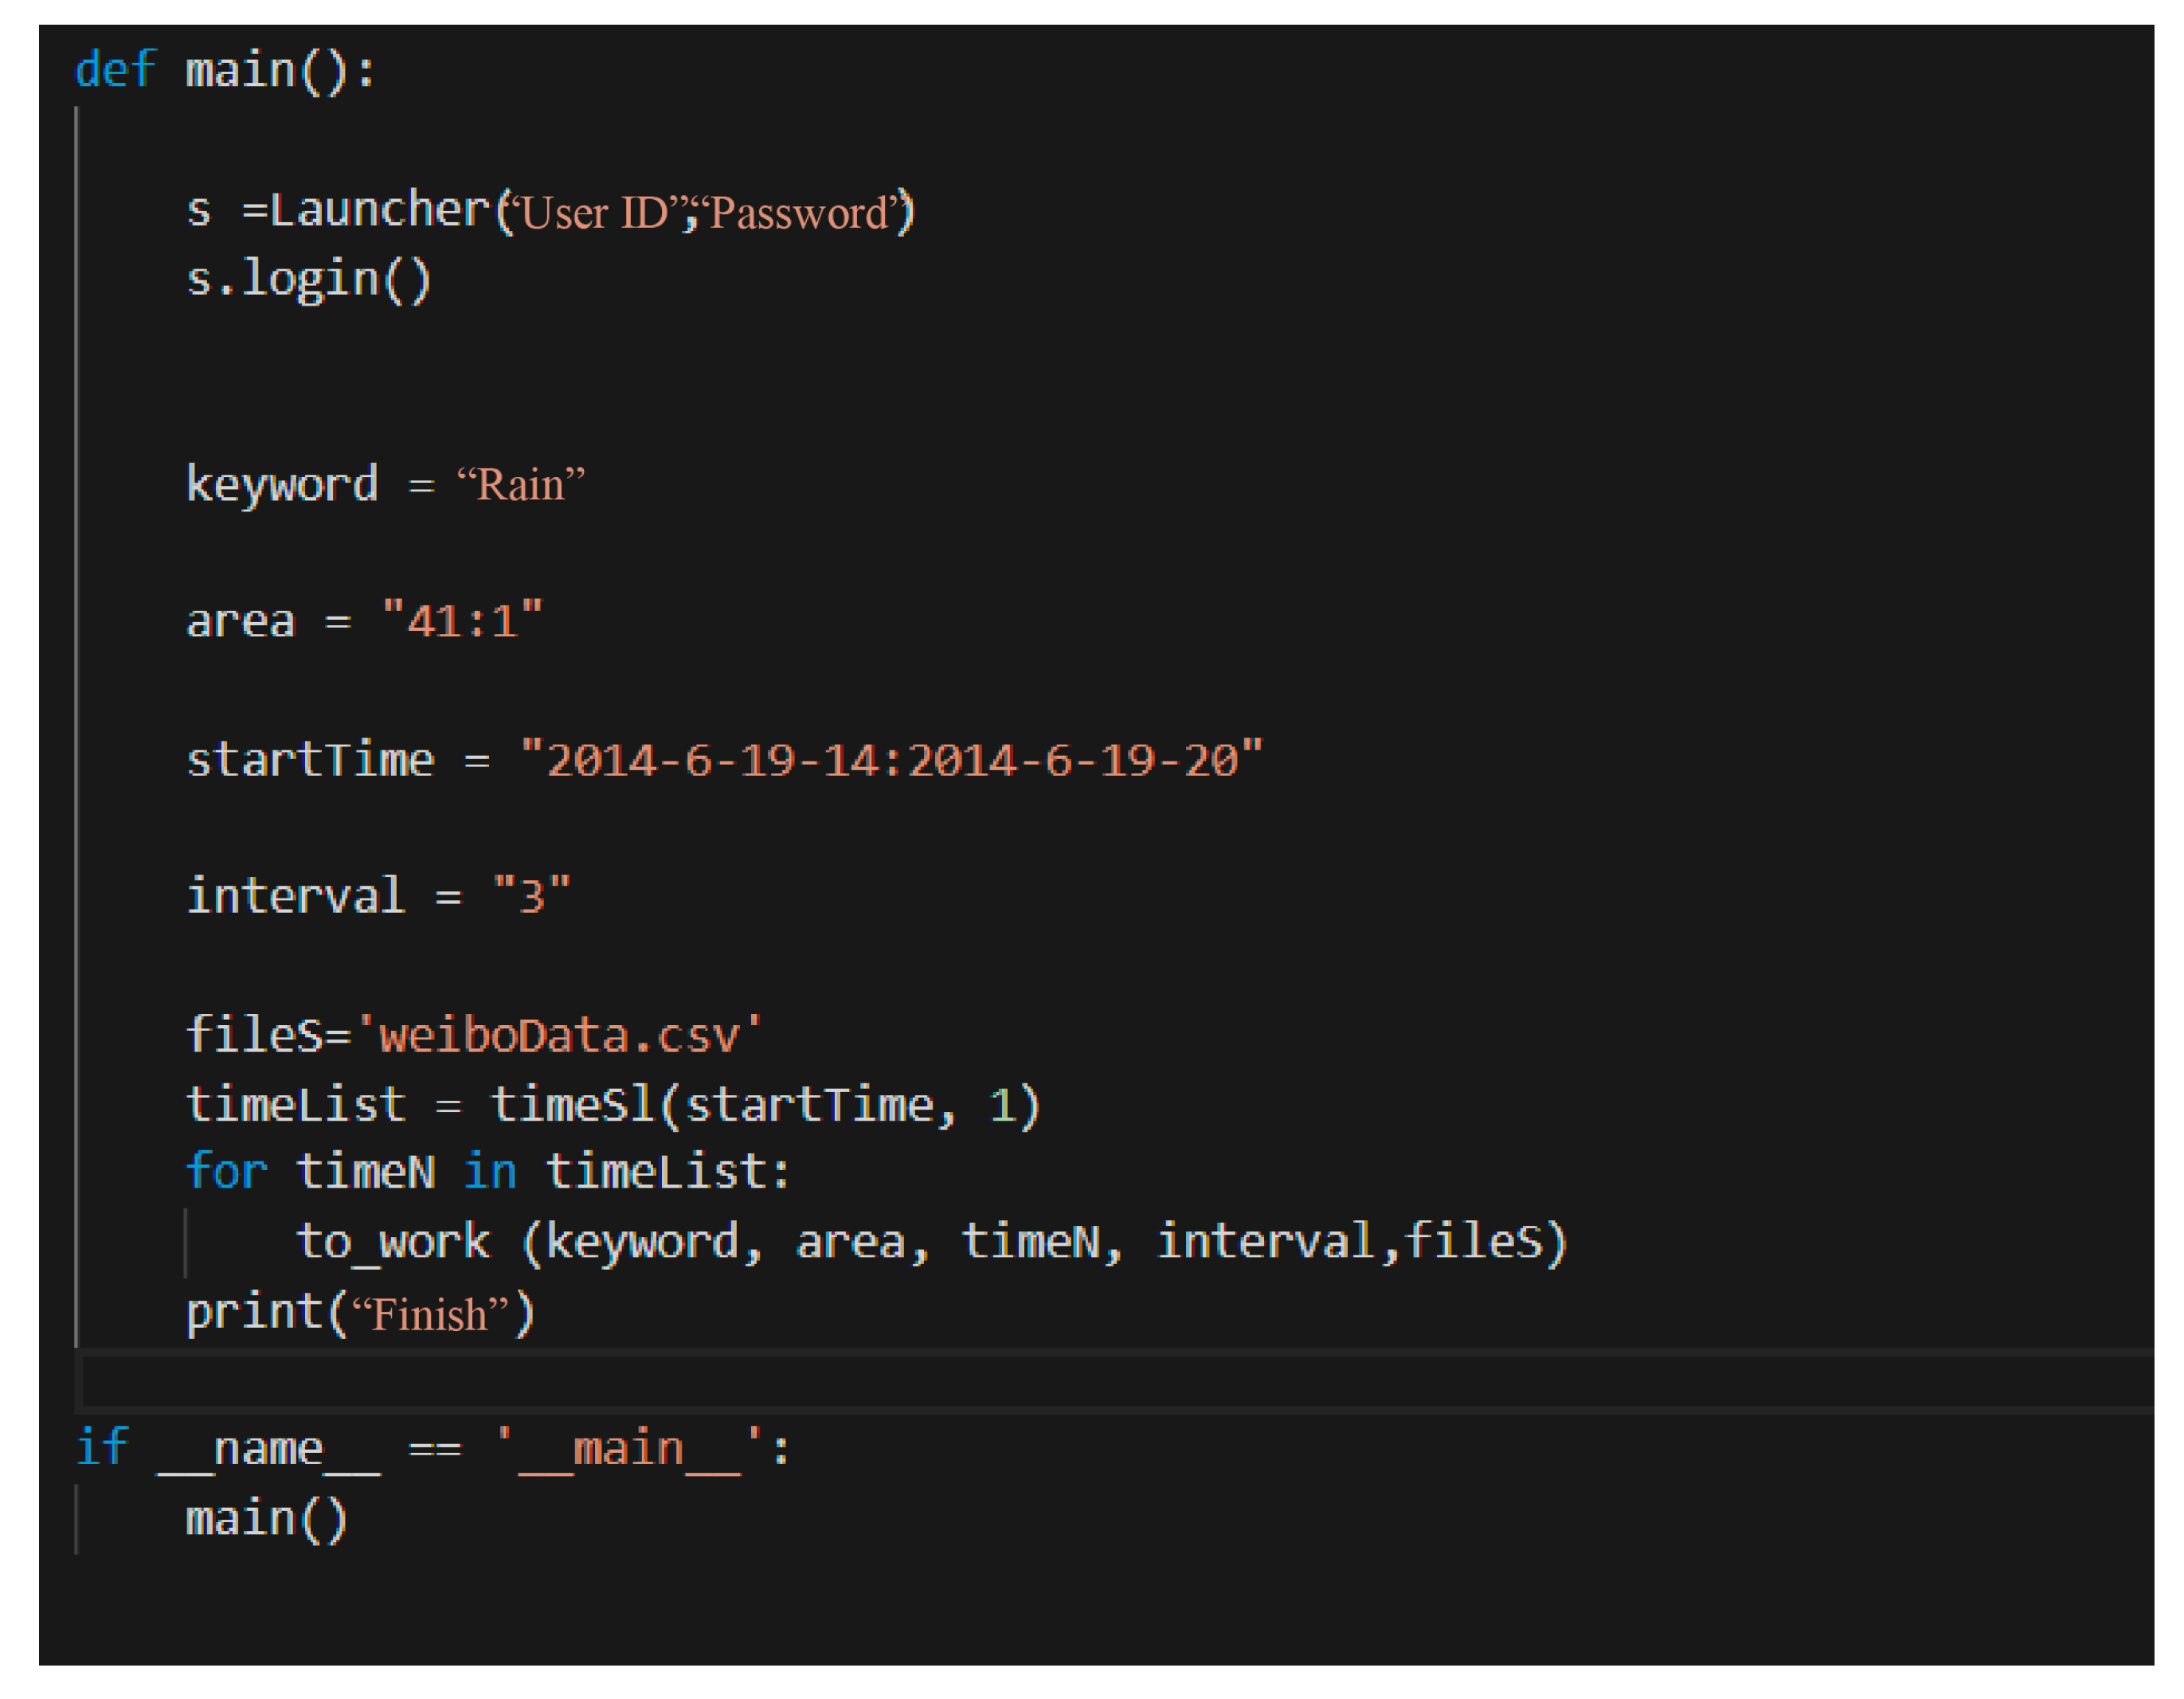
The web crawler code was written in Python, and part of the code is shown in Figure 5.
2.3.2. Correlation Analysis Method of the Unstructured Data and the Measured Rainfall Data
A correlation analysis between the Sina Weibo crawling data and the measured rainfall data was carried out using the Pearson correlation coefficient method [32]. The measured rainfall was expressed as X, and the number of Sina Weibo posts involving rainfall was expressed as y. The formula for the correlation coefficient is as follows:
In the formula, r represents the correlation coefficient, and its value range is |r| ≤ 1. A positive value of r means a positive correlation between the two directions; otherwise, a negative value means a negative correlation; |r| = means the two items are completely related; 0.8 ≤ |r| < 1 represents high correlations; 0.6 ≤ |r| < 0.8 represents strong correlations; 0.4 ≤ |r| < 0.6 represents moderate correlations; 0.2 ≤ |r| < 0.4 represents weak correlations; 0 < |r| < 0.2 represents very weak correlations; and |r| = 0 means the two items have no correlation [33,34].
2.3.3. Rainfall Pattern Identification Method Based on the Fuzzy Recognition Method
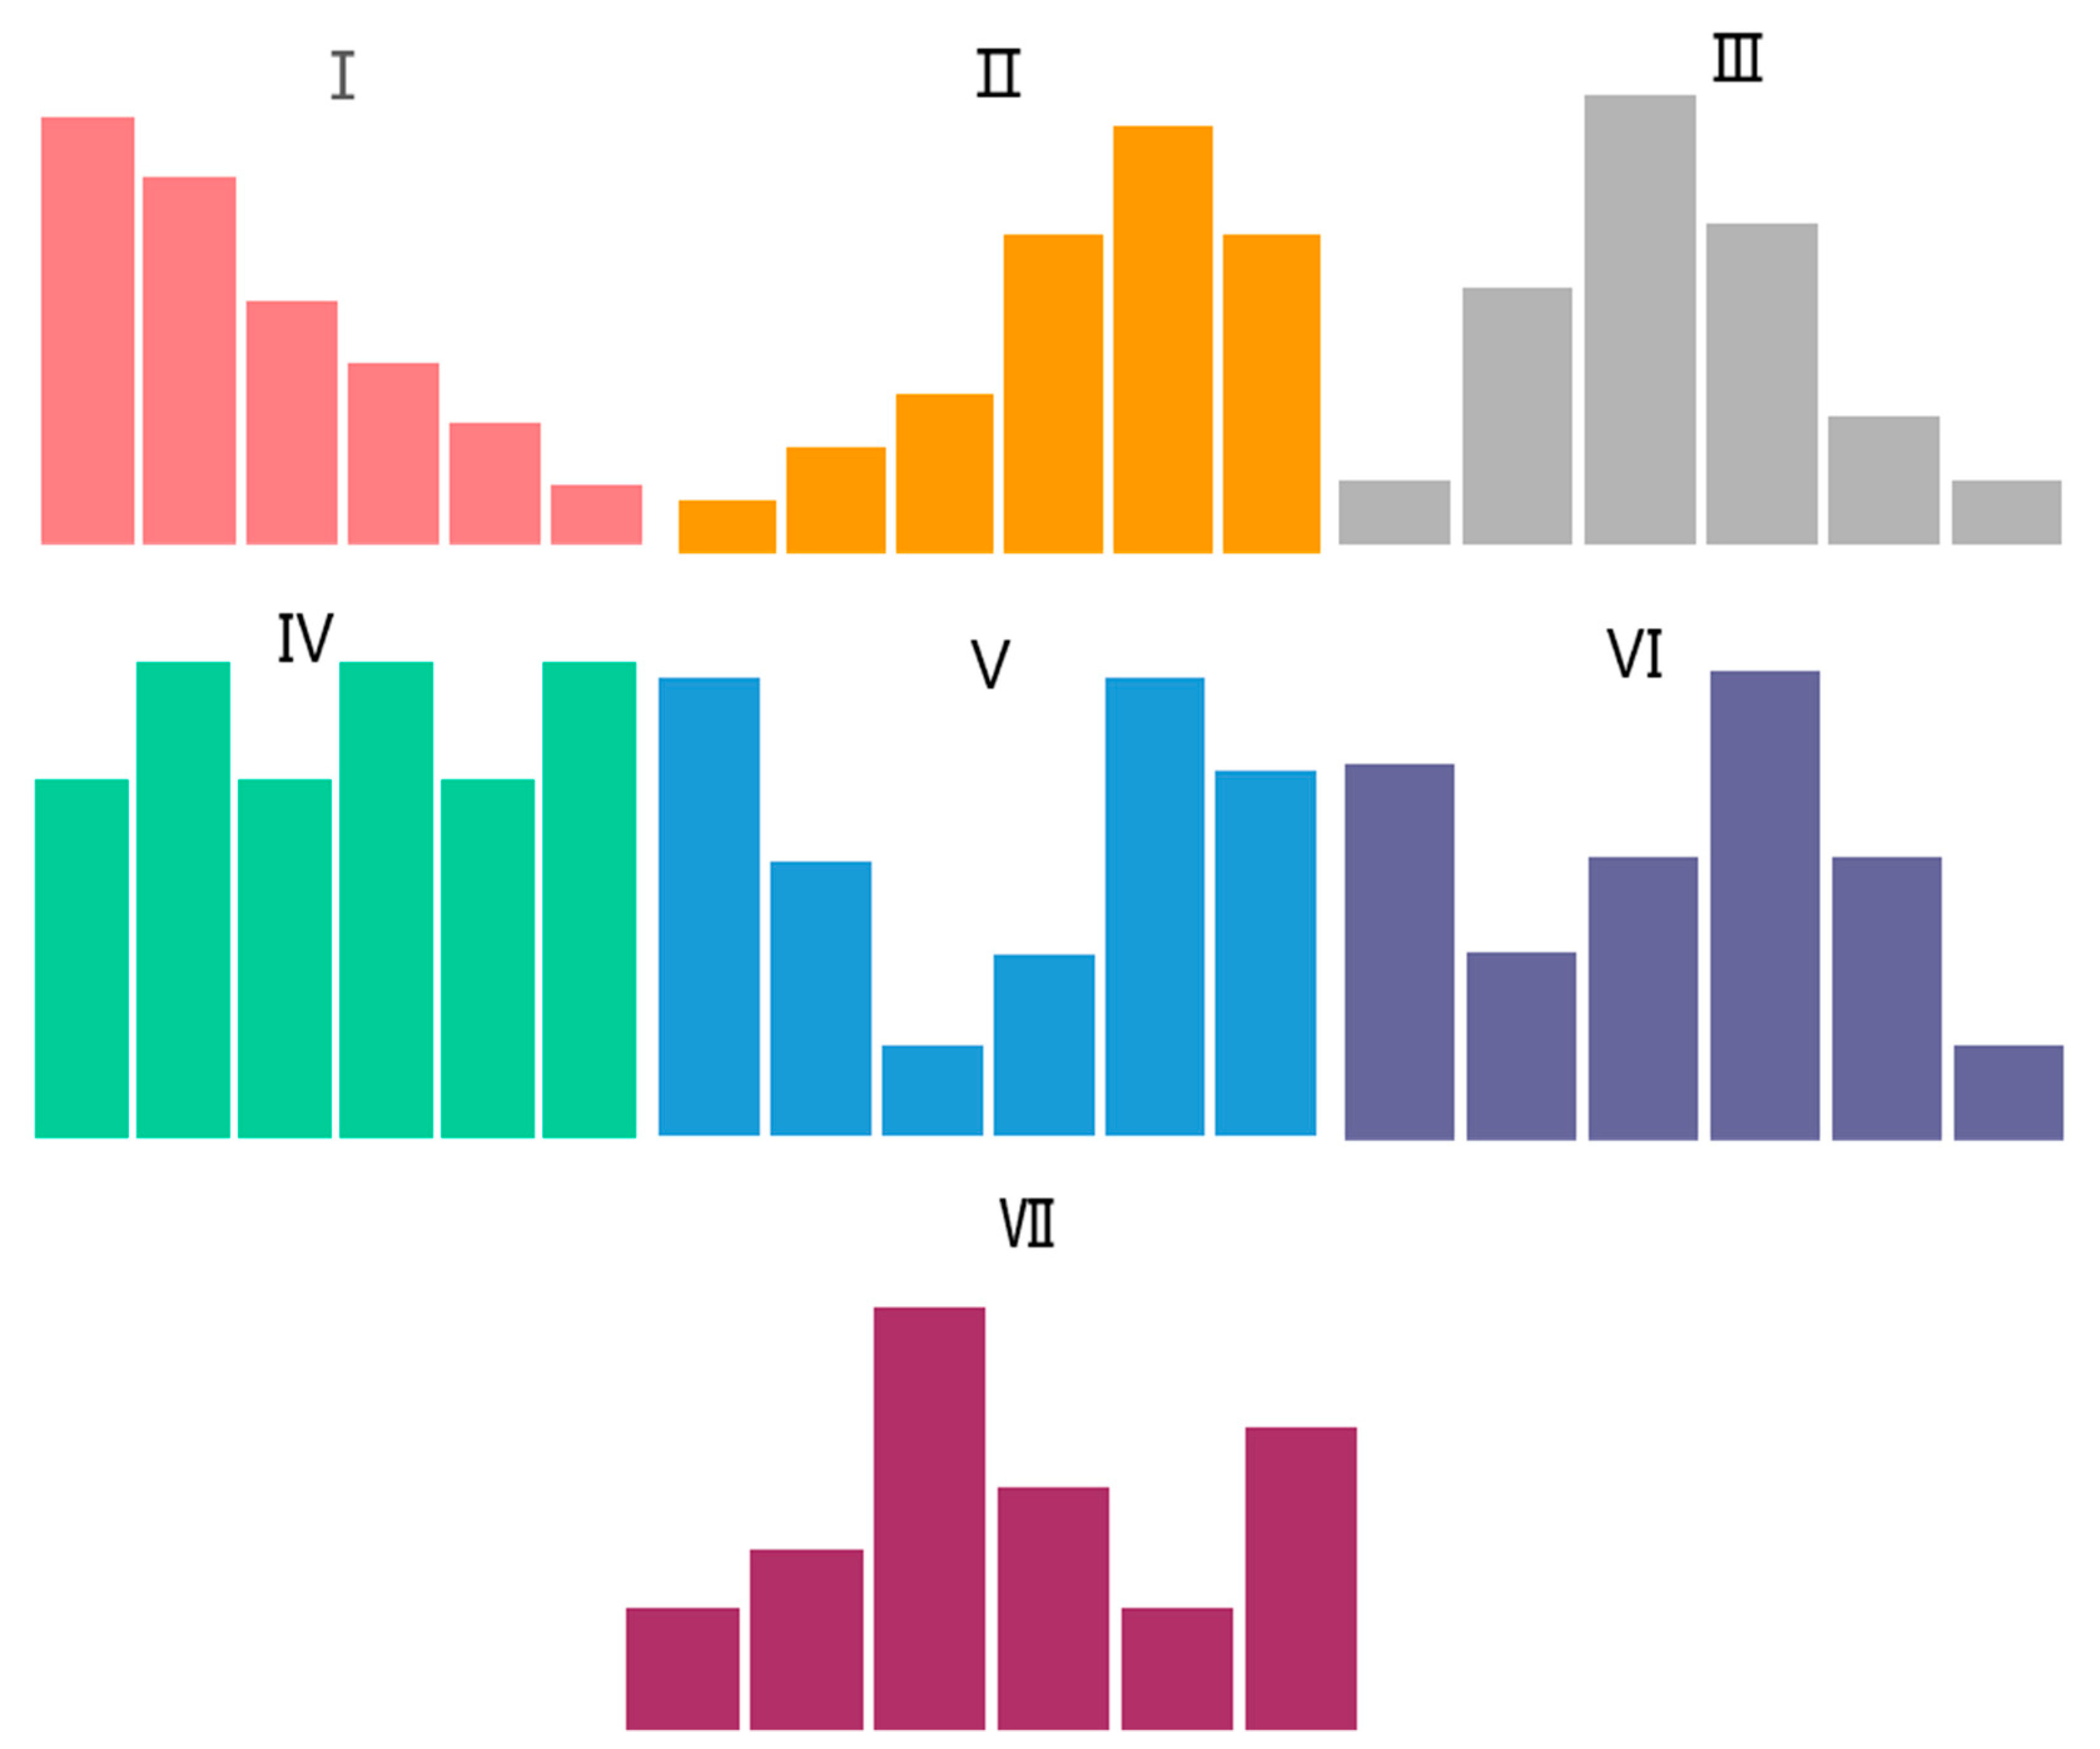
The fuzzy recognition method was used to identify rain patterns. Firstly, the ratio of the period rainfall to the total rainfall, was used as the rain pattern index, and a pattern matrix of seven rain patterns was established, which is shown in Table 1. Then, the proximity of each actual rainfall to the seven rain patterns (Figure 6), was calculated, and the rain pattern was identified according to the principle of proximity.
The formula for calculating the closeness degree ek between each rainfall and the seven modes is as follows:
where xi is the rain pattern index of a rainfall event, xi = ΔHi/H,ΔHi refers to the rainfall in each period, H is the total rainfall. gki is the rain indicator for the seven modes, gki = ΔHki/Hk, ΔHki is the rainfall in each period of the model, and Hk is the total rainfall of the model.
Based on the principle of proximity, if the closeness degree, ek, to kth was the largest, the rain belonged to the k-th rain pattern. The division of work was performed automatically by computer, which avoided human error in the judgment.
3. Results
3.1. Calculation Results of Rain Patterns in Zhengzhou City Based on Unstructured Data
Taking Zhengzhou City as an example, the rainfall patterns of the unstructured data were analyzed. The unstructured data were obtained from the Sina Weibo platform with the web crawler program, and the unstructured data of 153 rainfall events, from 2011 to 2018, in Zhengzhou, were crawled. The measured data were the rainfall in the same 24 h periods at 14 rain stations in Zhengzhou, which was calculated in 1-h units. The period-by-period rainfall of the 14 rainfall stations, was arithmetically averaged, and a period-by-period rainfall table was established. Limited by the length of the article, only five rainfall data were shown in the table. The 20180730, 20170825, 20160605, 20150828, and 20140501 measured data tables for the rainfall, are shown in Table 2. Taking 20180730 as an example, 2018 is the year of the local rainfall, 07 is the month of the local rainfall, and 30 is the date of the local rainfall.
3.1.1. Result and Analysis of the Unstructured Data Crawling
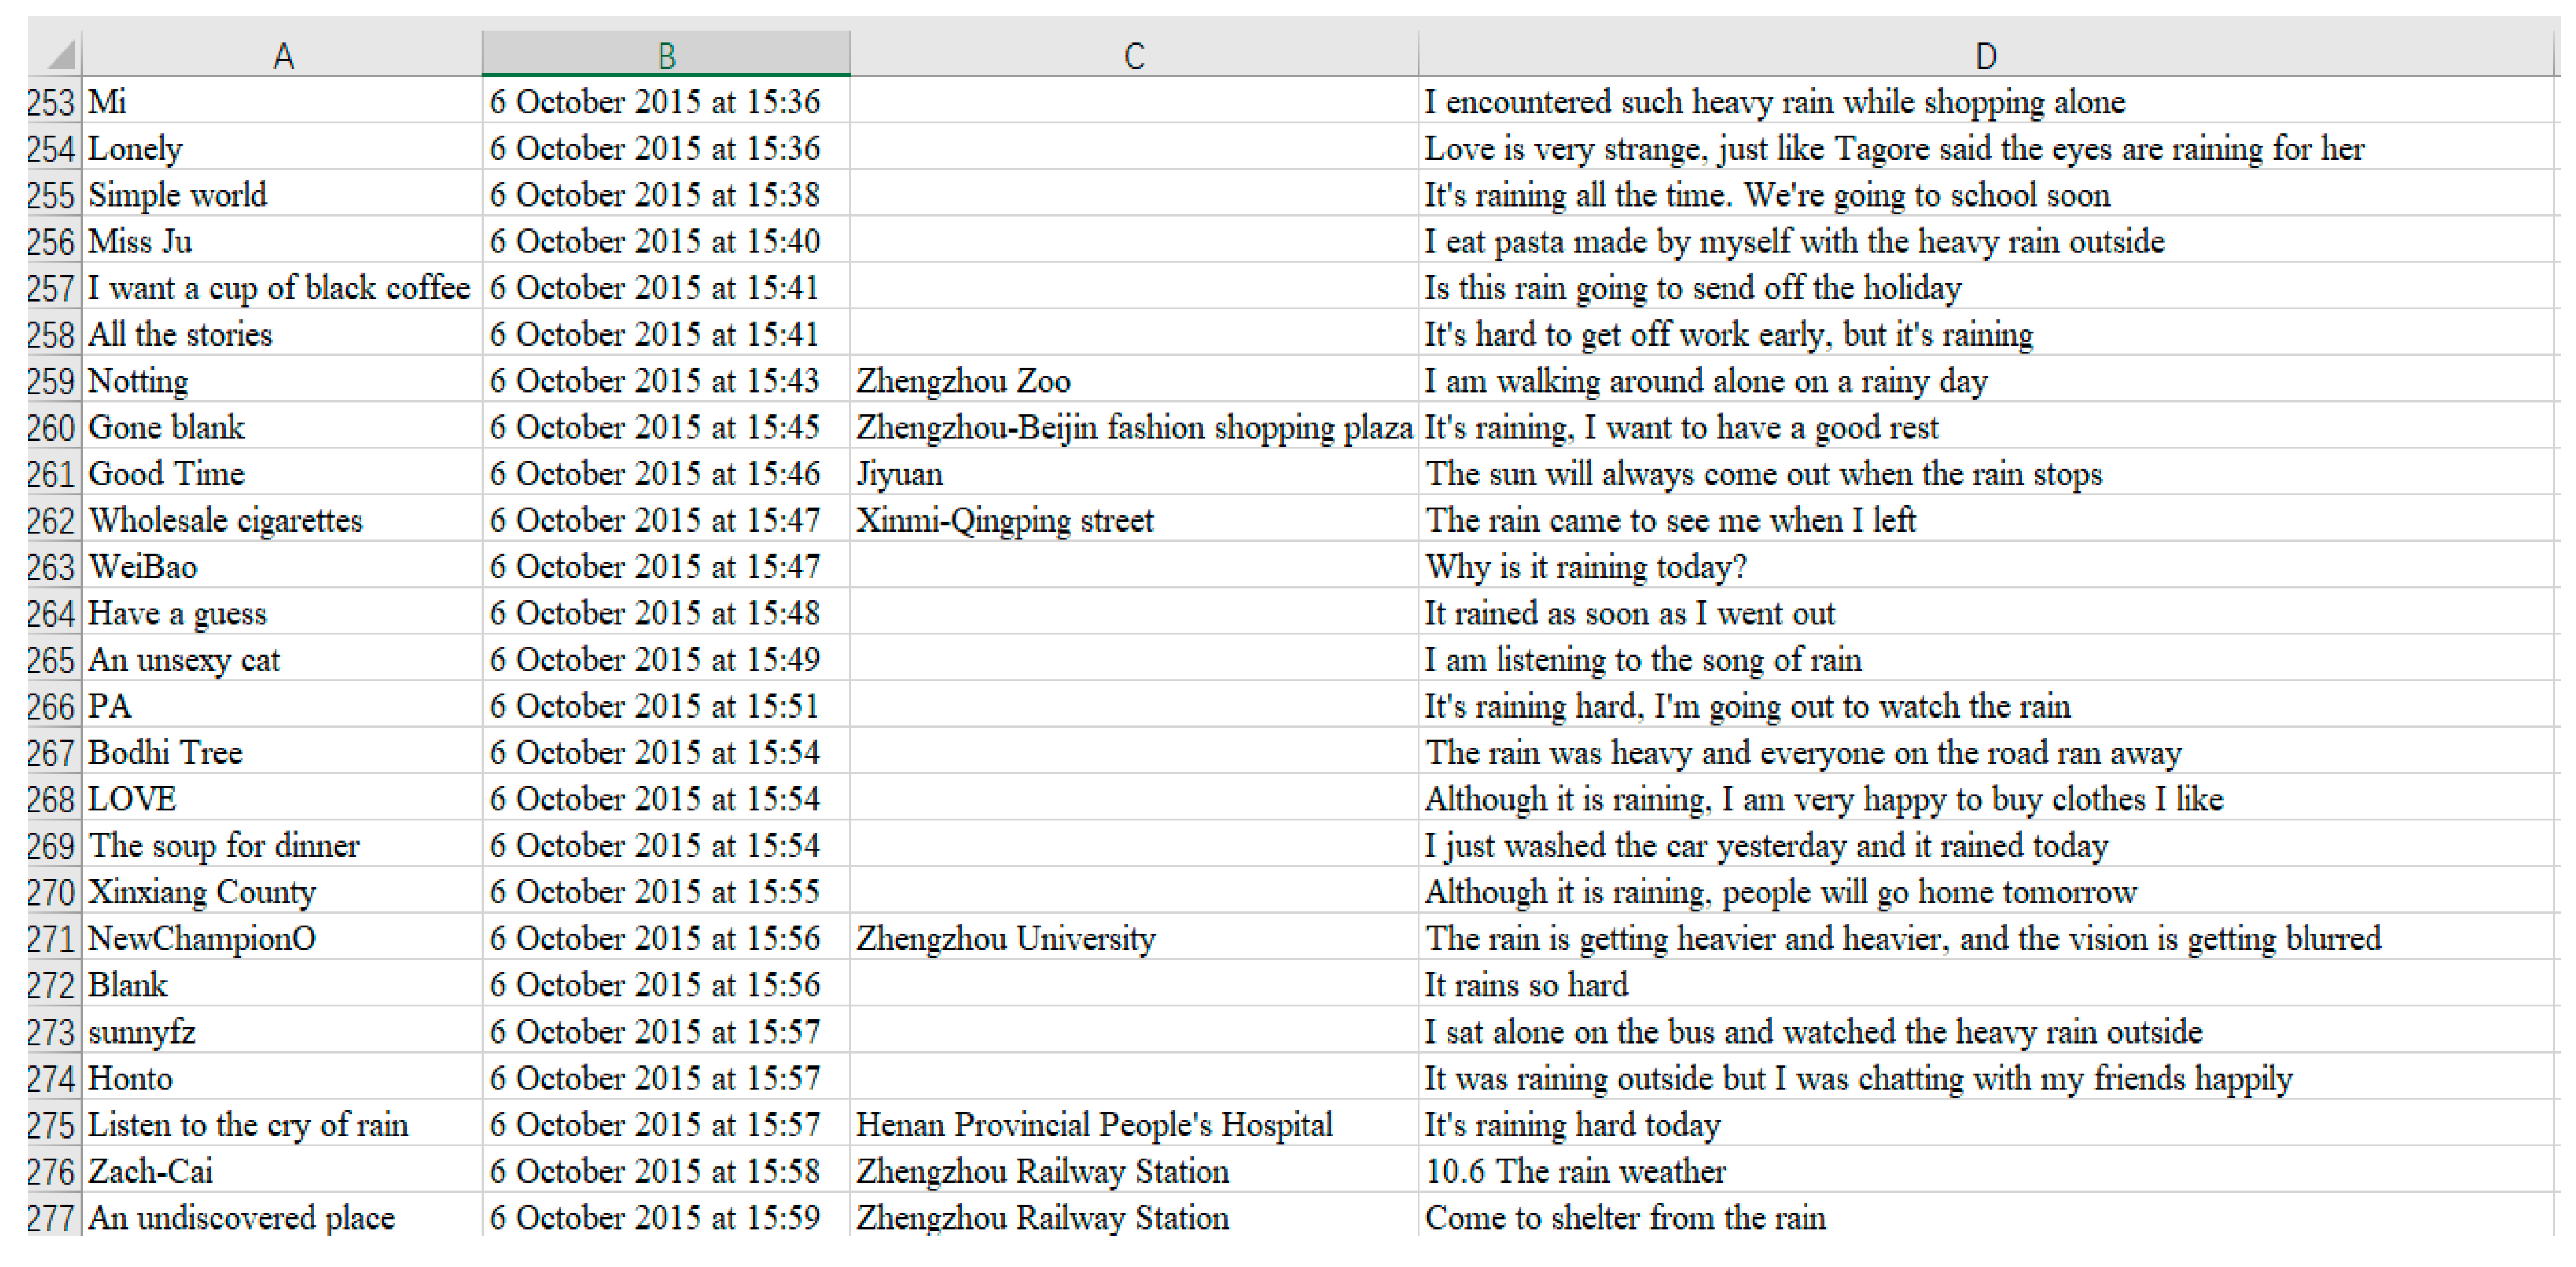
Figure 7 shows part of the data crawled, according to the keyword “rain” and the location is Zhengzhou, Henan.
In the above figure, column A is the user’s nickname, column B is the time of the Sina Weibo post, column C is the address, and column D is the content of the Sina Weibo post.
When initially sorting out the original data, it could be found that some texts reflect real rainfall, but it was difficult to obtain the rainfall-related data, directly based on the content from Sina Weibo. It was found that, as the duration and volume of the rainfall gradually increased, the amount of unstructured data about the rainfall on social media platforms also increased. Therefore, by further analyzing the data, it was possible to study the amount of rainfall reflected in the microblogs.
Due to the existence of irrelevant data in the unstructured data, the unstructured data were not zero for the whole period, which made it difficult to judge the start and end time of the rainfall, directly based on the amount of data. Through a statistical analysis of the amount of data at the time when there was no rainfall in the unstructured data, the average value of the amount of data irrelevant to the period was 15. We tried to divide the process line with the average value of 15 as the data baseline and then used 25 and 30 as the baselines for the comparison process line. Taking the rainfall of 19 June 2014as an example, a processed comparison chart is shown in Figure 8. The larger the baseline selected, the more data that could be excluded. In this way, the unstructured data and the measured data process lines could be closer to each other before the rainfall began. However, the selection could not be too large, which would exclude the real data. Therefore, at twice the average value, 30 was selected as the baseline to process the unstructured data, to eliminate the interference of the irrelevant data as much as possible.
The irrelevant data in the original data were removed, and the period’s data volume table was established. Taking the rainfall of 20180730, 20170825, 20160605, 20150828, and 20140501, as examples, the period data volume is shown in Table 3.
3.1.2. Correlation Analysis
From the beginning of the rain to the end of the rain, a large number of Sina Weibo users published rainfall-related blog posts in real-time, describing their current status. The number of posts varied with the duration and amount of rain [21]. These data were compared with the rainfall intensity process lines to draw a curve, based on the data volume and time, reflecting the change in rainfall intensity with time. Therefore, a correlation analysis between the measured data from the rainfall station and the unstructured data from Sina Weibo was carried out to verify the feasibility of applying the unstructured data to the rainfall pattern analysis.
The process line of the rainfall over time is the relation curve between the rainfall and the corresponding time, which can well reflect the rainfall of each period in the total rainfall duration [35,36]. Therefore, it is more intuitive to analyze whether the unstructured data can reflect the actual rainfall process, by comparing the process line drawn by the unstructured data with the rainfall process line drawn by the measured data in the same field. This is shown in Figure 10.
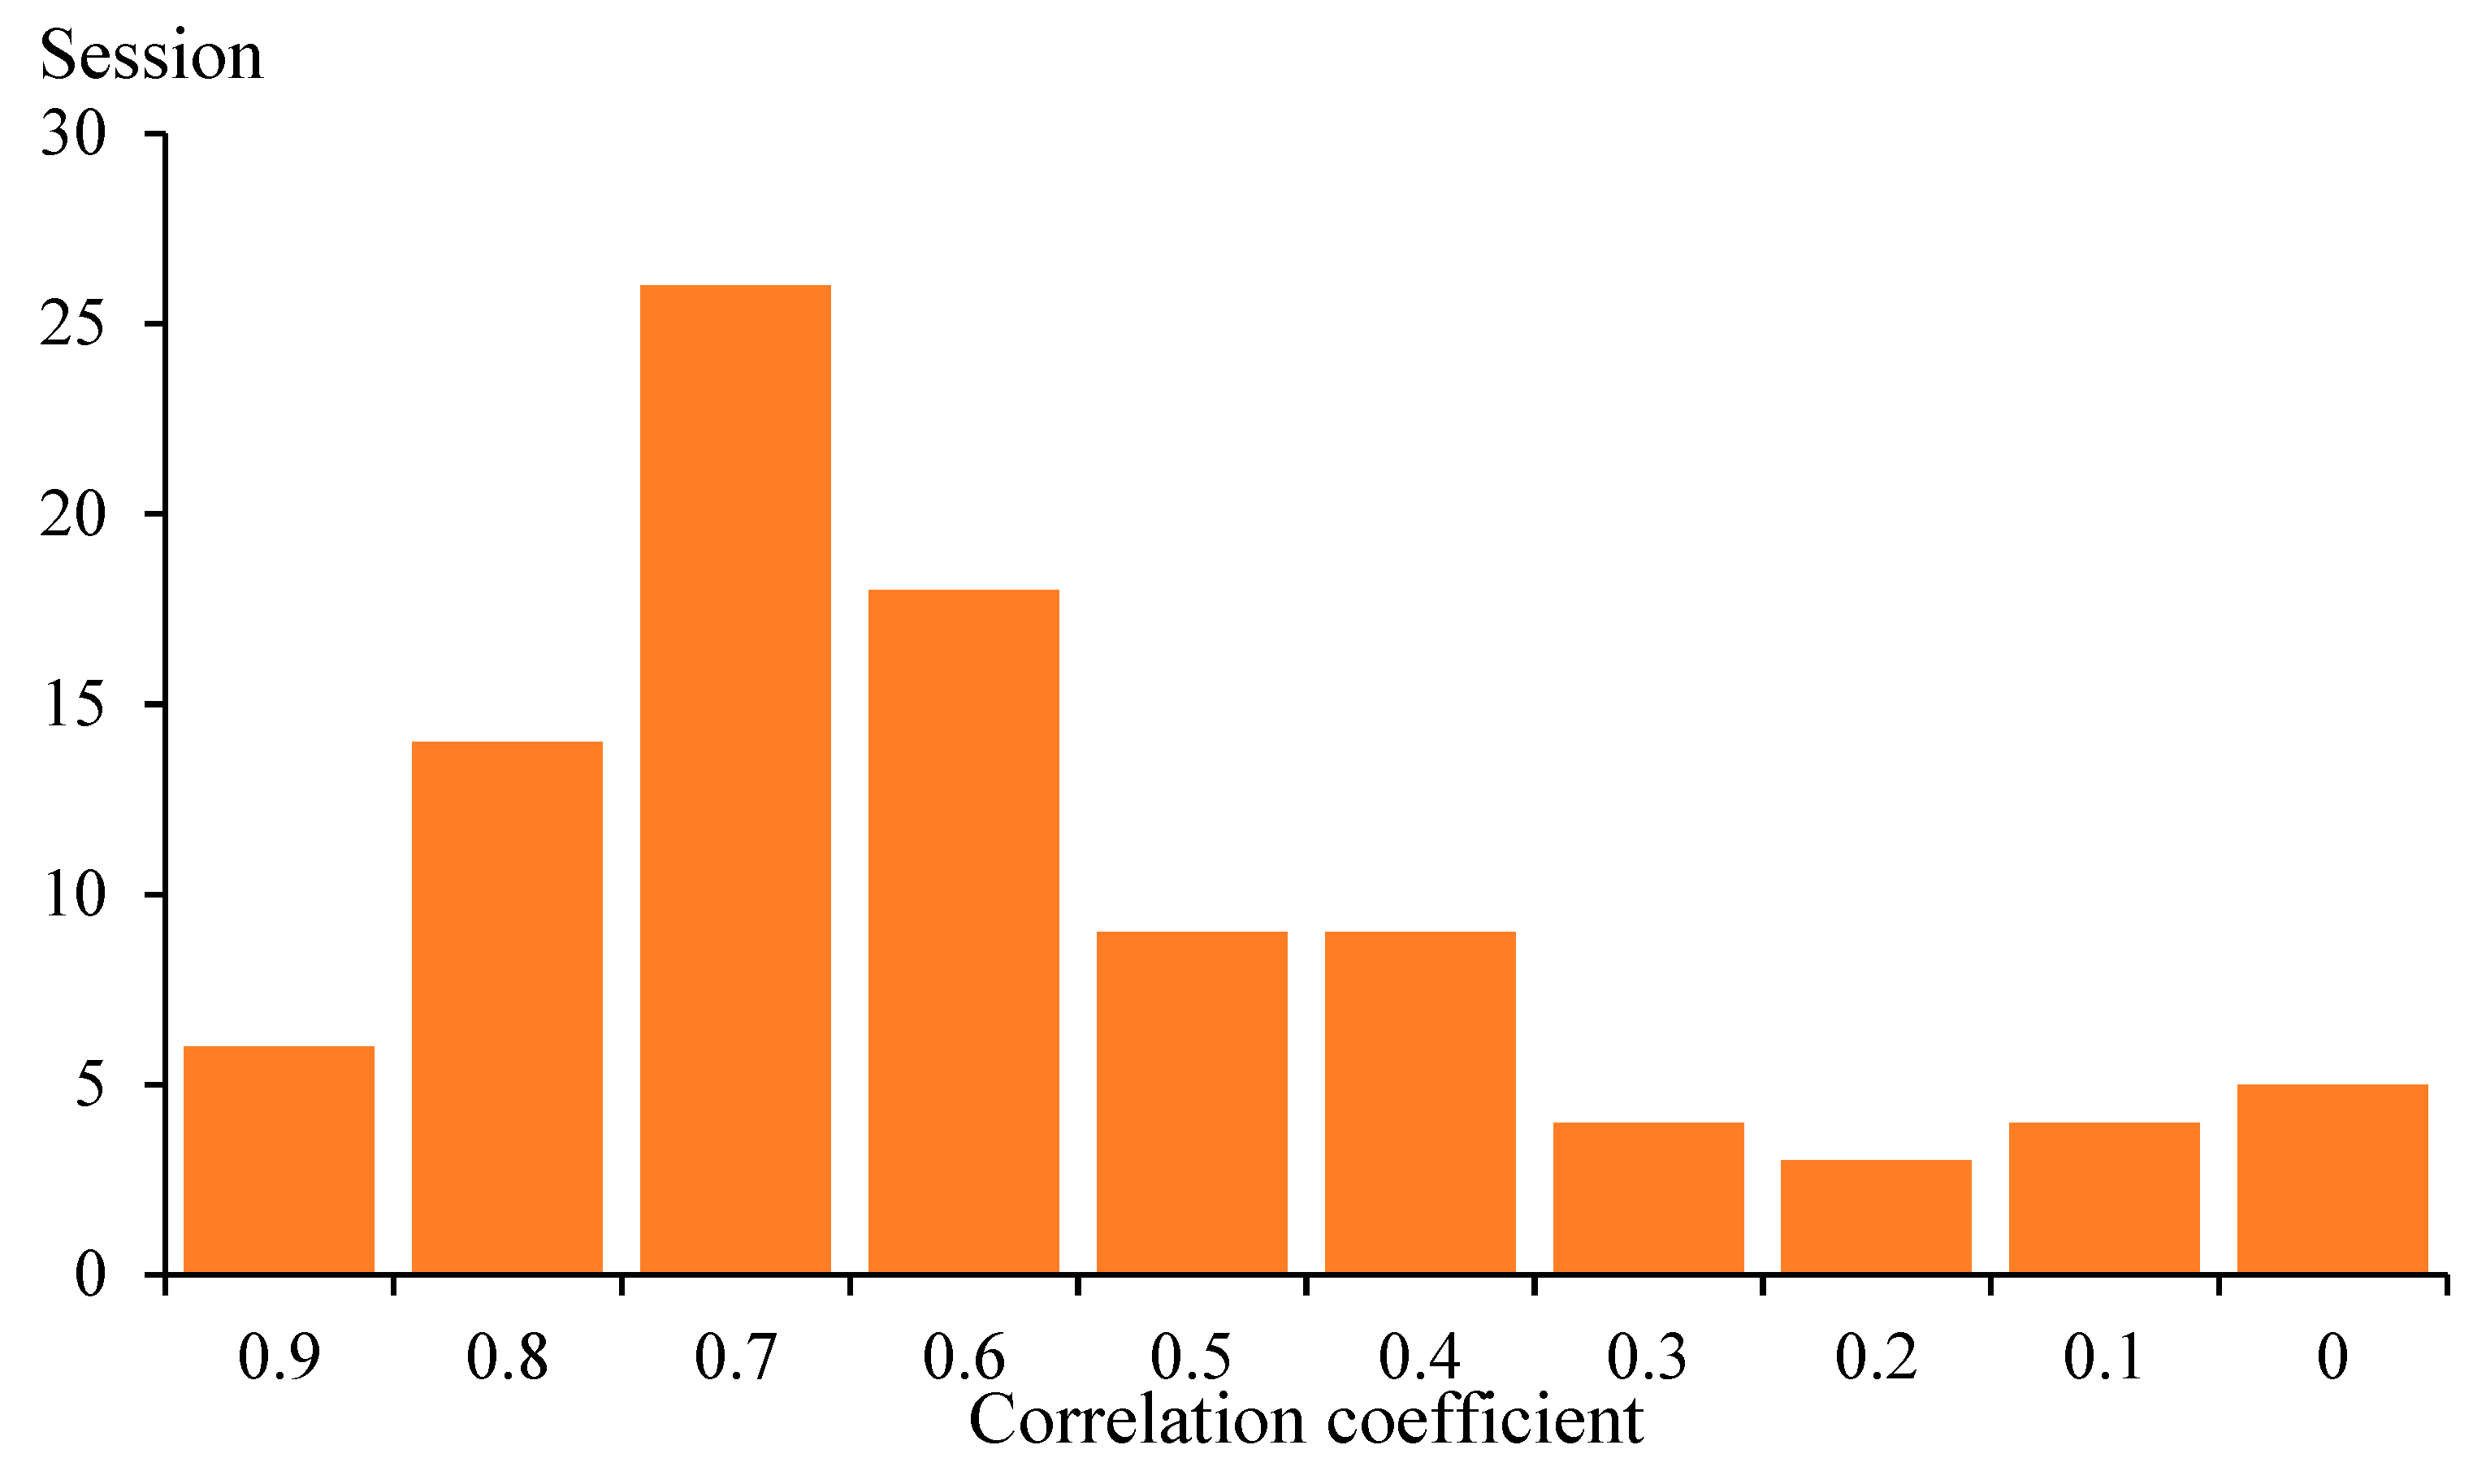
By quantitatively analyzing the correlation between the measured rainfall data and the unstructured data, using Pearson’s correlation coefficient, as mentioned in Section 2.3.2, the feasibility of applying the unstructured data to the urban rainfall type analysis can be verified. According to Formula (1), the correlation coefficient between the average rainfall data and the amount of Sina Weibo data, was calculated. The calculation results are shown in Figure 11. There were 20 rainfalls events with a high correlation (0.8 ≤ |r| < 1) and 44 rainfalls events with a strong correlation (0.6 ≤ |r| < 0.8).
3.1.3. Calculation Results of the Rain Pattern Analysis
According to the fuzzy recognition method, the rain patterns of 20 Sina Weibo rainfall data with a high correlation (0.8 ≤ |r| < 1) were identified. Then, the identified rainfall pattern results were linked to the rainfall events, as shown in Table 4.
The measured rainfall data from 13 rainfall stations were selected for the rain pattern analysis with reference to the geographic sources of the Sina Weibo data. The selection of the actual rainfall events data was the same as for the selection of the Sina Weibo rainfall events. Subsequently, the rain patterns, based on the fuzzy recognition method, were identified. The results are shown in Table 5.
3.2. Analysis of the Results
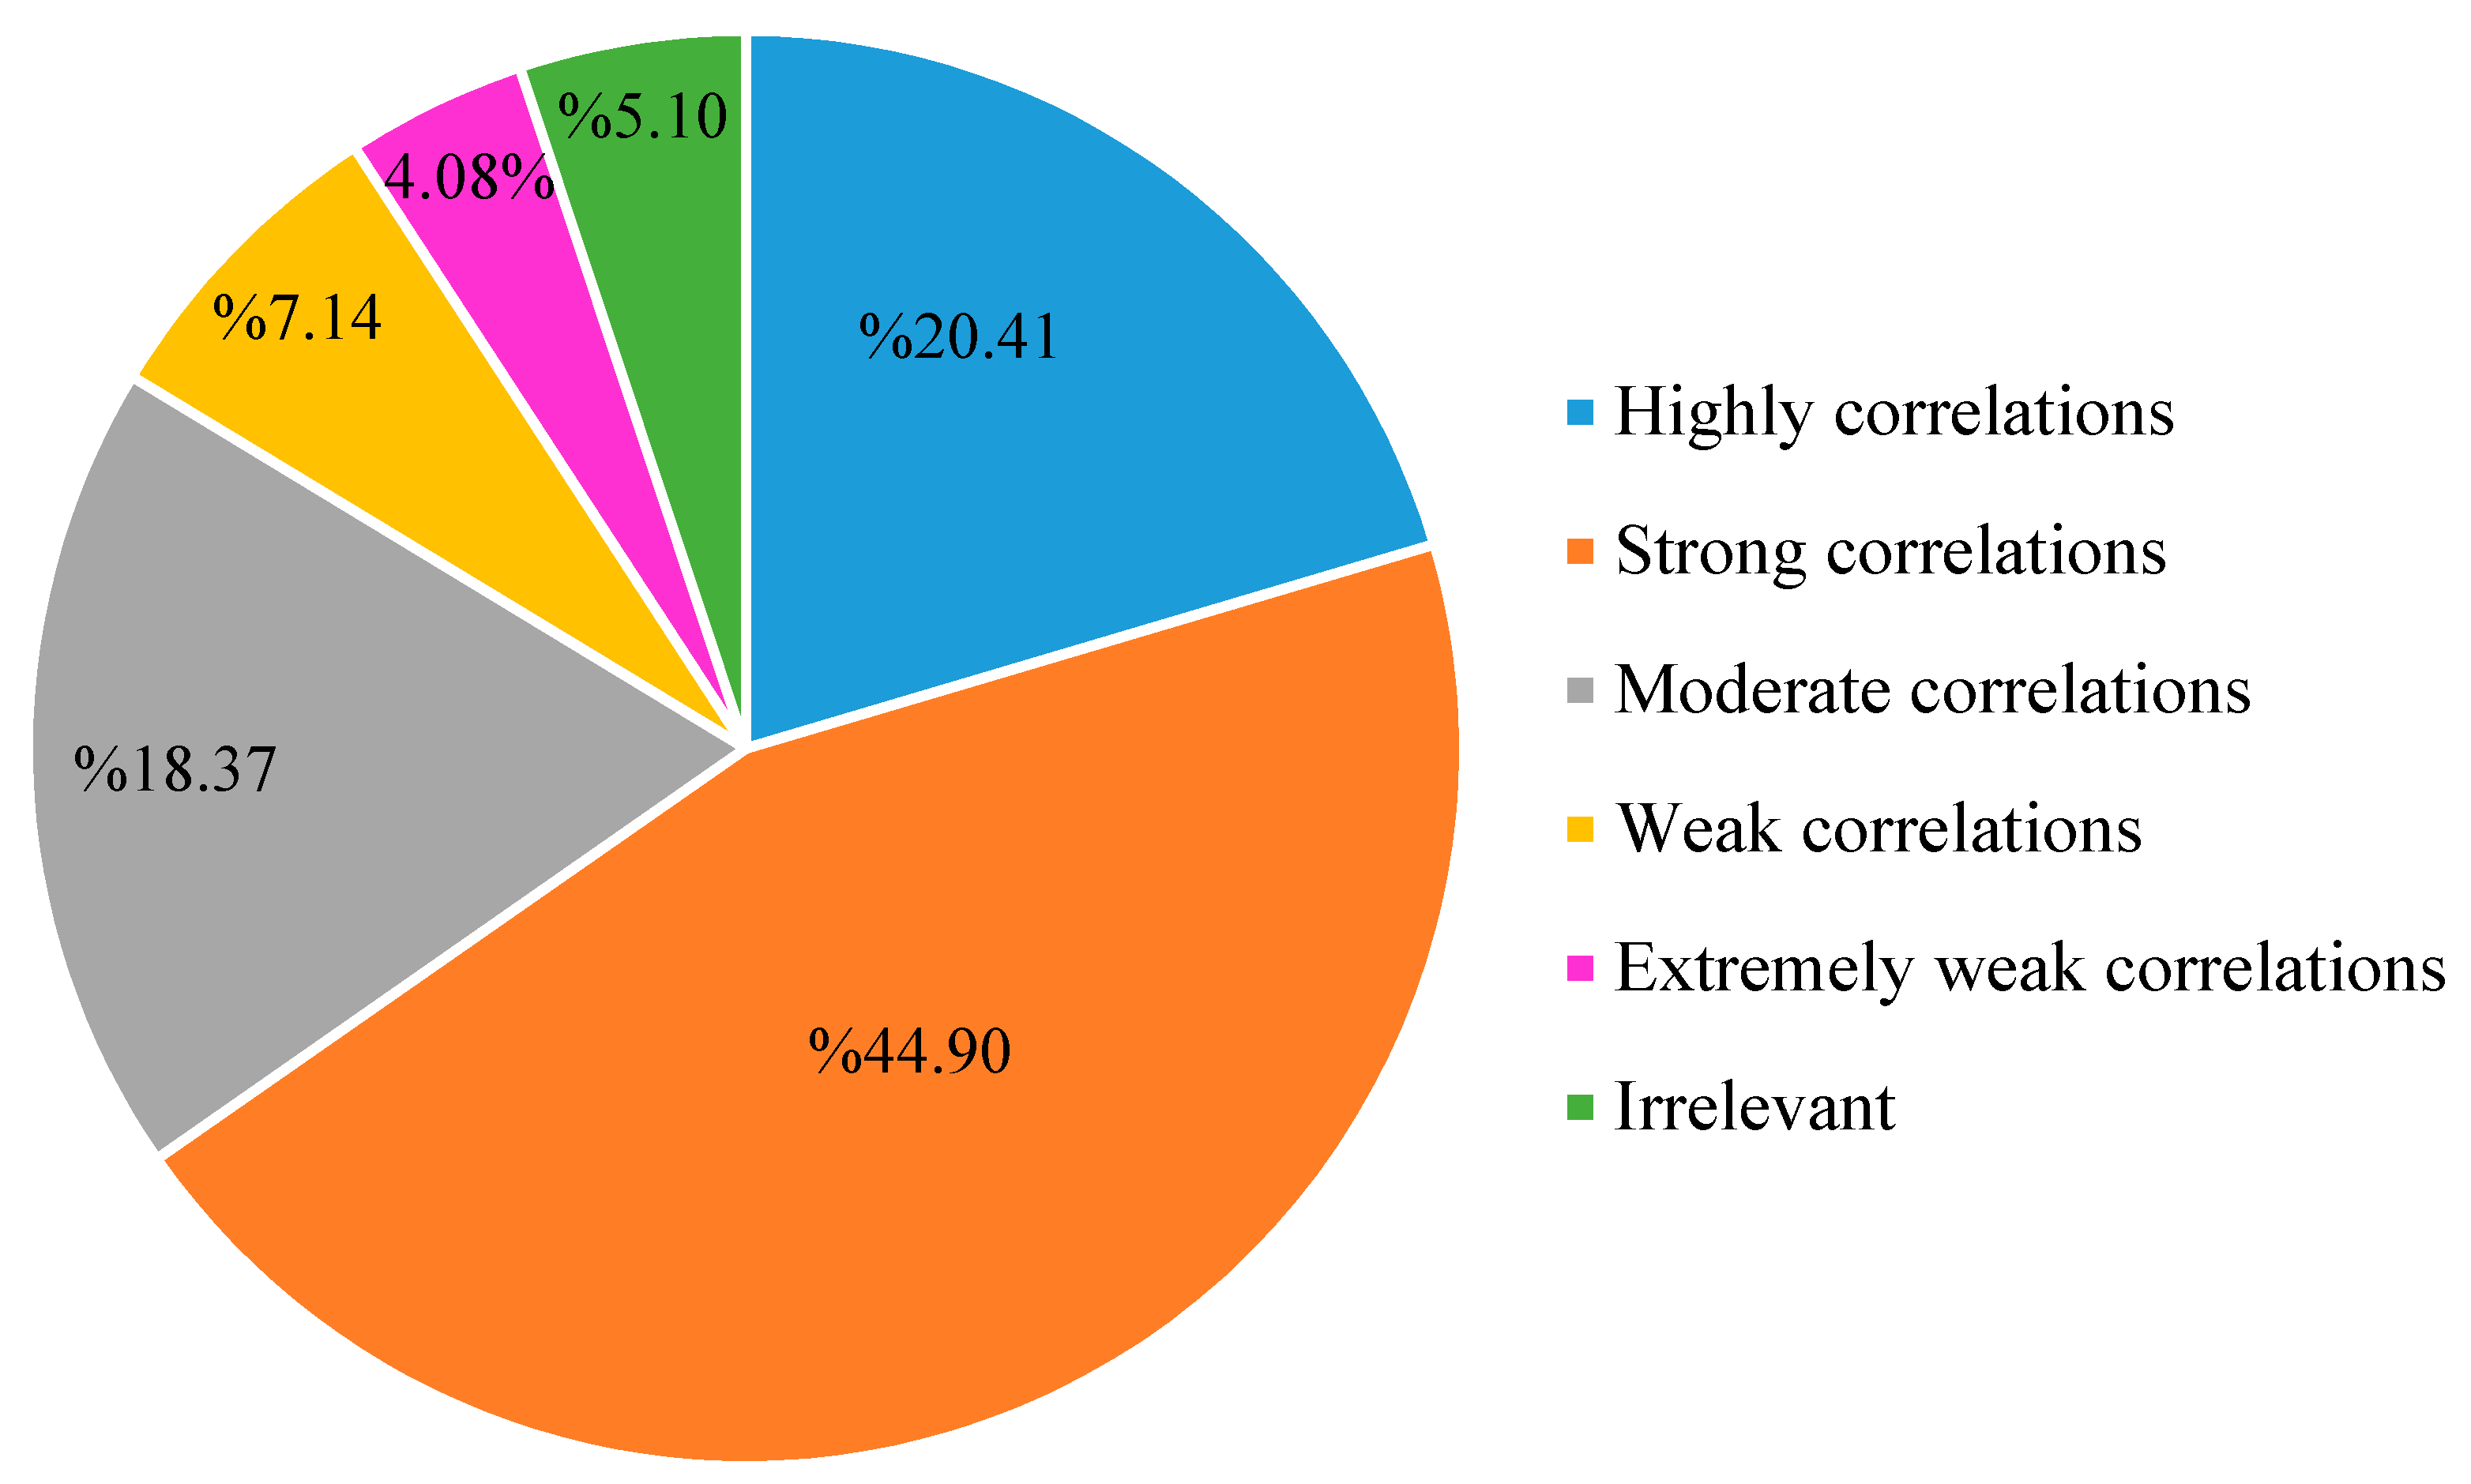
As seen in Figure 11 and Figure 12, the correlation between the unstructured data and the measured rainfall data, was analyzed. Among the 98 rainfall events, the number of high correlations (0.8 ≤ |r| < 1) was 20, accounting for 20.41% of the total; the number of strong correlations (0.6 ≤ |r| < 0.8) was 44, accounting for 44.90% of the total; the number of moderate correlations (0.4 ≤ |r| < 0.6) was 18, accounting for 18.37% of the total; the number of weak correlations (0.2 ≤ |r| < 0.4) was 7, accounting for 7.14% of the total; the number of extremely weak correlations (0 < |r| < 0.2) was 4, accounting for 4.08% of the total; and the number of irrelevant (|r| = 0) was 5, accounting for 5.10% of the total. More than half of the rainfall events had strong correlations between the Sina Weibo data and the measured data, indicating that there was a clear correlation between the crawled unstructured data and the rainfall. In the study by Li et al. [21], when the buffer radius was 2 km, the maximum correlation coefficient, between the rainfall and the Sina Weibo data, was 0.812, and the significance level was less than 0.01. This research also showed that there was an obvious correlation between the unstructured data and the precipitation.
According to Table 6 and Table 7, in the 20 selected rainfall events, the matches between the two groups of data accounted for 45%, nearly half, meaning that the use of the unstructured data to analyze the urban rainfall patterns may have a certain degree of reliability. Wu et al. [22] combined the text data with the traditional statistical data, to assess the vulnerability of cities to flood disasters. The results showed that research on rainstorm and flood disasters, based on big data, has a certain degree of reliability.
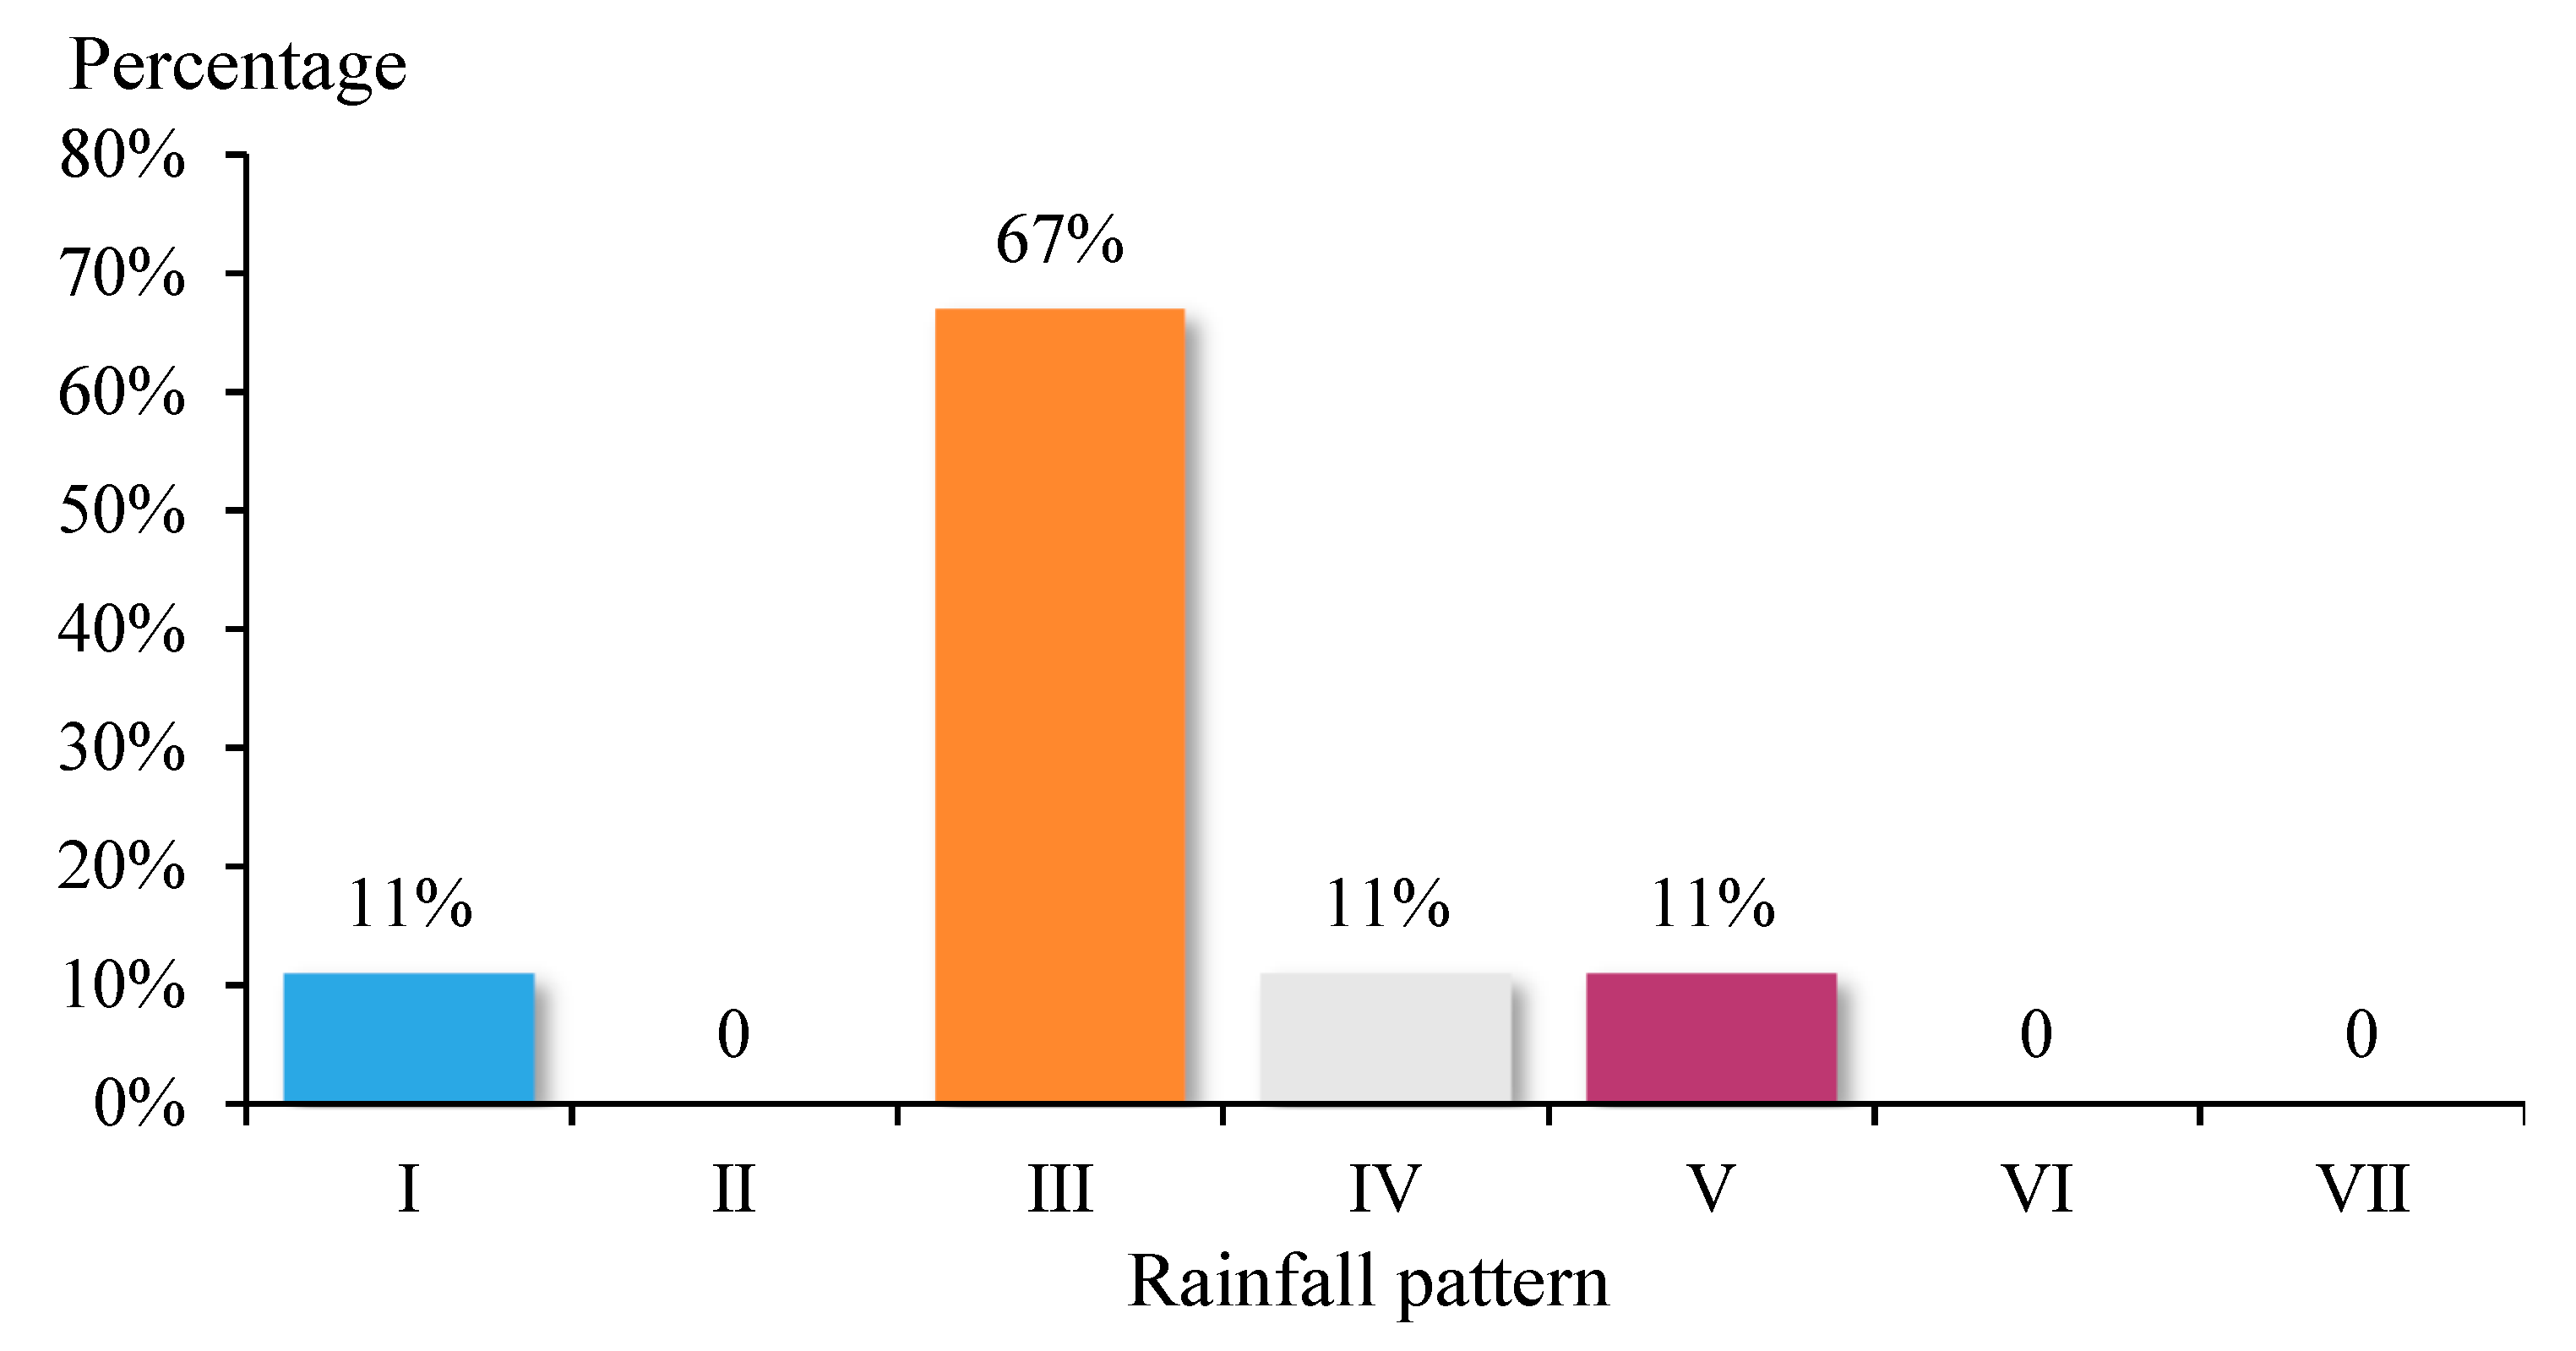
According to Table 7 and Figure 13, we know that, among the matching results, the number of rain pattern III matches was the largest, accounting for 67% of the total, while 86% of all rain pattern III fields matched. This showed that, among the seven rain patterns, the unstructured data had the best response to rain pattern III.
Table 7 also shows that the results of the unstructured data correspond to four measured rain patterns of pattern VI, two of patterns II, one of pattern I, and one of pattern IV. This discrepancy was caused by the hysteresis in the unstructured data. The amount of rainfall in the early stages was relatively large, and the amount of unstructured data was also relatively large. The amount of rainfall in the middle of the rainfall becomes smaller, but the amount of unstructured data did not decrease or decrease significantly, due to hysteresis in the unstructured data. The rainfall in the later stages became larger, and the unstructured data continued to increase. Therefore, the rain pattern identified by the unstructured data was a unimodal rain pattern with the rain peak behind, or a uniform rain pattern, and it was difficult to divide it into a bimodal rain pattern
4. Discussion
The application of the unstructured data in the urban rainstorm disaster research has attracted the attention of scholars. For example, Xiao et al. [37] presented a real-time identification method for the urban-storm disasters, using Weibo data. The experiments showed that the naive Bayes algorithm had the highest macro-average accuracy. However, that research was focused on identifying storm hazards and failed to alleviate the problem of insufficient rainfall data in cities. Wu et al. [22] used a combination of textual data and traditional data to evaluate the ability of cities to resist flood disasters and showed that the use of unstructured data in the study of urban rainstorms and flood disasters has a certain degree of reliability.
This paper focused on the reliability of the unstructured data for the study of urban rainfall patterns. However, there are still some limitations in this study. The selection of end times for the rainfall events has a great influence on the results of the rain pattern identification because of the potential hysteresis in the unstructured data. Therefore, the primary problem to improving the reliability of the unstructured data in the urban rainfall pattern research is finding a way to reduce the hysteresis in the unstructured data. In addition, the unstructured data in this article were only obtained through Sina Weibo, because WeChat, QQ, and Facebook are relatively private and their data are difficult to obtain. Future researchers can further study ways to use more platforms to enrich the methods of obtaining unstructured data and to make the data more sufficient. In the analysis of the Sina Weibo data, it is found that it is difficult to crawl data that have both geographic locations and rainfall conditions, which makes it impossible to accurately reflect the specific location of the Sina Weibo data; thus, it is impossible to explore the specific effects of the spatial distribution on the unstructured data for the rain pattern analysis. As a result, future researchers should further study the spatial distribution of the unstructured data, to make the research contents more complete.
5. Conclusions
Rainfall data are very important for urban rainfall research. However, it is easy to not have enough rainfall data, due to an insufficient number or uneven distributions of urban rainfall stations. This paper studied the feasibility of using unstructured data in the urban rainfall pattern recognition. The unstructured precipitation data of Zhengzhou, from 2011 to 2018, were collected using web crawler technology, and the measured rainfall data from 14 rain measuring stations in Zhengzhou were collected and sorted out. First, the Pearson correlation coefficient method was used to calculate the correlation coefficient between the unstructured data and the measured rainfall data from the same field. Second, several rainfall events with strong correlations were selected, and the fuzzy identification method was used to identify them with the seven rainfall patterns. The matching degree between the rainfall patterns, identified by using two different datasets, was calculated, and the reliability of the unstructured data used in the study of the urban rainstorm patterns was analyzed. Using Zhengzhou as a case study, it was found that the matching degree of the rainfall pattern recognition results was 45% between the unstructured data and the measured data. It can find that the application of unstructured data in the analysis of the urban rainfall patterns has a certain degree of reliability; rainfall pattern Ⅲ was the best match, indicating that the unstructured data are best at identifying this rainfall pattern. The results showed that the application of the unstructured data in the analysis of the urban rainfall patterns, not only has a certain degree of reliability, but it can also alleviate the problem of insufficient measured rainfall data, caused by insufficient rainfall stations and their unequal distribution.
Author Contributions
Conceptualization, C.L., Methodology, C.L., Z.N. and Y.L. Formal analysis, Investigation, M.L. Writing—original draft preparation, C.L. and Z.N. Writing—review and Editing, C.L., Z.N., Z.W. and D.Y. Funding acquisition, M.L. Resources, D.Y. Supervision, Z.W. All authors have read and agreed to the published version of the manuscript.
Funding
This research was funded by the National Key Research and Development Program [2021YFC3000204], the National Natural Science Foundation of China [NSCF-52079125].
Data Availability Statement
Restrictions apply to the availability of these data. Data are available from the authors with the permission of a third party.
Conflicts of Interest
The authors declare no conflict of interest.
References
- Sörensen, J.; Mobini, S. Pluvial, urban flood mechanisms and characteristics-Assessment based on insurance claims. J. Hydrol. 2017, 555, 51–67. [Google Scholar] [CrossRef]
- Viero, D.P. Modelling urban floods using a finite element staggered scheme with an anisotropic dual porosity model. J. Hydrol. 2019, 568, 247–259. [Google Scholar] [CrossRef] [Green Version]
- Yang, S.; Ye, M.; Chang, L.; Chang, F. AI-based design of urban stormwater detention facilities accounting for carryover storage. J. Hydrol. 2019, 575, 1111–1122. [Google Scholar] [CrossRef]
- Kaspersen, P.S.; Ravn, N.H.; Arnbjerg-Nielsen, K.; Madsen, H.; Drews, M. Comparison of the impacts of urban development and climate change on exposing European cities to pluvial flooding. Hydrol. Earth Syst. Sci. 2017, 21, 4131–4147. [Google Scholar] [CrossRef] [Green Version]
- Cullwell, R.K.; Klein, T. Upgrading Downtown Sewer Infrastructure in the Nation’s 7th Most Populous City. J. Achiev. Mater. Manuf. Eng. 2014, 78, 139–146. [Google Scholar]
- Sun, J.; Lei, L.; Yu, B.; Ding, Q. The fundamental features of the extreme severe rain events in the recent 10 years in the Beijing area. Acta Meteorologica Sinica 2015, 73, 609–623. [Google Scholar]
- Sun, Y.; Xiao, H.; Yang, H.; Ding, J.; Fu, D.; Guo, X.; Feng, L. Analysis of Dynamic Conditions and Hydrometeor Transport of Zhengzhou Superheavy Rainfall Event on 20 July 2021 Based on Optical Flow Field of Remote Sensing Data. Chin. J. Atmos. Sci. 2021, 45, 1384–1399. (In Chinese) [Google Scholar]
- Wu, Z.; Ma, B.; Wang, H.; Hu, C.; Lv, H.; Zhang, X. Identification of Sensitive Parameters of Urban Flood Model Based on Artificial Neural Network. Water Resour. Manag. 2021, 35, 2115–2128. [Google Scholar] [CrossRef]
- Ni, Z.; Li, Q.; Du, F.; Jang, H. Study on design of rainstorm pattern based on short duration in Nanjing City. J. Water Resour. Water Eng. 2019, 30, 57–62. [Google Scholar]
- Yuan, W.; Tu, X.; Su, C.; Liu, M.; Yan, D.; Wu, Z. Research on the Critical Rainfall of Flash Floods in Small Watersheds Based on the Design of Characteristic Rainfall Patterns. Water Resour. Manag. 2021, 35, 3297–3319. [Google Scholar] [CrossRef]
- Li, J.; Deng, C.; Li, H.; Ma, M.; Li, Y. Hydrological Environmental Responses of LID and Approach for Rainfall Pattern Selection in Precipitation Data-Lacked Region. Water Resour. Manag. 2018, 32, 3271–3284. [Google Scholar] [CrossRef]
- Li, J.; Liu, Z.; Xue, Q.; Yu, X.; Zhang, B.; Yue, Y. Study of Rainfall Characteristics and Pattern in Changchun City. China Water Wastewater 2015, 31, 100–104. [Google Scholar]
- Ou, S.; Ye, X.; Wang, F.; Zhu, C.; Yang, Y.; Liu, J. Applicability of Pilgrim & Cordery Rainstorm Pattern in Urban Drainage Calculation. Water Resour. Power 2018, 36, 32–35. [Google Scholar]
- Cen, G.; Shen, J.; Fan, R. Research on Rainfall Pattern of Urban Design Storm. Adv. Water Sci. 1998, 1998, 42–47. [Google Scholar]
- Zhou, Y.; Yao, S.; Weng, Y.; Li, J.; Li, P.; Zhang, Y.; Wang, Q. New Method for Data Sampling on Urban Storm Intensity Formula. China Water Wastewater 2012, 28, 9–12. [Google Scholar]
- Aragao, R.; El-Diraby, T.E. Network analytics and social BIM for managing project unstructured data. Autom. Constr. 2021, 122, 103512. [Google Scholar] [CrossRef]
- Zhou, Y.; Sharma, A.; Masud, M.; Gaba, G.S.; Dhiman, G.; Ghafoor, K.Z.; AlZain, M.A. Urban Rain Flood Ecosystem Design Planning and Feasibility Study for the Enrichment of Smart Cities. Sustainability 2021, 13, 5205. [Google Scholar] [CrossRef]
- de Bruijn, J.A.; de Moel, H.; Jongman, B.; de Ruiter, M.C.; Wagemaker, J.; Aerts, J. A global database of historic and real-time flood events based on social media. Sci. Data 2019, 6, 311. [Google Scholar] [CrossRef] [PubMed]
- Saini, A.; Sahu, N.; Kumar, P.; Nayak, S.; Duan, W.; Avtar, R.; Behera, S. Advanced Rainfall Trend Analysis of 117 Years over West Coast Plain and Hill Agro-Climatic Region of India. Atmosphere 2020, 11, 1225. [Google Scholar] [CrossRef]
- Chen, Y.; Gong, C.; Fan, Y.; Li, X.; Liang, Y.; Hu, M. Spatio-Temporal Variation Assessment of Urban Waterlogging in Zhengzhou Using Social Media Data. J. China Hydrol. 2022, 42, 48–52+26. [Google Scholar]
- Li, P.; Wu, Z. Research on Construction Method of Urban Simulated Rainfall Station Based on Sina Weibo Geographical Location Data. IOP Conf. Ser. Earth Environ. Sci. 2020, 545, 012017. [Google Scholar]
- Wu, Z.; Shen, Y.; Wang, H.; Wu, M. Quantitative assessment of urban flood disaster vulnerability based on text data: Case study in Zhengzhou. Water Supply 2020, 20, 408–415. [Google Scholar] [CrossRef]
- Wang, H.; Hu, Y.; Guo, Y.; Wu, Z.; Yan, D. Urban flood forecasting based on the coupling of numerical weather model and stormwater model: A case study of Zhengzhou city. J. Hydrol. Reg. Stud. 2022, 39, 100985. [Google Scholar] [CrossRef]
- Tuo, W.; Zhang, X.; Song, C.; Hu, D.; Liang, T. Annual precipitation analysis and forecasting–taking Zhengzhou as an example. Water Sci. Technol. Water Supply 2020, 20, 1604–1616. [Google Scholar] [CrossRef] [Green Version]
- Yang, Z.; Hua, Y.; Cao, Y.; Zhao, X.; Chen, M. Network Patterns of Zhongyuan Urban Agglomeration in China Based on Baidu Migration Data. ISPRS Int. J. Geo-Inf. 2022, 11, 62. [Google Scholar] [CrossRef]
- Deng, S.; Wang, Y.; Ma, Y. Design and Application of High Resolution Earthquake Catalogue Auto Update Program Based on Python Crawler Technology. Earthq. Res. China 2019, 35, 541–549. [Google Scholar]
- Fang, M.; Lu, Q. Study on clustering of micro-blog business enterprise users reputation based on web crawler. Int. J. Comput. Sci. Math. 2017, 8, 279–290. [Google Scholar] [CrossRef]
- Fang, T.; Han, T.; Zhang, C.; Yao, Y. Research and Construction of the Online Pesticide Information Center and Discovery Platform Based on Web Crawler. Procedia Comput. Sci. 2020, 166, 9–14. [Google Scholar] [CrossRef]
- ElAraby, M.E.; Shams, M.Y. Face retrieval system based on elastic web crawler over cloud computing. Multimed. Tools Appl. 2021, 80, 11723–11738. [Google Scholar] [CrossRef]
- Kumar, M.; Bindal, A.; Gautam, R.; Bhatia, R. Keyword query based focused Web crawler. Procedia Comput. Sci. 2018, 125, 584–590. [Google Scholar] [CrossRef]
- Zhang, J.; Zou, T.; Lai, Y. Novel method for industrial sewage outfall detection: Water pollution monitoring based on web crawler and remote sensing interpretation techniques. J. Clean. Prod. 2021, 312, 127640. [Google Scholar] [CrossRef]
- Pan, H.; You, X.; Liu, S.; Zhang, D. Pearson correlation coefficient-based pheromone refactoring mechanism for multi-colony ant colony optimization. Appl. Intell. 2021, 51, 752–774. [Google Scholar] [CrossRef]
- Chang, Y.; Yang, D.; Guo, Y. Laser ultrasonic damage detection in coating-substrate structure via Pearson correlation coefficient. Surf. Coat. Technol. 2018, 353, 339–345. [Google Scholar] [CrossRef]
- Zeng, W.; Lu, T.; Liu, Z.; Xu, Q.; Peng, H.; Li, C.; Yang, S.; Yao, F. Research on a laser ultrasonic visualization detection method for human skin tumors based on pearson correlation coefficient. Opt. Laser Technol. 2021, 141, 107117. [Google Scholar] [CrossRef]
- Alavinia, M.; Saleh, F.N.; Asadi, H. Effects of rainfall patterns on runoff and rainfall-induced erosion. Int. J. Sediment Res. 2019, 34, 270–278. [Google Scholar] [CrossRef]
- Sarhadi, A.; Soulis, E.D. Time-varying extreme rainfall intensity-duration-frequency curves in a changing climate. Geophys. Res. Lett. 2017, 44, 2454–2463. [Google Scholar] [CrossRef]
- Xiao, Y.; Li, B.; Gong, Z. Real-time identification of urban rainstorm waterlogging disasters based on Weibo big data. Nat. Hazards 2018, 94, 833–842. [Google Scholar] [CrossRef]
Figure 1.
Unstructured data about the contingencies on Weibo.

Figure 2.
The geographical location of Zhengzhou and the heavy rain disaster that occurred in Zhengzhou on 20 July 2022.
Figure 2.
The geographical location of Zhengzhou and the heavy rain disaster that occurred in Zhengzhou on 20 July 2022.

Figure 3.
Geographic distribution of the rainfall unstructured data collection points, from 2011 to 2018, and the rainfall stations in Zhengzhou City.
Figure 3.
Geographic distribution of the rainfall unstructured data collection points, from 2011 to 2018, and the rainfall stations in Zhengzhou City.

Figure 4.
Flow chart of the Sina Weibo rainfall data crawler.

Figure 5.
Part of the web crawler code that crawls the unstructured data.

Figure 6.
Seven modes of rainfall patterns. Rain pattern (I) is a single peak, and the rain peak is located in the front; Rain pattern (II) is a single peak, and the rain peak is located at the rear; Rain pattern (III) is a single peak, and the rain peak is in the middle; Rain pattern (IV) is a uniform rain pattern; Rain pattern (V) is bimodal, and the rain peaks are located at the front and rear; Rain pattern (VI) is bimodal and the rain peak is located at the front and in the middle; Rain pattern (VII) is bimodal and the rain peak is located in the middle and at the rear.

Figure 7.
Part of the original unstructured data.

Figure 8.
Data baseline selection.

Figure 9.
Process lines drawn from the unstructured data of the partial rainfall.

Figure 10.
Comparison of two kinds of 24-h data process lines in Zhengzhou. (a) Process line drawn for the collected Weibo data and the measured rainfall data, during a rainfall event that occurred on 5 June 2016. (b) Linear regression line drawn for the Weibo data collected and the measured rainfall data, during a rainfall event that occurred on 5 June 2016. (c) Process line drawn for the collected Weibo data and the measured rainfall data, during a rainfall event that occurred on 28 August 2015. (d) Linear regression line drawn for the Weibo data collected and the measured rainfall data, during a rainfall event that occurred on 28 August 2015. The green circles indicate Weibo data and measured rainfall data.

Figure 11.
Distribution of the correlation coefficients between the unstructured data and the measured rainfall data.
Figure 11.
Distribution of the correlation coefficients between the unstructured data and the measured rainfall data.

Figure 12.
Proportion of the different correlation coefficients between the unstructured data and the measured rainfall data.
Figure 12.
Proportion of the different correlation coefficients between the unstructured data and the measured rainfall data.

Figure 13.
Matching results of the rain patterns identified by the unstructured data and the measured data.
Figure 13.
Matching results of the rain patterns identified by the unstructured data and the measured data.


Table 1.
Pattern matrix of the seven rainfall patterns.
| Rainfall Pattern | Period | |||||
|---|---|---|---|---|---|---|
| 1 | 2 | 3 | 4 | 5 | 6 | |
| I | 30.4% | 26.1% | 17.4% | 13.0% | 8.7% | 4.3% |
| II | 3.8% | 7.7% | 11.5% | 23.1% | 30.8% | 23.1% |
| III | 5.0% | 20.0% | 35.0% | 25.0% | 10.0% | 5.0% |
| IV | 14.3% | 19.0% | 14.3% | 19.0% | 14.3% | 19.0% |
| V | 25.0% | 15.0% | 5.0% | 10.0% | 25.0% | 20.0% |
| VI | 22.2% | 11.1% | 16.7% | 27.8% | 16.7% | 5.6% |
| VII | 8.7% | 13.0% | 30.4% | 17.4% | 8.7% | 21.7% |
Note: The data in the table are the percentage of the rainfall in one period compared to the total period.
Table 2.
Part of the measured rainfall data. Units of the measured rainfall are in millimeters.
| Time Period | Session | ||||
|---|---|---|---|---|---|
| 30 July 2018 | 25 August 2017 | 5 June 2016 | 28 August 2015 | 1 May 2014 | |
| 0 | 0 | 0 | 16.14 | 0 | 0 |
| 1 | 0 | 0 | 0.32 | 0 | 0 |
| 2 | 0 | 0 | 0 | 0 | 0 |
| 3 | 0 | 0 | 0 | 0 | 0 |
| 4 | 0 | 0 | 0 | 0 | 0 |
| 5 | 0 | 0 | 0.04 | 0 | 0 |
| 6 | 0 | 0 | 0 | 0 | 0 |
| 7 | 0 | 0 | 0 | 0 | 0 |
| 8 | 0 | 0.04 | 0 | 0 | 0 |
| 9 | 0.07 | 1.36 | 1.71 | 0 | 0 |
| 10 | 0.07 | 6.25 | 12.07 | 0 | 0 |
| 11 | 0.21 | 9.04 | 1.54 | 0 | 0 |
| 12 | 3.82 | 2.89 | 0.07 | 0 | 0 |
| 13 | 0.43 | 0.43 | 0 | 0 | 0 |
| 14 | 0.07 | 0.14 | 0 | 0 | 2.14 |
| 15 | 0.07 | 0.11 | 0.04 | 0 | 0 |
| 16 | 0.18 | 0.07 | 0 | 0.57 | 0 |
| 17 | 0.11 | 0.04 | 0 | 4.64 | 0 |
| 18 | 0 | 0 | 0 | 0.32 | 0 |
| 19 | 0 | 0 | 0 | 0 | 0 |
| 20 | 0 | 0 | 3.57 | 0 | 0 |
| 21 | 0 | 0 | 12.89 | 0 | 0 |
| 22 | 0 | 0 | 11.04 | 0 | 0 |
| 23 | 0 | 0 | 3.5 | 0 | 0 |
Table 3.
Unstructured data of the partial rainfall. Units of the unstructured data are pieces.
| Time Period | Session | ||||
|---|---|---|---|---|---|
| 30 July 2018 | 25 August 2017 | 5 June 2016 | 28 August 2015 | 1 May 2014 | |
| 0 | 13 | 6 | 645 | 10 | 12 |
| 1 | 3 | 6 | 100 | 5 | 7 |
| 2 | 1 | 3 | 19 | 2 | 3 |
| 3 | 5 | 1 | 12 | 2 | 2 |
| 4 | 0 | 1 | 16 | 2 | 3 |
| 5 | 2 | 4 | 6 | 1 | 10 |
| 6 | 9 | 8 | 16 | 5 | 9 |
| 7 | 14 | 18 | 47 | 23 | 12 |
| 8 | 16 | 29 | 63 | 11 | 8 |
| 9 | 25 | 52 | 136 | 16 | 15 |
| 10 | 18 | 98 | 388 | 10 | 9 |
| 11 | 38 | 103 | 173 | 21 | 20 |
| 12 | 78 | 84 | 128 | 5 | 14 |
| 13 | 70 | 33 | 82 | 14 | 16 |
| 14 | 38 | 43 | 76 | 12 | 105 |
| 15 | 34 | 42 | 53 | 26 | 78 |
| 16 | 34 | 30 | 46 | 31 | 31 |
| 17 | 31 | 32 | 46 | 139 | 20 |
| 18 | 23 | 26 | 66 | 63 | 34 |
| 19 | 31 | 25 | 90 | 26 | 24 |
| 20 | 28 | 37 | 160 | 32 | 27 |
| 21 | 24 | 39 | 407 | 26 | 27 |
| 22 | 31 | 38 | 505 | 27 | 28 |
| 23 | 25 | 43 | 119 | 29 | 18 |
Table 4.
Rainfall pattern identified results of Weibo.
| Correlation Coefficient | Session | Rainfall Pattern | Rain Peak Type | Rainfall Peak Location |
|---|---|---|---|---|
| 0.8 | 26 August 2014 | III | single peak | Central |
| 0.8 | 27 August 2014 | III | Central | |
| 0.8 | 7 July 2015 | III | Central | |
| 0.8 | 22 July 2015 | III | Central | |
| 0.8 | 3 August 2015 | I | Front section | |
| 0.8 | 28 August 2015 | III | Central | |
| 0.8 | 7 June 2016 | II | Rear | |
| 0.8 | 25 August 2017 | III | Central | |
| 0.9 | 19 June 2014 | III | Central | |
| 0.9 | 29 July 2014 | II | Rear | |
| 0.9 | 5 June 2016 | III | Central | |
| 0.9 | 12 September 2016 | III | Central | |
| 0.9 | 22 May 2017 | I | Front section | |
| 0.8 | 19 April 2014 | IV | uniform rain pattern | No peak |
| 0.8 | 10 May 2014 | IV | No peak | |
| 0.8 | 19 April 2015 | IV | No peak | |
| 0.8 | 22 June 2017 | IV | No peak | |
| 0.8 | 1 May 2015 | VI | bimodal peak | Front and middle |
| 0.8 | 26 June 2015 | V | Front and back | |
| 0.9 | 6 October 2015 | VI | Front and middle |
Table 5.
Identified rainfall pattern results from the measured data.
| Session | Rainfall Pattern | Rain Peak Type | Rainfall Peak Location |
|---|---|---|---|
| 19 April 2014 | II | single peak | Rear |
| 26 August 2014 | III | Central | |
| 27 August 2014 | I | Front section | |
| 1 May 2015 | II | Rear | |
| 7 July 2015 | II | Rear | |
| 22 July 2015 | III | Central | |
| 28 August 2015 | III | Central | |
| 22 June 2017 | I | Front section | |
| 25 August 2017 | III | Central | |
| 19 June 2014 | II | Rear | |
| 6 October 2015 | III | Central | |
| 5 June 2016 | III | Central | |
| 12 September 2016 | III | Central | |
| 22 May 2017 | I | Front section | |
| 10 May 2014 | IV | uniform rain pattern | No peak |
| 19 April 2015 | VI | bimodal peak | Front and middle |
| 26 June 2015 | V | Front and back | |
| 3 August 2015 | VI | Front and middle | |
| 7 June 2016 | VI | Front and middle | |
| 29 July 2014 | VI | Front and middle |
Table 6.
Comparison results of the rainfall patterns identified by the two kinds of data.
| Session | Rain Pattern | ||
|---|---|---|---|
| Weibo Data | Measured Data | ||
| Match | 10 May 2014 | IV | IV |
| 26 August 2014 | III | III | |
| 26 June 2015 | V | V | |
| 22 July 2015 | III | III | |
| 28 August 2015 | III | III | |
| 25 August 2017 | III | III | |
| 5 June 2016 | III | III | |
| 12 September 2016 | III | III | |
| 22 May 2017 | I | I | |
| Does not match | 19 April 2014 | IV | II |
| 27 August 2014 | III | I | |
| 19 April 2015 | IV | VI | |
| 1 May 2015 | VI | II | |
| 7 July 2015 | III | II | |
| 3 August 2015 | I | VI | |
| 7 June 2016 | II | VI | |
| 22 June 2017 | IV | I | |
| 19 June 2014 | III | II | |
| 29 July 2014 | II | VI | |
| 6 October 2015 | VI | III | |
Table 7.
Matching results of the rainfall patterns identified by two kinds of data.
| Rainfall Pattern | Matching Number | Mismatch Number | Total | Proportion of Rain Pattern | Proportion of Matching | Percentage of Mismatches | Matching Degree |
|---|---|---|---|---|---|---|---|
| I | 1 | 2 | 3 | 15% | 11% | 18% | 33% |
| II | 0 | 4 | 4 | 20% | 0% | 36% | 0% |
| III | 6 | 1 | 7 | 35% | 67% | 9% | 86% |
| IV | 1 | 0 | 1 | 5% | 11% | 0% | 100% |
| V | 1 | 0 | 1 | 5% | 11% | 0% | 100% |
| VI | 0 | 4 | 4 | 20% | 0% | 36% | 0% |
| VII | 0 | 0 | 0 | 0% | 0% | 0% | |
| Total | 9 | 11 | 20 | 100% | 100% | 100% |
Publisher’s Note: MDPI stays neutral with regard to jurisdictional claims in published maps and institutional affiliations. |
© 2022 by the authors. Licensee MDPI, Basel, Switzerland. This article is an open access article distributed under the terms and conditions of the Creative Commons Attribution (CC BY) license (https://creativecommons.org/licenses/by/4.0/).
Share and Cite
MDPI and ACS Style
Lv, C.; Niu, Z.; Ling, M.; Wu, Z.; Li, Y.; Yan, D. Analyzing the Reliability of Unstructured Data for Urban Rainfall Pattern Studies—A Case Study from Zhengzhou. Water 2022, 14, 3316. https://doi.org/10.3390/w14203316
AMA Style
Lv C, Niu Z, Ling M, Wu Z, Li Y, Yan D. Analyzing the Reliability of Unstructured Data for Urban Rainfall Pattern Studies—A Case Study from Zhengzhou. Water. 2022; 14(20):3316. https://doi.org/10.3390/w14203316
Chicago/Turabian StyleLv, Cuimei, Zhaoying Niu, Minhua Ling, Zening Wu, Yang Li, and Denghua Yan. 2022. "Analyzing the Reliability of Unstructured Data for Urban Rainfall Pattern Studies—A Case Study from Zhengzhou" Water 14, no. 20: 3316. https://doi.org/10.3390/w14203316
Note that from the first issue of 2016, this journal uses article numbers instead of page numbers. See further details here.