
Monitoring and Analysis of Water Surface Slope of the Yarlung Zangbo River Based on Remote Sensing
School of Surveying and Engineering Information, Henan Polytechnic University (HPU), Jiaozuo 454003, China
*
Author to whom correspondence should be addressed.
Water 2022, 14(20), 3304; https://doi.org/10.3390/w14203304
Submission received: 10 August 2022
/
Revised: 16 September 2022
/
Accepted: 17 October 2022
/
Published: 19 October 2022
(This article belongs to the Special Issue The Interrelationship between Climate Change, Human Activities and Hydrological Processes)
Abstract
:Global warming has led to an increase in interest in river hydrology. Water surface slope is a basic parameter of river morphology and is critical in understanding riverine ecosystems. The Yarlung Zangbo River is an important international river. Scientific understanding of its hydrology has been severely limited by its harsh topography and the sparse distribution of measurement stations. This paper describes the first attempt to use ICESat-2 satellite altimetry data to calculate river water slope and introduces a new technique for studying river hydrology. Water level data for different stretches of the Yarlung Zangbo River were obtained from high spatial resolution ICESat-2 altimetry data. The data were analyzed to determine the water surface slope of the Yarlung Zangbo River, and variation in the water surface slope was examined for several river sections. The water surface slope of the Yarlung Zangbo River was greatest in summer and autumn and least in winter and spring. There may be seasonal cyclic changes in the water surface slope. The range for water surface slope was large and the difference in extremes is significant; the maximum average water surface slope was 1935.17 cm/km and the minimum water surface slope was 0.08 cm/km. The water surface slope of the Yarlung Zangbo River can be characterized as small in the upper and middle reaches and large in the lower reaches; it is related to dry and wet conditions determined by topography and climate. The upper and middle reaches of the Yarlung Zangbo River are semi-arid and the lower reaches of the Yarlung Zangbo River span three climate zones: semi-arid, semi-humid and humid. In addition, the water level information measured by ICESat-2 data is basically similar to the water level information measured by Hydroweb data, except that the water level information of individual virtual stations is quite different due to special reasons. It was found that ICESat-2 data had higher-accuracy water level data results and more river location information. Therefore, ICESat-2 satellite altimetry data can provide a baseline reference for the study of the Yarlung Zangbo River hydrology, and the technique used is applicable to other rivers.
1. Introduction
Climate change and human activity have significantly altered global water cycles and river hydrology in recent years. In August 2021, the United Nations Intergovernmental Panel on Climate Change (IPCC) Sixth Assessment Report (AR6) showed that global average warming, which was currently estimated at 1.1 °C, could, in the next 20 years, exceed 1.5 °C. Global warming accelerates glacier melting and thus leads to increased precipitation, further exacerbating changes in river hydrology [1]. Global warming particularly affects high-altitude regions, where glaciers in high mountain areas generally show accelerated melting. The continuing increase of glacial meltwater promotes surface water circulation, which changes river dynamics. Rivers link atmospheric, terrestrial and oceanic processes and return approximately 40% of the total global rainfall on land to the ocean [2,3]. They are the main source of water and the main transport mechanism of surface runoff for human life and ecosystems. River water resources also play a crucial role in regulating regional climate, balancing ecosystems and protecting biodiversity, and are also widely used for human-related activities such as hydropower, irrigation and farming [4]. Therefore, changes in the hydrological characteristics of rivers are of increasing interest [5]. Observing surface water from space is important for mitigating the effects of hydrological extremes because of its role in providing storage as well as flood transport during droughts. Therefore, it is important to carry out research on the changes in river hydrological elements for the sustainable development of socio-economic and ecological security.
Altitude-dependent warming has made the Yarlung Zangbo basin one of the most sensitive regions in the world to global warming [6]. Previous studies have shown that the Yarlung Zangbo River basin has experienced an average temperature increase that is greater than the global average temperature increase [7,8], and this has induced changes in evaporation [9], precipitation [10] and glacier meltwater patterns [11]. The Yarlung Zangbo River basin is in southwestern China. Elevation in the basin ranges from 151 to 6234 m above sea level, and the river drops 5590 m. Forty percent of the land area of the basin is >5000 m above sea level, and snow, glaciers and permafrost are widely distributed across the basin. Little human activity occurs in the Yarlung Zangbo River basin due to the harsh topography [12]. The Yarlung Zangbo River basin is the largest water system on the Tibetan Plateau and constitutes 47% of the water resources in the plateau, although it covers <10% of the entire plateau land area [13].
Many researchers have studied the hydrology of the Yarlung Zangbo River basin using remote sensing techniques. Some researchers [14,15,16] have used different altimetry missions (ERS-2, Envisat, SARAL/Altika, CryoSat-2, Jason-2/3 and Sentinel-3A) to investigate water level changes in the Yarlung Zangbo River, but they mainly focused on the short-term behavior of water levels or flow in various sections of the river. Xu et al. [14] conducted a comprehensive assessment of the effects of climate change on runoff by combining several hydrological models. Frappart et al. [15] validated the water level data for the river basin obtained by the SARAL/AltiKa altimetry satellite and found it to be more accurate than Jason-2. Papa et al. [16] combined data from TP, ERS-2 and ENVISAT altimetry satellites to obtain water level values for the river and incorporated daily measured river flow values to generate a monthly dataset for the Yarlung Zangbo River flow from 1993 to 2008 in order to analyze seasonal and interannual variability in flow and water levels. Papa et al. [17] subsequently used Jason-2 radar altimetry measurements from mid-2008 to December 2011 to estimate river flow. Huang et al. [18] developed an improved method with multisource remote sensing data to estimate the runoff of the river. Liu et al. [19] modeled runoff generation and its response to climate change in the Lhasa River basin, a tributary of the Yarlung Zangbo River, using a VIC (variable infiltration capacity model). Models of hydrological processes in the Yarlung Zangbo River basin will further our understanding of the mechanisms of runoff generation and thus inform future policies for water resources management and ecological conservation under climate change.
Global warming has led to an increase in interest in river hydrology. Water surface slope is a basic parameter of river morphology and is critical in understanding riverine ecosystems. The ICESat-2 satellite, which launched in September 2018, has a low Earth orbit at an altitude less than most other satellite missions and records data at high spatial resolution. It passes over many lakes and rivers and so produces data that contains details of changes in their hydrology. Studies that use ICESat-2 data products have mostly focused on lake-level measurement, and there has been little research into river hydrology based on ICESat-2 data. In this study, we used remote sensing data recorded by ICESat-2 to monitor and analyze the water slope change in the different stretches of the Yarlung Zangbo River.
2. Materials and Methods
2.1. Study Area
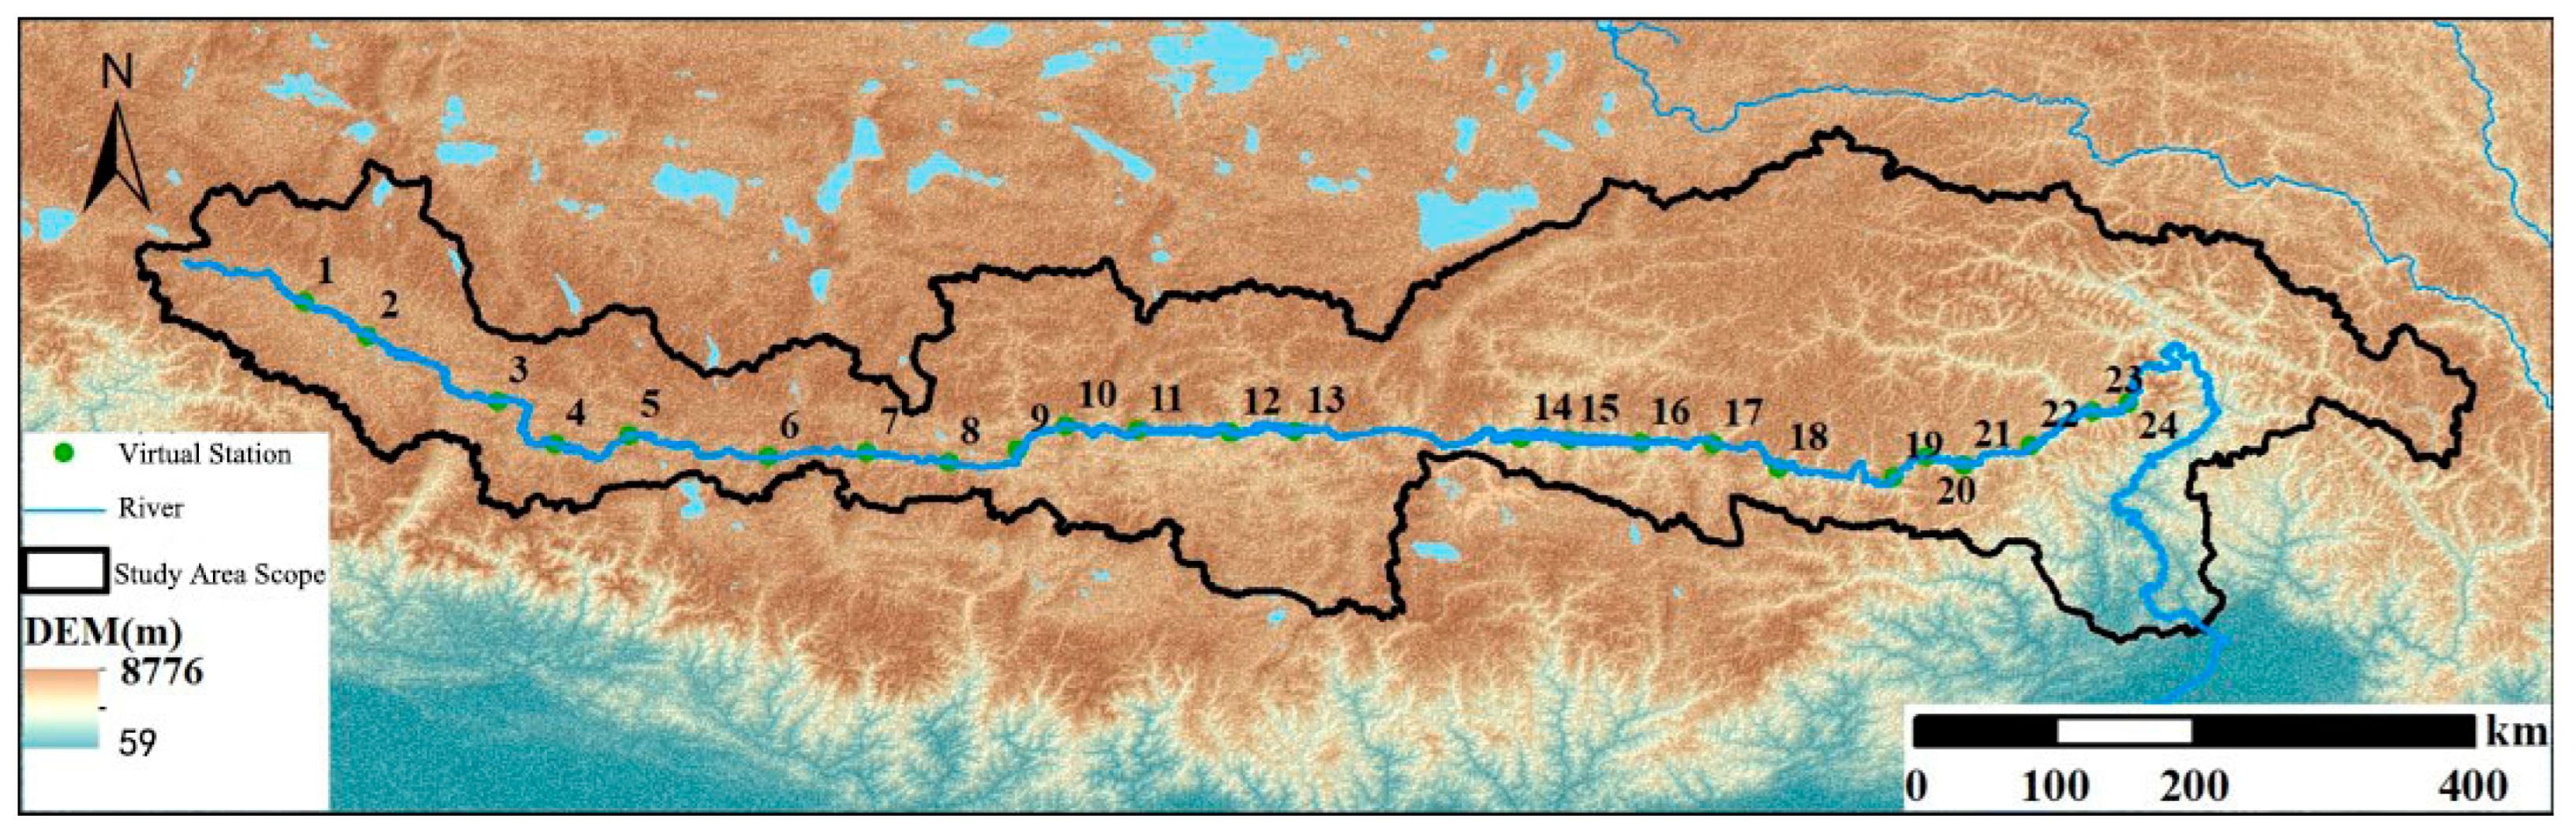
The study area was a section of the Yarlung Zangbo River (28°00′–31°16′ N, 82°00′–97°07′ E) in the southern part of the Tibetan Plateau, as shown in Figure 1. The river originates in the northern foothills of the Himalayas in the southwest of the Tibetan Plateau. The Yarlung Zangbo River is the highest river in the world, with a length of 2057 km in China and an area of about 2.4 × 10⁵ km2. It flows through high western terrain and low eastern terrain [20] with an average elevation >4000 m above sea level. The climate of the river basin is highland temperate, semi-humid and semi-arid [21]. The main stream of the Yarlung Zangbo River is divided into three sections: the upstream section from the end of the Jamayangzong glacier to Lhazhi, about 268 km long; the midstream section from Lhazhi to Nushita, about 1293 km long; and the downstream section from Nushita, around the easternmost peak of the Himalayas to Namcha Barwa then turning south, about 496 km long. There are significant differences in climate and precipitation from upstream to downstream, with clear vertical zoning [22]. Precipitation is influenced by the South Asian/Indian monsoon and is concentrated in June–October, with a dry season from October to May of the following year. The climate is dry and cold in winter due to the influence of westerly winds [23]. The total annual runoff of the Yarlung Zangbo River is about 1395.4 × 108 m3, which represents about 40% of the runoff of the outflowing river in Tibet [24]. The river is recharged mainly by atmospheric precipitation, glacier meltwater and groundwater, but the type of recharge varies between river sections. The upper and middle reaches are mainly recharged by groundwater, and the middle and lower reaches are recharged mainly by rainwater and snowmelt [25]. The annual runoff of the Yarlung Zangbo River is unevenly distributed, with >60% of the annual runoff occurring during the flood season (May–August).
2.2. Datasets
2.2.1. Sentinel-2 Data
The Sentinel-2 mission [26], launched in 2015, provides an unprecedented combination of spectral and spatial resolution and coverage from which changes in surface water can be observed. Data are available for free download from the European Space Agency (https://scihub.copernicus.eu, accessed on 16 October 2021). The Sentinel-2A and Sentinel-2B satellites revisit land observations every 5 days and provide multitemporal data for rivers [27]. Both satellites have 13 wavelength bands covering visible to short-wave infrared spectra. Sentinel-2 data were used in this study to determine the maximum water extent of the Yarlung Zangbo River for 2018–2020.
2.2.2. Hydroweb Data
Hydroweb data, sourced from the data center established by the French LEGOS laboratory, are multisatellite data that provide continuous and long-term time series of water levels in large rivers, lakes, reservoirs and wetlands worldwide. Crétaux et al. [28] used an approach that minimized possible bias in radar instruments between different satellites, thus improving the accuracy and spatial coverage of water level data observed by several satellites. There are 35 virtual stations along the mainstream of the Yarlung Zangbo River. We excluded 11 virtual stations that were located close to one another and averaged data from the remaining 24 stations to obtain monthly averages of the multiple observations for consecutive months in order to use them for comparison with water level information obtained from ICESat-2 data.
2.2.3. ICESat-2 Altimetry Data
ICESat-2 was launched in September 2018 to continue the ICESat mission. The satellite has a precise repeat cycle of 91 days. ICESat-2 detects at the photon level of sensitivity and carries an advanced topographic laser altimeter system (ATLAS) to measure altitude above the Earth’s surface by multibeam high-resolution photon counting. The propagation time of each detected laser photon is used to determine the distance to the reflective object, which, when combined with satellite attitude and orientation information, can be positioned to a unique location on the Earth’s surface. ICESat-2 transmits laser pulses at 10 kHz with a repetition rate that allows for observations every 0.7 m along the orbit [29], resulting in high spatial resolution along the orbit. Each pulse is divided by a diffractive optical element into three pairs of beams, spaced about 3.3 km apart, numbered according to the number and direction of their laser spots. The left–right distance of each laser pair spans 90 m across the track. Each pair consists of a strong and a weak laser beam [30]. The positions of the strong and weak beams vary with ATLAS orientation [31]. The diameter of the ICESat-2 laser spot is about 17 m and may increase to about 20 m as the available energy decreases after the end of the 3-year planned mission. Data accuracy of up to a few centimeters is possible due to the small area covered by the laser spot [32]. ICESat-2 produces geophysical products for various surface types such as sea ice (ATL07), atmosphere (ATL09), ocean (ATL12) and inland waters (ATL03/ATL13) [33]. Because of the ATLAS concentration on water bodies, we used ICESat-2 ATL13 data to obtain water levels of the Yarlung Zangbo River from December 2018 to November 2020. The data were used to calculate the water surface slope of the Yarlung Zangbo River.
2.2.4. ICESat-2 ATL13 Data Preprocessing
Before analysis of the ATL13 data from ICESat-2, preprocessing was necessary and consisted of the following steps:
- (1)
- ICESat-2 ATL13 data download and variable interpretation
ICESat-2 data are available for free download from the National Snow and Ice Data Center (https://nsidc.org/data/, accessed on 2 Noveber 2021). The range of the data was spatially filtered using the Yarlung Zangbo River basin bounding box. We retained ATL13 observations within the region and removed other observations. The period of the extracted data was from December 2018 to December 2020 (approximately 2 years). The original format of the file was h5, and the file included several variables that were used in this study; they are shown in Table 1 [34].
- (2)
- Correction of ATL13 observations
Each ATL13 observation bears a timestamp in seconds, which was first converted to the actual date, followed by a preprocessing correction of the raw data.
ATL13 was derived from the ATL03 geolocation photon product. It is an ICESat-2 level 2 product that has been geophysically corrected for factors such as Earth tides and atmospheric delay [35]. Most clouds have been excluded from ATL13, so there was no need to correct for or remove clouds. The orthometric height of ICESat-2 with reference to the geodetic level model EGM 2008 was used to determine the mean height and standard deviation of each ATL13 footprint. Water surface height was corrected for first photon bias before analysis. This bias is due to the short time period in which the detector is unable to detect a photon after detecting the previous one, and it is subtracted from the water surface height to obtain editable vectorized water level data.
- (3)
- ICESat-2 ATL13 data mask
To obtain the maximum number of ATL13 observations on each track within the water extent of the Yarlung Zangbo River to avoid the loss of observation data due to the small water extent, it is necessary to apply a river mask to it. ATL13 observations within the river mask, which were based on the water extent obtained from the Sentinel-2 data, were extracted and ATL13 observations outside the river extent were removed.
2.3. Acquisition of Water Level Values
The orbit of ICESat-2 varies with latitude, and it will theoretically return the satellite to the same position relative to Earth after two years. In a previous lake study, the lake surface was considered to be flat, so data from any of several ICESat-2 orbits could be used to estimate lake level in a two-year period. Rivers do not have flat surfaces, especially mountainous rivers affected by sloping topography, and data for two years only were available for this study. For some river reaches, the data included several observations. The Tibetan Plateau is at the mid-latitudes, and the Yarlung Zangbo River is mostly oriented transversely east–west. ICESat-2 observation frequency shows differences in river extent and location, so water levels in most reaches of the Yarlung Zangbo River can be calculated.
ICESat-2 has three pairs of lasers in a set of tracks; each pair consists of one strong and one weak laser, and the surface distance between the strong and weak laser tracks is about 90 m. The pulse energy ratios of the strong and weak lasers differ, and their performance may also differ. Cooley et al. [36] found that the difference in measurement between the strong and the weak laser was of the order of millimeters, so we assumed that this difference had little effect on calculating river water level. In the case that the laser did not penetrate clouds or, for some river sections, only one laser beam passed through clouds, the water level was taken from the data recorded by a single beam in order to obtain water level values for a large number of river sections. When data from both strong and weak lasers were present, the separate water level values obtained after removal of noise points were averaged to give the water level of the river section.
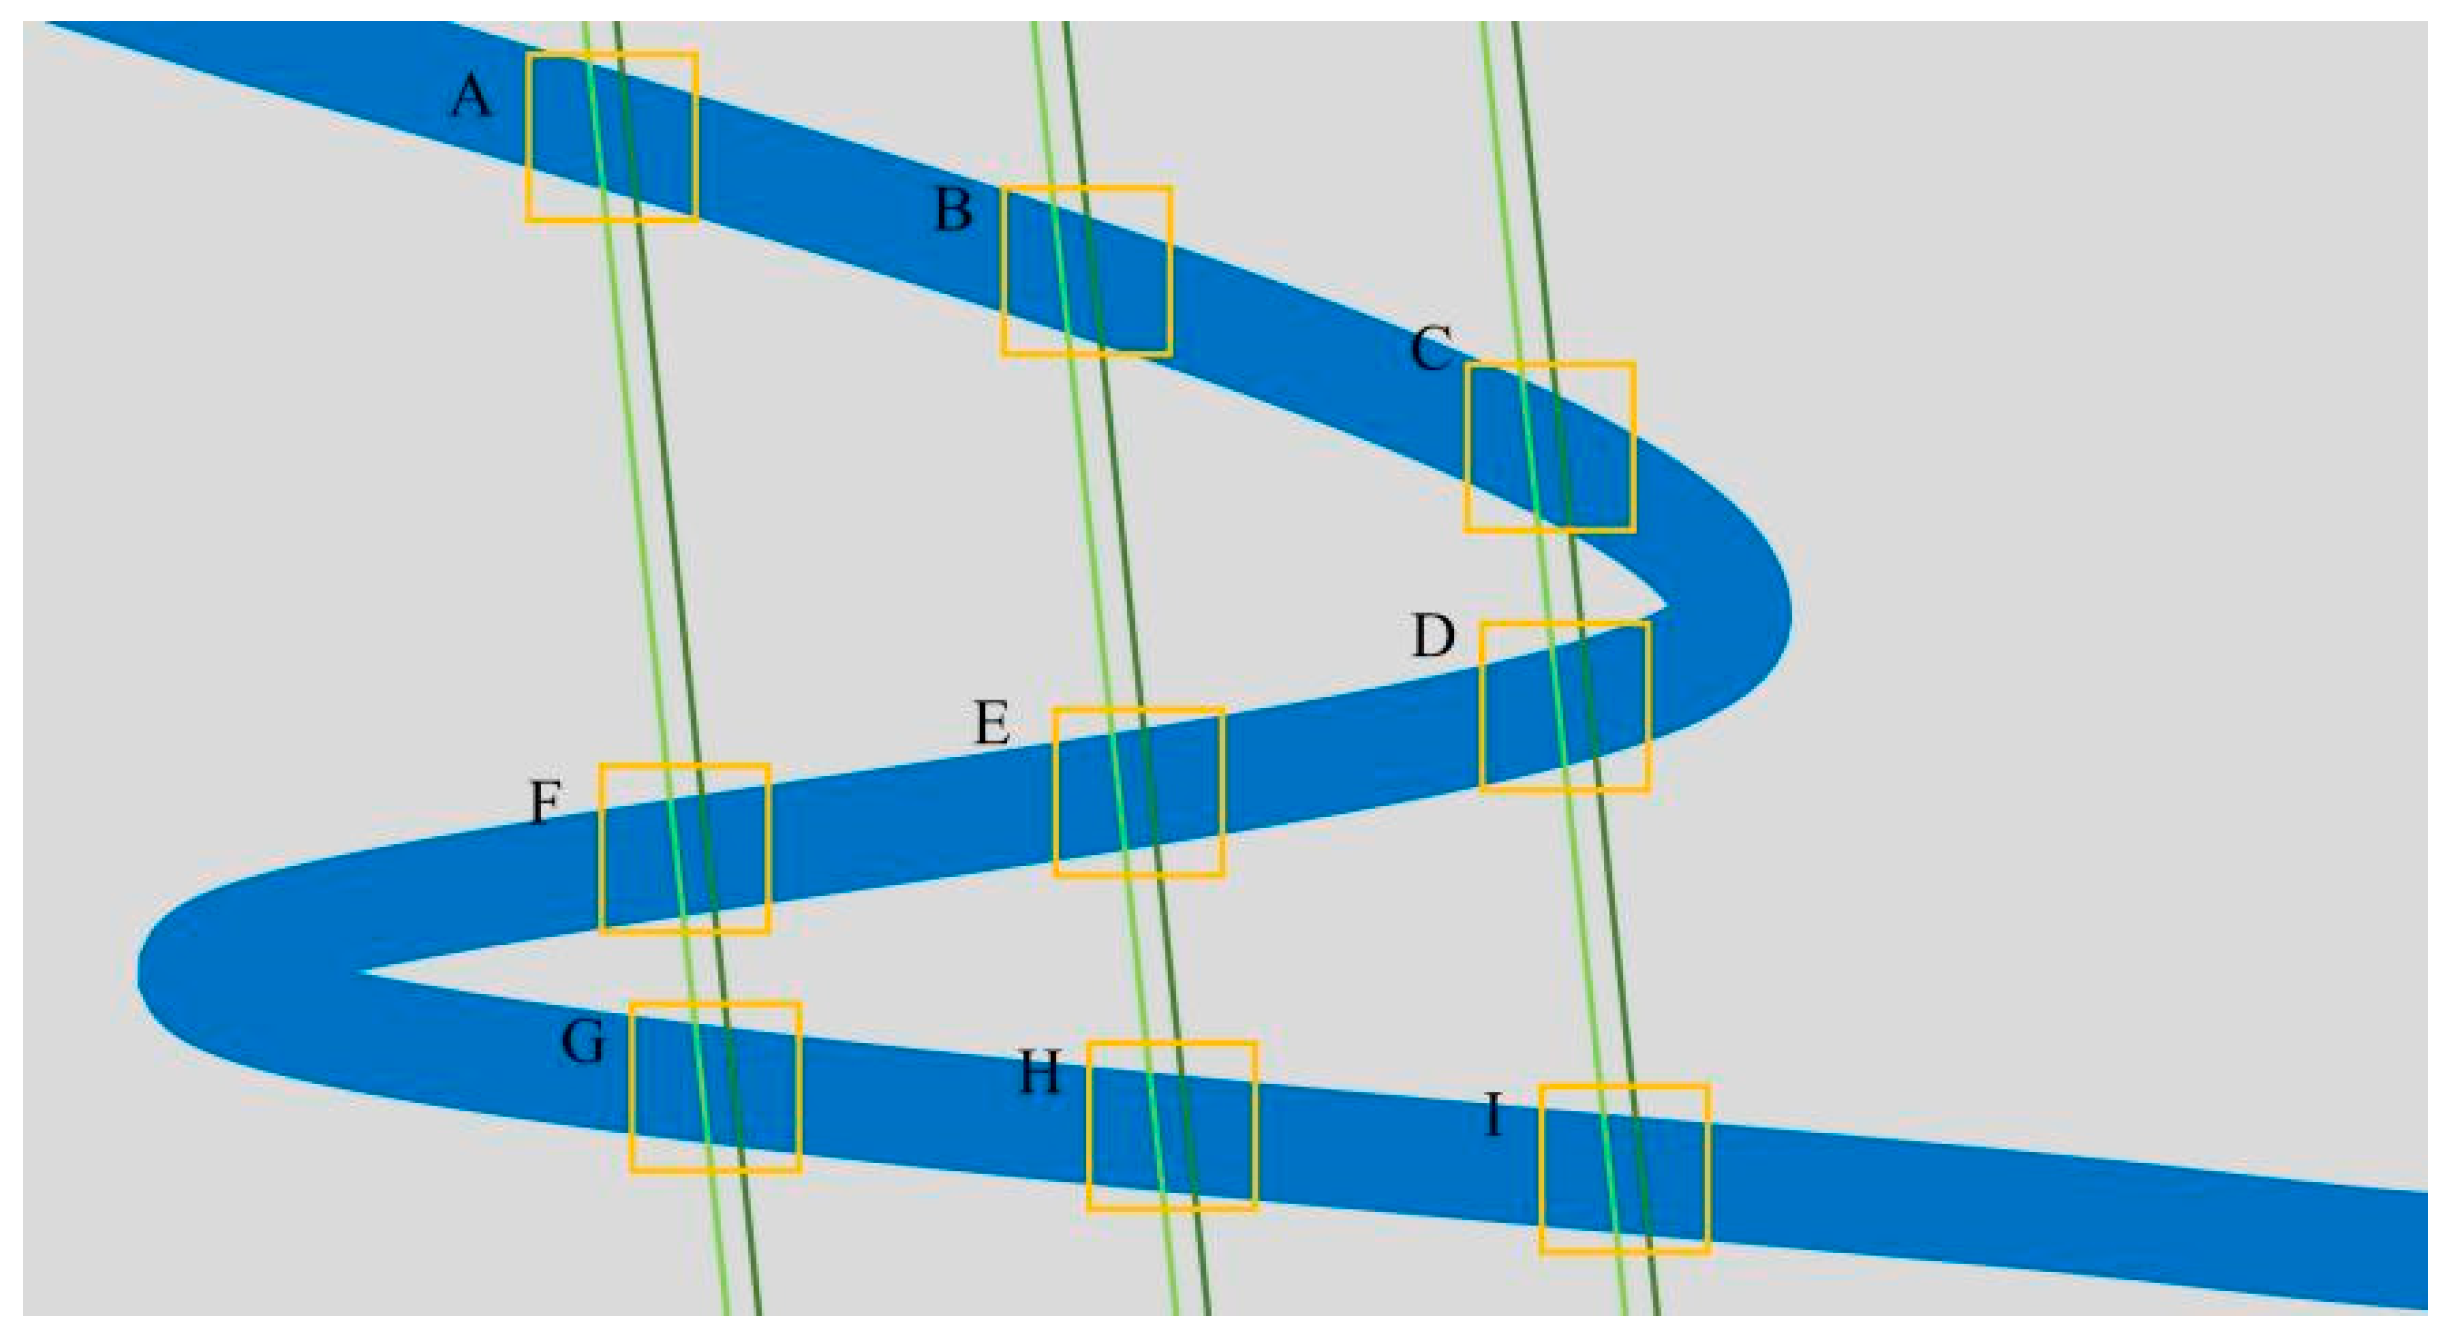
The Yarlung Zangbo River meanders, so there are some V-shaped river sections, as shown in Figure 2. Because the river mask consisted of the entire river polygon, a single track may pass over two or more different river sections. In this case, manual identification of the situation and consequent manual separation of the data was undertaken to assign a new number to each river segment passed over, so that a set of track observations represents the water level in only one river section.
2.4. Water Level Anomaly Removal
The Yarlung Zangbo River water extent data may contain anomalies for individual river sections, leading to the introduction of noise points in the water level data extraction process. We used the method described by Luo et al. [37] for each river segment combined with a method that used the normalized median absolute deviation (NMAD) [38] to remove water level anomalies for each water level observation date. Then the water level observations with deviations greater than the NMAD value were rejected. We also excluded observations with <5 footprints per river segment to further eliminate data uncertainty. The average of the remaining data points collected when the satellite passed over the river segment was used to represent the water level at that location.
where hj is the water level calculated from ICESat-2 data, j = 1, …, n and hmj is the median of the water level.
2.5. Estimation of Water Surface Slope of Yarlung Zangbo River
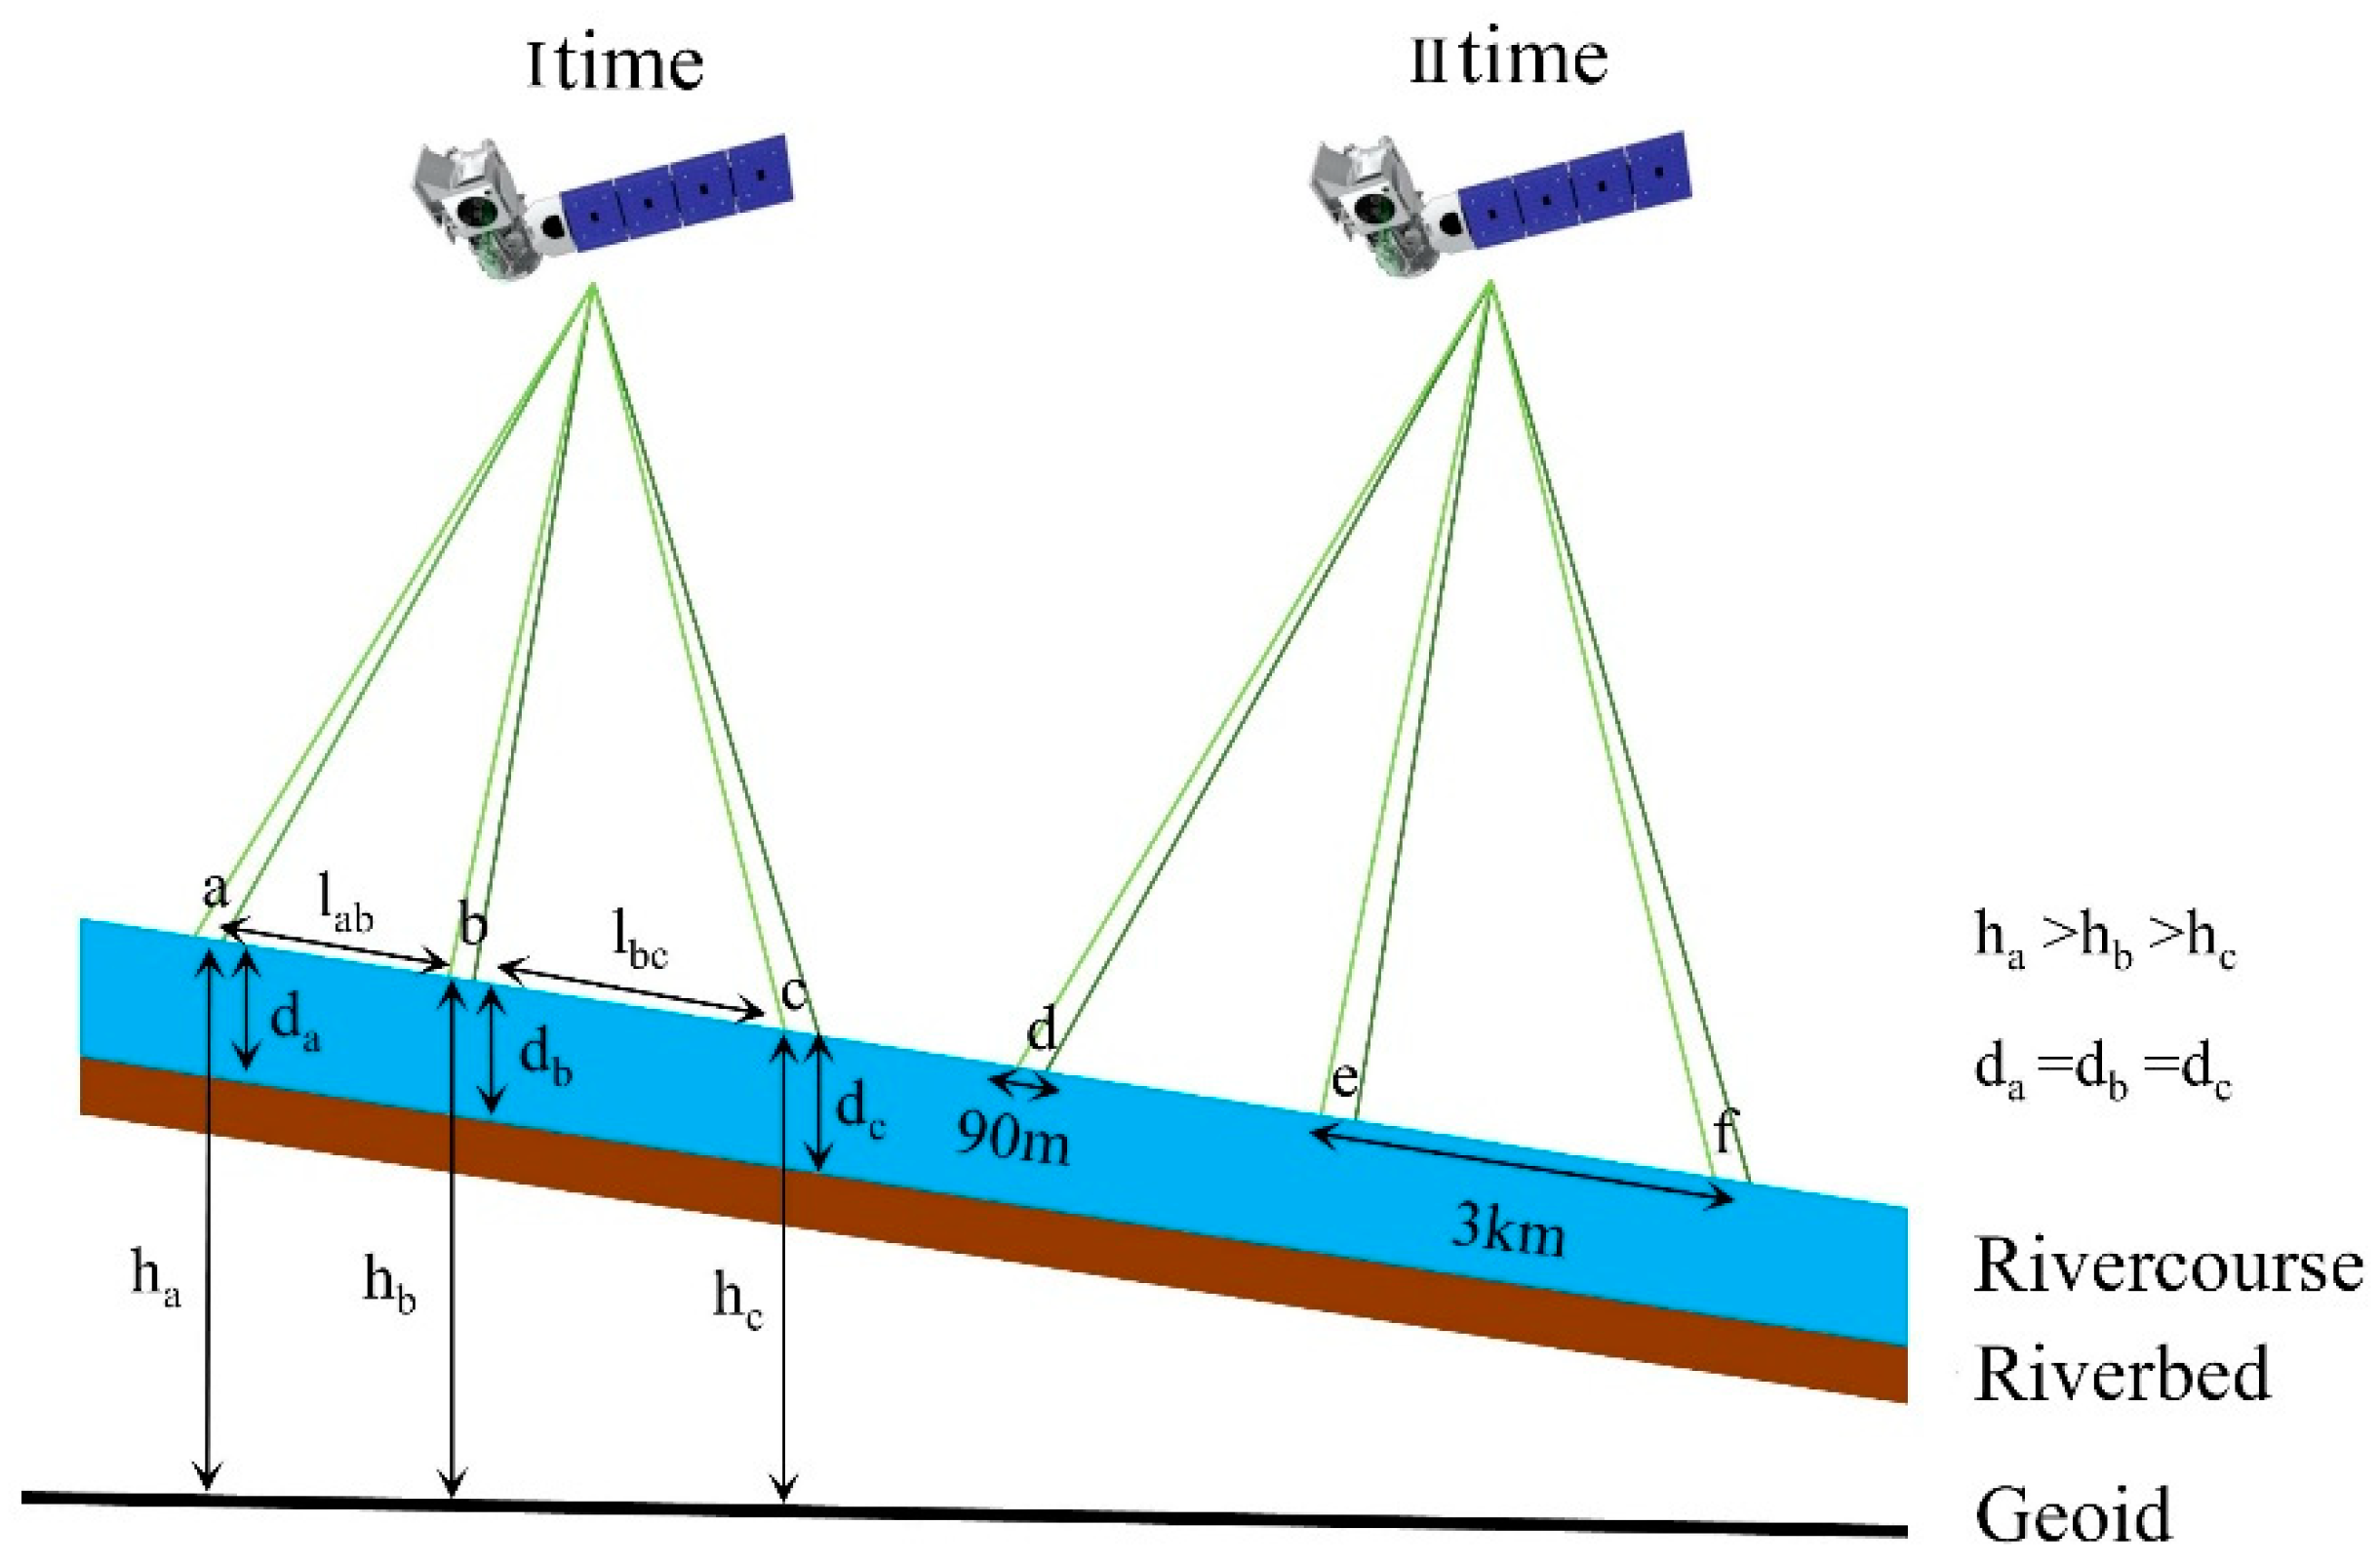
The water level of, at most, two river sections can be calculated from the water level observations of river sections of the Yarlung Zangbo River measured simultaneously by ICESat-2, as shown in Figure 3. The average water level at position a and the average water level at position b are calculated, and then the difference in water level, ∆h, between position a and position b is calculated. The distance lab between river section a and river section b is calculated along the river centerline, and the ratio ∆h to lab is the surface slope of the river segment ab. This segment slope is used as the water surface slope for position a and position b for the observation time period. The water surface slopes of position b and position c are similarly obtained for the same time.
3. Results
3.1. Analysis of Spatial and Temporal Variation of Water Surface Slope of Yarlung Zangbo River
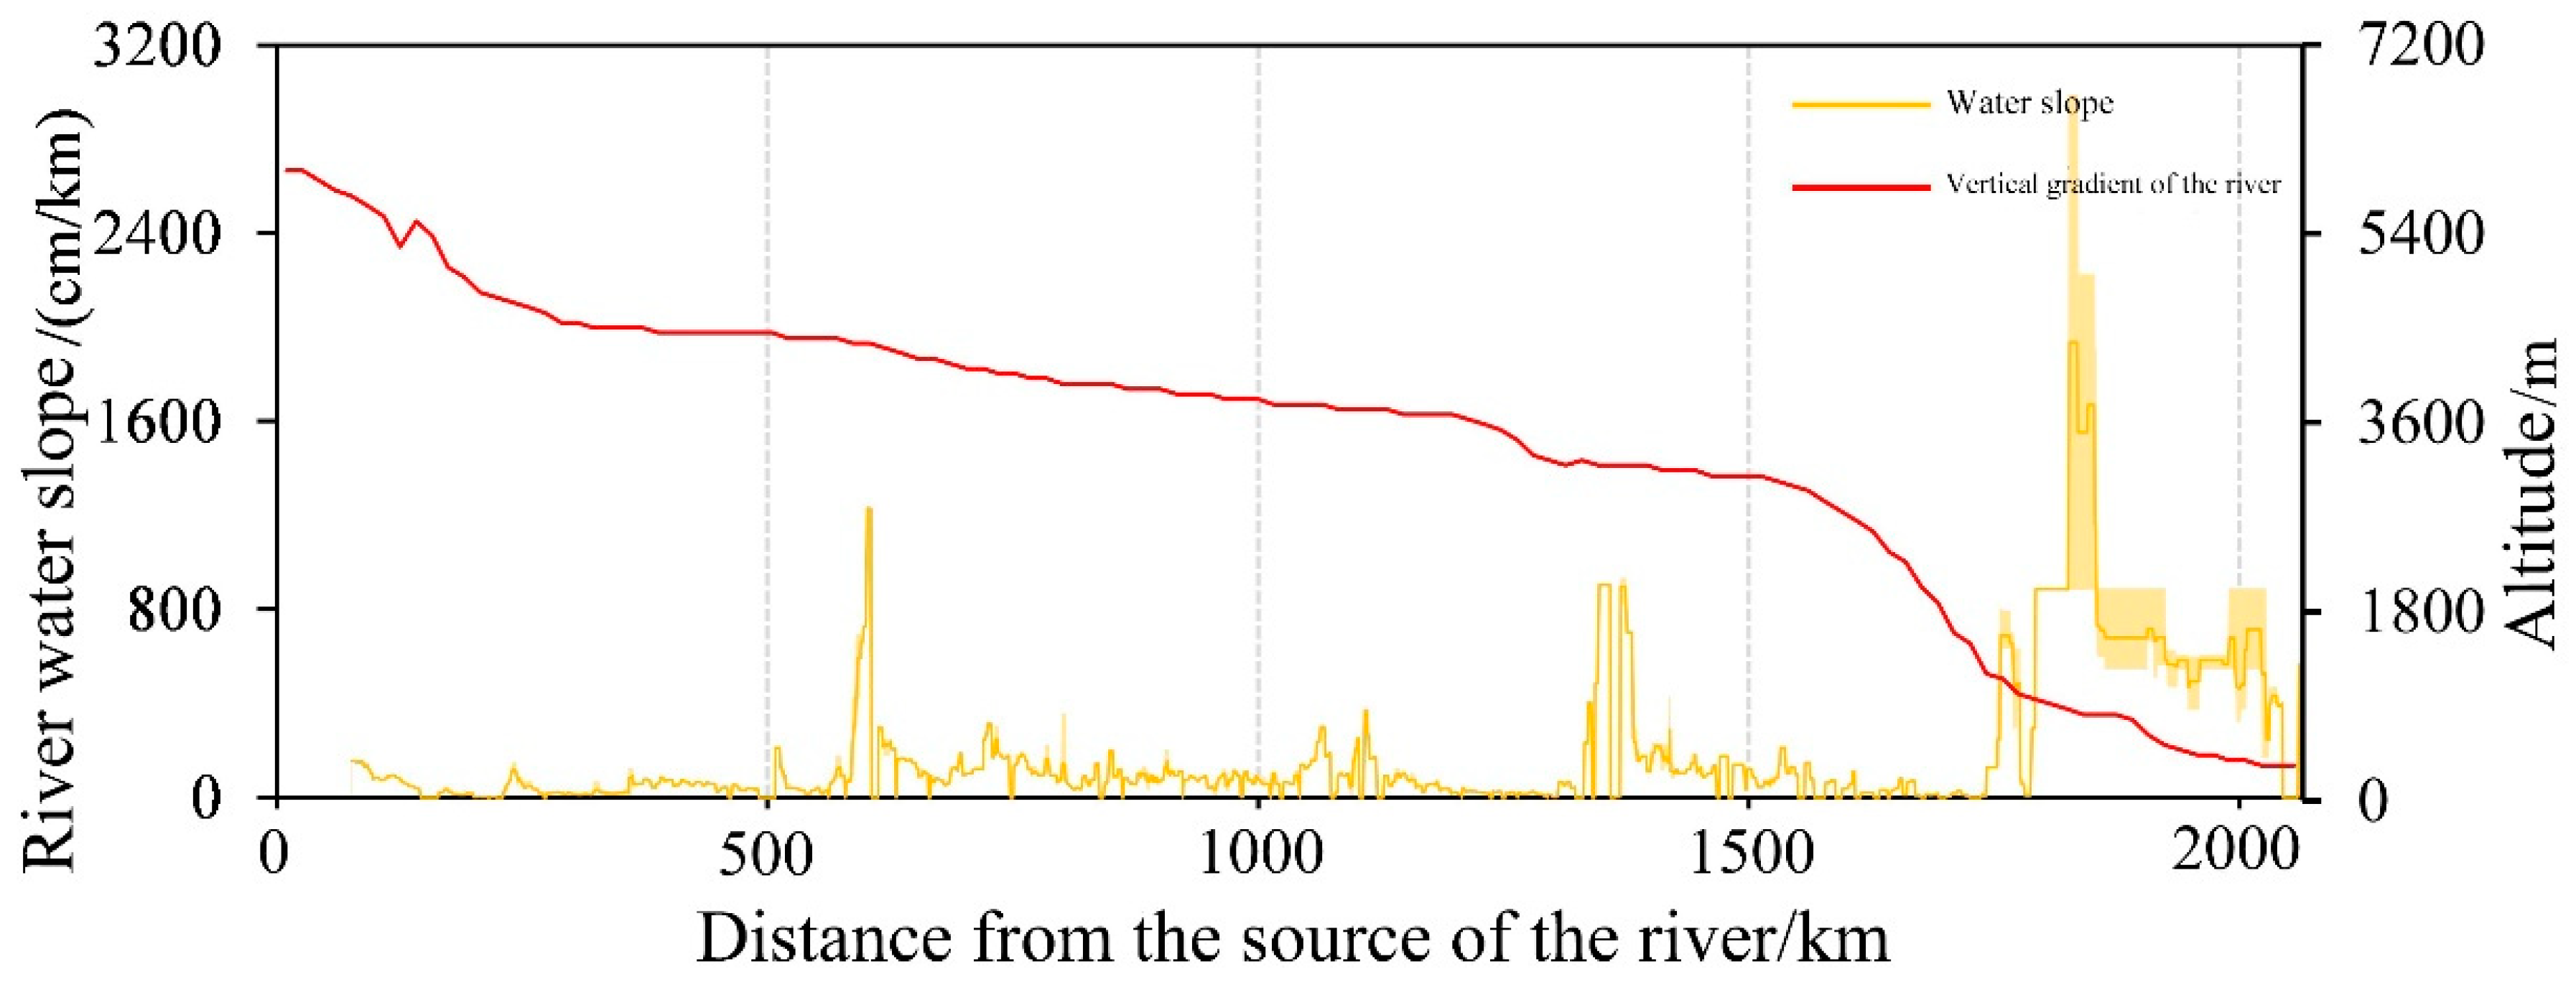
Figure 4 shows the average water surface slope along the direction of flow of the Yarlung Zangbo River during the two-year period December 2018–November 2020 in yellow, the variation in water surface slope during this period in light yellow and the trend of river slope change with elevation in red. There is a catchment in the upper reaches of the river basin where the minimum water surface slope is about 0.08 cm/km, and there are many villages and farmlands around the middle reaches, where the terrain is flat and the water level changes little, so the water surface slope is gentle. The length of this stretch of the river is 54.28% of the length of the entire river, and 81.62% of this stretch has a surface slope <500 cm/km. There are occasional abrupt changes in the slope in these upstream and midstream reaches where there are particularly large river bends. The water surface slope is large and varies greatly in the downstream reaches, especially in winter and spring, due to the alternating dry and wet climate conditions in the upper, middle and lower reaches of the river. The upper and middle basins are semi-arid areas, whereas the lower basin includes semi-arid, semi-humid and humid areas. The river flows through Medog County after it turns to flow south, and the angle between the ICESat-2 track and the river channel becomes very small. This results in the satellite passing over this section of the river less often, making it difficult to accurately calculate the water surface slope of this section of the river.
Because ICESat-2 passes over the same ground features every two years, more water level time series data for the same locations can be obtained, and changes in water surface slopes can be estimated for multiple river cross-sections.
3.2. Characteristics of Water Surface Slope in Different River Sections of the Yarlung Zangbo River
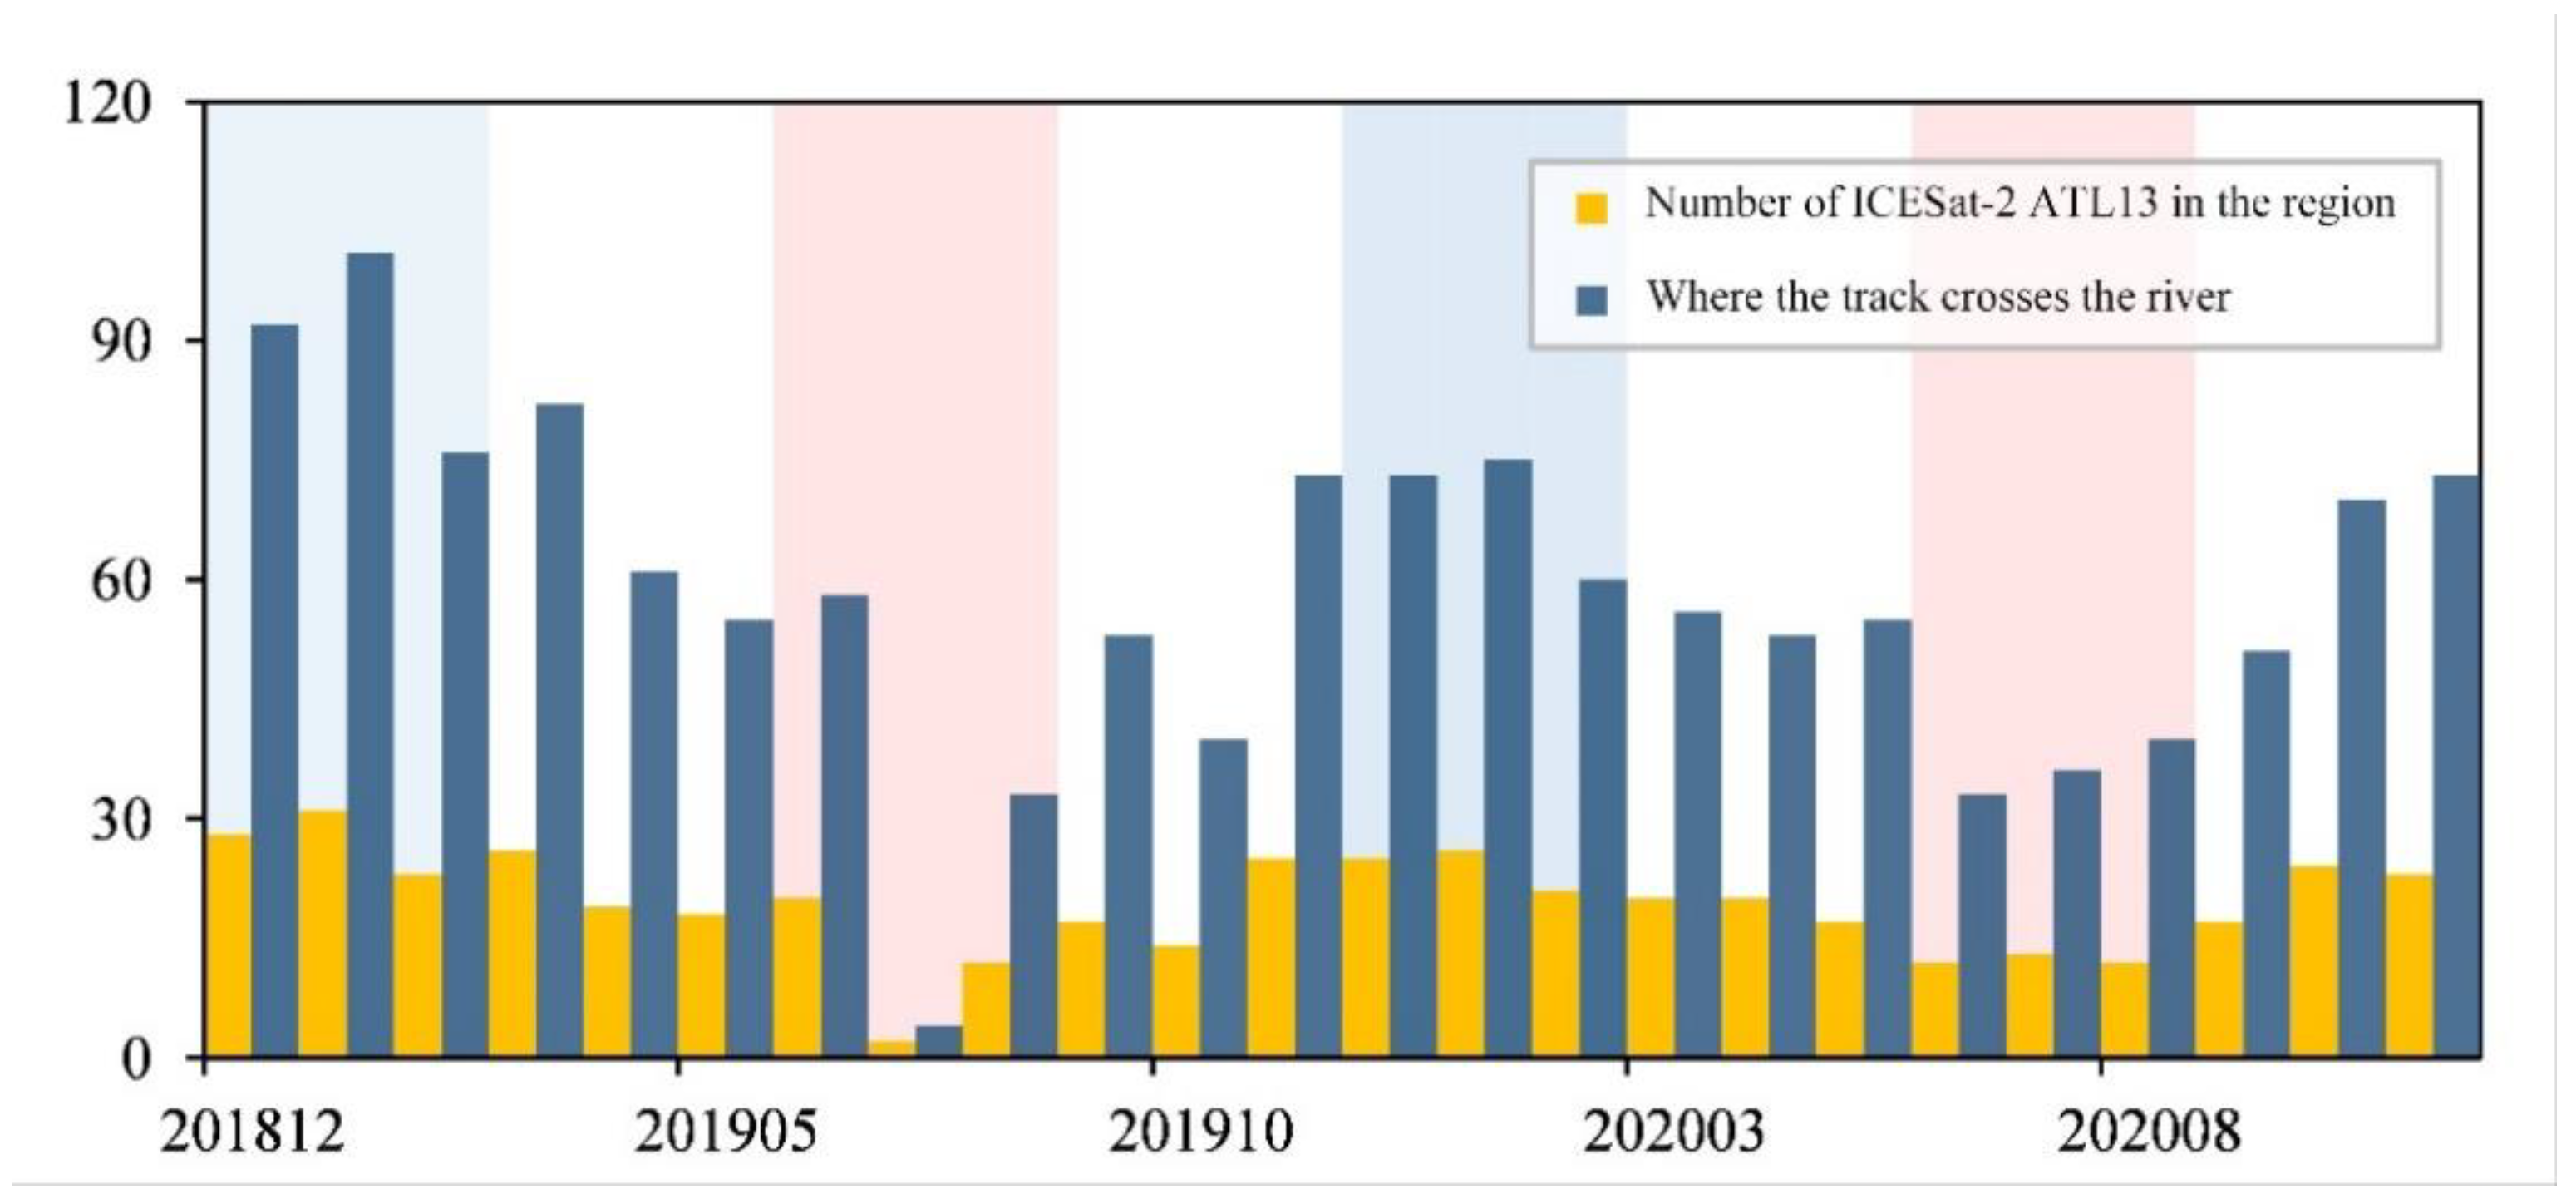
The number of repeat observations by ICESat-2 for any given body of water depends on the size and geographic location of the body of water. The frequency of the ICESat-2 passage over inland bodies of water depends on how often the orbital pattern of the spacecraft intersects with the water mask. The Yarlung Zangbo River is in the Tibetan Plateau, which is affected by cloud cover over most of the summer, and the number of recorded ICESat-2 passes over the river varies from month to month due to both the orbital trajectory and the laser signal being affected by cloud interference. Figure 5 shows that the number of ICESat-2 passages over the river mask is least in July and greatest in January. This is likely due to the high cloud cover in the region in summer; ICESat-2 is a laser altimetry satellite, and the laser beam does not easily pass through clouds, so cloud cover interferes with the surface measurement. As a result, there will be a greater time interval between passages that provide data that is usable in estimating the water surface slope of different river sections in summer. The average number of data-producing passages was 58/month, with the least number in July 2019 (4) and the greatest number in January 2019 (101).
Table 2 shows the cumulative length of river sections for which the water surface slope could be calculated in different seasons as a percentage of river length. Sections for which water surface slope was calculated more than four times (each season) were selected for analysis of their behavior over time; if the number of measurements is small (i.e., <5), it is difficult to assess seasonal changes in water surface slope and impossible to form a generalized water surface height curve.
Figure 6 shows the water surface slope for six different sections of the upper and middle reaches of the Yarlung Zangbo River. For river section (a), eight water surface slope values were calculated from ICESat-2 data over a two-year period. The least water surface slope (40.11 cm/km) was obtained for October 2019 and the greatest slope (100.34 cm/km) was obtained for April 2020 at this location. The average water surface slope was 66.91 cm/km, and more water surface slope values were calculated for this section than for the other five river sections. There was a relatively large time interval between October 2019 and September 2020 for which there were no values, which may be due to cloud cover preventing measurement.
The water surface slope varied less for sections (b) and (d) than for other sections. Six water surface slope values were obtained for section (b), with the least value in May 2019 (37.95 cm/km) and the greatest value in August 2019 (50.37 cm/km). The range for the water surface slope was greater for section (b) than for section (d), for which there were five water surface slope values, but the water surface slope of section (d) was not calculated in the summer of either year, resulting in the time series of water surface slope for this section omitting several extreme values.
The water surface slope varied greatly for section (f), with a range of 686.15 cm/km. The river curves noticeably in this section, and there are clear changes in the water level. Six water surface slope values were calculated. The smallest water surface slope value was in April 2019 (198.32 cm/km), and the greatest was in August 2020 (884.47 cm/km). The average water surface slope was 472.43 cm/km.
For river section (c), six water surface slope values were calculated from ICESat-2 data over a two-year period. The least water surface slope (120.55 cm/km) was obtained for February 2019 and the greatest slope (184.92 cm/km) was obtained for July 2019 at this location. The average water surface slope was 154.66 cm/km.
Five water surface slope measurements were obtained for section (e). The smallest water surface slope was in February 2019 (70.97 cm/km), and the average water surface slope was 138.00 cm/km. The change in water surface slope in section (e) was not as clear as in other river sections, which was mainly due to the low number of ICESat-2 passes and the long intervals between passages. The water surface slope of this section was not measured between May 2019 and August 2020, and the highest value was reached in September 2020 (229.29 cm/km). However, the sparsity of values does not allow for a sound judgment of any trend in water surface slope change.
River surface slope was greatest in summer and fall and least in winter and spring. There may be periodic seasonal variation in water surface slope in river sections, but extreme water surface elevation and seasonal variation are difficult to assess because of the long time intervals between ICESat-2 ATL13 measurements. A longer time series is required to enable identification of seasonal or cyclic trends.
3.3. Comparison of ICESat-2 Based Estimation of Yarlung Zangbo River Water Level with Hydroweb Data
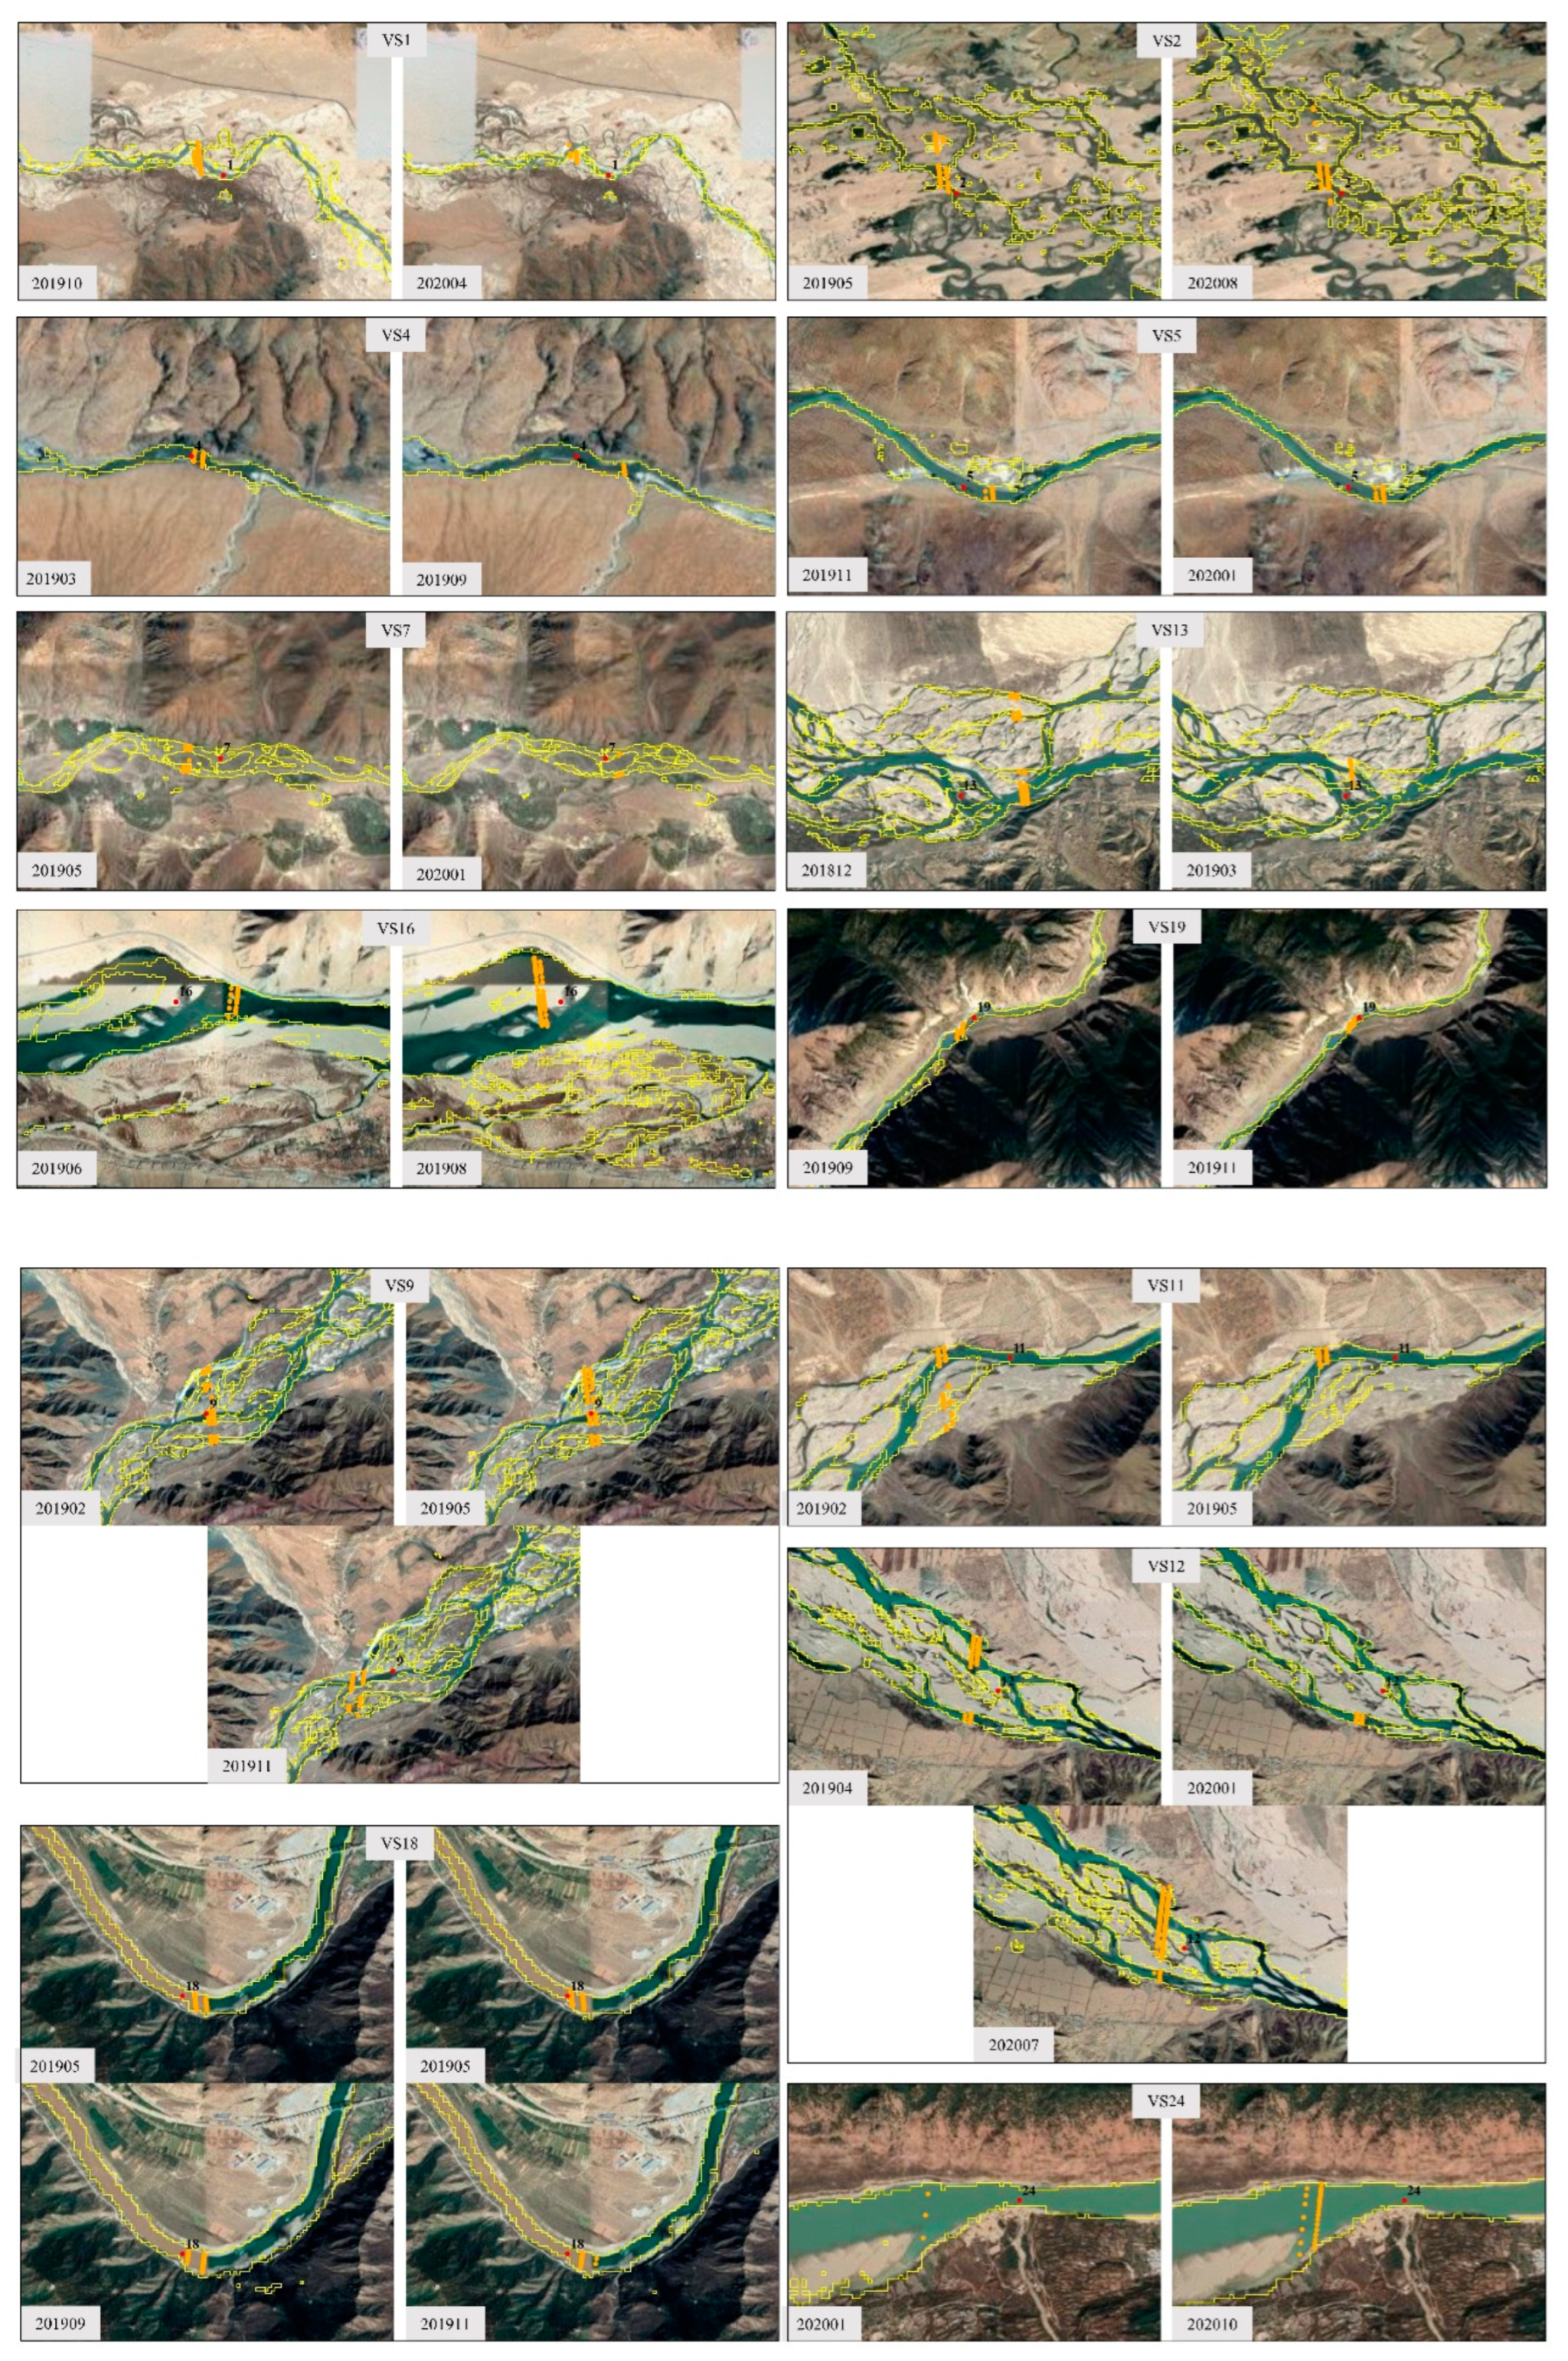
The Hydroweb virtual stations provided water level data for the period of December 2018–November 2020. We searched for multitemporal ICESat-2 passes within 3 km of each of the 24 virtual stations and found 14 such stations that satisfied this criterion and could be used to validate the ICESat-2 results, as shown in Figure 7 and Figure 8 and Table 3.
We compared the water levels calculated from the ICESat-2 data with those provided by Hydroweb stations, as shown in Figure 9. Hydroweb measurement results are in yellow and ICESat-2 measurement results are in blue. Over time, Hydroweb measurements are more readily available than ICESat-2 measurements for the same time period. Most of the seasonal cyclical changes in water level can be obtained from Hydroweb virtual station data, but they are difficult to calculate from the existing ICESat-2 data. However, the Hydroweb dataset can only provide water level data from, at most, 35 virtual stations on the Yarlung Zangbo River, whereas we calculated water levels at 127 river locations on the main stem of the Yarlung Zangbo River from ICESat-2 data. This is a greater number of locations than are available in Hydroweb, so these river locations should be added to Hydroweb.
The water levels for the virtual stations VS5 and VS11 and those for the nearby ICESat-2 observations differed significantly. The ICESat-2 water levels were similar to those for several other locations. The difference in water levels for virtual station VS4 in September 2019 was large (about 1.19 m); the ICESat-2 pass was far from the virtual station, so the difference may be due to height differences due to the water level slope. Hydroweb levels for VS11 for February–May 2019 differed significantly from the water levels calculated from ICESat-2, which may be due to the braided streams. Changes in water level are volatile. At VS24, the difference in water level between Hydroweb and ICASat-2 in January 2020 was about 1.20 m because the ICESat-2 pass was at some distance from the Hydroweb virtual station. The difference between the two in water levels may be due to increased surface roughness caused by turbulent river flow; additionally, the water level may also be influenced by wind formation or fluctuation in the geoid.
ICESat-2 has a ground track spacing of about 3.3 km. The water level values for the Hydroweb virtual stations were all provided by Sentinel-3, which has a ground track spacing of 52 km. ICESat-2 produces more accurate water level data than the virtual stations. However, the 91-day ICESat-2 cycle could result in more than 3 months of missing data from the two ICESat-2 satellite water level measurements, leading to unobserved extreme values and consequent misinterpretation of water level values. Thus, although the ICESat-2 measurements are accurate, the large time interval between measurements makes it difficult to draw firm conclusions about seasonal variation at this location. With a longer time series, it would be possible to draw stronger conclusions about water surface height; this would require further research.
4. Conclusions
This study is the first attempt to use ICESat-2 satellite altimetry data to provide water level information for the Yarlung Zangbo River. We calculated the water surface slope of river sections and examined the characteristics of changes in water surface slope over different time periods. Although the water level information measured by ICESat-2 altimetry data was similar to that measured by Hydroweb, the ICESat-2 data were more accurate. We obtained information that provides an important baseline reference for how water surface slope changes in different river sections of the Yarlung Zangbo River. However, the assessment of seasonal changes and the construction of water surface slope curves is tentative due to the short period of this study. The results would be improved if the ICESat-2 data were to be combined with additional multisource data.
We found that the water surface slope of the river was greatest in summer and autumn and lowest in winter and spring and that there may be seasonal changes in the water surface slope of the river sections. The water surface slope fluctuates widely with significant extreme differences. The maximum average water surface slope was 1935.17 cm/km at the large horseshoe-shaped bend, but the minimum water surface slope was only 0.08 cm/km in a particular catchment in the upper reaches, and the water surface was flat in the middle reaches where there was little change in water level. The general characteristics of the water surface slope of the Yarlung Zangbo River and its fluctuations are that they are mainly small in the upper and middle reaches of the river and large in its lower reaches. These characteristics may be related to the dry and wet conditions of the topography and climate.
5. Discussion
The stream of satellite launches over recent decades has greatly invigorated the exploration of river hydrology. ICESat-2 has smaller ground track spacing than other altimetry satellite missions, and its orbit passes over more river cross-sections. It can therefore measure the water level of most sections of the Yarlung Zangbo River. We obtained water level information for different sections of the Yarlung Zangbo River from the high spatial resolution ICESat-2 altimetry data and calculated the water surface slope of the various sections. We examined changes in river sections for which there were several passages by analyzing the results. However, the small ground track spacing of ICESat-2 passages is at the cost of temporal resolution, which results in a large time interval between water level measurements of each river section. It is therefore difficult to identify and assess seasonal variability and to create general water surface height profiles. We found that ICESat-2 may not capture data for extreme water surface heights, leading to misinterpretation of water surface heights. Hydrologically, ICESat-2 altimetry data are used mainly for lake measurements and have, at present, rarely been used in river hydrology. Lao et al. [39] monitored and analyzed the water level changes in the Mekong River from ICESat-2 altimetry data. Guo et al. [40] estimated the evaluation of the water level in the Upper Yangtze River from ICESat-2 altimetry data. This study was the first attempt to use ICESat-2 altimetry data for remote sensing and monitoring of the Yarlung Zangbo River water level slope. The results show that ICESat-2 data had higher-accuracy water level data results and more river location information than that of Hydroweb and can be used to provide an important baseline reference for water surface slope changes in different sections of the Yarlung Zangbo River over time. Multitemporal water surface slope information also provides basic data for studies on river runoff inversion.
We also found that combining ICESat-2 data with other multisource remote sensing data enabled the production of a more detailed representation and analysis of the temporal dynamics of the hydrology of the Yarlung Zangbo River. This technique may be used to compensate for the lack of hydrological data, and thus lack of hydrological understanding of the temporal and spatial dynamics, for ungauged or unsurveyed rivers.
Author Contributions
Conceptualization, S.W.; data curation, J.X.; methodology, J.X. and S.W.; project administration, S.W.; data processing, D.C.; writing—original draft, D.C.; writing—review and editing, D.C. All authors have read and agreed to the published version of the manuscript.
Funding
Scientific and Technological Innovation Team of Universities in Henan Province (Grant: Henan Provincial Education Department, Number: 22IRTSTHN008), Henan Provincial Science and Technology Key Projects (Grant: Henan Science and Technology Department, Number: 222102320005), Key Research Projects of Henan Higher Education Institutions (Grant: Henan Provincial Education Department, Number: 22A420002) and Program for Innovative Research Team (in Philosophy and Social Science) at the University of Henan Province (Grant: Henan Provincial Education Department, Number: 2022-CXTD-02).
Institutional Review Board Statement
Not applicable.
Informed Consent Statement
Not applicable.
Data Availability Statement
The data used in this study are available from the first author upon reasonable request.
Acknowledgments
Special acknowledgments are due to the European Space Agency, French LEGOS laboratory and National Snow and Ice Data Center for providing the data to conduct this research work, respectively. The research was supported by the Scientific and Technological Innovation Team of Universities in Henan Province (Grant: 22IRTSTHN008), Henan Provincial Science and Technology Key Projects (Grant: 222102320005), Program for IInnovative Research Team (in Philosophy and Social Science) at the University of Henan Province (Grant: 2022-CXTD-02)and the Key Research Projects of Henan Higher Education Institutions (Grant: 22A420002). Additionally, the authors would like to thank Chunqiao Song from the Nanjing Institute of Geography and Lakes, Chinese Academy of Sciences (CAS), for providing the data employed in this study.
Conflicts of Interest
The authors declare that no competing interest exist.
References
- Demelash, A.M.; Tena, A.A.; Job, R.K.; Nguyen, T.T.L.; Tesfa, G.A. Analysis of rainfall and streamflow trend and variability over Birr River watershed. Abbay basin Ethiopia. Environ. Chall. 2022, 7, 100528. [Google Scholar]
- Oki, T.; Kanae, S. Global hydrological cycles and world water resources. Science 2006, 313, 1068–1072. [Google Scholar] [CrossRef] [Green Version]
- Netrgui, N.; Miguel, A.; Dawei, H.; Huan, W.; Qiang, D.; Jun, Z. Uncertainty assessment of radar-raingauge merged rainfall estimates in river discharge simulations. J. Hydrol. 2021, 603, 127093. [Google Scholar]
- Sichangi, A.W.; Wang, L.; Yang, K.; Chen, D.; Wang, Z.; Li, X.; Zhou, J.; Liu, W.; Liu, W.; David, K. Estimating continental river basin discharges using multiple remote sensing data sets. Remote Sens. Environ. 2016, 179, 36–53. [Google Scholar] [CrossRef] [Green Version]
- Durand, M.; Gleason, C.; Garambois, P.-A.; Bjerklie, D.; Smith, L.C.; Roux, H.; Rodriguez, E.; Bates, P.D.; Pavelsky, T.M.; Monnier, J.; et al. An intercomparison of remote sensing river discharge estimation algorithms from measurements of river height, width, and slope. Water Resour. Res. 2016, 52, 4527–4549. [Google Scholar] [CrossRef] [Green Version]
- Pepin, N.; Bradley, R.S.; Diaz, H.; Baraer, M.; Caceres, E.B.; Forsythe, N.; Fowler, H.; Greenwood, G.; Hashmi, M.M.; Liu, D.; et al. Elevation-dependent warming in mountain regions of the world. Nat. Clim. Chang. 2015, 5, 424–430. [Google Scholar]
- Li, H.; Liu, L.; Akash, K.; Baoying, S.; Liu, X.; Li, X.; Niu, Q.; Cheng, L.; Diego, M. Vegetation greening concurs with increases in dry season water yield over the Upper Brahmaputra River basin. J. Hydrol. 2021, 203, 126981. [Google Scholar] [CrossRef]
- Gogoi, P.; Sharma, N. Spatio-temporal study of morpho-dynamics of the Brahmaputra River along its Majuli Island reach. Environ. Chall. 2021, 5, 100217. [Google Scholar]
- Qi, P.; Guo, X.L.; Chang, Y.; Tang, J.; Li, S. Cloud water path, precipitation amount, and precipitation efficiency derived from multiple datasets on the Qilian Mountains, Northeastern Tibetan Plateau. Atmos. Res. 2022, 274, 106204. [Google Scholar] [CrossRef]
- Zhu, X.; Wu, T.; Li, R.; Wang, S.; Hu, G.; Wang, W.; Qin, Y.; Yang, S. Characteristics of the ratios of snow, rain and sleet to precipitation on the Qinghai-Tibet Plateau during 1961—2014. Quat. Int. 2017, 444, 137–150. [Google Scholar] [CrossRef]
- Chen, X.; Long, D.; Hong, Y.; Zeng, C.; Yan, D. Improved modeling of snow and glacier melting by a progressive two-stage calibration strategy with GRACE and multisource data: How snow and glacier meltwater contributes to the runoff of the Upper Brahmaputra River basin? Water Resour. Res. 2017, 53, 2431–2466. [Google Scholar] [CrossRef]
- Li, F.; Xu, Z.; Feng, Y.; Liu, M.; Liu, W. Changes of land cover in the Yarlung Tsangpo River basin from 1985 to 2005. Environ. Earth Sci. 2013, 68, 181–188. [Google Scholar] [CrossRef]
- Dajun, S.; Chuanyou, C. Water resources of the Qinghai2Xizang Plateau and its exploitation. J. Nat. Resour. 1996, 11, 8–14. [Google Scholar]
- Xu, R.; Hu, H.; Tian, F.; Li, C.; Mohd, Y.A.K. Projected climate change impacts on future streamflow of the Yarlung Tsangpo-Brahmaputra River. Glob. Planet. Chang. 2019, 175, 144–159. [Google Scholar] [CrossRef] [Green Version]
- Frappart, F.; Papa, F.; Marieu, V.; Malbeteau, Y.; Jordy, F.; Calmant, S.; Durand, F.; Bala, S. Preliminary assessment of SARAL/AltiKa observations over the Ganges-Brahmaputra and Irrawaddy Rivers. Mar. Geod. 2015, 38, 568–580. [Google Scholar] [CrossRef]
- Papa, F.; Durand, F.; Rossow, W.B.; Atiqur, R.; Sujit, K.B. Satellite altimeter-derived monthly discharge of the Ganga-Brahmaputra River and its seasonal to interannual variations from 1993 to 2008. J. Geophys. Res. Ocean. 2010, 115, C12013. [Google Scholar] [CrossRef] [Green Version]
- Papa, F.; Bala, S.K.; Pandey, R.K.; Fabien, D.; Gopalakrishna, V.V.; Atiqur, R.; William, B.R. Ganga-Brahmaputra river discharge from Jason-2 radar altimetry: An update to the long-term satellite-derived estimates of continental freshwater forcing flux into the Bay of Bengal. J. Geophys. Res. Ocean. 2012, 117, 13. [Google Scholar] [CrossRef] [Green Version]
- Huang, Q.; Long, D.; Du, M.; Zeng, C.; Qiao, G.; Li, X.; Hou, A.; Hong, Y. Discharge estimation in high-mountain regions with improved methods using multisource remote sensing: A case study of the Upper Brahmaputra River. Remote Sens. Environ. 2018, 219, 115–134. [Google Scholar] [CrossRef]
- Liu, W.; Xu, Z.; Liu, L. Distributed hydrological simulation in the Lhasa River basin based on VIC model. J. Beijing Norm. Univ. (Nat. Sci.) 2012, 48, 524–529. [Google Scholar]
- Huang, X.; Wang, Z.; Sang, Y.; Yang, M.; Liu, X.; Gong, T. Precision of data in three precipitation datasets of the Yarlung Zangbo River Basin. Prog. Geogr. 2016, 35, 339–348. [Google Scholar]
- Bai, H.-Z.; Ma, Z.-F.; Dong, W.-J.; Li, D.-L.; Feng, F.; Fang, D.-X. Climatic properties and sandstorm causes in Tibet Plateau. J. Desert Res. 2006, 26, 249–253. [Google Scholar]
- Du, S.; Wu, Y.; Tan, L.; Huang, W.; Hao, C. Geochemical characteristics of fine and coarse fractions of sediments in the Yarlung Zangbo River Basin (southern Tibet, China). Environ. Earth Sci. 2018, 77, 337. [Google Scholar] [CrossRef]
- Bai, J.; Li, C.; Kang, S.; Chen, P.; Wang, J. Chemical speciation and risk assessment of heavy metals in the middle part of Yarlung Zangbo surface sediments. Huan Jing Ke Xue 2014, 35, 3346–3351. [Google Scholar] [PubMed]
- Yang, Z.; Zhuo, M.; Lu, H.; Da, W.; Ma, P.; Zhou, K. Characteristics of precipitation variation and its effects on runoff in the Yarlung Zangbo River basin during 1961–2010. J. Glaciol. Geocryol. 2014, 36, 166–172. [Google Scholar]
- Tianchou, L. Hydrological characteristics of Yarlung Zangbo river. Acta Geogr. Sin. 1999, 54, 157–164. [Google Scholar]
- Drusch, M.; Del Bello, U.; Carlier, S.; Colin, O.; Fernandez, V.; Gascon, F.; Hoersch, B.; Lsola, C.; Laberinti, P.; Martimort, P. Sentinel-2: ESA’s optical high-resolution mission for GMES operational services. Remote Sens. Environ. 2012, 120, 25–36. [Google Scholar] [CrossRef]
- Dandan, J.; Juan, Y.; Wenjuan, W.; Xingwu, G. Object-oriented urban water body extraction based on Sentinel-2 satellite images. Geospat. Inf. 2019, 17, 10–13. [Google Scholar]
- Crétaux, J.-F.; Calmant, S.; Romanovski, V.; Anton, S.; Florent, L.; Muriel, B.-N.; Anny, G.; Fabrice, H.; Flix, P. An absolute calibration site for radar altimeters in the continental domain: Lake Issykkul in Central Asia. J. Geod. 2008, 83, 723–735. [Google Scholar] [CrossRef]
- Markus, T.; Neumann, T.; Martino, A.; Abdalati, W.; Brunt, K.; Csatho, B.; Farrell, S.; Fricker, H.; Gardner, A.; Harding, D.; et al. The Ice, Cloud, and land Elevation Satellite-2 (ICESat-2): Science requirements, concept, and implementation. Remote Sens. Environ. 2017, 190, 260–273. [Google Scholar] [CrossRef]
- Neuenschwander, A.; Guenther, E.; White, J.C.; Duncanson, L.; Montesano, P. Validation of ICESat-2 terrain and canopy heights in boreal forests. Remote Sens. Environ. 2020, 251, 112110. [Google Scholar] [CrossRef]
- Zhang, G.; Chen, W.; Xie, H. Tibetan Plateau’s Lake Level and Volume Changes From NASA’s ICESat/ICESat-2 and Landsat Missions. Geophys. Res. Lett. 2019, 46, 13107–13118. [Google Scholar] [CrossRef]
- Neuenschwander, A.L.; Magruder, L.A. Canopy and terrain height retrievals with ICESat-2: A first look. Remote Sens. 2019, 11, 1721. [Google Scholar] [CrossRef] [Green Version]
- Milutin, M.; Johannes, R.; John, A.; Amy, N.; Wanda, D.; Martin, H.; Jan, V. Assessing Amazon rainforest regrowth with GEDI and ICESat-2 data. Sci. Remote Sens. 2022, 8, 100051. [Google Scholar]
- Eumann, T.; Brenner, A.; Hancock, D.; Robbins, J.; Saba, J.; Harbeck, K.; Gibbons, J.; Lee, J.; Luthcke, S.B.; Rebold, T.; et al. ATLAS/ICESat-2 L2A Global Geolocated Photon Data, Version 3; NASA National Snow and Ice Data Center Distributed Active Archive Center: Boulder, CO, USA, 2020; Volume 10. [Google Scholar]
- Jasinski, M.; Stoll, J.; Hancock, D.; Robbins, J.; Nattala, J.; Morison, J.; Jones, B.; Ondrusek, M.; Pavelsky, T.; Parrish, C. Algorithm Theoretical Basis Document (ATBD) for Along Track Inland Surface Water Data, Release 004; NASA GSFC: Greenbelt, MD, USA, 2021. [Google Scholar]
- Cooley, S.W.; Ryan, J.C.; Smith, L.C. Human alteration of global surface water storage variability. Nature 2021, 591, 78–81. [Google Scholar] [CrossRef] [PubMed]
- Luo, S.; Song, C.; Ke, L.; Zhan, P.; Fan, C.; Liu, K.; Chen, T.; Wang, J.; Zhu, J. Satellite laser altimetry reveals a net water mass gain in global lakes with spatial heterogeneity in the early 21st century. Geophys. Res. Lett. 2022, 49, e2021GL096676. [Google Scholar] [CrossRef]
- Höhle, J.; Höhle, M. Accuracy assessment of digital elevation models by means of robust statistical methods. ISPRS J. Photogramm. Remote Sens. 2009, 64, 398–406. [Google Scholar] [CrossRef] [Green Version]
- Lao, J.; Wang, C.; Nie, S.; Xi, X.; Wang, J. Monitoring and Analysis of Water Level Changes in Mekong River from ICESat-2 Spaceborne Laser Altimetry. Water 2022, 14, 1613. [Google Scholar] [CrossRef]
- Guo, X.; Jin, S.; Zhang, Z. Evaluation of Water Level Estimation in the Upper Yangtze River from ICESat-2 Data. Photonics Electromagn. Res. Symp. (PIERS) 2021, 2260–2264. [Google Scholar] [CrossRef]
Figure 1.
Overview of the study area.

Figure 2.
The river could have been passed over by the satellite more than once due to the course of the river; for each location at which ICESat-2 passes over the river, a unique ID was assigned. (A–I) indicates the position ID at the point where the track passes through the river.
Figure 2.
The river could have been passed over by the satellite more than once due to the course of the river; for each location at which ICESat-2 passes over the river, a unique ID was assigned. (A–I) indicates the position ID at the point where the track passes through the river.

Figure 3.
Schematic diagram of ICESat-2 measurement of water level in the Yarlung Zangbo River.

Figure 4.
River water slope and longitudinal gradient of the Yarlung Zangbo River.

Figure 5.
Number of ICESat-2 data-producing river passages by month.

Figure 6.
Changes in water surface slope of different river sections over the 2-year study period. (a–f) indicates the water surface slope for six different sections of the upper and middle reaches of the Yarlung Zangbo River.
Figure 6.
Changes in water surface slope of different river sections over the 2-year study period. (a–f) indicates the water surface slope for six different sections of the upper and middle reaches of the Yarlung Zangbo River.

Figure 7.
Locations of the Hydroweb virtual stations and adjacent ICESat-2 tracks.

Figure 8.
Location diagram of 24 Hydroweb data virtual stations along the main stream of the Yarlung Zangpo River.
Figure 8.
Location diagram of 24 Hydroweb data virtual stations along the main stream of the Yarlung Zangpo River.

Figure 9.
ICESat-2 and Hydroweb river water levels for comparison.


Table 1.
ICESat-2 ATL13 data used.
| Attribute | Variable | Description |
|---|---|---|
| location | segment_lat | Latitude. |
| segment_lon | Longitude. | |
| time | delta_time | Track elapsed time. |
| track | rgt | Reference ground track. |
| cycle_number | Number of exact repetitions of the reference track. | |
| water level | stdev_water_surf | Standard deviation of the water surface. |
| ht_ortho | Orthometric height EGM2008 converted from ellipsoidal height. | |
| segment_fpb_correction | First photon bias correction; corrected by subtracting the mean height products ht_ortho and ht_water_sur. | |
| quality | qf_subsurf_anomaly | The probability that a bottom or other subsurface anomaly is a bottom, based on the threshold for finding anomalies: 1 = possible subsurface anomaly due to bottom; 2 = subsurface signal may indicate bottom or other anomaly; 3 = possible subsurface anomaly; Invalid = no subsurface anomaly detected. |
Table 2.
The proportion of river for which water surface slope was calculated by season.
| Year | Season | Percentage (%) | Cumulative Length (km) |
|---|---|---|---|
| 2019 | 2019 winter | 29.39 | 604.55 |
| 2019 spring | 37.42 | 769.73 | |
| 2019 summer | 18.96 | 390.01 | |
| 2019 autumn | 21.62 | 444.72 | |
| 2020 | 2020 winter | 27.74 | 570.61 |
| 2020 spring | 16.40 | 337.35 | |
| 2020 summer | 28.25 | 581.10 | |
| 2020 autumn | 33.27 | 684.36 |
Table 3.
Location of 14 Hydroweb data virtual stations within 3 km of ICESat-2 orbit.
| FID | Latitude (°) | Longitude (°) |
|---|---|---|
| VS1 | 83.08 | 30.18 |
| VS2 | 83.49 | 29.96 |
| VS4 | 84.70 | 29.25 |
| VS5 | 85.18 | 29.31 |
| VS7 | 86.72 | 29.20 |
| VS9 | 87.69 | 29.22 |
| VS11 | 88.47 | 29.35 |
| VS12 | 89.07 | 29.33 |
| VS13 | 89.48 | 29.34 |
| VS16 | 91.71 | 29.27 |
| VS18 | 92.61 | 29.10 |
| VS19 | 93.35 | 29.05 |
| VS23 | 94.64 | 29.47 |
| VS24 | 94.87 | 29.52 |
Publisher’s Note: MDPI stays neutral with regard to jurisdictional claims in published maps and institutional affiliations. |
© 2022 by the authors. Licensee MDPI, Basel, Switzerland. This article is an open access article distributed under the terms and conditions of the Creative Commons Attribution (CC BY) license (https://creativecommons.org/licenses/by/4.0/).
Share and Cite
MDPI and ACS Style
Wang, S.; Cui, D.; Xu, J. Monitoring and Analysis of Water Surface Slope of the Yarlung Zangbo River Based on Remote Sensing. Water 2022, 14, 3304. https://doi.org/10.3390/w14203304
AMA Style
Wang S, Cui D, Xu J. Monitoring and Analysis of Water Surface Slope of the Yarlung Zangbo River Based on Remote Sensing. Water. 2022; 14(20):3304. https://doi.org/10.3390/w14203304
Chicago/Turabian StyleWang, Shidong, Dunyue Cui, and Jiahui Xu. 2022. "Monitoring and Analysis of Water Surface Slope of the Yarlung Zangbo River Based on Remote Sensing" Water 14, no. 20: 3304. https://doi.org/10.3390/w14203304
Note that from the first issue of 2016, this journal uses article numbers instead of page numbers. See further details here.