
A Joint Method Based on Geochemistry and Magnetotelluric Sounding for Exploring Geothermal Resources in Sedimentary Basins and Its Application
 ,
,
Abstract
:1. Introduction
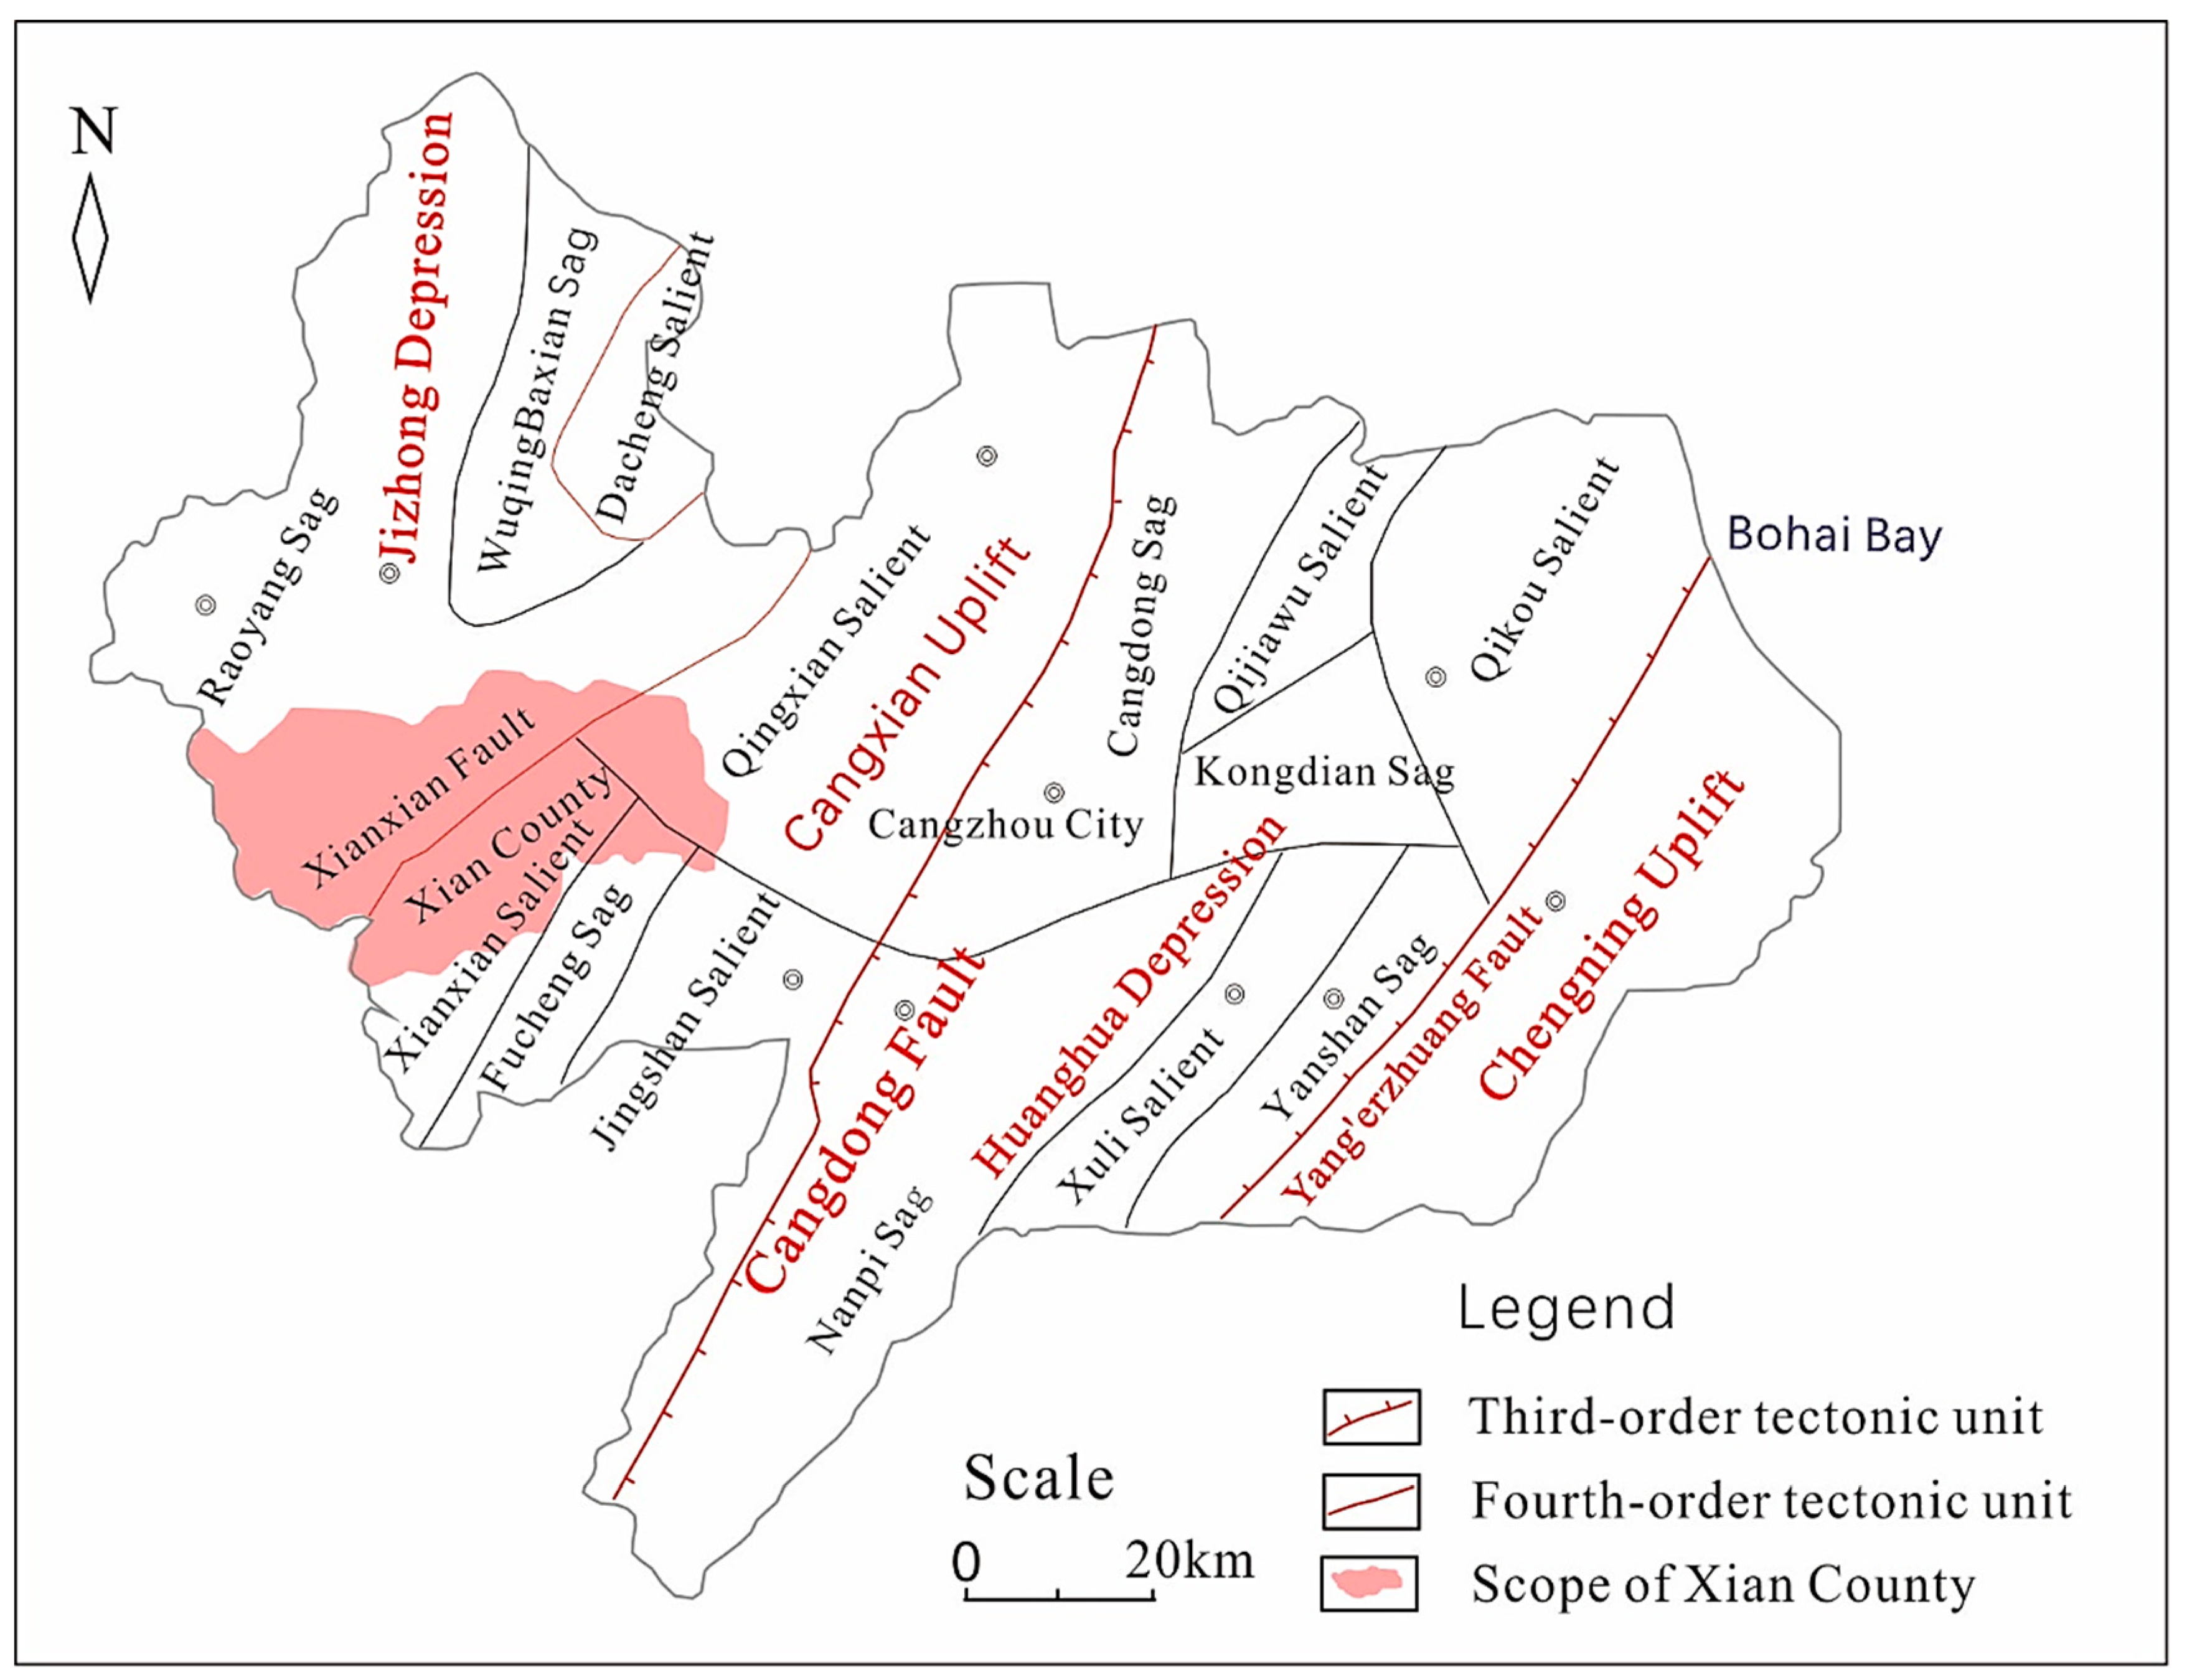
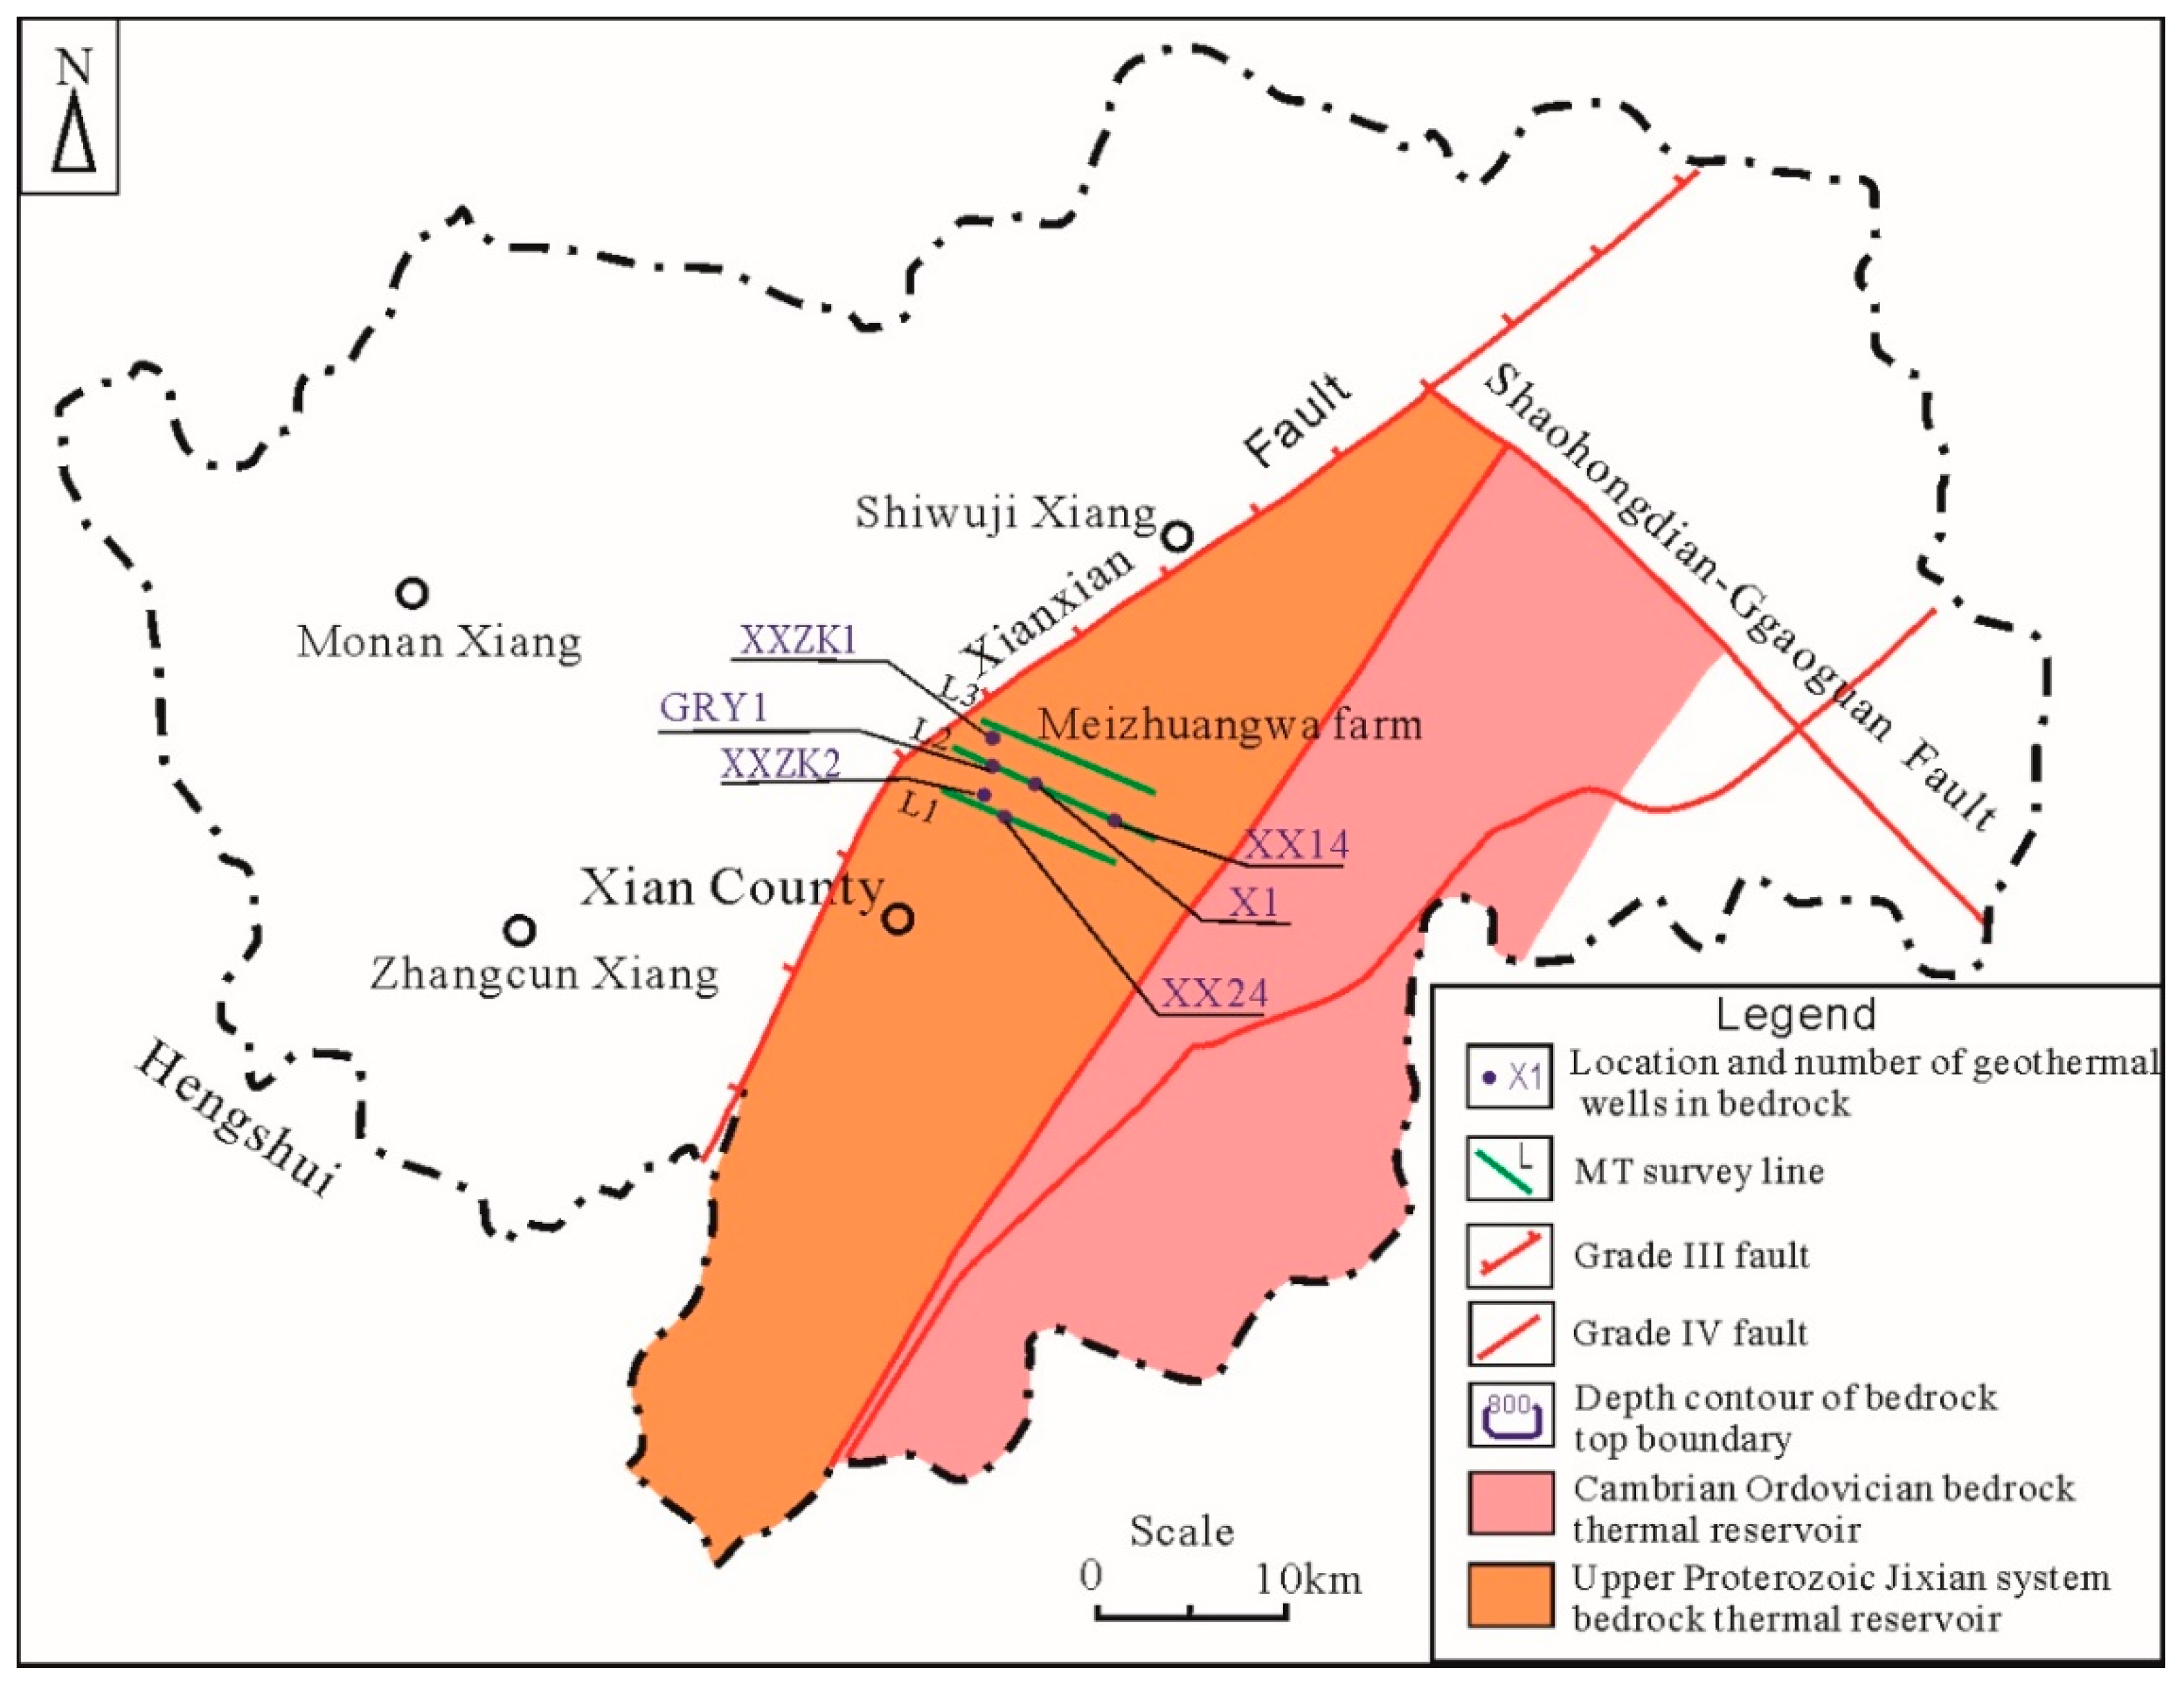
2. Geological Setting
3. Methods
3.1. MT Sounding
3.2. Collection and Analysis of Water Samples
3.3. Estimation of the Geothermal Reservoirs’ Temperature
3.3.1. Water–Rock Equilibrium State
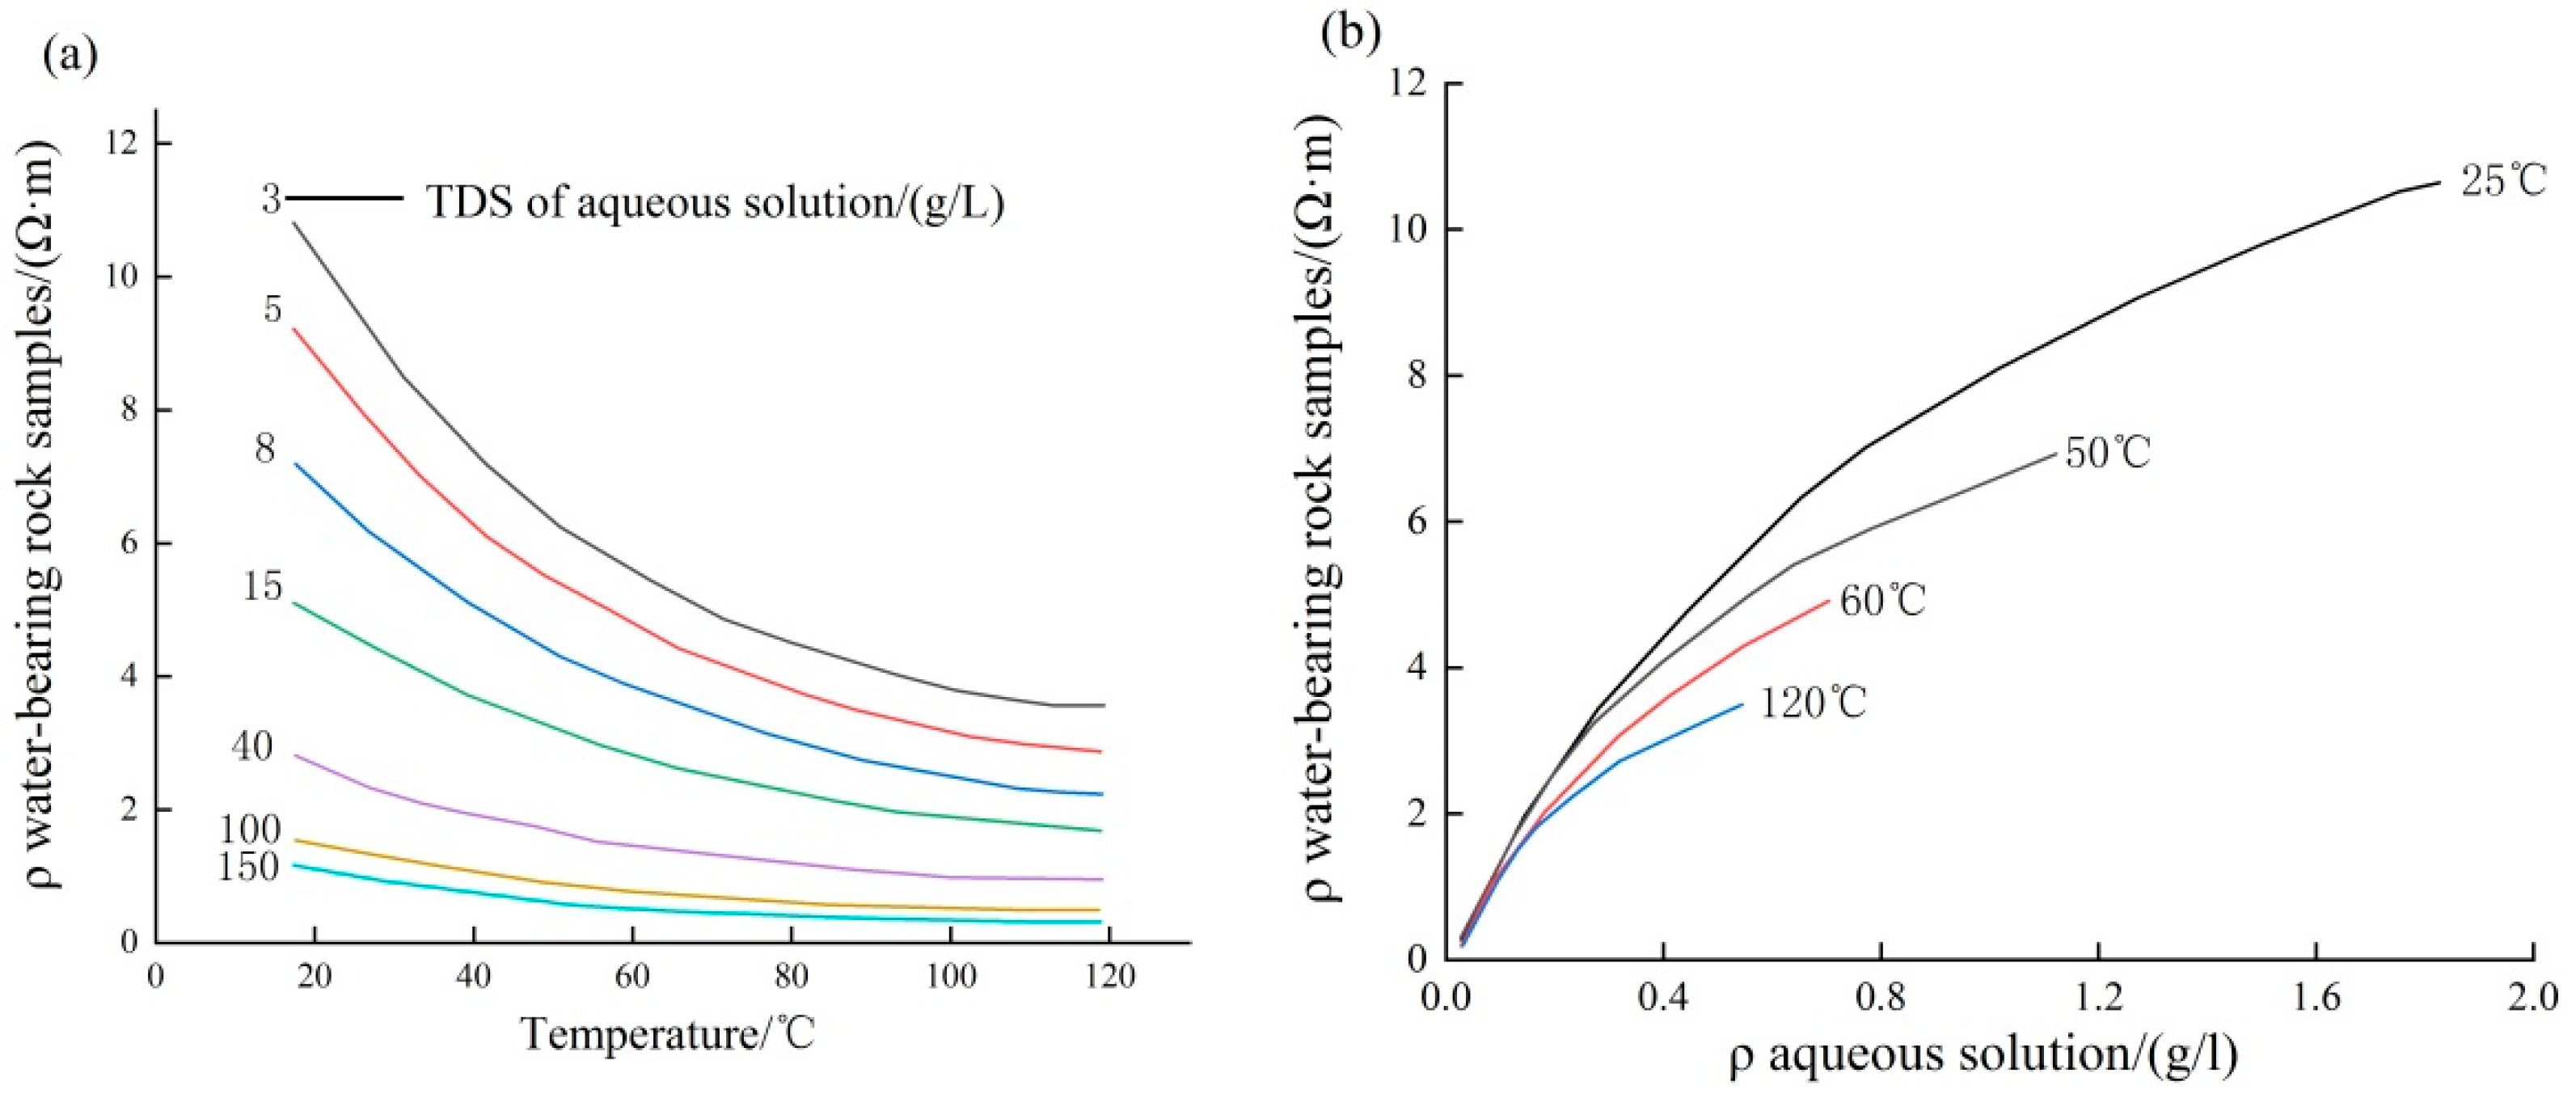
3.3.2. Resistivity–Temperature Method
3.3.3. Geothermometers
- (1)
- Geochemical geothermometry
- (2)
- Multiple mineral equilibrium diagrams
3.4. Calculation of the Circulation Depth of Geothermal Water
4. Results and Discussion
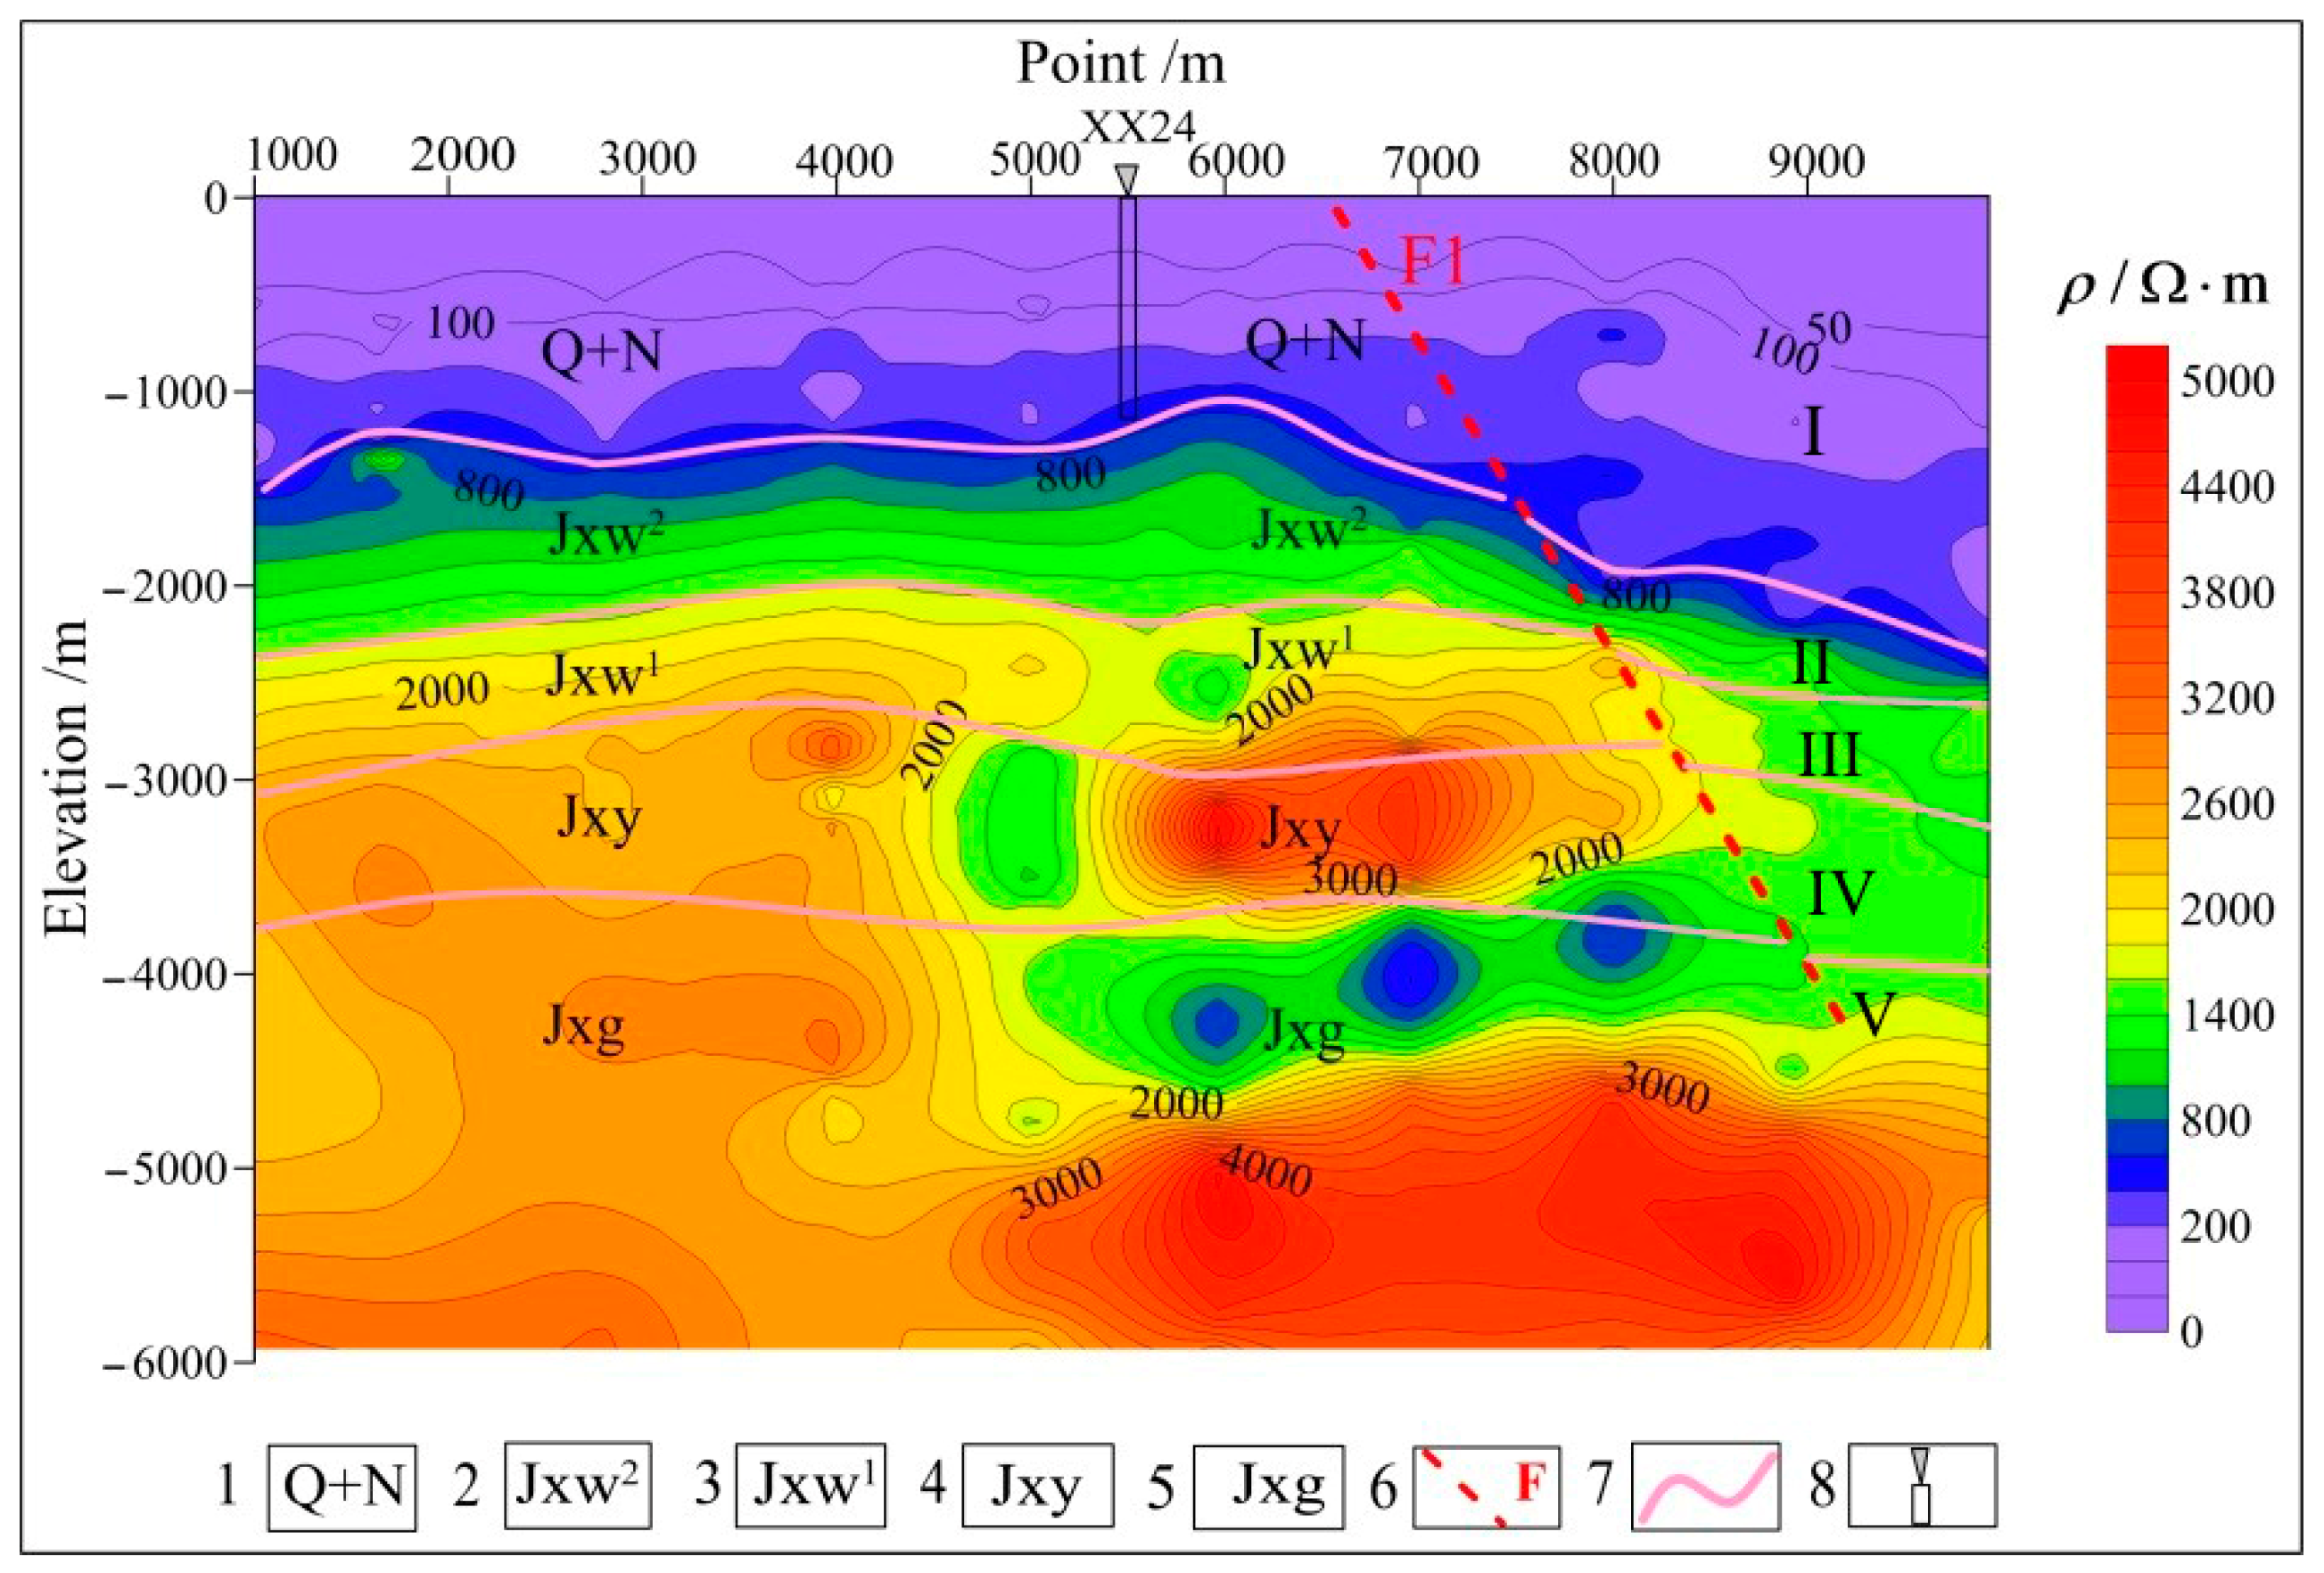
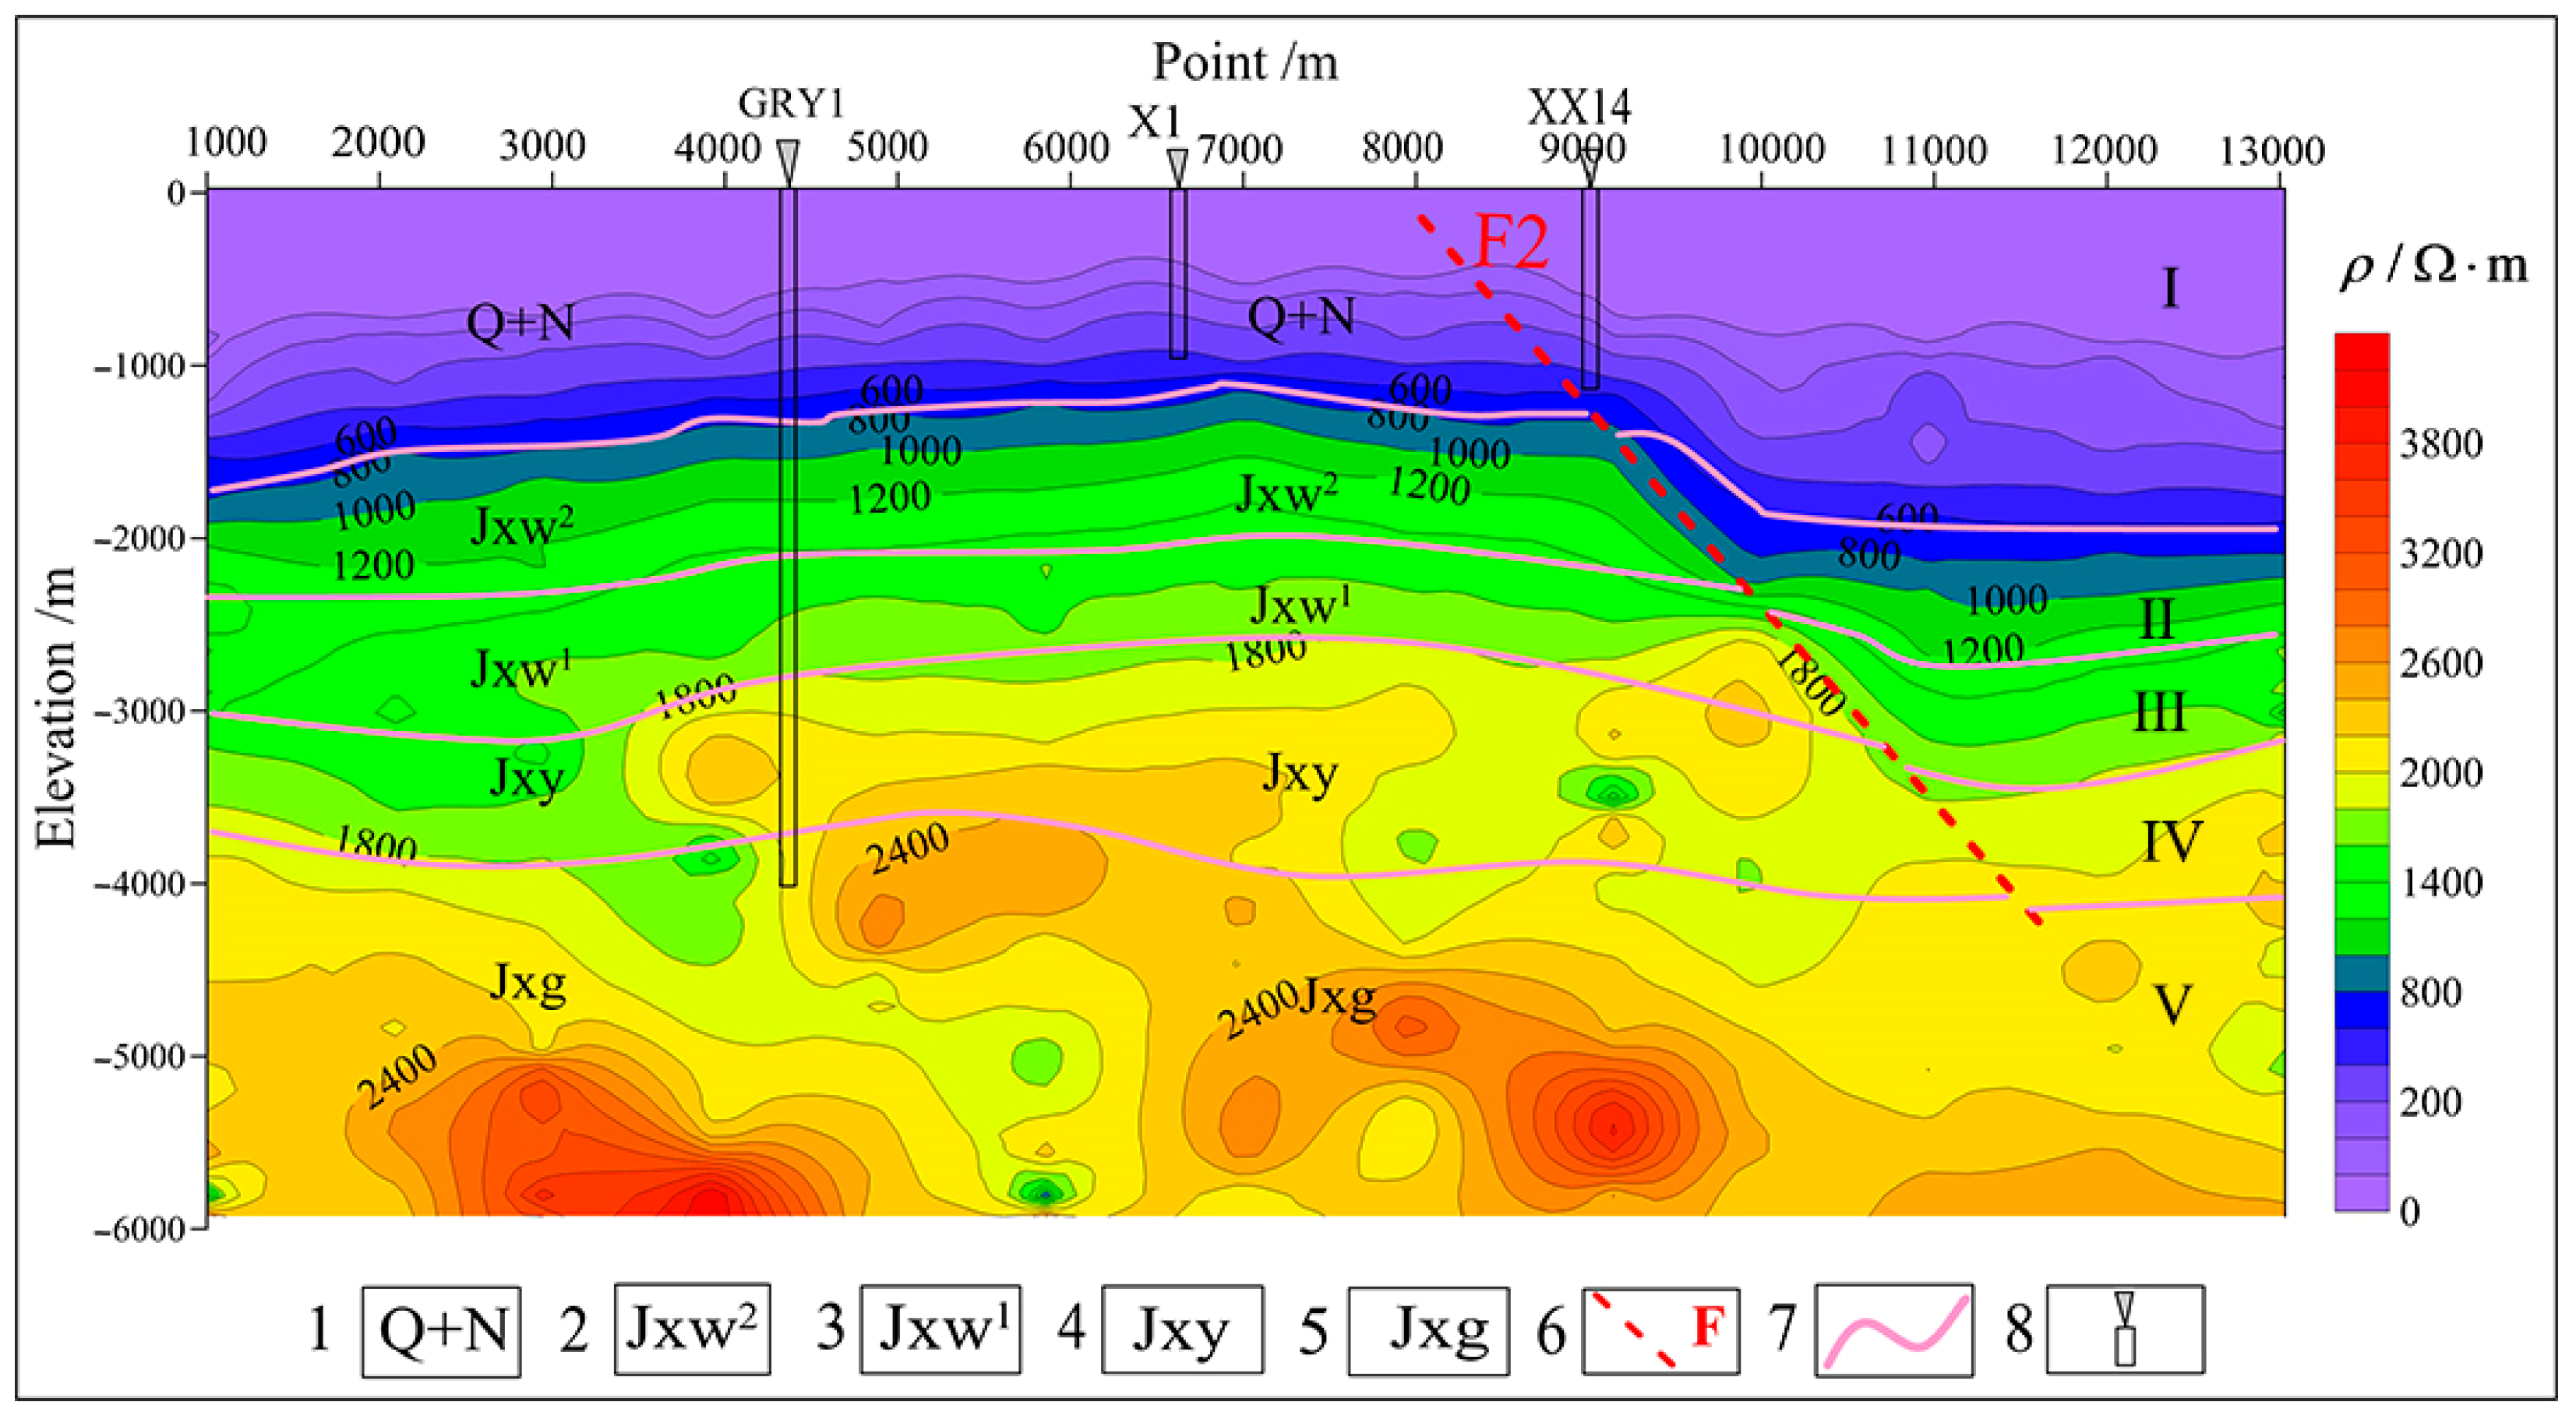
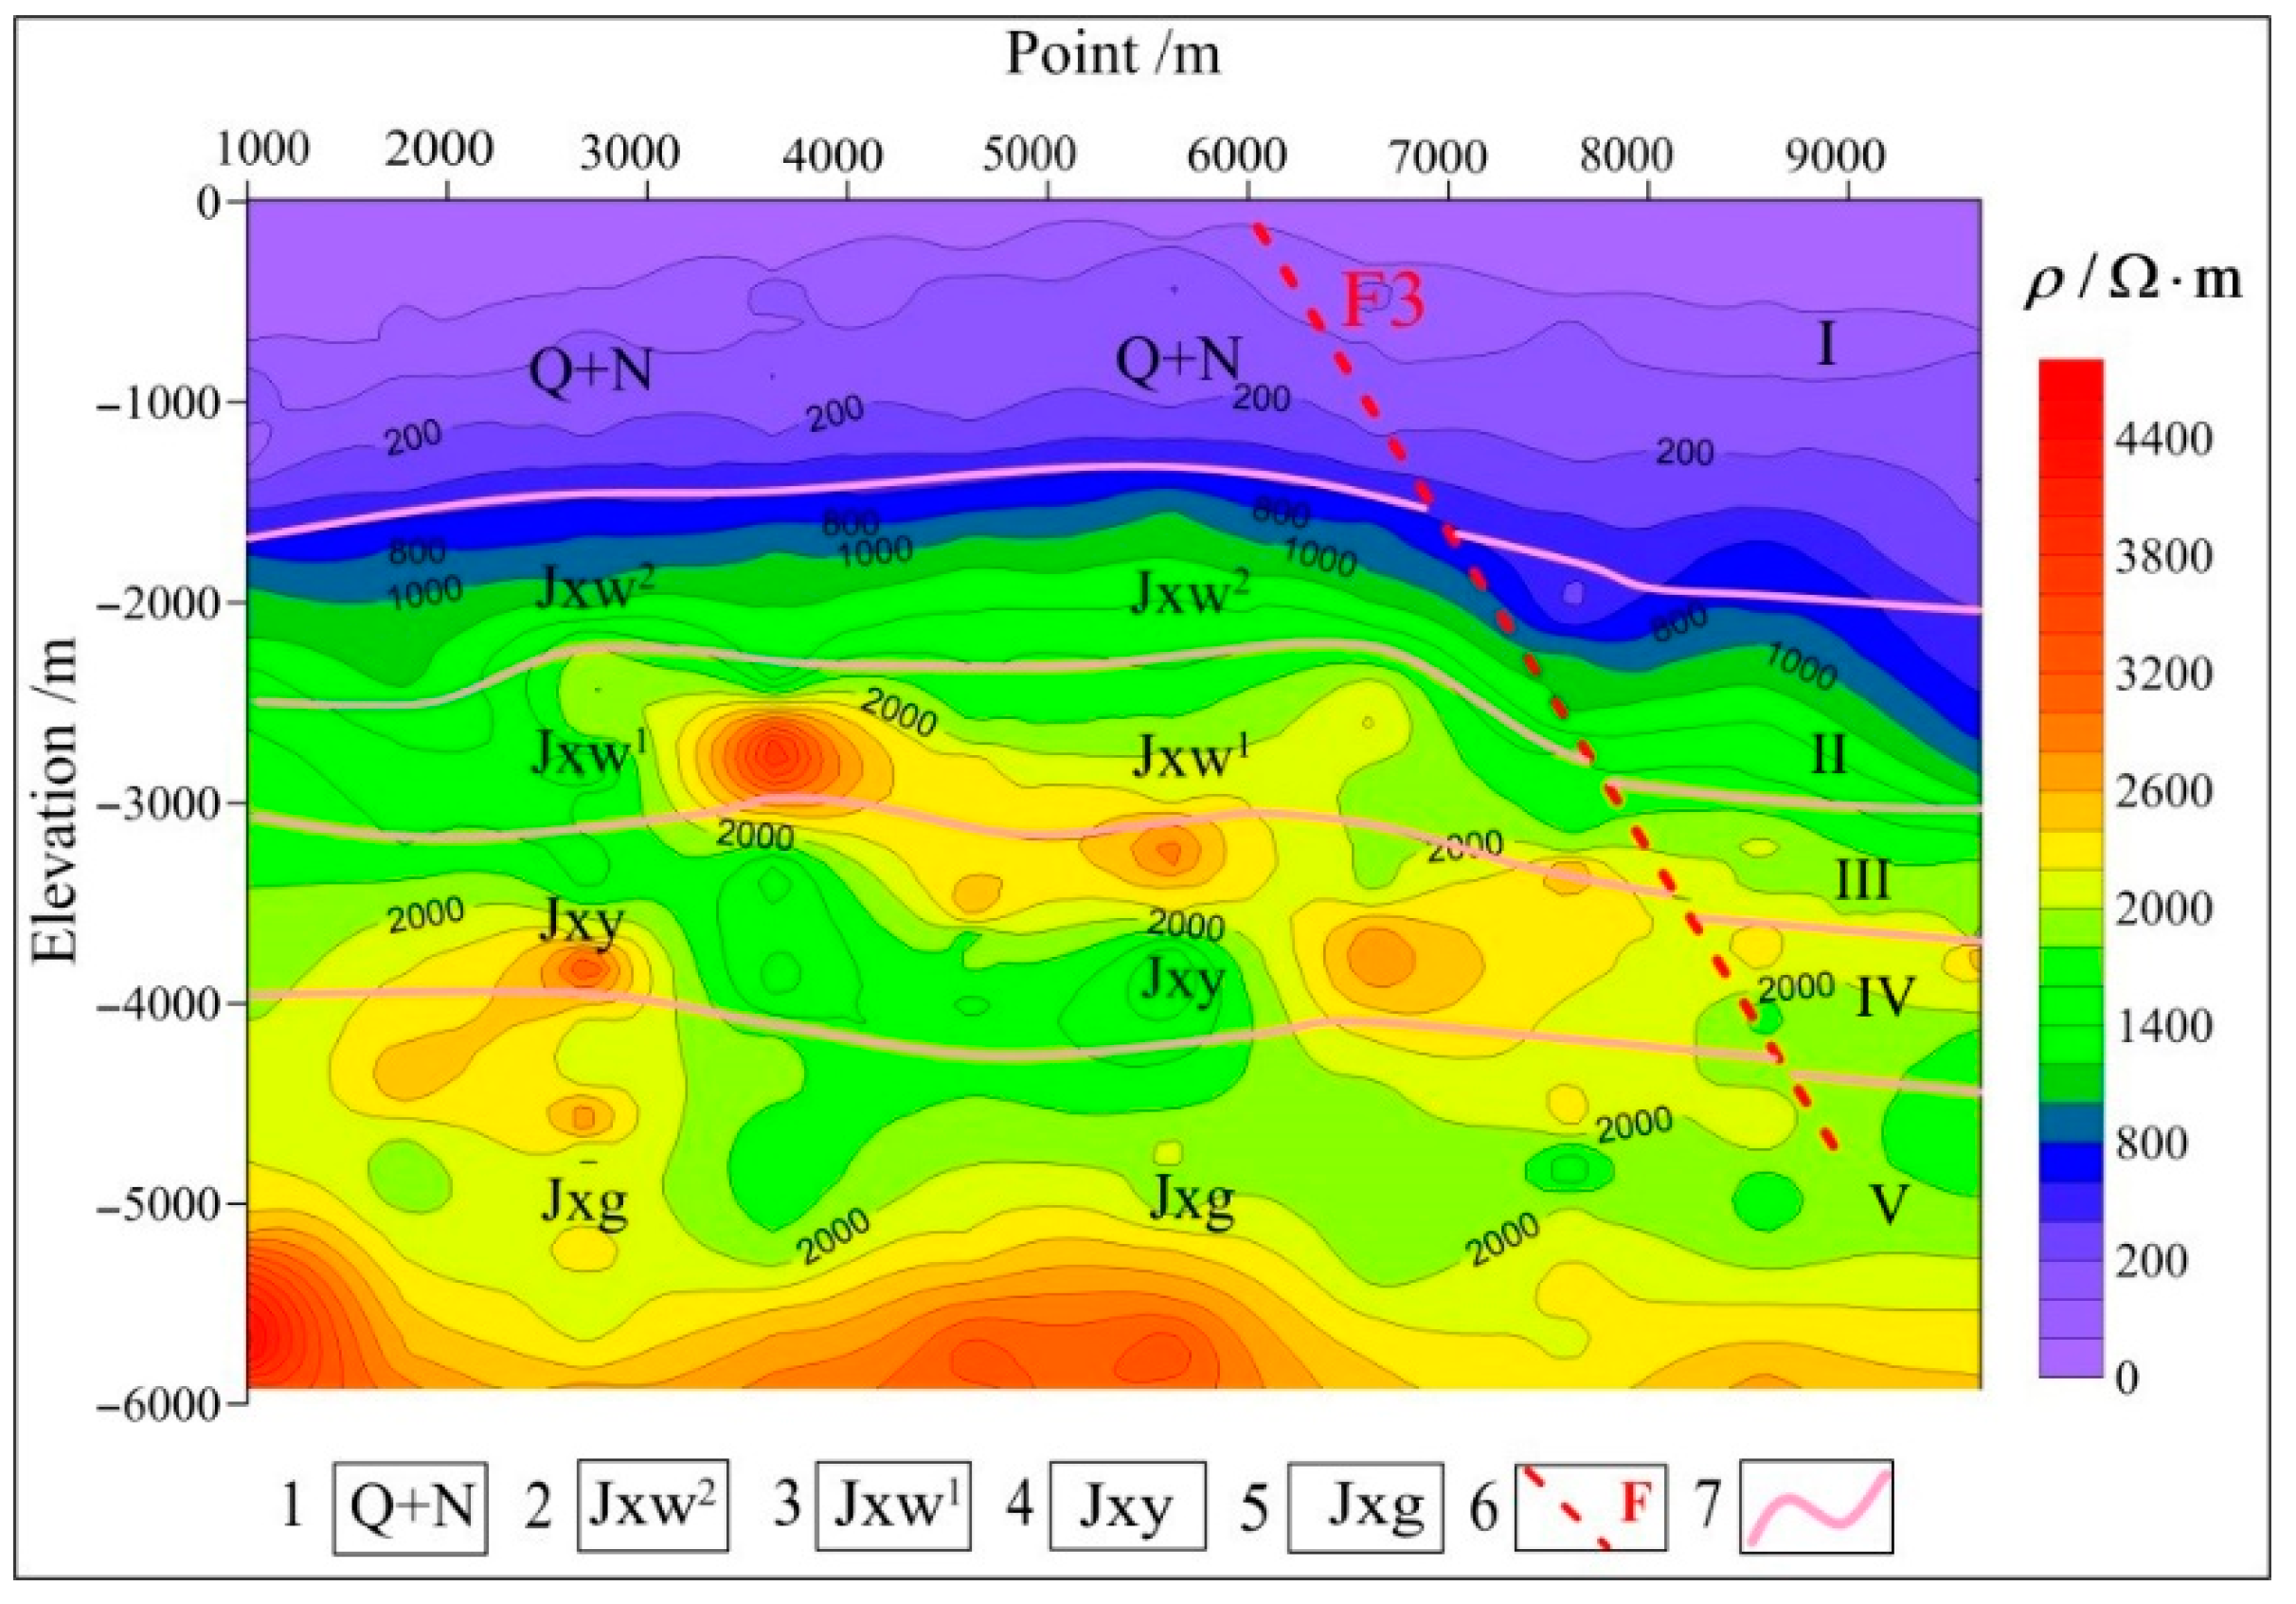
4.1. Analysis of Sections Obtained from MT Inversion
4.2. Estimation of the Geothermal Reservoir’s Temperature
4.2.1. Hydrogeochemical Characteristics of Geothermal Waters
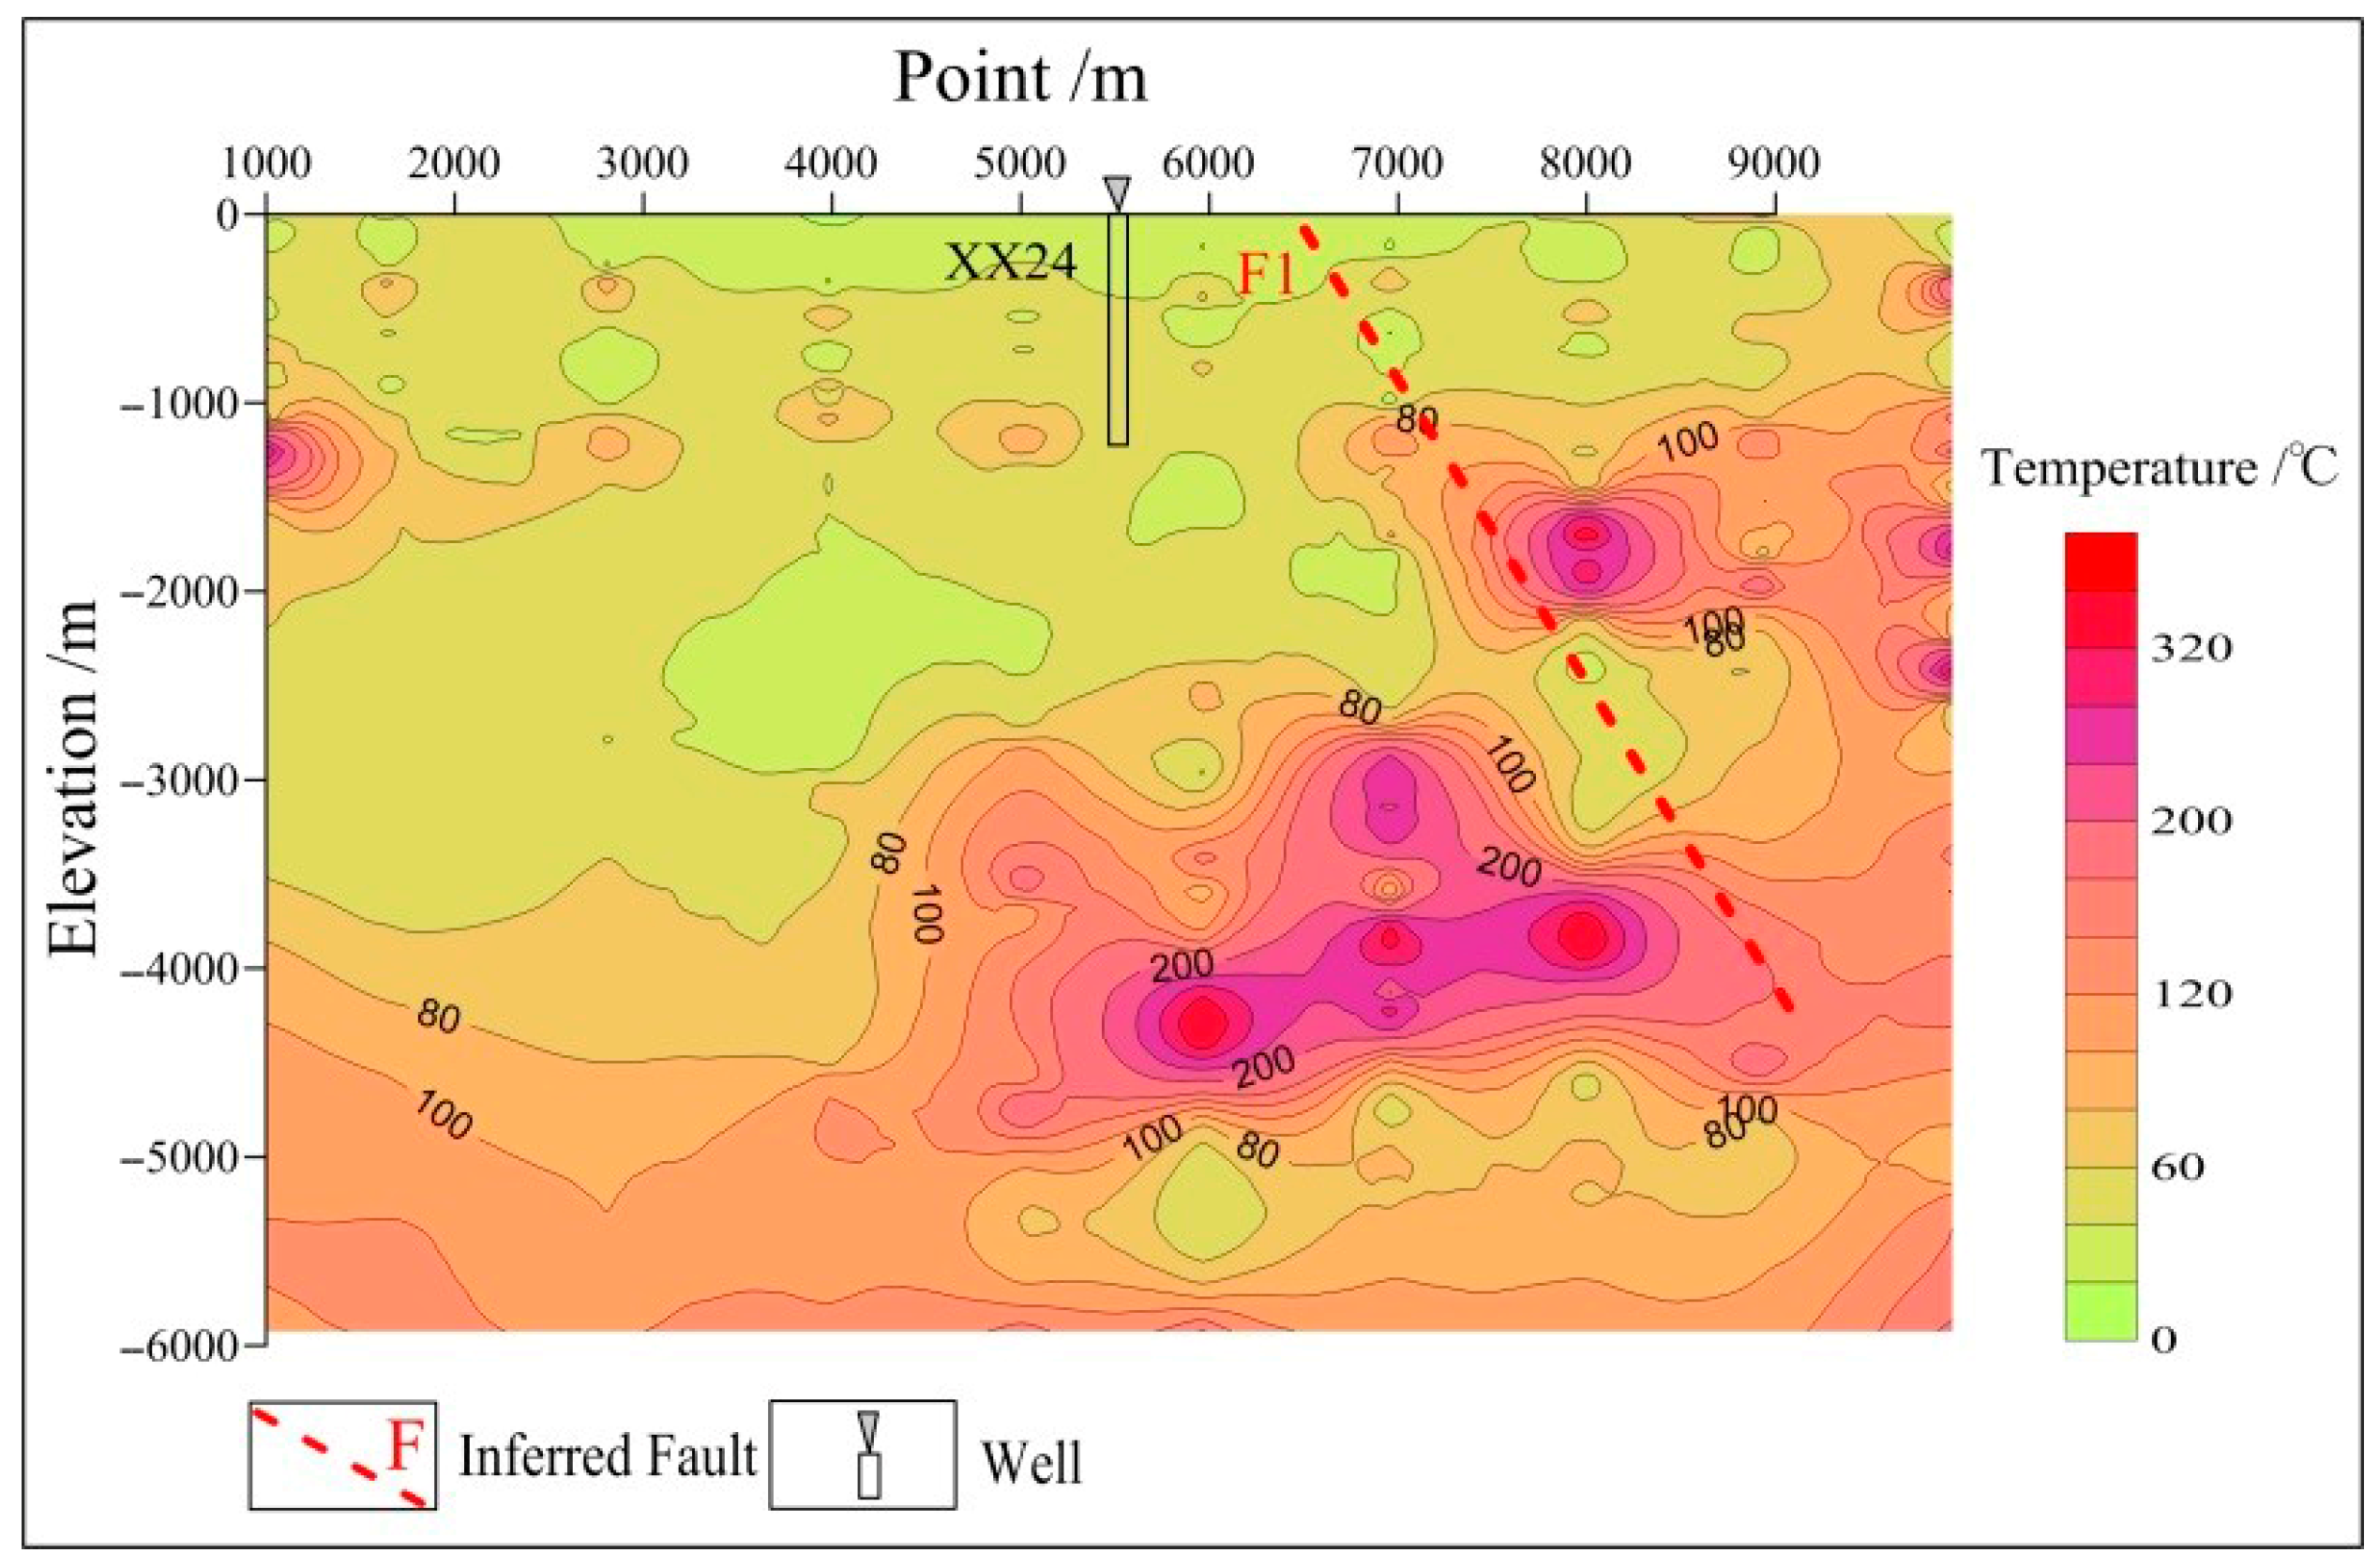
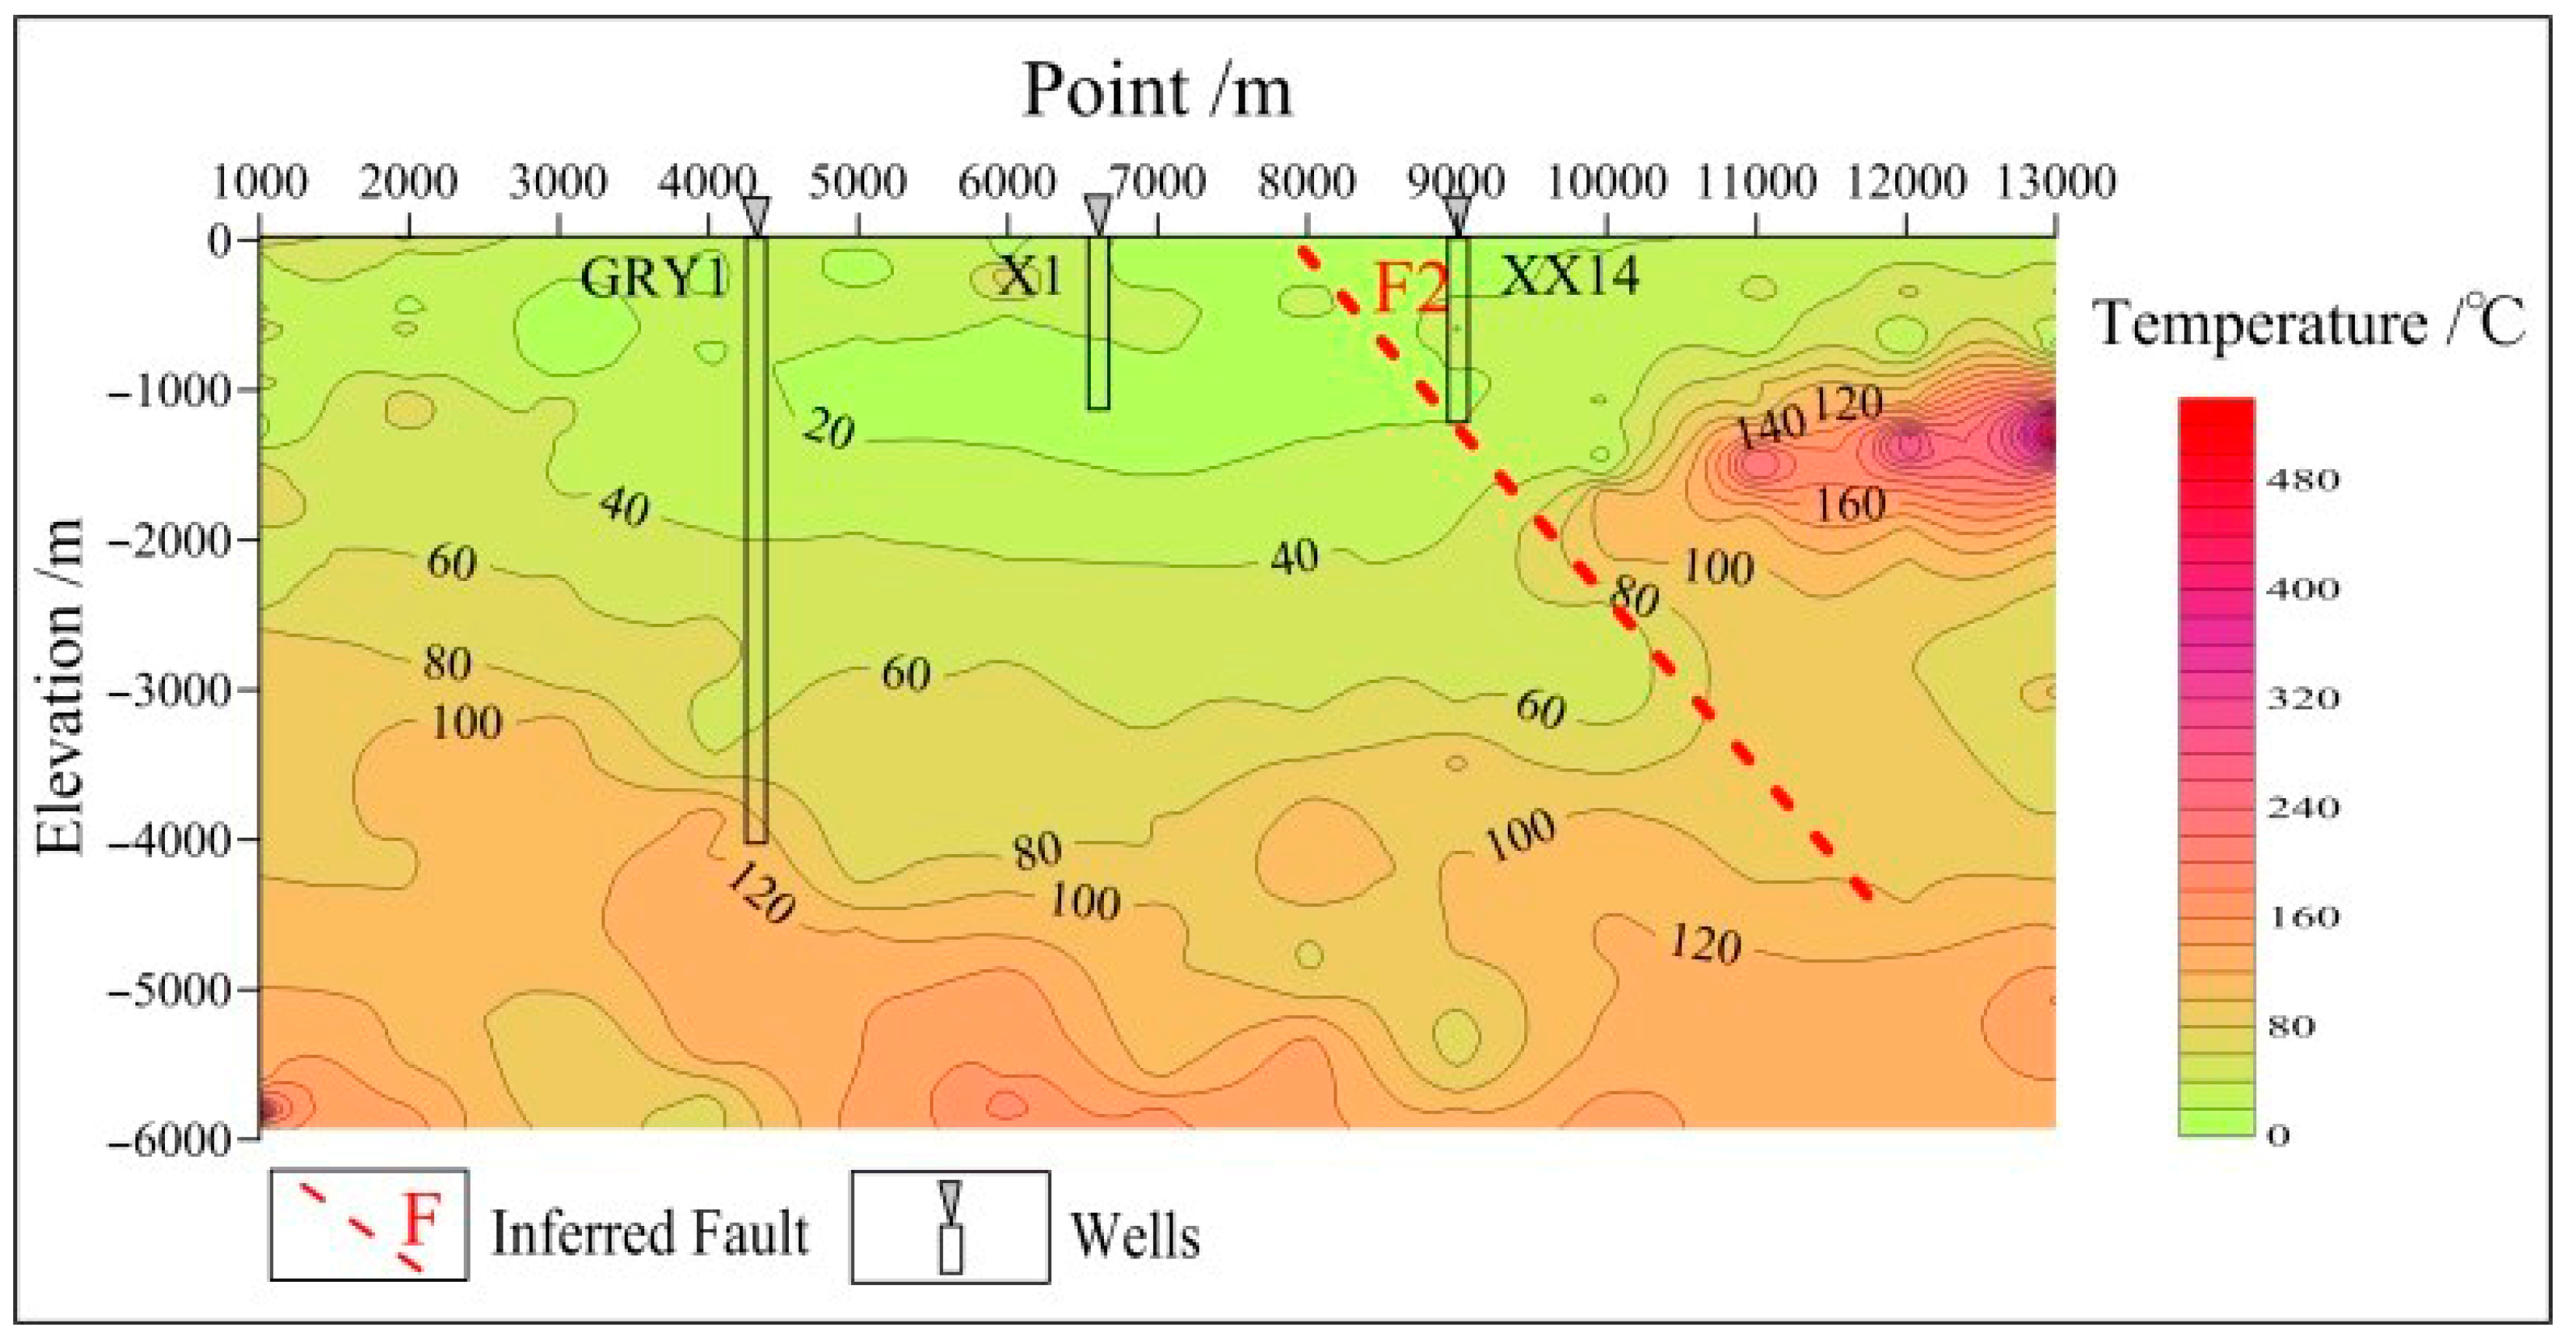
4.2.2. Resistivity-Based Inversion of the Geothermal Reservoir’s Temperature
4.2.3. Calculation of Geothermal Reservoirs Using Geothermometers
- (1)
- Geochemical geothermometry
- (2)
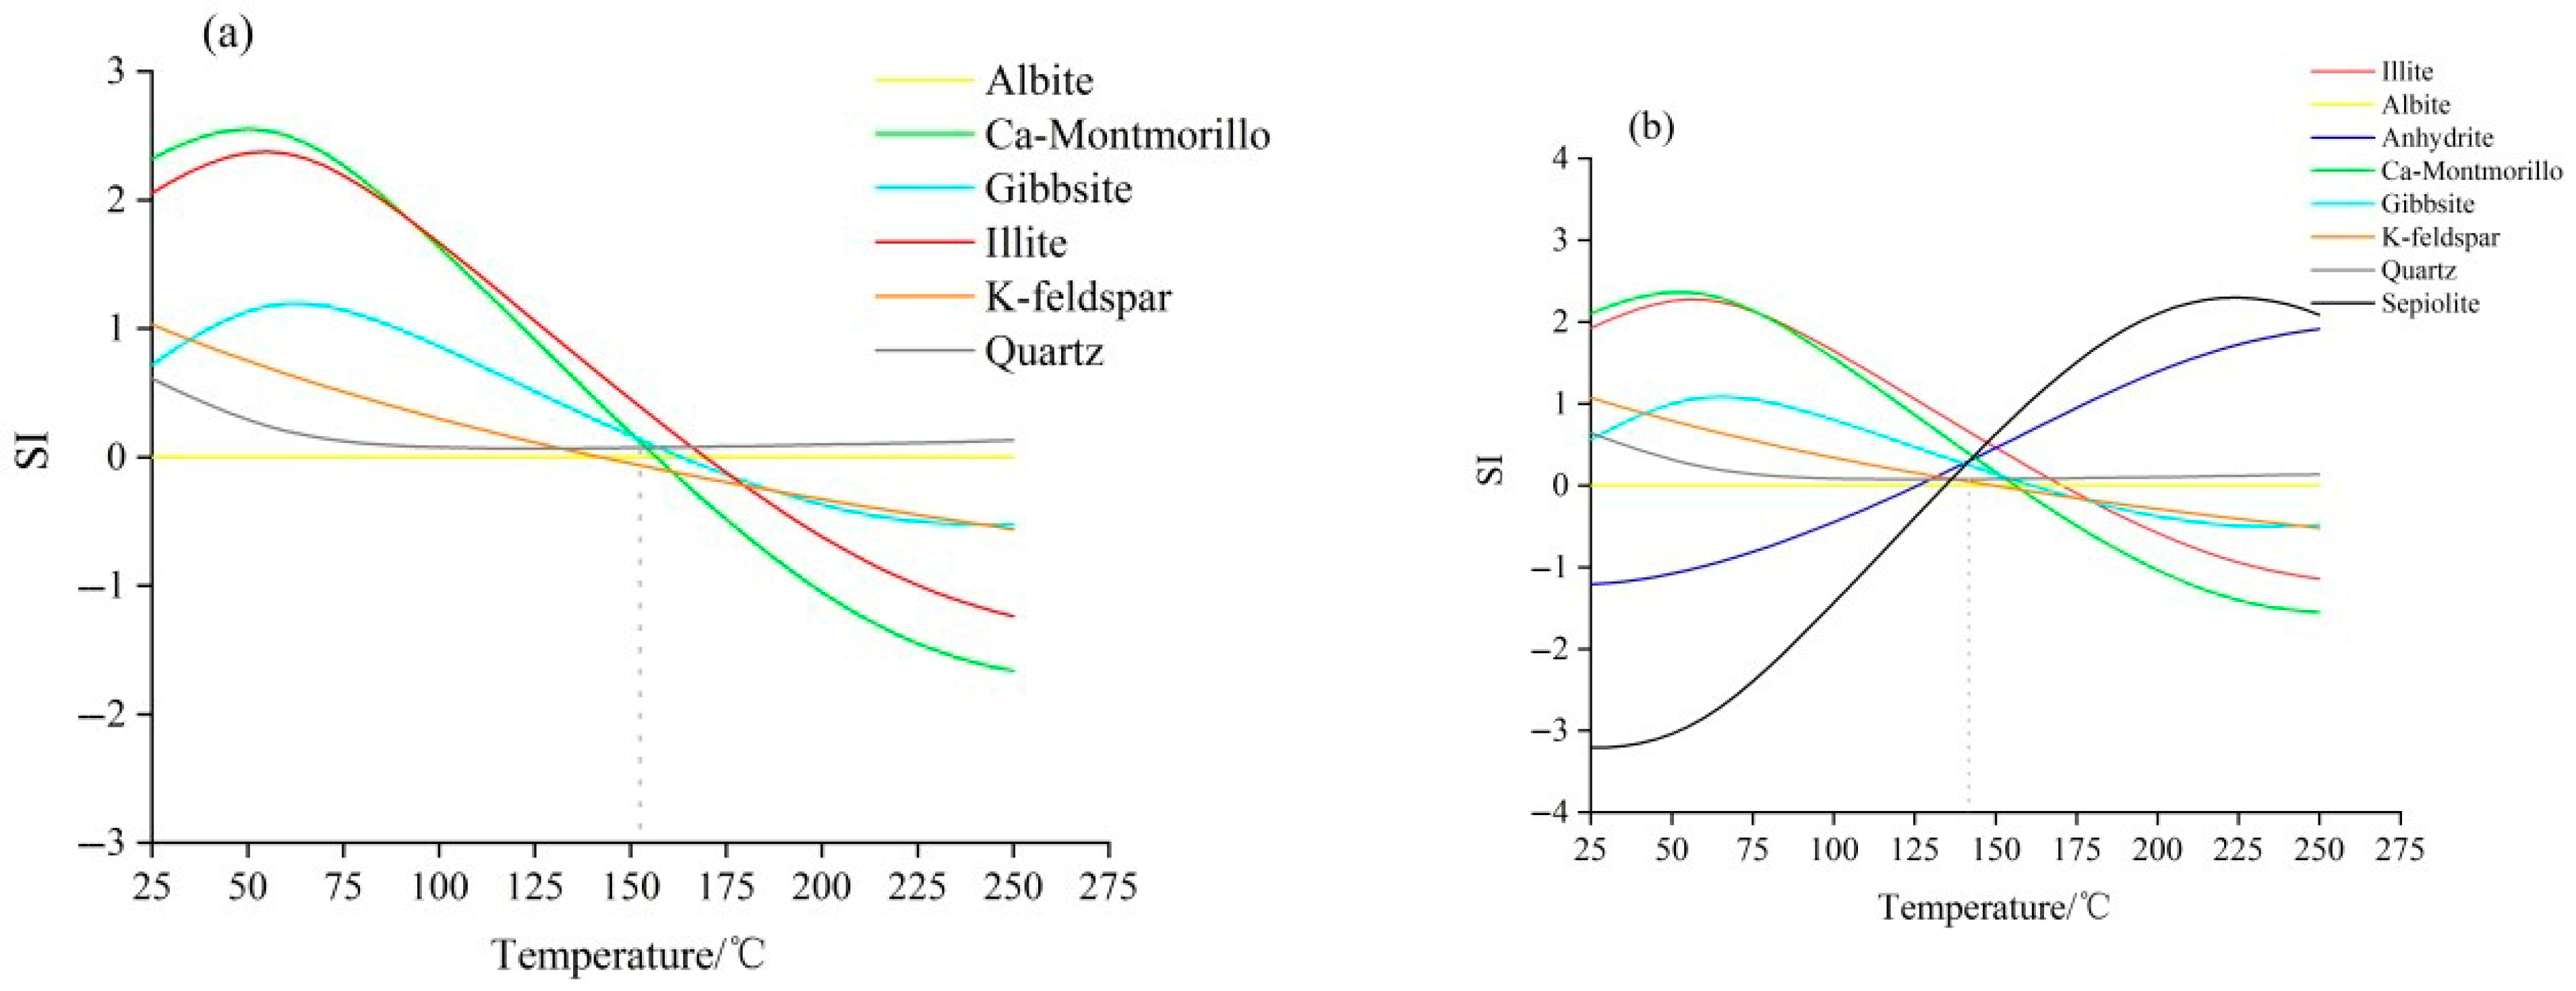
- Multiple mineral equilibrium diagrams
4.3. Circulation Depth of Geothermal Water
5. Conclusions and Suggestions
5.1. Conclusions
- (1)
- This comprehensive analysis based on magnetotelluric sounding and drilling data revealed that the geothermal reservoirs in the Xianxian geothermal field mainly include porous Neogene geothermal reservoirs and bedrock geothermal reservoirs with karst fissures. The latter are the most promising geothermal reservoirs in the study area and can be divided into the geothermal reservoirs of the Jixianian Wumishan and Gaoyuzhuang formations. The geothermal reservoirs of the Jixianian Wumishan formation have a top depth of 1100–1500 m and a thickness of 700–1700 m, and the ratio of the thickness of the geothermal reservoirs to the formation is 15–30%. They mainly consist of dolomites and banded chert-rich dolomites. The geothermal reservoirs of the Jixianian Gaoyuzhuang formation have a top depth of 3700–4000 m, the thickness ratio of the geothermal reservoir to the formation is 15–30%, and the maximum drilled thickness is 400 m. They consist of dolomites and banded chert-rich dolomites.
- (2)
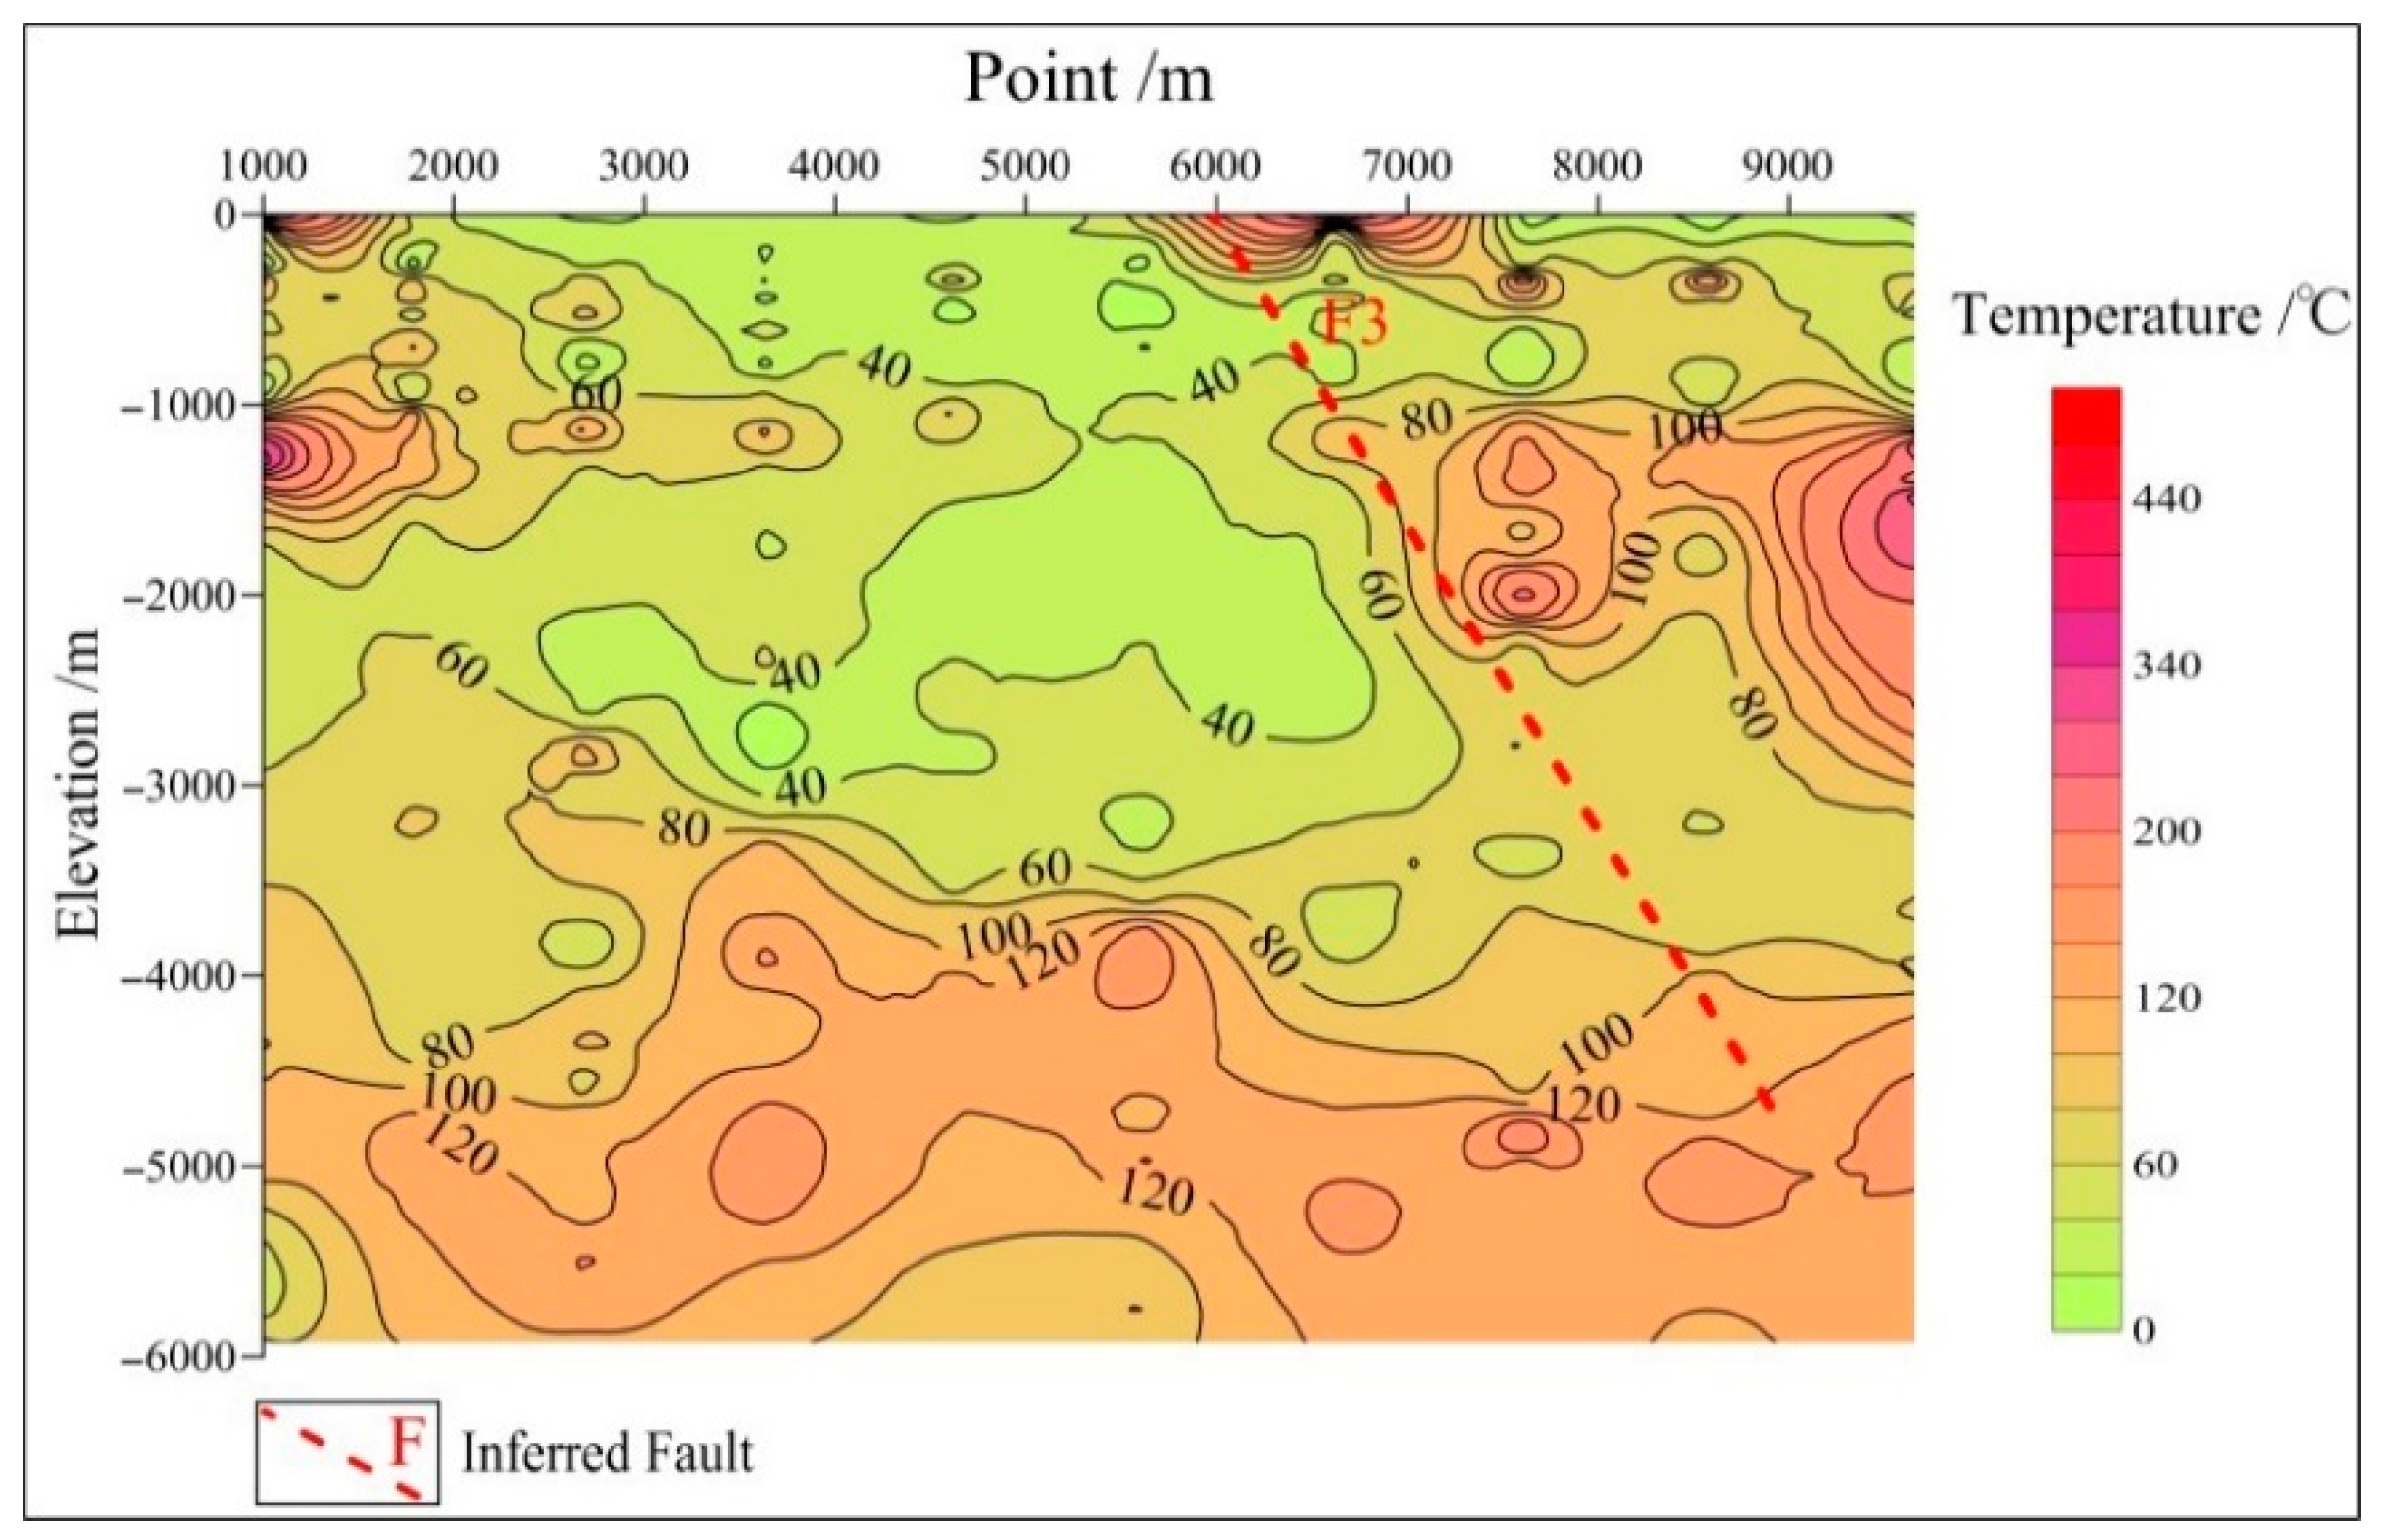
- This study established the MT resistivity–temperature relationship to obtain the field distribution of the temperature of geothermal reservoirs in the geothermal fields in sedimentary basins through inversion. The estimated field distribution of temperature is roughly consistent with the temperature measured in boreholes and the temperature estimated using the quartz geothermometer with no steam loss, the K-Mg geothermometer, and multiple mineral equilibrium diagrams, indicating that the resistivity–temperature inversion methodology is reliable. The geothermal reservoirs of the Xianxian geothermal field primarily have medium and low temperatures of 138–160 °C and the circulation depth of the geothermal water is 5873 m.
5.2. Suggestions
- (1)
- To verify the accuracy of the temperature distribution of deep strata calculated using the MT resistivity–temperature inversion method, it is necessary to obtain more data on the lithology and resistivity of the strata through additional deep geothermal drilling. The purpose is to establish a more detailed and reliable formation resistivity-based inversion relationship and improve the accuracy and reliability of the resistivity–temperature inversion method.
- (2)
- The formation and evolution processes of the lithology and its geochemical features are critical to establishing the relationships among resistivity, fluid geochemistry, and the formation’s temperature. In-depth research on these processes could shed light on the intrinsic relationships among the formation’s lithology and resistivity, fluid geochemistry, and the geothermal reservoir’s temperature. The purpose is to establish a more scientific, reliable, and comprehensive inversion method for deep geothermal reservoirs; explore the attributes of deep geothermal reservoirs from the surface more economically and effectively; and reduce the risks and costs of the exploration, development, and utilization of geothermal resources.
Author Contributions
Funding
Institutional Review Board Statement
Informed Consent Statement
Data Availability Statement
Conflicts of Interest
References
- Lin, W.; Liu, Z.; Wang, W.; Wang, G. The assessment of geothermal resources potential of China. Geol. China 2013, 40, 10. [Google Scholar] [CrossRef]
- Wang, G.; Zhang, W.; Liang, J.; Lin, W.; Liu, Z.; Wang, W. Evaluation of Geothermal Resourees Potential in China. Acta Geol. Sin. Engl. 2017, 38, 12. [Google Scholar] [CrossRef]
- Lin, W.; Wang, G.; Gan, H.; Zhang, S.; Zhao, Z.; Yue, G.; Long, X. Heat source model for Enhanced Geothermal Systems (EGS) under different geological conditions in China. Gondwana Res. 2022, 40, 312–321. [Google Scholar] [CrossRef]
- Wang, Y.; Liu, Y.G.; Bian, K.; Zhang, H.L.; Qin, S.J.; Wang, X.J. Seepage-heat transfer coupling process of low temperature return water injected into geothermal reservoir in carbonate rocks in Xian County, China. J. Groundw. Sci. Eng. 2020, 8, 305–314. [Google Scholar]
- Wang, Y.; Liu, J.; Liu, R.; Guo, R.; Feng, D. Frequency-domain magnetotelluric footprint analysis for 3D earths. J. Geophys. Eng. 2019, 16, 1151–1163. [Google Scholar] [CrossRef] [Green Version]
- Blasco, M.; Auque, L.F.; Gimeno, M.J.; Acero, P.; Gomez, J.; Asta, M.P. Mineral equilibria and thermodynamic uncertainties in the geothermometrical characterisation of carbonate geothermal systems of low temperature. The case of the Alhama-Jaraba system (Spain). Geothermics 2019, 78, 170–182. [Google Scholar] [CrossRef]
- Long, X.; Liu, F.; Xie, H.; Lin, W.; Liu, Y.; Li, C. Seismic Geothermal Resource Exploration Based on CPU/GPU Collaborative Parallel Prestack Time Migration. Acta Geol. Sin. Engl. 2022. [Google Scholar] [CrossRef]
- Long, X.; Xie, H.; Deng, X.; Wen, X.; Ou, J.; Ou, R.; Wang, J.; Liu, F. Geological and Geochemical Characteristics of the Geothermal Resources in Rucheng. China. Lithosphere 2021, 2021, 1357568. [Google Scholar] [CrossRef]
- Zhao, G.; Liu, Y.; Hu, L.; Bian, K.; Qin, S.; Liu, F.; Hu, J. Inversion of the Temperature and Depth of Geothermal Reservoirs Using Controlled Source Audio Frequency Magnetotellurics and Hydrogeochemical Method. Front. Earth Sci. 2022, 10, 858748. [Google Scholar] [CrossRef]
- Guo, Q.; Wang, Y.; Wei, L. Major hydrogeochemical processes in the two reservoirs of the Yangbajing geothermal field, Tibet, China. J. Volcanol. Geotherm. Res. 2007, 166, 255–268. [Google Scholar] [CrossRef]
- Gazis, C.; Taylor, H.P.; Hon, K.; Tsvetkov, A. Oxygen isotopic and geochemical evidence for a short-lived, high-temperature hydrothermal event in the Chegem caldera, Caucasus Mountains, Russia. J. Volcanol. Geotherm. Res. 1996, 73, 213–244. [Google Scholar] [CrossRef]
- Dobrzyński, D.; Duliński, M.; Birski, Ł.; Barrett, J. Origin of the chemical composition of So Francisco ultra-fresh thermal water (Itabira region, Minas Gerais, Brazil). Appl. Geochem. 2021, 134, 105090. [Google Scholar] [CrossRef]
- Afandi, A.; Lusi, N.; Febriani, S.D.A. Prediction of the Distribution of Geothermal Sources based on the Geothermal Temperature Gradient in the Blawan Bondowoso. Case Stud. Therm. Eng. 2021, 25, 100931. [Google Scholar] [CrossRef]
- Anuar, M.; Arifin, M.H.; Baioumy, H.; Nawawi, M. A geochemical comparison between volcanic and non-volcanic hot springs from East Malaysia: Implications for their origin and geothermometry. J. Asian Earth Sci. 2021, 217, 104843. [Google Scholar] [CrossRef]
- Blasco, M.; Auqué, L.; Gimeno, M.J.; Acero, P.; Asta, M.P. Geochemistry, geothermometry and influence of the concentration of mobile elements in the chemical characteristics of carbonate-evaporitic thermal systems. The case of the Tiermas geothermal system (Spain). Chem. Geol. 2017, 466, 696–709. [Google Scholar] [CrossRef] [Green Version]
- Weng, A.H.; Si-Rui, L.I.; Yang, Y.; Da-Jun, L.I.; Jian-Ping, L.I.; Shi-Wen, L.I. 3D inversion of surface magnetotelluric resistivity data using nonlinear conjugate gradients combined with the impressing method. Chin. J. Geophys. 2017, 60, 1903–1917. [Google Scholar] [CrossRef]
- Hu, X.; Peng, R.; Wu, G.; Wang, W.; Han, B. Mineral Exploration using CSAMT data: Application to Longmen region metallogenic belt, Guangdong Province, China. Geophysics 2013, 78, B111–B119. [Google Scholar] [CrossRef]
- Wu, G.; Hu, X.; Huo, P.; Zhou, X. Geophysical exploration for geothermal resources: An application of MT and CSAMT in Jiangxia, Wuhan, China. J. Earth Sci. 2012, 23, 757–767. [Google Scholar] [CrossRef]
- Zhang, Q.J.; Liu, R.D.; Lu, G.F. The method for forecasting temperature of the geothermal field. Geophys. Geochem. Explor. 2011, 35, 325–328. [Google Scholar]
- Meng, Y.S.; Yao, C.L.; Liu, R.D.; Huang, L.J. The prediction of the geothermal field temperature by means of resisitivity inversion. Geophys. Geochem. Explor. 2011, 35, 57–58. [Google Scholar] [CrossRef]
- Campbell, R.B.; Bower, C.A.; Richards, L.A. Change of Electrical Conductivity With Temperature and the Relation of Osmotic Pressure to Electrical Conductivity and Ion Concentration for Soil Extracts1. Soil Sci. Soc. Am. J. 1949, 13, 66–69. [Google Scholar] [CrossRef]
- Hidayatullah, M.S.; Triatamaputra, G.; Giffary, R.F.; Wicaksono, G.B.; Mardiana, U. Comparison of Geothermal Reservoir Characteristics, Geothermometers, and Heat Loss in Sukarame, West Java Region with Banjarnegara, Central Java Region Based on Geochemical Data Analysis. IOP Conf. Ser. Earth Environ. Sci. 2019, 248, 012076. [Google Scholar] [CrossRef]
- Li, J.; Sagoe, G.; Wang, X.; Yang, Z. Assessing the suitability of lithium-related geothermometers for estimating the temperature of felsic rock reservoirs. Geothermics 2021, 89, 101950. [Google Scholar] [CrossRef]
- Giggenbach, W.F. Geothermal solute equilibria. Derivation of Na-K-Mg-Ca geoindicators. Geochim. Cosmochim. Acta 1988, 52, 2749–2765. [Google Scholar] [CrossRef]
- Pang, Z.H.; Reed, M. Theoretical chemical geothermometry on geothermal waters: Problems and methods. Geochem. Cosmochim. Acta 1998, 62, 1083–1091. [Google Scholar] [CrossRef]
- Spycher, N.; Peiffer, L.; Sonnenthal, E.L.; Saldi, G.; Reed, M.H.; Kennedy, B.M. Integrated multicomponent solute geothermometry. Geothermics 2014, 51, 113–123. [Google Scholar] [CrossRef]
- Pandarinath, K.; Dominguez-Dominguez, H. Evaluation of the solute geothermometry of thermal springs and drilled wells of La Primavera (Cerritos Colorados) geothermal field, Mexico: A geochemometrics approach. J. S. Am. Earth Sci. 2015, 62, 109–124. [Google Scholar] [CrossRef]
- Jácome-Paz, M.P.; Pérez-Zárate, D.; Prol-Ledesma, R.M.; González- Romo, I.A.; Rodríguez-Díaz, A. Geochemical Exploration in Mesillas geothermal area, Nayarit, Mexico. Appl. Geochem. 2022, 143, 105376. [Google Scholar] [CrossRef]
- Permadi, A.N.; Akbar, A.M.; Wildan, D.; Sobirin, R.; Supriyant. Subsurface modeling of geothermal manifestation in mt. endut based on vertical electrical sounding (ves) method. AIP Conf. Proc. 2017, 1862, 1–5. [Google Scholar] [CrossRef] [Green Version]
- Shah, M.; Sircar, A.; Shaikh, N.; Patel, K.; Sharma, D.; Vaidya, D. Comprehensive geochemical/hydrochemical and geo-thermometry analysis of Unai geothermal field, Gujarat, India. Acta Geochim. 2019, 38, 14. [Google Scholar] [CrossRef]
- Sun, H.; Feng, M.; Lin, W.; Zhao, L.; Wang, G.; Nan, D. Geochemical Characteristics and Geothermometer Application in High Temperature Geothermal Field in Tibet. Geol. Sci. Technol. Inf. 2015, 3, 171–177. [Google Scholar]
- Verma, S.P.; Dulski, P.; Alvarado, I.; Pandarinath, K. Mineralogical and geochemical effects due to hydrothermal alteration in the Los Azufres geothermal field, Mexico. Rev. Mex. Cienc. Geológicas 2007, 24, 15–24. [Google Scholar] [CrossRef]
- Barcelona, H.; Lelli, M.; Norelli, F.; Peri, G.; Winocur, D. Hydrochemical and geological model of the Baitos-Gollete geothermal system in Valle del Cura, main Andes Cordillera of San Juan, Argentina. J. S. Am. Earth Sci. 2019, 96, 102378. [Google Scholar] [CrossRef]
- Xu, P.; Li, M.; Qian, H.; Zhang, Q.; Liu, F.; Hou, K. Hydrochemistry and geothermometry of geothermal water in the central Guanzhong Basin, China: A case study in Xi’an. Environ. Earth Sci. 2019, 78, 1–20. [Google Scholar] [CrossRef]
- Liu, Y.; Huang, Z.; Wang, Y.; Wang, W.; Wang, J. Thermo-hydro-mechanical Coupling Processes in Carbonate Geothermal Reservoirs and Their Numerical Simulation. Lithosphere 2022, 2021, 9466388. [Google Scholar] [CrossRef]
- Liu, Y.; Liu, G.; Zhao, Z.; Zhang, H. Theoretical model of geothermal tail water reinjection based on an equivalent flow channel model: A case study in Xianxian, North China Plain. Energy Explor. Exploit. 2019, 37, 849–864. [Google Scholar] [CrossRef]
- Liu, Y.; Long, X.; Liu, F. Tracer test and design optimization of doublet system of carbonate geothermal reservoirs. Geothermics 2022, 105, 102533. [Google Scholar] [CrossRef]
- Zhang, J. MT Sounding and Geothermal Resource Assessment in XianXian Convex of Bohai Bay Basin; China University of Geosciences (Beijing): Beijing, China, 2014; Available online: https://kns.cnki.net/KCMS/detail/detail.aspx?dbname=CMFD201801&filename=1017253652.nh (accessed on 16 October 2022).
- Chang, X.W.; Xu, M.; Jiang, L.W.; Li, X.; Zhang, Y.H. Hydrogeochemical Characteristics and Formation of Low-Temperature Geothermal Waters in Mangbang-Longling Area of Western Yunnan, China. Hindawi 2021, 2021, 5527354. [Google Scholar] [CrossRef]
- Arnórsson, S.; Gunnlaugsson, E.; Svavarsson, H. The chemistry of geothermal waters in Iceland. III. Chemical geothermometry in geothermal investigations. Geochim. Cosmochim. Acta 1983, 47, 567–577. [Google Scholar] [CrossRef]
- Fournier, R. Chemical geothermometers and mixing models for geothermal systems. Geothermics 1977, 5, 41–50. [Google Scholar] [CrossRef]
- Bian, K.; Niu, X.J.; Wang, W.M.; Wang, X.J.; Pang, Y.; Panchal, B. Application of geothermal thermometric scale in the study of deep reservoir temperature. Energy Explor. Exploit. 2020, 38, 2618–2630. [Google Scholar] [CrossRef]


| Erathem | System | Series | Formation | Member | Code | Resistivity (Ω·m) | Average Resistivity (Ω·m) |
|---|---|---|---|---|---|---|---|
| Cenozoic | Quaternary | Holocene and Pleistocene | Q | 11.0–29.0 | 17.5 | ||
| Neogene | Pliocene | Minghuazhen | Upper member | Nmupper | 5.87–17.4 | 10.6 | |
| Lower member | Nmlower | 4.35–8.65 | 6.0 | ||||
| Miocene | Guantao | Ng | 3.49–6.20 | 4.46 | |||
| Paleogene | Oligocene | Dongying, Shahejie | Ed + Es | 2.48–5.50 | 4.12 | ||
| Eocene | Kongdian | Ek | 3.60–12.9 | 6.54 | |||
| Mesozoic | Cretaceous, Jurassic, and Triassic | Mz | 6.27–61.6 | 22.2 | |||
| Paleozoic | Permian and Carboniferous | P-C | 17.7–37.2 | 22.7 | |||
| Ordovician | O | 120–470 | 209 | ||||
| Cambrian | ∈ | 33.2–112.5 | 69.5 | ||||
| Middle–Upper Proterozoic | Jixianian and Changchengian | Pt2–3 | 150–1162 | 517 | |||
| Archaeozoic | Ar | 2.8–204,184 | 1398.92 |
| Analysis Item | XXZK1 | XXZK2 | Analysis Item | XXZK1 | XXZK2 |
|---|---|---|---|---|---|
| Na+ | 1798 | 1692 | H2SiO3 | 69.02 | 74.79 |
| K+ | 90.19 | 93.46 | Free CO2 | 30.61 | 23.99 |
| Mg2+ | 38.83 | 42.91 | PH | 7.16 | 7.25 |
| Ca2+ | 183.1 | 196.5 | Mn | 0.064 | 0.104 |
| Fe2+ | - | - | Cu | <0.010 | <0.006 |
| Cl− | 2850 | 2582 | Total Cr | <0.020 | <0.020 |
| SO42− | 500.9 | 537.9 | Ba | 0.150 | 0.116 |
| HCO3− | 347.8 | 353.4 | Li | 3.090 | 2.922 |
| CO32− | 0.00 | 0.00 | Ni | <0.008 | <0.008 |
| F− | 4.59 | 4.43 | Mo | 0.016 | 0.006 |
| NO3− | <0.20 | 35.56 | TDS | 5910 | 5635 |
| Geothermal Well | Temperature of the Geothermal Reservoir (°C) | ||
|---|---|---|---|
| Chalcedony Geothermometer | Quartz Geothermometer with No-Steam Loss | K-Mg Geothermometer | |
| XXZK1 | 75 | 105 | 104 |
| XXZK2 | 79 | 108 | 104 |
Publisher’s Note: MDPI stays neutral with regard to jurisdictional claims in published maps and institutional affiliations. |
© 2022 by the authors. Licensee MDPI, Basel, Switzerland. This article is an open access article distributed under the terms and conditions of the Creative Commons Attribution (CC BY) license (https://creativecommons.org/licenses/by/4.0/).
Share and Cite
Liu, Y.; Wang, G.; Guo, X.; Hu, J.; Wang, J.; Wang, X.; Zhao, G. A Joint Method Based on Geochemistry and Magnetotelluric Sounding for Exploring Geothermal Resources in Sedimentary Basins and Its Application. Water 2022, 14, 3299. https://doi.org/10.3390/w14203299
Liu Y, Wang G, Guo X, Hu J, Wang J, Wang X, Zhao G. A Joint Method Based on Geochemistry and Magnetotelluric Sounding for Exploring Geothermal Resources in Sedimentary Basins and Its Application. Water. 2022; 14(20):3299. https://doi.org/10.3390/w14203299
Chicago/Turabian StyleLiu, Yanguang, Guiling Wang, Xuezhong Guo, Jing Hu, Jianguo Wang, Xiaojun Wang, and Gui Zhao. 2022. "A Joint Method Based on Geochemistry and Magnetotelluric Sounding for Exploring Geothermal Resources in Sedimentary Basins and Its Application" Water 14, no. 20: 3299. https://doi.org/10.3390/w14203299