
Prediction of Wastewater Treatment Plant Performance Using Multivariate Statistical Analysis: A Case Study of a Regional Sewage Treatment Plant in Melaka, Malaysia
 , ,
, ,
Abstract
:1. Introduction
2. Materials and Methods
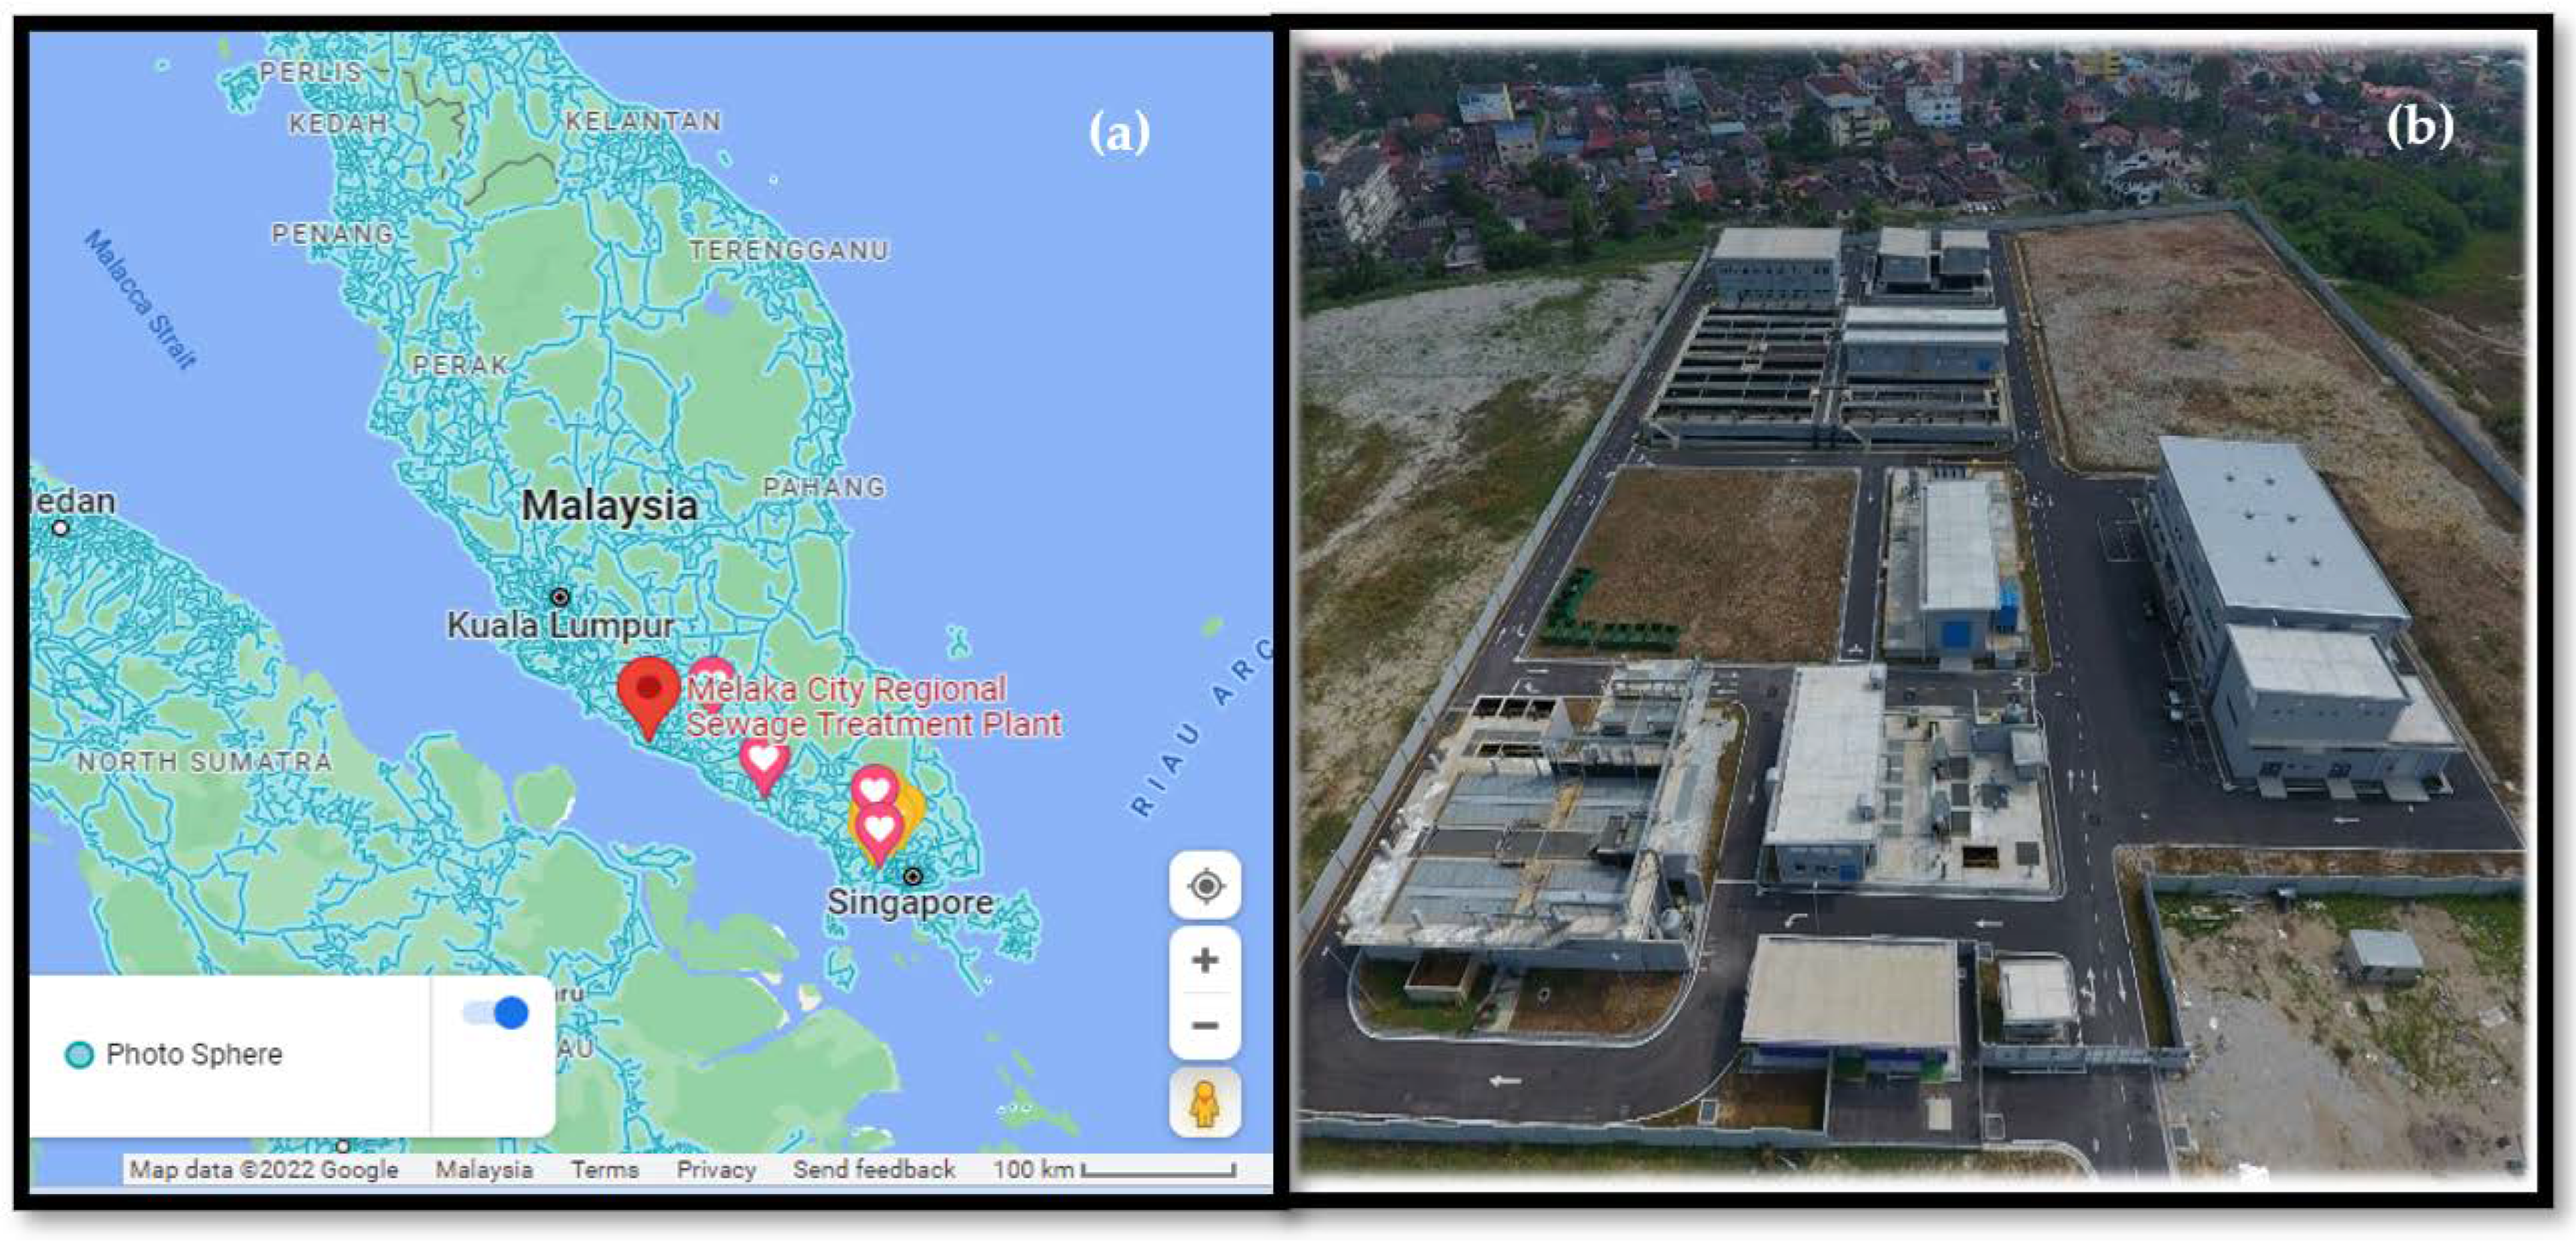
2.1. Site Description
2.2. Collecting Data
2.3. Wastewater Quality Index (WWQI)
2.4. Principal Component Analysis (PCA)
2.5. Multiple Linear Regression Analysis (MLR)
3. Results
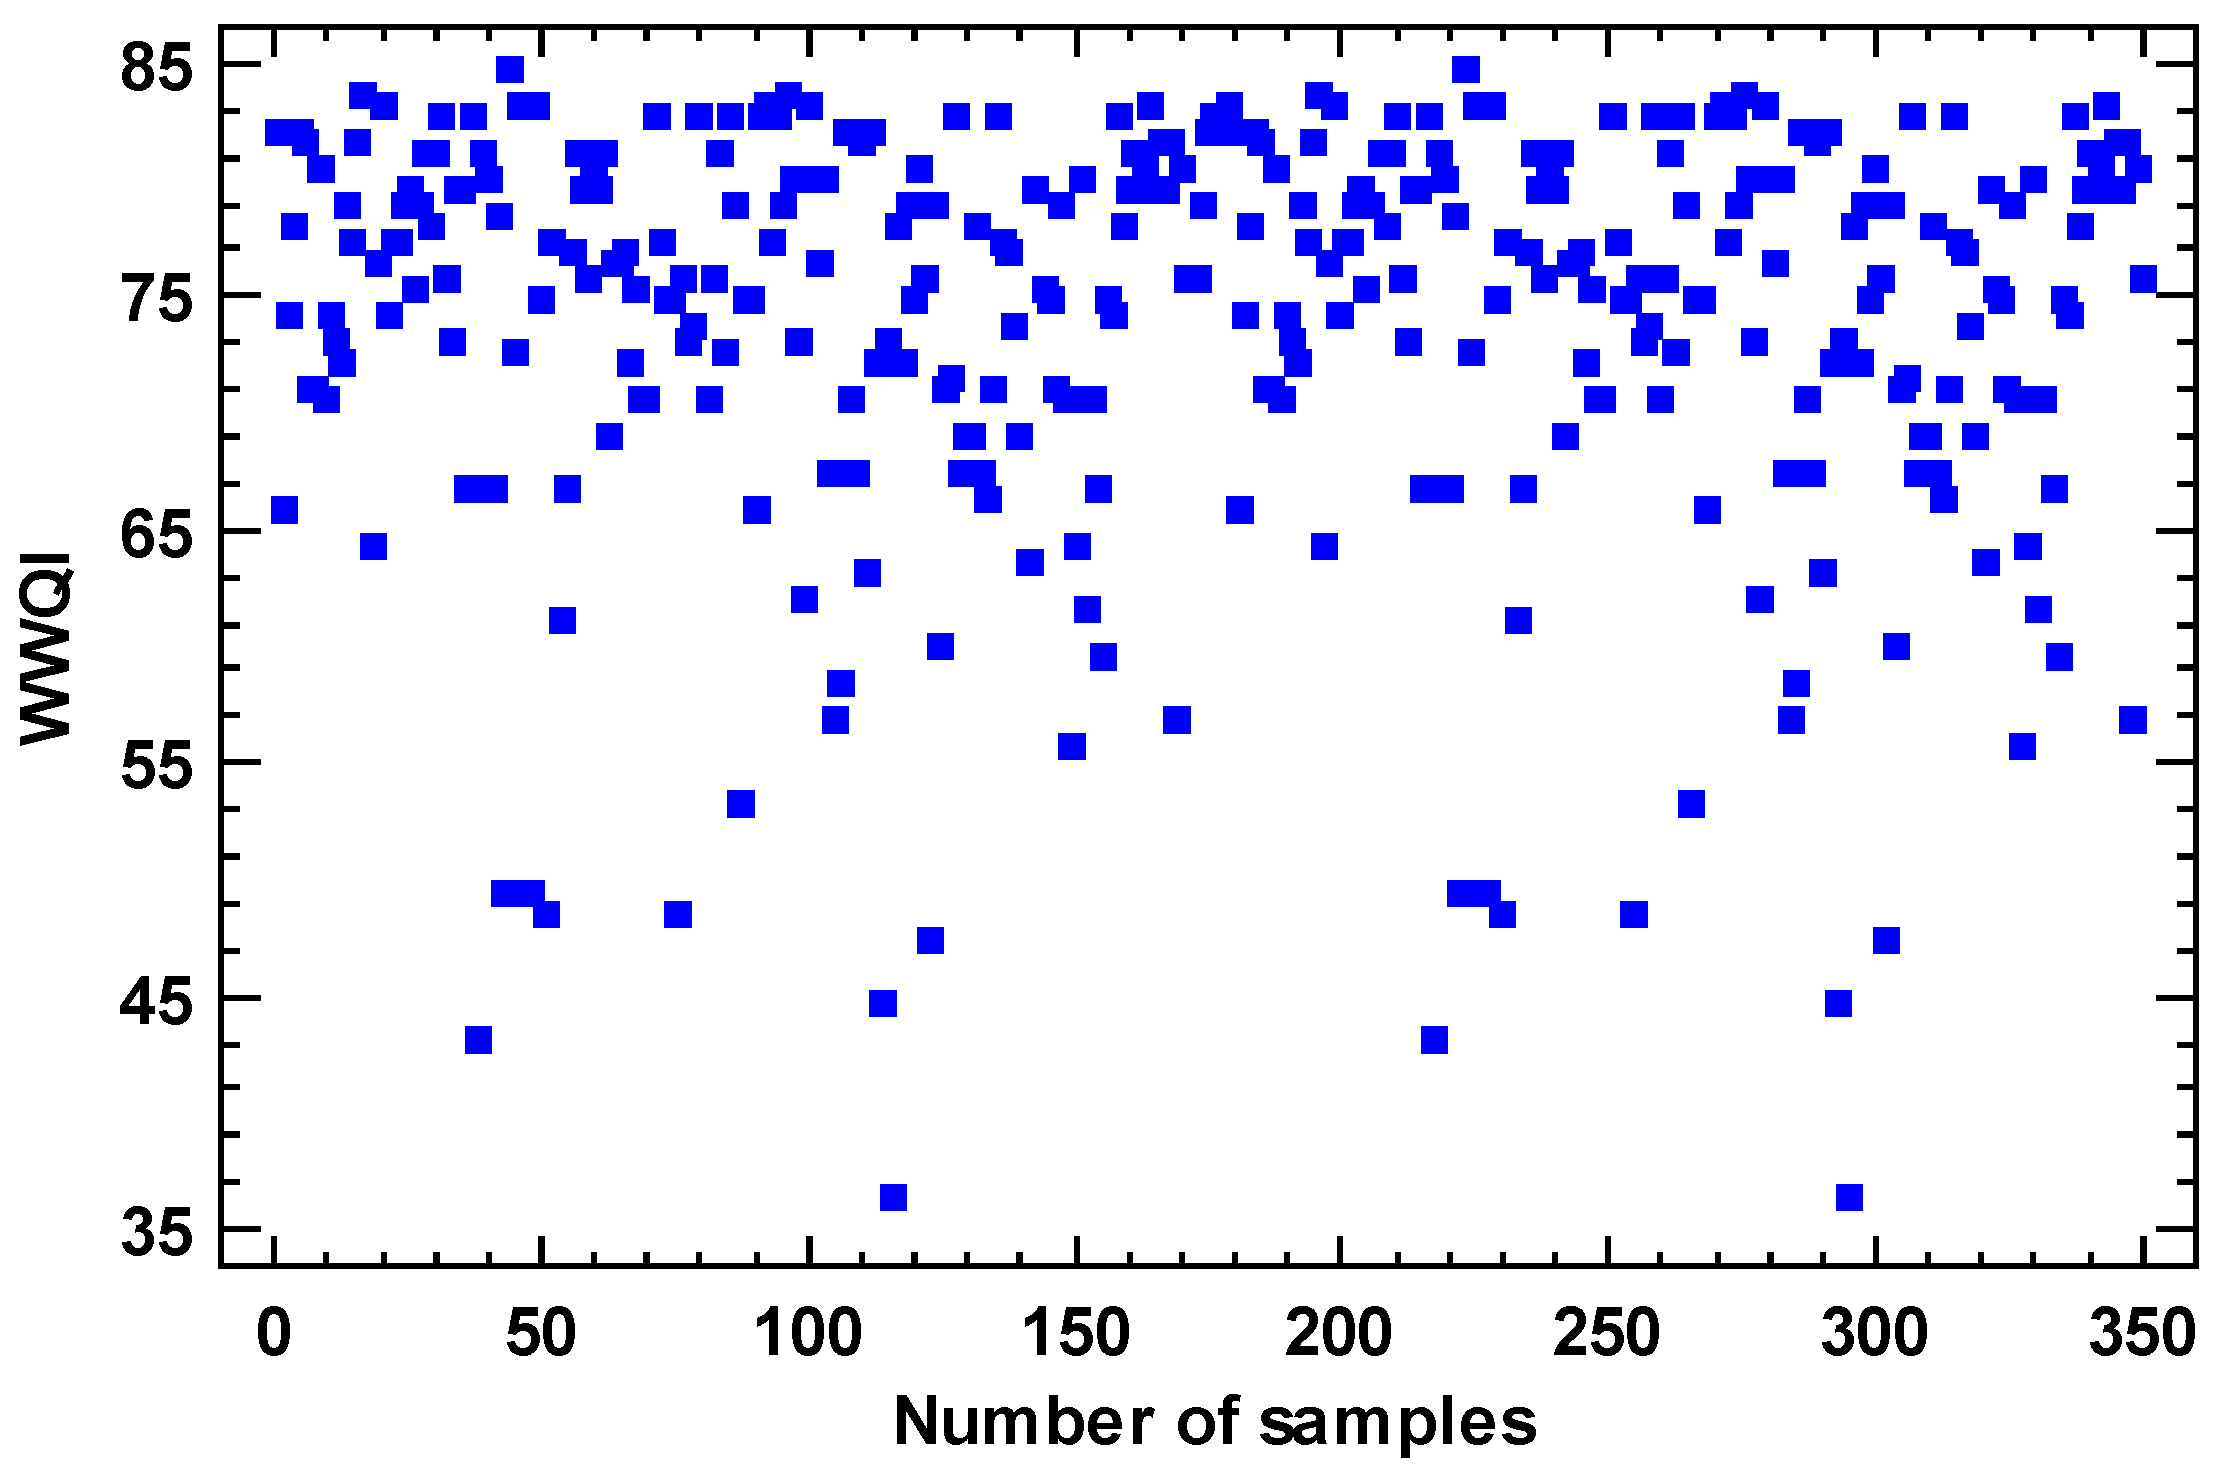
3.1. Wastewater Quality Index (WWQI)
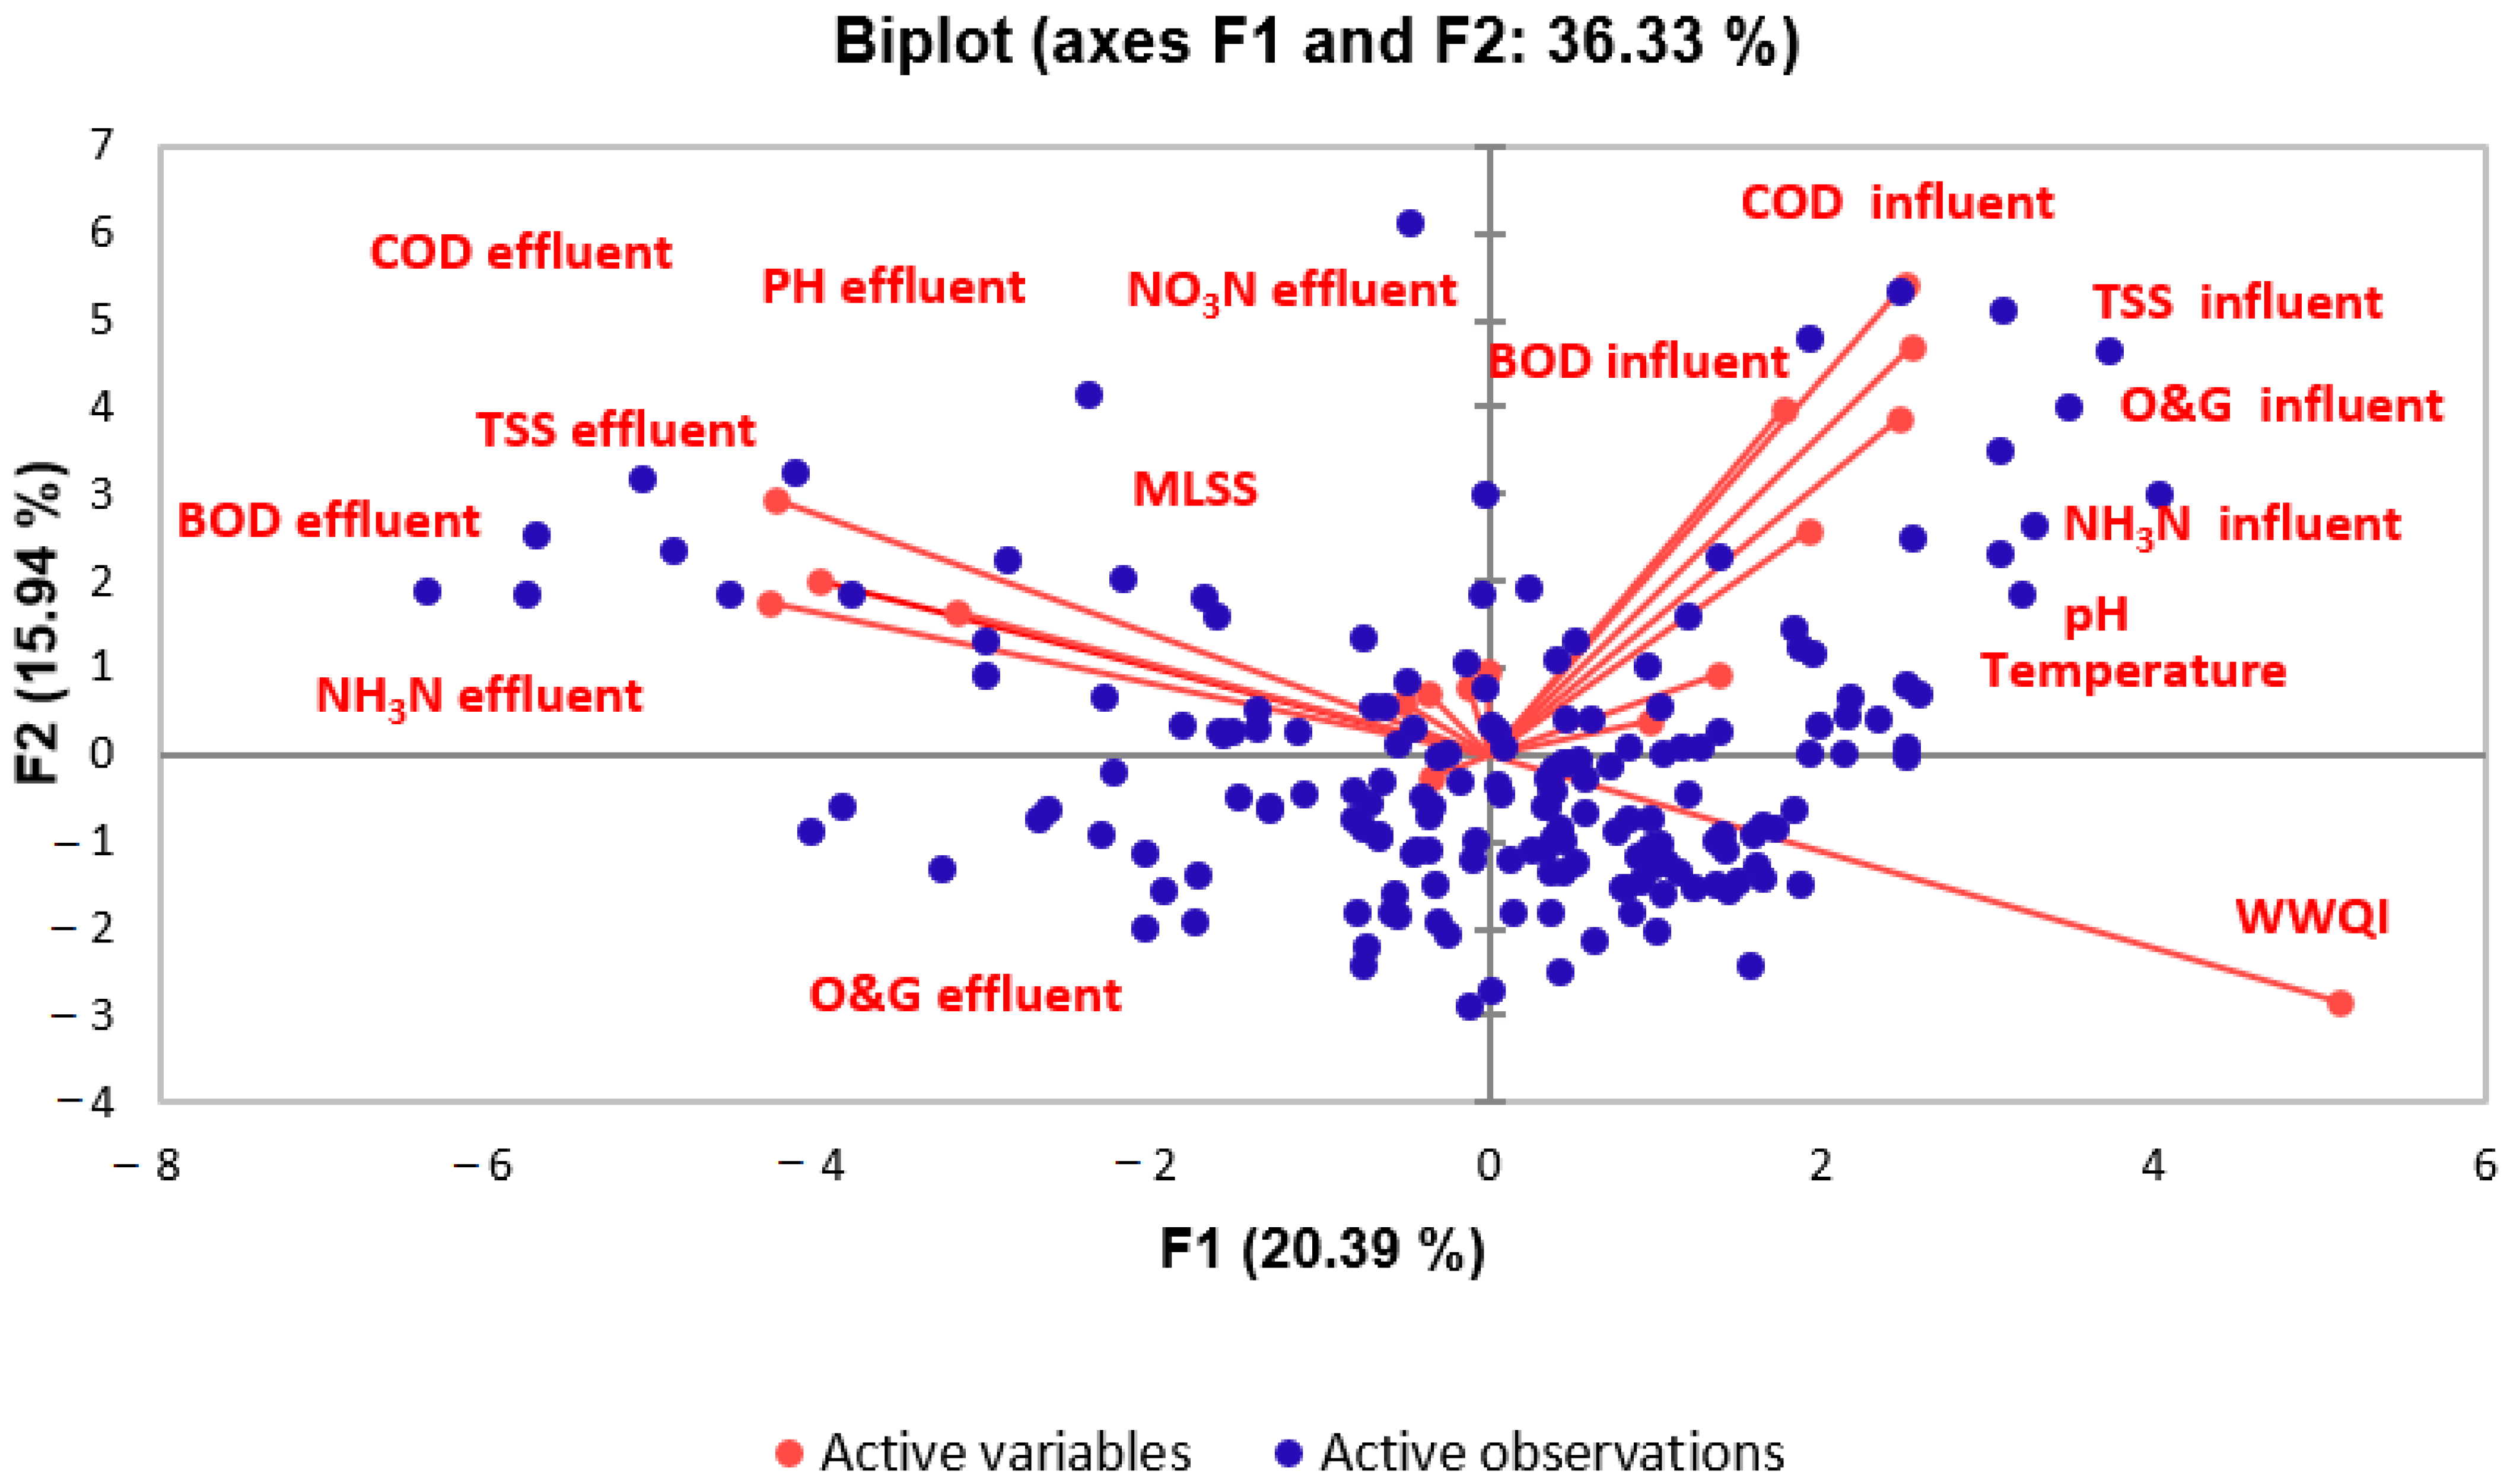
3.2. Principal Component Analysis (PCA)
3.3. Multiple Linear Regression (MLR)
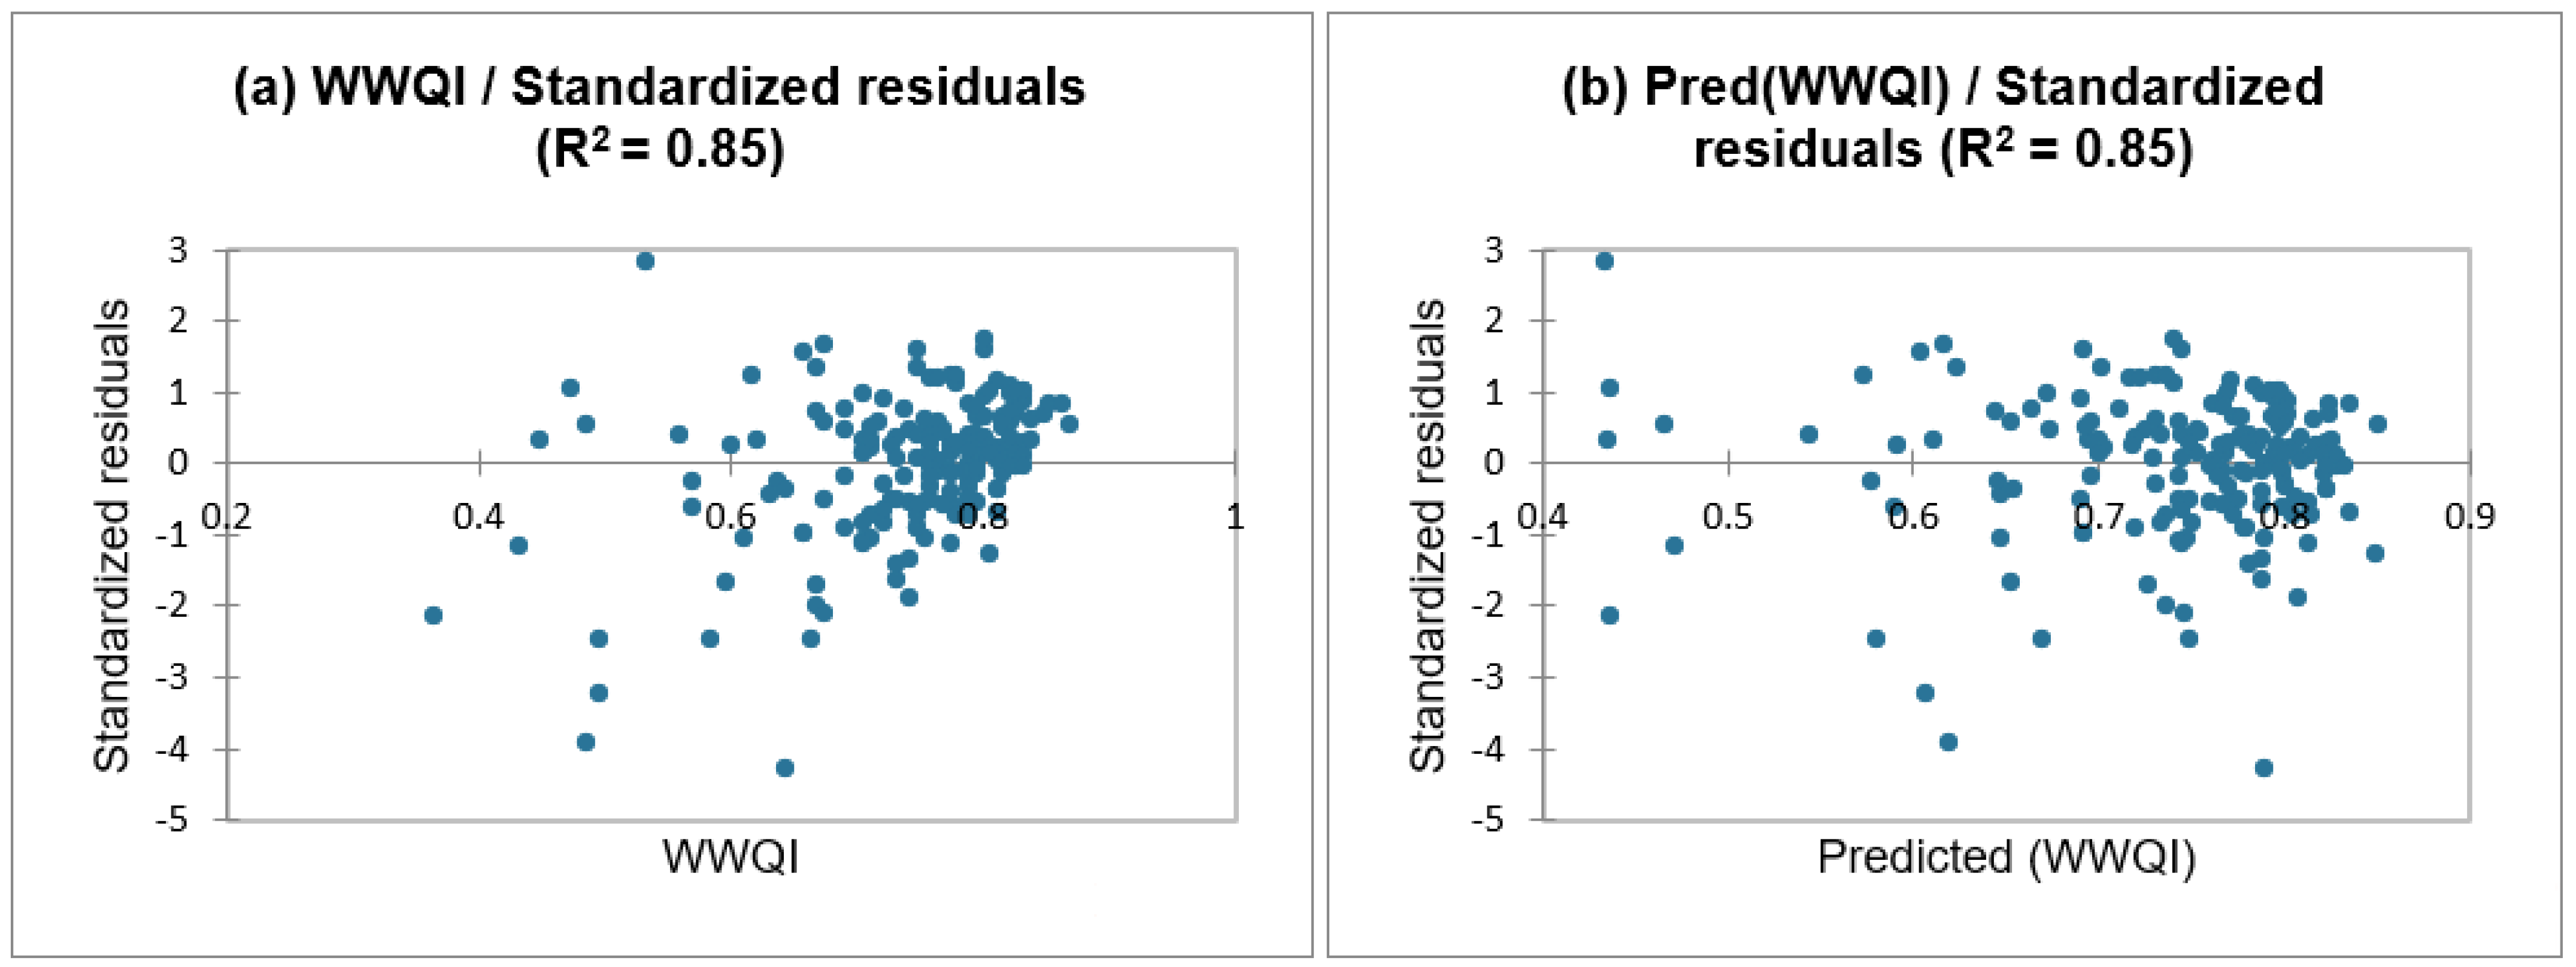
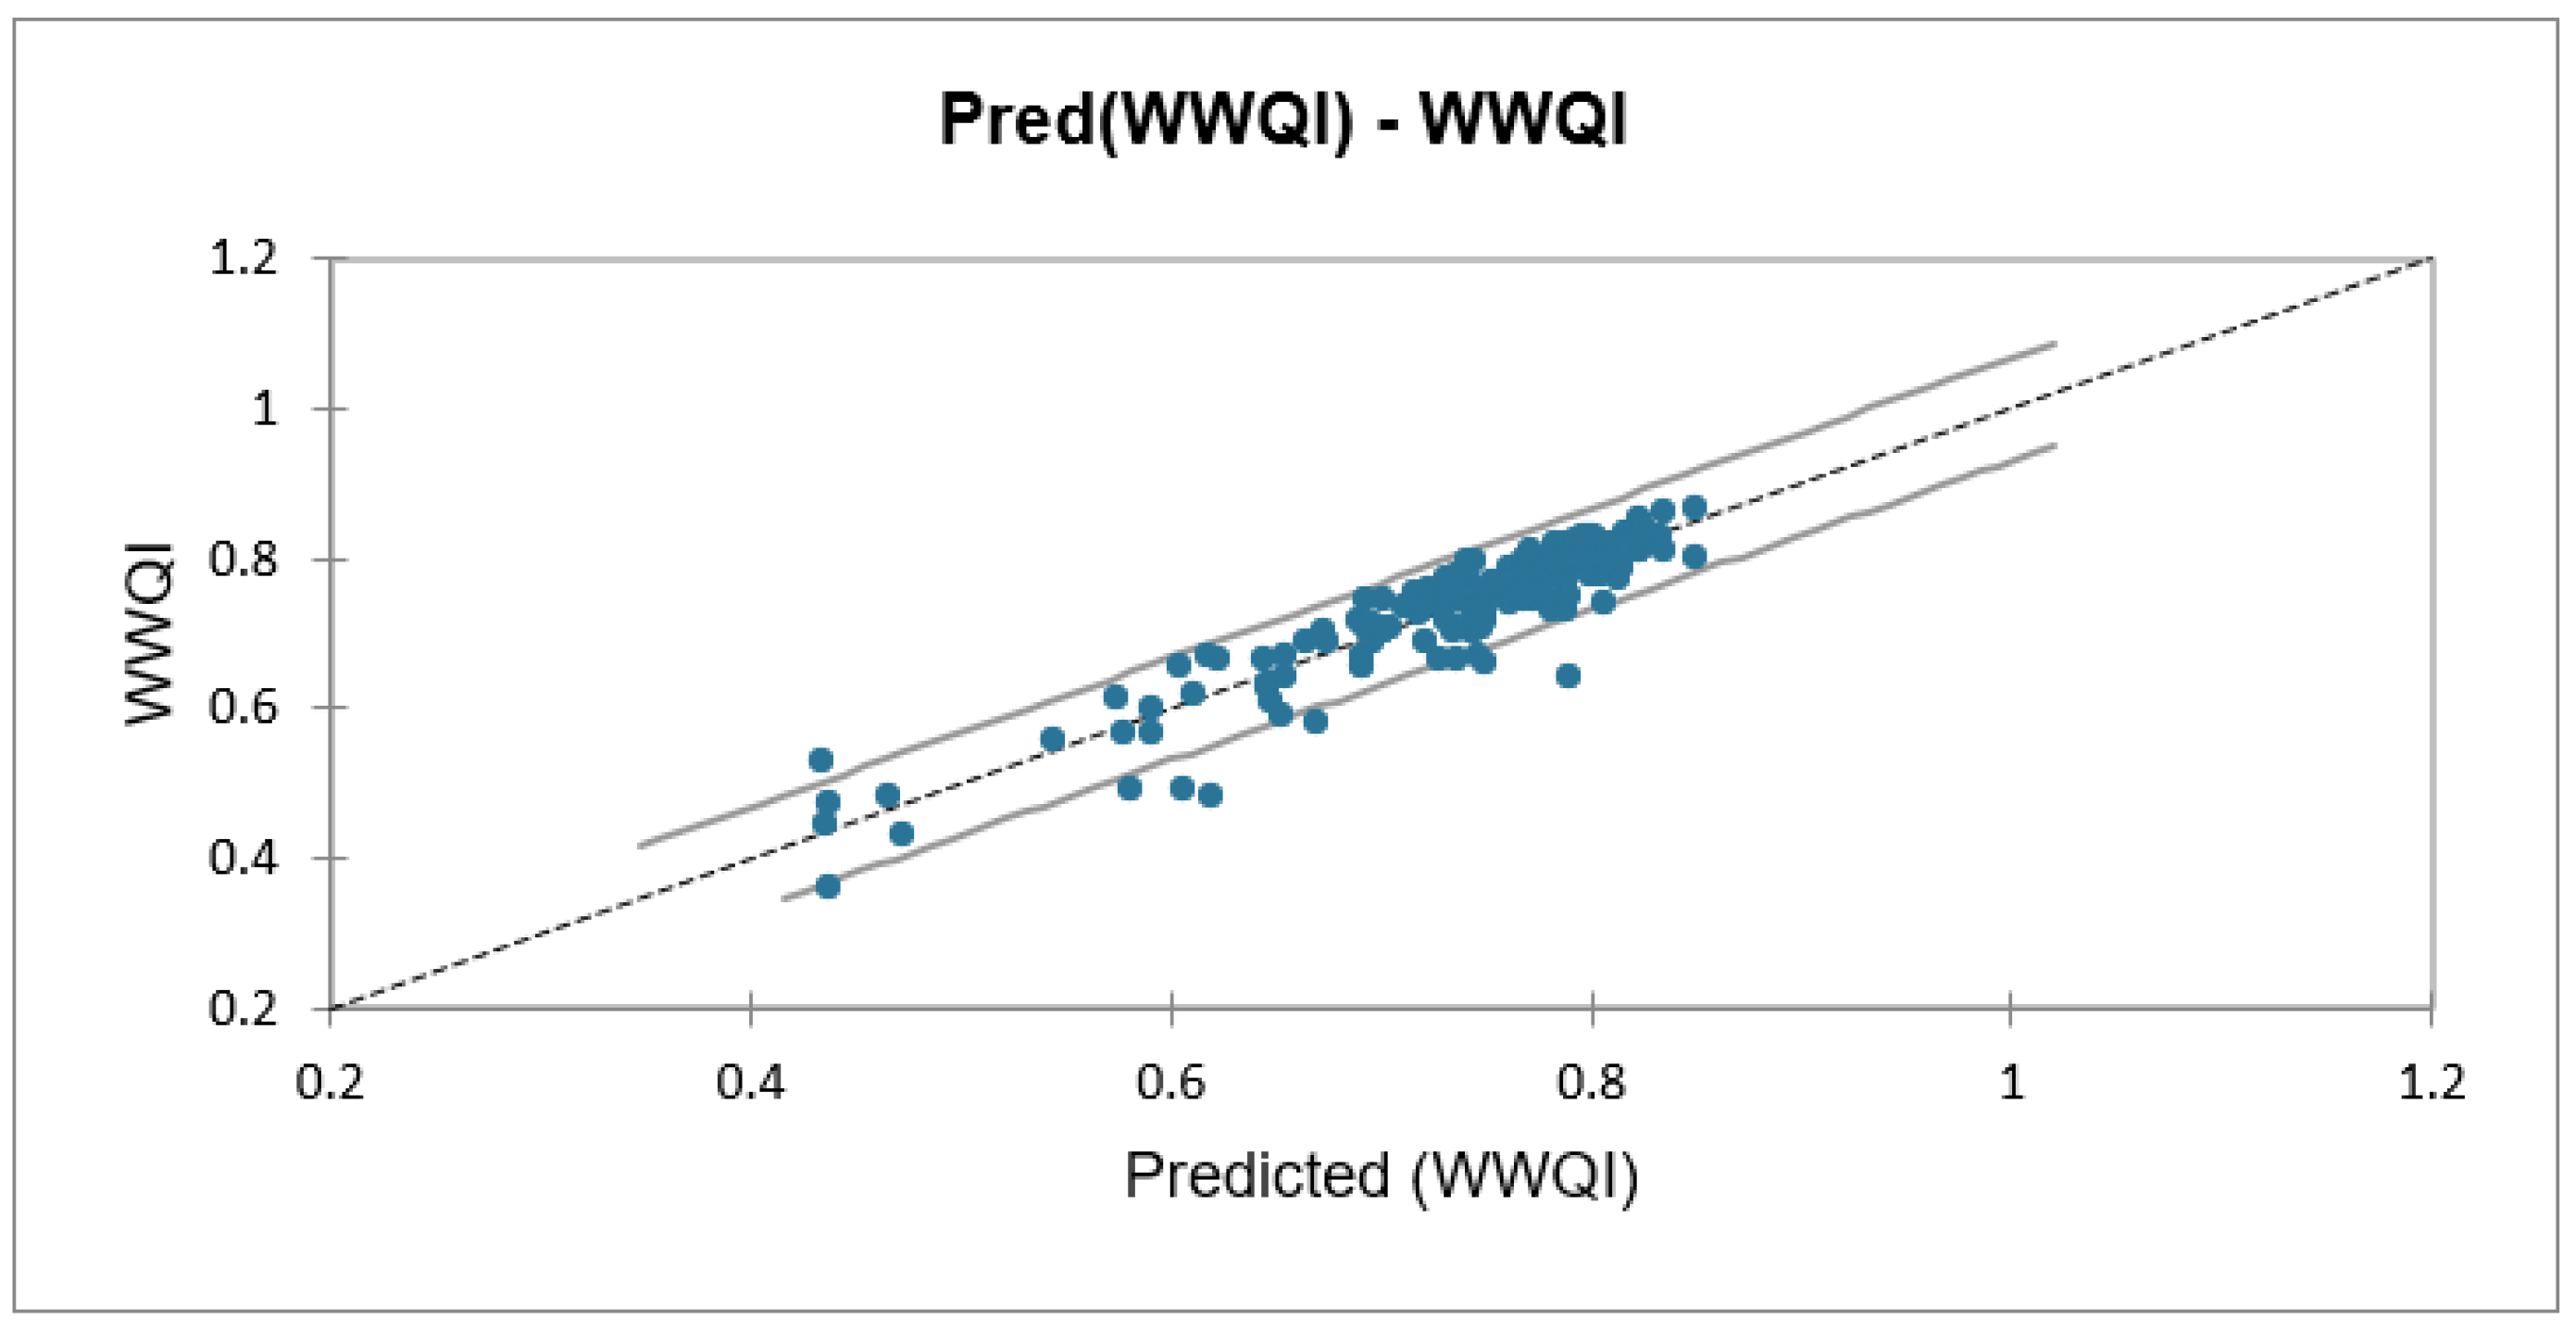
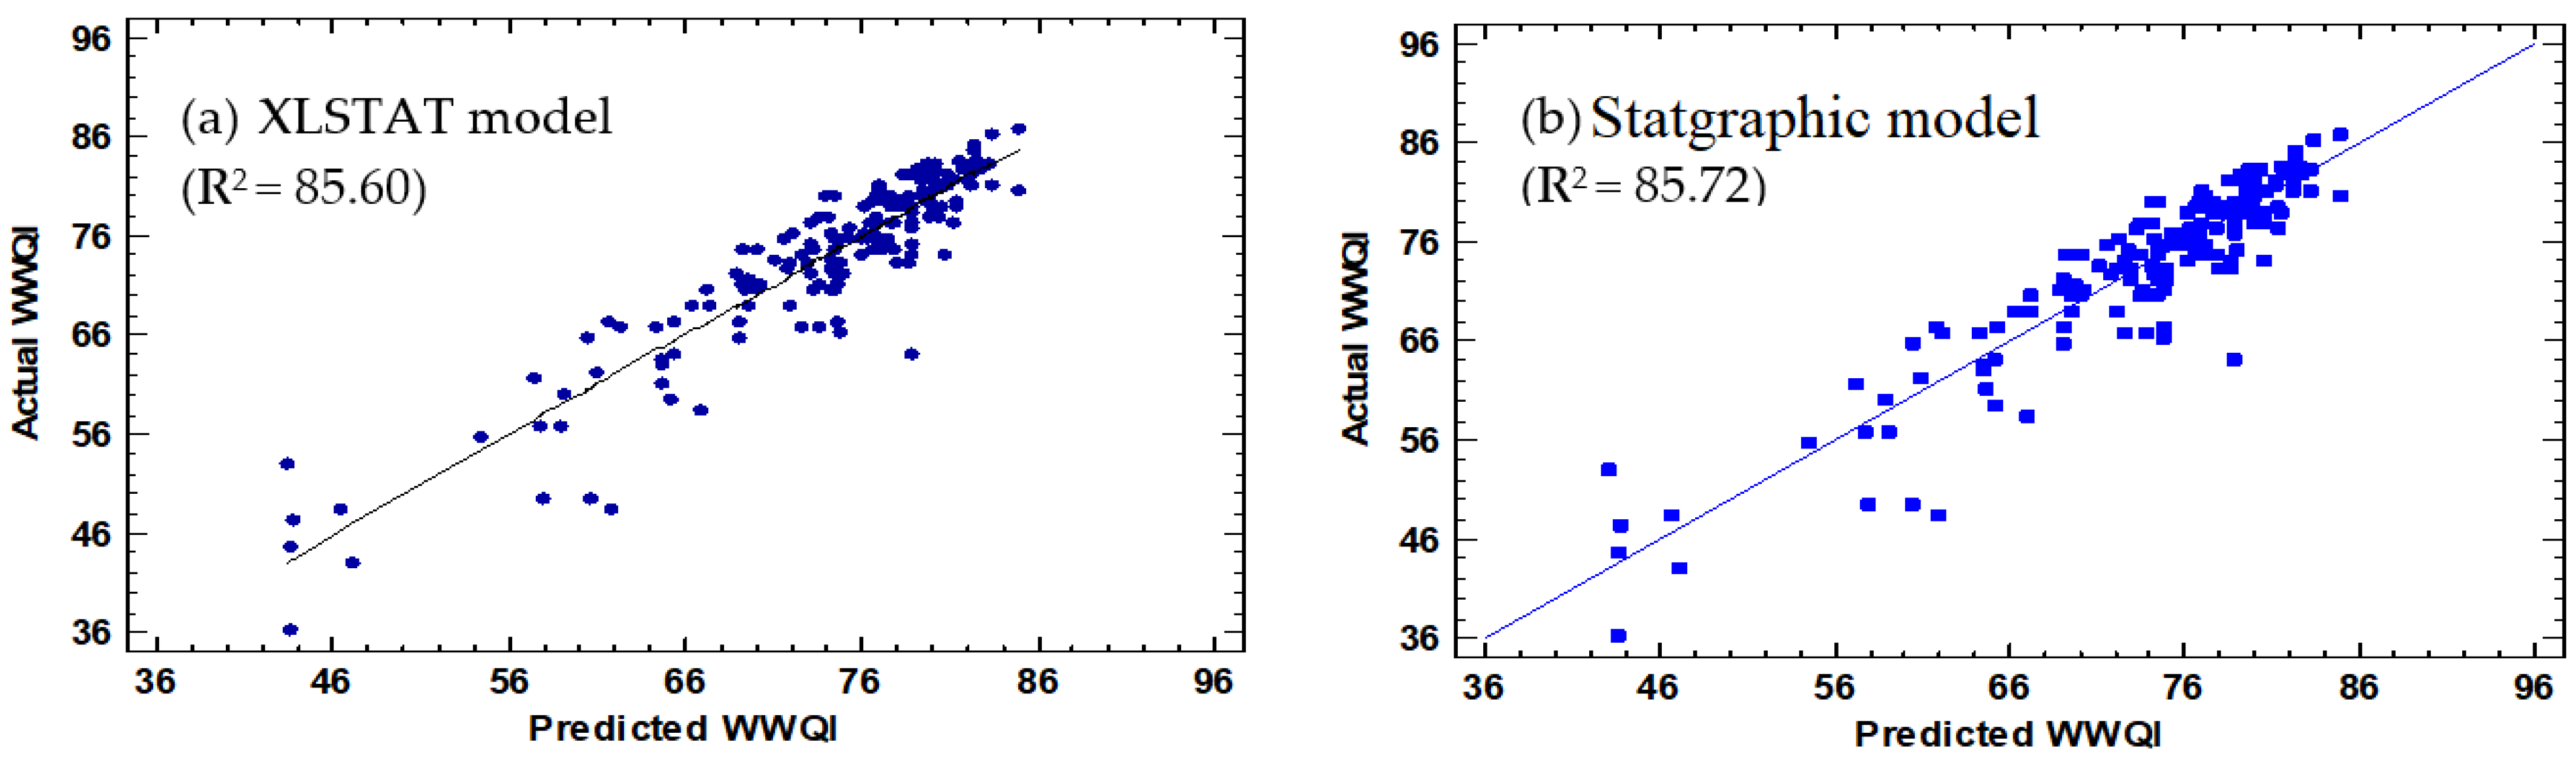
3.3.1. XLSTAT Modeling
3.3.2. Statgraphic Modeling
4. Conclusions
Supplementary Materials
Author Contributions
Funding
Institutional Review Board Statement
Informed Consent Statement
Data Availability Statement
Acknowledgments
Conflicts of Interest
References
- Altowayti, W.A.H.; Othman, N.; Goh, P.S.; Alshalif, A.F.; Al-Gheethi, A.A.; Algaifi, H.A. Application of a novel nanocomposites carbon nanotubes functionalized with mesoporous silica-nitrenium ions (CNT-MS-N) in nitrate removal: Optimizations and nonlinear and linear regression analysis. Environ. Technol. Innov. 2021, 22, 101428. [Google Scholar] [CrossRef]
- Altowayti, W.A.H.; Othman, N.; Shahir, S.; Alshalif, A.F.; Al-Gheethi, A.A.; Saleh, Z.M.; Haris, S.A. Removal of arsenic from wastewater by using different technologies and adsorbents: A review. Int. J. Environ. Sci. Technol. 2021, 19, 9243–9266. [Google Scholar] [CrossRef]
- Altowayti, W.A.H.; Othman, N.; Tajarudin, H.A.; Al-Dhaqm, A.; Asharuddin, S.M.; Al-Gheethi, A.; Alshalif, A.F.; Salem, A.A.; Din, M.F.; Fitriani, N.; et al. Evaluating the Pressure and Loss Behavior in Water Pipes Using Smart Mathematical Modelling. Water 2021, 13, 3500. [Google Scholar] [CrossRef]
- Zhang, J.; Shao, Y.; Wang, H.; Liu, G.; Qi, L.; Xu, X.; Liu, S. Current operation state of wastewater treatment plants in urban China. Environ. Res. 2021, 195, 110843. [Google Scholar] [CrossRef] [PubMed]
- Martínez, R.; Vela, N.; El Aatik, A.; Murray, E.; Roche, P.; Navarro, J.M. On the Use of an IoT Integrated System for Water Quality Monitoring and Management in Wastewater Treatment Plants. Water 2020, 12, 1096. [Google Scholar] [CrossRef]
- Bagherzadeh, F.; Mehrani, M.-J.; Basirifard, M.; Roostaei, J. Comparative study on total nitrogen prediction in wastewater treatment plant and effect of various feature selection methods on machine learning algorithms performance. J. Water Process Eng. 2021, 41, 102033. [Google Scholar] [CrossRef]
- Ayob, S.; Othman, N.; Altowayti, W.A.H.; Khalid, F.S.; Abu Bakar, N.; Tahir, M.; Soedjono, E.S. A Review on Adsorption of Heavy Metals from Wood-Industrial Wastewater by Oil Palm Waste. J. Ecol. Eng. 2021, 22, 249–265. [Google Scholar] [CrossRef]
- Harrou, F.; Dairi, A.; Sun, Y.; Senouci, M. Statistical monitoring of a wastewater treatment plant: A case study. J. Environ. Manag. 2018, 223, 807–814. [Google Scholar] [CrossRef]
- Su, J.-J.; Ding, S.-T.; Chung, H.-C. Establishing a Smart Farm-Scale Piggery Wastewater Treatment System with the Internet of Things (IoT) Applications. Water 2020, 12, 1654. [Google Scholar] [CrossRef]
- Nair, A.; Hykkerud, A.; Ratnaweera, H. Estimating Phosphorus and COD Concentrations Using a Hybrid Soft Sensor: A Case Study in a Norwegian Municipal Wastewater Treatment Plant. Water 2022, 14, 332. [Google Scholar] [CrossRef]
- Nanda, I.; Shukla, V.K.; Dhanekula, V.J.; Gadipudi, M.; Penugonda, V.; Maloji, S. Design and real time implementation of SmartWater management using LabVIEW and IoT. In Proceedings of the 2021 International Conference on Computational Intelligence and Knowledge Economy (ICCIKE), Dubai, United Arab Emirates, 17–18 March 2021; IEEE: Piscataway, NJ, USA, 2021; pp. 524–528. [Google Scholar]
- Ejeian, F.; Etedali, P.; Mansouri-Tehrani, H.-A.; Soozanipour, A.; Low, Z.-X.; Asadnia, M.; Taheri-Kafrani, A.; Razmjou, A. Biosensors for wastewater monitoring: A review. Biosens. Bioelectron. 2018, 118, 66–79. [Google Scholar] [CrossRef] [PubMed]
- Wang, R.; Yu, Y.; Chen, Y.; Pan, Z.; Li, X.; Tan, Z.; Zhang, J. Model construction and application for effluent prediction in wastewater treatment plant: Data processing method optimization and process parameters integration. J. Environ. Manag. 2021, 302, 114020. [Google Scholar] [CrossRef] [PubMed]
- Hsien, C.; Low, J.S.C.; Chung, S.Y.; Tan, D.Z.L. Quality-based water and wastewater classification for waste-to-resource matching. Resour. Conserv. Recycl. 2019, 151, 104477. [Google Scholar] [CrossRef]
- Kawan, J.A.; Suja’, F.; Pramanik, S.K.; Yusof, A.; Rahman, R.A.; Abu Hasan, H. Effect of Hydraulic Retention Time on the Performance of a Compact Moving Bed Biofilm Reactor for Effluent Polishing of Treated Sewage. Water 2022, 14, 81. [Google Scholar] [CrossRef]
- Barbulescu, A.; Barbes, L.; Dumitriu, C.S. Assessing the Water Pollution of the Brahmaputra River Using Water Quality Indexes. Toxics 2021, 9, 297. [Google Scholar] [CrossRef]
- Ramya, K.; Vasudevan, N. Performance evaluation of ETP from pesticide manufacturing industry by using WWQI and multivariate statistical analysis. Environ. Sci. Pollut. Res. 2019, 26, 20595–20609. [Google Scholar] [CrossRef]
- Pirvu, F.; Petre, J.; Cruceru, L.; Paun, I.; Niculescu, M.; Pascu, L.F.; Vasilache, N.; Chiriac, F.L. Physico–chemical characteristics and wastewater quality index for evaluating the efficiency of treatment process effluent. In Proceedings of the International Symposium “the Environment and the Industry”—SIMI 2018, Bucharest, Romania, 20–21 September 2018. [Google Scholar] [CrossRef]
- Khudair, B.H.; AL-Sulaimen, A.M.; Jbbar, R.K. Effluent quality assessment of Al-Diwaniyah sewage treatment plant based on wastewater quality index. Int. J. Civ. Eng. Technol. 2018, 9, 22–31. [Google Scholar]
- Raut, S.; Anaokar, G.; Dharnaik, A. Determination of wastewater quality index of municipal wastewater treatment plant using fuzzy rule base. Eur. J. Adv. Eng. Technol. 2017, 4, 733–738. [Google Scholar]
- Sarkheil, H.; Azimi, Y.; Rahbari, S. Fuzzy wastewater quality index determination for environmental quality assessment under uncertain and vagueness conditions. Int. J. Eng. 2018, 31, 1196–1204. [Google Scholar]
- Jamshidzadeh, Z.; Barzi, M.T. Wastewater quality index (WWQI) as an assessment tool of treated wastewater quality for agriculture: A case of North Wastewater Treatment Plant effluent of Isfahan. Environ. Sci. Pollut. Res. 2019, 27, 7366–7378. [Google Scholar] [CrossRef]
- Abbaa, S.; Elkiranb, G.; Nouranic, V. Improving novel extreme learning machine using PCA algorithms for multi-parametric modeling of the municipal wastewater treatment plant. Desalin. Water Treat 2021, 215, 414–426. [Google Scholar] [CrossRef]
- Sakson, G.; Brzezinska, A.; Bandzierz, D.; Olejnik, D.; Jedrzejczak, M.; Gryglik, D.; Badowska, E. Monitoring of wastewater quality in Lodz sewage system (Poland)—Do the current solutions enable the protection of WWTP and receiving water? Int. J. Energy Environ. Eng. 2021, 13, 713–727. [Google Scholar] [CrossRef]
- Ebrahimi, M.; Gerber, E.L.; Rockaway, T.D. Temporal performance assessment of wastewater treatment plants by using multivariate statistical analysis. J. Environ. Manag. 2017, 193, 234–246. [Google Scholar] [CrossRef] [PubMed]
- Vijayan, G.; Saravanane, R.; Sundararajan, T. Wastewater Quality Index–A Tool for Categorization of the Wastewater and Its Influence on the Performance of Sequencing Batch Reactor. Int. J. Environ. Eng. Manag. 2016, 7, 69–88. [Google Scholar]
- Ahmed, S.M.; Taha, O.M.; Najemalden, M.A.; Ahmed, R.T.; Abedulwahab, A.A. Assessment of Lower Zab river water quality using both Canadian Water Quality Index Method and NSF Water Quality Index Method. Przegląd Nauk. Inżynieria Kształtowanie Sr. 2020, 29, 155–171. [Google Scholar] [CrossRef]
- Obiad, A.J.; Al-Sultan, A.A. CWWQI on the Evaluation of Effluent Wastewater from Al-Dora Refinery WWTP. In IOP Conference Series: Materials Science and Engineering, Proceedings of the 4th International Conference on Buildings, Construction and Environmental Engineering, Istanbul, Turkey, 7–9 October 2020; IOP Publishing: Bristol, UK, 2020; p. 012167. [Google Scholar]
- Jagaba, A.H.; Kutty, S.R.M.; Fauzi, M.A.H.M.; Razali, M.A.; Hafiz, M.F.U.M.; Noor, A. Organic and nutrient removal from pulp and paper industry wastewater by extended aeration activated sludge system. In IOP Conference Series: Materials Science and Engineering, Proceedings of the 3rd International Conference on Tropical Resources and Sustainable Sciences, Kelantan, Malaysia, 14–15 July 2021; IOP Publishing: Bristol, UK, 2021; p. 012021. [Google Scholar] [CrossRef]
- Raad, N.K.; Farrokhi, F.; Mousavi, S.A.; Darvishi, P.; Mahmoudi, A. Simultaneous power generation and sewage sludge stabilization using an air cathode-MFCs. Biomass Bioenergy 2020, 140, 105642. [Google Scholar] [CrossRef]
- Mouhtady, O.; Obeid, E.; Abu-Samha, M.; Younes, K.; Murshid, N. Evaluation of the Adsorption Efficiency of Graphene Oxide Hydrogels in Wastewater Dye Removal: Application of Principal Component Analysis. Gels 2022, 8, 447. [Google Scholar] [CrossRef]
- Cui, F.; Kim, M.; Park, C.; Kim, D.; Mo, K.; Kim, M. Application of principal component analysis (PCA) to the assessment of parameter correlations in the partial-nitrification process using aerobic granular sludge. J. Environ. Manag. 2021, 288, 112408. [Google Scholar] [CrossRef]
- Zhang, H.; Li, H.; Yu, H.; Cheng, S. Water quality assessment and pollution source apportionment using multi-statistic and APCS-MLR modeling techniques in Min River Basin, China. Environ. Sci. Pollut. Res. 2020, 27, 41987–42000. [Google Scholar] [CrossRef]
- Schreiber, J.B. Issues and recommendations for exploratory factor analysis and principal component analysis. Res. Soc. Adm. Pharm. 2020, 17, 1004–1011. [Google Scholar] [CrossRef]
- Qasaimeh, A.; Al-Ghazawi, Z. Regression modeling for rapid prediction of wastewater BOD5. Desalin. Water Treat. 2020, 201, 165–172. [Google Scholar] [CrossRef]
- Sharma, P.; Sood, S.; Mishra, S.K. Development of multiple linear regression model for biochemical oxygen demand (BOD) removal efficiency of different sewage treatment technologies in Delhi, India. Sustain. Water Resour. Manag. 2020, 6, 29. [Google Scholar] [CrossRef]
- Zheng, X.; Jiang, Z.; Ying, Z.; Song, J.; Chen, W.; Wang, B. Role of feedstock properties and hydrothermal carbonization conditions on fuel properties of sewage sludge-derived hydrochar using multiple linear regression technique. Fuel 2020, 271, 117609. [Google Scholar] [CrossRef]
- Khalkhali, M.; Mo, W. The energy implication of climate change on urban wastewater systems. J. Clean. Prod. 2020, 267, 121905. [Google Scholar] [CrossRef]
- Ayat, A.; Arris, S.; Abbaz, A.; Bencheikh-Lehocine, M.; Meniai, A.H. Application of Response Surface Methodology For Modeling and Optimization of A Bio Coagulation Process (Sewage Wastewater Treatment Plant). Environ. Manag. 2021, 67, 489–497. [Google Scholar] [CrossRef]
- Tunç, M.S. Co-pretreatment of municipal wastewater and landfill leachate by chemical coagulation using ferric chloride and aluminum sulfate. Gazi Univ. J. Sci. 2020, 33, 679–688. [Google Scholar] [CrossRef]
- Saidulu, D.; Gupta, B.; Gupta, A.K.; Ghosal, P.S. A review on occurrences, eco-toxic effects, and remediation of emerging contaminants from wastewater: Special emphasis on biological treatment based hybrid systems. J. Environ. Chem. Eng. 2021, 9, 105282. [Google Scholar] [CrossRef]
- Liu, J.; Piché-Choquette, S. The combination of external conditioning and Ca2+ addition prior to the reintroduction of effluent sludge into SBR sharply accelerates the formation of aerobic granules. J. Water Process Eng. 2020, 36, 101269. [Google Scholar] [CrossRef]
- Gao, X.; Zhang, T.; Wang, B.; Xu, Z.; Zhang, L.; Peng, Y. Advanced nitrogen removal of low C/N ratio sewage in an anaerobic/aerobic/anoxic process through enhanced post-endogenous denitrification. Chemosphere 2020, 252, 126624. [Google Scholar] [CrossRef]
- Varol, M. Use of water quality index and multivariate statistical methods for the evaluation of water quality of a stream affected by multiple stressors: A case study. Environ. Pollut. 2020, 266, 115417. [Google Scholar] [CrossRef]
- Ustaoğlu, F.; Taş, B.; Tepe, Y.; Topaldemir, H. Comprehensive assessment of water quality and associated health risk by using physicochemical quality indices and multivariate analysis in Terme River, Turkey. Environ. Sci. Pollut. Res. 2021, 28, 62736–62754. [Google Scholar] [CrossRef] [PubMed]
- Jang, C.-S. Using multi-threshold regression techniques to assess river fecal pollution in the highly urbanized Tamsui River watershed. Environ. Monit. Assess. 2021, 193, 113. [Google Scholar] [CrossRef] [PubMed]
- Milh, H.; Van Eyck, K.; Bastiaens, B.; De Laet, S.; Leysen, D.; Cabooter, D.; Dewil, R. Predicting Residual Adsorbable Organic Halides Concentrations in Industrial Wastewater Using Typical Wastewater Parameters. Water 2020, 12, 1653. [Google Scholar] [CrossRef]
- Lotfi, K.; Bonakdari, H.; Ebtehaj, I.; Mjalli, F.S.; Zeynoddin, M.; Delatolla, R.; Gharabaghi, B. Predicting wastewater treatment plant quality parameters using a novel hybrid linear-nonlinear methodology. J. Environ. Manag. 2019, 240, 463–474. [Google Scholar] [CrossRef] [PubMed]
- Hussain, S.; Khan, H.; Khan, N.; Gul, S.; Wahab, F.; Khan, K.I.; Zeb, S.; Khan, S.; Baddouh, A.; Mehdi, S.; et al. Process modeling toward higher degradation and minimum energy consumption of an electrochemical decontamination of food dye wastewater. Environ. Technol. Innov. 2021, 22, 101509. [Google Scholar] [CrossRef]
- Bessedik, M.; Abdelbaki, C.; Badr, N.; Tiar, S.M.; Megnounif, A. Application of water quality indices for assessment of influent and effluent wastewater from wastewater treatment plant of Oran City, Algeria. Desalin. Water Treat. 2021, 236, 306–317. [Google Scholar] [CrossRef]
- Aboulfotoh, A.; Heikal, G. Estimation of Per Capita Loading and Treated Wastewater Quality Index in Sharkia Governorate, Egypt. J. Ecol. Eng. 2022, 23, 73–80. [Google Scholar] [CrossRef]
- Bilgin, A.; Bayraktar, H.D. Assessment of lake water quality using multivariate statistical techniques and chlorophyll-nutrient relationships: A case study of the Göksu Lake. Arab. J. Geosci. 2021, 14, 483. [Google Scholar] [CrossRef]
- Vizárová, K.; Vajová, I.; Krivoňáková, N.; Tiňo, R.; Takáč, Z.; Vodný, Š.; Katuščák, S. Regression Analysis of Orthogonal, Cylindrical and Multivariable Color Parameters for Colorimetric Surface pH Measurement of Materials. Molecules 2021, 26, 3682. [Google Scholar] [CrossRef]


| Variable | Description | Unit | Minimum | Maximum | Mean | Std. Deviation (±) | Malaysia Effluent Standard (A) |
|---|---|---|---|---|---|---|---|
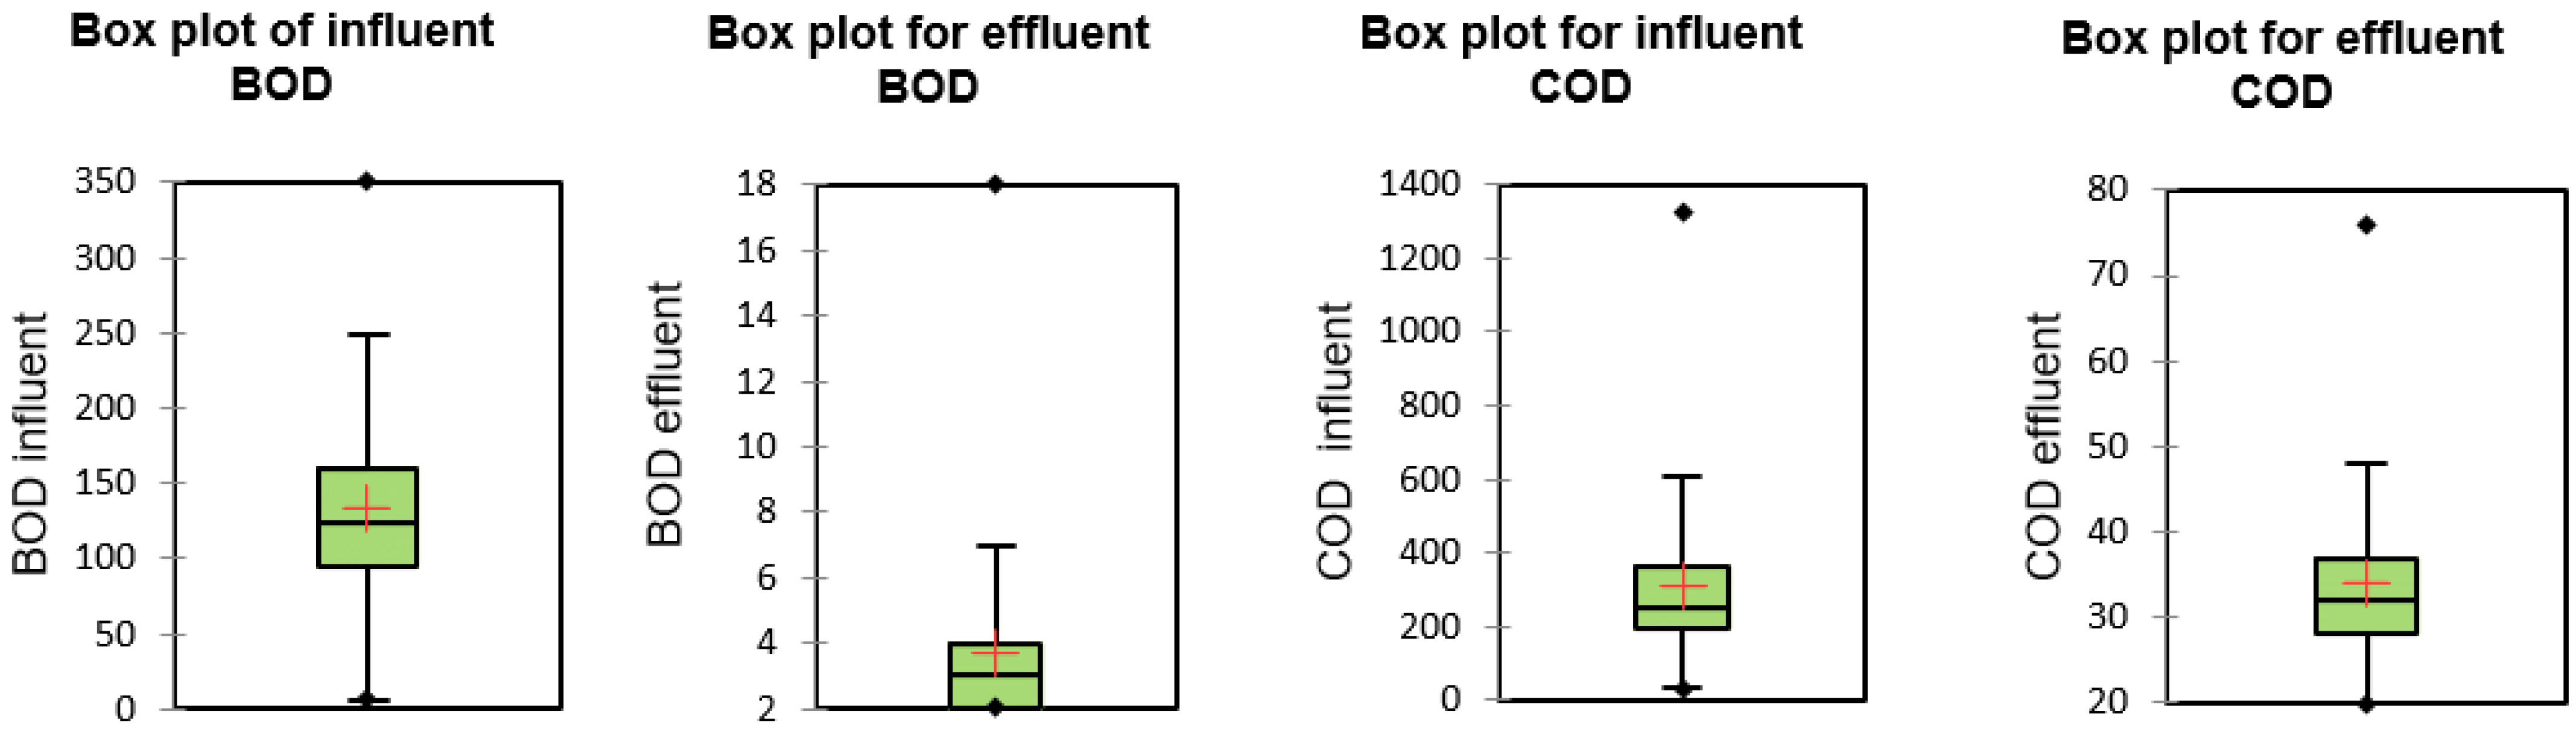
| BOD | Influent BOD | mg/L | 6.00 | 350.00 | 133.76 | 66.34 | - |
| CODi | Influent COD | mg/L | 30.00 | 1323.00 | 307.62 | 213.98 | - |
| TSSi | Influent TSS | mg/L | 15.00 | 903.00 | 148.48 | 137.08 | - |
| Ammoniai | Influent ammonia | mg/L | 8.00 | 38.00 | 20.64 | 6.49 | - |
| pHi | Influent pH | - | 6.40 | 8.20 | 7.00 | 0.30 | - |
| O&Gi | Influent O&G | mg/L | 1.00 | 135.00 | 32.12 | 24.28 | - |
| BODe | Effluent BOD | mg/L | 2.00 | 18.00 | 3.68 | 2.30 | 20 |
| CODe | Effluent COD | mg/L | 20.00 | 76.00 | 34.07 | 10.64 | 120 |
| TSSe | Effluent TSS | mg/L | 2.00 | 42.00 | 11.06 | 7.59 | 5 |
| Ammoniae | Effluent Ammonia | mg/L | 1.00 | 45.00 | 7.62 | 6.75 | 5 |
| pHe | Effluent pH | - | 6.00 | 8.50 | 7.02 | 0.33 | 6–9 |
| OGe | Effluent O&G | mg/L | 1.00 | 7.00 | 2.07 | 1.08 | 5 |
| Tempe | Effluent Temp | °C | 29.00 | 32.00 | 29.55 | 0.59 | 40 |
| Nitratei | Influent Nitrate | mg/L | 1.00 | 11.00 | 1.05 | 0.74 | - |
| Nitratee | Effluent Nitrate | mg/L | 1.00 | 24.00 | 1.57 | 2.46 | 20 |
| MLSS | MLSS | mg/L | 2918.00 | 9905.00 | 5858.94 | 2226.53 | - |
| WWQI | WWQI | - | 36.30 | 86.80 | 74.30 | 9.10 | - |
| Quality Range | WWQI | Category |
|---|---|---|
| Excellent | 95–100 | Very close to natural or pristine levels |
| Good | 80–94 | Rarely depart from natural or desirable levels |
| Fair | 65–79 | Sometimes depart from natural or desirable levels |
| Marginal | 45–64 | Often depart from natural or desirable levels |
| Poor | 0–44 | Quality is almost always threatened or impaired |
| F1 | F2 | F3 | F4 | F5 | F6 | F7 | |
|---|---|---|---|---|---|---|---|
| Eigenvalue | 3.466 | 2.710 | 1.520 | 1.268 | 1.067 | 1.031 | 1.008 |
| Variability (%) | 20.389 | 15.944 | 8.941 | 7.462 | 6.274 | 6.067 | 5.930 |
| Cumulative (%) | 20.389 | 36.333 | 45.273 | 52.735 | 59.009 | 65.076 | 71.006 |
| Source | DF | Sum of Squares | Mean Squares | F | Pr > F | R2 | Adjusted R2 |
|---|---|---|---|---|---|---|---|
| Model | 4 | 2.511 | 0.628 | 530.587 | <0.0001 | 0.856 | 0.856 |
| Error | 353 | 0.418 | 0.001 | ||||
| Total Corrected | 357 | 2.928 |
| Source | Value | Standard Error | t-Value | p-Level |
|---|---|---|---|---|
| Intercept | 0.993 | 0.007 | 138.313 | <0.0001 |
| BODi | 0.000018 | 0.000033 | 0.563 | 0.574 |
| CODi | 0.000018 | 0.000010 | 1.813 | 0.071 |
| BODe | −0.009 | 0.001 | −8.972 | <0.0001 |
| CODe | −0.007 | 0.000 | −31.286 | <0.0001 |
| Source | DF | Sum of Squares | Mean Squares | F | Pr > F | R2 | Adjusted R2 |
|---|---|---|---|---|---|---|---|
| Model | 3 | 25,103.2 | 8367.72 | 708.59 | <0.0001 | 85.7245 | 85.6035 |
| Error | 354 | 4180.38 | 11.809 | ||||
| Total Corrected | 357 | 29,283.5 |
| Source | Value | Standard Error | t-Value | p-Level |
|---|---|---|---|---|
| Intercept | 99.4487 | 0.65471 | 151.898 | <0.0001 |
| CODi | 0.002145 | 0.000854 | 2.5107 | 0.0125 |
| BODe | −0.872038 | 0.097284 | −8.96375 | <0.0001 |
| CODe | −0.66303 | 0.0211011 | −31.4215 | <0.0001 |
Publisher’s Note: MDPI stays neutral with regard to jurisdictional claims in published maps and institutional affiliations. |
© 2022 by the authors. Licensee MDPI, Basel, Switzerland. This article is an open access article distributed under the terms and conditions of the Creative Commons Attribution (CC BY) license (https://creativecommons.org/licenses/by/4.0/).
Share and Cite
Rahmat, S.; Altowayti, W.A.H.; Othman, N.; Asharuddin, S.M.; Saeed, F.; Basurra, S.; Eisa, T.A.E.; Shahir, S. Prediction of Wastewater Treatment Plant Performance Using Multivariate Statistical Analysis: A Case Study of a Regional Sewage Treatment Plant in Melaka, Malaysia. Water 2022, 14, 3297. https://doi.org/10.3390/w14203297
Rahmat S, Altowayti WAH, Othman N, Asharuddin SM, Saeed F, Basurra S, Eisa TAE, Shahir S. Prediction of Wastewater Treatment Plant Performance Using Multivariate Statistical Analysis: A Case Study of a Regional Sewage Treatment Plant in Melaka, Malaysia. Water. 2022; 14(20):3297. https://doi.org/10.3390/w14203297
Chicago/Turabian StyleRahmat, Sofiah, Wahid Ali Hamood Altowayti, Norzila Othman, Syazwani Mohd Asharuddin, Faisal Saeed, Shadi Basurra, Taiseer Abdalla Elfadil Eisa, and Shafinaz Shahir. 2022. "Prediction of Wastewater Treatment Plant Performance Using Multivariate Statistical Analysis: A Case Study of a Regional Sewage Treatment Plant in Melaka, Malaysia" Water 14, no. 20: 3297. https://doi.org/10.3390/w14203297