
Characterization of the Propagation of Meteorological Drought Using the Copula Model


1
Division of Earth Environmental System Science (Major of Environmental Engineering), Pukyong National University, Busan 48513, Korea
2
K-Water Research Institute, K-Water, Daejeon 34045, Korea
*
Author to whom correspondence should be addressed.
Water 2022, 14(20), 3293; https://doi.org/10.3390/w14203293
Submission received: 30 August 2022
/
Revised: 3 October 2022
/
Accepted: 16 October 2022
/
Published: 18 October 2022
(This article belongs to the Section Hydrology)
Abstract
:Drought is a phenomenon that is caused by several factors and can be divided into meteorological drought, agricultural drought, hydrological drought, and socioeconomic drought. In this study, the characteristics of propagating from meteorological drought to agricultural (or hydrological) drought in the Andong Dam basin and Hapcheon Dam basin located in the Nakdong River basin in Korea were investigated. Standardized precipitation index (SPI), standardized soil moisture index (SMI), and standardized runoff index (SRI) were used to characterize meteorological, agricultural, and hydrological droughts, respectively. SPI-m (1–12) on various timescales and SMI-1 (or SRI-1) were selected as drought propagation timeseries, such that a correlation analysis was performed to evaluate the correlation and propagation time between meteorological and agricultural (or hydrological) drought. Propagation probability was quantified using a copula-based model. The correlation between meteorological and agricultural (or hydrological) droughts was not significantly affected by seasons. A relatively strong correlation was found in summer. A relatively weak correlation was shown in autumn. In addition, it was found that there was a difference in correlation between the Andong Dam basin and the Hapcheon Dam basin. On the other hand, in both watersheds, the propagation time was as long as 2 to 4 months in spring and decreased to 1 month in summer.
1. Introduction
Drought is an extreme climatic phenomenon characterized by lower-than-normal precipitation over months to years [1]. It is a major natural disaster with serious direct and indirect impacts on the ecological [2], agricultural [3], environmental health [4], energy [5], and economic sectors [6]. Over the past 100 years, climate change has become more pronounced [7,8], leading to increasingly severe droughts in many parts of the world [9]. Drought is generally divided into four types [10]:
Drought identification is generally performed using the drought index, which can be identified differently depending on the drought index applied even if it is the same type of drought [15]. The standardized precipitation index (SPI), the percentage of normal precipitation (PN), and the Palmer drought severity index (PDSI) are used to evaluate meteorological droughts. The standard soil moisture index (SMI) and standardized runoff index (SRI) are widely used for the evaluation of agricultural and hydrological droughts, respectively.
The relationship among various droughts, especially propagation characteristics, has received considerable attention from academia in recent years [16,17,18,19]. In general, meteorological drought occurs due to lack of precipitation. When such a meteorological drought continues and leads to a lack of soil moisture, a vegetation or agricultural drought occurs, and, when it leads to a decrease in runoff, a hydrological drought occurs [20]. Drought propagation refers to the process of propagation from one type of drought to another [21], and it was found that there was a spatiotemporal delay between the two types of droughts [22]. Most droughts in various hydrological, agricultural, groundwater, and socioeconomic environments result from meteorological droughts [23,24,25,26,27]. After analyzing the onset and recovery of drought in the United States, the authors of [28] argued that the onset of meteorological drought occurred months earlier than agricultural drought during the same drought period. The authors of [29] investigated the propagation characteristics of meteorological and hydrological drought in a climate 1.5–3.0 °C warmer than preindustrial, and found that drought conditions were more severe during the propagation process in warm climate regions.
The method of detecting drought propagation applies not only to propagation time but also to intensity, duration, and spatial movement of drought propagation [30,31,32]. There is a close relationship among different types of drought propagation characteristics [33,34]. Drought propagation characteristics, including duration, intensity, and probability of propagation in a particular region, are significantly affected by soil characteristics, plant types, and climate conditions [35]. For example, the authors of [15] analyzed the propagation relationship from meteorological drought to agricultural drought in Korea and confirmed that drought propagation did not occur depending on the type of drought or was delayed up to 3 months. Meanwhile, the authors of [36] investigated spatiotemporal changes in characteristics propagating from meteorological to agricultural droughts across China, and found that the correlation and propagation sensitivity between meteorological and agricultural droughts were generally the strongest in summer and wet areas. However, studies on the propagation relationship from meteorological drought to agricultural drought or hydrological drought are still lacking.
The purpose of this study was to quantify the correlation and propagation characteristics between meteorological and agricultural or hydrological droughts for the Andong Dam basin and Hapcheon Dam basin located in the Nakdonggang River basin in Korea. SPI, SMI, and SRI were introduced to represent meteorological droughts, agricultural droughts, and hydrological droughts, respectively. We then applied the correlation coefficient and copula-based probabilistic methods to analyze the drought characteristics between meteorological and agricultural (or hydrological) droughts including correlation, propagation time, and conditional probability distributions. Estimation of drought propagation time may be more accurate by recognizing the onset times of meteorological and agricultural drought events and comparing the differences. To do this, it is necessary to isolate drought events individually, and then compare the onset times of each type of drought event with each other. However, since the time difference between each type of drought event is different for each drought event, various statistical procedures are required to determine the objective propagation time [37]. A number of studies have defined drought propagation times by considering agricultural (or hydrological) drought events as a response to meteorological conditions over the past m-month [23,38,39]. That is, the correlation coefficient between the multi-timescale (1 to 12 month) meteorological drought index and the 1 month agricultural (or hydrological) drought index is calculated, and the timescale with the highest correlation coefficient is used as the drought propagation time [18,36,40,41]. The objectives of this study were as follows:
- Evaluation of the relationship between meteorological drought by SPI and agricultural drought by SMI (or hydrological drought by SRI) in Andong Dam basin and Hapcheon Dam basin through correlation analysis;
- Estimation of propagation time from meteorological drought to agricultural (or hydrological) drought;
- Estimation of the probability of propagation from various severity (weak, moderate, severe, extreme) to agricultural (or hydrological) drought using the Copula-based conditional probability distribution method;
- Attempt to classify seasonal propagation characteristics by performing this analysis on a seasonal basis.
2. Materials and Methods
2.1. Data and Research Areas
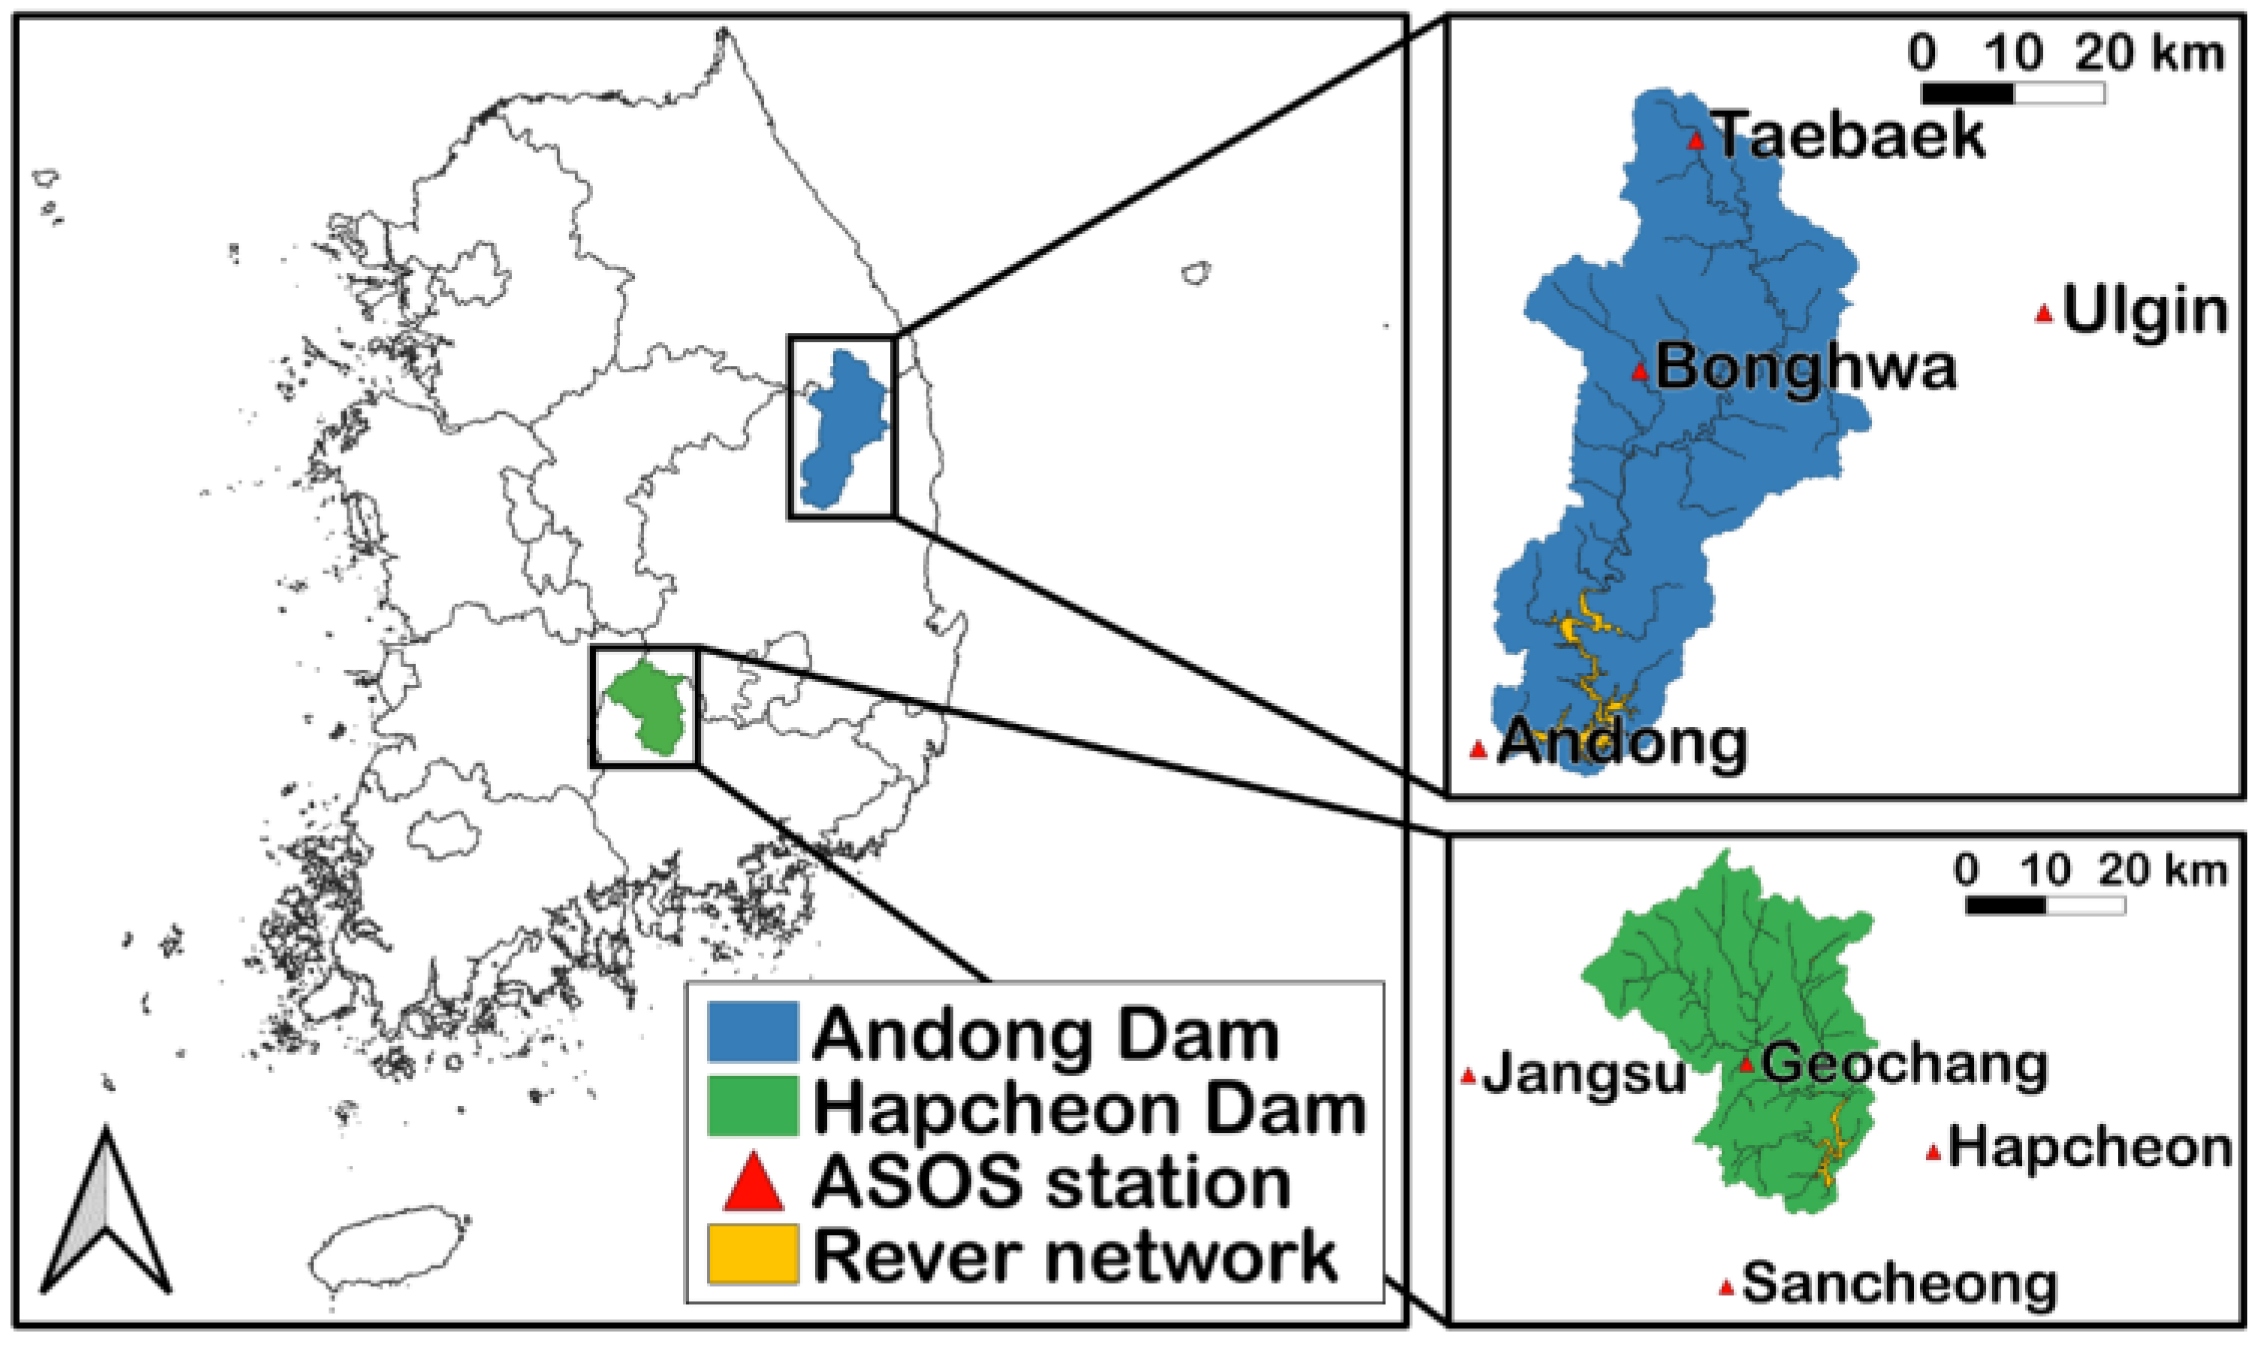
The research areas of this study were the Andong Dam and Hapcheon Dam watersheds located in the Nakdong River basin in Korea. The Andong Dam and Hapcheon Dam watersheds contain 79.49% and 75.24% of forest area, respectively. Both watersheds are upstream watersheds of large multipurpose dams, and the water stored in the dams is used as a water source for drinking water; hence, it is an area that places several restrictions on human activities. Therefore, the Andong dam watershed and the Hapcheon dam watershed can be seen as areas where the impact of human activities is minimized. However, according to [42], both watersheds have high soil erosion risk and potential. Figure 1 shows the locations of the Andong Dam basin and Hapcheon Dam basin, which are the research areas.
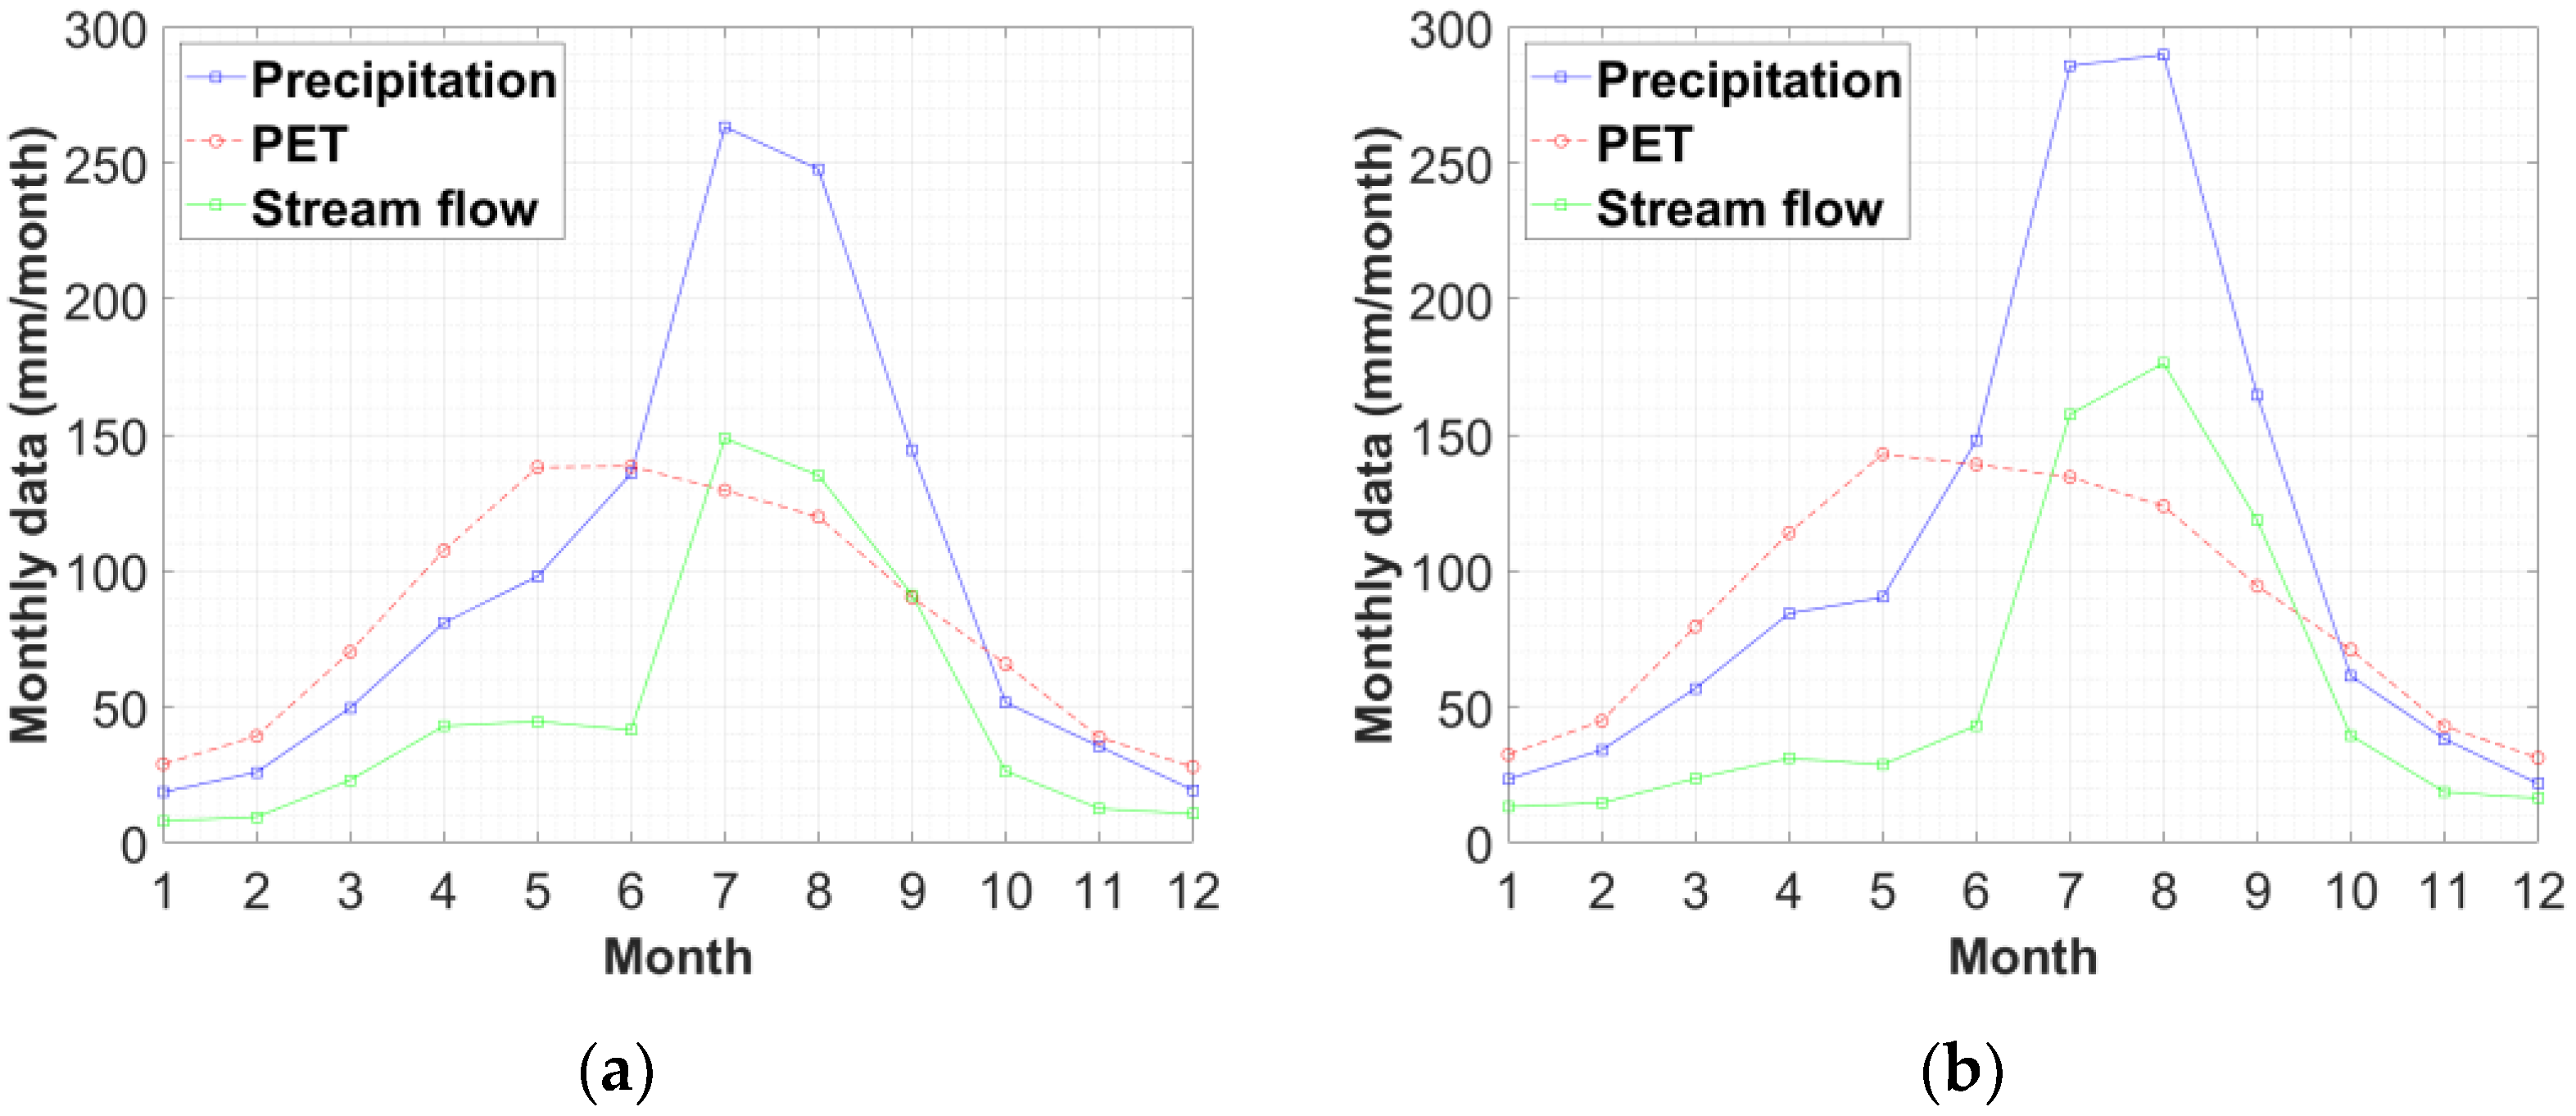
Monthly precipitation, daily minimum and maximum surface air temperature, daily average wind speed, daily average dew point temperature, and monthly average dam inflow data were obtained and used from the Korea Meteorological Administration’s open MET data portal [43] and the National Water Resources Management Information System [44]. The data period was from January 1991 to December 2021. Figure 2 shows monthly precipitation, monthly potential evapotranspiration, and monthly inflow in each basin. The monthly potential evapotranspiration in Figure 2 was calculated using the Penman–Monteith method, which is calculated using the daily minimum and maximum daily temperature, daily average wind speed, and daily average dew point temperature. The monthly precipitation for each watershed was calculated by applying the Thiessen weighting method, which was calculated using the data observed from 4 ASOS sites for each watershed. That is, the data observed at the Andong, Bonghwa, Taebaek, and Uljin sites were used for the Andong Dam watershed, and the data observed from the Geochang, Hapcheon, Jangsu, and Sancheong sites were used for the Hapcheon Dam watershed.
2.2. Monthly Soil Moisture Simulation Model
Monthly soil moisture data were simulated from 1991 to 2021 using the abcd model [45], which has been widely used to evaluate monthly runoff in Korea. The abcd model consists of four parameters, and a timeseries of monthly precipitation and monthly latent evaporation is required to drive the model. For reference, this study evaluated the water balance per unit catchment area since the data calculated using the abcd model resulted as stream flow rate per unit area (i.e., runoff depth [mm/day]).
The model first defines two state variables, (available water) and (evapotranspiration opportunity). is defined in Equation (1).
where and represent precipitation at month and soil moisture storage at month , respectively. may be expressed as Equation (2).
where the parameter describes the tendency of runoff to occur before the soil is completely saturated, with a value between 0 and 1. Parameter refers to the upper limit of evapotranspiration accumulation and soil moisture storage. and represent the actual evapotranspiration and soil moisture storage simulated at month , respectively, which are calculated using Equations (3) and (4).
where is the potential evapotranspiration at month.
, the amount of water that can be used for runoff, is further divided into direct runoff and groundwater recharge using parameter as follows:
where the parameter has a value between 0 and 1 as a base runoff index. Groundwater recharge is added to the groundwater state variable , and base runoff is calculated as shown in Equation (7).
where the parameter is a proportional constant that describes the linear relationship between the groundwater state variable and the base runoff, and has a value between 0 and 1. Using the continuous equation, the groundwater state variable is updated using Equation (8).
2.3. Drought Index
Looking at the results of studies in Korea, including [19,27,46,47] and many others, in the case of Korea, it is difficult to find the difference between SPI and SPEI; currently, the Korea Meteorological Administration is using SPI as a standard to determine the drought status. In this study, SPI was introduced to represent meteorological drought. The SPI proposed by [48] is widely used as an indicator for meteorological drought monitoring and analysis, and it is calculated by precipitation data observed in the cumulative period defined by the user. The SPI is dimensionless and calculated on the basis of the probability distribution of precipitation. SPI has been adopted by the World Meteorological Organization as a standard drought monitoring index for quantifying and predicting droughts worldwide [49]. According to the literature, the gamma distribution fits well with monthly precipitation data [48,50]. Similar to SPI, SMI and SRI were introduced as drought indices to express agricultural and hydrological droughts, respectively, and may both be derived using gamma distributions in the same way as SPI. In this study, SMI was calculated using soil moisture storage simulated by the abcd model, and SRI was calculated using the observed monthly runoff data.
Specifically, the two-parameter gamma probability density function was adopted to describe the frequency distribution of m-month cumulative monthly precipitation, monthly soil moisture storage, and monthly runoff.
where is the gamma function, is the m-month cumulative monthly precipitation (or monthly soil moisture storage or monthly runoff), and and are the scale and shape parameters, respectively, which can be estimated by the probability-weighted moment method.
Drought severity can be classified as follows on the basis of the values of SPI-m (i.e., SPI for cumulative m-month precipitation), SMI-1, and SRI-1 [51]:
- Weak drought (−1 to −0.5);
- Normal drought (−1.5 to −1);
- Severe drought (−2 to −1.5);
- Extreme drought (−2 or less).
2.4. Drought Propagation Time
Propagation time refers to the length of time from the beginning of a meteorological drought to the beginning of an agricultural (or hydrological) drought, which can be simplified by a mathematical connection between SPI on various timescales and SMI-1 (or SRI-1). To clearly identify short-term agricultural (or hydrological) droughts, SMI-1 (or SRI-1) with a timescale of 1 month was used as an indicator to characterize short-term droughts in soil moisture storage (or runoff). Furthermore, when establishing a relationship with SMI-1 (or SRI-1), using SPI-m of various timescales rather than SPI of a single timescale can better represent the actual environmental conditions. SPI-m refers to the accumulated precipitation deficiency over the previous m-month, which causes a lack of soil moisture storage (or runoff). Correlation analysis was applied to characterize the propagation relationship between meteorological and agricultural (or hydrological) droughts [24].
We can identify the SPI-m timeseries that achieves the highest correlation with SMI-1 (or SRI-1) among 12 timescales from 1 month to 12 months. The lack of monthly soil moisture storage (or monthly runoff) is largely affected by the lack of precipitation accumulated over the previous m-month [52]. The timescale for agricultural (or hydrological) droughts is 1 month, but the timescale for meteorological droughts varies depending on the propagation time (m-month) of each watershed. The highest correlation coefficient between SPI-m and SMI-1 (or SRI-1) represents the propagation intensity between meteorological and agricultural (or hydrological) droughts, and the timescale of m-month is defined as the drought propagation time. The drought propagation time of m-months discussed here does not mean that agricultural (or hydrological) droughts are affected by meteorological drought events that occurred before m-months, but by meteorological drought events accumulated from the previous m-months. Referring to previous studies [33,35,53], propagation times can be estimated individually every four seasons (spring: March, April, and May; summer: June, July, and August; fall: September, October, and November; winter: December, January, and February). Therefore, we focused on the cumulative time of meteorological droughts propagating to agricultural (or meteorological) droughts with seasonal distinctions. For example, if SMI-1 in spring has the highest correlation with SPI-3, the propagation time is 3 months. This means that the agricultural drought in spring has been spread by meteorological droughts caused by lack of precipitation over the past 3 months.
2.5. Copula Model between Meteorological and Agricultural (or Hydrological) Drought Propagation
Copula is applied to model the joint dependence structure between various drought indices [46]. It can model the dependencies that exist between multivariate data without restrictions on the marginal distribution [54]. In this work, we introduce copula theory to model the joint probability distribution of SPI and SMI (or SRI). According to Skalar’s theorem [55], the joint cumulative probability distribution between SPI and SMI (or SRI) can be expressed as Equation (10).
where and are the marginal cumulative probability distribution function (CDF) of SMI (or SRI) and SPI, respectively, denoting and , respectively. is a copula function. In this work, we model the joint probability distribution using Clayton, Frank, Gumbel, Gaussian, and Student’s t, copula functions widely used in hydrological and meteorological applications [56]. The copula function that best captures the dependent structure between SMI (or SRI) and SPI was determined using Akaike information criteria [57,58].
Given (i.e., conditions under which SPI-m becomes a specific value or less), we may be interested in the conditional non-exceedance probability of (i.e., the probability that SMI-1 or SRI-1 becomes a specific value or less), which can be expressed as follows:
3. Results and Discussion
3.1. Soil Moisture Simulation
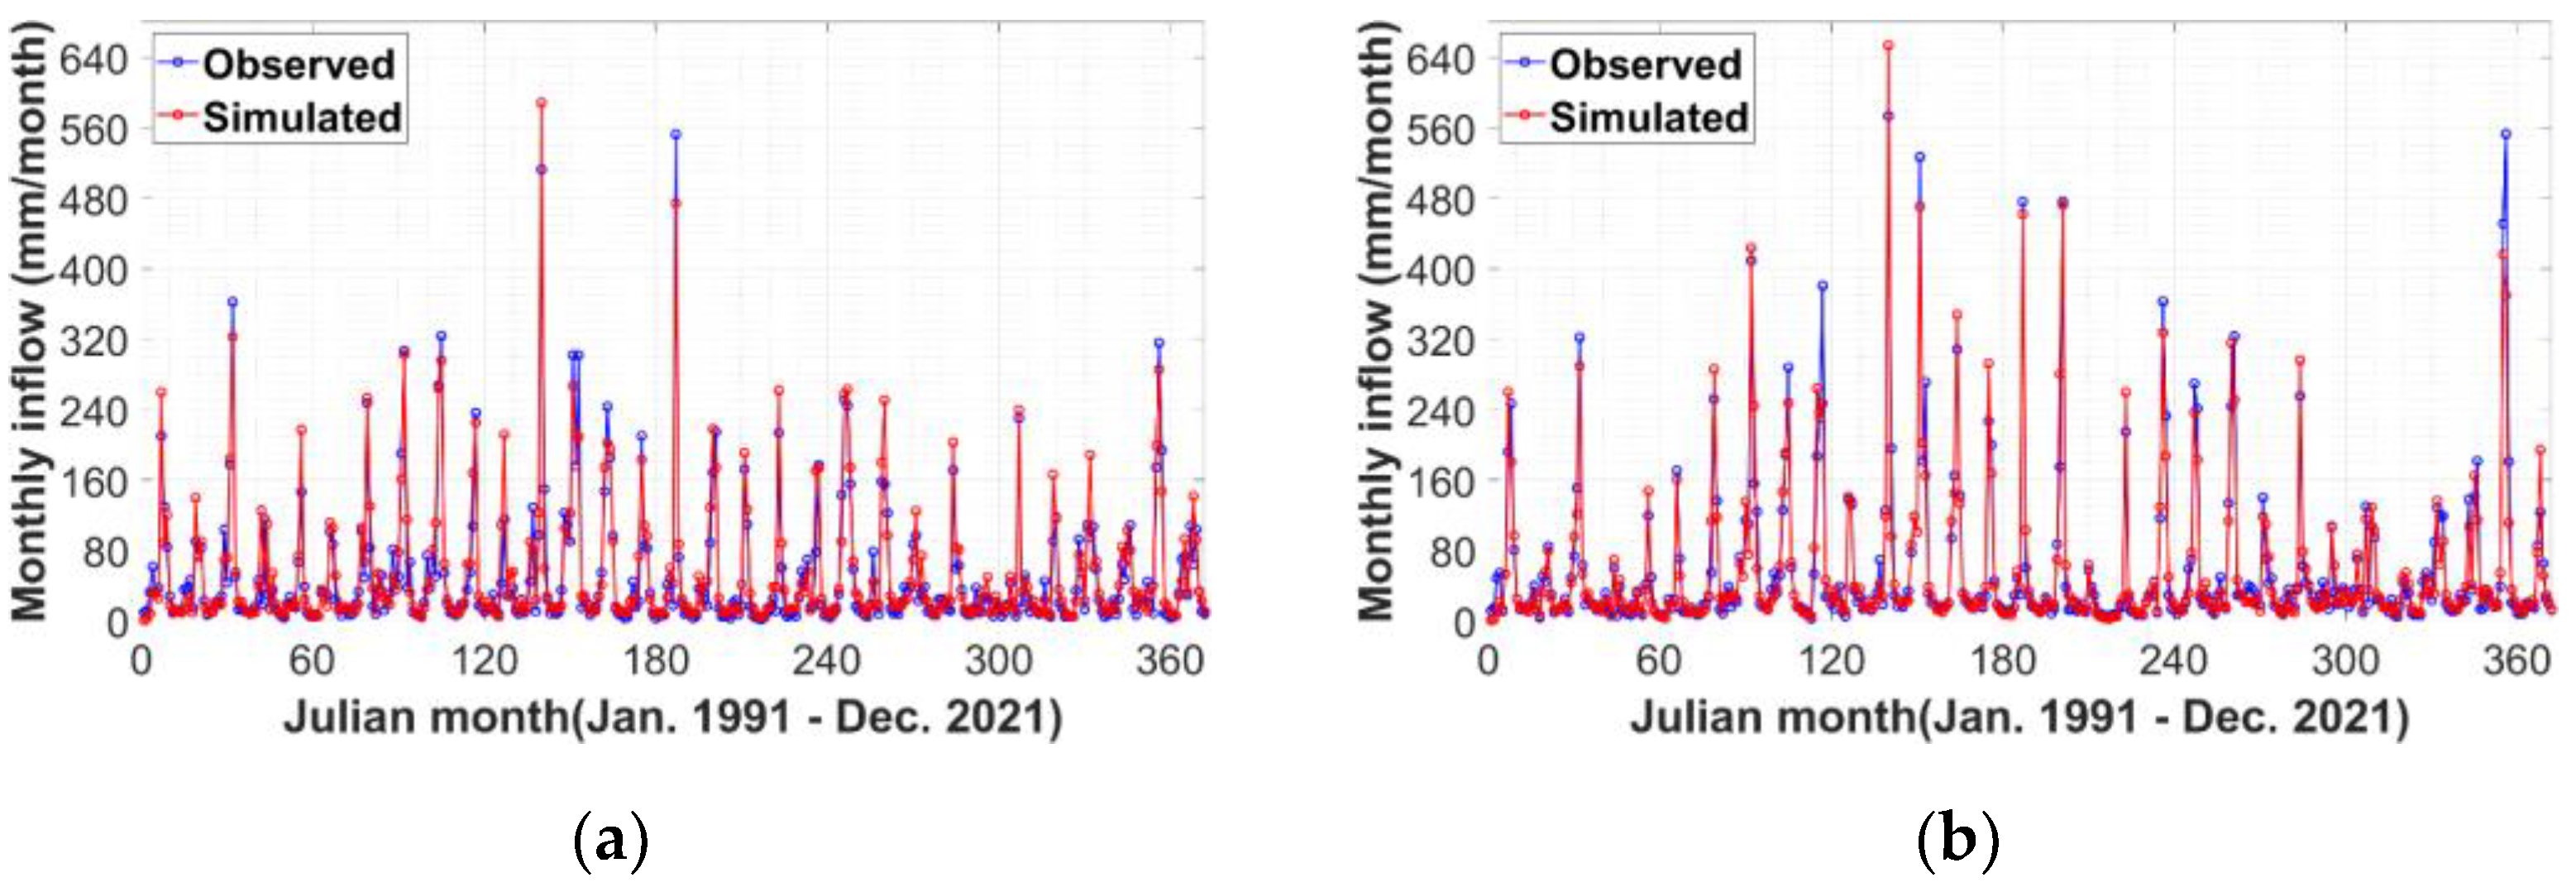
Calibration and validation of the abcd model, a monthly water balance model, were performed for the Andong Dam basin and Hapcheon Dam basin. The calibration period for the two basins was from January 1991 to December 2005, and the validation period was from January 2006 to December 2021. The area average meteorological data using the Thiessen weighting method was applied to the model. Model parameter estimation was performed using the shuffled complex evolution metropolis (SCEM) algorithm [59]. Table 1 shows the values of the estimated parameters. The performance of the model was evaluated for accuracy as shown in Table 2 by applying the coefficient of determination (), Nash–Sutcliffe efficiency (NSE), and KGE (Kling–Gupta efficiency), and it can be confirmed that all of them are 0.8 or more. In general, if is greater than 0.5, NSE is greater than 0.5, and KGE is greater than 0.6, the results of the model can be considered to be a good reproduction of observations [60,61,62].
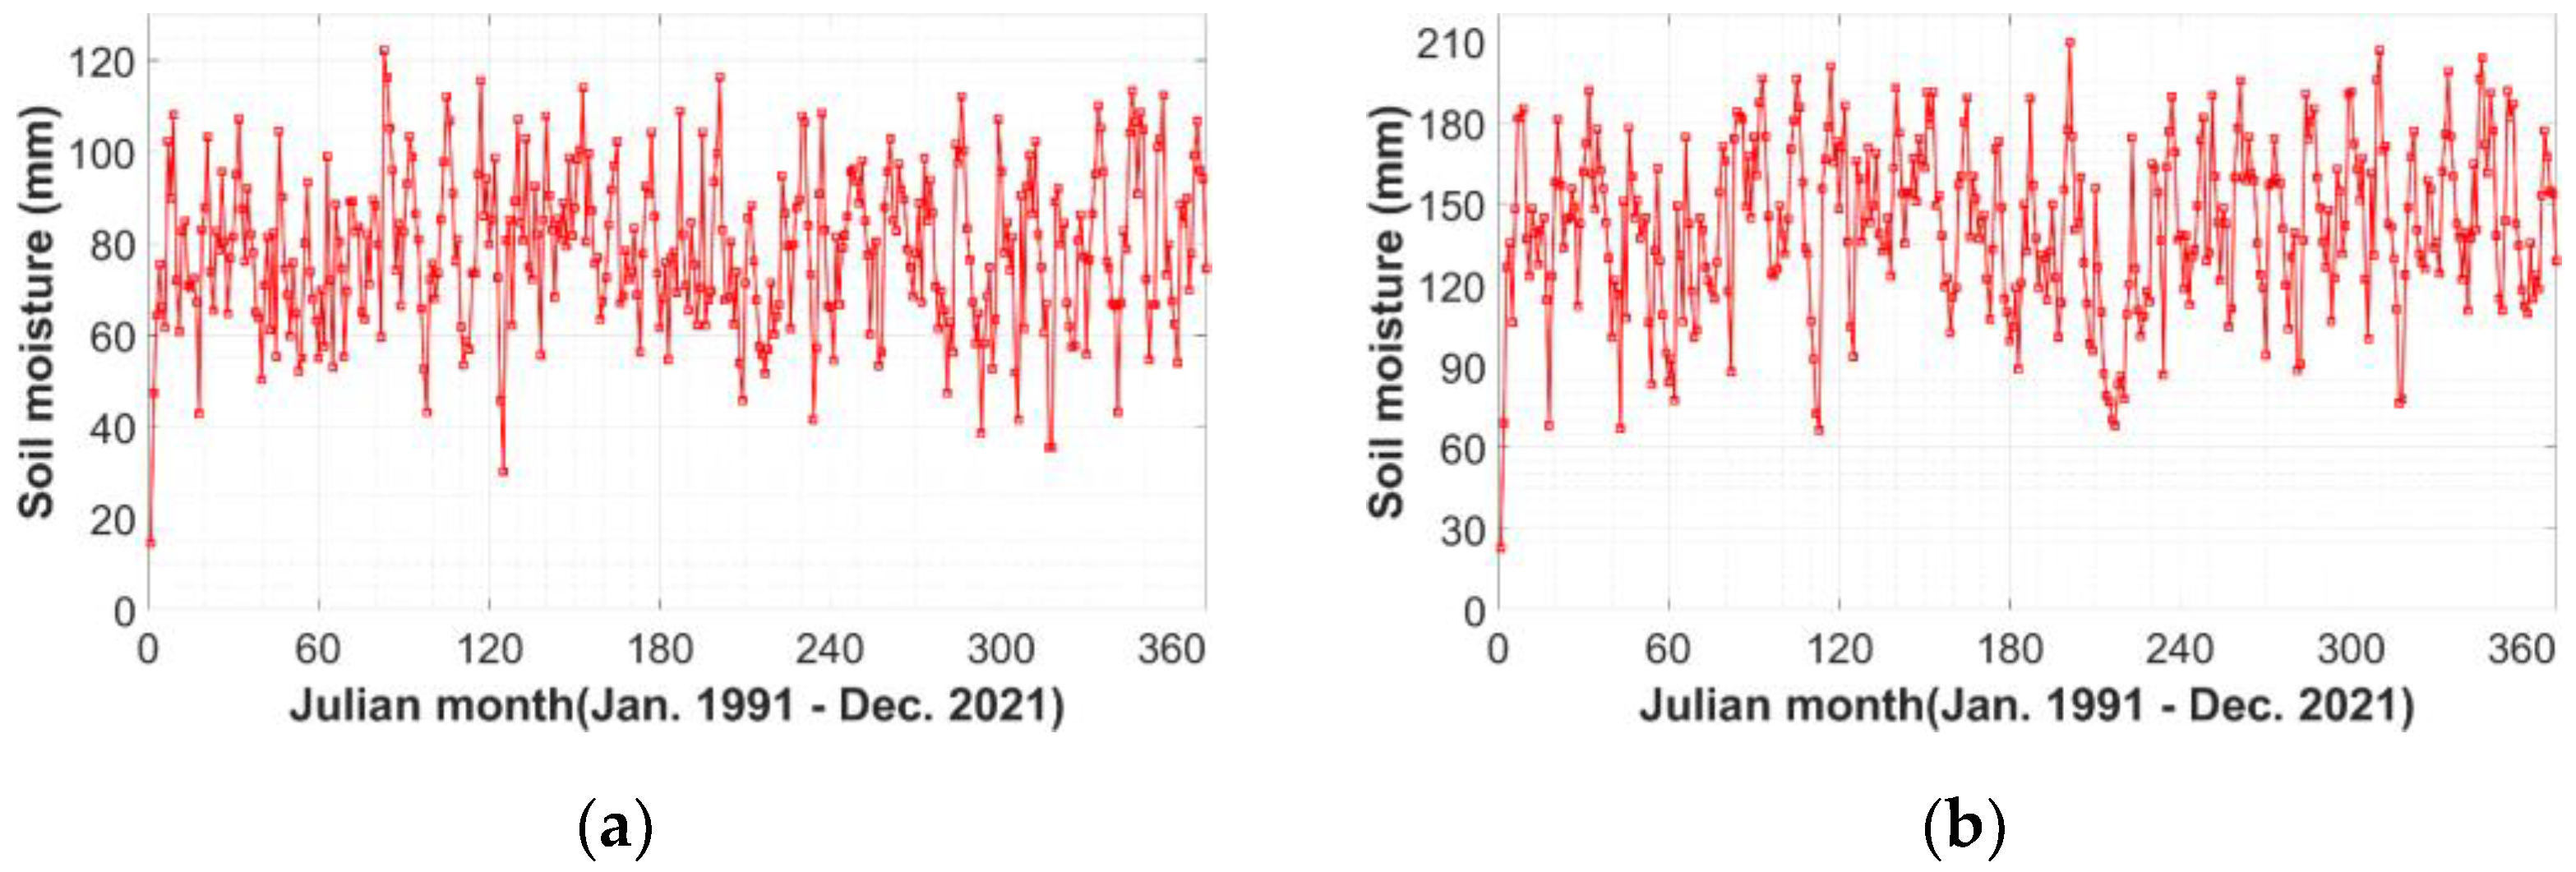
Although many studies have investigated the propagation of drought from meteorological drought to agricultural drought using soil moisture simulated by hydrologic models [36,63], it should be recognized that the soil moisture obtained from the abcd model is data simulated by the model and, therefore, contains uncertainty. Figures S1 and S3 in the Supplementary Materials show the posterior distribution of the parameters of the abcd model. In addition, in Figures S2 and S4 in the Supplementary Materials, the range of uncertainty in consideration of the mean and standard deviation of the ensemble of stream flow and soil moisture simulated from the abcd model is expressed. As can be seen from the soil moisture ensemble data, the soil moisture information obtained from the abcd model has relatively large uncertainty compared to the stream flow rate. Therefore, it can be said that the analysis related to the agricultural drought derived from this study contains many uncertainties.
Figure 3 and Figure 4 are the simulation results conducted on a monthly basis, showing the dam inflow and soil moisture storage, respectively. The soil moisture storage simulated from the model was used in the calculation of SMI-1, which expresses agricultural drought. For reference, in the case of SRI-1, which expresses hydrological drought, there is observed monthly runoff data, which were used for calculation.
3.2. Meteorological Drought Propagation Time and Correlation with Other Types of Drought
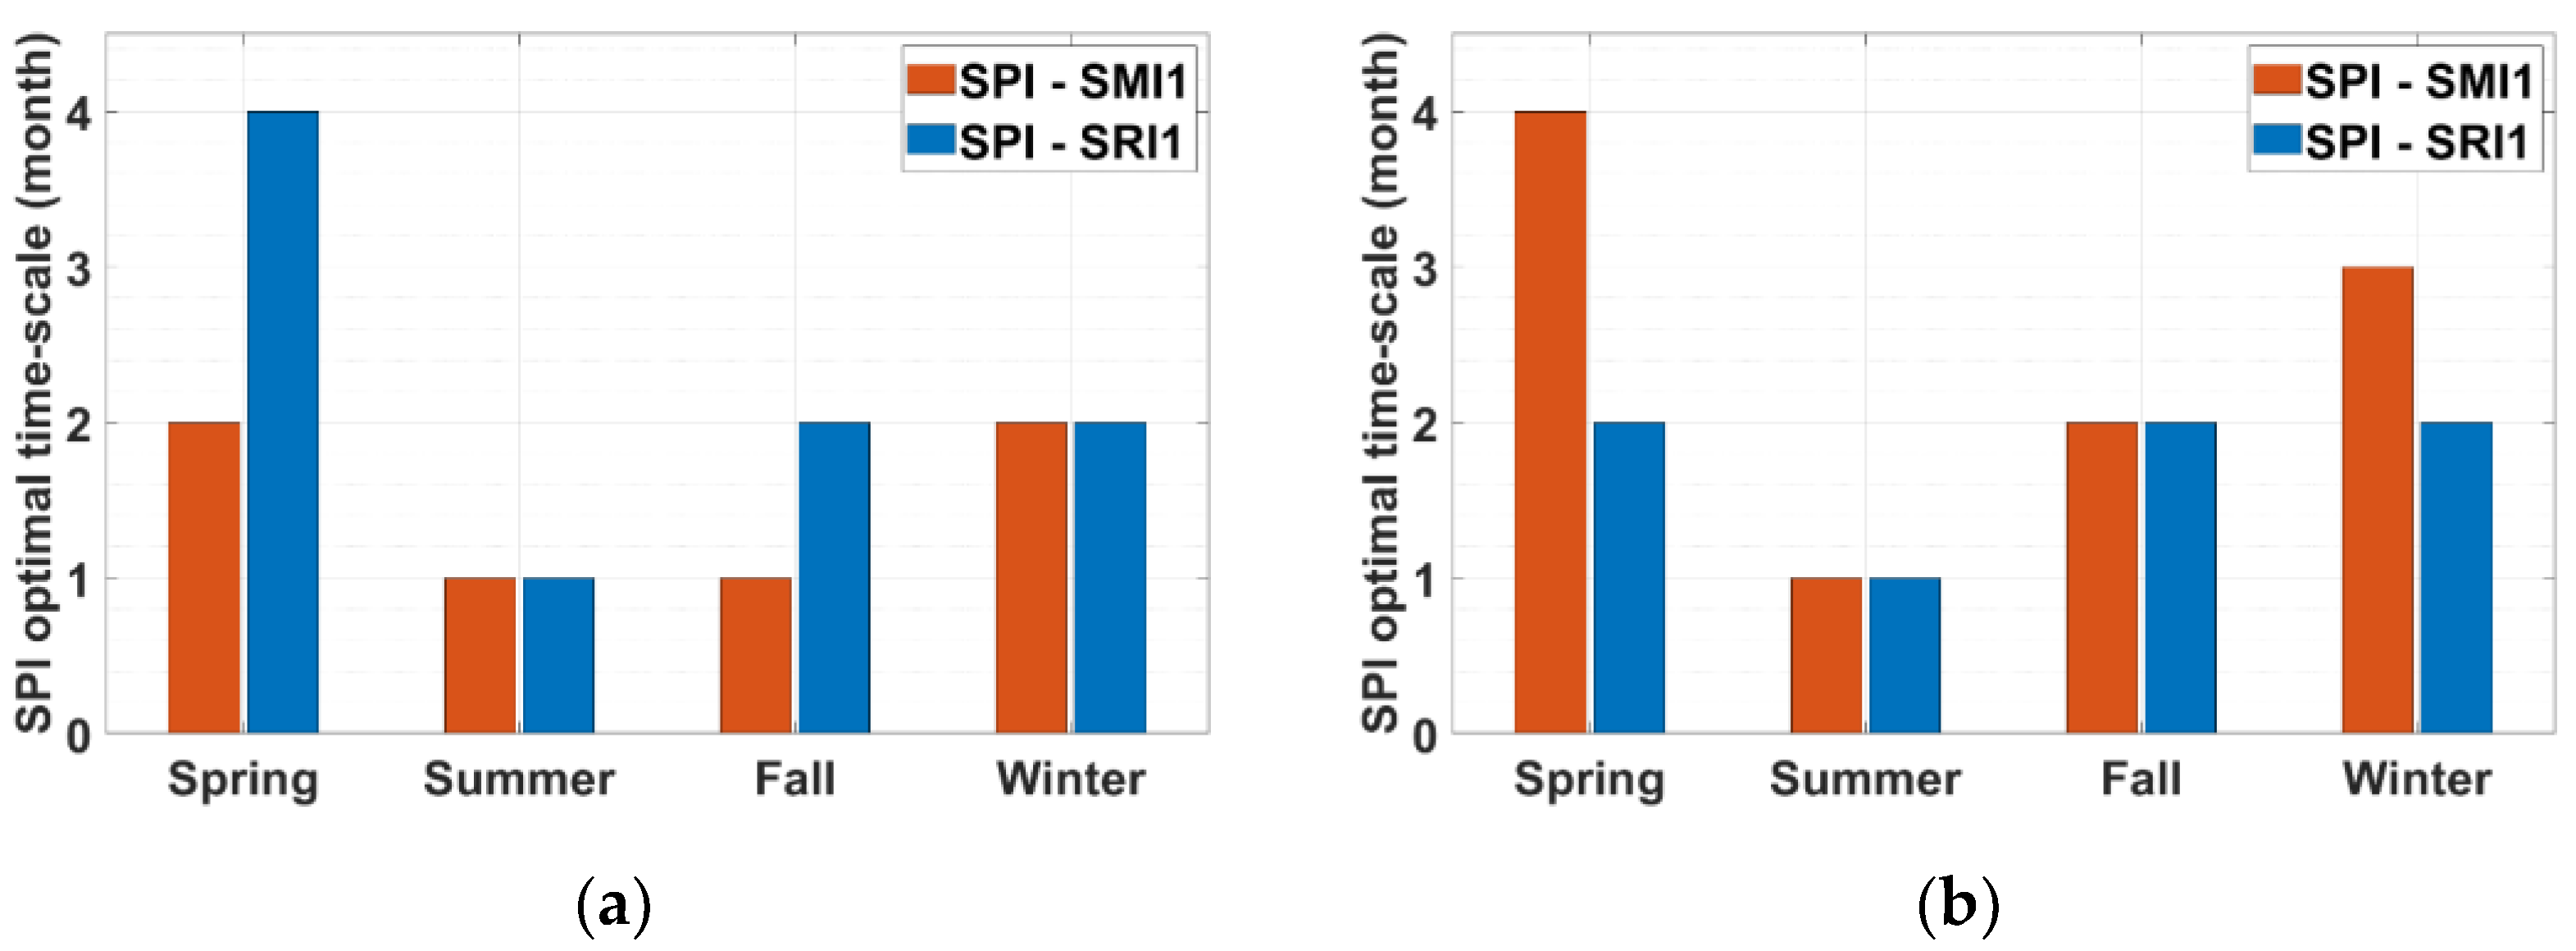
From 1992 to 2021, the correlation between SPI-m calculated on various timescales (1, 2, …, 12 months) and SMI-1 (or SRI-1) was analyzed. Figure 5 shows information on a propagation time between SPI-m and SMI-1 (or SRI-1). Figure 5 is a timescale of SPI showing the maximum cross-correlation coefficient with SMI-1 (or SRI-1). This refers to the cumulative period of precipitation that has the greatest effect on agricultural (or hydrological) drought.
In the case of the Andong Dam basin, it can be found that agricultural drought in spring and winter is most affected by cumulative precipitation in the previous 2 months, and agricultural drought in summer and fall is directly affected by precipitation in the month. In the case of the Hapcheon Dam basin, agricultural drought in spring, fall, and winter is most affected by precipitation accumulated during the preceding 4 months, 2 months, and 3 months, respectively, and agricultural drought in summer is greatly affected by precipitation in the month. In other words, agricultural drought occurring in spring in the Hapcheon Dam basin is propagating due to a lack of precipitation in winter, and agricultural drought occurring in winter seems to be due to a lack of precipitation in autumn.
Through the relationship between SPI and SRI, the propagation time to hydrological drought can also be examined. In the case of the Andong Dam basin, it can be said that the decrease in spring inflow is affected by the lack of precipitation during the previous 4 months, and the decrease in inflow in autumn and winter is the propagation of the lack of precipitation in the preceding 2 months. In the case of the Hapcheon Dam basin, the decrease in inflow in spring, fall, and winter all seems to have been propagated due to a lack of precipitation during the previous 2 months. In both basins, it can be found that the decrease in summer inflow is directly affected by the decrease in precipitation for the month.
Looking at the main characteristics of propagation time, it is very short in summer. This seems to be primarily due to the characteristics of the Far East Asian monsoon climate, where precipitation is concentrated in summer. In addition, this means that drought is responding relatively quickly to fluctuations in precipitation due to high surface air temperatures and strengthening hydrological circulation in summer [25]. In summer, the temperature rises rapidly, and the soil moisture evapotranspiration rate tends to increase due to high precipitation [64]. However, since summer is a season when vegetation flourishes, sufficient soil moisture is needed to maintain vegetation growth [65]. In other words, short-term precipitation shortages are linked to the rapid biochemical processing rate of vegetation, increasing the likelihood of propagating to agricultural drought [36]. Another notable feature is that the propagation time in spring is relatively long compared to other seasons. This means that winter precipitation plays an important role in agricultural drought and dam inflow in spring, the sowing season.
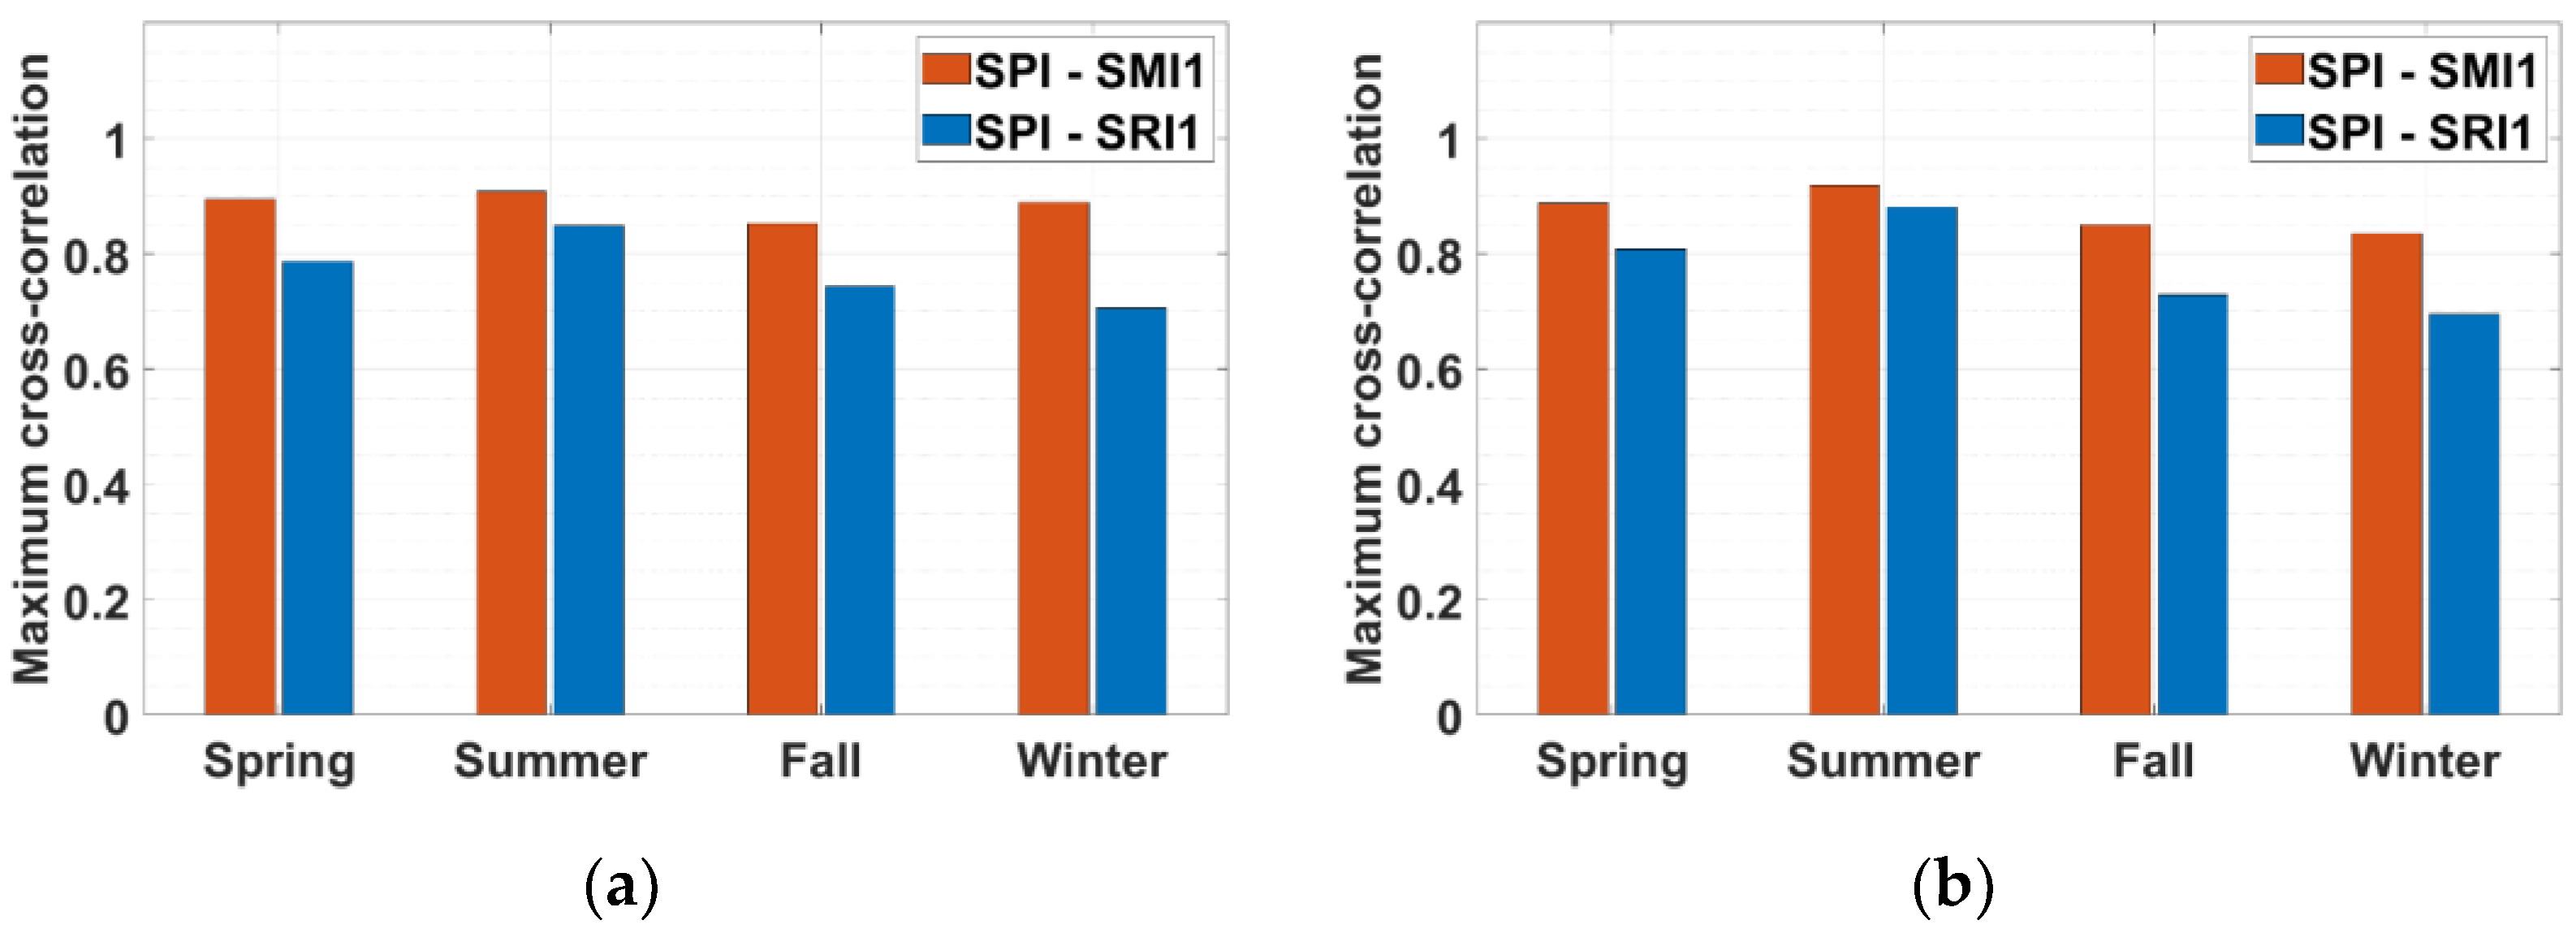
Figure 6 shows the cross-correlation coefficient between SPI-m and SMI-1 (or SRI-1) corresponding to the propagation time. In both regions, the cross-correlation coefficient between meteorological and agricultural droughts is found to be very high at 0.8 or higher. The correlation between meteorological and hydrological droughts is 0.8 or higher in summer, and is lower in other seasons. However, it can still be found that there is a high correlation of 0.7 or more.
The cross-correlation coefficients of SPI and SMI (or SRI) varied depending on the region, season, and timescale. This means that the correlation between SPI and SMI (or SRI) may vary by region and season. In addition, even if the same drought index is applied, it can be found that the correlation strength with SMI (or SRI) is different depending on which timescale it is calculated. In particular, the regional difference in drought propagation time was most noticeable in spring. This seems to be the influence of winter snowfall. This is because snowfall in winter can only replenish soil moisture or contribute to the amount of inflow only in spring when the temperature rises. In addition, in the case of the two regions, it can be seen that the correlation strength between meteorological and agricultural droughts is greater than that between meteorological and hydrological droughts.
3.3. Propagation of Drought Severity
In this study, copula-based methods for bivariate probability analysis were used to quantify the risk of monthly drought propagation from meteorological drought to agricultural (or hydrological) drought. The combined distribution between meteorological and agricultural (or hydrological) droughts based on propagation time was modeled using the SPI-m time series most correlated with the monthly SMI-1 (or SRI-1) time series.
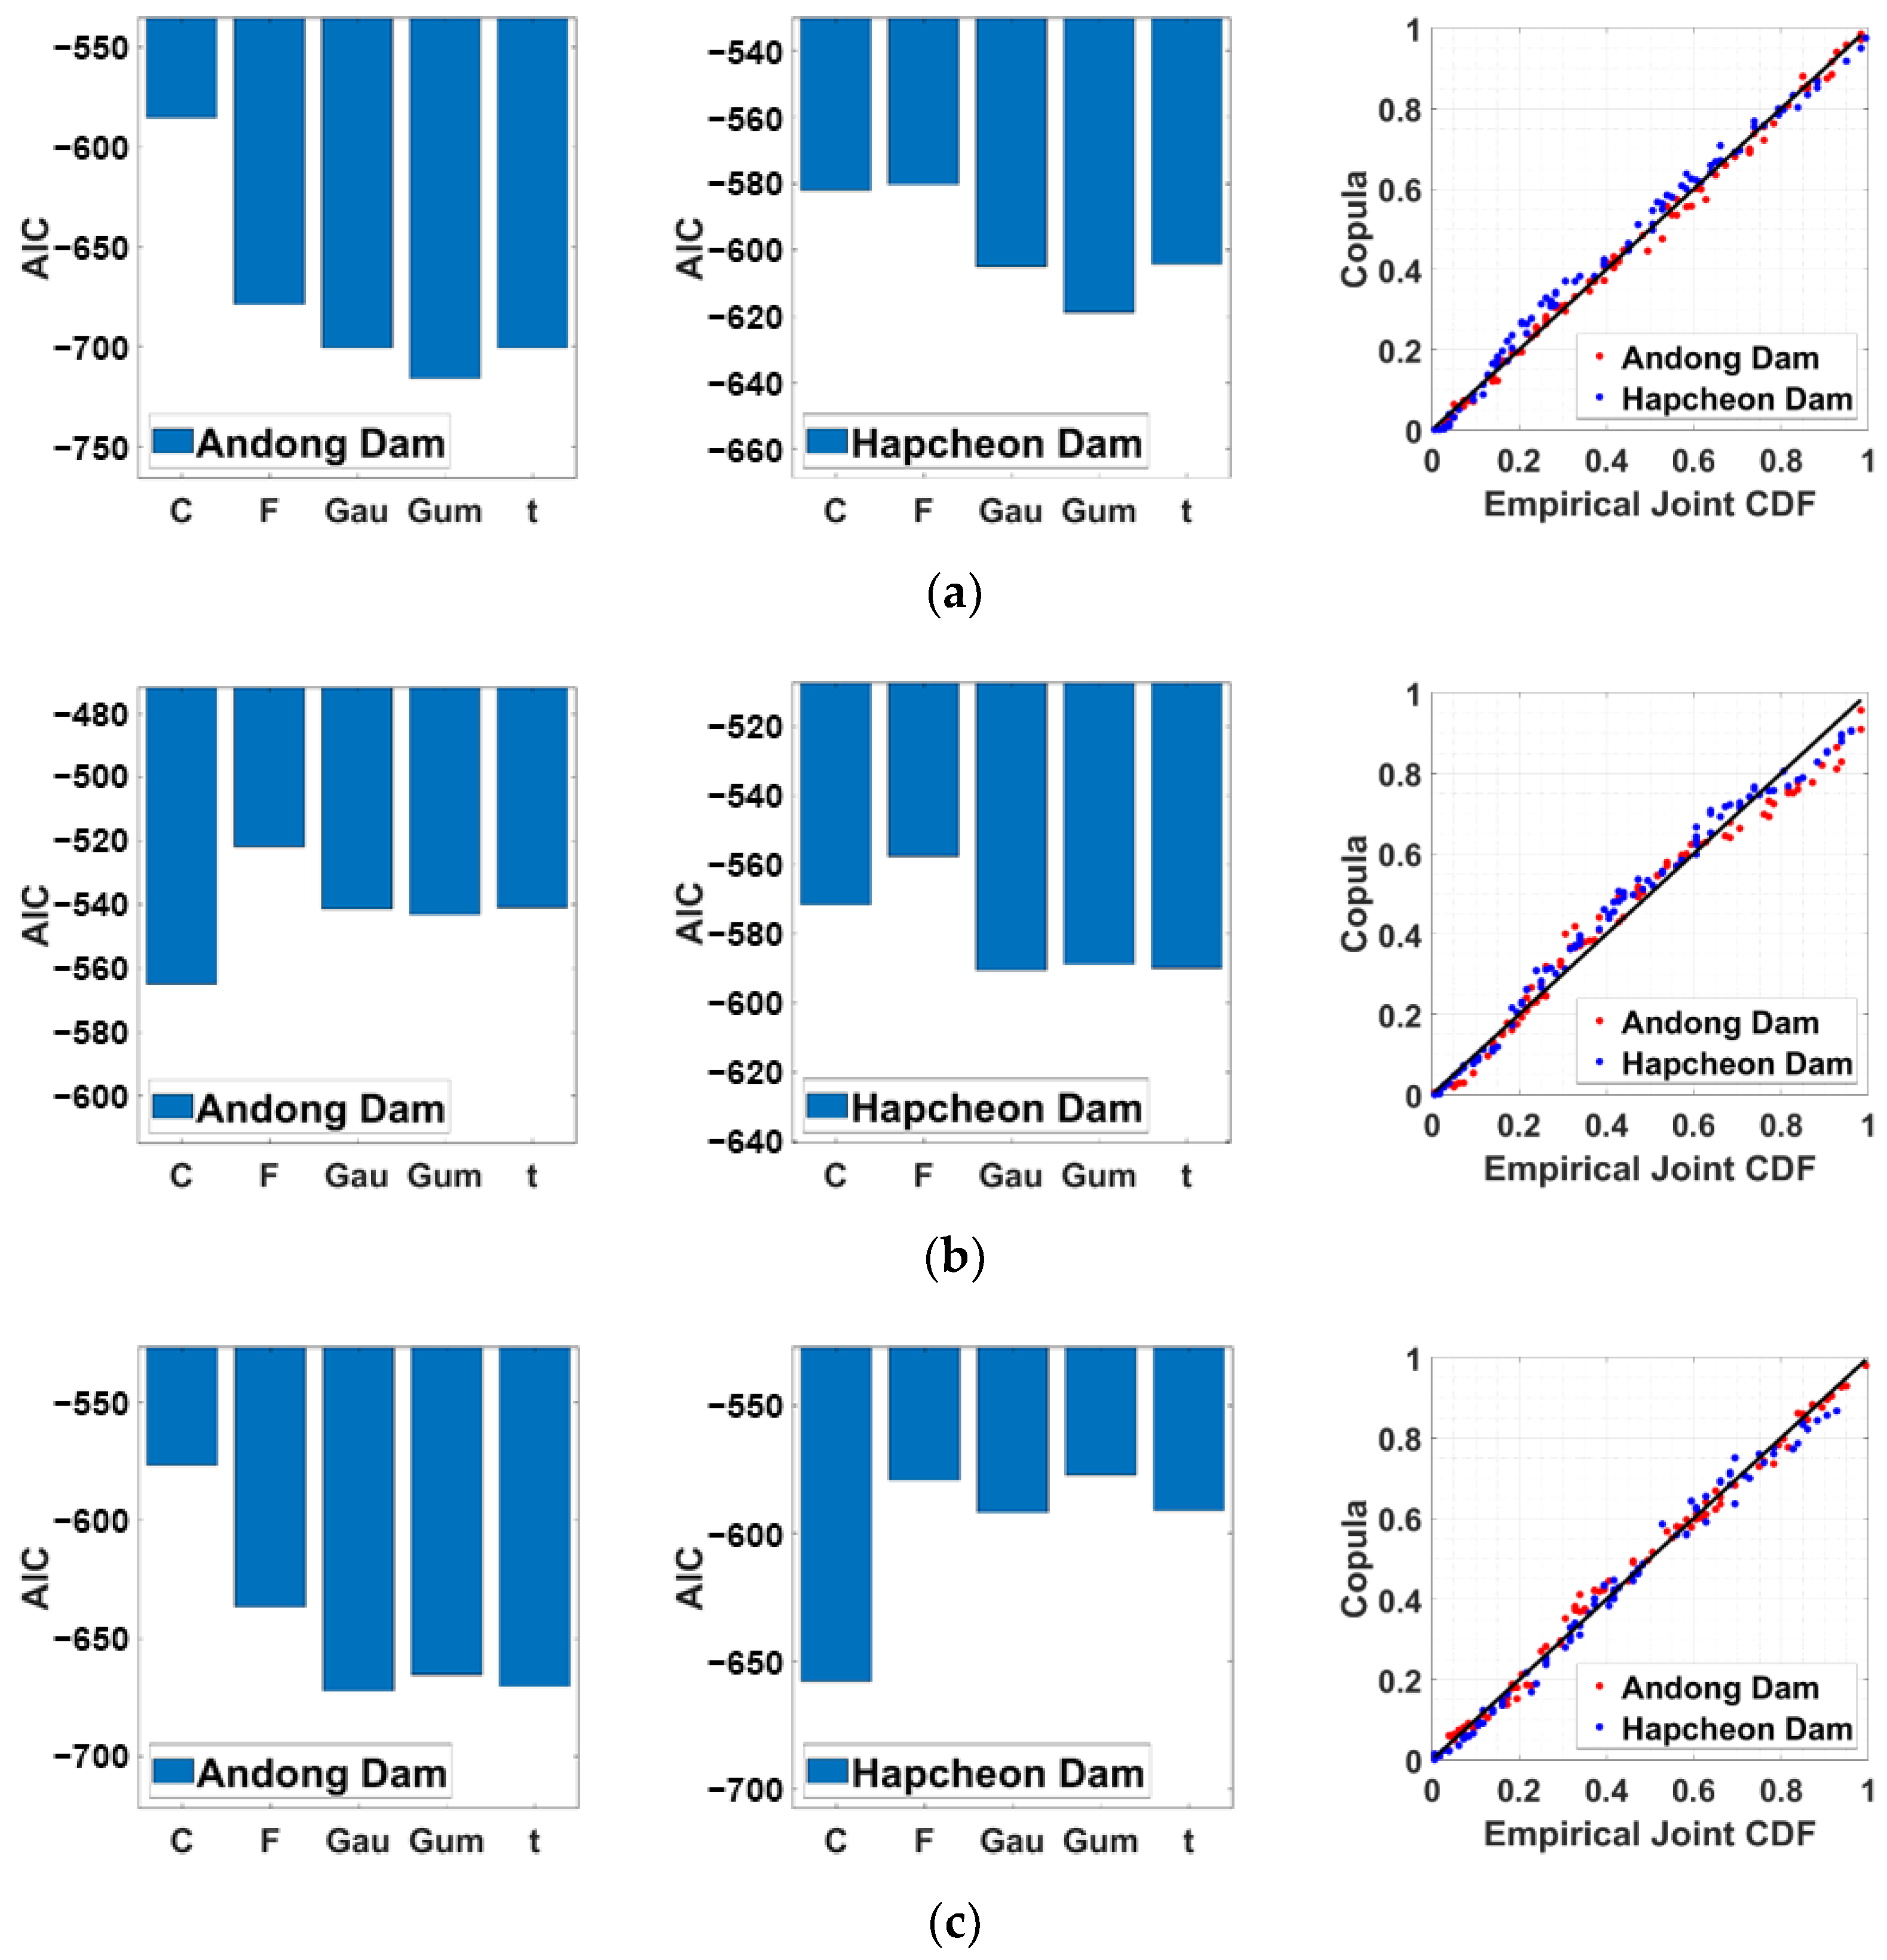
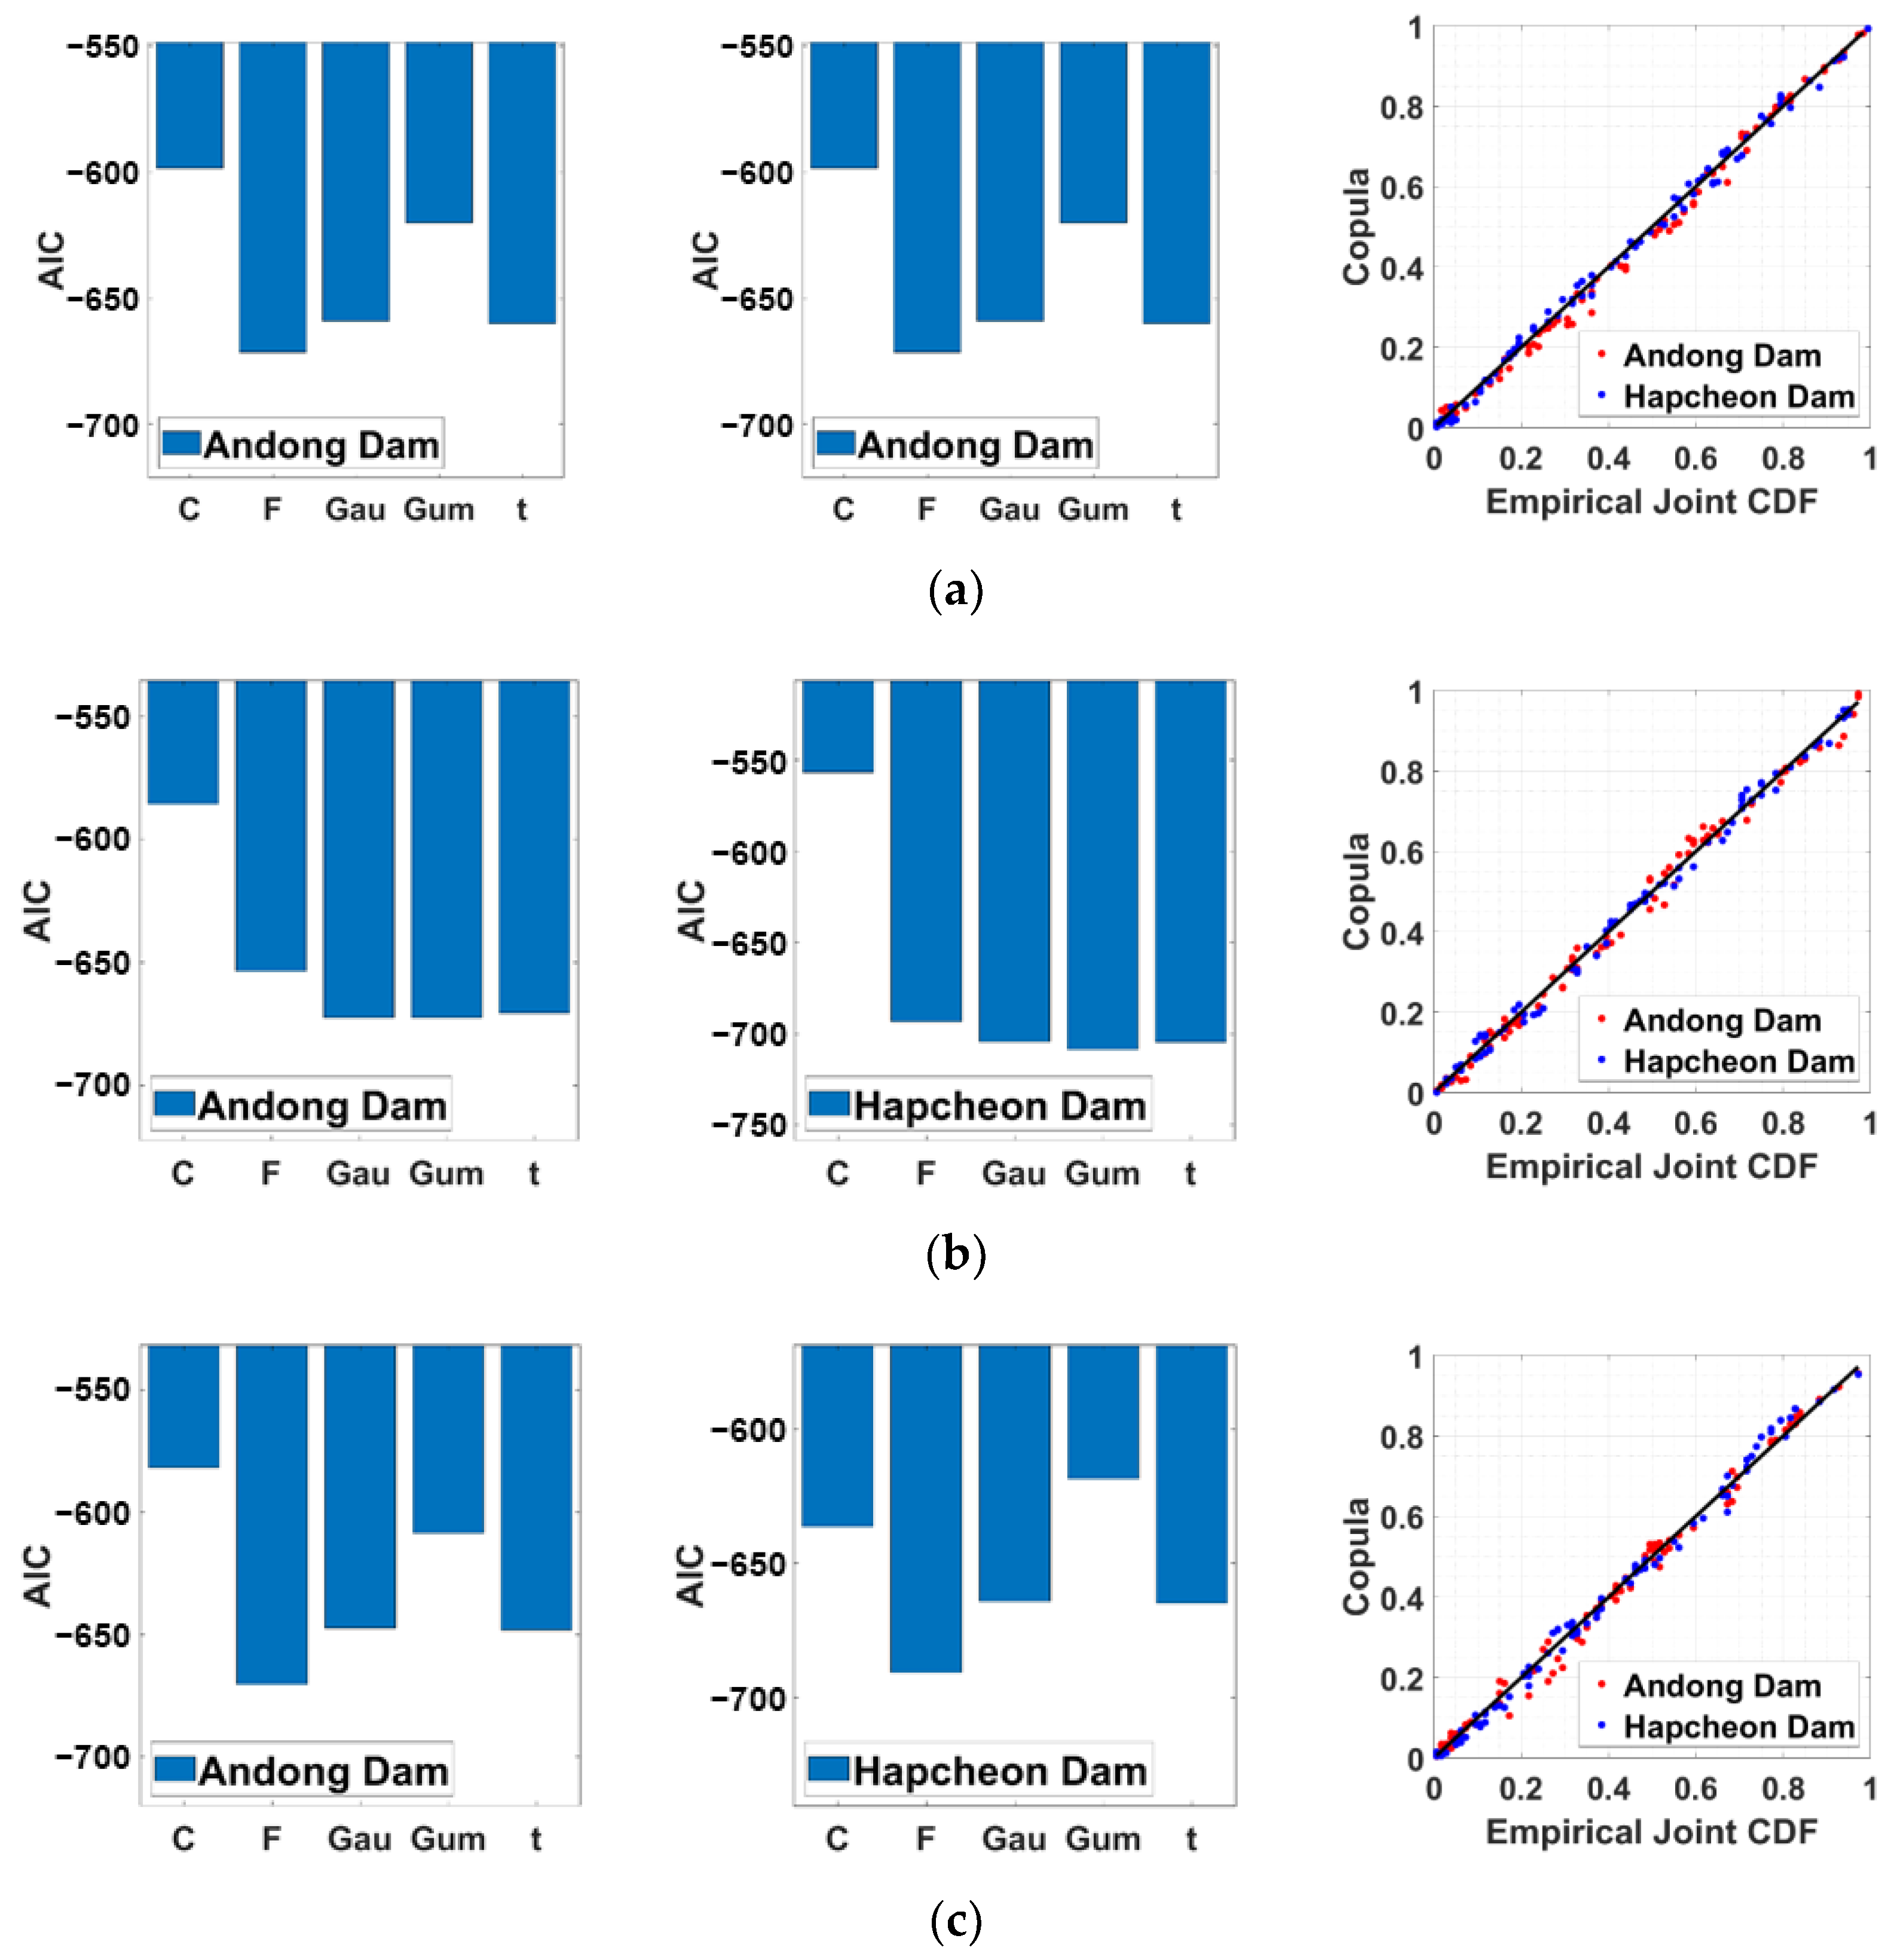
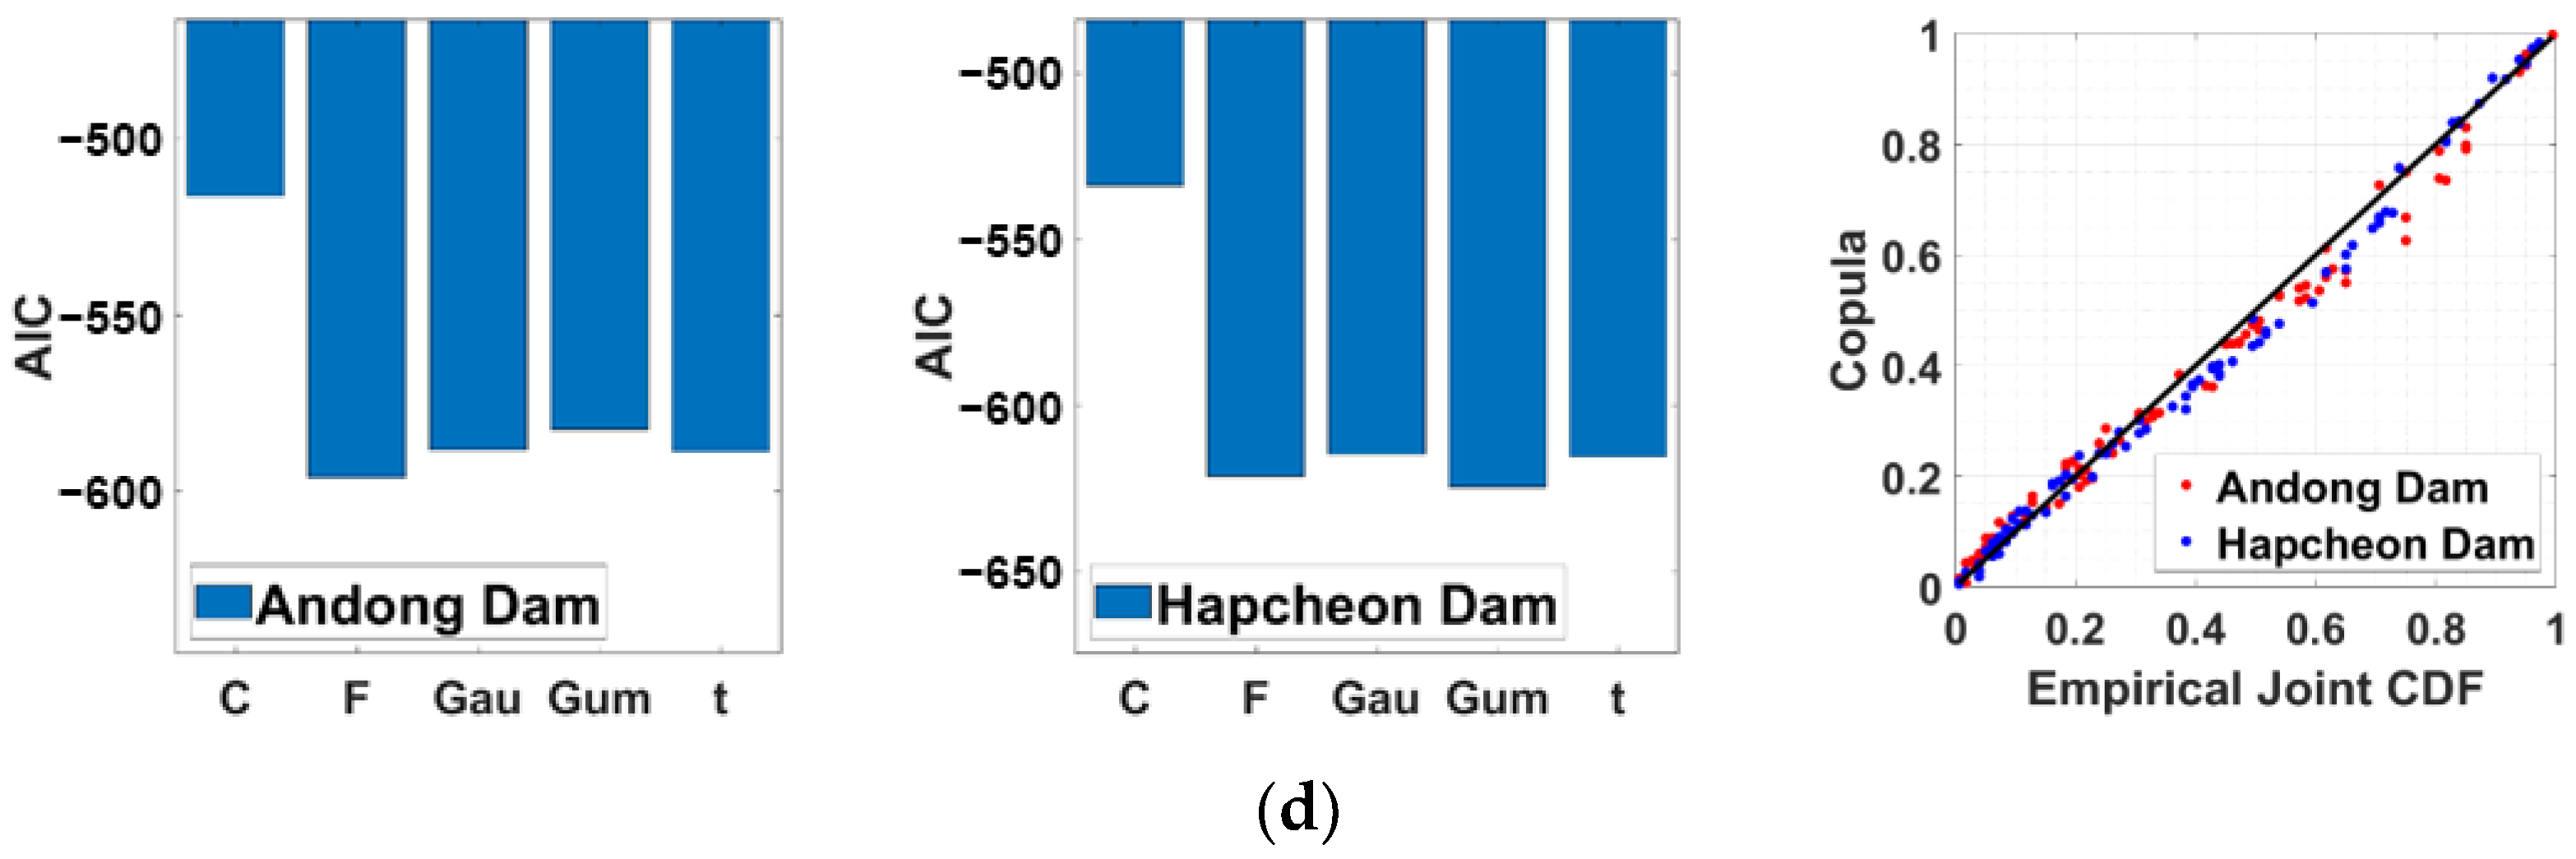
Figure 7 (or Figure 8) shows the copula modeling results for SPI-m and SMI-1 (or SRI-1). The AIC (Andong Dam Basin and Hapcheon Dam Basin) of the copula functions calculated for each season and the Q–Q plot of the selected optimal copula function are shown in order. The horizontal axes of the left and center panels are five applied copula functions, and the vertical axis shows the AIC for the corresponding copula function. It can be seen that the copula function with the smallest AIC was selected as the optimal copula function that best describes the dependent structure between SPI and SMI (or SRI), and that the optimal copula function was selected differently between basins and seasons. This fact means that it is important to select the optimal copula function individually for each basin or season. The right panel indicates that the selected optimal copula function reproduces the dependency relationship between SPI and SMI (or SRI) relatively well.
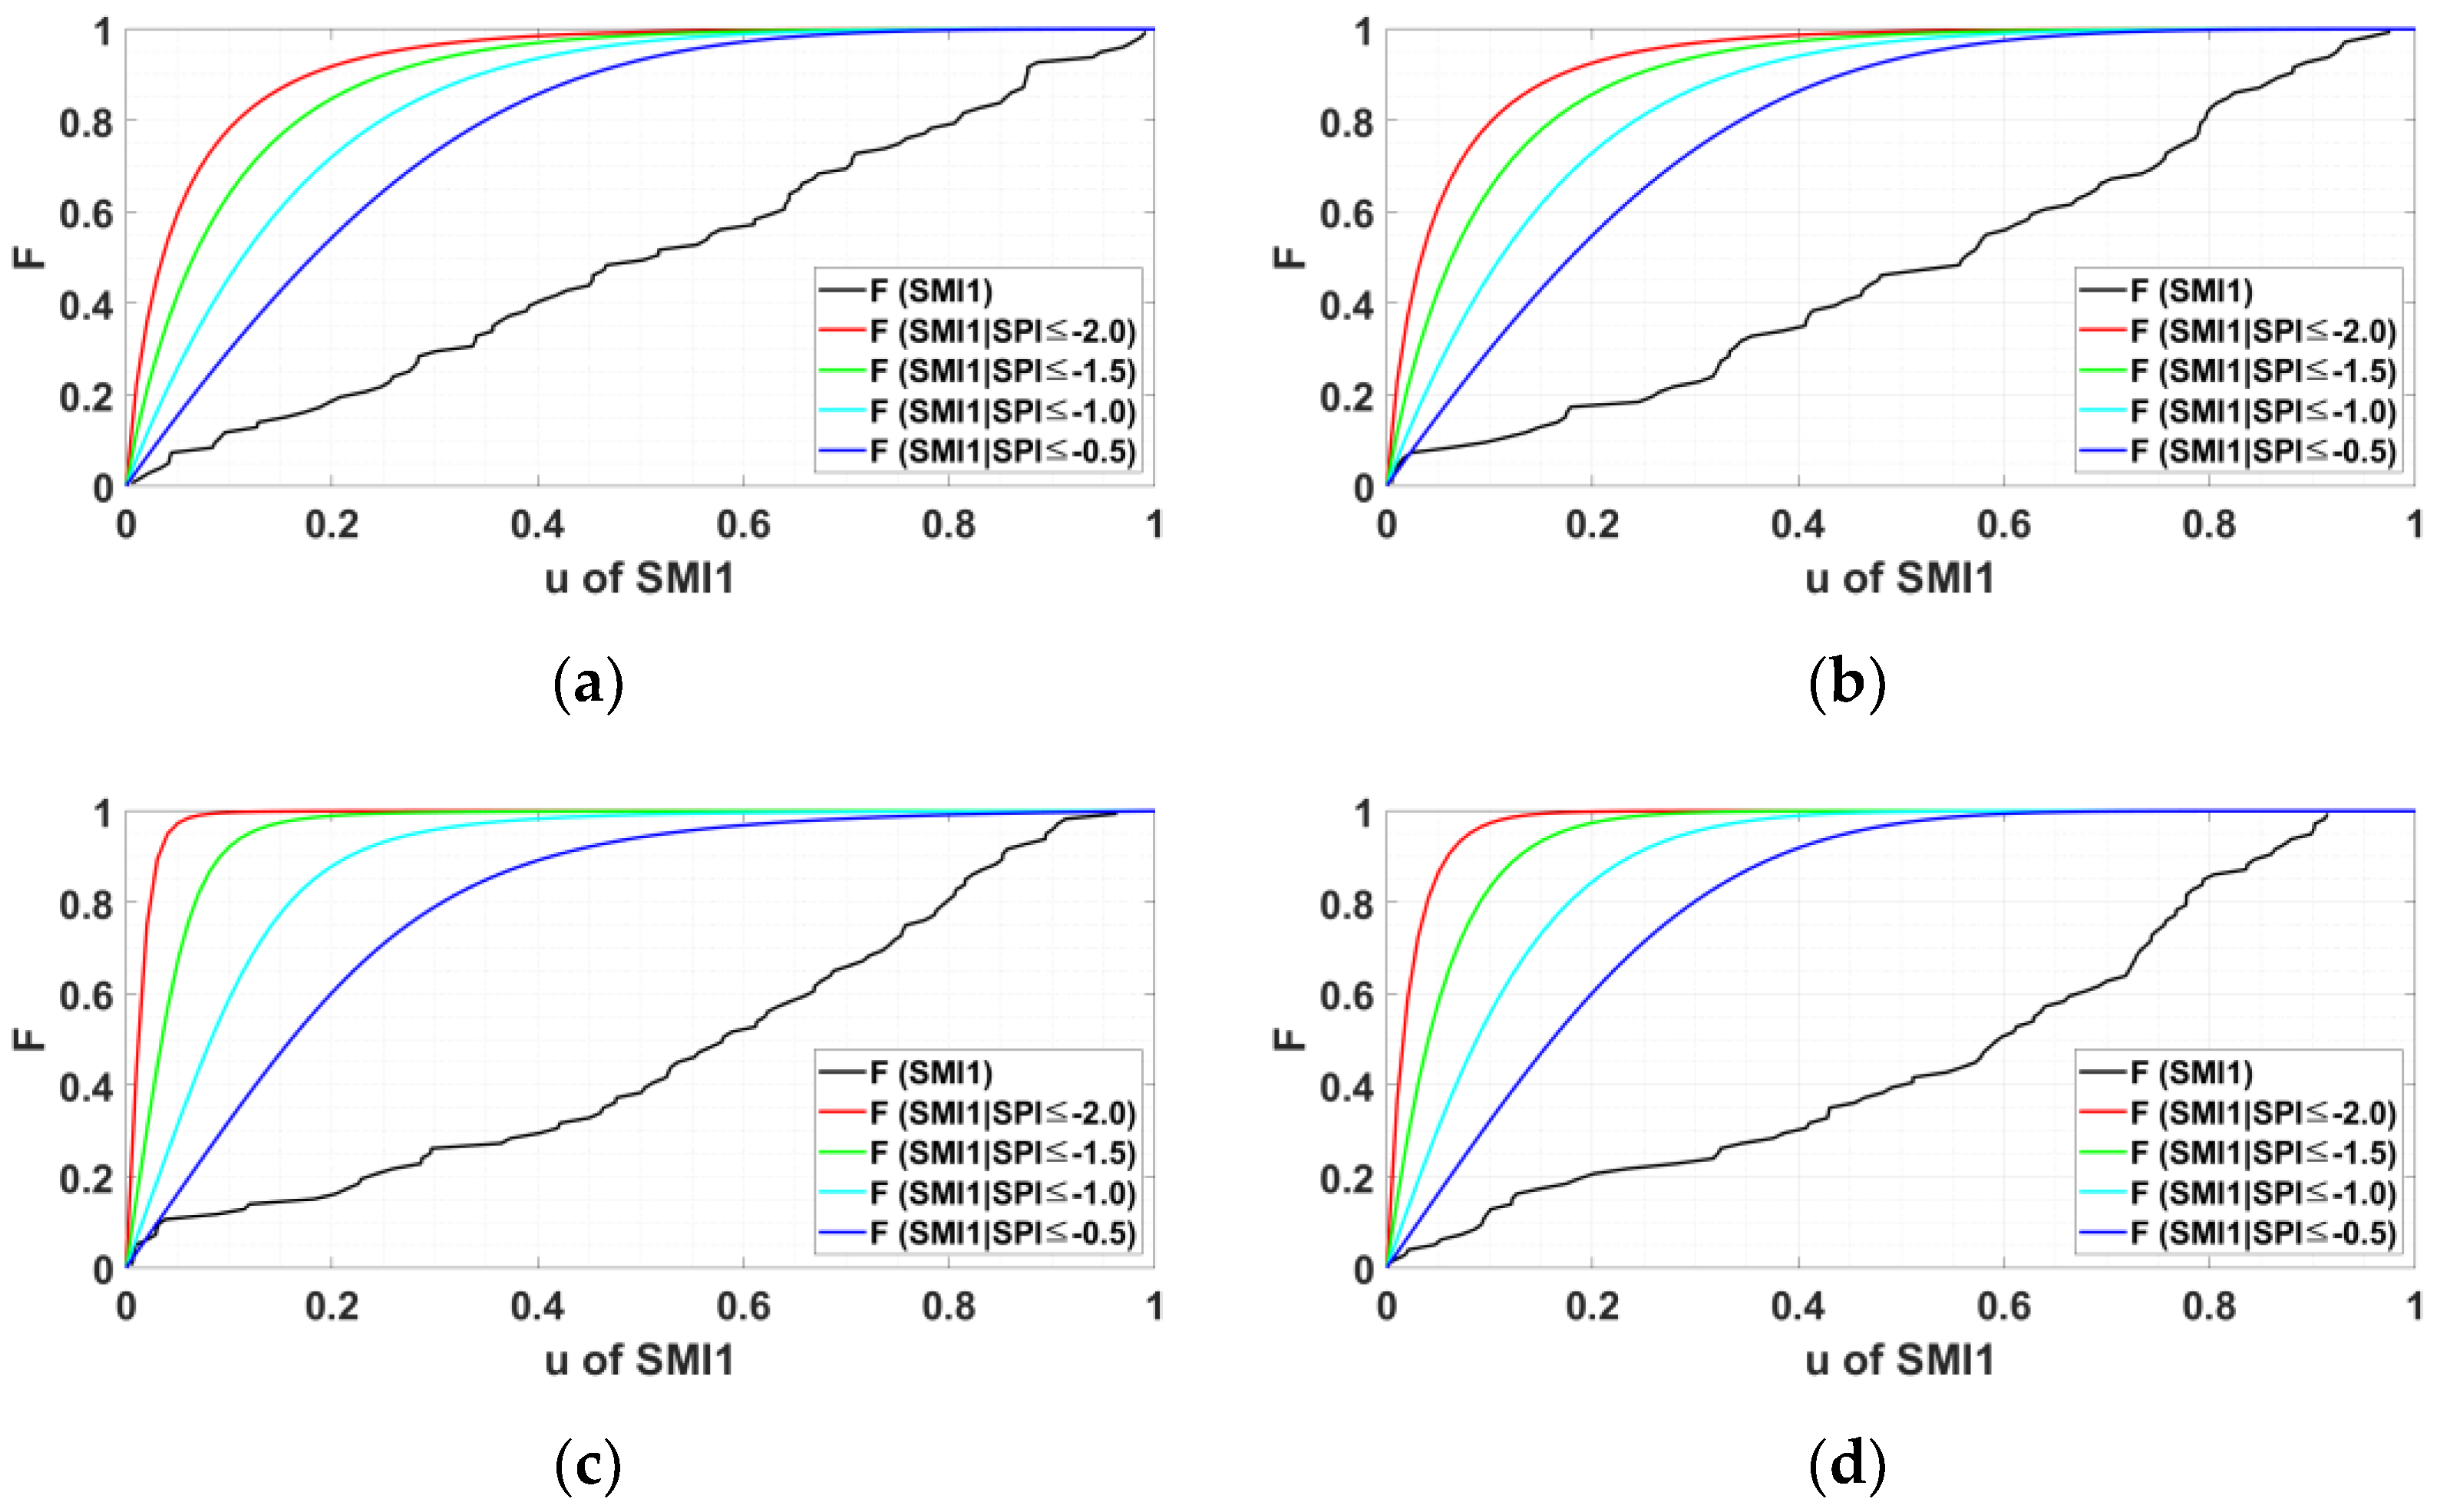
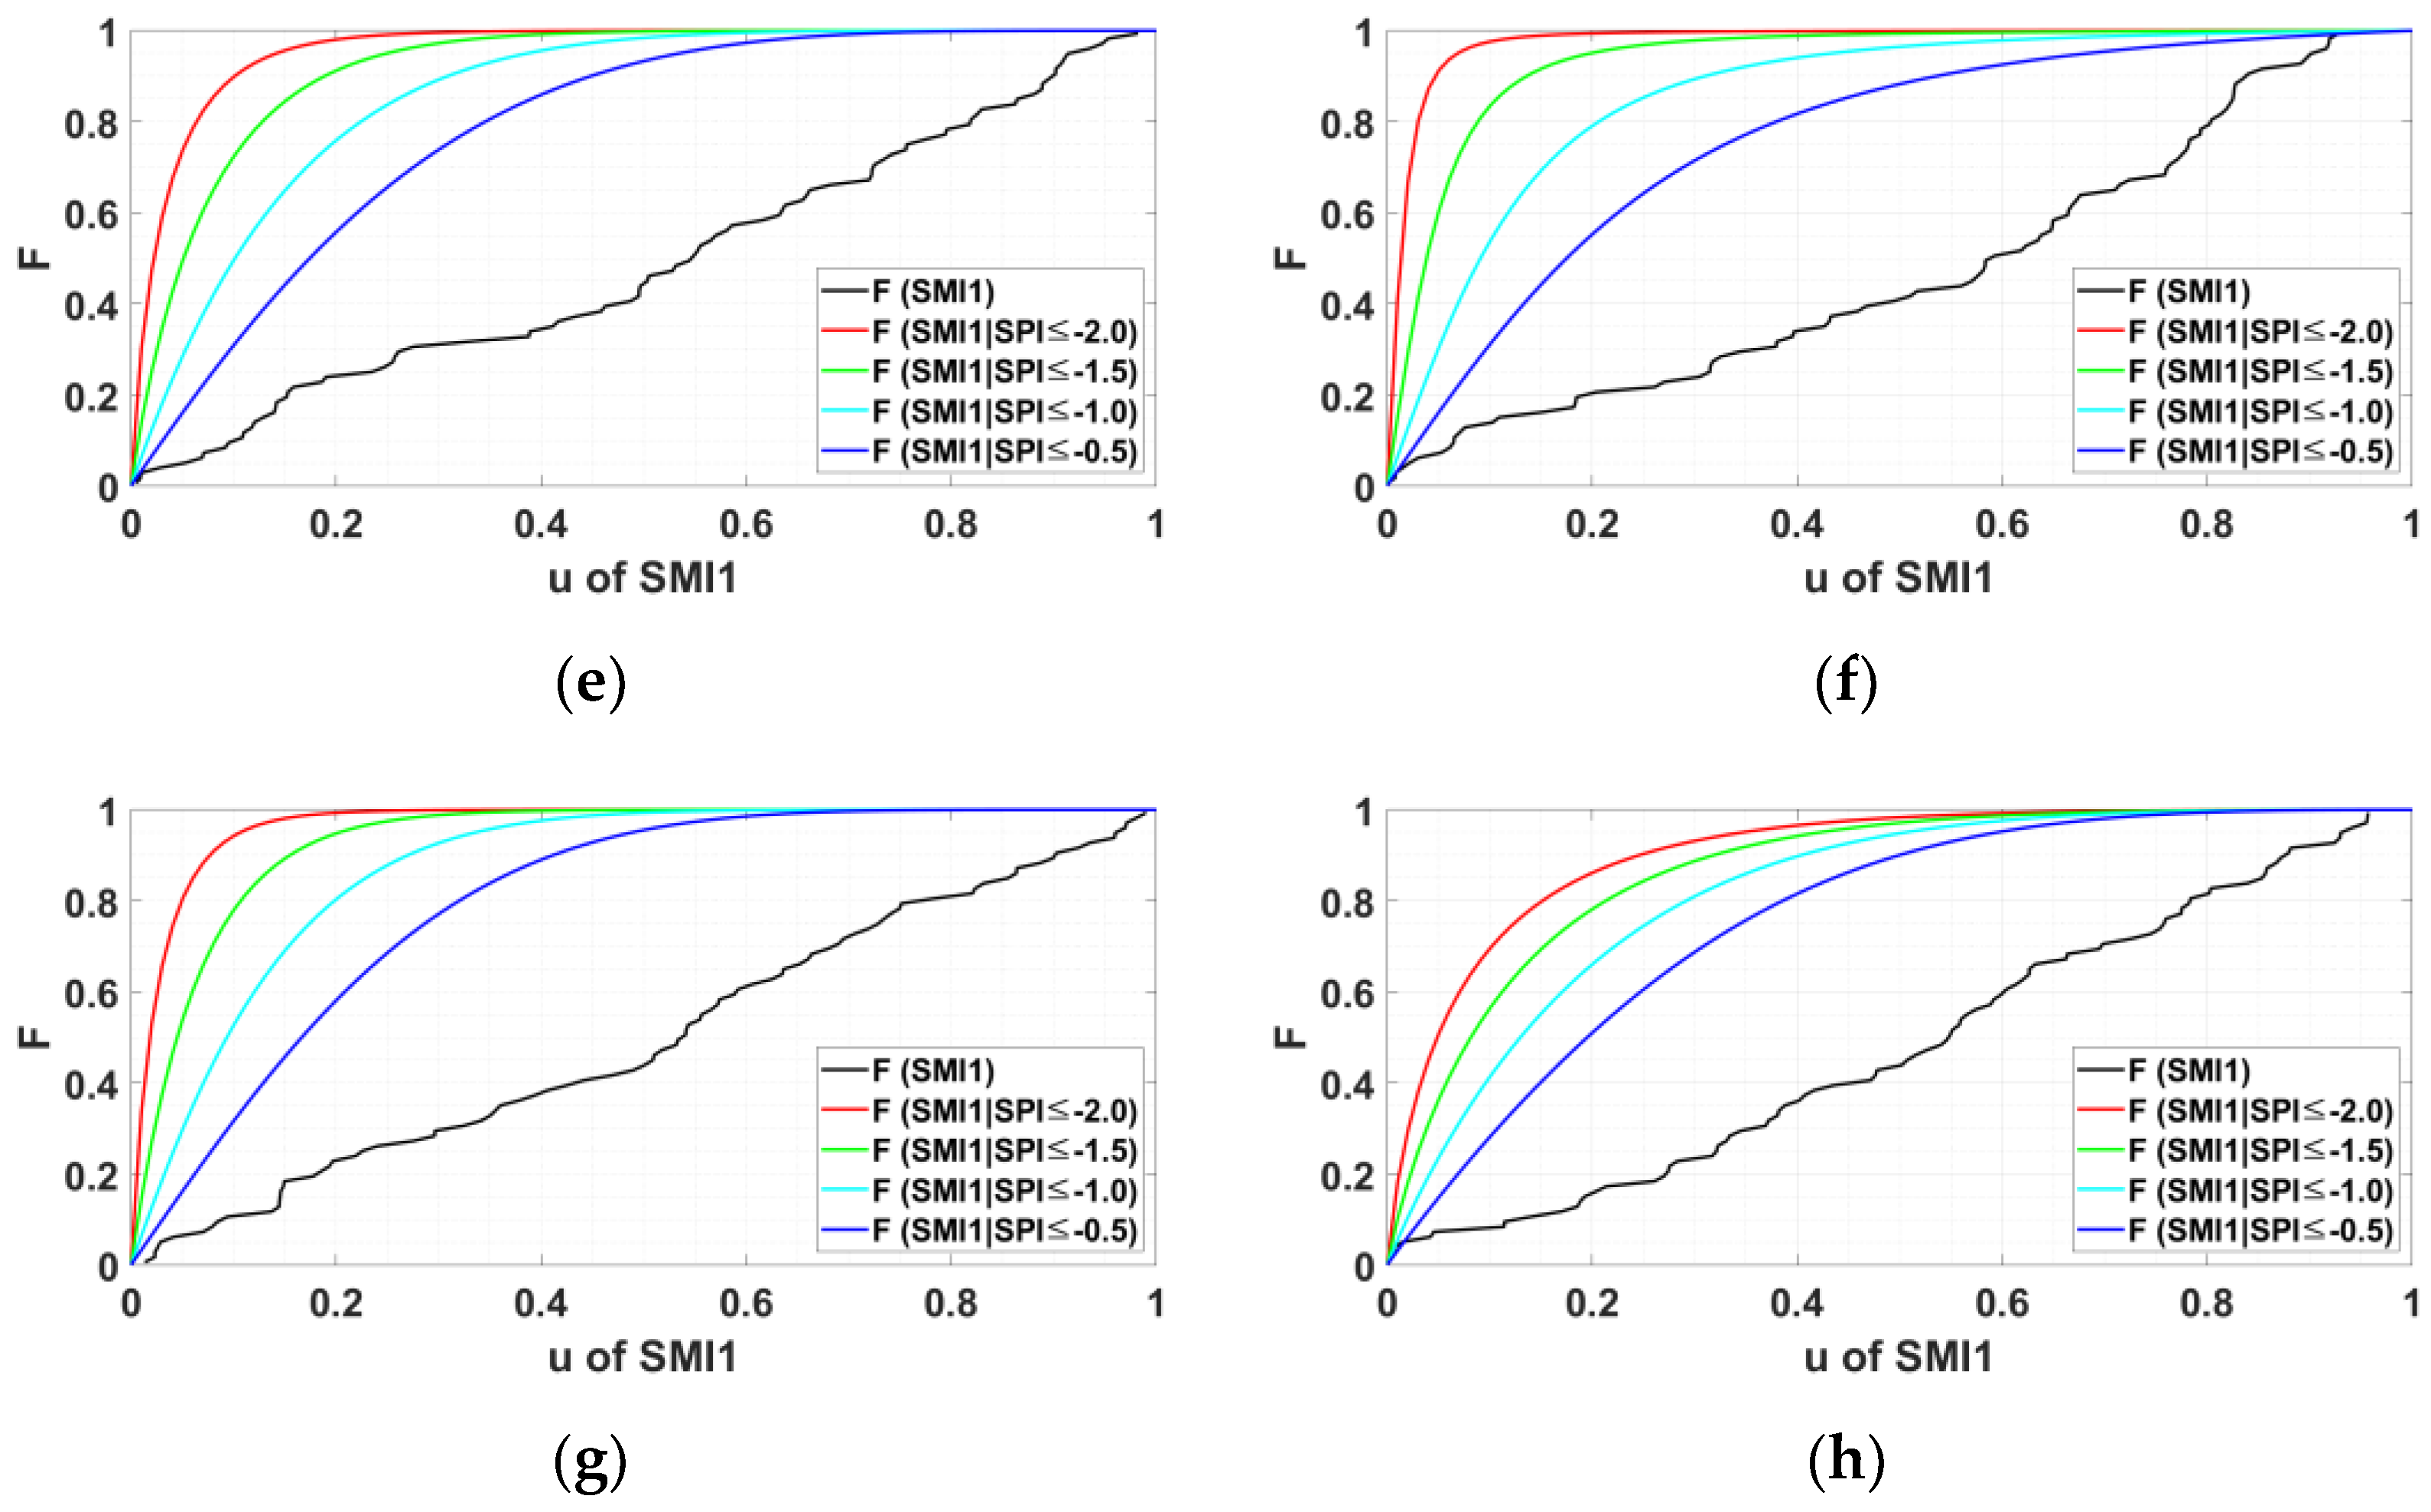
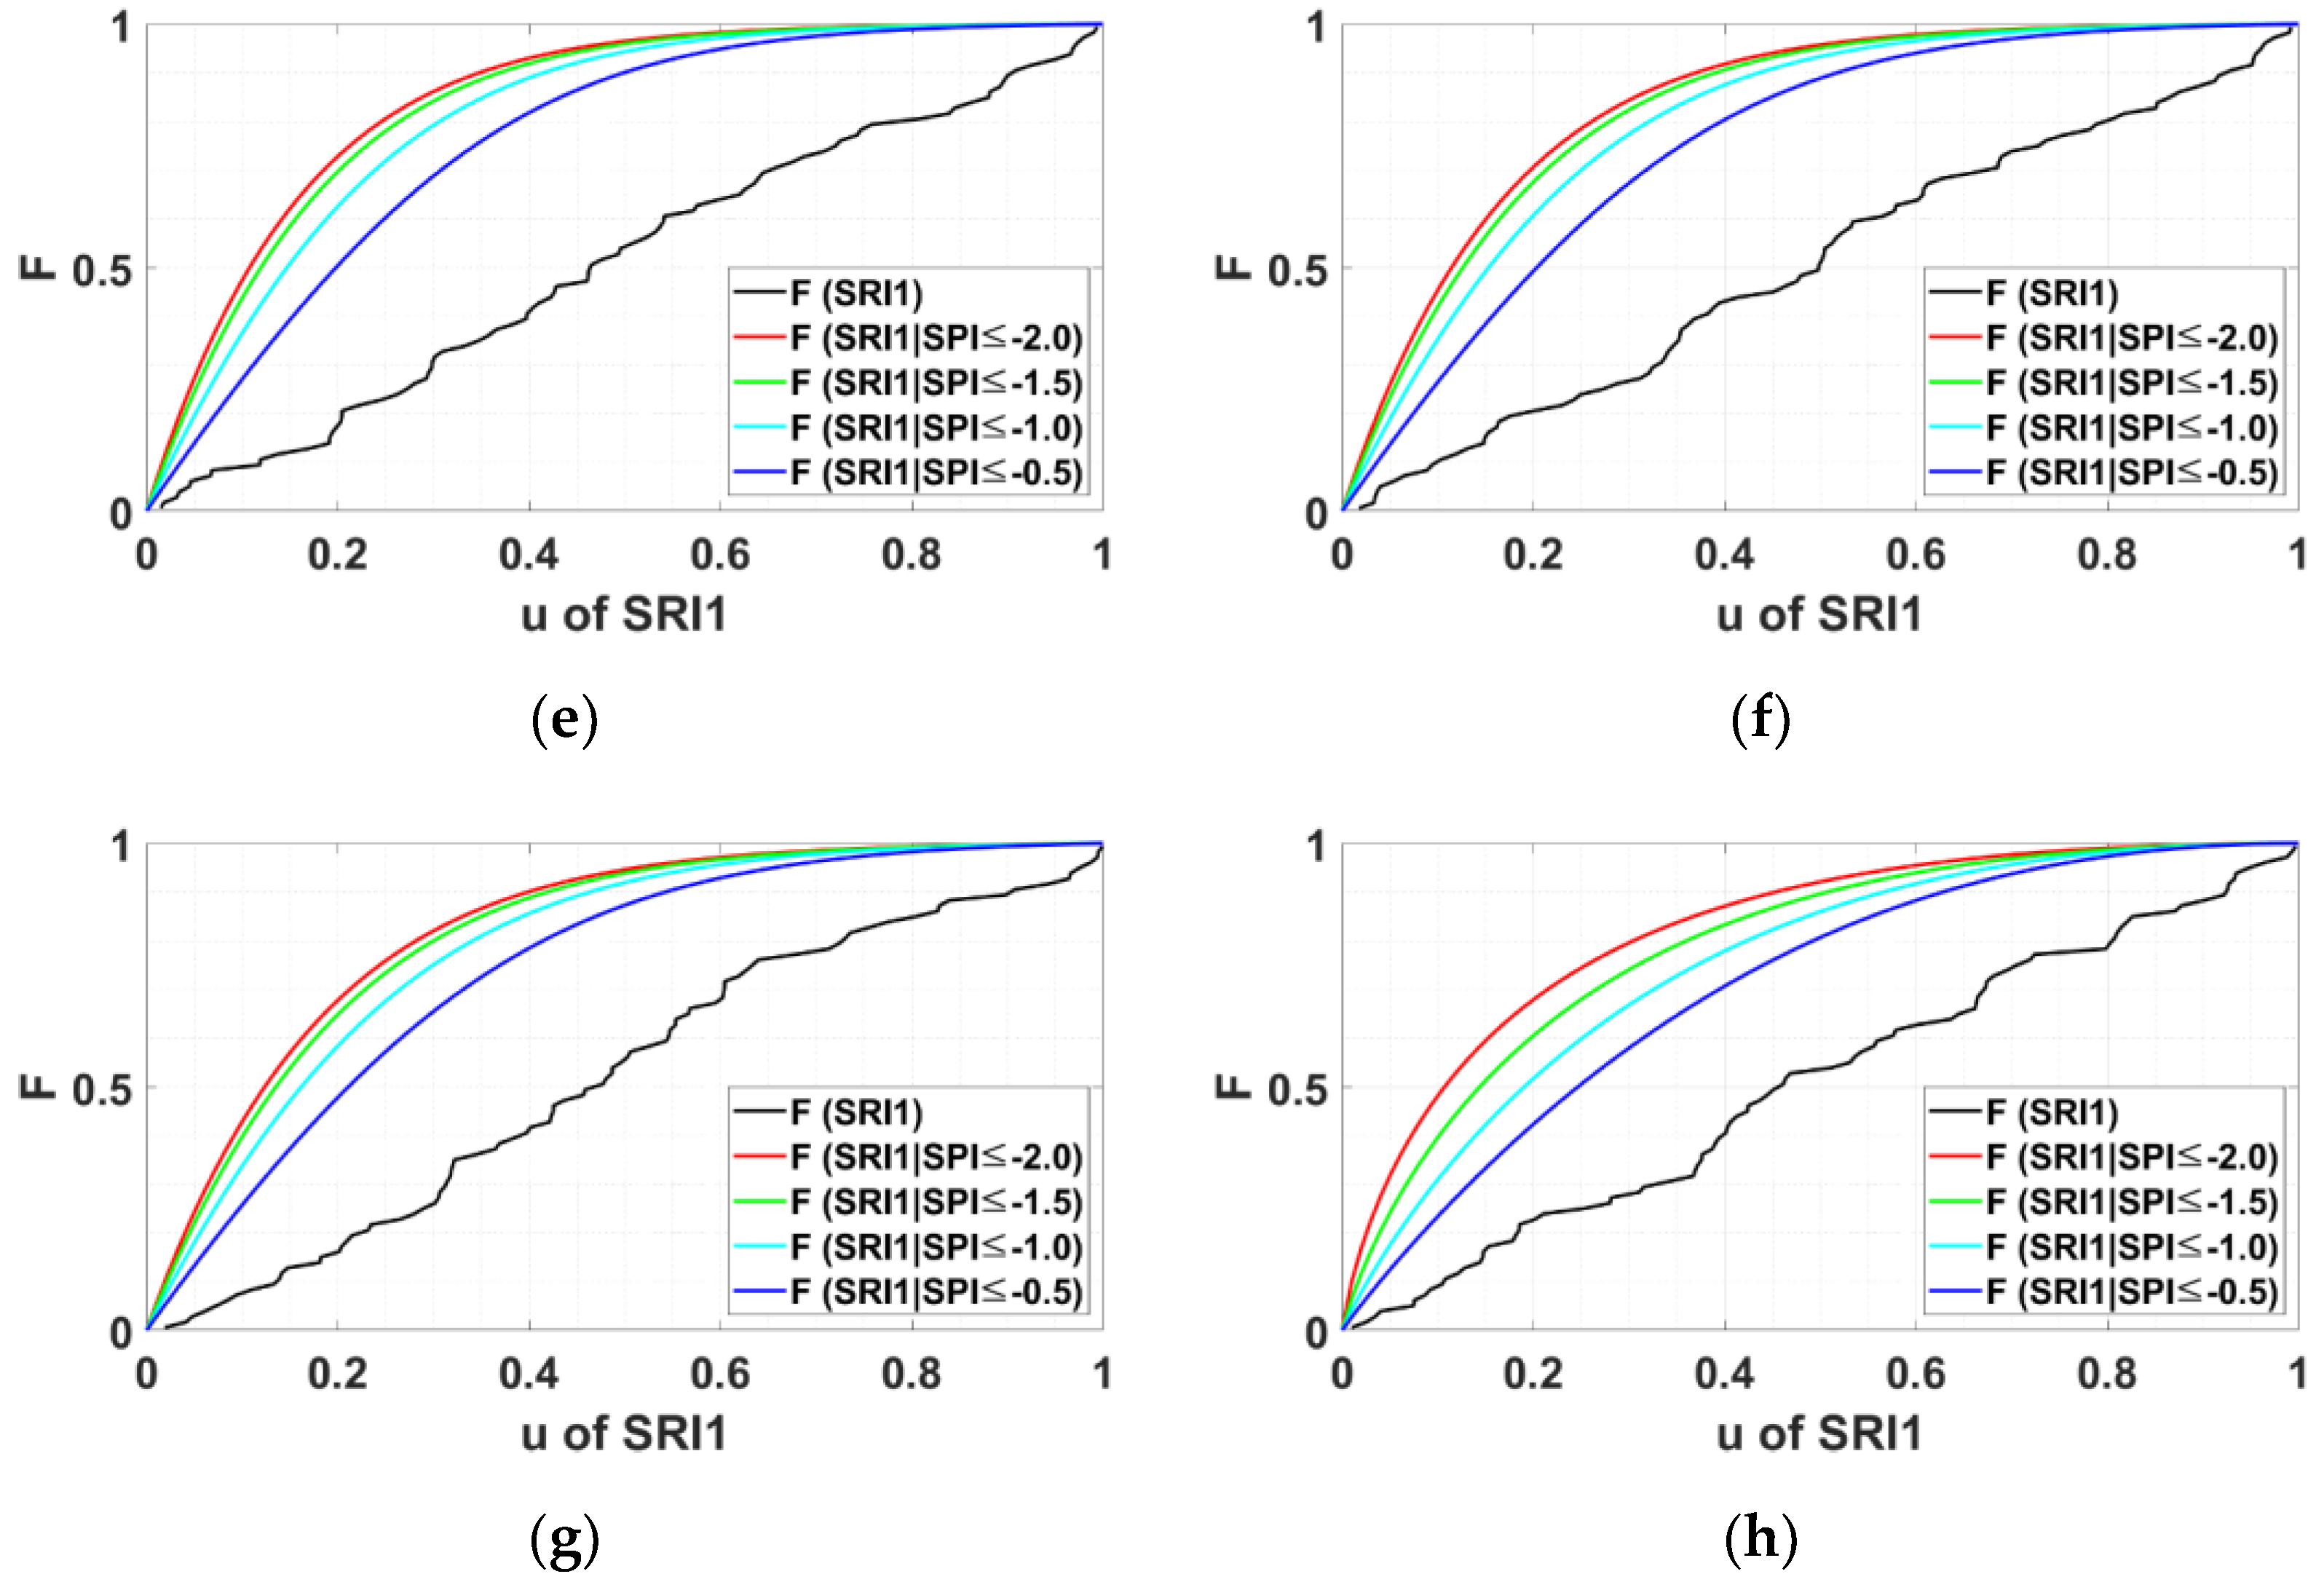
The severity of the meteorological drought was divided into four stages, and the propagation sensitivity to agricultural (or hydrological) drought was compared. Figure 9 (or Figure 10) can be drawn using Equation (11) and represents the change in empirical CDF of agricultural (or hydrological) droughts in basins and seasons given the condition that meteorological droughts of a specific severity or higher have occurred. In this figure, is simply a CDF for all SMI-1 time series. According to the copula theory, the of SMI-1 and the cumulative probability of SMI-1 are the same values; hence, theoretically represents the form of a straight line with slope 1 with intercept 0. On the other hand, represents a conditional CDF for SMI-1 time series given a condition in which SPI is −1.0 or less. That is, shows the relationship between cumulative probability for all SMI-1 time series independent of SPI and cumulative probability of SMI-1 given the condition of SPI <−1.0. Figures related to conditions for different SPI and SRI-1 may also be described in the same manner. From this, it is possible to examine how likely it is to propagate to agricultural (or hydrological) drought when meteorological droughts of various severity occur. With the development of meteorological drought severity, the conditional CDF curve shifts from right to left for each panel. This pattern of movement of CDF curves suggests that the more severe the meteorological drought is, the more likely it is to propagate to agricultural (or hydrological) drought.
Figure 9 (or Figure 10) can be used to calculate the conditional cumulative probability that SMI-1 (or SRI-1) will propagate to agricultural (or hydrological) droughts of severity of −0.5, −1.0, −1.5, −2.0, or less given meteorological drought severity conditions with SPI of −0.5, −1.0, −1.5, −2.0, or less. In addition, the probability of occurrence of agricultural (or hydrological) droughts in which SMI-1 (or SRI-1) is less than −0.5, −1.0, −1.5, and −2.0 regardless of SPI can be calculated from the standard normal distribution, which is 0.30854, 0.15866, 0.06681, and 0.02275, respectively. The propagation sensitivity between meteorological drought and agricultural (or hydrological) drought can be examined by comparing the probability of occurrence of agricultural drought itself with the probability of occurrence of agricultural (or hydrological) drought given the condition that a meteorological drought has occurred.
Table 3 and Table 4 show the probability of propagating to agricultural drought of various severity when four meteorological drought severities are given for each season. In the Andong Dam basin, the season with the highest propagation sensitivity from meteorological drought to agricultural drought was summer. In the Hapcheon Dam basin, propagation sensitivity was generally the highest in summer, but the sensitivity from severe (or extreme) meteorological drought to severe (or extreme) agricultural drought was the highest in autumn. The season with the lowest propagation sensitivity from meteorological drought to agricultural drought was spring in the Andong Dam basin and winter in the Hapcheon Dam basin. In spring and autumn, the propagation sensitivity of Hapcheon Dam basin was relatively greater than that of Andong Dam basin. This means that when meteorological droughts occur in spring and autumn, the probability of propagating to agricultural droughts is greater in Hapcheon Dam basin, and, under the condition that there is an artificial water supply system at the same level, the Hapcheon Dam basin is more vulnerable to agricultural droughts in spring and autumn. On the contrary, agricultural drought occurring in summer and winter turned out to be more vulnerable in the Andong Dam basin.
Table 5 and Table 6 show the probability of propagating to hydrological droughts of various severity when four meteorological droughts are given each season. In the Andong Dam basin, the season with the highest propagation sensitivity from meteorological drought to hydrological drought was summer. In the Hapcheon Dam basin, propagation sensitivity was generally the highest in summer, but the sensitivity to propagation from weak meteorological drought to weak hydrological drought was the highest in spring. The season with the lowest propagation sensitivity from meteorological drought to hydrological drought was winter in the Andong Dam basin, and the Hapcheon Dam basin was generally the least sensitive in winter except when it propagated from severe meteorological drought to severe hydrological drought. In spring and summer, the propagation sensitivity of the Hapcheon Dam basin was relatively greater than that of the Andong Dam basin. This means that, when meteorological droughts occur in spring and autumn, the probability of propagating to hydrological droughts is greater in Hapcheon Dam basin, and, under the condition that there is an artificial water supply system at the same level, the Hapcheon Dam basin is more vulnerable to hydrological droughts in spring and summer. On the contrary, the hydrological drought that occurs in autumn turned out to be more vulnerable in the Andong Dam basin. In winter, the Andong Dam basin was more vulnerable in weak hydrological droughts propagated from weak meteorological droughts; on the contrary, the Hapcheon Dam basin was more vulnerable in severe hydrological droughts propagated from severe meteorological droughts.
3.4. Changes in Drought Propagation Characteristics by Multipurpose Dam
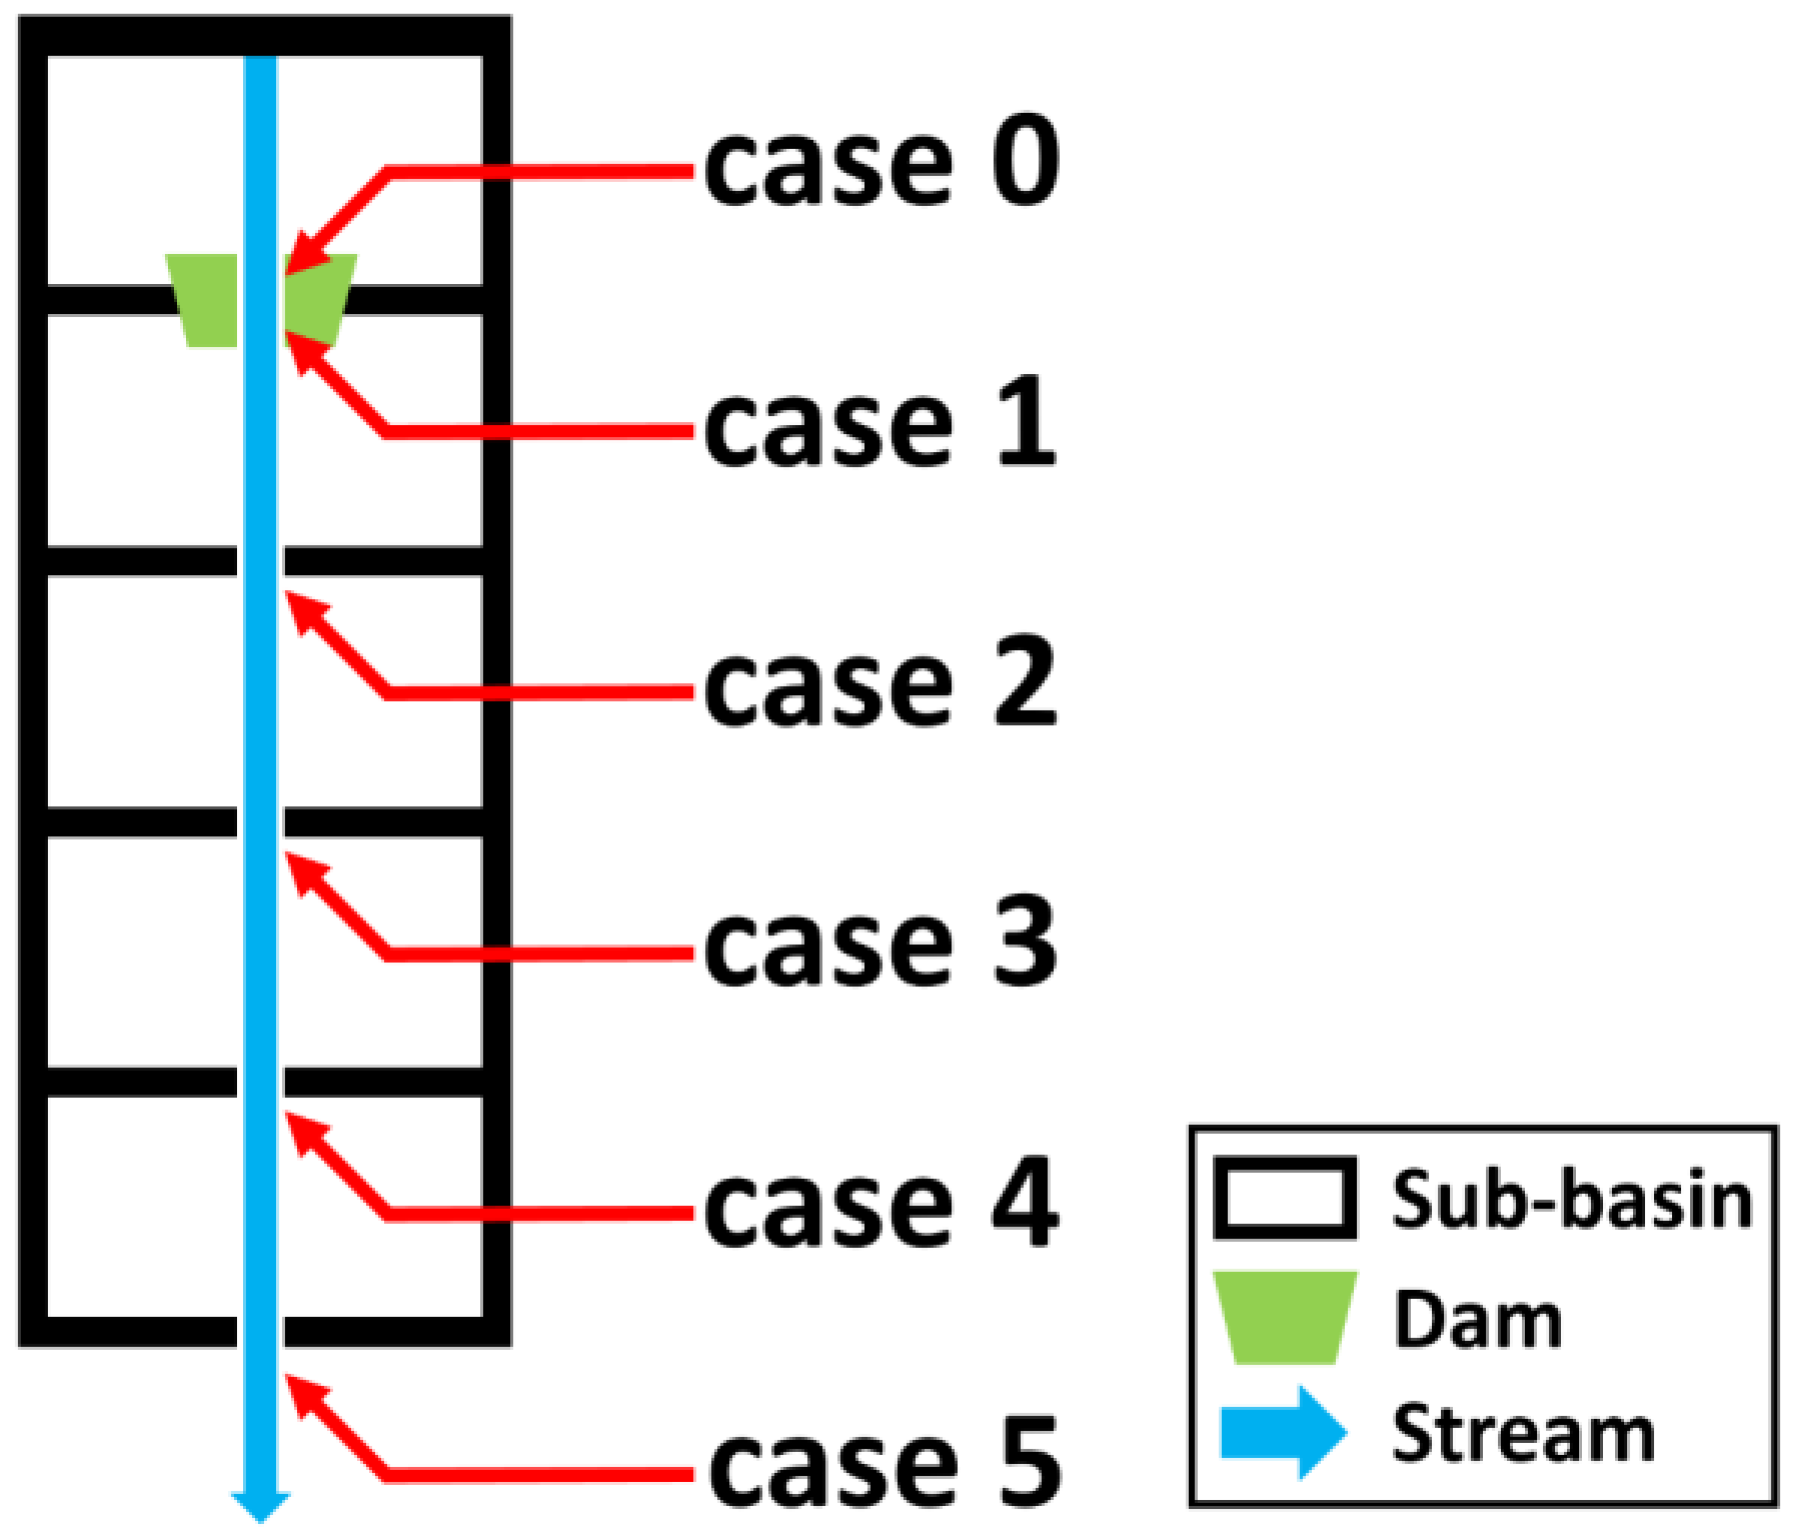
In this section, we examined how the drought propagation characteristics from meteorological drought to hydrological drought are affected by a multipurpose dam. To analyze the difference in drought propagation characteristics by a dam, a hypothetical watershed as shown in Figure 11 was established. In Figure 11, ‘case 0’ is the same as the result of the previous analysis. That is, ‘case 0’ examines the propagation characteristics of drought using information on precipitation and dam inflow in the basin upstream of the dam. In ‘case 1’, the precipitation information is the same as in ‘case 0’, but the stream flow information used the dam discharge information, not the dam inflow, to examine the propagation characteristics of the drought. Therefore, ‘case 0’ examines the drought propagation characteristics of the upstream region of the dam, and ‘case 1’ examines the drought propagation characteristics of the region directly downstream of the dam. From ‘case 2’, the research area is expanded in the downstream direction of the dam. The region corresponding to ‘case 2’ is composed of a dam upstream region and a dam downstream region, and the area of the dam downstream region is the same as the upstream region of the dam. The stream flow at the outlet of the region corresponding to ‘case 2’ was assumed to be the sum of the dam discharge and the dam inflow. The region of ‘case 3’ is composed of the dam upstream region and the dam downstream region, and the area of the dam downstream region is twice that of the dam upstream region. The stream flow at the outlet of the region in ‘case 3’ was assumed to be the sum of the dam outflow and the double of the dam inflow. In this way, the area of the downstream region of the dam was expanded and a virtual watershed was constructed (Table 7).
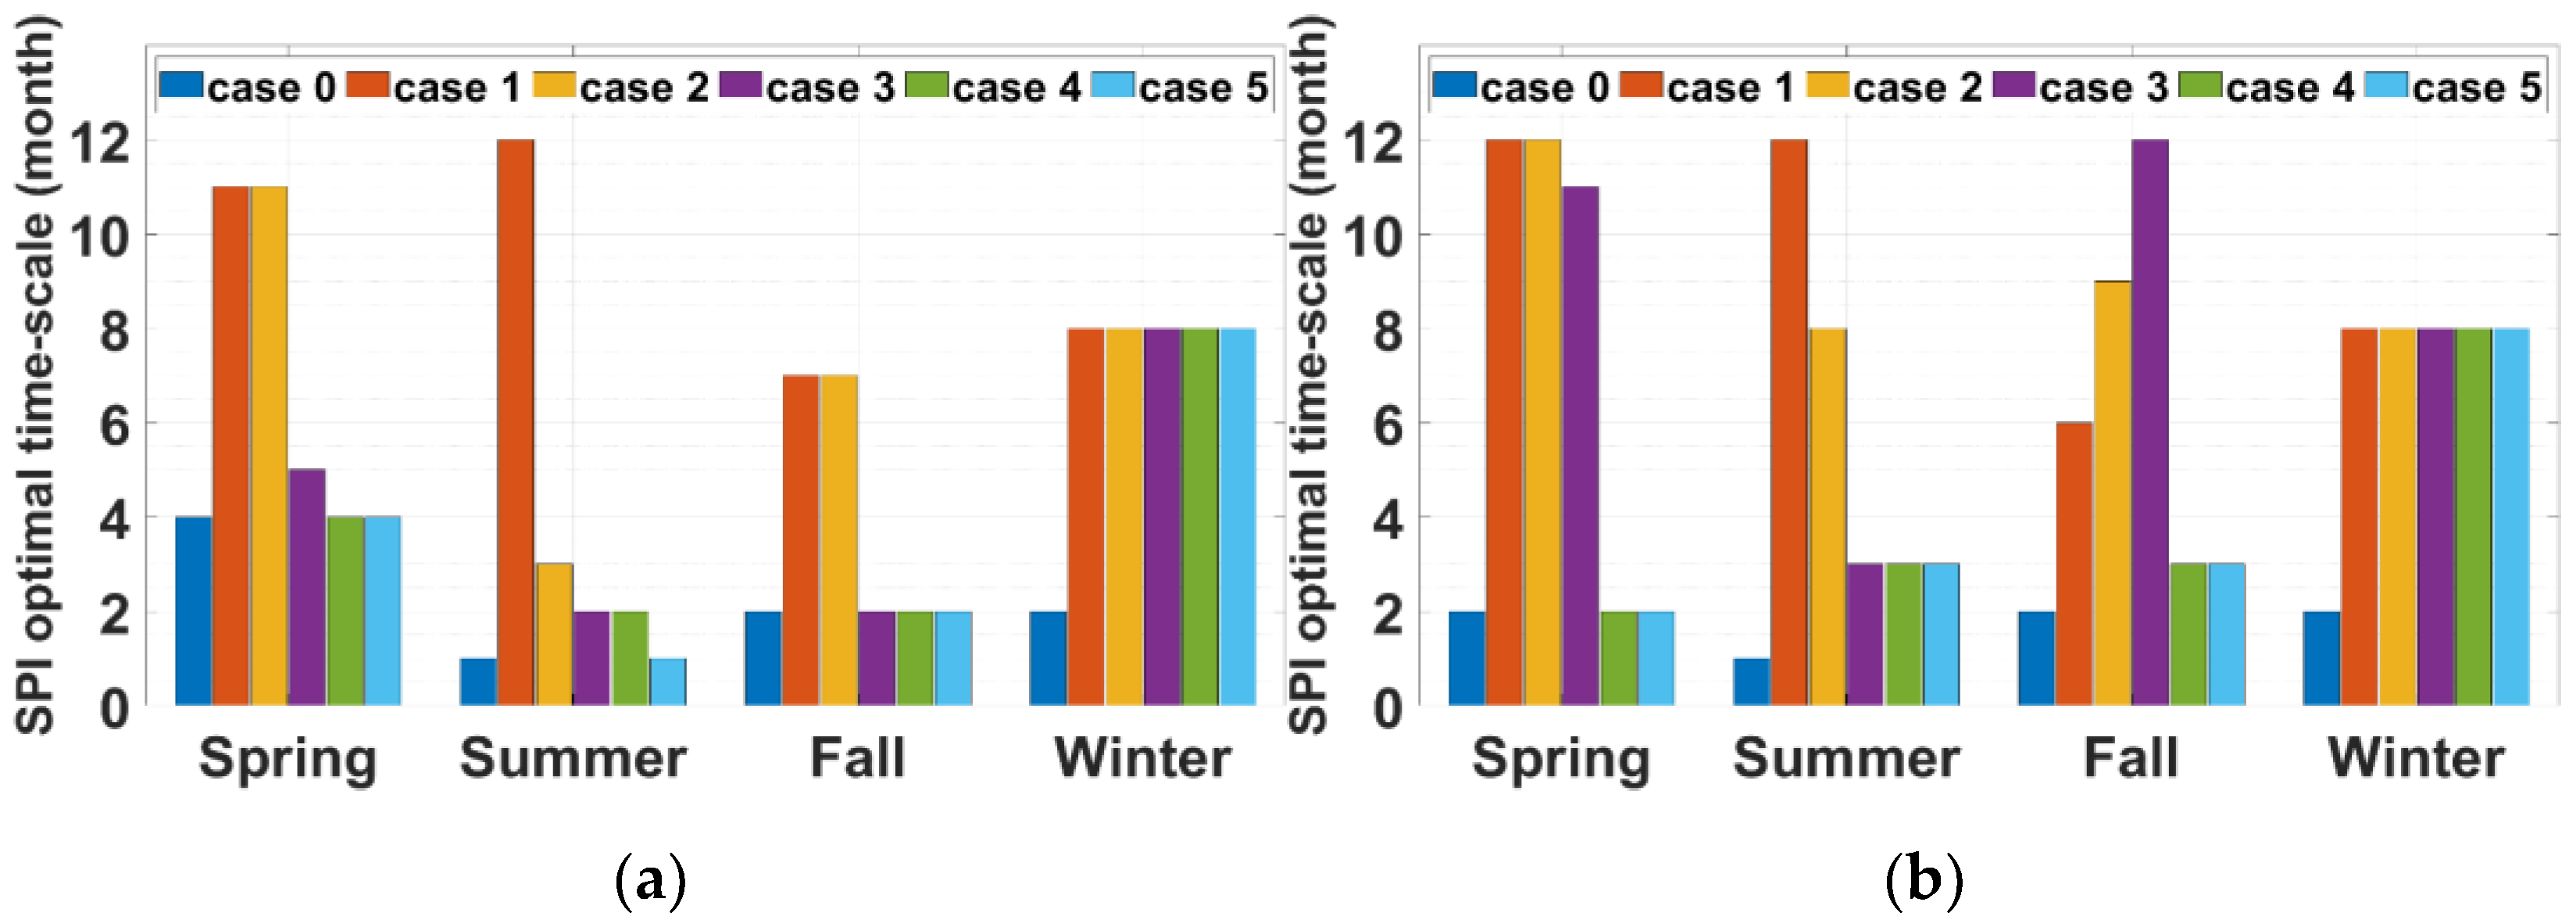
Figure 12 shows the propagation time from the meteorological drought to the hydrological drought in each case. Both watersheds showed a sharp increase in drought propagation time in ‘case 1’. This means that, when a meteorological drought occurs (or is expected), the dam gives us more time to prepare for a hydrological drought. In summer, the propagation time, which increased rapidly in ‘case 1’, decreased rapidly toward the downstream region of the dam. This fact suggests that the effect of a dam on the drought propagation time during summer drought is limited. In the spring and autumn droughts, it can be found that the dam affects the drought propagation time even in the downstream region equal to or twice the area of the upstream region of the dam. In addition, it can be recognized that the Hapcheon Dam has a greater effect on the drought propagation time of the downstream region of the dam than the Andong Dam. The season when a dam had the greatest effect on drought propagation time was winter. In spring, summer, and autumn, the drought propagation time increased by the dam decreased in the downstream direction. In winter, the increased drought propagation time was maintained up to the downstream region of the dam, which was more than four times the area upstream of the dam. Since both Andong Dam and Hapcheon Dam actively secure dam storage in winter, the change in stream flow caused by the dam changes most dramatically in winter. From these results, it can be recognized that the effect of the dam on the drought propagation time in the region downstream of the dam varies by season and dam, as well as in the downstream direction of the dam.
Figure 13 shows the probability of propagation of a hydrological drought with an SRI-1 of −1.0 or less when given a meteorological drought severity with an SPI-m of −0.5 or less. When ‘case 0’ and ‘case 1’ were compared in Andong Dam, the probability of propagation from meteorological drought to hydrological drought in all four seasons was smaller in ‘case 1’ than in ‘case 0’. Furthermore, the propagation probability of ‘cases 2’ to ‘case 5’ was lower than that of ‘case 0’ in all seasons except summer. In summer, the propagation probability, which dropped sharply in ‘case 1’, showed a greater propagation probability than ‘case 0’ from ‘case 2’. In terms of propagation probability, the effects of the Andong dam appear clearly in spring, autumn, and winter (especially in winter), suggesting that the dam’s effect is relatively limited in the summer drought. In the Hapcheon Dam, the effect of the dam on the drought propagation probability was more unclear than in the Andong Dam. This means that a new method to analyze the drought propagation probability, different from the drought propagation time, needs to be proposed, which is left for future research. Detailed information on the drought propagation probability for each case is included in Tables S1–S10 of the Supplementary Materials.
4. Conclusions
In this study, the propagation sensitivity and propagation probability of the Andong Dam and Hapcheon Dam watersheds, which are the upstream watersheds of large multipurpose dams, from meteorological droughts of various severity (mild, moderate, severe, and extreme) to agricultural (or hydrological) droughts of various severity were estimated respectively. Furthermore, in order to analyze how the propagation time and propagation probability of drought are affected by the dam, the change in the drought propagation characteristic by the dam in the downstream direction was examined. It was assumed that SPI represented meteorological drought, and SMI and SRI were applied as proxy variables for agricultural drought and hydrological drought, respectively. SPI and SRI were estimated from the observed monthly precipitation and observed monthly dam inflow time series, respectively, but SMI was estimated using simulated values in the abcd model because there were no observation data. Through correlation analysis, the time of propagation from seasonal meteorological drought to agricultural (or hydrological) drought in two study areas was estimated, and the copula model was used for the sensitivity analysis of the propagation.
The cross-correlation coefficients of SPI and SMI (or SRI) varied depending on the region, season, and timescale in which the drought index is calculated. The time propagated from a meteorological drought to an agricultural (or hydrological) drought is defined as the timescale of SPI (i.e., SPI-m), which shows the best correlation with SMI-1 (or SRI-1) calculated on a 1 month timescale. Looking at the main characteristics of the propagation time, in the case of spring, the precipitation in winter plays an important role in the agricultural drought and dam inflow in spring; thus, the propagation time is relatively longer than in other seasons. In addition, it was found that the propagation time in summer was very short due to the characteristics of the East Asian monsoon climate where precipitation was concentrated in summer. Looking at the regional difference in drought propagation time, in the case of spring, regional differences were large due to the influence of winter snowfall.
The optimal copula function was selected differently from basin to season. This suggests that it is important to select the optimal copula function individually for each basin or season. In addition, with the development of meteorological drought severity, the pattern of movement of CDF curves for SMI (or SRI) shows that, as meteorological drought becomes more severe, the likelihood of propagating to agricultural (or hydrological) drought increases. It was confirmed that the season with the highest propagation sensitivity from meteorological drought to agricultural drought was generally summer, and the season with the lowest propagating sensitivity from meteorological drought to agricultural drought was spring or winter, depending on the region. It was found that the season with the highest propagation sensitivity from meteorological drought to hydrological drought was mainly summer, and the season with the lowest propagation sensitivity from meteorological drought to hydrological drought was winter. An area or season that is likely to propagate from a meteorological drought to an agricultural (or hydrological) drought is an area or season in which the propagation to an agricultural (or hydrological) drought occurs particularly well, even if a meteorological drought of the same severity occurs. In other words, it warns that it is a region or season that is relatively more vulnerable to agricultural (or hydrological) drought than other regions or seasons. This information may provide information on where artificial water supply systems should be applied in priority to reduce drought damage. It also provides information on areas where response measures must be prepared first when drought intensifies (or is predicted) from weak meteorological droughts to more severe meteorological droughts in certain seasons.
Results on the effects of dams on drought propagation characteristics can help to evaluate the value of various purpose dams currently in operation. Our results show that there is an increase in the drought propagation time due to the dam, as well as provide information on how this increase in propagation time is decreasing in the downstream direction of the dam. It also shows that the increase in propagation time varies from season to season and from dam to dam. However, no clear characteristics were found for the propagation probability. This means that new research on the analysis related to the propagation probability is needed.
However, since the SPI applied as a proxy variable for meteorological drought in this study is a drought index that depends only on precipitation, evapotranspiration, which is the aspect of moisture demand in the atmosphere, was not considered at all. In future studies, it will be necessary to examine the propagation characteristics of drought using a meteorological drought index that can consider the evapotranspiration. In addition, in order to generalize the theory of drought propagation, it is necessary to apply it to more diverse regions.
Supplementary Materials
The following supporting information can be downloaded at: https://www.mdpi.com/article/10.3390/w14203293/s1, Figure S1: Posterior distribution of abcd model parameters (Andong Dam Basin); Figure S2: Simulated monthly runoff ensembles from posterior distribution of parameters (Andong Dam Basin); Figure S3: Posterior distribution of abcd model parameters (Hapcheon Dam Basin); Figure S4: Simulated monthly runoff ensembles from posterior distribution of parameters (Hapcheon Dam Basin); Table S1: Propagation probability of hydrological drought under various seventies of meteorological drought at Andong Dam Basin (case 1); Table S2: Propagation probability of hydrological drought under various seventies of meteorological drought at Andong Dam Basin (case 2); Table S3: Propagation probability of hydrological drought under various seventies of meteorological drought at Andong Dam Basin (case 3); Table S4: Propagation probability of hydrological drought under various seventies of meteorological drought at Andong Dam Basin (case 4); Table S5: Propagation probability of hydrological drought under various seventies of meteorological drought at Andong Dam Basin (case 5); Table S6: Propagation probability of hydrological drought under various seventies of meteorological drought at Hapcheon Dam Basin (case 1); Table S7: Propagation probability of hydrological drought under various seventies of meteorological drought at Hapcheon Dam Basin (case 2); Table S8: Propagation probability of hydrological drought under various seventies of meteorological drought at Hapcheon Dam Basin (case 3); Table S9: Propagation probability of hydrological drought under various seventies of meteorological drought at Hapcheon Dam Basin (case 4); Table S10: Propagation probability of hydrological drought under various seventies of meteorological drought at Hapcheon Dam Basin (case 5).
Author Contributions
Conceptualization, H.J. and S.K. (Sangdan Kim); methodology, H.J. and S.K. (Sangdan Kim); software, H.J. and J.W.; validation, H.J. and S.K. (Shinuk Kang); formal analysis, H.J. and S.K. (Sangdan Kim); investigation, S.K (Shinuk Kang) and S.K. (Sangdan Kim); resources, S.K. (Sangdan Kim); data curation, J.W. and S.K. (Sangdan Kim); writing—original draft preparation, H.J. and S.K. (Sangdan Kim); writing—review and editing, J.W. and S.K. (Shinuk Kang); visualization, J.W.; supervision, S.K. (Sangdan Kim); project administration, S.K. (Sangdan Kim); funding acquisition, S.K. (Sangdan Kim) All authors have read and agreed to the published version of the manuscript.
Funding
This research was funded by the Korean Ministry of Environment (MOE), grant number 2022003050007.
Data Availability Statement
Not applicable.
Acknowledgments
This work was supported by Korea Environment Industry & Technology Institute (KEITI) through Aquatic Ecosystem Conservation Research Program (or Project), funded by Korea Ministry of Environment (MOE) (2022003050007).
Conflicts of Interest
The authors declare no conflict of interest.
References
- Dai, A. Drought under global warming: A review. WIREs Clim. Chang. 2011, 2, 45–65. [Google Scholar] [CrossRef] [Green Version]
- Gampe, D.; Zscheischler, J.; Reichstein, M.; O’Sullivan, M.; Smith, W.; Sitch, S.; Buermann, W. Increasing impact of warm droughts on northern ecosystem productivity over recent decades. Nat. Clim. Chang. 2021, 11, 772–779. [Google Scholar] [CrossRef]
- Lesk, C.; Coffel, E.; Winter, J.; Ray, D.; Zscheischler, J.; Seneviratne, S.; Horton, R. Stronger temperature–moisture couplings exacerbate the impact of climate warming on global crop yields. Nat. Food 2021, 2, 683–691. [Google Scholar] [CrossRef]
- Chiang, F.; Mazdiyasni, O.; AghaKouchak, A. Evidence of anthropogenic impacts on global drought frequency, duration, and intensity. Nat. Commun. 2021, 12, 2754. [Google Scholar] [CrossRef] [PubMed]
- Watson, P.; Spaulding, A.; Koukoula, M.; Anagnostou, E. Improved quantitative prediction of power outages caused by extreme weather events. Weather Clim. Extrem. 2022, 37, 100487. [Google Scholar] [CrossRef]
- Naumann, G.; Cammalleri, C.; Mentaschi, L.; Feyen, L. Increased economic drought impacts in Europe with anthropogenic warming. Nat. Clim. Chang. 2021, 11, 485–491. [Google Scholar] [CrossRef]
- Samaniego, L.; Thober, S.; Kumar, R.; Wanders, N.; Rakovec, O.; Pan, M.; Zink, M.; Sheffield, J.; Wood, E.; Marx, A. Anthropogenic warming exacerbates European soil moisture droughts. Nat. Clim. Chang. 2018, 8, 421–426. [Google Scholar] [CrossRef] [Green Version]
- Iglesias, V.; Travis, W.; Balch, J. Recent droughts in the United States are among the fastest-developing of the last seven decades. Weather Clim. Extrem. 2022, 37, 100491. [Google Scholar] [CrossRef]
- Trenberth, K.; Dai, A.; van der Schrier, G.; Jones, P.; Barichivich, J.; Briffa, K.; Sheffield, J. Global warming and changes in drought. Nat. Clim. Chang. 2014, 4, 17–22. [Google Scholar] [CrossRef]
- Wilhite, D.A.; Glantz, M.H. Understanding: The drought phenomenon: The role of definitions. Water Int. 1985, 10, 111–120. [Google Scholar] [CrossRef]
- Huschke, R.E. Glossary of Meteorology, 1st ed.; American Meteorological Society: Boston, MA, USA, 1959; p. 638. [Google Scholar]
- Rosenberg, N.J. Drought in the Great Plains: Research on Impacts and Strategies, 1st ed.; Water Resources Publications: Littleton, CO, USA, 1979; p. 225. [Google Scholar]
- Yevjevich Vujica, H.W.A.; Salas, J.D. Drought Research Needs, 1st ed.; Water Resources Publications: Littleton, CO, USA, 1977; p. 276. [Google Scholar]
- Zeng, J.; Zhang, R.; Tang, J.; Liang, J.; Li, J.; Zeng, Y.; Li, Y.; Zhang, Q.; Shui, W.; Wang, Q. Ecological sustainability assessment of the carbon footprint in Fujian Province, southeast China. Front. Earth Sci. 2020, 15, 12–22. [Google Scholar] [CrossRef]
- Yu, M.; Cho, Y.; Kim, T.; Chae, H. Analysis of drought propagation using hydrometeorological data: From meteorological drought to agricultural drought. J. Korea Water Resour. Assoc. 2017, 51, 195–205. [Google Scholar]
- Van Loon, A.F.; Tijdeman, E.; Wanders, N.; van Lanen, H.A.J.; Teuling, A.J.; Uijlenhoet, R. How climate seasonality modifies drought duration and deficit. J. Geophys. Res. Atmos. 2014, 119, 4640–4656. [Google Scholar] [CrossRef]
- Ma, F.; Luo, L.; Ye, A.; Duan, Q. Drought Characteristics and propagation in the semiarid Heihe River basin in northwestern China. J. Hydrometeor. 2019, 20, 59–77. [Google Scholar] [CrossRef]
- Guo, Y.; Huang, S.; Huang, Q.; Leng, G.; Fang, W.; Wang, L.; Wang, H. Propagation thresholds of meteorological drought for triggering hydrological drought at various levels. Sci. Total Environ. 2020, 712, 136502. [Google Scholar] [CrossRef] [PubMed]
- Seo, J.; Won, J.; Choi, J.; Lee, J.; Kim, S. A copula model to identify the risk of river water temperature stress for meteorological drought. J. Environ. Manag. 2022, 311, 114861. [Google Scholar] [CrossRef] [PubMed]
- Yoo, J.; So, B.; Lee, J.; Kim, T. Analysis of drought propagation from meteorological to hydrological drought considering spatio-temporal moving pattern of drought events. J. Korean Soc. Civ. Eng. 2020, 40, 135–143. [Google Scholar]
- Joseph, S.; Sahai, A.K.; Goswami, B.N. Eastward propagating MJO during boreal summer and Indian monsoon droughts. Clim. Dyn. 2009, 32, 1139–1153. [Google Scholar] [CrossRef] [Green Version]
- Eltahir, E.A.B.; Yeh, P.J.F. On the asymmetric response of aquifer water level to floods and droughts in Illinois. Water Resour. Res. 1999, 35, 1199–1217. [Google Scholar] [CrossRef] [Green Version]
- Barker, L.J.; Hannaford, J.; Chiverton, A.; Svensson, C. From meteorological to hydrological drought using standardised indicators. Hydrol. Earth Syst. Sci. 2016, 20, 2483–2505. [Google Scholar] [CrossRef] [Green Version]
- Xu, Y.; Zhang, X.; Wang, X.; Hao, Z.; Singh, V.P.; Hao, F. Propagation from meteorological drought to hydrological drought under the impact of human activities: A case study in northern China. J. Hydrol. 2019, 579, 124147. [Google Scholar] [CrossRef]
- Han, Z.; Huang, S.; Huang, Q.; Leng, G.; Wang, H.; Bai, Q.; Zhao, J.; Ma, L.; Wang, L.; Du, M. Propagation dynamics from meteorological to groundwater drought and their possible influence factors. J. Hydrol. 2019, 578, 124102. [Google Scholar] [CrossRef]
- Guo, Y.; Huang, S.; Huang, Q.; Wang, H.; Fang, W.; Yang, Y.; Wang, L. Assessing socioeconomic drought based on an improved Multivariate Standardized Reliability and Resilience Index. J. Hydrol. 2019, 568, 904–918. [Google Scholar] [CrossRef]
- Won, J.; Seo, J.; Kim, S. A copula model integrating atmospheric moisture demand and supply for vegetation vulnerability mapping. Sci. Total Environ. 2022, 812, 151464. [Google Scholar] [CrossRef] [PubMed]
- Mo, K.C. Drought onset and recovery over the United States. J. Geophys. Res. Atmos. 2011, 116, D20106. [Google Scholar] [CrossRef]
- Wu, G.; Chen, J.; Shi, X.; Kim, J.S.; Xia, J.; Zhang, L. Impacts of global climate warming on meteorological and hydrological droughts and their propagations. Earth’s Future 2022, 10, e2021EF002542. [Google Scholar] [CrossRef]
- Bloomfield, J.P.; Marchant, B.P. Analysis of groundwater drought building on the standardised precipitation index approach. Hydrol. Earth Syst. Sci. 2013, 17, 4769–4787. [Google Scholar] [CrossRef] [Green Version]
- Zhang, X.; Zhang, B. The responses of natural vegetation dynamics to drought during the growing season across China. J. Hydrol. 2019, 574, 706–714. [Google Scholar] [CrossRef]
- Grillakis, M.G. Increase in severe and extreme soil moisture droughts for Europe under climate change. Sci. Total Environ. 2019, 660, 1245–1255. [Google Scholar] [CrossRef] [PubMed]
- Apurv, T.; Sivapalan, M.; Cai, X. Understanding the role of climate characteristics in drought propagation. Water Resour. Res. 2017, 53, 9304–9329. [Google Scholar] [CrossRef] [Green Version]
- Keyantash, J.A.; Dracup, J.A. An aggregate drought index: Assessing drought severity based on fluctuations in the hydrologic cycle and surface water storage. Water Resour. Res. 2004, 40, W09304. [Google Scholar] [CrossRef] [Green Version]
- Gevaert, A.I.; Veldkamp, T.I.E.; Ward, P.J. The effect of climate type on timescales of drought propagation in an ensemble of global hydrological models. Hydrol. Earth Syst. Sci. 2018, 22, 4649–4665. [Google Scholar] [CrossRef]
- Xu, Y.; Zhang, X.; Hao, Z.; Singh, V.P.; Hao, F. Characterization of agricultural drought propagation over China based on bivariate probabilistic quantification. J. Hydrol. 2021, 598, 126194. [Google Scholar] [CrossRef]
- Chen, N.; Li, R.; Zhang, X.; Yang, C.; Wang, X.; Zeng, L.; Tangf, S.; Wanga, W.; Li, D.; Niyogig, D. Drought propagation in Northern China Plain: A comparative analysis of GLDAS and MERRA-2 datasets. J. Hydrol. 2020, 588, 125026. [Google Scholar] [CrossRef]
- Lorenzo-Lacruz, J.; Vicente-Serrano, S.M.; González-Hidalgo, J.C.; López-Moreno, J.I.; Cortesi, N. Hydrological drought response to meteorological drought in the Iberian Peninsula. Clim. Res. 2013, 58, 117–131. [Google Scholar] [CrossRef] [Green Version]
- Haslinger, K.; Koffler, D.; Schöner, W.; Laaha, G. Exploring the link between meteorological drought and streamflow: Effects of climate-catchment interaction. Water Resour. Res. 2014, 50, 2468–2487. [Google Scholar] [CrossRef]
- Guo, Y.; Huang, Q.; Huang, S.; Leng, G.; Zheng, X.; Fang, W.; Deng, M.; Song, S. Elucidating the effects of mega reservoir on watershed drought tolerance based on a drought propagation analytical method. J. Hydrol. 2021, 598, 125738. [Google Scholar] [CrossRef]
- Xing, Z.; Ma, M.; Zhang, X.; Leng, G.; Su, Z.; Lv, J.; Yu, Z.; Yi, P. Altered drought propagation under the influence of reservoir regulation. J. Hydrol. 2021, 603, 127049. [Google Scholar] [CrossRef]
- Ji, U.; Hwang, M.; Yeo, W.; Lim, K. Risk Assessment and potentiality analysis of soil loss at the Nakdong River watershed using the land use map, revised universal soil loss equation, and landslide risk map. J. Korea Water Resour. Assoc. 2012, 45, 617–629. [Google Scholar] [CrossRef] [Green Version]
- Open MET Data Portal. Available online: https://data.kma.go.kr (accessed on 22 March 2022).
- Water Resources Management Information System. Available online: http://www.wamis.go.kr (accessed on 5 April 2022).
- Thomas, H.A. Improved Methods for National Water Assessment, Water Resources Contract: WR15249270; Final report; Harvard Water Resources Group: Washington, DC, USA, 1981; p. 59. [Google Scholar]
- Won, J.; Choi, J.; Lee, O.; Kim, S. Copula-based Joint Drought Index using SPI and EDDI and its application to climate change. Sci. Total Environ. 2020, 744, 140701. [Google Scholar] [CrossRef] [PubMed]
- Won, J.; Son, Y.; Lee, S.; Kang, L.; Kim, S. Evaluation of utilization of satellite remote sensing data for drought monitoring. Korean J. Remote Sens. 2021, 37, 1803–1818. [Google Scholar]
- McKee, T.; Doesken, N.; Kleist, J. The relationship of drought frequency and duration to time scales. In Proceedings of the Eighth Conference on Applied Climatology, Anaheim, CA, USA, 17–22 January 1993. [Google Scholar]
- Hayes, M.; Svoboda, M.; Wall, N.; Widhalm, M. The Lincoln declaration on drought indices: Universal meteorological drought index Recommended. Bull. Am. Meteor. Soc. 2011, 92, 485–488. [Google Scholar] [CrossRef] [Green Version]
- Kao, S.C.; Govindaraju, R.S. A copula-based joint deficit index for droughts. J. Hydrol. 2010, 380, 121–134. [Google Scholar] [CrossRef]
- Ionita, M.; Scholz, P.; Chelcea, S. Assessment of droughts in Romania using the Standardized Precipitation Index. Nat. Hazards 2016, 81, 1483–1498. [Google Scholar] [CrossRef] [Green Version]
- Huang, S.; Li, P.; Huang, Q.; Leng, G.; Hou, B.; Ma, L. The propagation from meteorological to hydrological drought and its potential influence factors. J. Hydrol. 2017, 547, 184–195. [Google Scholar] [CrossRef]
- Huang, S.; Huang, Q.; Chang, J.; Leng, G.; Xing, L. The response of agricultural drought to meteorological drought and the influencing factors: A case study in the Wei River Basin China. Agric. Water Manag. 2015, 159, 45–54. [Google Scholar] [CrossRef]
- Ryu, J.S.; Ahn, J.; Kim, S. An application of drought severity-area- duration curves using copulas-based joint drought index. J. Korea Water Resour. Assoc. 2012, 45, 1043–1050. [Google Scholar] [CrossRef] [Green Version]
- Sklar, M. Fonctions de repartition an dimensions et leurs marges. Publ. De L’institut De Stat. De L’université De Paris 1959, 8, 229–231. [Google Scholar]
- Salvadori, G.; De Michele, C. Frequency analysis via copulas: Theoretical aspects and applications to hydrological events. Water Resour. Res. 2004, 40, W12511. [Google Scholar] [CrossRef]
- Akaike, H. Information Theory and an Extension of the Maximum Likelihood Principle, 1st ed.; Akadémiai Kiadó: Budapest, Hungary, 1973; pp. 267–281. [Google Scholar]
- Sadegh, M.; Ragno, E.; AghaKouchak, A. Multivariate Copula Analysis Toolbox (MvCAT): Describing dependence and underlying uncertainty using a B ayesian framework. Water Resour. Res. 2017, 53, 5166–5183. [Google Scholar] [CrossRef]
- Vrugt, J.; Gupta, H.; Bouten, W.; Sorooshian, S. A shuffled complex evolution metropolis algorithm for optimization and uncertainty assessment of hydrologic model parameters. Water Resour. Res. 2012, 39, 1201. [Google Scholar] [CrossRef] [Green Version]
- Green, C.H.; Tomer, M.D.; Di Luzio, M.; Arnold, J.G. Hydrologic evaluation of the soil and water assessment tool for a lager tile-drained watershed in Iowa. Trans. Am. Soc. Agric. Biol. Eng. 2006, 49, 413–422. [Google Scholar]
- Patil, S.D.; Stieglitz, M. Comparing spatial and temporal transferability of hydrological model parameters. J. Hydrol. 2015, 525, 409–417. [Google Scholar] [CrossRef] [Green Version]
- Choi, J.; Lee, J.; Kim, S. Utilization of the long short-term memory network for predicting streamflow in ungauged basins in Korea. Ecol. Eng. 2022, 182, 106699. [Google Scholar] [CrossRef]
- Maity, R.; Suman, M.; Verma, N. Drought prediction using a wavelet based approach to model the temporal consequences of different types of droughts. J. Hydrol. 2016, 539, 417–428. [Google Scholar] [CrossRef]
- Milly, P.C.D. Potential evaporation and soil moisture in general circulation models. J. Clim. 1992, 5, 209–226. [Google Scholar] [CrossRef]
- Qian, Y.; He, F.; Wang, W. Seasonality, rather than nutrient addition or vegetation types, influenced short-term temperature sensitivity of soil organic carbon decomposition. PLoS ONE 2016, 11, e0153415. [Google Scholar] [CrossRef]
Figure 1.
Location of Andong Dam Basin and Hapcheon Dam Basin.

Figure 2.
Monthly meteorological and hydrological data: (a) Andong Dam Basin; (b) Hapcheon Dam Basin.
Figure 2.
Monthly meteorological and hydrological data: (a) Andong Dam Basin; (b) Hapcheon Dam Basin.

Figure 3.
Monthly inflow simulation results: (a) Andong Dam Basin; (b) Hapcheon Dam Basin.

Figure 4.
Monthly inflow simulation results: (a) Andong Dam Basin; (b) Hapcheon Dam Basin.

Figure 5.
Optimal timescale between SPI-m and SMI-1 (or SRI-1): (a) Andong Dam Basin; (b) Hapcheon Dam Basin.
Figure 5.
Optimal timescale between SPI-m and SMI-1 (or SRI-1): (a) Andong Dam Basin; (b) Hapcheon Dam Basin.

Figure 6.
Maximum cross-correlation between SPI-m and SMI-1 (or SRI-1): (a) Andong Dam Basin; (b) Hapcheon Dam Basin.
Figure 6.
Maximum cross-correlation between SPI-m and SMI-1 (or SRI-1): (a) Andong Dam Basin; (b) Hapcheon Dam Basin.

Figure 7.
AIC values of five copulas (C, F, Gau, Gum, and t indicate Clayton, Frank, Gumbel, Gaussian, and Student’s t copula, respectively) and Q–Q plot of optimal copula (SPI–SMI): (a) spring; (b) summer; (c) fall; (d) winter.
Figure 7.
AIC values of five copulas (C, F, Gau, Gum, and t indicate Clayton, Frank, Gumbel, Gaussian, and Student’s t copula, respectively) and Q–Q plot of optimal copula (SPI–SMI): (a) spring; (b) summer; (c) fall; (d) winter.


Figure 8.
AIC values of five copulas (C, F, Gau, Gum, and t indicate Clayton, Frank, Gumbel, Gaussian, and Student’s t copula, respectively) and Q–Q plot of optimal copula (SPI–SRI): (a) spring; (b) summer; (c) fall; (d) winter.
Figure 8.
AIC values of five copulas (C, F, Gau, Gum, and t indicate Clayton, Frank, Gumbel, Gaussian, and Student’s t copula, respectively) and Q–Q plot of optimal copula (SPI–SRI): (a) spring; (b) summer; (c) fall; (d) winter.


Figure 9.
Conditional cumulative probabilities of SMI-1 when different severities of meteorological drought occurred (under extreme meteorological drought conditions (red), under severe meteorological drought conditions (green), under moderate meteorological drought conditions (cyan), and under mild meteorological drought conditions (blue)): (a) Andong Dam Basin (Spring); (b) Hapcheon Dam Basin (Spring); (c) Andong Dam Basin (Summer); (d) Hapcheon Dam Basin (Summer); (e) Andong Dam Basin (Fall); (f) Hapcheon Dam Basin (Fall); (g) Andong Dam Basin (Winter); (h) Hapcheon Dam Basin (Winter).


Figure 10.
Conditional cumulative probabilities of SRI-1 when different severities of meteorological drought occurred (under extreme meteorological drought conditions (red), under severe meteorological drought conditions (green), under moderate meteorological drought conditions (cyan), and under mild meteorological drought conditions (blue)): (a) Andong Dam Basin (Spring); (b) Hapcheon Dam Basin (Spring); (c) Andong Dam Basin (Summer); (d) Hapcheon Dam Basin (Summer); (e) Andong Dam Basin (Fall); (f) Hapcheon Dam Basin (Fall); (g) Andong Dam Basin (Winter); (h) Hapcheon Dam Basin (Winter).


Figure 11.
Watershed layout for analysis of the impact of dam on drought propagation characteristics.
Figure 11.
Watershed layout for analysis of the impact of dam on drought propagation characteristics.

Figure 12.
Optimal timescale for each case between SPI-m and SRI-1: (a) Andong Dam Basin; (b) Hapcheon Dam Basin.
Figure 12.
Optimal timescale for each case between SPI-m and SRI-1: (a) Andong Dam Basin; (b) Hapcheon Dam Basin.

Figure 13.
Propagation probability of hydrological drought (SRI ≤ −1.0) under meteorological drought (SPI ≤ −0.5): (a) Andong Dam Basin; (b) Hapcheon Dam Basin.
Figure 13.
Propagation probability of hydrological drought (SRI ≤ −1.0) under meteorological drought (SPI ≤ −0.5): (a) Andong Dam Basin; (b) Hapcheon Dam Basin.


Table 1.
Parameters estimated for abcd model.
| Basin | Parameters | |||
|---|---|---|---|---|
| a | b | c | d | |
| Andong Dam | 0.88209 | 194.0413 | 0.075125 | 0.60503 |
| Hapcheon Dam | 0.94594 | 287.4673 | 0.149630 | 0.51401 |
Table 2.
Performance metrics of abcd model.
| Basin | Calibration | Validation | ||||
|---|---|---|---|---|---|---|
| NSE | KGE | NSE | KGE | |||
| Andong Dam | 0.89268 | 0.88595 | 0.91163 | 0.90374 | 0.89368 | 0.86295 |
| Hapcheon Dam | 0.93364 | 0.93266 | 0.96607 | 0.92641 | 0.92491 | 0.91494 |
Table 3.
Propagation probability of agricultural drought under various seventies of meteorological drought at Andong Dam Basin.
Table 3.
Propagation probability of agricultural drought under various seventies of meteorological drought at Andong Dam Basin.
| Seasons | Conditions for SPI | Agricultural Drought Probability | |||
|---|---|---|---|---|---|
| SMI ≤ −0.5 (0.30854) | SMI ≤ −1.0 (0.15866) | SMI ≤ −1.5 (0.06681) | SMI ≤ −2.0 (0.02275) | ||
| Spring | SPI ≤ −0.5 | 0.74407 | 0.44797 | 0.20291 | 0.07136 |
| SPI ≤ −1.0 | 0.87116 | 0.62950 | 0.33033 | 0.12622 | |
| SPI ≤ −1.5 | 0.93710 | 0.78448 | 0.50648 | 0.23040 | |
| SPI ≤ −2.0 | 0.96777 | 0.88023 | 0.67659 | 0.38632 | |
| Summer | SPI ≤ −0.5 | 0.80175 | 0.49478 | 0.21591 | 0.07373 |
| SPI ≤ −1.0 | 0.96220 | 0.79868 | 0.41196 | 0.14328 | |
| SPI ≤ −1.5 | 0.99716 | 0.97834 | 0.79826 | 0.33660 | |
| SPI ≤ −2.0 | 0.99990 | 0.99918 | 0.98845 | 0.79823 | |
| Fall | SPI ≤ −0.5 | 0.75084 | 0.46268 | 0.21111 | 0.07347 |
| SPI ≤ −1.0 | 0.89977 | 0.67017 | 0.36173 | 0.13796 | |
| SPI ≤ −1.5 | 0.97496 | 0.85905 | 0.58736 | 0.27629 | |
| SPI ≤ −2.0 | 0.99636 | 0.96209 | 0.81135 | 0.50583 | |
| Winter | SPI ≤ −0.5 | 0.78375 | 0.47978 | 0.21427 | 0.07368 |
| SPI ≤ −1.0 | 0.93302 | 0.71304 | 0.38121 | 0.14111 | |
| SPI ≤ −1.5 | 0.98955 | 0.90532 | 0.63956 | 0.29705 | |
| SPI ≤ −2.0 | 0.99926 | 0.98404 | 0.87229 | 0.56599 | |
Table 4.
Propagation probability of agricultural drought under various seventies of meteorological drought at Hapcheon Dam Basin.
Table 4.
Propagation probability of agricultural drought under various seventies of meteorological drought at Hapcheon Dam Basin.
| Seasons | Conditions for SPI | Agricultural Drought Probability | |||
|---|---|---|---|---|---|
| SMI ≤ −0.5 (0.30854) | SMI ≤ −1.0 (0.15866) | SMI ≤ −1.5 (0.06681) | SMI ≤ −2.0 (0.02275) | ||
| Spring | SPI ≤ −0.5 | 0.75082 | 0.45188 | 0.20416 | 0.07164 |
| SPI ≤ −1.0 | 0.87878 | 0.63847 | 0.33502 | 0.12760 | |
| SPI ≤ −1.5 | 0.94287 | 0.79562 | 0.51712 | 0.23533 | |
| SPI ≤ −2.0 | 0.97162 | 0.88985 | 0.69106 | 0.39772 | |
| Summer | SPI ≤ −0.5 | 0.81541 | 0.49373 | 0.21585 | 0.07373 |
| SPI ≤ −1.0 | 0.96016 | 0.75457 | 0.39726 | 0.14270 | |
| SPI ≤ −1.5 | 0.99687 | 0.94343 | 0.69071 | 0.31438 | |
| SPI ≤ −2.0 | 0.99992 | 0.99519 | 0.92319 | 0.62591 | |
| Fall | SPI ≤ −0.5 | 0.72532 | 0.46231 | 0.21214 | 0.07356 |
| SPI ≤ −1.0 | 0.89905 | 0.71249 | 0.38913 | 0.14200 | |
| SPI ≤ −1.5 | 0.97974 | 0.92411 | 0.70885 | 0.32264 | |
| SPI ≤ −2.0 | 0.99761 | 0.99031 | 0.94745 | 0.70816 | |
| Winter | SPI ≤ −0.5 | 0.70020 | 0.42121 | 0.19344 | 0.06897 |
| SPI ≤ −1.0 | 0.81912 | 0.57238 | 0.29934 | 0.11627 | |
| SPI ≤ −1.5 | 0.89339 | 0.71087 | 0.44039 | 0.19898 | |
| SPI ≤ −2.0 | 0.93537 | 0.81085 | 0.58433 | 0.31773 | |
Table 5.
Propagation probability of hydrological drought under various seventies of meteorological drought at Andong Dam Basin.
Table 5.
Propagation probability of hydrological drought under various seventies of meteorological drought at Andong Dam Basin.
| Seasons | Conditions for SPI | Hydrological Drought Probability | |||
|---|---|---|---|---|---|
| SRI ≤ −0.5 (0.30854) | SRI ≤ −1.0 (0.15866) | SRI ≤ −1.5 (0.06681) | SRI ≤ −2.0 (0.02275) | ||
| Spring | SPI ≤ −0.5 | 0.70590 | 0.41580 | 0.18539 | 0.06449 |
| SPI ≤ −1.0 | 0.80860 | 0.53602 | 0.25856 | 0.09319 | |
| SPI ≤ −1.5 | 0.85617 | 0.61402 | 0.31949 | 0.12017 | |
| SPI ≤ −2.0 | 0.87458 | 0.64992 | 0.35290 | 0.13657 | |
| Summer | SPI ≤ −0.5 | 0.71034 | 0.42757 | 0.19583 | 0.06961 |
| SPI ≤ −1.0 | 0.83149 | 0.58540 | 0.30655 | 0.11870 | |
| SPI ≤ −1.5 | 0.90439 | 0.72799 | 0.45520 | 0.20612 | |
| SPI ≤ −2.0 | 0.94401 | 0.82781 | 0.60529 | 0.33276 | |
| Fall | SPI ≤ −0.5 | 0.70104 | 0.41278 | 0.18415 | 0.06408 |
| SPI ≤ −1.0 | 0.80274 | 0.53040 | 0.25556 | 0.09210 | |
| SPI ≤ −1.5 | 0.85045 | 0.60692 | 0.31477 | 0.11824 | |
| SPI ≤ −2.0 | 0.86907 | 0.64230 | 0.34721 | 0.13405 | |
| Winter | SPI ≤ −0.5 | 0.66748 | 0.39166 | 0.17524 | 0.06112 |
| SPI ≤ −1.0 | 0.76167 | 0.49251 | 0.23545 | 0.08472 | |
| SPI ≤ −1.5 | 0.80932 | 0.55914 | 0.28393 | 0.10568 | |
| SPI ≤ −2.0 | 0.82893 | 0.59081 | 0.31034 | 0.11804 | |
Table 6.
Propagation probability of hydrological drought under various seventies of meteorological drought at Hapcheon Dam Basin.
Table 6.
Propagation probability of hydrological drought under various seventies of meteorological drought at Hapcheon Dam Basin.
| Seasons | Conditions for SPI | Hydrological Drought Probability | |||
|---|---|---|---|---|---|
| SRI ≤ −0.5 (0.30854) | SRI ≤ −1.0 (0.15866) | SRI ≤ −1.5 (0.06681) | SRI ≤ −2.0 (0.02275) | ||
| Spring | SPI ≤ −0.5 | 0.75852 | 0.44743 | 0.19778 | 0.06845 |
| SPI ≤ −1.0 | 0.87011 | 0.59962 | 0.29239 | 0.10540 | |
| SPI ≤ −1.5 | 0.91342 | 0.69437 | 0.37571 | 0.14356 | |
| SPI ≤ −2.0 | 0.92834 | 0.73503 | 0.42158 | 0.16792 | |
| Summer | SPI ≤ −0.5 | 0.74385 | 0.44784 | 0.20287 | 0.07135 |
| SPI ≤ −1.0 | 0.87092 | 0.62921 | 0.33018 | 0.12617 | |
| SPI ≤ −1.5 | 0.93691 | 0.78412 | 0.50614 | 0.23024 | |
| SPI ≤ −2.0 | 0.96764 | 0.87991 | 0.67612 | 0.38596 | |
| Fall | SPI ≤ −0.5 | 0.68647 | 0.40367 | 0.18035 | 0.06283 |
| SPI ≤ −1.0 | 0.78502 | 0.51375 | 0.24671 | 0.08886 | |
| SPI ≤ −1.5 | 0.83291 | 0.58590 | 0.30102 | 0.11262 | |
| SPI ≤ −2.0 | 0.85207 | 0.61970 | 0.33070 | 0.12683 | |
| Winter | SPI ≤ −0.5 | 0.59161 | 0.34921 | 0.16238 | 0.05924 |
| SPI ≤ −1.0 | 0.67912 | 0.43964 | 0.22331 | 0.08760 | |
| SPI ≤ −1.5 | 0.74991 | 0.53031 | 0.29883 | 0.12958 | |
| SPI ≤ −2.0 | 0.80343 | 0.61094 | 0.38052 | 0.18475 | |
Table 7.
Propagation probability of hydrological drought under various seventies of meteorological drought at Hapcheon Dam Basin.
Table 7.
Propagation probability of hydrological drought under various seventies of meteorological drought at Hapcheon Dam Basin.
| Case | Input Data |
|---|---|
| Case 0 | Dam inflow |
| Case 1 | Dam outflow |
| Case 2 | Dam inflow + Dam outflow |
| Case 3 | Dam inflow × 2 + Dam outflow |
| Case 4 | Dam inflow × 3 + Dam outflow |
| Case 5 | Dam inflow × 4 + Dam outflow |
Publisher’s Note: MDPI stays neutral with regard to jurisdictional claims in published maps and institutional affiliations. |
© 2022 by the authors. Licensee MDPI, Basel, Switzerland. This article is an open access article distributed under the terms and conditions of the Creative Commons Attribution (CC BY) license (https://creativecommons.org/licenses/by/4.0/).
Share and Cite
MDPI and ACS Style
Jung, H.; Won, J.; Kang, S.; Kim, S. Characterization of the Propagation of Meteorological Drought Using the Copula Model. Water 2022, 14, 3293. https://doi.org/10.3390/w14203293
AMA Style
Jung H, Won J, Kang S, Kim S. Characterization of the Propagation of Meteorological Drought Using the Copula Model. Water. 2022; 14(20):3293. https://doi.org/10.3390/w14203293
Chicago/Turabian StyleJung, Haeun, Jeongeun Won, Shinuk Kang, and Sangdan Kim. 2022. "Characterization of the Propagation of Meteorological Drought Using the Copula Model" Water 14, no. 20: 3293. https://doi.org/10.3390/w14203293
Note that from the first issue of 2016, this journal uses article numbers instead of page numbers. See further details here.