

Study on Multi-Objective Optimization of Sponge Facilities Combination at Urban Block Level: A Residential Complex Case Study in Nanjing, China

1
College of Civil and Transportation Engineering, Hohai University, Nanjing 210024, China
2
College of Hydrology and Water Resources, Hohai University, Nanjing 210024, China
3
Department of Landscape Architecture, School of Architecture, Southeast University, Nanjing 210096, China
*
Authors to whom correspondence should be addressed.
Water 2022, 14(20), 3292; https://doi.org/10.3390/w14203292
Submission received: 3 September 2022
/
Revised: 1 October 2022
/
Accepted: 10 October 2022
/
Published: 18 October 2022
(This article belongs to the Special Issue Urban Runoff Control and Sponge City Construction II)
Abstract
:Urban block-scale sponge system design needs address how to specify the optimal approach to combine the number of areas and types of sponge facilities for diverse land conditions and sponge system design objectives, while ensuring sponge performance and economic efficiency. With the gradual application of multi-objective optimization algorithms in the design of sponge cities, multi-objective combinatorial problem solving for sponge facilities based on optimization algorithms is more accurate and efficient than traditional design methods based on the designer’s experience. This study utilizes a residential complex in Nanjing as a practical example, selects six types of typical sponge facilities to construct a multi-objective optimization combination model for sponge facilities, and employs the SPEA-2 algorithm to determine the optimal combination of sponge facility types and quantities. Finally, 186,754 combinations of sponge facilities were calculated. For the three sponge objectives of optimal performance and economy for stormwater infiltration and storage, optimal performance and economy for runoff pollution control, and optimal average overall performance for stormwater infiltration, runoff pollution control, and economy, a number of combinations of sponge types and numbers were obtained.
1. Introduction
Under natural conditions, the underlying surface has good permeability and precipitation can infiltrate directly into the soil and participate in the hydrological cycle [1]. However, the increase in impermeable underlying surface in cities has gradually led to an increase in the amount of runoff volumes and a decrease in the amount of naturally infiltrated stormwater, causing many urban water environment problems [2]. Examples include urban flooding, lack of water in urban green spaces, etc. [3,4]. Sponge cities aim to increase the resilience of cities to rainfall by optimising the urban underlying surface and thereby increasing the natural infiltration and storage capacity of rainwater [5]. Now, China’s sponge cities have moved from the pilot exploration stage to the systematic demonstration stage [6].
Given the scarcity of land resources in built-up urban areas, how to optimize the combination of sponge facilities to maximize ecological and economic benefits has become an important issue for sponge city planners. The selection and combination of sponge facility types is an important step in the planning and design process of urban sponge systems [7,8]. The performance and cost of sponge facilities vary, how to reasonably select the type and number of sponge technology facilities based on site conditions and sponge city policy requirements requires consideration of multiple design objectives such as runoff control, pollution control and stormwater resource utilization [9].
The problem of optimising the combination of sponge or eco-stormwater management facilities has been extensively researched by many scholars in similar fields. Advanced experiences can provide us with a reference. These concepts mainly include the Low Impact Development (LID), Green Infrastructure (GI) and Best Management Practices (BMPs) etc. [10]. Different combinations of facilities will create different stormwater management effects. For example, in terms of stormwater runoff control [11], stormwater pollution control [12] and in terms of economic performance [13]. Therefore, depending on the objectives of the project, different types of LID-BMP-GI facilities are combined in different practical projects. The combination of facility types chosen for the different scales of the project also varies considerably [14,15,16]. In recent years, multi-objective optimisation models have become more widely used in the sponge city [17,18].
A multi-objective optimization model-based approach provides methods and approaches to address the multi-objective combination of sponge facilities [15,19]. The design variables, objective functions, constraints, software tools and solution algorithms are all significantly different in the construction of multi-objective optimisation models due to the different purposes and scenarios for which different combinations of stormwater management facilities are studied [15,20,21,22,23].
The aims of this study are: (1) to construct a multi-objective optimisation model for a typical combination of sponge facility type and scale at the urban plot scale. (2) To explore the application and solution of parametric design software (e.g., grasshopper), which is more commonly used by urban planners, to the multi-objective optimisation model. (3) Apply the constructed multi-objective optimisation model for sponge facility combinations to a case study in Nanjing, China, and apply it empirically to solve for sponge facility types and scales under different optimal combination scenarios.
2. Methodology
2.1. The Multi-Objective Optimization Model
In real-world cases, people are often faced with decision problems that consist of multiple interacting and conflicting goals that need to be weighed to obtain the best solution to the problem. A multi-objective optimization problem is when we are faced with a decision problem with more than one objective [24].
In general, multi-objective optimization problems have conflicting objectives, and it is very unlikely that multiple objectives will be optimal at the same time. Thus, the solution to a multi-objective optimization problem is not unique, but rather there is a set of many Pareto optimal solutions. The set of Pareto optimal solutions constitutes the Pareto front [25]. In Bi-objective optimization problems, the Pareto front is usually a two-dimensional curve, while in multi-objective optimization problems, the Pareto front is a hypersurface [26]. The set of Pareto optimal solutions is a set of possibilities, but in practice it is necessary for the decision maker to select one or more of the set of Pareto optimal solutions as the optimal solution to the multi-objective optimization problem. The decision maker can select one or several optimal solutions from among the many Pareto fronts based on the visualisation. If more than one optimal solution is selected, the values of the objective function corresponding to the multiple optimal solutions are compared and analysed in relation to the application scenario in which the problem needs to be solved. The mathematical expression for the multi-objective optimization problem is as Equation (1) and the components of a multi-objective optimization model as Table 1.
where is the objective function that maximises or minimises the objective function;, ,…, is the i single objective function; is the set of objective function constraints.
2.2. Model Framework
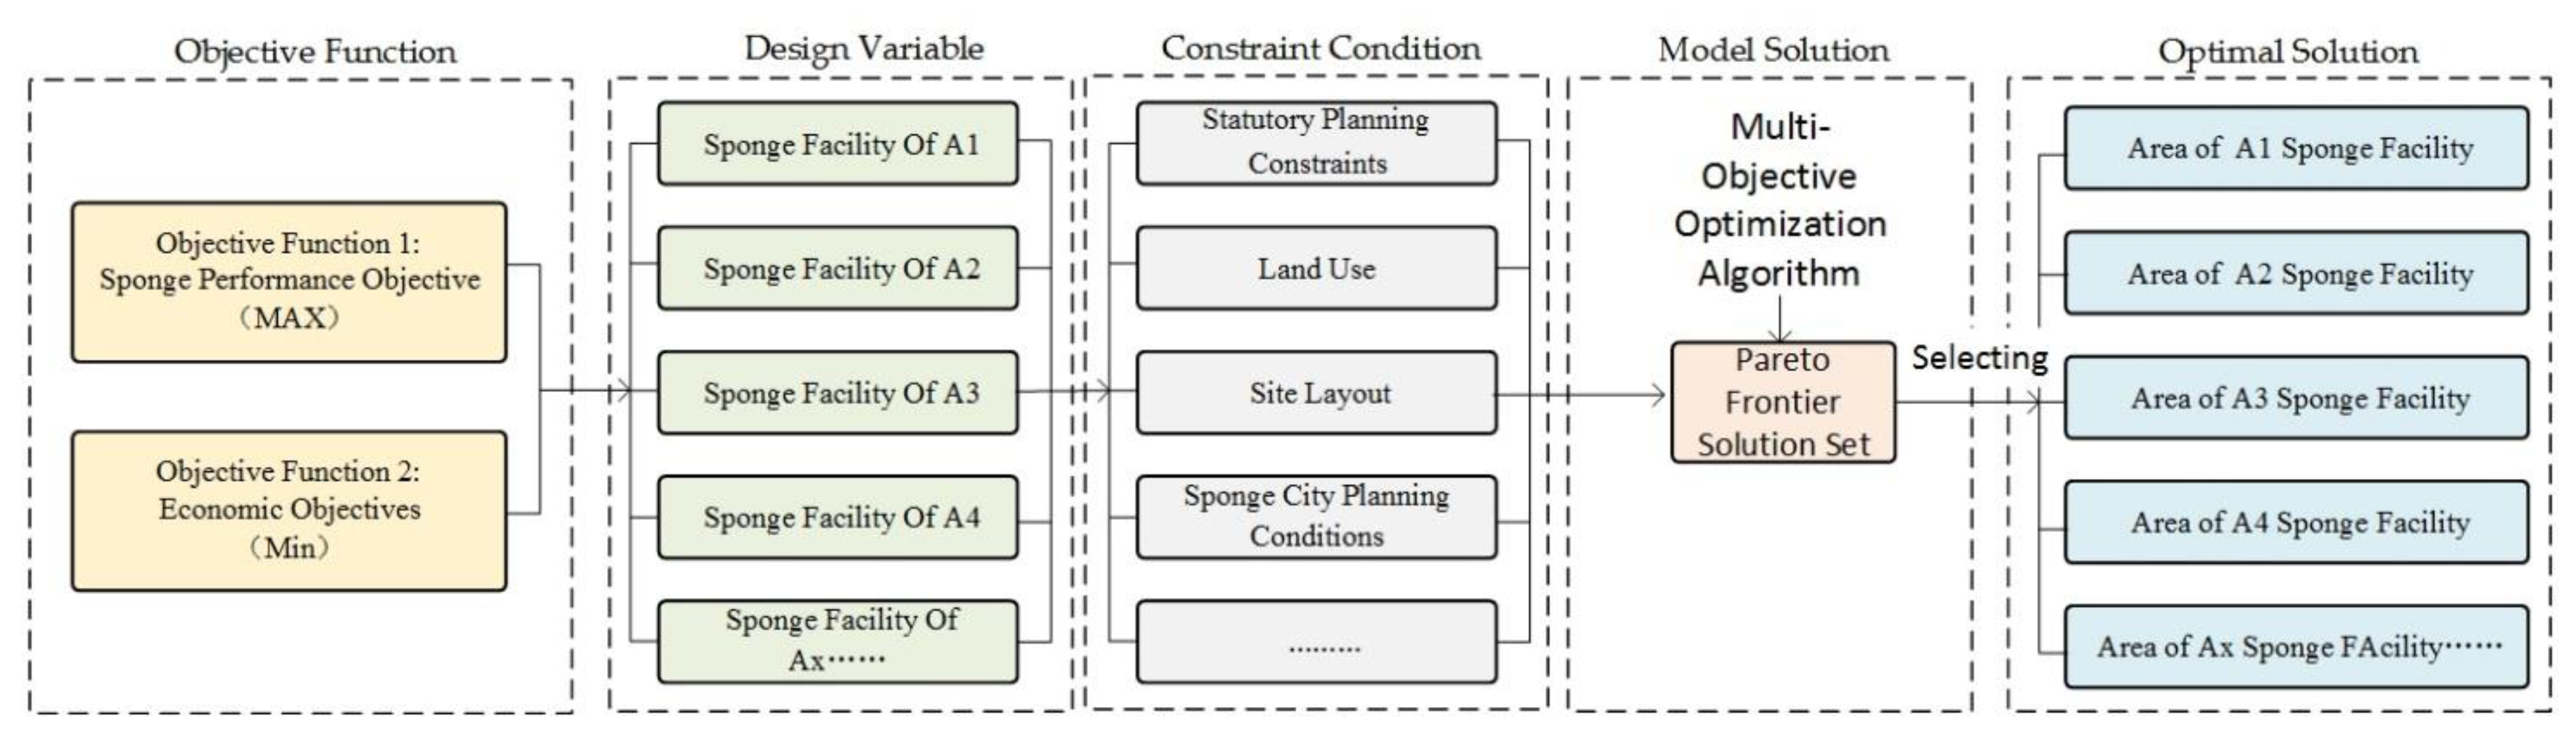
The multi-objective combination optimization model for sponge facilities is mainly used to solve the problem of selecting and scaling combinations of different sponge facilities. This means that different types and numbers of sponges are required to achieve both optimal stormwater management performance and economic cost objectives per unit area of urban land. A logical framework for a multi-objective optimization model of sponge facilies combination is shown in Figure 1.
The modelling steps are as follows:
- First, determine the sponge city design objective functions under different site conditions.
- Second, determine the number of design variables and constraints, while obtaining model constants such as sponge capacity attributes and economic cost per unit sponge facility.
- Again, establish a list of multi-objective optimization model for sponge facilities combination.
- Finally, the optimization algorithm is used to solve the model list to obtain the Pareto solution set, and the optimal solution for the combination of sponge facilities is selected according to the project situation.
2.3. Model Components
2.3.1. The Objective Functions
For different site conditions, the objective function can consist of three objectives: rainwater infiltration and storage, rainwater harvesting and utilisation, and runoff pollution control, with the overall objective of optimal sponge performance at the lowest economic cost. Its mathematical formula is expressed as:
where F is the overall objective of the optimisation; is the sponge performance objective function of the sponge facility; and is the economic cost objective number.
(1) Sponge performance objective function
Under the control scale requirements for sponge systems, three indicators are used to measure the sponge performance of different types of sponge facilities, namely rainwater infiltration capacity, rainwater resource storage capacity and runoff pollution control capacity, one or more of which can be selected as the overall sponge performance objective function depending on site conditions.
- Rainwater infiltration and storage effect
The rainwater infiltration and storage effect includes the infiltration and storage volume of rainfall on the site by the sponge facilities, with reference to the formula for calculating rainwater infiltration and storage facilities in the the Technical Guide for Sponge City Construction [27], The mathematical expression for rainwater infiltration and storage effect is:
where, is rainwater infiltration volume (m3); is soil infiltration coefficient (m·s−1); take the value can refer to Table A2; is the hydraulic gradient, usually taken as = 1; is the effective infiltration area (m2); horizontal infiltration surface according to the projected area, vertical infiltration according to the effective water level height 1/2 calculation, oblique infiltration surface according to the effective water level height 1/2. is infiltration time (s), usually take 2 h; is effective storage area (m2); is effective rainwater storage depth (m); is facility fill porosity, no fill to take 1; is the number of different sponge facility types.
- Rainwater harvesting and utilization effect
The rainwater harvesting capacity effect of a sponge facility is determined by its unit storable volume and unit area, expressed by the mathematical formula:
where is the volume of rainwater collected and utilised (m3); is the volume of water stored per unit area of the sponge facility (m3/m2); is the area of the sponge facility (m2); is the different sponge facility types.
- Runoff pollution removal effect
The pollution control objectives of sponge cities are mainly reflected in the removal effects of sponge facilities on SS, COD, BOD, TN and TP in urban runoff surface source pollution. In urban runoff SS is significantly correlated with several other water quality indicators, and the Technical Guidelines for Sponge City Construction issued by the Ministry of Housing and Urban-Rural Development of China selects SS indicators as runoff pollution control indicators, so this study also adopts SS as a measure of pollution removal capacity of sponge facilities, with the formula expressed as:
where is the amount of pollution removed by the sponge facility (t); is the removal rate of SS by different sponge facilities (%); is the area of different sponge facility types (m2); is the annual pollution load of site runoff (t/m2); and m is the different sponge facility types.
(2) Economic objective function
The total cost of the project’s sponge facilities is expressed as the sum of the product of the area of the different facility components and the cost per unit area of such facilities, where the cost per unit area of the sponge facilities needs to be determined according to the local market and facility section structure.The mathematical expression of which is:
where is the total construction cost of the proposed sponge facility(yuan); is the area of the type of facility (m2); is the cost per unit area of the mth type of facility (yuan); and n is the different sponge facility types.
2.3.2. The Decision Variables
The variables in the construction of the multi-objective optimization model for sponge facilities combination are the number of areas for different types of facilities
With reference to several types of sponge facilities that are more frequently used in China’s sponge city practice, this study selects six types of typical sponge facilities for application, namely horizontal green space without water storage modules, horizontal green space with water storage modules, water-storing sunken green space, permeable hard surface, designed water body and green roofs. The details are shown in Table 2.
Taking the area A of each type of sponge facility as a decision variable and using Ai to denote the planned design area of different facilities, where i denotes the type of facility (i = 6 for horizontal green space, horizontal green space with water storage module, water-storing sunken green space, permeable hard surface, designed water body, green roof), the variables involved in this study are listed in the Table 3.
2.3.3. The Constraints
In actual sponge city project design practice, constraints are imposed by site planning and land use and other factors on the area that can be laid out for different types of facilities, mainly including the following categories.
- (1)
- Constraints of the total area
This means that the sum of the area of each sponge facility type on the site should be less than or equal to the total area of the planned and designed site.
where A1–A6 is the sum of the area of each type of sponge facility on the site; ATA is the total area of the planned and designed site.
- (2)
- Constraints of the site green space ratio
The total area of green space type facilities such as horizontal green space and sunken green space must be less than the total area of green space on the site, in accordance with the green space ratio restrictions in the site plan.
where A1 is the area of the horizontal green space without water storage modules; A2 is the area of the horizontal green space with water storage; A3 is the area of the sunken green space on the site.
A1 + A2 + A3 ≤ AGS
- (3)
- Runoff Control Constraints for Sponge City Construction
In order to meet the design storage volume requirements corresponding to volume capture ratio of annual rainfall and runoff of the sponge city, the sum of infiltration volume, rainwater harvesting volume and runoff pollution treatment volume in the function should be greater than or equal to the design storage volume under the design rainfall corresponding to the annual volume capture ratio of the site.
where is the infiltration volume; is the rainwater harvesting volume; is the runoff pollution treatment volume on the site. is the design storage volume.
- (4)
- Constraints of the Site Building Density Rate
According to the plot ratio requirements in the site plan, the area of the green roof must be smaller than the site building footprint.
where A6 is the area of the green roof on the site; AB is the planned building footprint.
A6 ≤ AB
- (5)
- Constraints of the Hard Surface Area
The permeable hard surface provided on the site shall be less than equal to the sum of the areas of all hard surfaces such as roads and squares on the site.
where A4 is the area of permeable hard surface sponge facilities on the site; AHS is the total area of hard surface such as roads and squares on the site.
A4 ≤ AHS
- (6)
- Constraints of the Water Surface Rate
If the site water surface ratio constraint is stipulated in the detailed site plan, consideration needs to be given to the fact that the proportion of the site occupied by designed water body for storage should be less than or equal to the water surface ratio requirement in the site plan.
where A5 is the area of the designed water body in the site and A is the planned site water surface rate footprint.
A5 ≤ AWS
- (7)
- Non-negative Constraints
Non-negative area for each type of sponge city facility
where A1–A6 is the sum of the area of each type of sponge facility on the site.
A1,A2,A3,A4,A5,A6 ≥ 0
2.3.4. The Constants
The constants are the basic attribute parameters for the different types of sponge facilities. The values of the basic constants for rainwater infiltration and storage, rainwater harvesting and utilisation, runoff pollution control and unit cost can be found in Table A1, Table A2, Table A3, Table A4 and Table A5, listed in the Appendix A.
2.4. Model Solution
2.4.1. Algorithms
In recent years, evolutionary algorithms based on simulating the evolutionary process of natural organisms have become an important method for solving multi-objective optimization problems. Compared to traditional mathematical planning methods evolutionary algorithms have the characteristics of being informative, adaptable and scalable. At present, the more commonly used evolutionary algorithms include Genetic Algorithms, Simulated Annealing Algorithms, The Strength Pareto Evolutionary Algorithm, Ant Colony Optimization Algorithm etc. [28]. The Non-Dominated Sorting Genetic Algorithm (NSGA-II) and The Strength Pareto Evolutionary Algorithm (SPEA-2) are the most widely used and influential multi-objective evolutionary algorithms, and are the reference for performance comparisons of other evolutionary algorithms. Compared to the first generation of traditional genetic algorithms, the advantages of the enhanced evolutionary algorithm include reduced computational complexity of the initial evolutionary algorithm, faster computational speed, improved accuracy of the optimization results and reduced computational effort [29,30]. In this study, the Strength Pareto Evolutionary Algorithm (SPEA-2) was selected as the algorithmic solution tool for the multi-objective optimization sponge facility combination model.
2.4.2. Software Tools
In this study, Rhinoceros and Grasshopper, which are widely used in the field of urban planning and design, are used as the basic software platforms for the calculation of optimization algorithms [31,32,33,34]. Grasshopper is a parametric design plug-in for Rhinoceros with visual programming capabilities, but it cannot be run independently of Rhinoceros itself, and can generate results through operator command operations, and can also realise circular iterative operations based on the written algorithms, greatly improving the efficiency of planning and design personnel [35].
This study uses the Octopus multi-objective optimization plug-in. Octopus is a multi-objective optimization plug-in based on the Grasshopper developed by the University of Applied Arts in Vienna, Austria, and Bollinger+Grohmann (Frankfurt, Germany). It provides designers with a quick and easy-to-use multi-objective parametric design plug-in for computational design and is widely used in the field of planning and design [36,37].
3. Case Study
3.1. Overview of the Study Area
3.1.1. Location
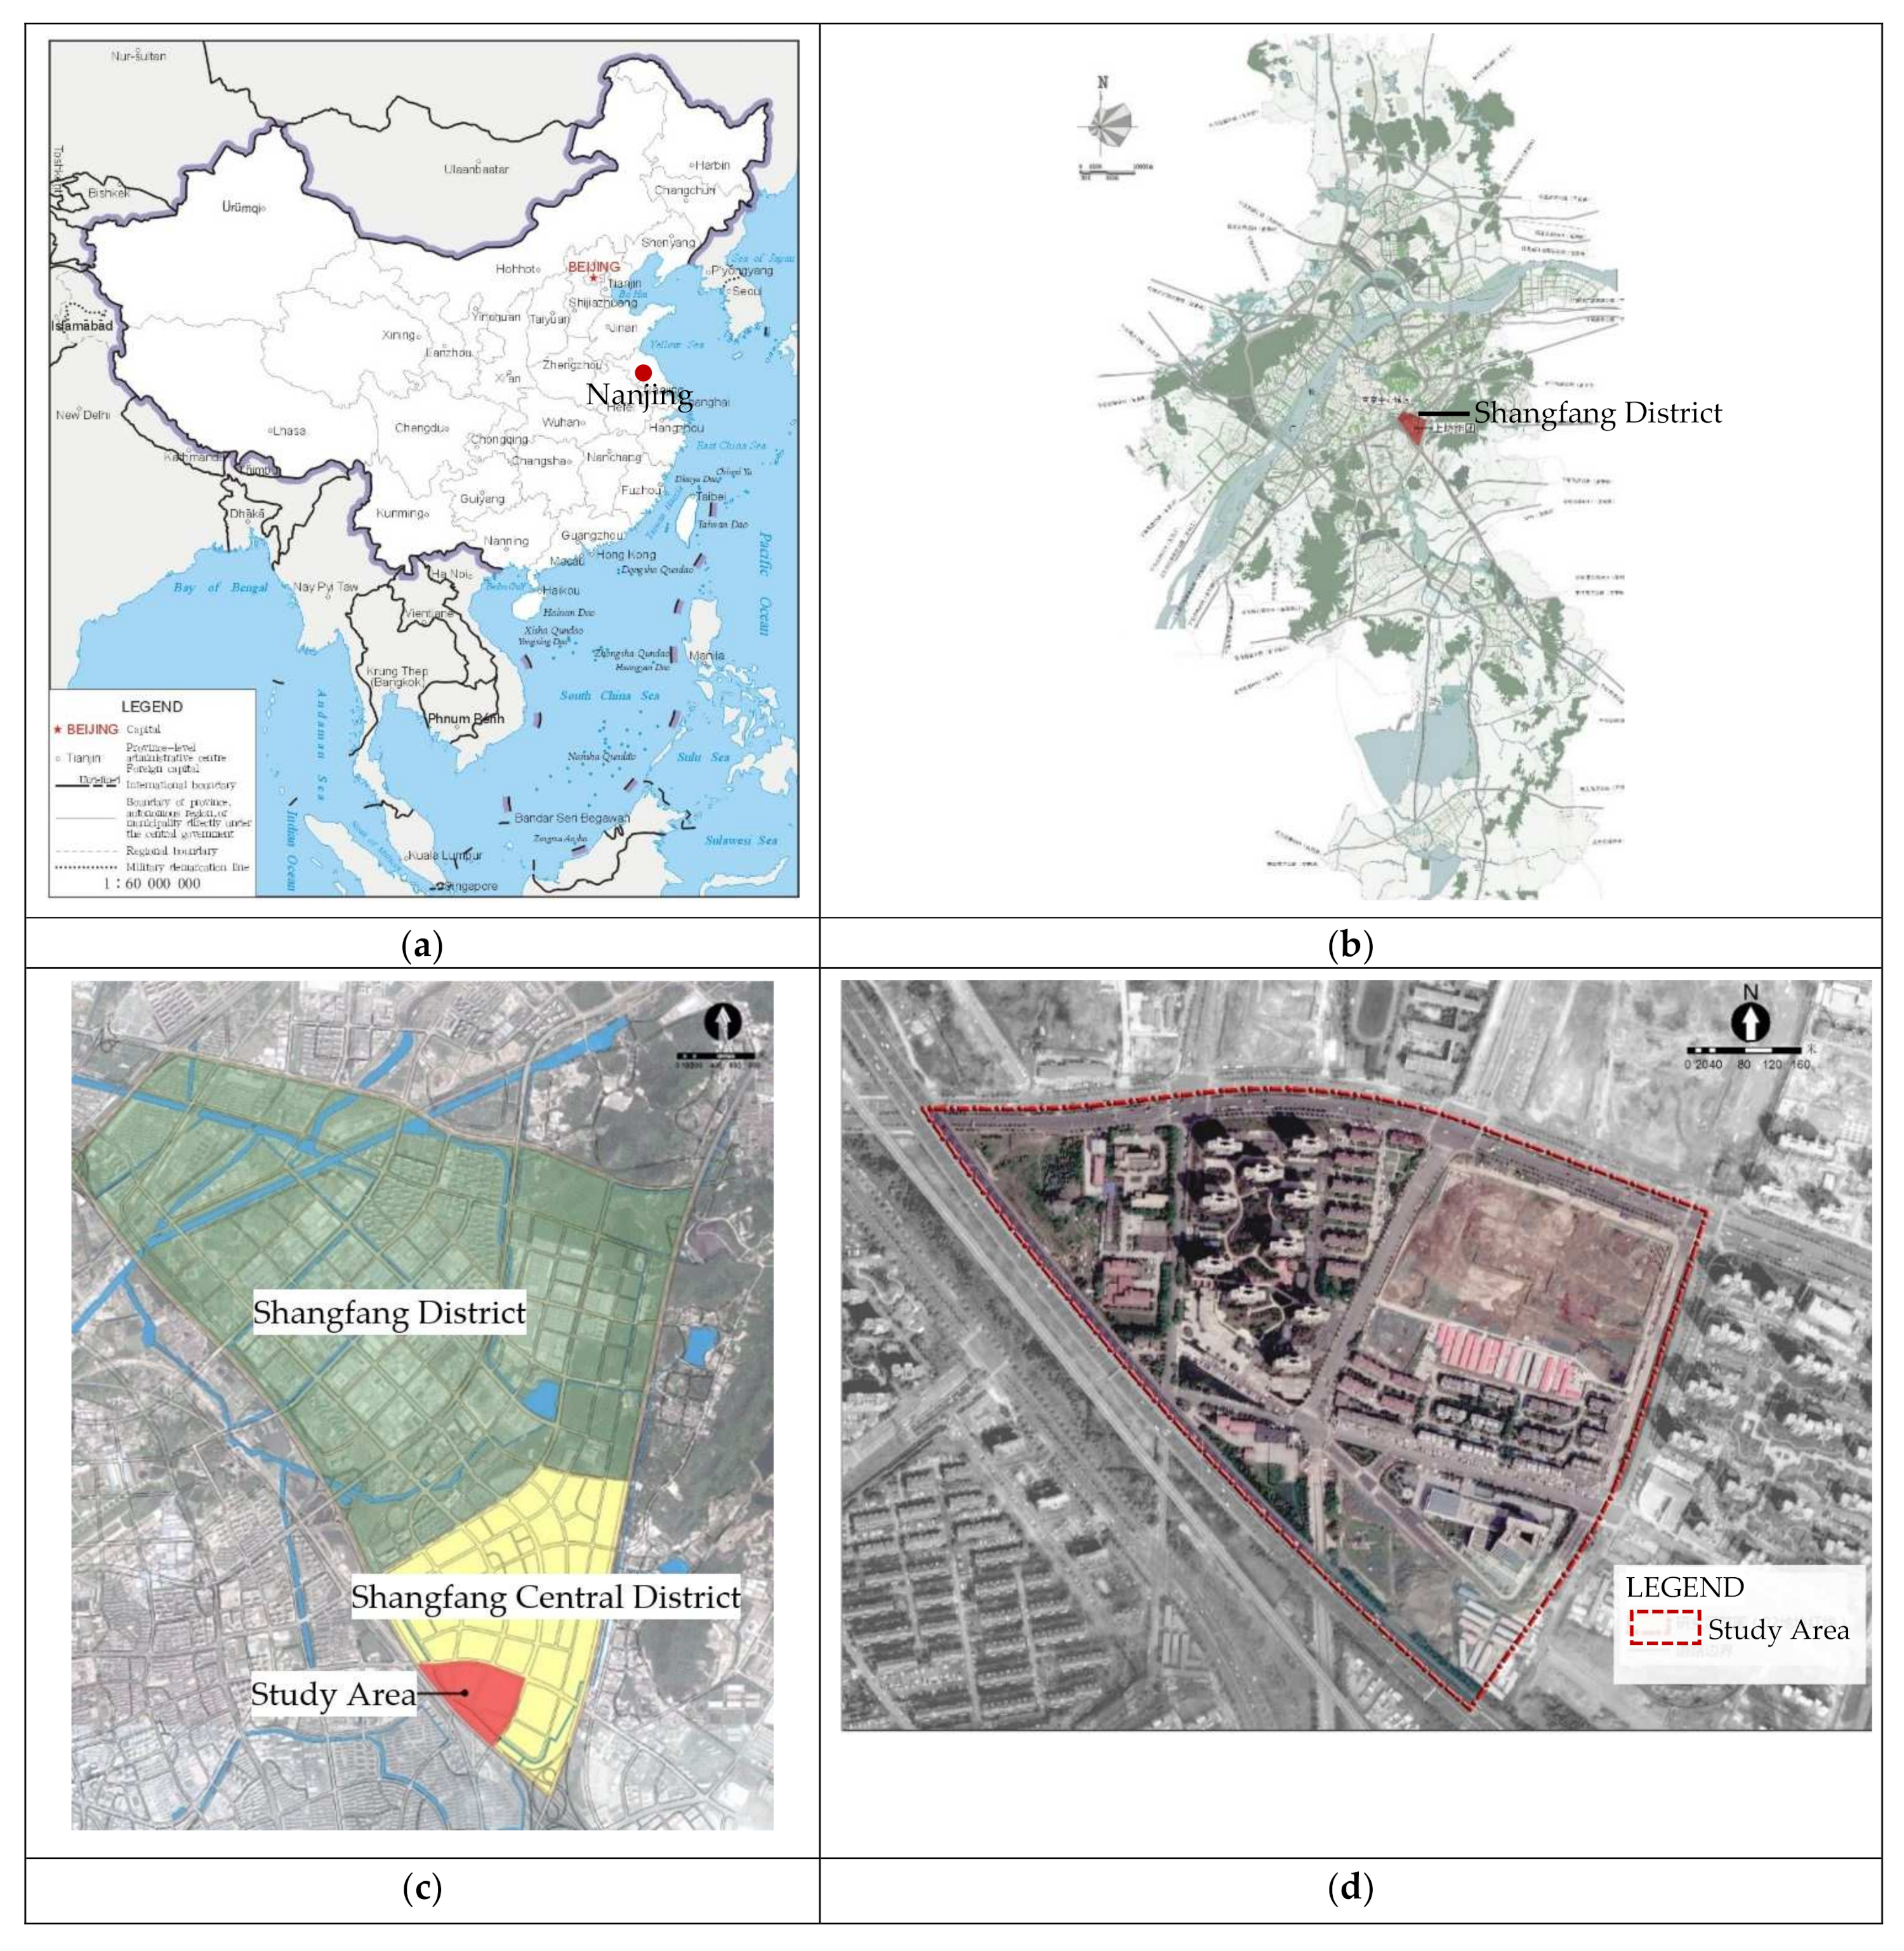
The study area is located in the southeast of Nanjing, with a total planned area of approximately 18.13 square kilometres for the Shangfang District urban area. The No. 2 residential complex selected for this study is located on the southern side of Shangfang District, with a total area of 3.77 hectares (Figure 2).
3.1.2. Weather
The study area is located in a subtropical monsoon climate, with an average annual rainfall of 1038.7–1124 mm and an average annual rainfall day of 124.2 days. Most of the annual rainfall is concentrated in June to August, accounting for more than 50% of the annual rainfall, with June to July being the rainy season.
3.1.3. Underlying Surface
The current topography of the study area is relatively flat, with over 80% impervious area and the main land types are impervious building roofs and road squares, along with some infiltrated bare earth wasteland. The current status of the site has a large proportion of highly developed industrial, residential and storage land attributes. The vegetation is poorly protected and the water system in the area is underdeveloped, with most of the original water system being filled in and some areas poorly drained.
3.1.4. Planning and Policy Status
According to the Nanjing Urban Master Planning (2007–2020), the Jiangning District Urban and Rural Master Planning (2010–-2030) and the Nanjing Jiangning Shangfang Group Control Detailed Planning, the current land use in the study area has been greatly adjusted, with a large proportion of industrial land replaced by residential and commercial land. The commercial land use is mainly concentrated in the northwest and southeast of the site in two separate plots 02–06 and 02–19, and the green space in the area has been reorganized and a separate green space has been planned in the west, so that the green space rate has been improved to a large extent (Table 4).
3.1.5. Sponge City Scale Control Requirements
Based on the requirements for runoff control in this area in the Nanjing Sponge City Construction Pilot City Implementation Planning and the Nanjing Sponge City Special Planning, the total annual runoff control rate for the study area sponge city is 85%, corresponding to a design rainfall of 38.8 mm, We obtained the control index parameters of annual runoff control rate, design rainfall amount, surface source pollution control rate, rainfall field control rate and design of storage volume for the control unit in which the study area is located through the upper planning. The details are shown in Table 5.
3.2. Optimization Objectives
By analysing the site topography, land use type and runoff characteristics, the main water environment issues faced in the study area as follow:
(1) A large proportion of impervious surface area and a low water surface ratio resulting in a high volume of runoff from the site.
(2) The site is highly developed and surface runoff pollution is more serious.
(3) A high proportion of green space is planned for the site, with high water demand for vegetation and high long-term maintenance and management costs.
By integrating the water environment issues that need to be addressed at the site, rainwater infiltration and collection, runoff pollution control and economic objectives are selected as the site sponge system design optimization objectives, and a multi-objective optimization model for sponge facility.
3.3. Constraint Settings
Based on the control requirements for boundary conditions, green area ratio, building density, water body area and square road area in the detailed control planning of the study area, as well as the scale control requirements in the sponge city planning (Table 5), In conjunction with Section 2.3.3 the constraints, we obtained the relevant constraints for the model.
3.4. Model List
After setting the objective function and constraints, we obtained a list of elements for a multi-objective optimization model for sponge facilities in the study area, with each element specified as follows in Table 6.
4. Results
4.1. Parameter Settings
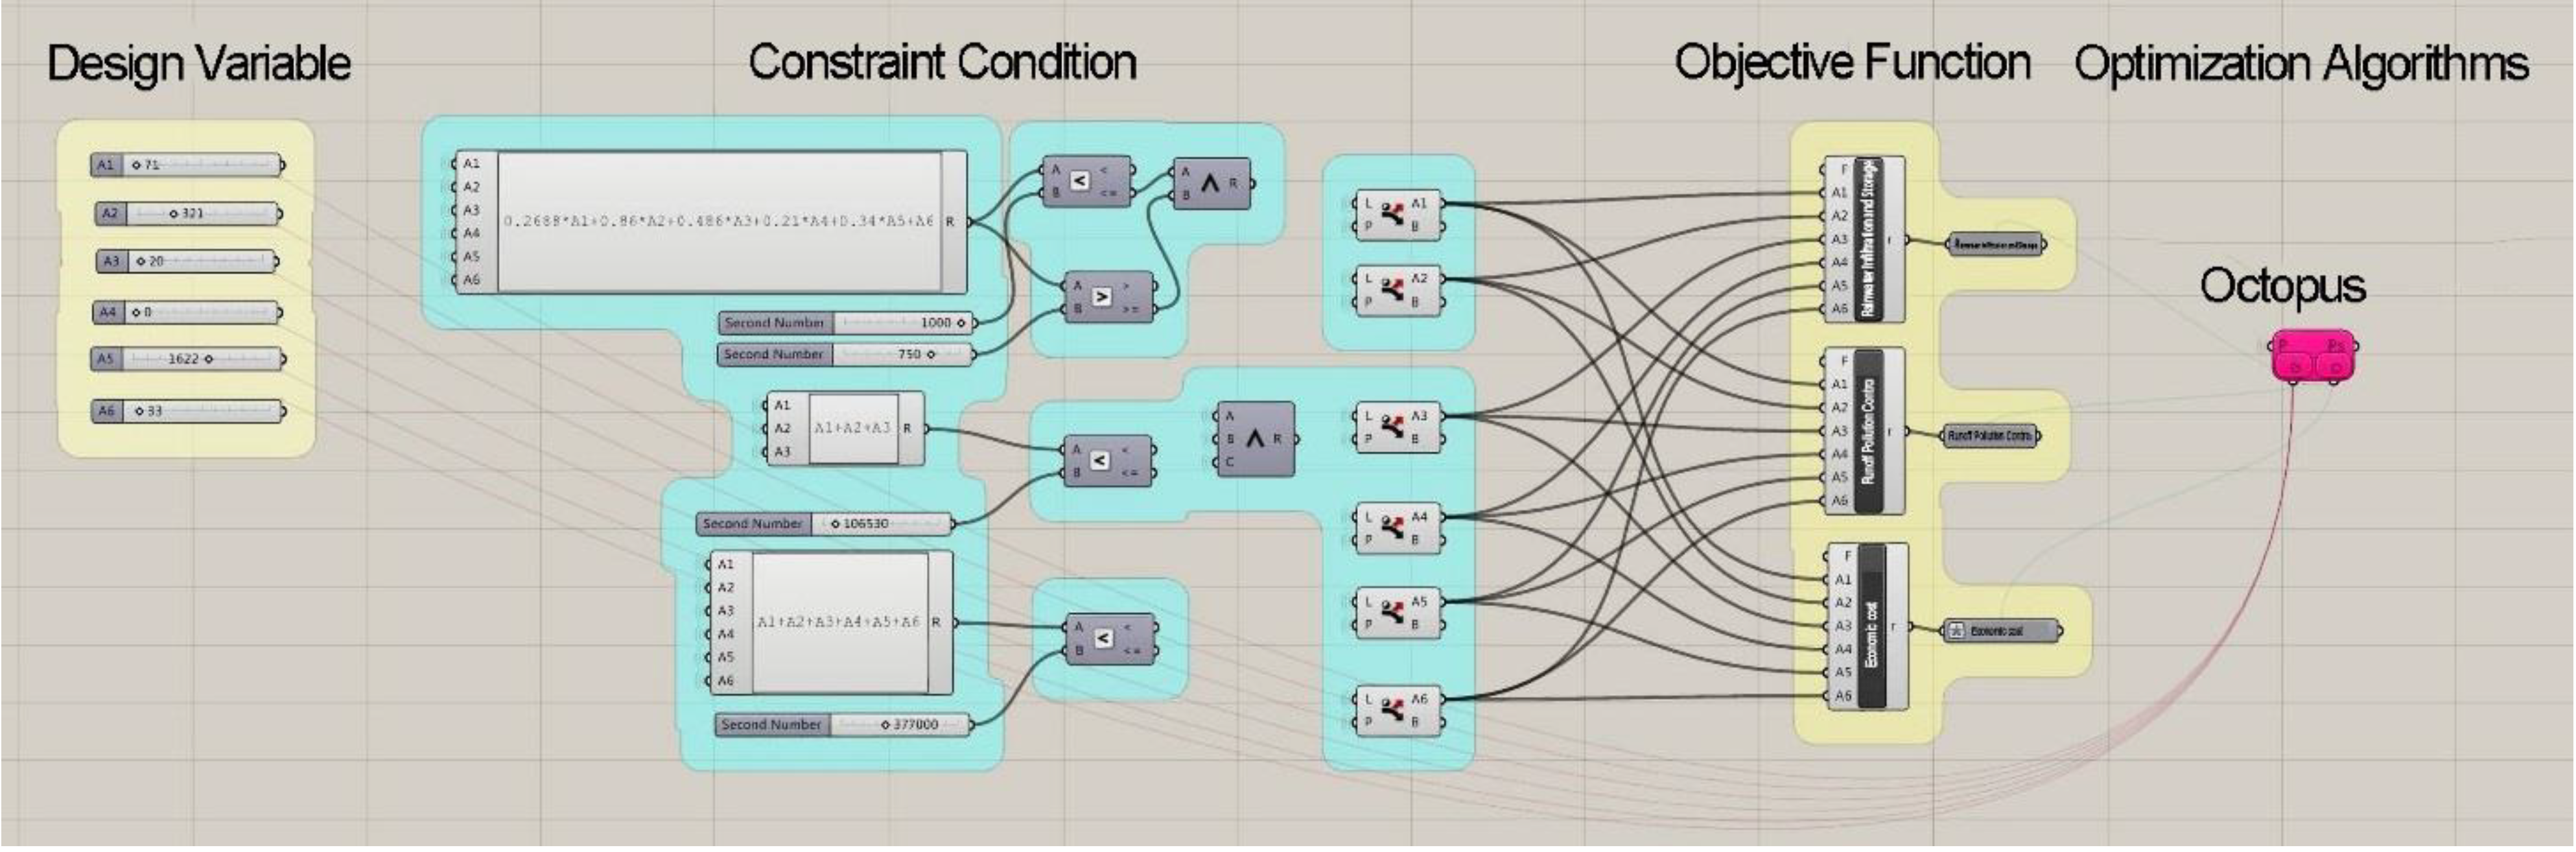
The six decision variables A1–A6 were connected to the G-side of the Octopus plug-in in the form of a Number slider. The three objective functions of rainwater infiltration, runoff pollution control and economic objectives are entered into the O-side of the Octopus plug-in using the objective function equation in Evaluate. The rainwater infiltration function and pollution control are evaluated for the maximum value and the economic objective for the minimum value. At the same time, constraints are set between the six decision variables Number slider, through the setting of constraints can improve the speed of the model calculation, reduce the number of invalid scenario simulation calculation. The sponge objective function and the pollution control objective function are maximum values, and as the default design of the Octopus plug-in program is to find the minimum value, the sponge objective function and the pollution control objective function formula output data need to be negative (i.e., the output formula is multiplied by −1).
The Octopus parameters were set as follows: Optimization algorithm: SPEA-2, population size: 100, maximum number of iterations: 500, elite rate 0.5, mutation probability 0.1, mutation ratio 0.5, crossover rate 0.8, and Grasshopper cell connection method detailed in Figure 3.
4.2. Validity Verification
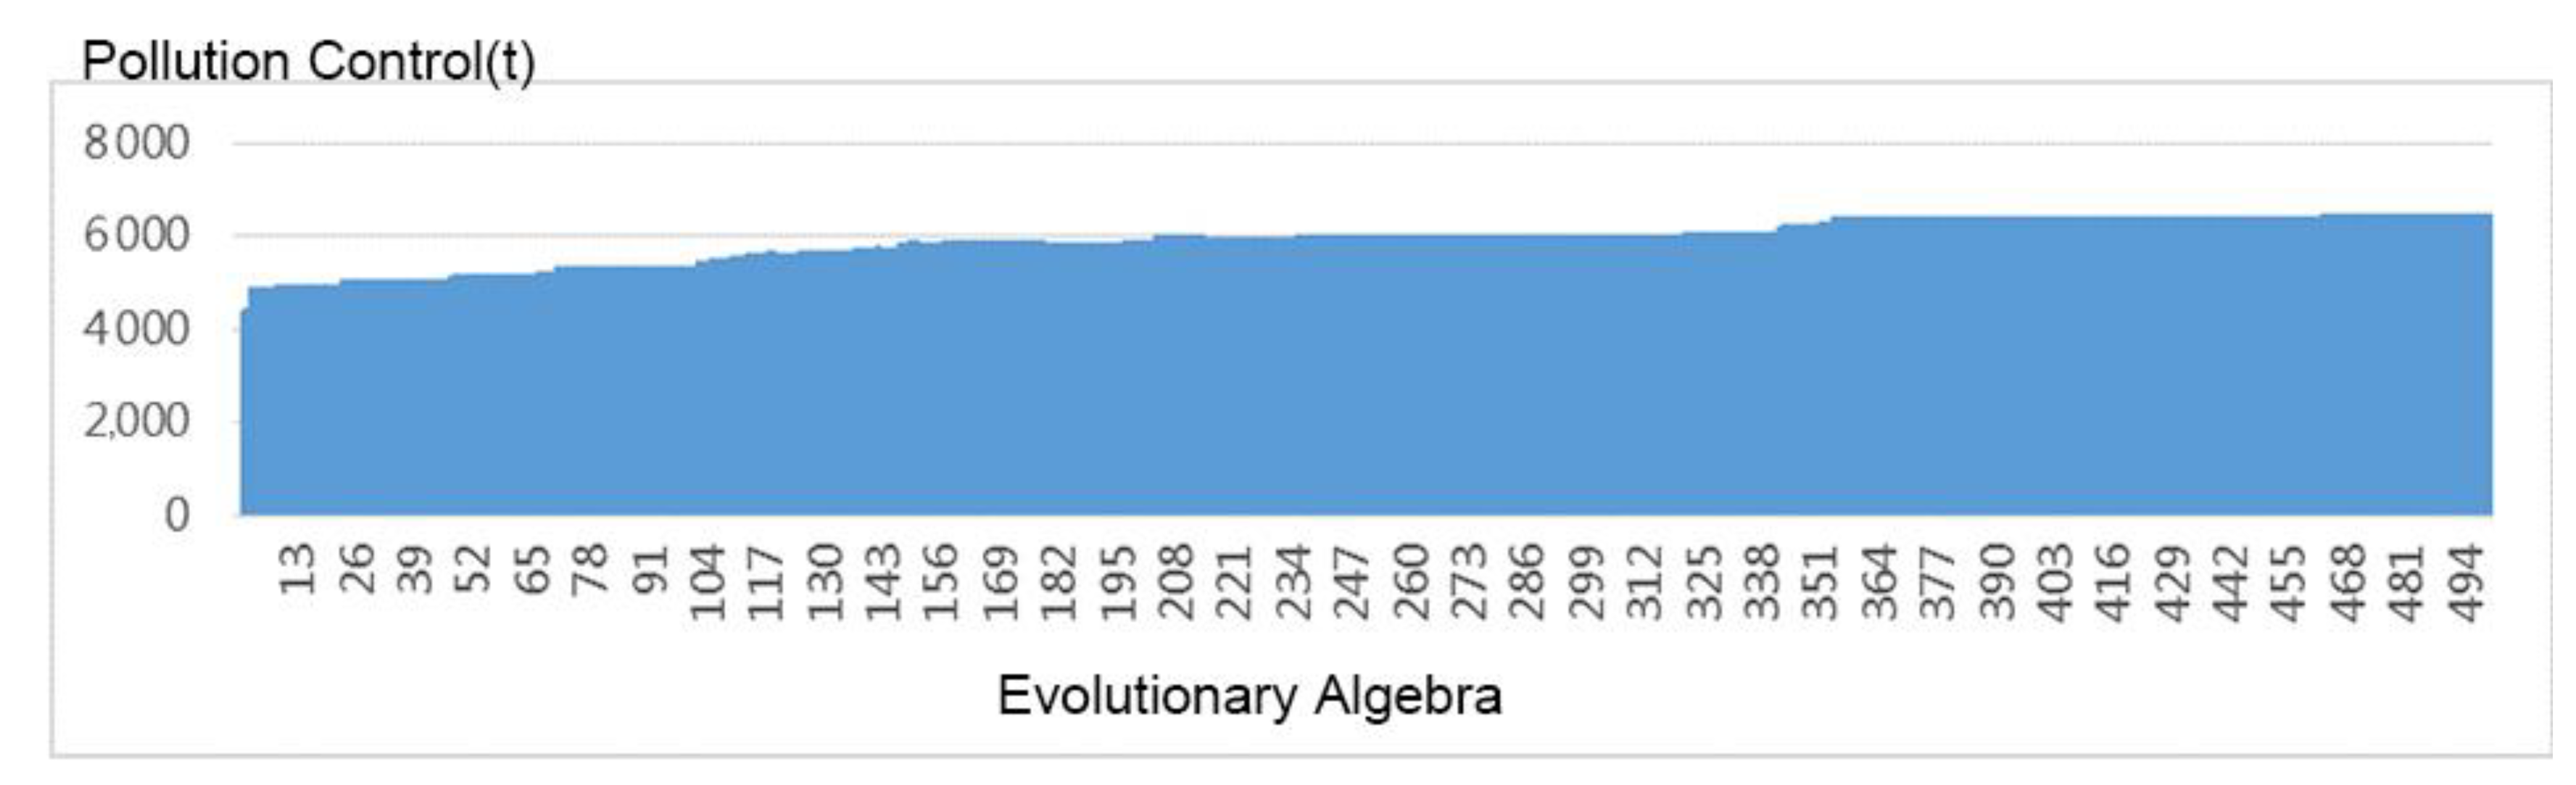
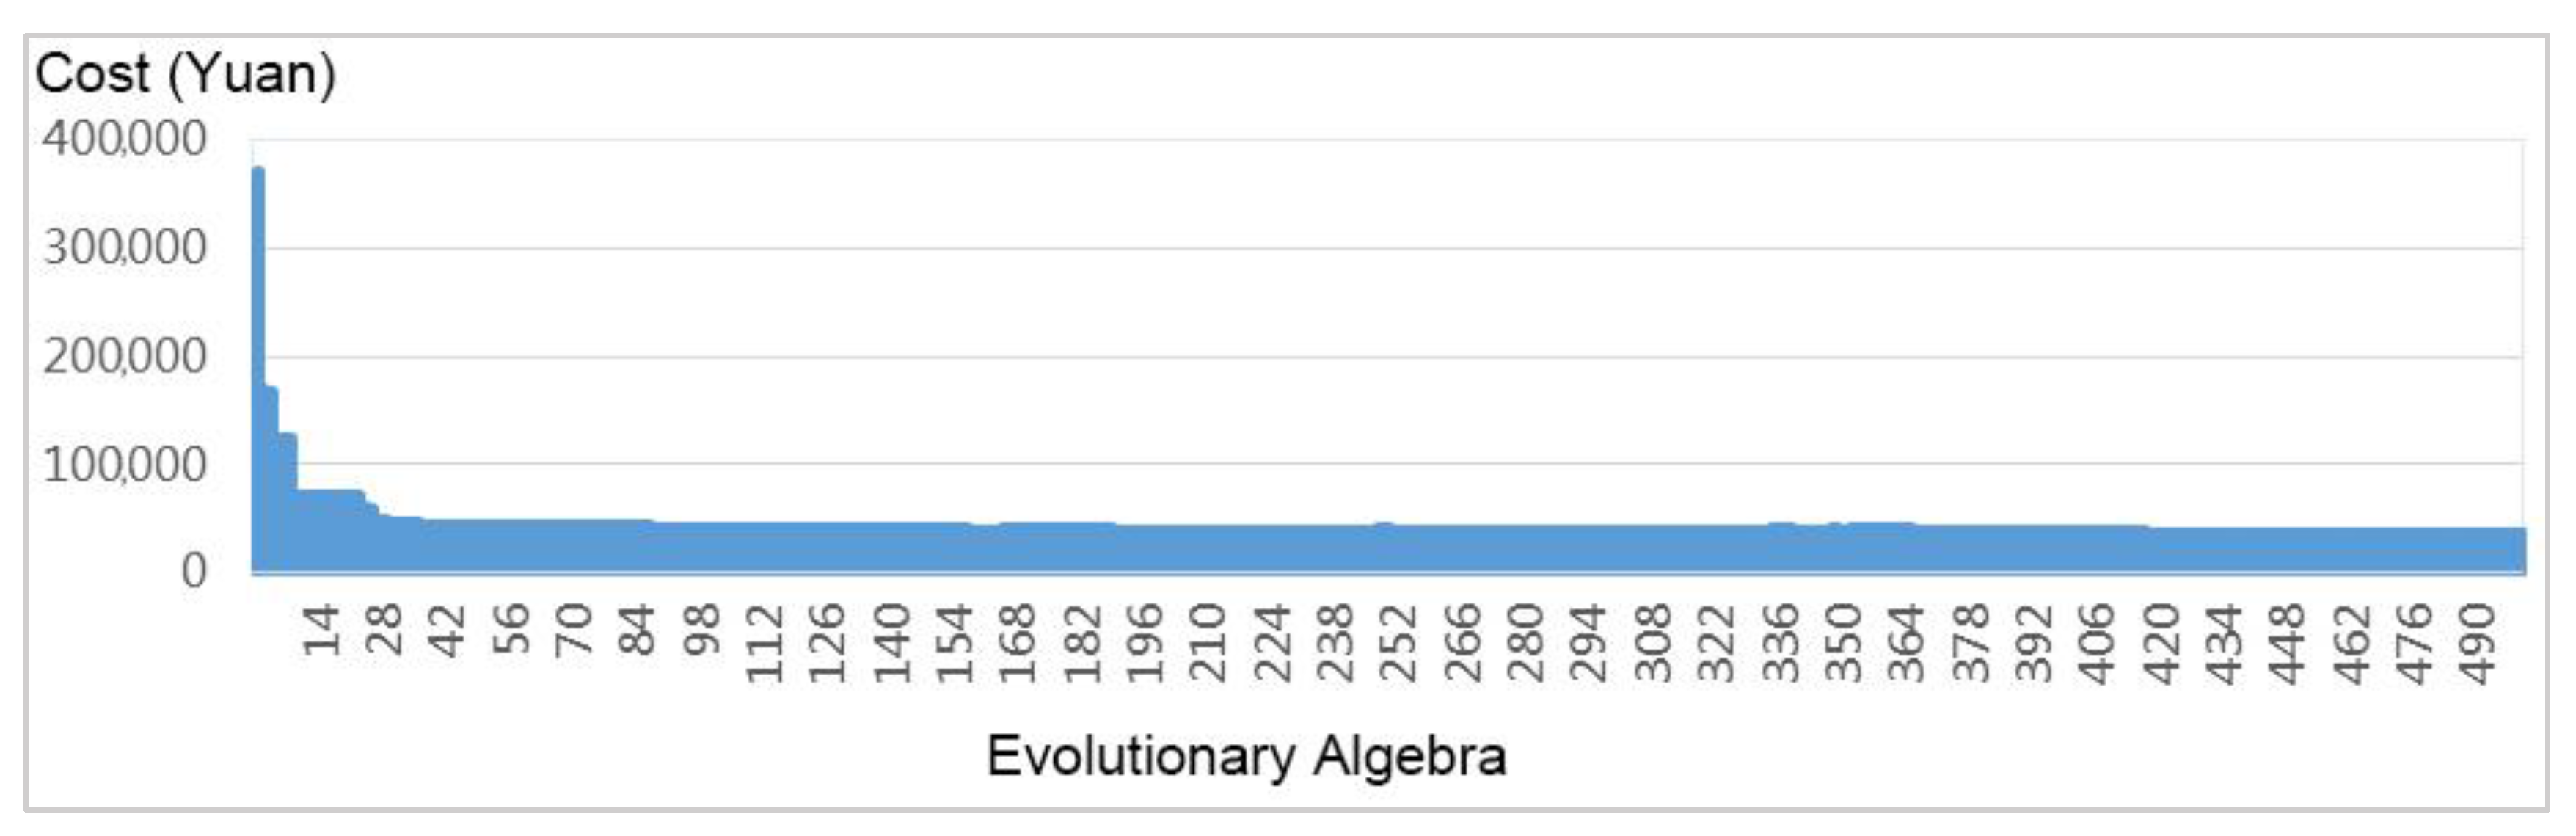
After 500 iterations of the Octopus plug-in, the results of the three objective functions were extracted and analysed, showing that the values of rainwater infiltration and runoff pollution removal capacity gradually increased with the number of iterations and the economic cost values gradually decreased with the number of iterations, indicating that the objective functions were gradually optimised with the iterative operation of the algorithm.
The resultant values gradually stabilise at the 10th iteration of the rainwater infiltration objective function (Figure 4) and at around 370 iterations of the pollution control objective function and they gradually reach a maximum value at the 10th iteration of the rainwater infiltration objective function. In order to verify whether the optimization algorithm converges towards the optimization objective, 500 generations of the evolutionary process of the Pareto optimal solution of concentrated rainwater infiltration storage, pollution control objective function value per generation maximum value, and economic cost objective function minimum value for comparison can be seen from Figure 4, Figure 5 and Figure 6. In the 400th generation around the three objective functions, basic unity basically remains unchanged and the optimization objective gradually gains better convergence, meeting the optimization requirements.
4.3. Analysis of the Results
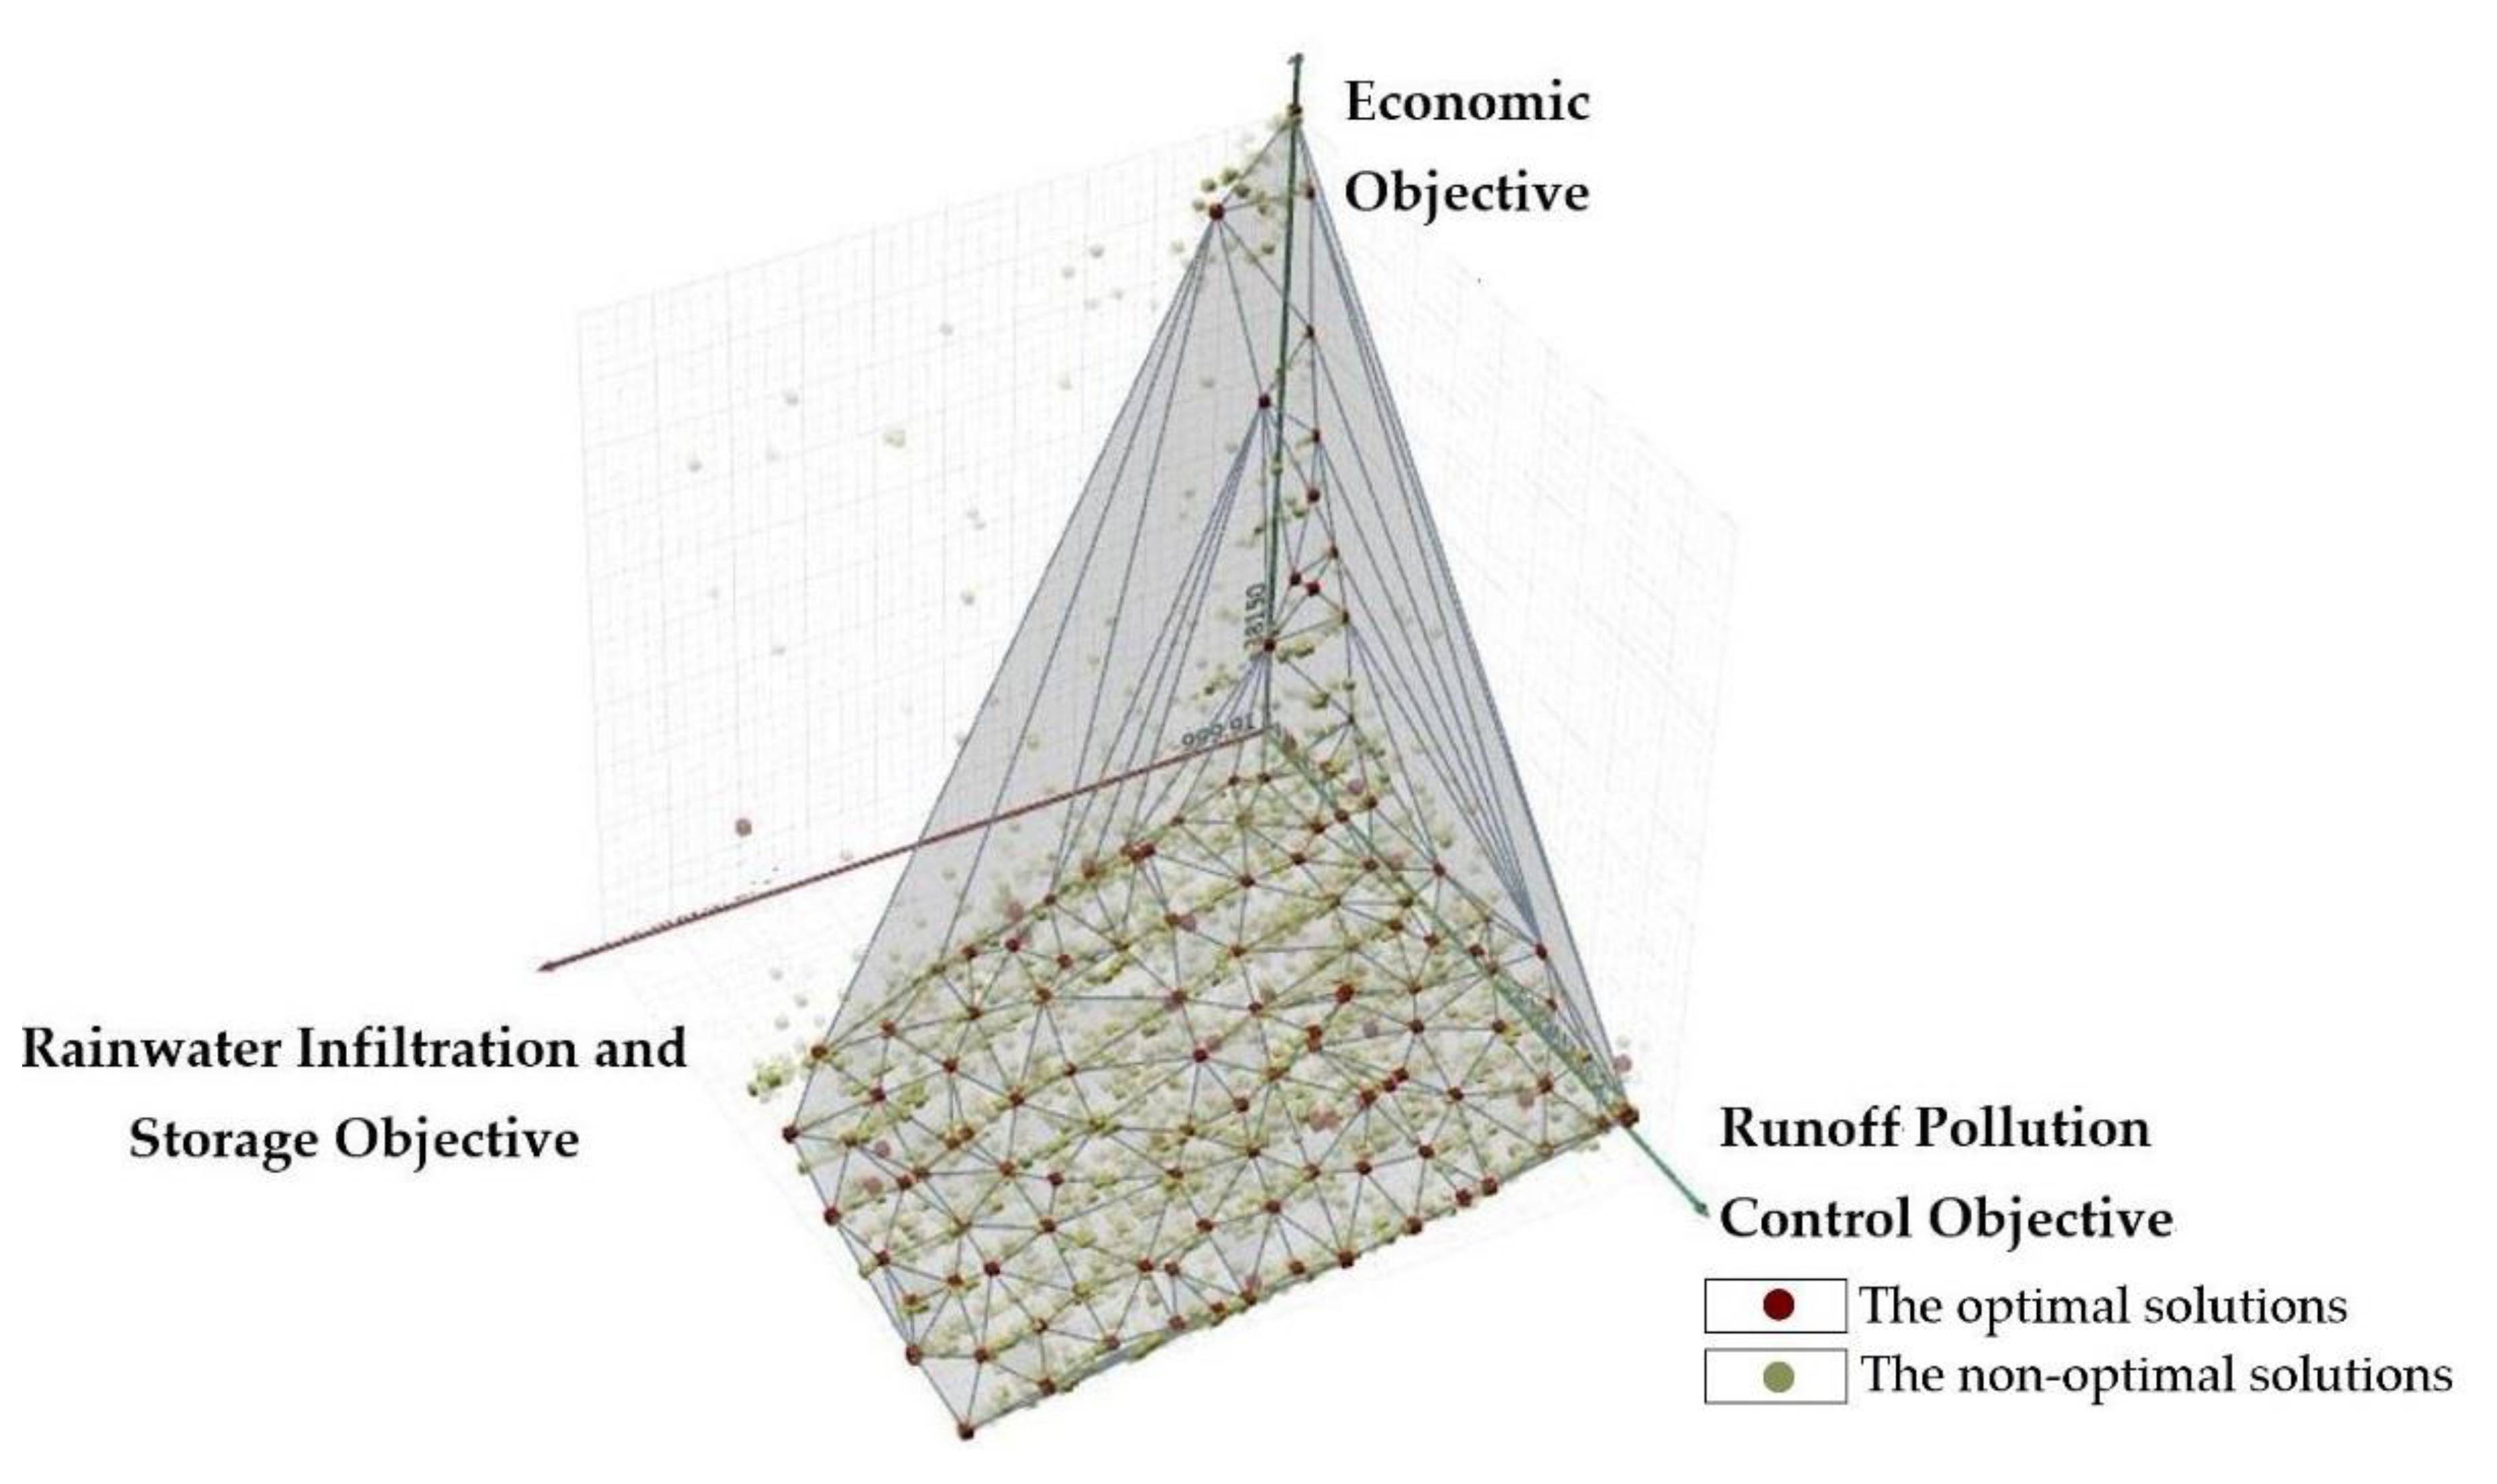
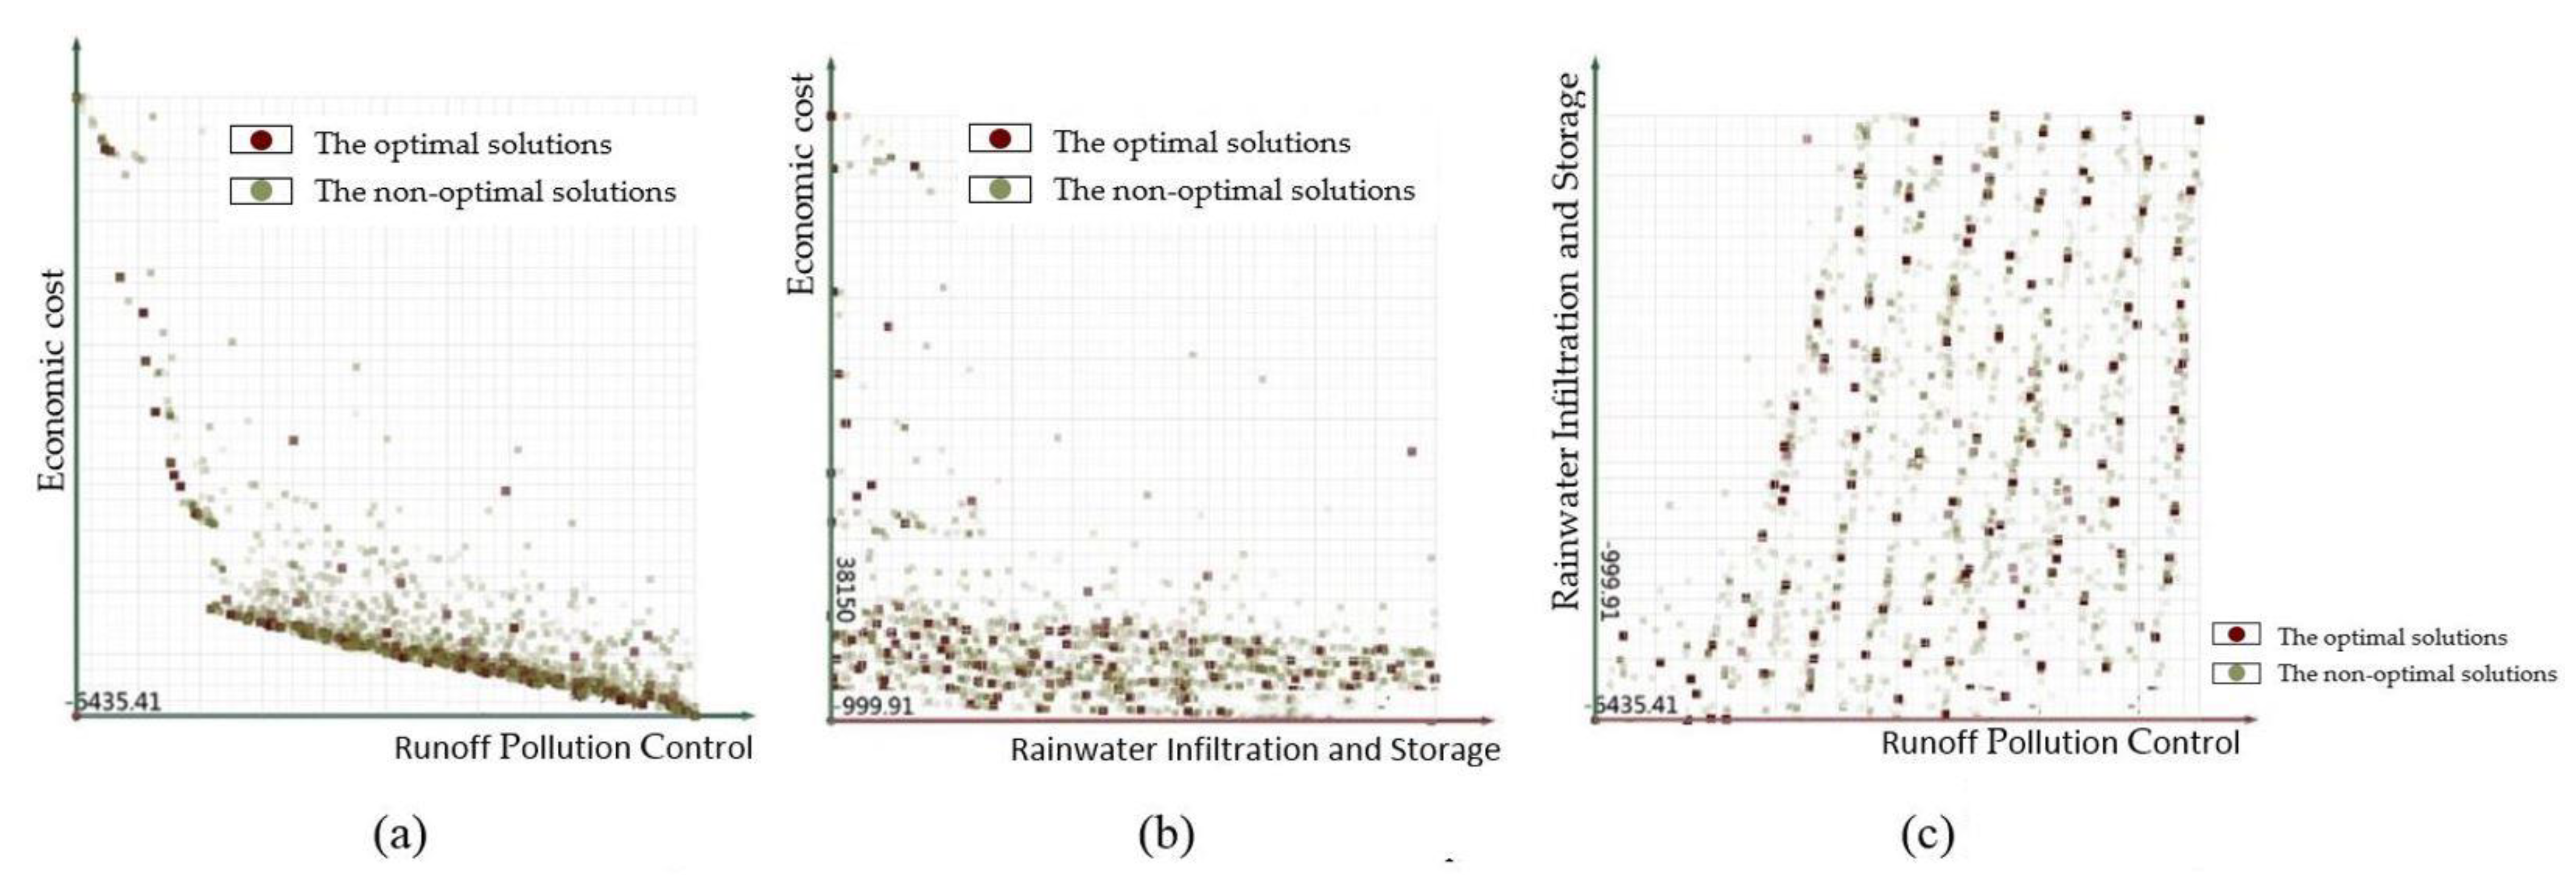
A total of 186,754 optimal solution sets were obtained after 500 generations of the algorithm. 123 sets of optimal solutions obtained in the 500th generation were selected (Figure 7), and this solution space can provide designers with a rich choice of solutions. Based on the design objectives of this case, the optimal solution for rainwater infiltration and storage, the optimal solution for pollution control, the optimal solution for economic efficiency and the comprehensive average optimal solution are compared and analysed (Figure 8).
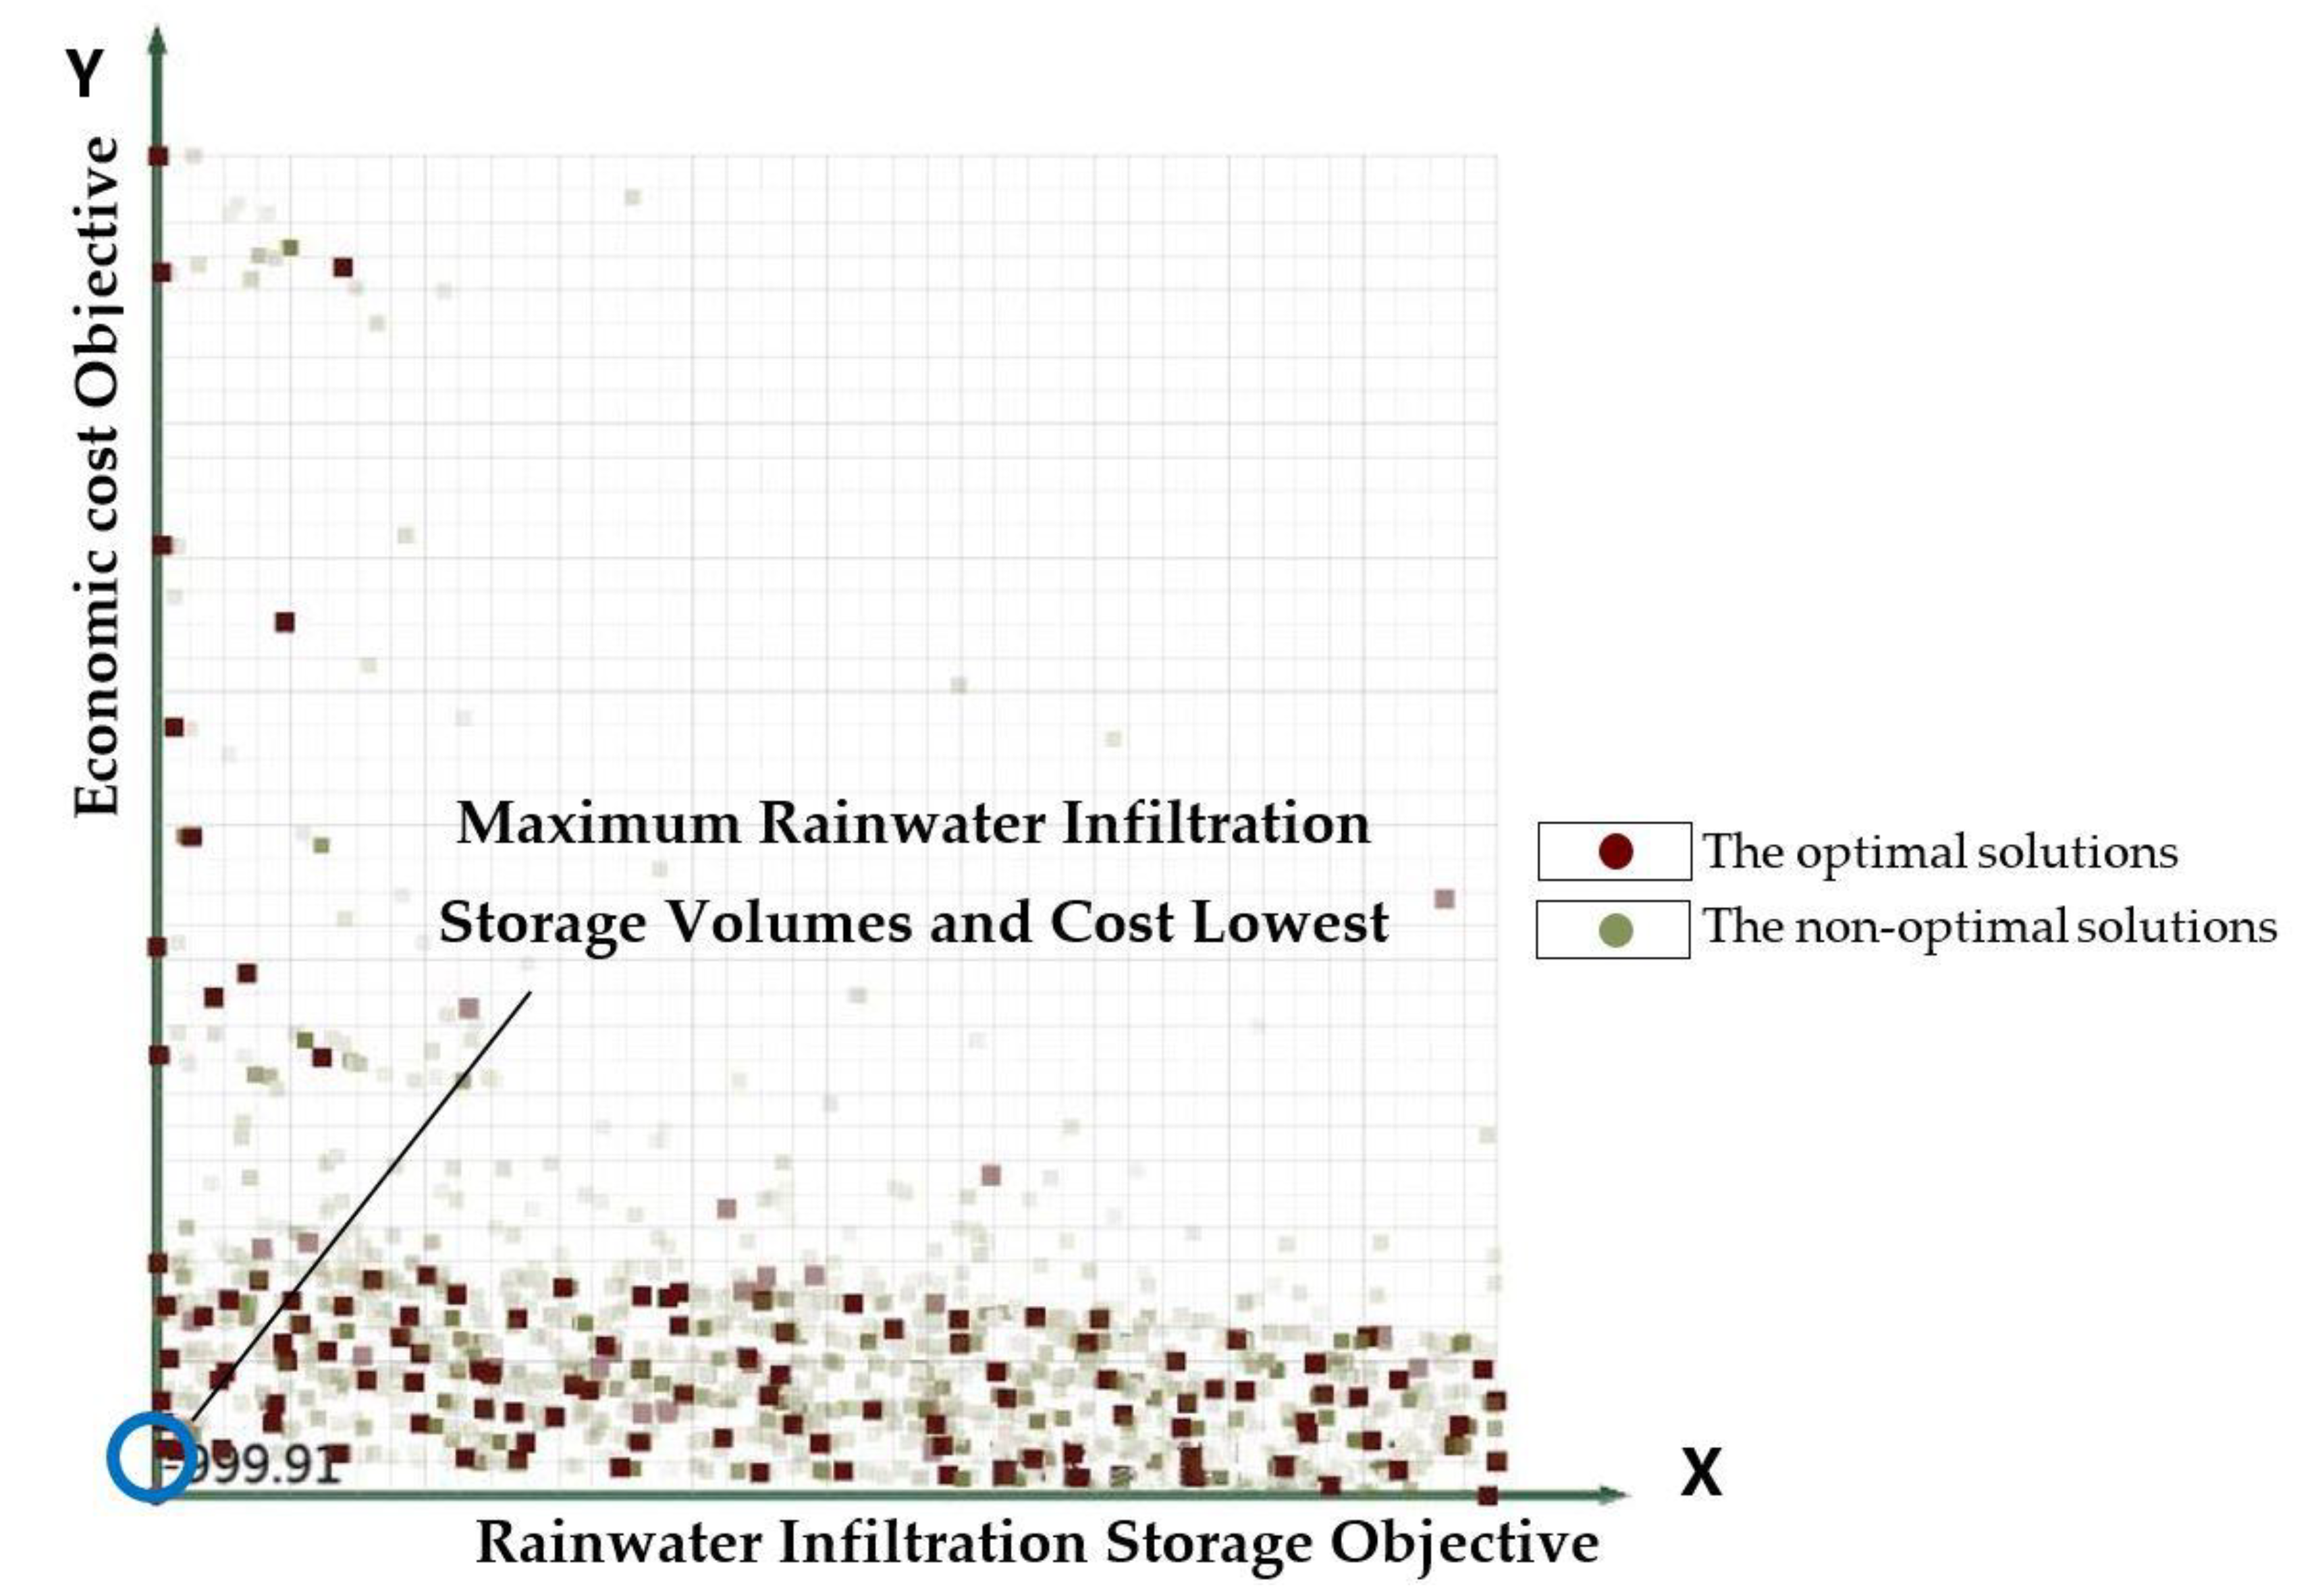
4.3.1. Optimal Solution for Rainwater Infiltration, Storage and Economic Objectives
In the spatial distribution of the Pareto optimal solution set, the green X-axis represents the infiltration capacity of the combination of sponge facilities, and the closer the value is to the origin, the better the infiltration capacity of the combination of facilities. The green Y-axis is the economic cost of the combination of facilities, the closer to the origin the lower the economic cost of the combination of facilities. As shown in Figure 9, the value with the strongest rainwater infiltration capacity and the lowest economic cost is the optimal set of blue circles in the bottom left corner, with a rainwater infiltration capacity of 998 m3 and an economic cost of 52,440 yuan.
4.3.2. Optimal Solution for Runoff Pollution Control and Economic Objectives
In the spatial distribution of the Pareto optimal solution set, the green X-axis represents the pollution control capacity of the combination of facilities, and the Y-axis represents the economic cost level, the higher the runoff pollution control capacity of the combination of facilities, the closer the X-axis numerical optimal solution is to the position of the origin, as shown in Figure 10, the blue circle in the upper left corner is the optimal target parameter value for runoff pollution control, which corresponds to a runoff pollution treatment capacity of 6345 t. The value of the model variable when the runoff pollution control objective is optimal as shown is Table 7.
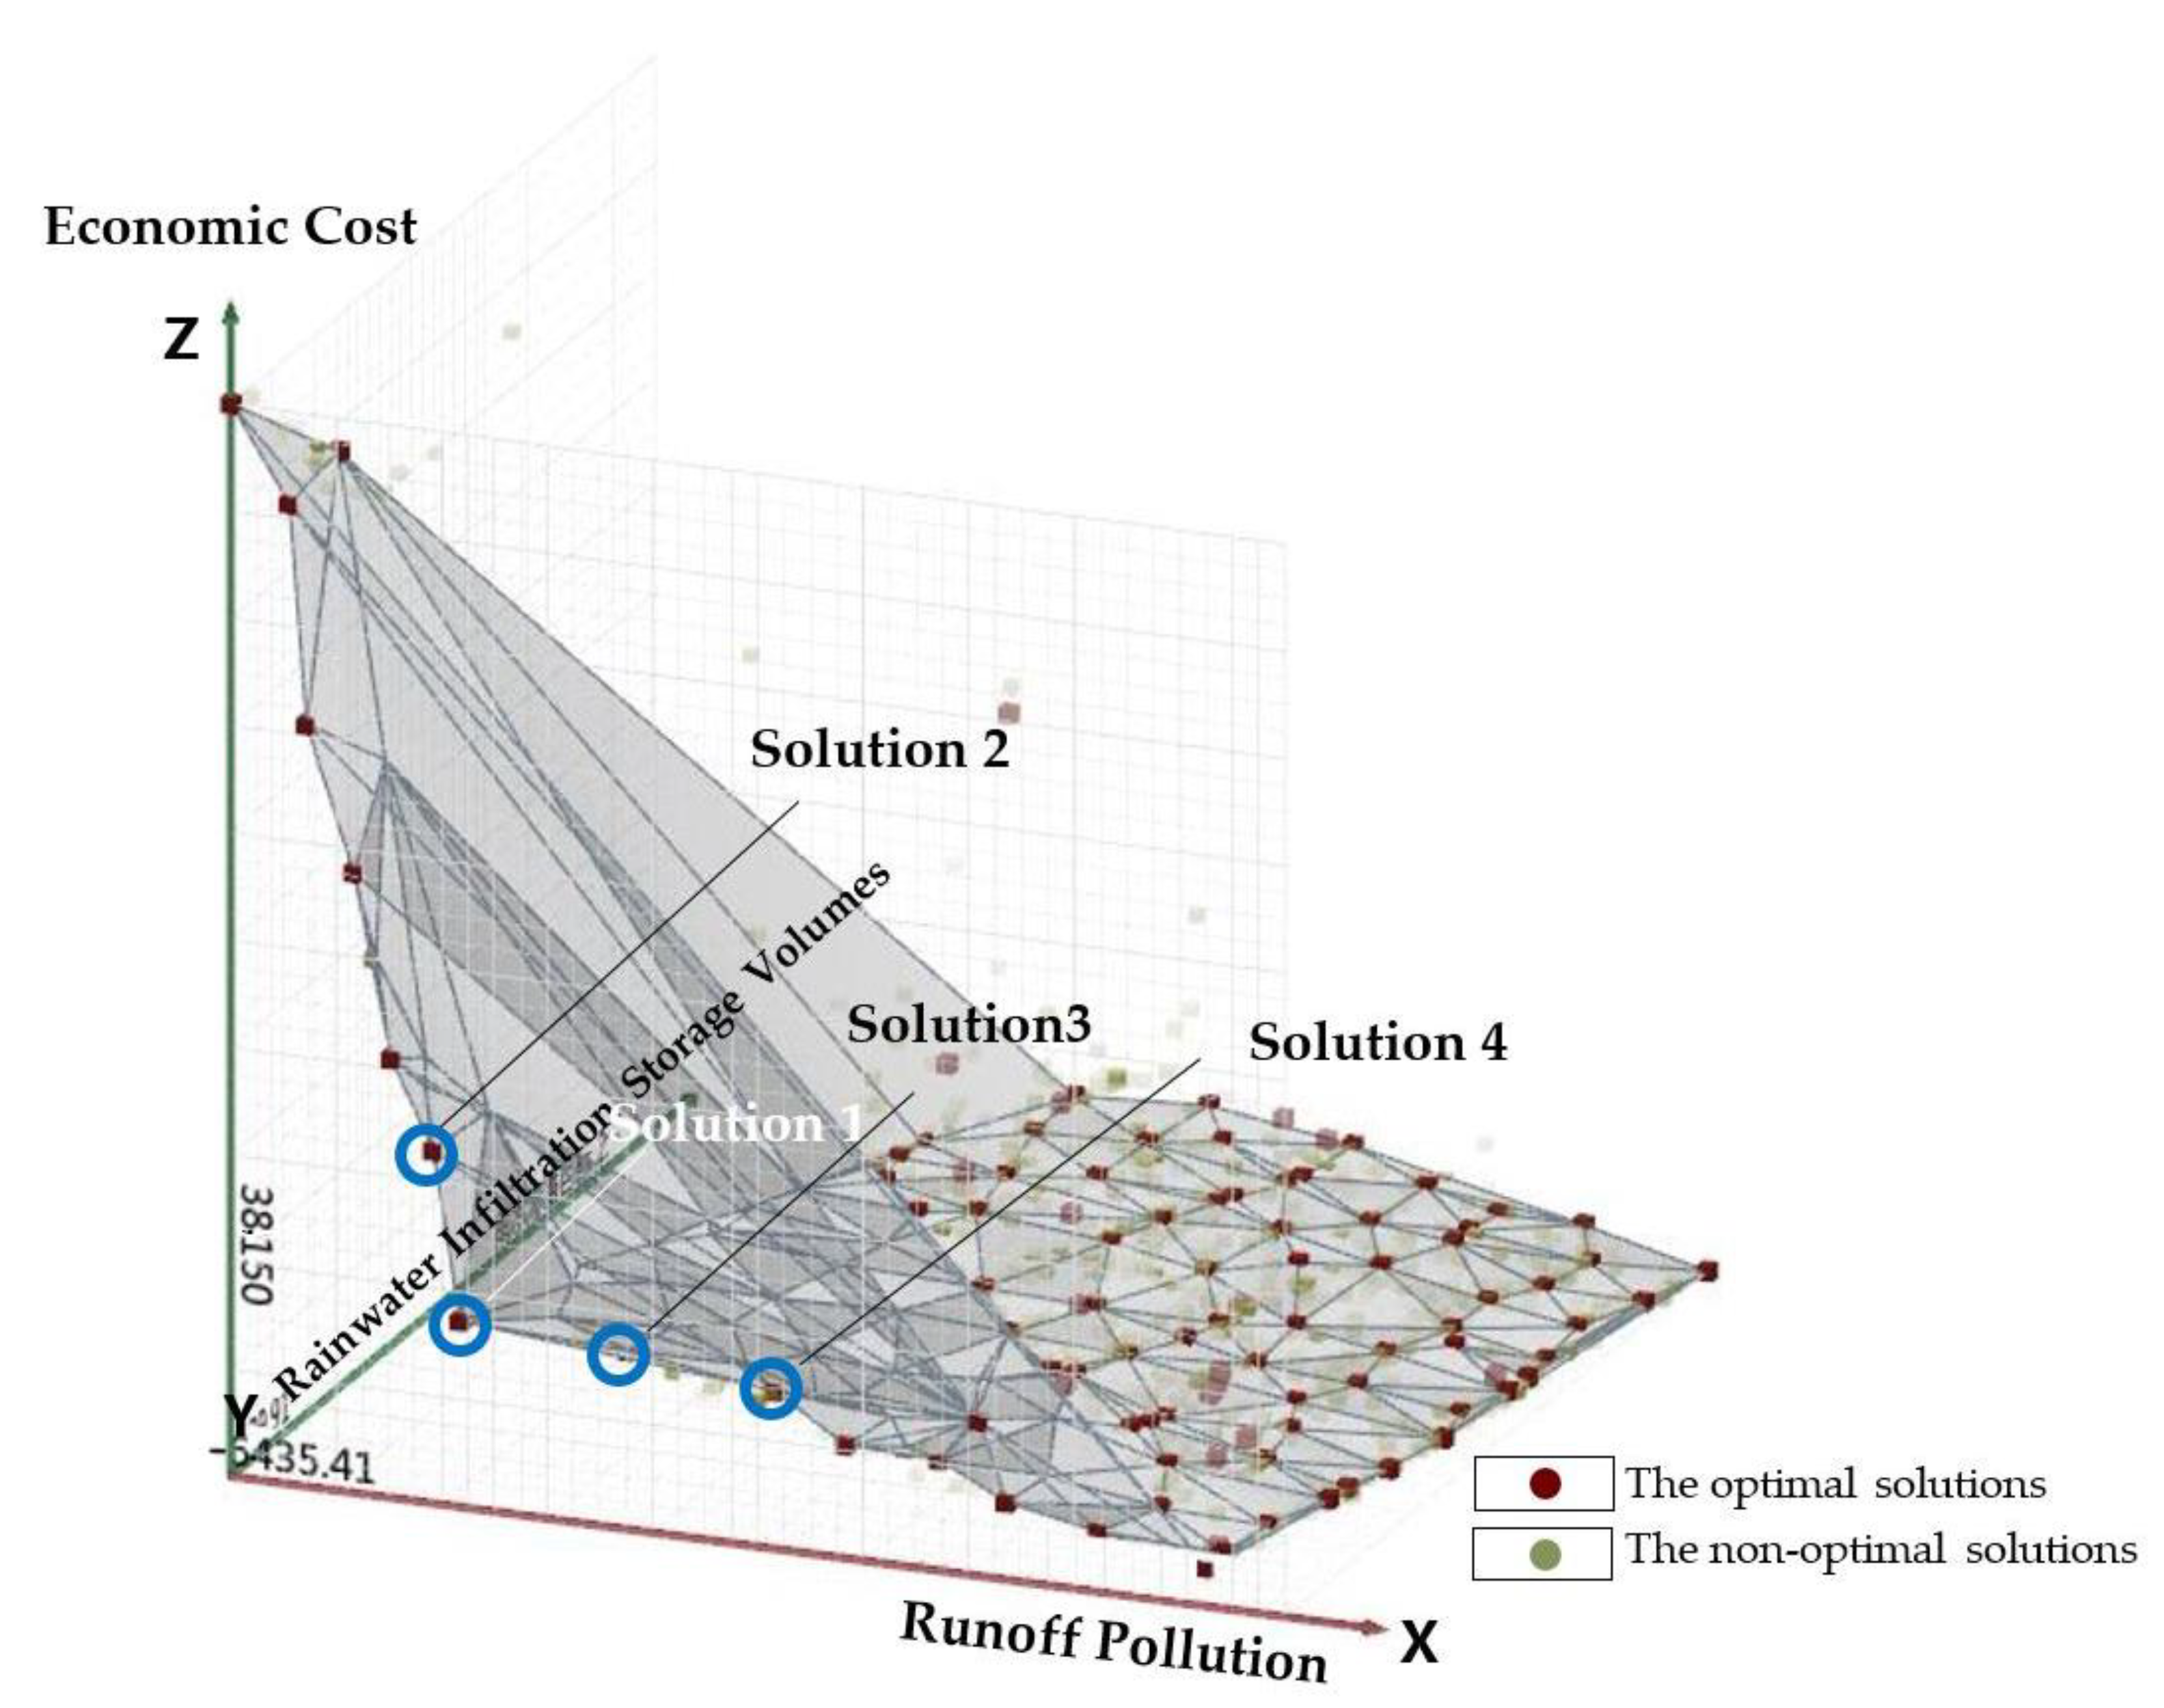
4.3.3. Optimal Solution for All Objectives
As can be seen from Figure 11, the Pareto solution set for each objective should be as close as possible to the origin of the coordinates and located at the outer convex position of the solution set set surface. The selection of the integrated optimal value takes into account the factors of rainwater infiltration and storage, pollution control and cost, and compromises between the optimal values. 4 combinations of sponge facilities are selected from the three-objective Pareto optimal solution set as the optimal solution alternatives (Table 8). We offer four sets of optimal decision options and the final decision should be made by the designer, project implementer and stakeholders. Of the four solutions, solution 2 can be chosen if the best infiltration, storage and decontamination performance is considered, and solution 4 can be chosen if the lowest economic cost is desired.
4.3.4. Target Interval Selection and Priority for Specific Facility Types
There are also special cases in the selection process of sponge facilities, where application scenarios may require the selection of a combination of options within a certain target range, for example the selection of a combination of facilities within a certain price range. In addition to this, decision makers often require a single type of facility to be selected as the main facility, for example a demonstration area with a green roof. In this case, the combination solution can be selected from the set of Pareto solutions derived from arithmetic, the optimal solution for all facility combinations can be derived as a data table, a target-variable correspondence can be established, and then the number of facility combinations corresponding to a certain target interval value or a certain type of facility quantity dominated by conditional statements can be selected.
In this case, a total of 61,920 sets of optimal solutions were generated, corresponding to a total of 371,520 facility area parameters. See Table 9 for a schematic representation of facility combinations dominated by a single type of facility.
5. Discussion
After calculation, a total of 186,754 combinations of sponge facilities were obtained for the study case. This solution space provides designers with a rich choice of sponge facility combinations, allowing them to flexibly select sponge facility combinations according to the site water environment problems to be solved and the design objectives.
Although good computational results were obtained with the SPEA-2 algorithm via the Octopus plug-in, the accuracy of the data results and the applicability of the software tool are issues that deserve further research and discussion. Therefore, in this study, the NSGA-II algorithm was selected for the comparative validation of the multi-objective combinatorial optimization model for sponge facilities, and the choice of software tools was also discussed.
5.1. Comparison of Algorithms
In the case of consistent objective functions and constraints, the NSGA-II algorithm of MATLAB software was used to solve the case study model, and from the spatial analysis of the final obtained solution set distribution, the rainwater infiltration storage objective frontier solution set range was between 757–1000 m3, the runoff pollution control objective function frontier solution set range was distributed between 3155–5028 t, and the economic cost The target solution set is distributed between RMB 216,430 and RMB 276,219. Four integrated optimal solutions were selected from the relevant solution sets, and the calculation results of each solution and the corresponding A1-A6 variables are detailed in Table 10.
The results obtained based on the NSGA-II algorithm are compared with the optimization results of the SPEA-2 algorithm. In terms of the number of optimal solution sets, both algorithms obtain a rich set of Pareto front solutions, which can provide a rich choice of sponge facility type combinations for site scale sponge system design decisions; in terms of the optimization objective values obtained, both optimization algorithms obtain optimal solution sets within the constraint range for the rainwater infiltration and storage objective; in terms of the pollution control objective the SPEA-2 algorithm obtained results in the range of 3500–5500 t, while the NSGA-II algorithm obtained target calculated values in the range of 3155–5028 t, from the total obtained optimal target value analysis, the SPEA-2 algorithm obtained target optimal value than NSGA-II to about 10% higher; economic cost objectives SPEA-2 algorithm obtained optimal value solution set distribution in the range of 90,000–360,000 yuan. The Pareto front solution obtained by SPEA-2 is also superior to the NSGA-II algorithm. Due to the stochastic nature of the genetic algorithm, the results obtained by the author for the NSGA-II algorithm after several operations are still relatively close to the final values of the study, and the results are basically representative of the algorithm’s ability to solve the multi-objective combination model for sponge facilities.
By comparing the two algorithms, the objective optimal values obtained by the two algorithms are generally close to each other, and the distribution characteristics of the number of different types of sponge facilities corresponding to the same objective values are also more consistent, and both algorithms can meet the needs of sponge city design well. However, the SPEA-2 algorithm achieves better results than the NSGA-II algorithm for the multi-objective combination of sponge facilities.
5.2. Selecting Software Tools
The study used two optimization algorithms with different software tools, Grasshopper and MATLAB with different characteristics.
(1) Octopus is a multi-objective optimization plug-in based on the Grasshopper parametric design platform, and its interface is more user-friendly and easier for urban planners to get used to. Whereas mathematical software like MATLAB mostly requires the user to have programming skills and the learning time cost will be higher.
(2) In terms of data visualization, Octopus provides a more convenient way to visualize the process and result data, while MATLAB-based optimization algorithms can often only obtain images and data of the final optimal solution, which is more cumbersome than grasshopper for recording and visualizing historical data of the evolutionary process.
5.3. Comparison with Related Research
We compared this study with related studies on the application of multi-objective optimisation models in sponge cities in recent years, and the differences between this research work and other studies in terms of research objectives, scale, methodology and tools can be clearly seen. Meanwhile, we illustrate the highlights of relevant research. Please see Table 11 for more details. The relevant study also provides a good reference for our future research works.
Meanwhile, this study also has some limitations, for example: (1) In the selection of design variables for the model, we have selected only six typical types of sponge facilities, other than that other types of sponge facilities are not involved. (2) We did not consider additional social influences, such as landscape aesthetics and social behavioural preferences, in our objective setting. (3) The analysis of application scenarios for selecting the best solution and optimal solution for the model can be further extended.
6. Conclusions
This study focuses on the combination of typical sponge facility areas and types at the urban block scale to achieve optimal stormwater management performance and economic benefits for different site conditions and sponge system objectives, provided that the sponge system scale is determined. Six typical sponge facilities were selected for multi-objective optimization modelling and applied in practice with a case study located in Nanjing, China. By comparing the SPEA-2 and NSGA-II algorithms, both algorithms can meet the computational requirements of sponge city planning and design, but from the experimental results, it is observed that the SPEA-2 algorithm is superior for the application of multi-objective optimisation combination models for sponge facilities.The mathematical models, software tools and empirical cases involved in this study can provide references for sponge city practice and research.
In further research, more types of sponge facilities can be selected as design variables, and a corresponding multi-objective optimisation model database for sponge facilities can be established to further expand its scope of application. In terms of model application scenarios, two types of application scenarios can be categorised, one for completed urban areas and the other for new urban areas in the future; at the same time, the multi-objective optimisation algorithm can be coupled with the urban hydrological model to achieve more complex and refined optimisation results.
Author Contributions
Conceptualization, M.X. and Y.C.; methodology, M.X.; software, M.X.; validation, M.X.; formal analysis, M.X.; investigation, M.X.; resources, Y.C.; data curation, Y.C.; writing—original draft preparation, M.X.; writing—review and editing, M.X.; visualization, M.X.; supervision, Y.C. and Z.D.; project administration, Y.C.; funding acquisition, Y.C. All authors have read and agreed to the published version of the manuscript.
Funding
This research was funded by National Natural Science Foundation of China, grant number 51838003 and the Fundamental Research Funds for the Central Universities, grant number B220201015.
Data Availability Statement
Not applicable.
Conflicts of Interest
The authors declare no conflict of interest.
Appendix A

Table A1.
Constants implications of multi-objective optimal combination models for sponge facilities.
Table A1.
Constants implications of multi-objective optimal combination models for sponge facilities.
| Scheme | Constants | Description of Constants | Unit |
|---|---|---|---|
| 1 | s | Infiltration storage capacity per unit area of facility | m3 |
| 3 | r | Water collected per unit area of facility | m3 |
| 4 | p | Runoff pollution removal per unit area of facility | t |
| 5 | e | Facility cost per unit area of facility | Yuan/m2 |
Table A2.
Reference infiltration coefficients for different soil types [39].
Table A2.
Reference infiltration coefficients for different soil types [39].
| Materials | Grain Size (mm) | Weight (%) | Permeability Coefficient K (m/s) |
|---|---|---|---|
| Clay | - | - | <5.7 × 10⁻⁸ |
| Silty clay | - | - | 5.7 × 10⁻⁸ ~ 1.16 × 10⁻⁶ |
| Powdered soil | - | - | 1.16 × 10⁻⁶ ~ 5.79 × 10⁻⁶ |
| Silt | >0.075 | >50 | 5.79 × 10⁻⁶ ~ 1.16 × 10⁻⁵ |
| Fine sandy clay | >0.075 | >85 | 1.16 × 10⁻⁵ ~ 5.79 × 10⁻⁵ |
| Medium sand | >0.25 | >50 | 5.79 × 10⁻⁵ ~ 2.31 × 10⁻⁴ |
| Homogenised medium sand | - | - | 4.05 × 10⁻⁴ ~ 5.79 × 10⁻⁴ |
| Coarse sand | >0.50 | >50 | 2.31 × 10⁻⁴ ~ 5.79 × 10⁻⁴ |
| Round gravel | >2.00 | >50 | 5.79 × 10⁻⁴ ~ 1.16 × 10⁻³ |
| Pebbles | >20.0 | >50 | 1.16 × 10⁻³ ~ 5.79 × 10⁻³ |
| Slightly fractured rock | - | - | 2.31 × 10⁻⁴ ~ 6.94 × 10⁻⁴ |
| Rocks with many fissures | - | - | >6.94 × 10⁻⁴ |
Table A3.
Porosity reference for different soil types.
| Type of Soil | K (mm/h) | ψ (mm) | Φ (Fractions) | FC (Fractions) | WP (Fractions) |
|---|---|---|---|---|---|
| Sandy Soil | 120.4 | 4.9022 | 0.437 | 0.062 | 0.024 |
| Loamy Sandy Soil | 29.972 | 6.096 | 0.437 | 0.105 | 0.047 |
| Sandy Loamy Soil | 10.922 | 10.9982 | 0.453 | 0.190 | 0.085 |
| Loamy Soil | 3.302 | 8.89 | 0.463 | 0.232 | 0.116 |
| Silty Loamy Soil | 6.604 | 16.9926 | 0.501 | 0.284 | 0.135 |
| Sandy Clay Loam Soil | 1.524 | 21.9964 | 0.398 | 0.244 | 0.136 |
| Clay Loamy Soil | 1.016 | 21.0058 | 0.464 | 0.310 | 0.187 |
| Chalky Clay Loam Soil | 1.016 | 27.0002 | 0.471 | 0.342 | 0.210 |
| Sandy Clay Soil | 0.508 | 24.003 | 0.430 | 0.321 | 0.221 |
| Chalky Clay Soil | 0.508 | 29.0068 | 0.479 | 0.371 | 0.251 |
| Clay Soil | 0.254 | 32.004 | 0.475 | 0.378 | 0.265 |
* K is saturated hydraulic conductivity, mm/h, ψ is flat suction head, mm, φ is porosity, fraction, FC is water yield capacity, fraction, WP is withering point, fraction [40].
Table A4.
Reference for runoff pollution removal capacity of different sponge facilities.
| Name of coefficient | Horizontal green space | Horizontal Green Space with Water Storage Modules | Water-storing Sunken Green Space | Permeable Hard Surface | Designed Water Body for Water Storage | Green Roof |
|---|---|---|---|---|---|---|
| K | 65 | 85 | 60 | 85 | 0 | 75 |
| P | Annual average SS of stormwater runoff from urban areas | |||||
* K is the removal rate of SS from runoff by different sponge facilities (%), P is annual average SS of stormwater runoff from urban areas [41].
Table A5.
Reference unit cost for different types of sponge facilities.
| Serial Number | Types of Sponge Facilities | Rource of Values | Unit Area Cost (yuan/m2) | Notes |
|---|---|---|---|---|
| 1 | Horizontal green space | Technical Guide for Sponge City Construction | 30–50 | |
| 2 | Horizontal green space with water storage modules | Prices in Nanjing | 800–1200 | Depth of 0.8–1 m |
| 3 | Water-storing sunken green space | Technical Guide for Sponge City Construction | 40–50 | Average depth 100–200 mm |
| 4 | Permeable hard surface | Technical Guide for Sponge City Construction | 60–200 | |
| 5 | Designed water body for water storage | Prices in Nanjing | 80 | Average depth 1 m |
| 6 | Green roof | Technical Guide for Sponge City Construction | 100–300 |
References
- Yang, D.; Yang, Y.; Xia, J. Hydrological cycle and water resources in a changing world: A review. Geogr. Sustain. 2021, 2, 115–122. [Google Scholar] [CrossRef]
- Zhang, J.; Song, X.; Wang, G.; He, R.; Wang, X. Development and challenges of urban hydrology in a changing environment: I: Hydrological response to urbanization. Adv. Water Sci. 2014, 25, 594–605. [Google Scholar]
- Liu, J.; Shao, W.; Xiang, C.; Mei, C.; Li, Z. Uncertainties of urban flood modeling: Influence of parameters for different underlying surfaces. Environ. Res. 2019, 182, 108929. [Google Scholar] [CrossRef] [PubMed]
- Cheng, Y.N.; Xie, M.K. Being both Opposite and Complementary: Urban Road Sponge System Practice Based on Digital Technology—Taking Nanjing Tianbao Street Ecological Road as the Example. Chin. Landscape Archit. 2017, 33, 5–13. [Google Scholar]
- Hamidi, A.; Ramavandi, B.; Sorial, G.A. Sponge City—An emerging concept in sustainable water resource management: A scientometric analysis. Resour. Environ. Sustain. 2021, 5, 100028. [Google Scholar] [CrossRef]
- Yin, D.; Xu, C.; Jia, H.; Yang, Y.; Sun, C.; Wang, Q.; Liu, S. Sponge City Practices in China: From Pilot Exploration to Systemic Demonstration. Water 2022, 14, 1531. [Google Scholar] [CrossRef]
- Gao, J.; Li, J.; Li, Y.; Xia, J.; Lv, P. A Distribution Optimization Method of Typical LID Facilities for Sponge City Construction. Ecohydrol. Hydrobiol. 2020, 21, 13–22. [Google Scholar] [CrossRef]
- Li, Q.; Wang, F.; Yu, Y.; Huang, Z.; Li, M.; Guan, Y. Comprehensive performance evaluation of LID practices for the sponge city construction: A case study in Guangxi, China. J. Environ. Manag. 2019, 231, 10–20. [Google Scholar] [CrossRef]
- Zhang, K.; Chui, T.F.M. A comprehensive review of spatial allocation of LID-BMP-GI practices: Strategies and optimization tools. Sci. Total Environ. 2017, 621, 915–929. [Google Scholar] [CrossRef]
- George’s County, Maryland Department of Environmental Resources Programs and Planning Division. Low Impact Development Design Strategies: An Integrated Design Approach; U.S. Environmental Protection Agency: Washington, DC, USA, 1999. [Google Scholar]
- Brown, R.A.; Line, D.E.; Hunt, W.F. LID Treatment Train: Pervious Concrete with Subsurface Storage in Series with Bioretention and Care with Seasonal High Water Tables. J. Environ. Eng. 2012, 138, 689–697. [Google Scholar] [CrossRef]
- Jia, H.; Wang, X.; Ti, C.; Zhai, Y.; Field, R.; Tafuri, A.N.; Cai, H.; Yu, S.L. Field monitoring of a LID-BMP treatment train system in China. Environ. Monit. Assess. 2015, 187, 373. [Google Scholar] [CrossRef] [PubMed]
- Xu, C.; Hong, J.; Jia, H.; Liang, S.; Xu, T. Life cycle environmental and economic assessment of a LID-BMP treatment train system: A case study in China. J. Clean. Prod. 2017, 149, 227–237. [Google Scholar] [CrossRef]
- Lee, J.G.; Selvakumar, A.; Alvi, K.; Riverson, J.; Zhen, J.X.; Shoemaker, L.; Lai, F.-H. A watershed-scale design optimization model for stormwater best management practices. Environ. Modell. Software 2012, 37, 6–18. [Google Scholar] [CrossRef]
- Xu, T.; Jia, H.; Wang, Z.; Mao, X.; Xu, C. SWMM-based methodology for block-scale LID-BMPs planning based on site-scale multi-objective optimization: A case study in Tianjin. Front. Environ. Sci. Eng. 2017, 11, 48–59. [Google Scholar] [CrossRef]
- Zhang, Z.; Gu, J.; Zhang, G.; Ma, W.; Zhao, L.; Ning, P.; Shen, J. Design of urban runoff pollution control based on the Sponge City concept in a large-scale high-plateau mountainous watershed: A case study in Yunnan, China. J. Water Clim. Chang. 2021, 12, 201–222. [Google Scholar] [CrossRef] [Green Version]
- Jiang, C.; Li, J.; Gao, J.; Lv, P.; Yao, Y.; Li, H. Advances in research of optimal rainwater infrastructure configuration in sponge city construction. J. Hydroelectr. Eng. 2021, 40, 19–29. [Google Scholar]
- Sun, H.; Li, L.; Tian, Y.; Zhang, T.; Zuo, W.; Cai, G.; Zhang, F. Sponge city planning and design based on multi-objective optimization and comprehensive evaluation. Acta Sci. Circumstantiae. 2020, 40, 3605–3614. [Google Scholar]
- She, L.; Wei, M.; You, X.-Y. Multi-objective Layout Optimization for Sponge City by Annealing Algorithm and Its Environmental Benefits Analysis. Sustain. Cities Soc. 2021, 66, 102706. [Google Scholar] [CrossRef]
- Hou, J.; Zhu, M.; Wang, Y.; Sun, S. Optimal spatial priority scheme of urban LID-BMPs under different investment periods. Landsc. Urban Plan. 2020, 202, 103858. [Google Scholar] [CrossRef]
- Liu, Z.; Xu, C.; Xu, T.; Jia, H.; Zhang, X.; Chen, Z.; Yin, D. Integrating socioecological indexes in multiobjective intelligent optimization of green-grey coupled infrastructures. Resour. Conserv. Recycl. 2021, 174, 105801. [Google Scholar] [CrossRef]
- Yu, Y.; Zhou, Y.; Guo, Z.; van Duin, B.; Zhang, W. A new LID spatial allocation optimization system at neighborhood scale: Integrated SWMM with PICEA-g using MATLAB as the platform. Sci. Total Environ. 2022, 831, 154843. [Google Scholar] [CrossRef] [PubMed]
- Zhang, G.; Hamlett, J.M.; Reed, P.; Yong, T. Multi-Objective Optimization of Low Impact Development Designs in an Urbanizing Watershed. Open J. Optim. 2013, 2, 95–108. [Google Scholar] [CrossRef] [Green Version]
- Mytilinou, V.; Kolios, A.J. A multi-objective optimization approach applied to offshore wind farm location selection. J. Ocean Eng. Mar. Energy 2017, 3, 265–284. [Google Scholar] [CrossRef] [Green Version]
- Branke, J.; Deb, K.; Miettinen, K.; Sowiński, R. Multiobjective Optimization: Interactive and Evolutionary Approaches; Branke, J., Ed.; Springer: Berlin, Germany, 2008. [Google Scholar] [CrossRef]
- Deb, K. Multi-Objective Optimization Using Evolutionary Algorithms; Ross, S., Weber, R., Eds.; John Wiley & Sons: New York, NY, USA, 2001; p. 15. [Google Scholar]
- Beijing University of Civil Engineering and Architecture. Technical Guide for Sponge City Construction; The Ministry of Housing and Urban-Rural Development; China Architecture & Building Press: Beijing, China, 2015; pp. 49–53. [Google Scholar]
- Eiben, A.E.; Smith, J.E. Multiobjective Evolutionary Algorithms. In Introduction to Evolutionary Computing; Natural Computing Series; Springer: Berlin, Germany, 2015. [Google Scholar] [CrossRef]
- Deb, K.; Pratap, A.; Agarwal, S.; Meyarivan, T.A.M.T. A fast and elitist multiobjective genetic algorithm: NSGA-II. IEEE Trans. Evol. Comput. 2002, 6, 182–197. [Google Scholar] [CrossRef] [Green Version]
- Zitzler, E.; Laumanns, M.; Thiele, L. SPEA2: Improving the strength pareto evolutionary algorithm. Tech. Rep. Gloriastrasse. 2001, 103, 95–100. [Google Scholar]
- Roudsari, M.S.; Pak, M. Ladybug: A parametric environmental plugin for grasshopper to help designers create an environmentally-conscious design. In Proceedings of the BS 2013: 13th Conference of the International Building Performance Simulation Association, Chambéry, France, 26–28 August 2013. [Google Scholar]
- Shan, R. In Integrating Genetic Algorithm with Rhinoceros and Grasshopper in Whole Building Energy Simulation. In Proceedings of the Grand Renewable Energy 2014, Tokyo, Japan, 27 July–1 August 2014. [Google Scholar]
- Shi, X.; Yang, W. Performance-driven architectural design and optimization technique from a perspective of architects. Autom. Constr. 2013, 32, 125–135. [Google Scholar] [CrossRef]
- Cubukcuoglu, C.; Nourian, P.; Sariyildiz, S.; Tasgetiren, M.F. A discrete event simulation procedure for validating programs of requirements: The case of hospital space planning. SoftwareX 2020, 12, 100539. [Google Scholar] [CrossRef]
- Bahdad, A.A.S.; Fadzil, S.F.S.; Onubi, H.O.; BenLasod, S.A. Sensitivity analysis linked to multi-objective optimization for adjustments of light-shelves design parameters in response to visual comfort and thermal energy performance. J. Build. Eng. 2021, 44, 102996. [Google Scholar] [CrossRef]
- Lakhdari, K.; Sriti, L.; Painter, B. Parametric optimization of daylight, thermal and energy performance of middle school classrooms, case of hot and dry regions. Build. Environ. 2021, 204, 108173. [Google Scholar] [CrossRef]
- Toutou, A.; Fikry, M.; Mohamed, W. The parametric based optimization framework daylighting and energy performance in residential buildings in hot arid zone. Alexandria Eng. J. 2018, 57, 3595–3608. [Google Scholar] [CrossRef]
- Liu, Z.; Yang, Y.; Hou, J.; Jia, H. Decision-Making Framework for GI Layout Considering Site Suitability and Weighted Multi-Function Effectiveness: A Case Study in Beijing Sub-Center. Water 2022, 14, 1765. [Google Scholar] [CrossRef]
- Ministry of Housing and Urban-Rural Construction of the People’s Republic of China; General Administration of Quality Supervision, Inspection and Quarantine of the People’s Republic of China. Technical Code for Rainwater Management and Utilization of Building and Sub-District, 1st ed.; China Architecture & Building Press: Beijing, China, 2017; pp. 8–9. [Google Scholar]
- Rawls, W.J.; Brakensiek, D.L.; Miller, N. Green-ampt Infiltration Parameters from Soils Data. J. Hyd. Engr. 1983, 109, 62–70. [Google Scholar] [CrossRef]
- Ministry of Housing and Urban-Rural Construction of the People’s Republic of China. Technical Guide for Sponge City Construction: Technical Guide for Sponge City Construction, 1st ed.; China Architecture & Building Press: Beijing, China, 2014; p. 46. [Google Scholar]
Figure 1.
A logical framework for a multi-objective optimization model of sponge facilities combination.
Figure 1.
A logical framework for a multi-objective optimization model of sponge facilities combination.

Figure 2.
(a) Location of Nanjing in China, Source: Ministry of Natural Resources of China; (b) Location of Shangfang District in Nanjing; (c) Location of the study area in the Shangfang District; (d) Satellite image of the study area, Source: Google Maps 2018-10.
Figure 2.
(a) Location of Nanjing in China, Source: Ministry of Natural Resources of China; (b) Location of Shangfang District in Nanjing; (c) Location of the study area in the Shangfang District; (d) Satellite image of the study area, Source: Google Maps 2018-10.

Figure 3.
Connection and illustration of the Grasshopper operator for multi-objective combinatorial optimization of sponge facilities.
Figure 3.
Connection and illustration of the Grasshopper operator for multi-objective combinatorial optimization of sponge facilities.

Figure 4.
Evolutionary process of maxima in Pareto-optimal solutions for rainwater infiltration and storage objectives.
Figure 4.
Evolutionary process of maxima in Pareto-optimal solutions for rainwater infiltration and storage objectives.

Figure 5.
Evolutionary process of maxima in the Pareto-optimal solution of pollution control objectives.
Figure 5.
Evolutionary process of maxima in the Pareto-optimal solution of pollution control objectives.

Figure 6.
Minimal value evolutionary process in the Pareto optimal solution of economic cost objectives.
Figure 6.
Minimal value evolutionary process in the Pareto optimal solution of economic cost objectives.

Figure 7.
Spatial distribution of multi-objective optimal solutions for rainwater infiltration, runoff pollution control, economy and cost of sponge facilities.
Figure 7.
Spatial distribution of multi-objective optimal solutions for rainwater infiltration, runoff pollution control, economy and cost of sponge facilities.

Figure 8.
(a) Pareto front distribution of runoff pollution control (x-axis) and economic cost (y-axis); (b) Pareto front distribution of rainwater infiltration and storage (x-axis) and economic cost (y-axis); (c) Pareto front distribution of runoff pollution control (x-axis) and rainwater infiltration and storage (y-axis).

Figure 9.
Rainwater infiltration and storage and economic objective are both optimal.

Figure 10.
Optimal parameters for runoff pollution control.

Figure 11.
Optimal parameters for all objectives.

Table 1.
Components of a multi-objective optimization model.
| Elements of the Model | Description |
|---|---|
| Decision variables | Constructing a choice of options for describing the characteristics of a system (process) in a mathematical model, where each different set of values taken for the design variables corresponds to a solution value for the problem. |
| Constants | Known constants to be considered in model construction. |
| Objectives | A function constructed according to the objective problem to be solved, usually requiring a maximum or minimum value. |
| Constraints | Constraints that need to be met to establish decision variables. |
Table 2.
Description of the characteristics of 6 types of typical sponge facilities.
| S/N | Name | Description | Section Illustration |
|---|---|---|---|
| 1 | Horizontal Green Space Without Water Storage Modules | Low cost, low infiltration and runoff pollution control, low stormwater storage capacity |  |
| 2 | Horizontal Green Space With Water Storage Modules | Infiltration and runoff pollution control advantages of horizontal green space, but space saving, high rainwater harvesting efficiency and high cost |  |
| 3 | Sunken Green Space | Low cost with a certain volume of water storage and pollution control function for rainwater runoff, but the actual storage volume is insufficient |  |
| 4 | Permeable Hard Surface | Effective stormwater infiltration and runoff pollution control, insufficient stormwater storage capacity and high costs. |  |
| 5 | Green Roof | Only be used on building roofs, with less scope for application and higher costs. |  |
| 6 | Designed Water Body | High rainwater storage capacity, low pollution control and low cost of construction. |  |
Table 3.
Composition of variables for a multi-objective optimization model for sponge facilities combination.
Table 3.
Composition of variables for a multi-objective optimization model for sponge facilities combination.
| Serial Number | Design Variable Symbol | Description | Unit |
|---|---|---|---|
| 1 | A1 | Area of horizontal green space | m2 |
| 2 | A2 | Area of horizontal green space with water storage modules | m2 |
| 3 | A3 | Area of water-storing sunken green space | m2 |
| 4 | A4 | Area of permeable hard surface | m2 |
| 5 | A5 | Area of designed water body for water storage | m2 |
| 6 | A6 | Area of green roof | m2 |
Table 4.
Statistics of the urban planning underlying surface classification of the study area.
| Serial Number | Underlying Surface Classification | Planning Indicators (m2) |
|---|---|---|
| 1 | Total site area | 377,133 |
| 2 | Area of building area | 41,260 |
| 3 | Area of road and open space | 229,343 |
| 4 | Area of green space | 106,530 |
| 5 | Area of water surface | 9600 |
Table 5.
Study area sponge city design scale and control requirements.
| Planning Control Index | Annual Runoff Control Rate (%) | Design Rainfall Amount (mm) | Surface Source Pollution Control Rate (%) | Rainfall Field Control Rate (%) | Design of Storage Volumes (m3) |
|---|---|---|---|---|---|
| Values | 79.52 | 29.7 | 55 | 87.3 | 750–1000 |
Table 6.
A list of elements for a multi-objective combined optimization model for sponge facilities in the study area.
Table 6.
A list of elements for a multi-objective combined optimization model for sponge facilities in the study area.
| Design Variables | A1: Area of horizontal green space | |||
| A2: Area of horizontal green space with water storage module | ||||
| A3: Area of water-storing sunken green space | ||||
| A4: Area of permeable hard surface | ||||
| A5: Area of designed water body for water storage | ||||
| A6: Area of green roof | ||||
| Objective Functions | Overall objective function | Sub-objectives | Formula | Description |
(Maximum sponge efficiency and lowest economic cost) | Rainwater infiltration and storage objective | Max (x) = n = 6 | The larger the rainwater infiltration storage capacity the better the objective | |
Runoff pollution control objective | = | The greater the runoff pollution removal capacity the better the objective. | ||
Economic objective | = | The lower the economic cost, the better the objective. | ||
| Constraints | Constraints of the total area | A1 + A2 + A3 + A4 + A5 + A6 ≤ 377,000 | ||
| Constraints of the site green space ratio | A1 + A2 + A3 ≤ 106,530 | |||
| Runoff Control Constraints for Sponge City Construction | 1.7248A1 + 2.764A2 + 2.39A3 + 1.89A4 + 0.34A5 + 1.344A6 ≥ 750 | |||
| Constraints of the hard surface area | A4 ≤ 229,343 | |||
| Constraints of the Site Building Density Rate | A6 ≤ 41,260 | |||
| Constraints of the Water Surface Rate | A5 ≤ 9600 | |||
| Optimization Algorithms | The Strength Pareto Evolutionary Algorithm-2 (SPEA-2) | |||
Table 7.
The value of the model variable when the runoff pollution control objective is optimal.
| Optimization Objective | Objective Values | Area of Sponge Facilities (m2) | |||||||
|---|---|---|---|---|---|---|---|---|---|
| Rainwater Infiltration and Storage Volumes (m3) | Runoff Pollution Control (t) | Economic Costs (yuan) | A1 | A2 | A3 | A4 | A5 | A6 | |
| Optimal runoff pollution control (regardless of economic factors) | 999 | 6435 | 453,730 | 2173 | 0 | 4 | 1938 | 2 | 6 |
| Optimal runoff pollution control and lowest economic cost | 995 | 5258 | 109,340 | 3579 | 0 | 1 | 1 | 0 | 33 |
Table 8.
The value of the model variable when the comprehensive objective is optimal.
| S/N | Facility Combination Solution | Area for Various Types of Facilities (m2) | Rainwater Infiltration and Storage Volumes (t) | Runoff Pollution Control (t) | Economic Costs (yuan) | |||||
|---|---|---|---|---|---|---|---|---|---|---|
| A1 | A2 | A3 | A4 | A5 | A6 | |||||
| 1 | Solution 1 | 3579 | 0 | 1 | 1 | 9 | 34 | 999 | 5260 | 110,110 |
| 2 | Solution 2 | 3243 | 1 | 1 | 365 | 11 | 46 | 999 | 5400 | 174,590 |
| 3 | Solution 3 | 2905 | 0 | 4 | 5 | 2 | 202 | 986 | 4517 | 98,890 |
| 4 | Solution 4 | 2131 | 0 | 2 | 43 | 10 | 405 | 991 | 3723 | 93,820 |
Table 9.
The value of design objective for the maximum area of a particular type.
| S/N | Facility Combination Solution | Area for Various Types of Facilities (m2) | Rainwater Infiltration and Storage Volumes (m3) | Runoff Pollution Control (t) | Economic Costs (yuan) | |||||
|---|---|---|---|---|---|---|---|---|---|---|
| A1 | A2 | A3 | A4 | A5 | A6 | |||||
| 1 | Maximum Area of A1 | 3632 | 0 | 19 | 2 | 2 | 13 | 999 | 5345 | 112,450 |
| 2 | Maximum Area of A2 | 209 | 439 | 345 | 719 | 138 | 165 | 999 | 5400 | 174,590 |
| 3 | Maximum Area of A3 | 1101 | 9 | 1330 | 19 | 43 | 18 | 986 | 4208 | 209,770 |
| 4 | Maximum Area of A4 | 2131 | 0 | 2 | 43 | 10 | 405 | 991 | 3723 | 93,820 |
| 5 | Maximum Area of A5 | 809 | 10 | 708 | 100 | 858 | 105 | 999 | 4946 | 568,780 |
| 6 | Maximum Area of A6 | 3300 | 0 | 21 | 2 | 0 | 975 | 999 | 6400 | 450,570 |
Table 10.
A comprehensive optimal solution based on the NSGA-II algorithm.
| S/N | Facility Combination Solution | Area for Various Types of Facilities (m2) | Rainwater Infiltration and Storage Volumes (m3) | Runoff Pollution Control (t) | Economic Costs (yuan) | |||||
|---|---|---|---|---|---|---|---|---|---|---|
| A1 | A2 | A3 | A4 | A5 | A6 | |||||
| 1 | Solution 1 | 2197 | 0 | 241 | 1 | 399 | 15 | 858 | 3678 | 127,712 |
| 2 | Solution 2 | 2261 | 1 | 233 | 754 | 336 | 3 | 999 | 5011 | 275,823 |
| 3 | Solution 3 | 2259 | 1 | 204 | 237 | 459 | 4 | 917 | 4083 | 177,862 |
| 4 | Solution 4 | 2203 | 1 | 175 | 22 | 636 | 8 | 907 | 3590 | 143,711 |
Table 11.
Comparison of this study with related research.
| References | Objectives | Scale | Methodology | Tools | Highlights |
|---|---|---|---|---|---|
| Te Xu, Haifeng Jia et al. (2017) [15] | LID-BMPs planning, LID-BMP chain layout optimization | Block-scale, site-scale | Multi-objective optimization | SWMM-based methodology, NSGA-II algorithm | Coupling MOEA to SWMM and LID-BMP chain layout, optimization was combined with block-scale scenario analysis |
| Kun Zhang, Ting Fong May Chui (2018) [9] | selected, designed, and allocated for LID-BMP-GI | From site to catchment scale | Strategic planning cycle | Spatial allocation optimization tools (SAOTs) | Spatial allocation of LID-BMP-GI practices is illustrated. Strategic planning cycle |
| Yang Yu, Yongchao Zhou et al. (2022) [22] | LID spatial allocation optimization | Neighborhood scale | Integrated hydrological computing enginean with optimization algorithm | SWMM &MATLAB, PICEA-g algorithm | LID spatial allocation optimization couples SWMM & MATLAB, PICEA-g algorithm |
| Joong Gwang Lee, Ariamalar Selvakumar et al. (2012) [14] | SUSTAIN-based approach to optimising applications in BMPs | Watershed-scale | Optimization module | SUSTAIN, NSGA-II algorithm | Details of the SUSTAIN model |
| Zijing Liu, Haifeng Jia et al. (2022) [38] | Decision-making framework for GI layout | City scale | An adaptive GI layout decisionmaking System | Arcgis | Considering Site Suitability and Weighted Multi-Function Effectiveness: |
| Jingwei Hou, Moyan Zhu et al. (2020) [20] | Optimal spatial priority scheme of urban LID-BMPs | City scale | Multi-objective model | ArcMap, ADEA (Adaptive differential evolution algorithm) | Includes different investment periods |
| Zijing Liu, Changqing Xu et al. (2022) [21] | Multiobjective optimization of green-grey coupled infrastructures | Block-scale | Multiobjective evaluation framework, Intelligent optimization algorithm | SWMM NSGA-II algorithm | Integrating socioecological indexes, Grey-green infrastructure coupling |
| Our works | Sponge facilities combination | Block-scale | Multi-objective optimization | Octopus, Grasshopper, SPEA-2 | Six typical sponge facilities, Application of Grasshopper with SPEA-2 algorithm |
Publisher’s Note: MDPI stays neutral with regard to jurisdictional claims in published maps and institutional affiliations. |
© 2022 by the authors. Licensee MDPI, Basel, Switzerland. This article is an open access article distributed under the terms and conditions of the Creative Commons Attribution (CC BY) license (https://creativecommons.org/licenses/by/4.0/).
Share and Cite
MDPI and ACS Style
Xie, M.; Cheng, Y.; Dong, Z. Study on Multi-Objective Optimization of Sponge Facilities Combination at Urban Block Level: A Residential Complex Case Study in Nanjing, China. Water 2022, 14, 3292. https://doi.org/10.3390/w14203292
AMA Style
Xie M, Cheng Y, Dong Z. Study on Multi-Objective Optimization of Sponge Facilities Combination at Urban Block Level: A Residential Complex Case Study in Nanjing, China. Water. 2022; 14(20):3292. https://doi.org/10.3390/w14203292
Chicago/Turabian StyleXie, Mingkun, Yuning Cheng, and Zengchuan Dong. 2022. "Study on Multi-Objective Optimization of Sponge Facilities Combination at Urban Block Level: A Residential Complex Case Study in Nanjing, China" Water 14, no. 20: 3292. https://doi.org/10.3390/w14203292
Note that from the first issue of 2016, this journal uses article numbers instead of page numbers. See further details here.