


Adsorption Behavior of Nonylphenol on Polystyrene Microplastics and Their Cytotoxicity in Human Caco-2 Cells

State Key Laboratory of Food Science and Technology, China-Canada Joint Lab of Food Science and Technology (Nanchang), Key Laboratory of Bioactive Polysaccharides of Jiangxi Province, Nanchang University, 235 Nanjing East Road, Nanchang 330047, China
*
Author to whom correspondence should be addressed.
Water 2022, 14(20), 3288; https://doi.org/10.3390/w14203288
Submission received: 29 September 2022
/
Revised: 13 October 2022
/
Accepted: 14 October 2022
/
Published: 18 October 2022
(This article belongs to the Topic Microplastics Pollution)
Abstract
:As two environmental pollutants of great concern, polystyrene microplastics (PS-MPs) and nonylphenol (NP) often coexist in the environment and cause combined pollution. Batch adsorption experiments were carried out by varying parameters such as pH, the particle sizes of the PS-MPs, the initial concentration of NP, and metal ion content. The results showed that the particle size of the PS-MPs in the range tested (0.1, 1, 10, 50, and 100 μm) had a significant effect on their NP adsorption capacity. The NP adsorption process of the PS-MPs was best described by the pseudo-second-order kinetic model and the Langmuir isotherm model, while the intraparticle diffusion and Bangham models were also involved in determining the NP adsorption process of 0.1 μm PS-MPs. Both PS-MPs and NP significantly affected cell proliferation, which had been confirmed by reduced cell viability, a blocked cell cycle G1 phase, and elevated apoptosis by affecting the basic cell functions. Furthermore, the negative effects of 0.1 μm PS-MPs on cell proliferation and function were aggravated after the adsorption of NP. Further research on the potential health risks of PS-MPs combined with NP or other environmental contaminants is needed.
1. Introduction
The accumulation and fragmentation of plastic waste have always been the focus of environmental concerns. It is noted that trends in the accumulation rate of mega- and macro-plastic no longer uniformly increase, while the average size of plastic particles seems to decrease on a global scale. Microplastics, which are plastic fragments with diameters smaller than 5 mm, circulate in the system of the air/soil/ocean/living organisms and have been detected in aquatic organisms such as freshwater shrimp, seaweed laver, and edible fish [1,2,3]. The transmission and accumulation of microplastics in food chains make voluntary or involuntary ingestion almost inevitable. The detection rate of microplastics in human stool samples from Europe and Asia was 100%, and nine types of plastics were detected [4]. The potential health risk of environmentally released microplastics has become a topic of great concern.
Microplastics with particle sizes smaller than 150 μm are proven to pass through the intestinal mucosal barrier, accumulate in the intestine and other tissues, destroy the immune system, and cause inflammation and oxidative stress [5]. The accumulation of microplastics in the gills, liver, and gut of zebrafish was observed after seven days of exposure to 20 mg/L microplastics of 5 μm [6]. More specifically, some microplastics with smaller particle sizes passed through the blood-brain barrier, causing brain damage and behavioral disorder [7]. In addition, due to their high specific surface area and hydrophobic surface, microplastics can adsorb hydrophilic chemicals and act as significant vectors for pollutants [8]. After being exposed to 100 μg/L microplastics and organophosphorus flame retardants for up to 90 days, aggravated toxicity of organophosphorus flame retardants in mice were found [9]. Microplastics have been reported to change exposure routes, increase the accumulation and share the common toxic mechanisms of di-(2-ethylhexyl) phthalate (DEHP) in mice [10].
Nonylphenol (NP), a widely researched phenolic endocrine disruptor, originates principally from the degradation of nonylphenol ethoxylates and is mainly used in the production of surfactants, lubricating oil additives, and pesticide emulsifiers [11]. Many studies have proven that NP is harmful to the immune system, the nervous system, and the reproductive system [12,13]. Mice exposed to NP had reduced oocyte quality, where the cytoskeletal dynamics and mitochondrial function were affected, which further induced oxidative stress and apoptosis in mouse oocytes [14]. NP in the intestinal tract after oral administration destroyed the intestinal barrier. Studies have shown that NP changed the permeability of Caco-2 monolayer cells by inhibiting the expression of tight junction protein and increasing intestinal permeability [15].
As two environmental pollutants of great concern, microplastics and NP coexist in the ocean, sludge, and sediments [16,17]. However, studies into the adsorption, desorption, and combined effects of microplastics and NP are still rare. This article aimed to systematically investigate the adsorption and desorption process of NP from polystyrene microplastics (PS-MPs) with different particle sizes. The mechanism of adsorption was investigated using kinetics and the isotherm model. The desorption experiments of NP from PS-MPs under water or simulated warm-blooded body gastrointestinal environments were also studied and provided support for the analysis of the single and combined toxicity of NP and PS-MPs on human intestinal epithelial Caco-2 cells. These results can provide new insights into the potential health risks of PS-MPs combined with NP or other environmental contaminants in humans.
2. Materials and Methods
2.1. Materials and Chemicals
NP (analysis standard, CAS: 104-40-5, Aladdin Bio-Chem Technology, Shanghai, China) was dissolved in acetonitrile to prepare a stock solution and stored at 4 °C. PS-MPs with diameters of 0.1, 1, 10, 50, and 100 μm were bought from Dongguan Zhangmutou Company (Dongguan, China). After the removal of surfactants using ethanol and water alternately, PS-MPs were dried using vacuum freeze-drying and subjected to the adsorption testing. High glucose Dulbecco’s modified Eagles medium (DMEM), nonessential amino acid, 0.25% Trypsin-EDTA solution (without phenol red), and L-glutamine were all purchased from Solarbio Science & Technology Co., Ltd. (Beijing, China), while fetal bovine serum (FBS) was brought from Biological Industries (Karmiel, Israel). Cell counting Kit-8 assay kit (CCK-8) was purchased from Dojindo Chemical Technology Co., Ltd. (Shanghai, China).
2.2. Characterization of PS-MPs and Detection of NP
The surface morphology of the PS-MPs was investigated by cold field emission scanning electron microscope (SU8100, Hitachi, Japan); The surface area of the PS-MPs was evaluated by N2 adsorption-desorption using Brunauer-Emmett-Teller (JW-BK132F, JWGB Sci & Tech Ltd., Beijing, China). The surface functional groups of the PS-MPs were measured usin Fourier transform infrared spectroscopy (FTIR, Nicolet iS50, Thermo Fisher Scientific, Waltham, MA, USA) in the wavenumber range of 4000–400 cm−1 with KBr pellet.
Ultra-high performance liquid chromatography-fluorescence detector (excitation wavelength = 230 nm, emission wavelength = 310 nm) (Agilent technologies company, Santa Clara, CA, USA) was applied to the determination of NP [18,19], 10 μL of sample was loaded in Eclipse XDB-C18 column (5 μm, 4.6 × 150 mm, Agilent technologies company, Santa Clara, CA, USA), with 0.4 mL/min flow rate of acetonitrile: water (90:10) as mobile phase (isocratic elution). An external standard method was used for the construction of the peak area-concentration standard curve, and then the concentration of NP was calculated.
2.3. Adsorption and Desorption Experiments
An amount of 2 mg of PS-MPs with different particle sizes was mixed with 100 mL NP solution (4 mg/L and pH = 7). All samples were oscillated in a shaker at a temperature of 25 °C and at a constant speed of 150 r/min. Three samples were taken as parallel samples at each time point (0, 0.25, 0.5, 1, 2, 3, 6, 9, 12, 18, 24, 36, 48, 72 and 96 h). After centrifugation and filtration with a 0.22 μm PTFE filter membrane, the concentration of the residual NP in the filtrate was measured. The NP adsorption capacity of PS-MPs (qe) at equilibrium (t = 96 h) or a selected time (qt) were calculated, respectively, by Equations (1) and (2):
where C0, Ce, and Ct are the solution concentration of NP at initial, equilibrium (t = 96 h), and selected times t (h), respectively; V (mL) is the volume of solution and m (g) represents the weight of the PS-MPs.
The desorption behavior of NP on the PS-MPs in a water environment and the warm-blood body gastrointestinal environment were investigated. The simulated gastrointestinal fluid was an acid solution (pH = 2.8) with 15.5 mmol/L sodium taurocholate and 4 g/L of pepsin. The mixtures were then agitated in a constant temperature shaker at the intestinal temperature of 35 ± 2 °C and a speed of 100 r/min [20]. A total of 50 mL of water (3.5% sodium chloride in ultrapure water, pH 7.0) was used as the control for comparison with the gastrointestinal fluids for the desorption experiments, which occurred at a constant temperature of 25 ± 2 °C and speed of 150 r/min [21].
After 120 h of desorption. The amount of NP desorbed (qdt, mg/g) was calculated by Equation (3):
where qdt (mg/g) denoted the desorption capacity of the PS-MPs at the time t (h); Cd0 and Cdt are the concentration of NP in the solution at an initial and selected time t (h); Vd (L) was the volume of solution added, and md (g) was the total weight of the PS-MPs and adsorbed NP used for the desorption experiment.
NP desorption percentage (Adt, %) can be calculated based on Equation (4):
2.4. The Factors That Influence the Adsorption Behavior of NP on PS-MPs
Separate sets of experiments were conducted to investigate the effects of pH, metal ions, and the diameter of the PS-MPs on NP adsorption. The influence of pH was studied by adjusting the reaction solutions to different pH values (3, 5, 7, 9, and 11.0, adjusted with 1 mol/L HCl solution and NaOH solution) and the effects of the metal ions on adsorption were carried out in reaction solution containing 0.2 mol/L metal ions (Na+, Fe2+, Ca2+, and K+ respectively) until the equilibrium of the NP solutions (4 mg/L) and the 0.1 μm PS-MPs (20 μg/mL) was established. In addition to the normal influencing factors, the initial concentration of NP and the particles sizes of the PS-MPs are non-negligible effects. The influence of the initial concentration of NP was investigated by agitating the NP solution at a series of gradients (1, 4, 10, 20, 30, and 40 mg/L) with 20 μg/mL 0.1 μm PS-MPs at 25 °C for 96 h. The effect of the diameter of the PS-MPs on NP adsorption was carried out in NP solutions (4 mg/L) with 20 μg/mL PS-MPs, with different particle sizes (0.1, 1, 10, 50, and 100 μm) at 25 °C until the adsorption reached equilibrium.
2.5. Adsorption Kinetic and Isotherm Equations
The adsorption kinetics of NP in the solution via the PS-MPs with different particle sizes were studied in terms of four kinetic models: pseudo-first-order, pseudo-second-order, intra-particle diffusion, and Bangham model. Three adsorption isotherms models, including Langmuir, Freundlich, and Dubinin-Radushkevich (D-R) model, were also constructed and used to examine the adsorption mechanism and corresponding rate control step. The models mentioned here can be found in Appendix A Table A1.
2.6. Cell Culture
The Caco-2 (Cat NO.: CL-0050) cell lines were provided by Procell Life Science & Technology Co., Ltd. Wuhan, Hebei, China. They were cultured in DMEM high-sugar medium containing 18% fetal bovine serum, 1% L-glutamine, and non-essential amino acids and were grown under 5% CO2, 37 °C constant temperature culture conditions. When the cells grew to cover 80–90% of the bottom of the flask, they were digested with trypsin and passaged every three days.
Different particle sizes of PS-MPs (0.1, 1, 10, 50, and 100 μm) were dispersed in serum-free DMEM medium at a concentration of 500 mg/L; an NP solution with a concentration of 40 μmol/L, and PS-MPs synergistic with NP (1 h adsorption reaction product of 500 mg/L PS-MPs and 40 μmol/L NP) were added to the Caco-2 cells. Culture mediums without any contaminants were set as control groups.
2.7. Cytotoxicity Assays
2.7.1. Cell Viability
Cell viability was quantitatively evaluated using the Cell Counting Kit-8 (CCK-8). After 12 and 48 h of drug intervention, 10 μL of CCK-8 assay solution was added to each well of the 96-well plate, followed by incubation for 1.5 h. The absorbance at 450 nm was measured using a microplate reader (Varioskan Flash, Thermo Fisher Scientific, Waltham, MA, USA). Cell viability can be calculated according to the following formula:
where Ae and Ac represented the absorbance of the experimental group and the control group, A0 and Ap were the absorbances of the culture medium and solution of the PS-MPs dispersed in the medium, respectively.
2.7.2. Cell Cycle
After treatment with drugs for 48 h, cells were harvested by centrifugation and resuspended to a final concentration of 1 × 10⁶ cells/mL, and then fixed with 70% cold ethanol. Cells were incubated with a propidium iodide staining working solution in the dark for 1 h. The red fluorescence of 10,000 events of propiodium iodide-stained cells was countered using a Cytoflex-S flow cytometer (Beckman Coulter, Inc. in Brea, CA, USA). The percentage of cells in the different phases of the cell cycle was calculated using Kaluza Analysis Software (Beckman Coulter, Inc. in Brea, USA).
2.7.3. Apoptosis
After exposure to the PS-MPs and NP, 5 μL Annexin V-FITC dye solution and 10 μL propidium iodide were added to the cell suspension for a 15 min incubation in the dark at room temperature (20–25 °C). Afterward, the cells were measured in a Cytoflex-S flow cytometer (Beckman Coulter, Inc. in Brea, USA).
2.7.4. Mitochondrial Membrane Potential (MMP)
A total of 1 mL of JC-1 staining working solution was directly mixed with the treated cells for a 20 min of incubation at 37 °C. The supernatant was aspirated off and the cells were washed twice with JC-1 staining buffer (1×). The red and green fluorescence values of the cells were measured using a fluorescence microscope (Leica DMi8, Leica Microsystems, Wetzlar, Germany), and the ratio of green/red JC-1 fluorescent intensity was calculated.
2.7.5. Reactive Oxygen Species (ROS)
After 48 and 72 h of drug intervention in the cells, an appropriate amount of 10 μmol/L DCFH-DA fluorescent probe dye was added and incubated for 20 min at 37 °C. Cells were then collected and washed three times with PBS to sufficiently remove the DCFH-DA that did not enter the cells. Subsequently, the average fluorescence intensity value detected by the flow cytometer (Cytoflex S, Beckman Coulter, Inc. in Brea, USA) at a 488 nm excitation wavelength and a 525 nm emission wavelength characterized the active oxygen levels.
2.8. Statistical Analysis
The fitting curve and fitting parameters of the adsorption kinetics and isotherm models were performed using the Origin 2019 software. All experimental data were expressed as a mean with standard deviations. One-way ANOVA and Tukey or Dunnett testing for multiple comparisons were performed using GraphPad Prism 8.0. A p-value < 0.05 was considered statistically significant.
3. Results
3.1. Characterization of PS-MPs
The PS-MPs used in this study were pure particles with particle sizes of 0.1, 1, 10, 50, and 100 μm. Uniform particle size can be observed using a scanning electron microscope (Figure 1A). As to the surface morphology observed, representative phenomena of different particle sizes were found. The surface of the 1 μm PS-MPs was not smooth and flat but was adhered to the unaggregated fragments with cracks. In the observation of the PS-MPs with a diameter of 50 μm, a surface that was either relatively smooth or attached with loose and porous foam-like substances was found. In addition, the shape of a particle of 100 μm in size was closer to an ellipse, with particles attached to its rough surface. The specific surface area and porosity tests proved that the PS-MPs had a porous structure, and the PS-MPs with smaller particle sizes had a larger specific surface and average pore diameters (Table 1).
The FT-IR spectrum of the PS-MPs is shown in Figure 1B as a representative example. The infrared absorption peak at 3000 cm−1 and 750 cm−1 was attributed to the C-H stretching vibration mode and the out-of-plane bending vibration mode on the benzene ring in the polystyrene molecule; The 2850 cm−1 frequency belongs to the CH2 symmetric stretching vibration mode in the polystyrene molecule, and 960 cm−1 is attributed to the out-of-plane deformation vibration mode of the olefin in the polystyrene molecule; the prominent peak at around 1455 cm−1 and 1730 cm−1 was attributed to the vibration mode of the benzene ring in the polystyrene molecule. The composition and characteristic diffraction peaks of the PS-MPs corresponded to previous reports [22].
Figure 1.
Characterization of PS−MPs used in this study. (A) SEM images of PS−MPs with different particle sizes: 0.1 μm (a); 1 μm (b); 10 μm (c); 50 μm (d); 100 μm (e). (B) FTIR spectra of PS−MPs.
Figure 1.
Characterization of PS−MPs used in this study. (A) SEM images of PS−MPs with different particle sizes: 0.1 μm (a); 1 μm (b); 10 μm (c); 50 μm (d); 100 μm (e). (B) FTIR spectra of PS−MPs.


Table 1.
Surface area, total pore volume, and average pore diameter of PS-MPs.
| Particle Size (μm) | 0.1 | 1 | 10 | 50 | 100 |
|---|---|---|---|---|---|
| Surface area (m2/g) | 62.248 | 38.193 | 16.887 | 3.824 | 3.351 |
| Total pore volume (cc/g) | 0.336 | 0.476 | 0.043 | 0.007 | 0.004 |
| Average pore diameter (nm) | 19.970 | 9.818 | 10.013 | 7.082 | 5.096 |
3.2. Effect of Reaction Time on Adsorption and Desorption of NP on PS-MPs
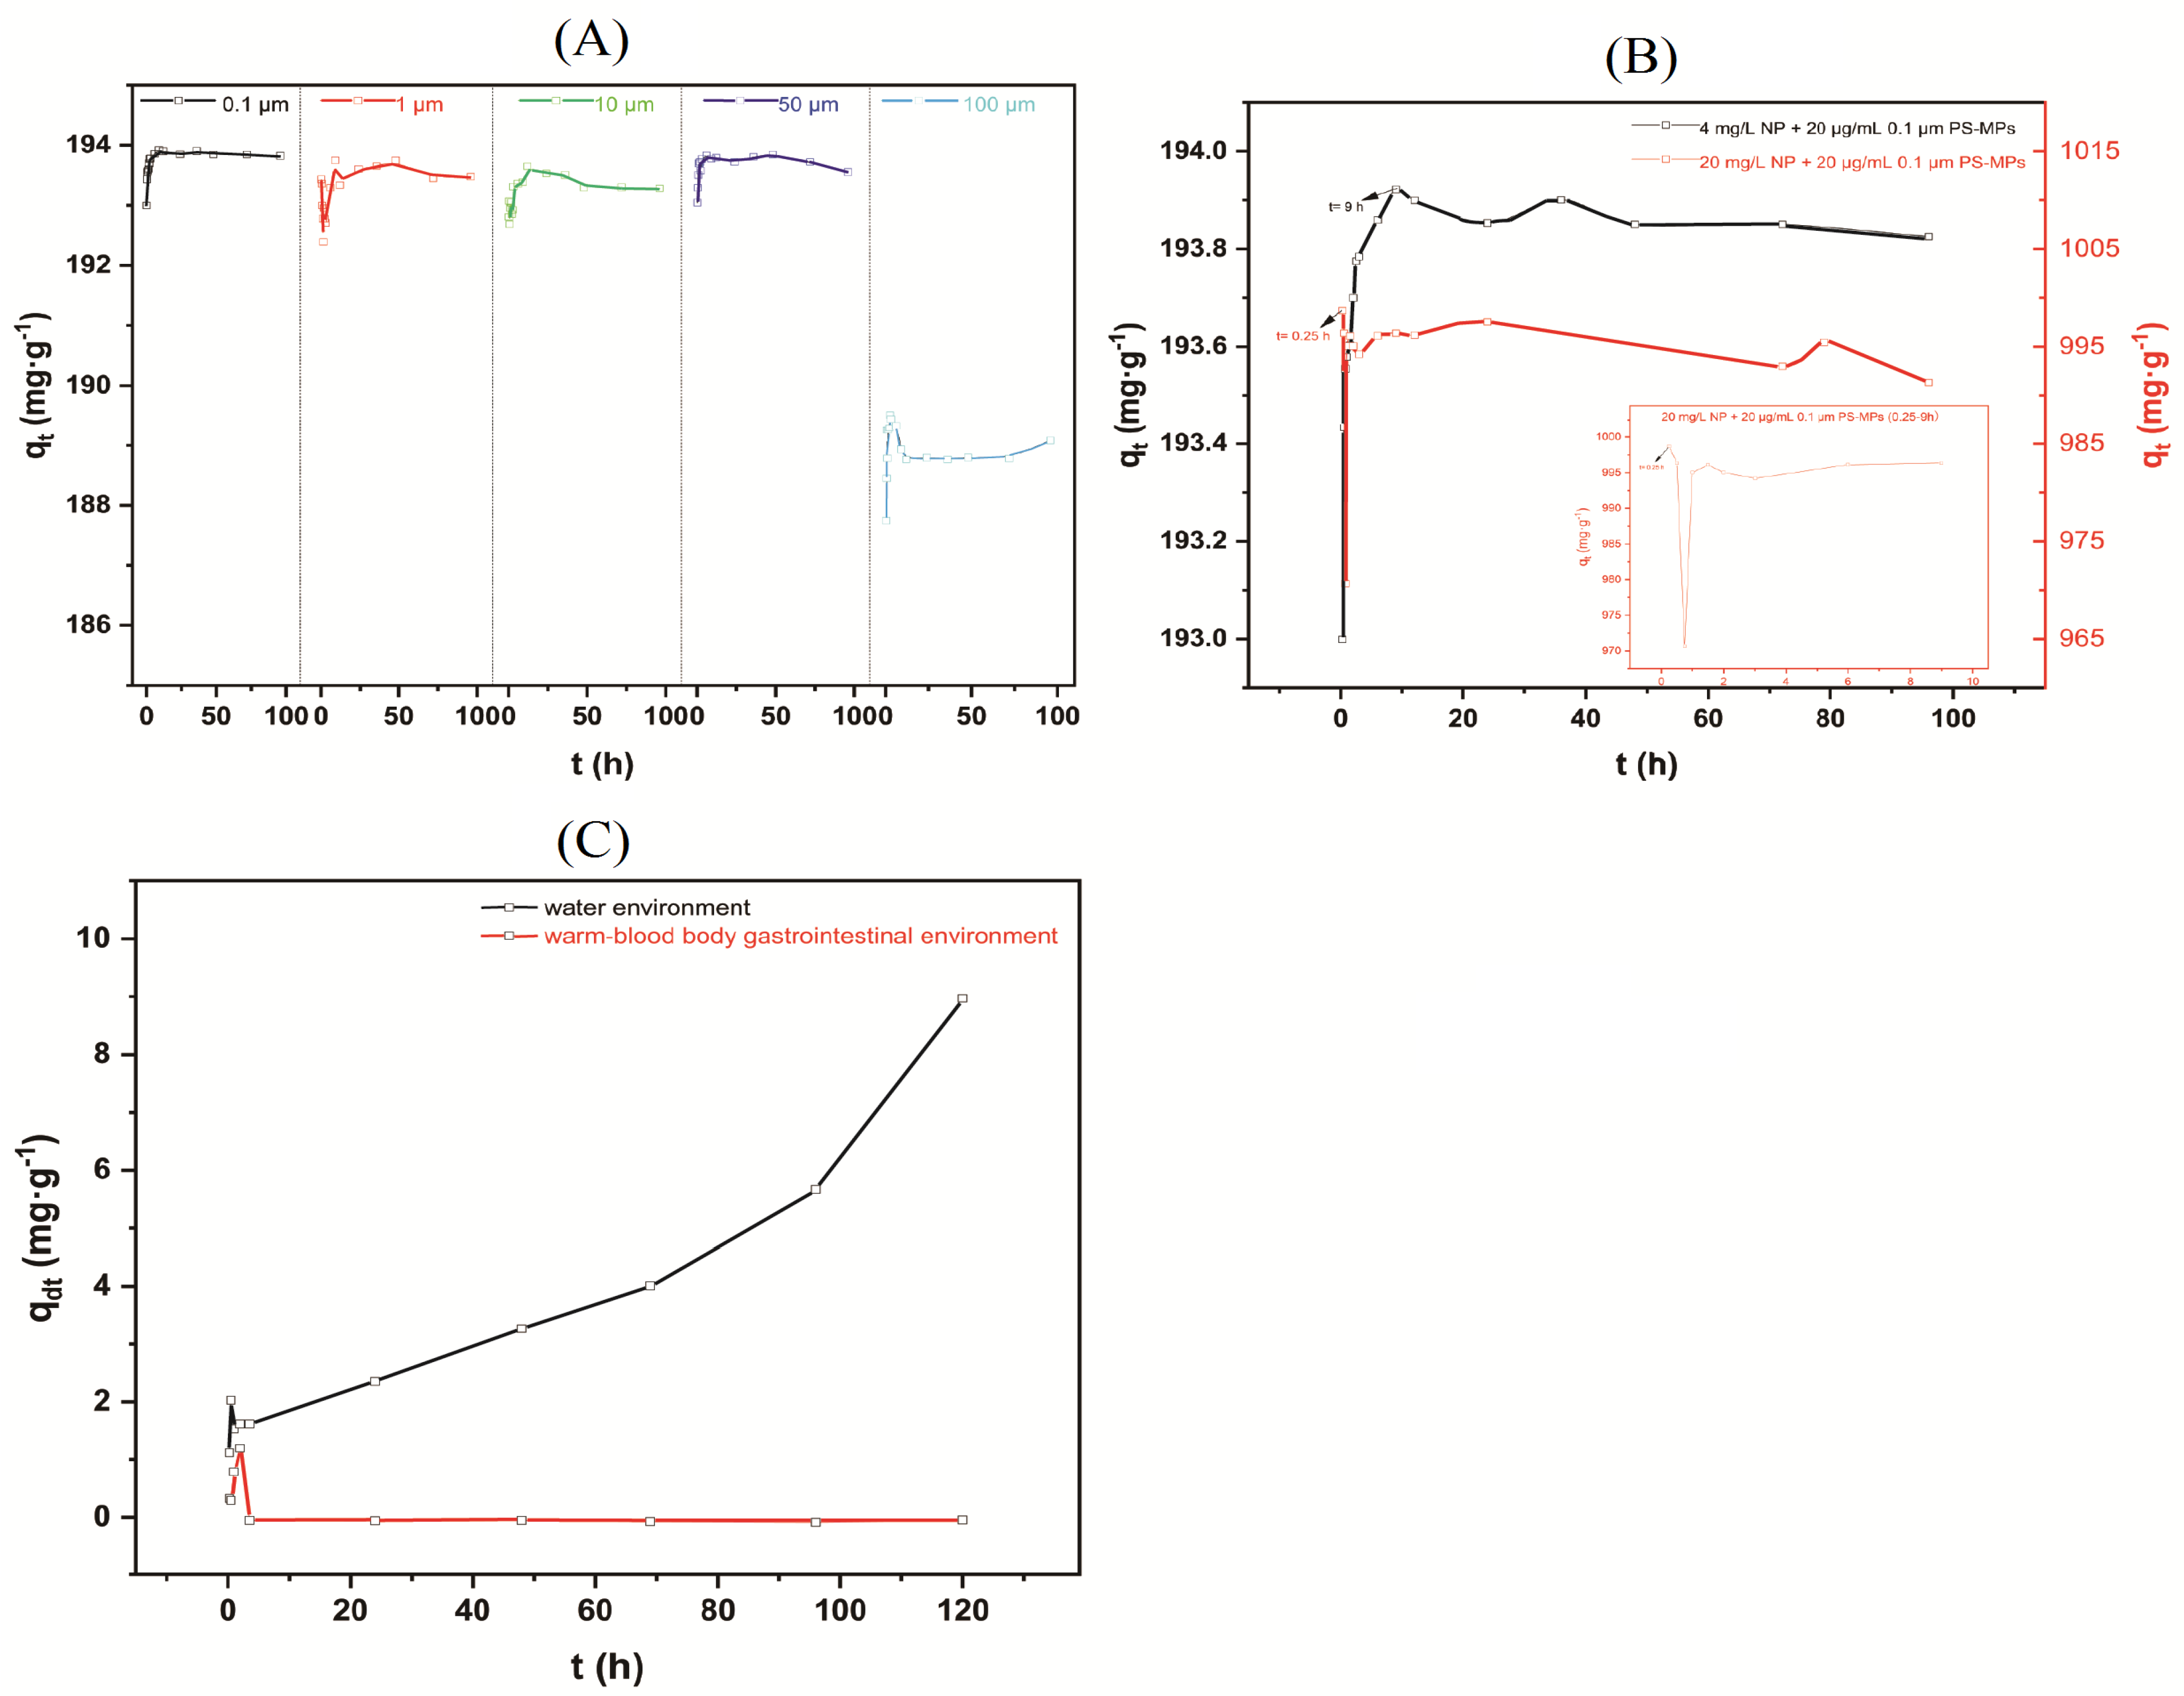
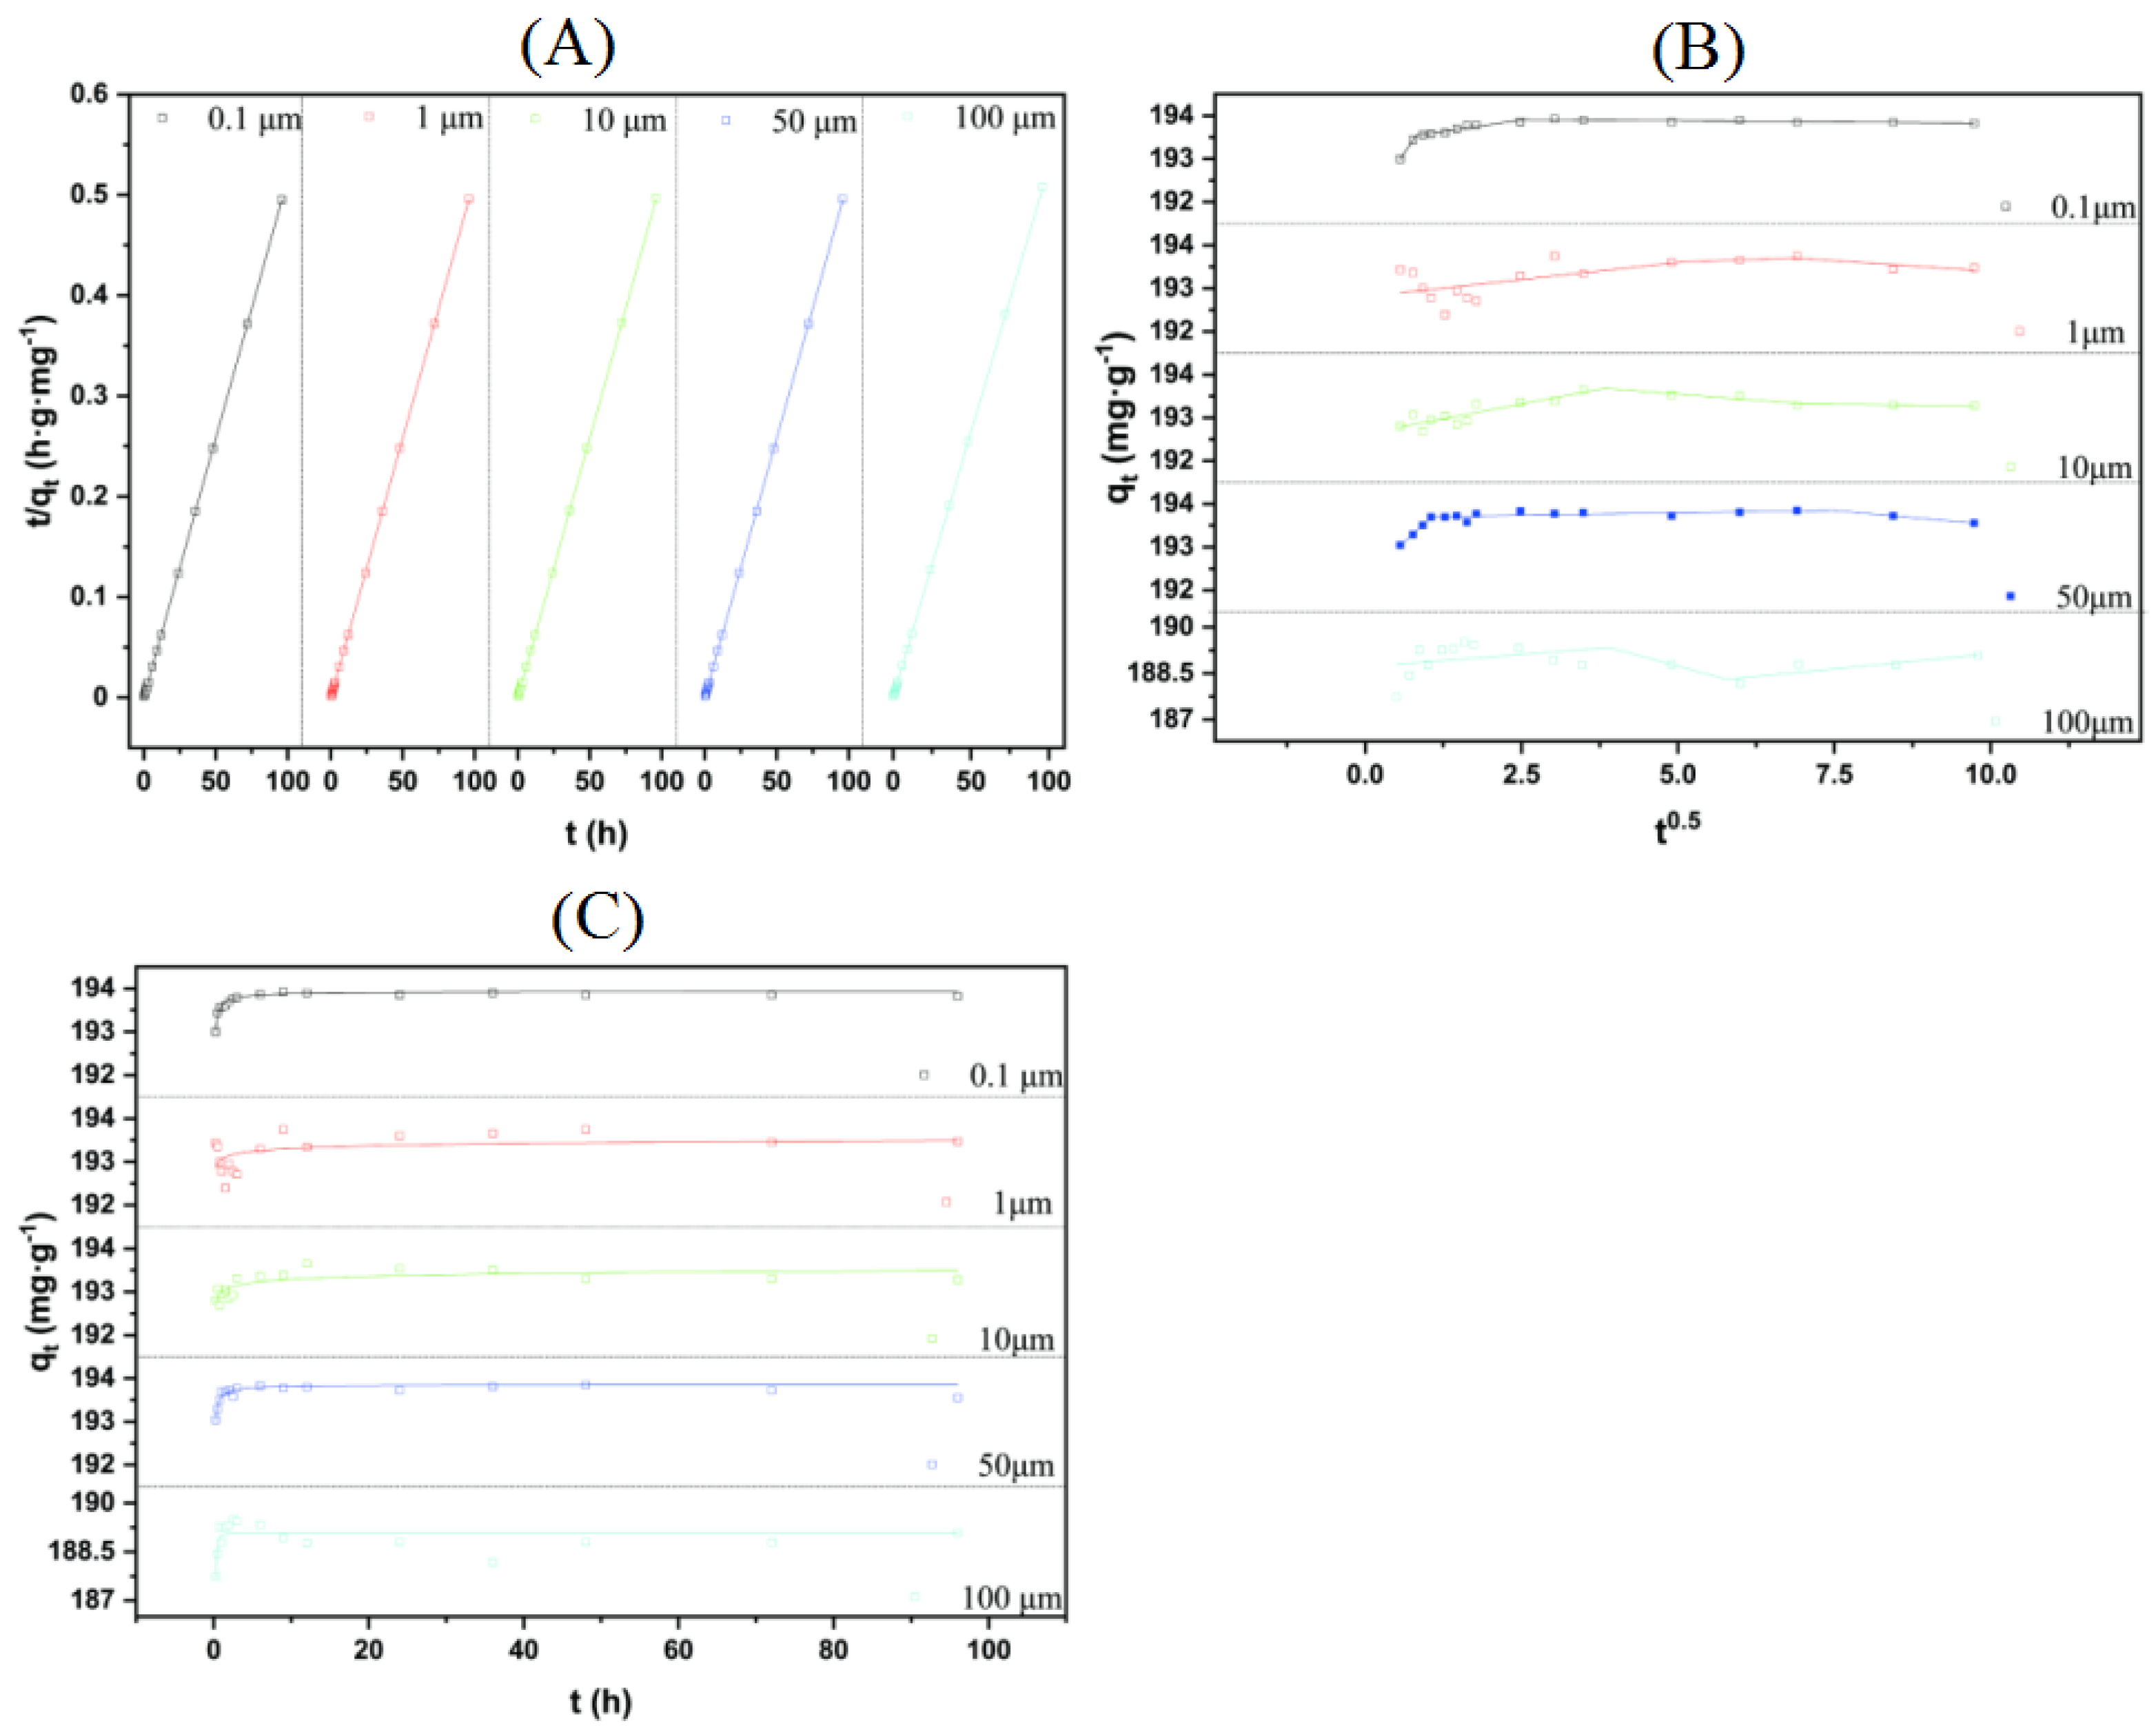
In this study, Figure 2A,B are the individual plotted curves of the NP adsorption capacity of PS-MPs changing with time. It can be seen that the NP sorption by PS-MPs rose rapidly to the maximum and then gradually slowed until reaching the adsorption equilibrium, which was followed by it then becoming unchanging. The results showed similar trends for the NP adsorption processes for different particle sizes of the PS-MPs. Figure 2C showed that the NP desorption capacity curve of PS-MPs with a diameter of 0.1 μm under the gastrointestinal tract reached a maximum of about 0.12% within the first 2 h and then remained stable, whereas the NP desorption capacity of the PS-MPs under a water environment kept growing and was about nine times higher than that of the warm-blooded biological gastrointestinal tract at 120 h.
3.3. Intrinsic and Extrinsic Factors That Influence NP Adsorption to PS-MPs
There are many factors that affect the adsorption capacities of microplastics on a certain organic pollutant, such as the type, the physical characteristics (mainly particle size, specific surface area, and crystallinity) of the microplastics, the concentration of organic pollutant, and environmental conditions (pH and metal ions) [23,24,25]. Figure 3 showed the influence of four factors on the adsorption process. It was found that the adsorption of NP onto the PS-MPs was strongly dependent on the initial concentration of NP. As seen in Figure 3B, the adsorption capacity increased with the increasing initial concentration of NP, and reached the maximum when the initial concentration of NP was 40 mg/L. We also found that, under a certain concentration of NP, the increasing particle size of the PS-MPs would result in a decrease in the adsorption capacity.
Solution conditions, such as pH value and metal ion concentration, also significantly affected the adsorption capacity of the PS-MPs. Maximum NP adsorption occurred when the pH was 3 for the PS-MPs. NP adsorption capacity decreased as solution pH increased. Figure 3D shows the influence of various metal ions (0.2 M) on the adsorption of NP onto the PS-MPs at a pH of 7. The results showed that NP adsorption was strongly dependent on ions for the PS-MPs. An average increase of 6.5 mg/g for NP adsorption capacity for the PS-MPs was observed in the presence of other metal ions, among which Na+ increased the most.
Figure 3.
The effect of PS-MP particle size (A), initial NP concentration (B), solution pH (C), and metal ions contained in the solution (D) on the adsorption process of NP. * indicates the significant difference between the treatment group (0.1 μm PS-MPs, initial NP concentration of 4 mg/L, pH 7 and control without metal ions, respectively) and other groups (* p < 0.05, ** p < 0.001, *** p < 0.0005).

3.4. Adsorption Kinetics
The obtained data were analyzed with the pseudo-second-order, intra-particle diffusion, and Bangham models. As shown in Table 2, the NP adsorption process of the PS-MPs was best fitted with a pseudo-second order kinetic model with high correlation coefficient (R2) values. The intra-particle diffusion kinetic model was more suitable for 0.1 μm PS-MPs (R2 = 0.988) than for other particle sizes of the PS-MPs. The data from the intra-particle diffusion rate constant k1p and the piece-wise fitting, C, of the 0.1 μm PS-MPs showed that the NP easily diffused inside the PS-MPs, whereas intra-particle diffusion was not the only rate-limiting step. Surprisingly, the Bangham kinetic model also gave good fittings for the adsorption of NP by 0.1 μm PS-MPs, indicating that intraparticle diffusion is crucial for NP adsorption by PS-MPs with small particle size. The kinetic model fitting curves mentioned here can be found in Appendix A Figure A1.
3.5. Adsorption Isotherm
Under a given system with a constant temperature and adsorption equilibrium, the relationship between the concentration of the adsorbate and adsorbent can be described by different equilibrium sorption isotherm models. The Langmuir, Freundlich, and D-R isotherms are used frequently to describe the adsorption data. According to Table 3, the adsorption of NP onto the PS-MPs was found to follow the Langmuir isotherm model since the maximum adsorption capacity calculated by the Langmuir model is approximately equal to the actual test results, suggesting that the PS-MPs had homogeneous surface sites, and monolayer adsorption was occurring [26,27]. The value for the RL of the D-R isotherm indicated the adsorption behavior of the PS-MPs was extremely favorable for NP. The adsorption isotherm model-fitting curve mentioned here can be found in Appendix A Figure A2.
3.6. Cell Proliferation and Apoptosis
3.6.1. Cell Viability
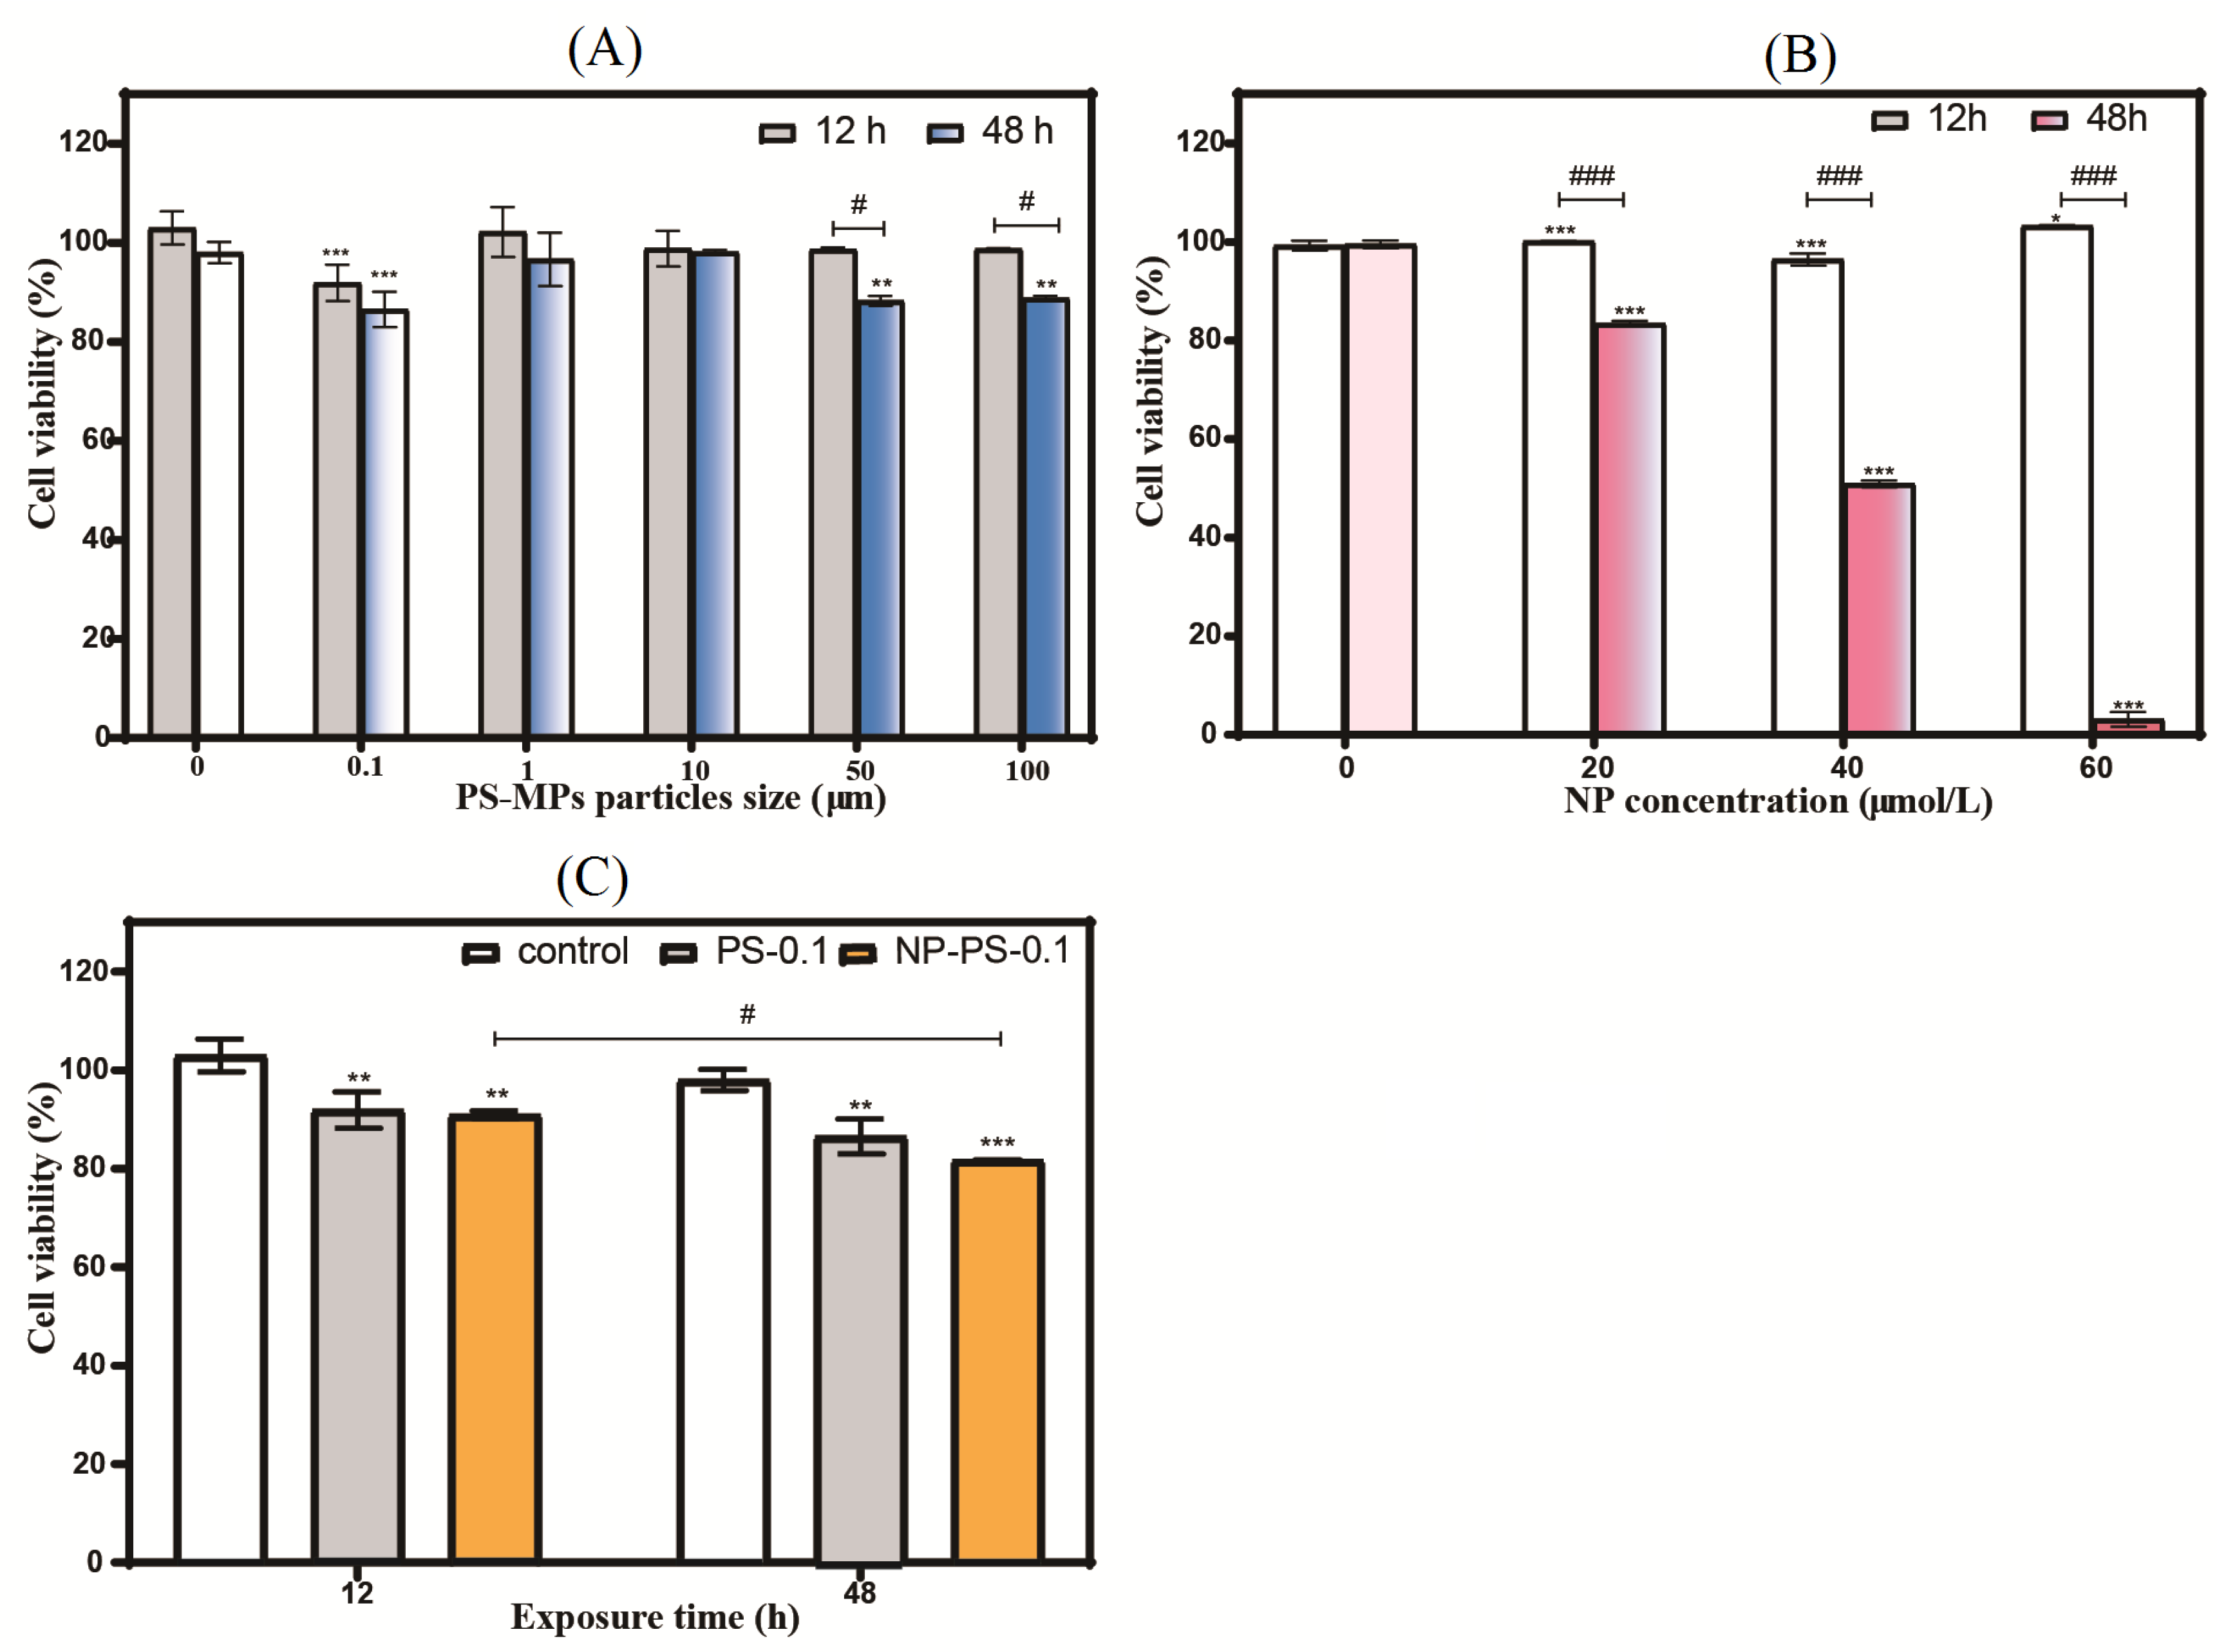
Figure 4B shows that the toxicity of NP on Caco-2 cells seemed to be time- and concentration-dependent. As shown in Figure 4A, 500 mg/L of PS-MPs with all particle sizes tested except 0.1 μm had no significant cytotoxicity for 12 h, which suggested that smaller particle sizes may cause more rapid damage. When treatment time was extended to 48 h, those PS-MPs with a bigger diameter (50 and 100 μm) decreased cell viability by about 12%, indicating a time dimension to their cytotoxicity. When the 0.1 μm PS-MPs intervened in the Caco-2 cells synergistically with NP, the activity of the Caco-2 cells declined in a time-dependent manner. There was no significant difference in cell viability between the exposure to PS-MPs alone and PS-MP-adsorbed NP exposure (Figure 4C).
3.6.2. Cell Cycle
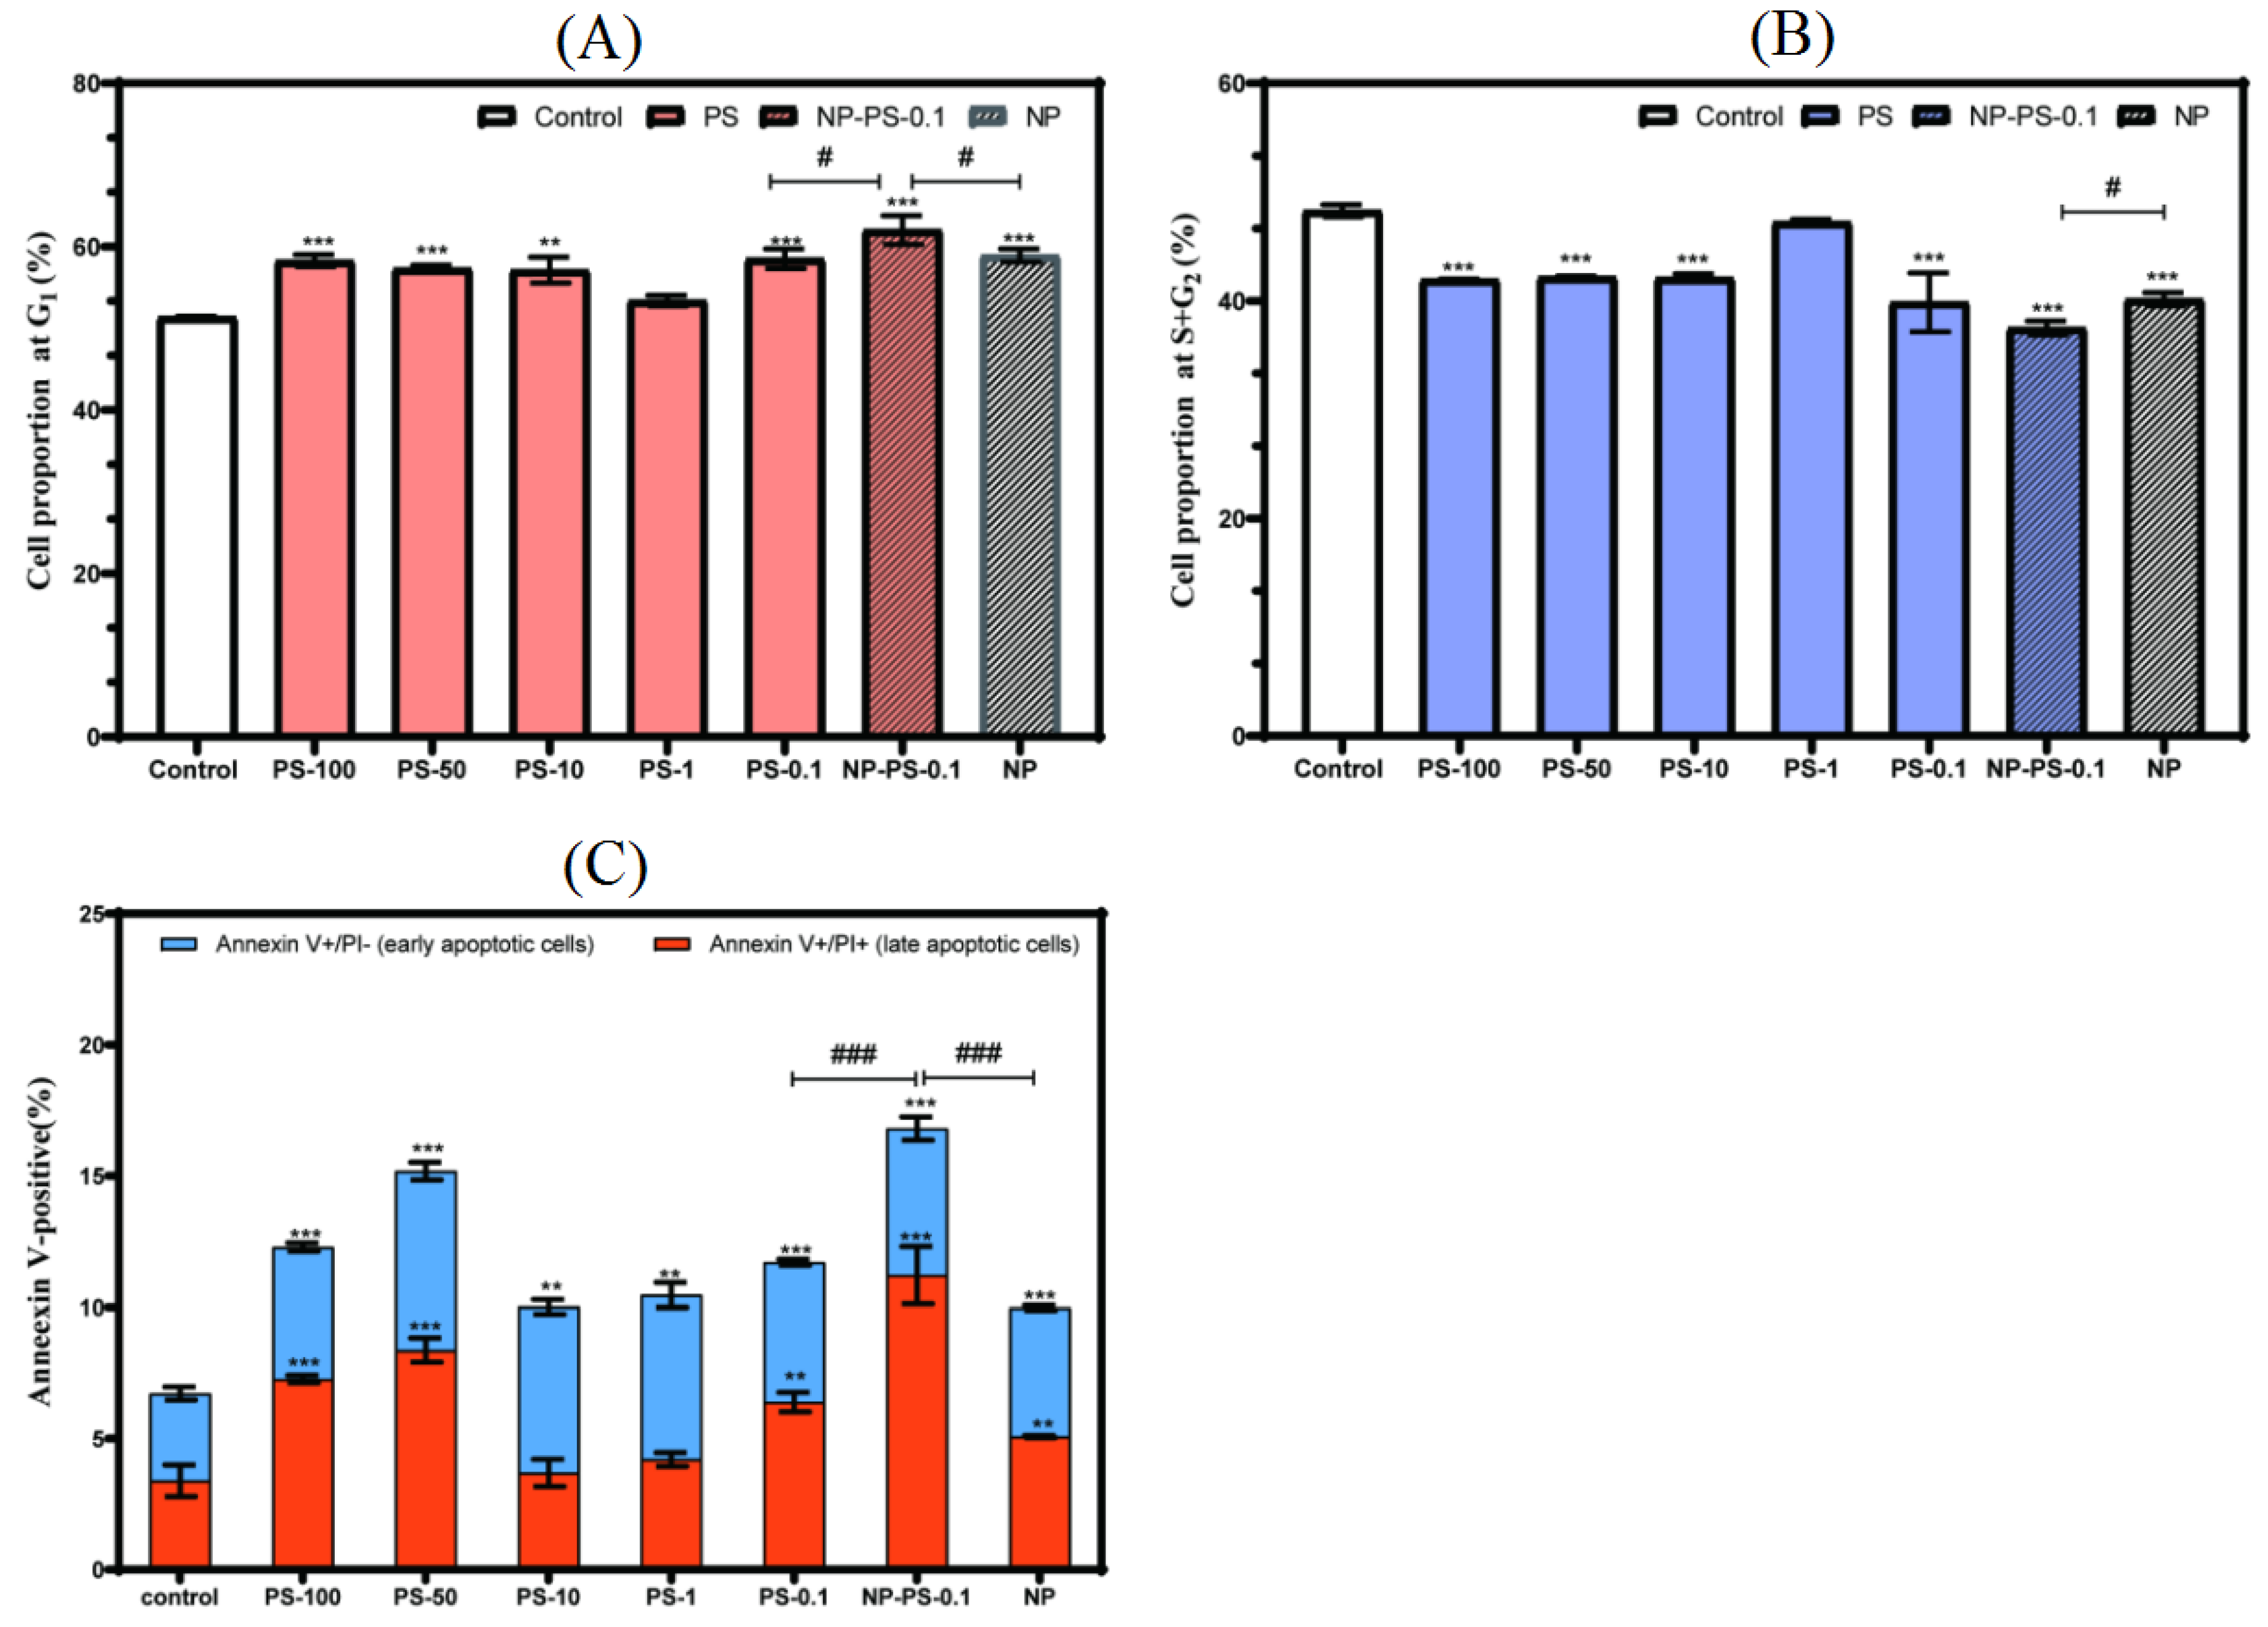
Problems with the cell cycle may also be a major reason for the interference in cell proliferation. Figure 5A,B showed that, in comparison with the control group, the NP, PS-MPs (with a diameter of 0.1, 10, 50, and 100 μm), or the 0.1 μm PS-MPs synergistic with NP groups showed similar trends in early DNA synthesis: a significantly higher proportion of cells in the G1 phase and a lower proportion of cells in the S and G2/M phases. Compared with the 0.1 μm PS-MPs group, the 0.1 μm PS-MPs synergistic with the NP group exhibited a higher proportion of cells in the G1 phase by about 6.5%.
3.6.3. Apoptosis
Our results showed that, compared with the control group, the NP, PS-MPs (with diameters tested in this study), or 0.1 μm PS-MPs synergistic with NP induced significant apoptosis in the Caco-2 cells, as shown in Figure 5C. The 48 h treatment of the larger PS-MPs (with a diameter of 50 and 100 μm) resulted in a significant increase in the population of both early and late apoptotic cells over the control group. The increase in the proportion of cells undergoing apoptosis was significantly higher following exposure to 0.1 μm PS-MPs synergistic with NP treatment (17.7%) when compared to 0.1 μm PS-MP (10.5%) or NP-alone (8.94%) treatment, which was mainly attributed to the greater proportion of early apoptosis.
Figure 5.
Effects of 48 h treatment of PS-MPs, NP and synergistics on the cell cycle and apoptosis of the Caco-2 cells. (A) Shows the proportion of cells in the G1 phase via different exposures. (B) Showed the sum of the cells in the S and G2 phases via different exposures. Early and late apoptotic Caco-2 cells were analyzed by flow cytometry after Annexin V and PI staining. A statistical graph of the percentage of cells in each phase was calculated (C). * indicates the significant difference between the treatment group and the control group (** p < 0.001, *** p < 0.0005). # indicates the significant difference between the marked groups (# p < 0.05, ### p < 0.0005).

3.7. Cell Function
3.7.1. Mitochondrial Depolarization
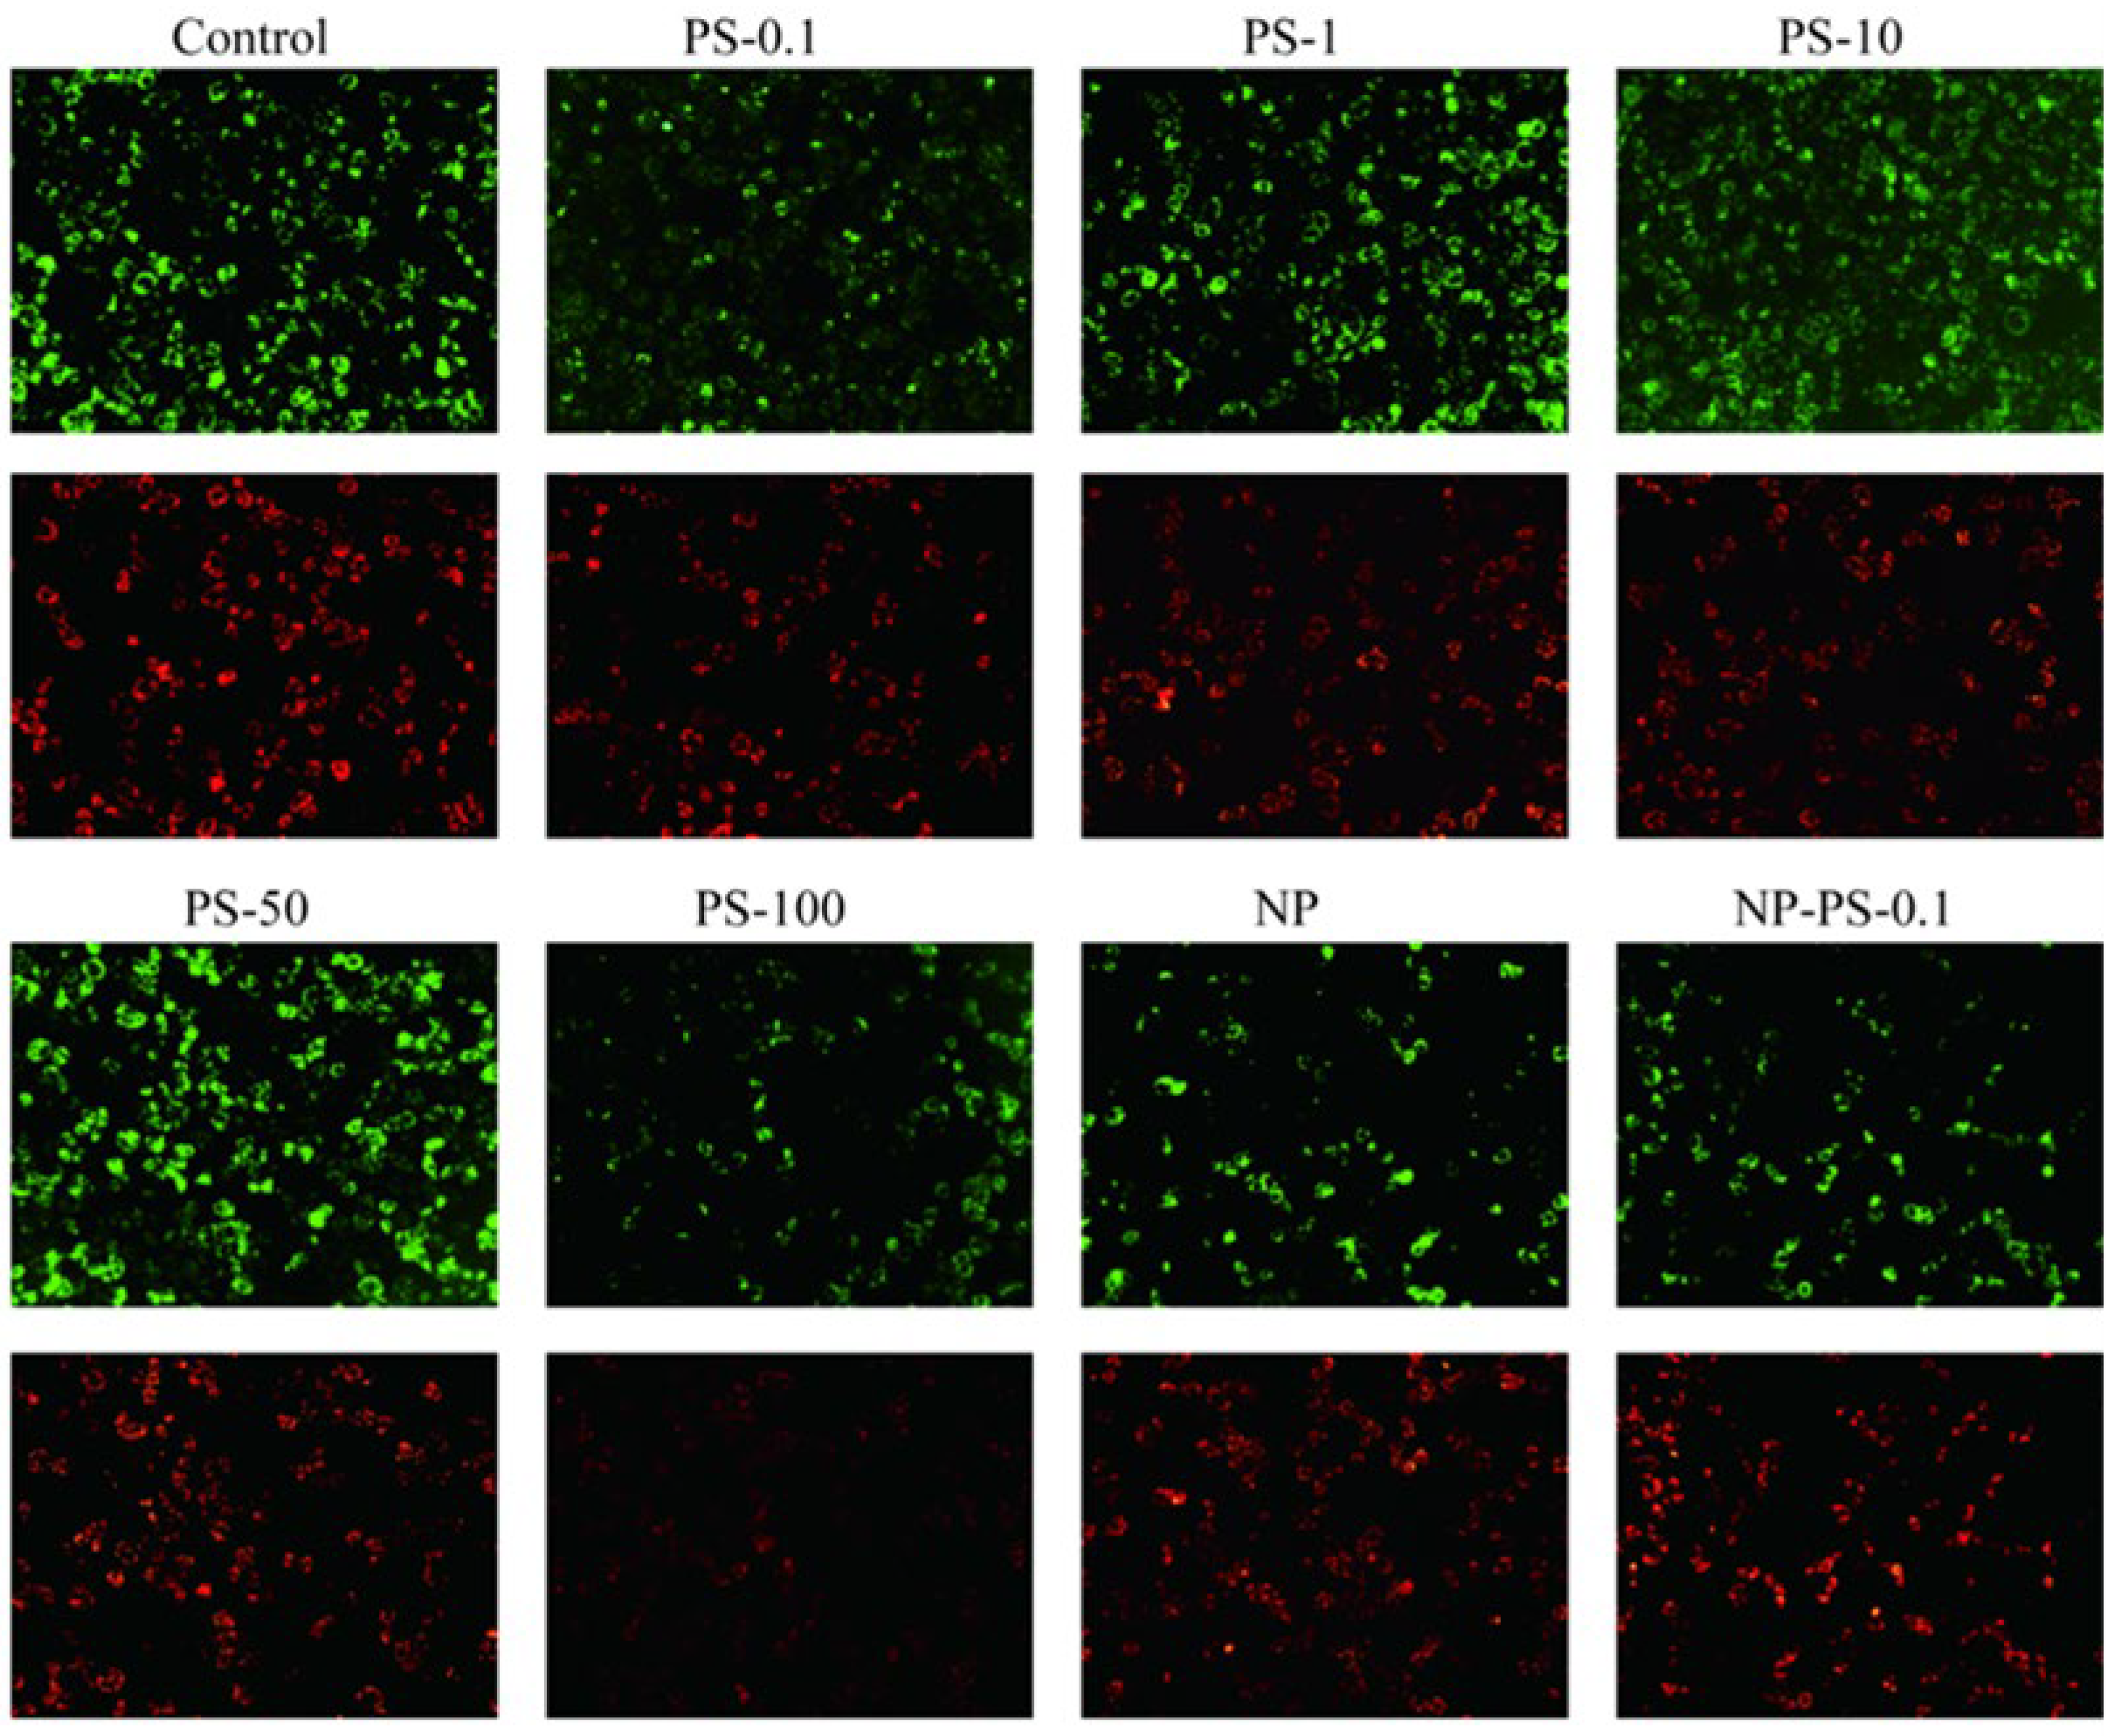
The destruction of mitochondrial membrane potential is considered to be one of the earliest events in the process of an apoptosis cascade. JC-1 fluorescent dye was used to detect the depolarization of cell mitochondrial membrane potential. Fluorescence images of the cells were recorded, and the relative levels of the intensities of green/red JC-1 fluorescence were quantified.
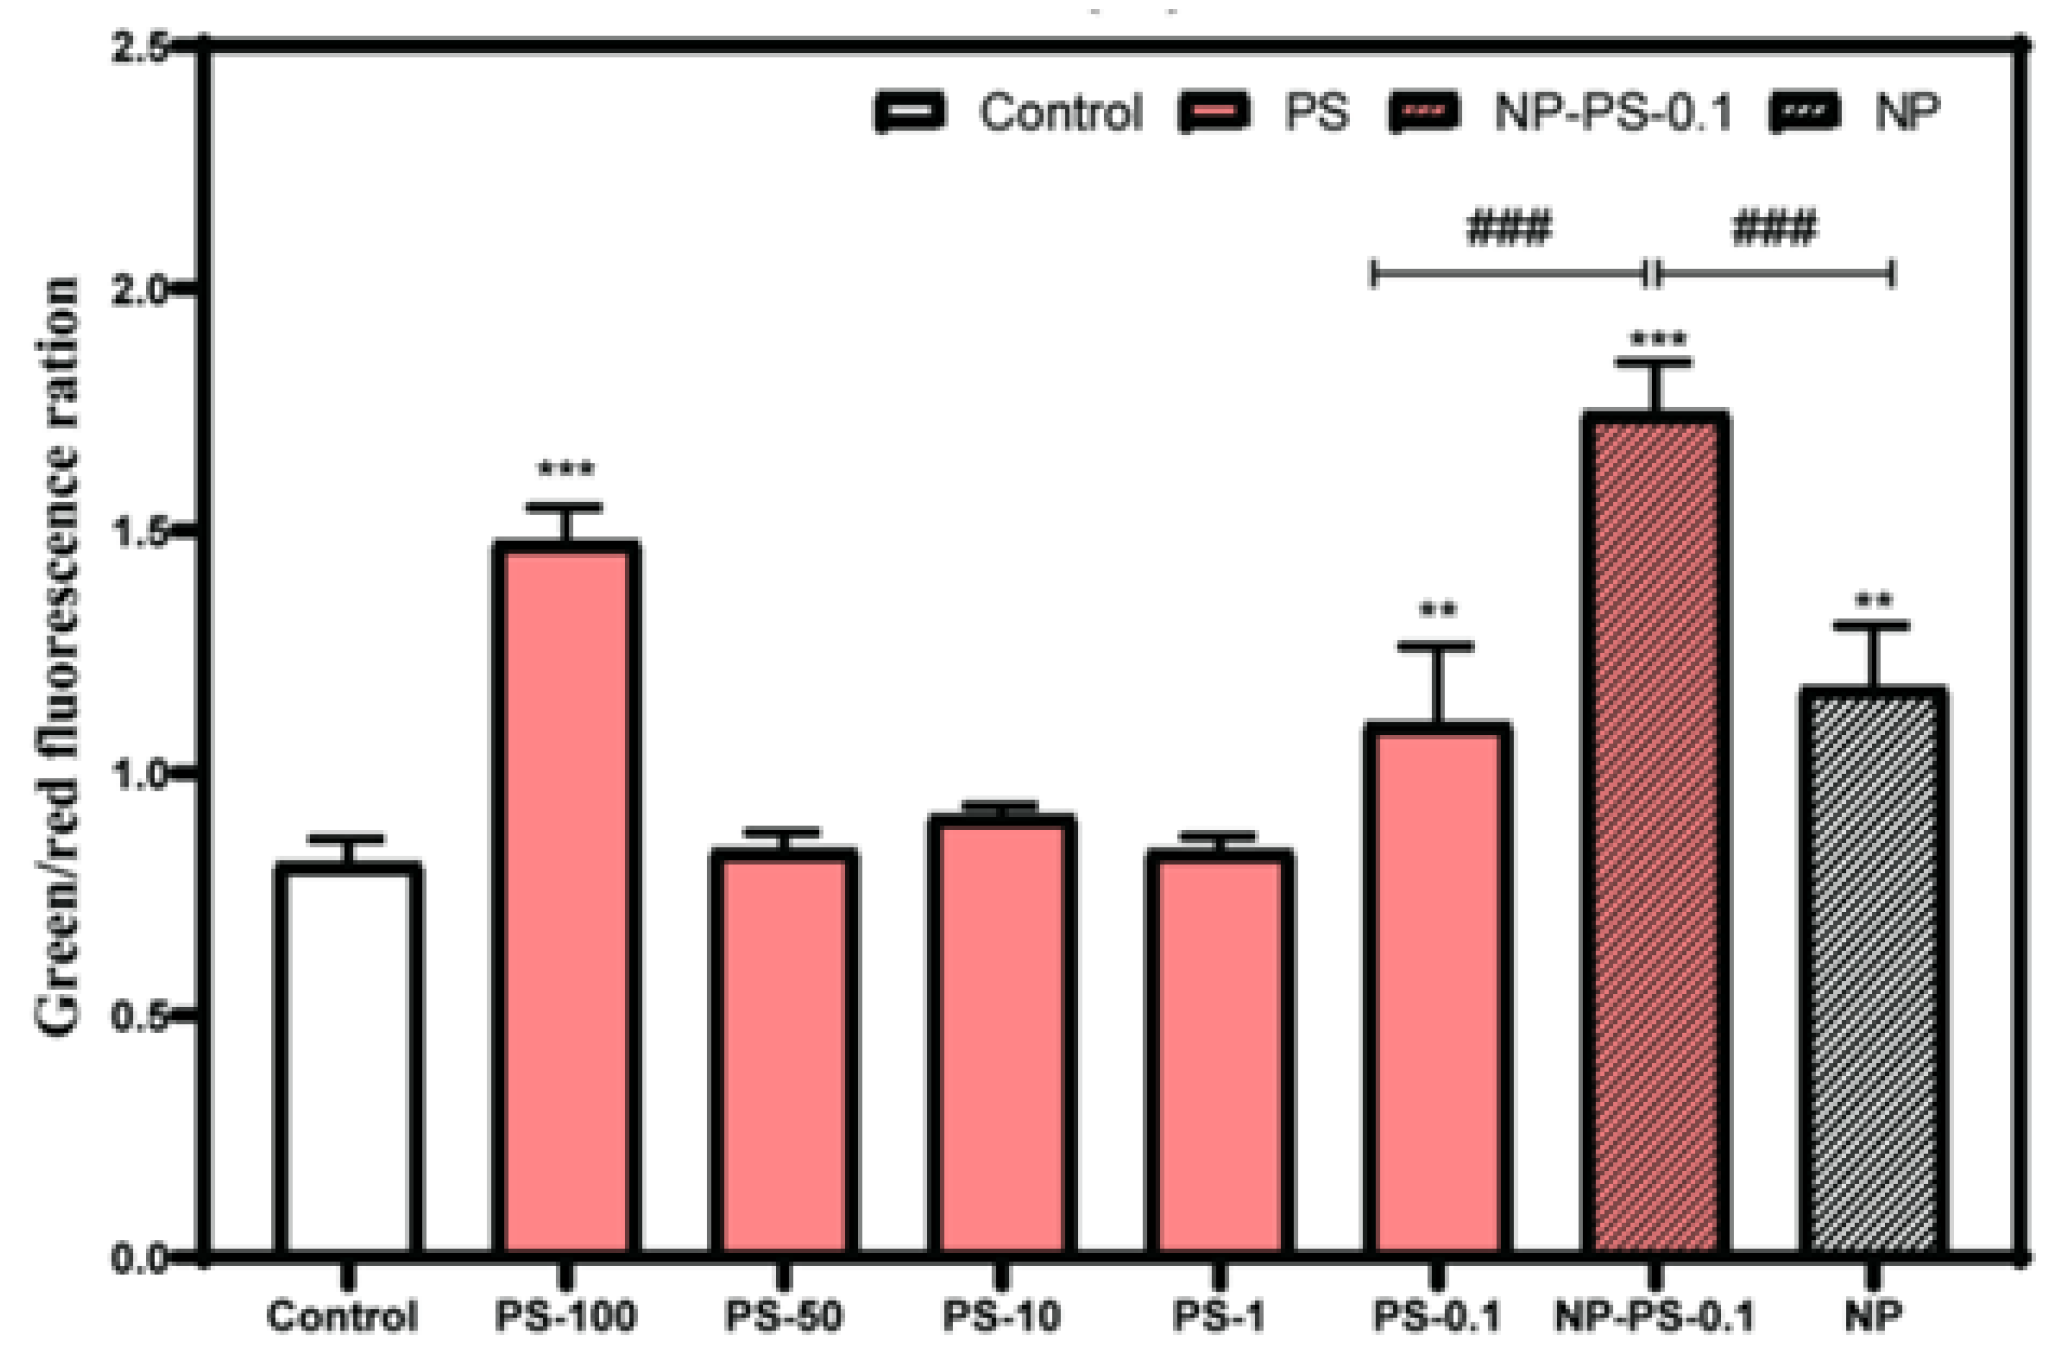
As shown in Figure 6 and Appendix A Figure A3, after 48 h of treatment, PS-MPs of various sizes caused a different degree of depolarization of the mitochondrial membrane potential. Further, in comparison to 0.1 μm PS-MPs alone or NP alone treatments, a statistical significance for MMP change was observed in the PS-MPs with adsorbed NP group, pointing to a synergistic effect once again.
3.7.2. Reactive Oxygen Species Production
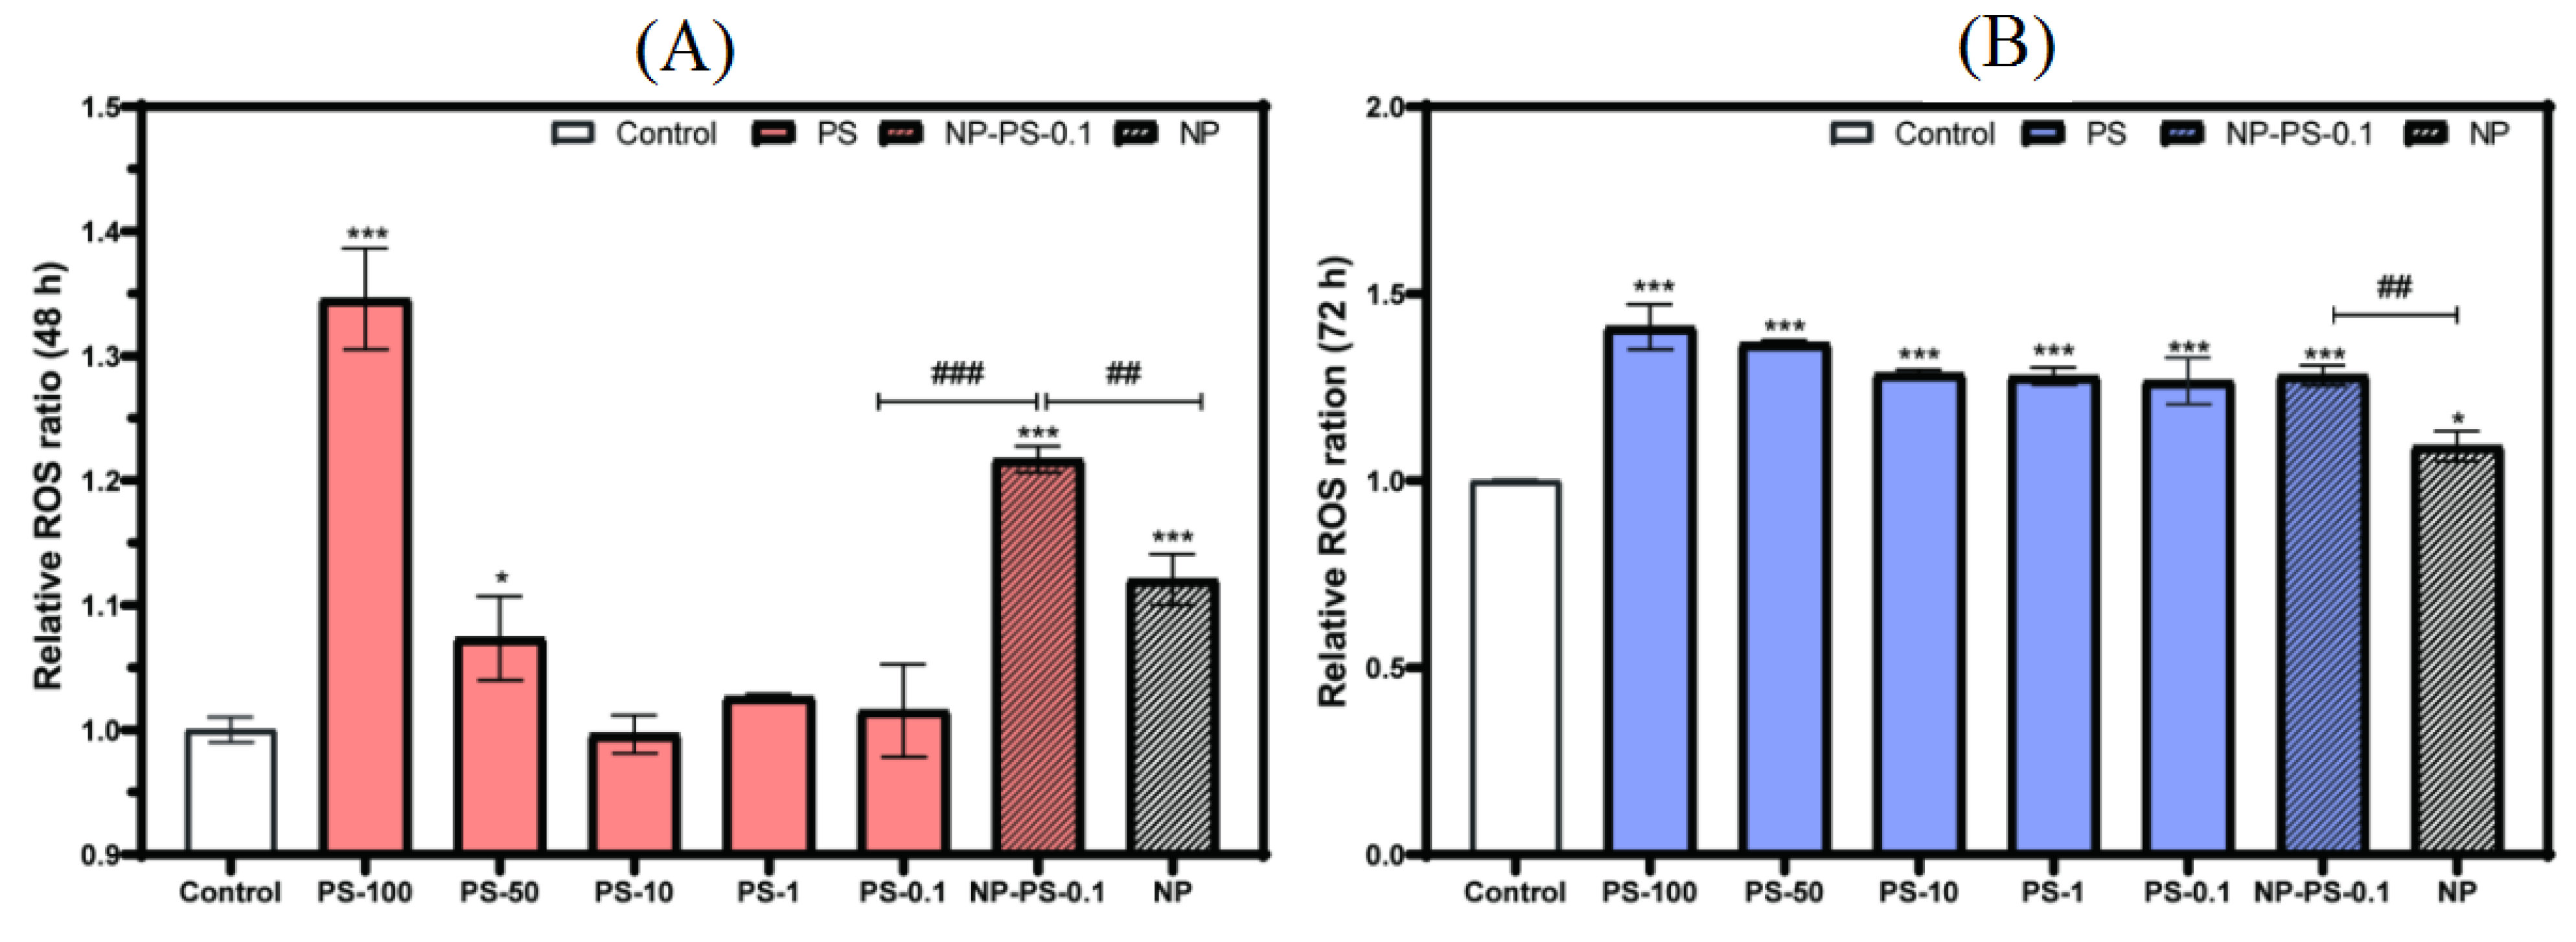
Reactive oxygen species (ROS) are a group of chemically reactive chemical substances containing oxygen, which play important roles in cell signal transduction and homeostasis. In this study, the ROS change caused by the PS-MPs was roughly in accord with a time-dependent manner (Figure 7). In comparison with the control group, large PS-MP (with a particle size of 50 and 100 μm) treatment for 48 and 72 h resulted in a significant increase in ROS generation, which suggested that larger PS-MPs have a greater potential to break the oxidation–antioxidant balance of cells. In addition, compared with the NP group, 0.1 μm PS-MPs synergistic with NP treatment resulted in a significant increase in ROS generation, evidencing that the joint effect of the PS-MPs occurred.
4. Discussion
Plastic polymers have been believed to be biochemically inert and not harmful to ecosystem health for many years. However, there is a growing consensus that more research is needed to explore the toxicological effects of MPs, especially when combined with other contaminants. Previous studies have shown that combined exposure to MPs with other contaminants may alter toxicokinetics [28]. Hence, this study aimed at systemically examining the adsorption/desorption behavior of NP on PS-MPs with different particle sizes and evaluating their cytotoxic effects on Caco-2 cells.
PS-MPs with different diameters caused various degrees of decline in intestinal cellar proliferation. PS-MPs with smaller particle sizes caused a quick decrease, whereas larger particle sizes (of PS-MPs) did not affect cell viability in the short term, which was consistent with the studies of Zhang et al. [29]. There is a combined toxicity of nanoscale and micronscale plastic particles in the intestines [30]. Considering the accumulation of MPs in the intestine, their toxicity will be amplified; a total of 48 days chronic exposure to MPs triggered intestinal disorders [31]. As to the cell cycle, PS-MPs induced a G1 phase block, verifying a former study that showed that high concentrations of nanomaterials can adhere to the cell membrane to hinder the transport and adsorption of nutrients, which was related to cell cycle arrest [32]. Furthermore, we speculated that impaired cell function might be the main pathway of cell damage caused by PS-MPs, especially those of large particle sizes. They induced ROS generation and mitochondrial permeability transition (MPT), which correlates with the depolarization of the mitochondrial membrane potential and leads to an apoptotic cascade [33]. Similarly, there have been distinct pieces of evidence that long-term PS-MPs exposure may be a risk factor for kidney health and placental barriers [34,35].
In this study, PS-MPs were proven to have a high adsorbent of NP which may be due to their large specific surface area and rich microporous structure. The data of NP desorption from PS-MPs showed a linear increase in the aqueous environment, indicating that PS-MPs with absorbed NP may possess chronic toxic effects with the reduced metabolism efficiency of NP. Consistently, MPs acted as carriers and transport phthalate esters into organisms, as well as inducing combined health risks [10]. Microporous adsorption and intra-particle diffusion had a stronger influence on small-sized PS-MPs than on large particle sizes of PS-MPs, suggesting that the smaller the particle size of the microplastics, the higher the risk of synergistic toxicity [36]. Further studies were conducted with NP and smaller particle sizes of PS-MPs (0.1 μm) to elucidate a general mechanism concerning reactive oxygen species, mitochondrial membrane potential, apoptosis, and the cell cycle. Inversely, polycyclic aromatic hydrocarbons could decrease the toxicity of the nanoplastics by enhancing their stability, whereas metal oxide nanoparticles had the opposite effect [37]. Our results showed that oxidative stress and mitochondrial dysfunction were the main pathways through which PS-MPs destroy cell homeostasis. Similar results can be found in the study about the toxic effects of PS-MPs with bisphenol A, which showed that the synergistic toxicity of nano-scale polystyrene and bisphenol A was more obvious than that of polystyrene or bisphenol A alone [38]. Additionally, M Vagner et al. demonstrated that nanoplastics had a strong potential to cross the intestinal barrier [39]; thus, we speculate that the synergistic cytotoxicity of PS-MPs and NP also damages other organs and even creating whole systemic exposure risk, which requires further study. Furthermore, damage to the basic functions of cells caused by PS-MPs combined with NP should not be underestimated, especially considering that smaller particle-sized MPs can interact with the cellular components and increase the accumulation of hazards or change the distribution of hazards.
5. Conclusions
The current work focused on the environmental behavior and in vitro toxicity of NP on PS-MPs by using the results from desorption experiments in the intestinal or water environment as a bridge. The adsorption process of PS-MPs and NP can be better described by the pseudo-second-order kinetic model and Langmuir isotherm model, suggesting that the adsorption process was presumably chemisorption and spontaneous. An analysis of the NP adsorption of 0.1 μm PS-MPs using intra-particle diffusion and Bangham modeling confirmed that pore adsorption was also a possible adsorption mechanism. The desorption experiments showed that the biological environment significantly reduced the desorption capacity of NP, while the desorption rate was non-linearly increased in an aqueous environment. PS-MPs synergistic with NP can enhance the lethal toxicity of PS-MPs in Caco-2 cells. Both the PS-MPs and NP alone caused cellular oxidative stress, the depolarization of mitochondrial membrane potential, and cell cycle arrest, indicating that PS-MPs and NP may share the same mechanism, which can be seen as the main reason for the coordinated cell dysfunction caused by the combined group. These data can be used to comprehensively assess the environmental risks and human health threats from PS-MPs and NP. The next step is to focus on the damage caused to the function of specific organelles, such as mitochondria, lysosomes, and endoplasmic reticulum.
Author Contributions
Methodology and writing—original draft preparation, F.D.; validation, Q.Z.; data curation, L.W. and J.M.; writing—review and editing, L.S.; supervision, project administration and funding acquisition, D.H. All authors have read and agreed to the published version of the manuscript.
Funding
This research was funded by the Natural Science Foundation of Jiangxi Province (No. 20212BAB206089), the National Natural Science Foundation of China (No. 31260364, and No. 32260563), the National Key R&D Program of China (No. 2017YFF0207805), and the Special Funds Project for Innovation of Postgraduates in Jianxi province (No. YC2019-S067).
Data Availability Statement
Data is contained within the article.
Conflicts of Interest
The authors declare no conflict of interest.
Appendix A
Table A1.
Adsorption kinetic and isotherm models used in this study.
| Name | Equations | References |
|---|---|---|
| kinetics | ||
| Pseudo-first-order | [40] | |
| Pseudo-second-order | [41] | |
| Intra-particle diffusion | [42] | |
| Bangham | [43] | |
| isotherm | ||
| Langmuir | [44] | |
| Freundlich | [45] | |
| D-R | [46] | |
In adsorption kinetics, qe and qt denote the adsorption capacity of the PS-MPs at the condition of equilibrium and at the time t (h); k1 (h−1) is the rate invariable of the pseudo-first-order adsorption kinetic models; k2 (g·mg−1·h−1) is the pseudo-second-order rate invariable; kip (mg·g−1·h−0.5) represents the rate invariable of intra-particle diffusion; C is a constant related to thickness and boundary layer. K is the adsorption rate constant of the Bangham model, and Z is the adsorption constant. qe (mg·g−1) is the equilibrium adsorption capacity of NP per unit adsorbent; ce (mg·L−1) is the equilibrium concentration of NP insolution; kL (L·mg−1) is the Langmuir adsorption constant; qmax (mg·g−1) represents the theoretical maximum adsorption capacity; nf is the surface heterogeneity factor and kF (mg·g−1) is the Freundlich partition co-efficient; KDR is the constant related to adsorption energy (mol2·KJ−2); ε is Polanyi potential energy (KJ·mol−1); R is the gas constant, T is the absolute temperature (K), and E is the average free energy of adsorption (KJ·mol−1), |E| < 8 (KJ·mol−1) is physical adsorption, |E| > 16 (KJ·mol−1) is chemisorption.
Figure A1.
The plots of adsorption kinetics fitted by pseudo-second-order kinetic (A), intra−particle diffusion kinetics (B) and Bangham modes (C). The adsorption of NP (4 mg/L) and PS−MPs (20 μg/mL) of different particle sizes were studied.
Figure A1.
The plots of adsorption kinetics fitted by pseudo-second-order kinetic (A), intra−particle diffusion kinetics (B) and Bangham modes (C). The adsorption of NP (4 mg/L) and PS−MPs (20 μg/mL) of different particle sizes were studied.

Figure A2.
Adsorption isotherm model fitting of 20 μg/mL 0.1 μm of MPs−PS with different concentrations of NP. (A) Langmuir model fitting. (B) D−R model fitting.
Figure A2.
Adsorption isotherm model fitting of 20 μg/mL 0.1 μm of MPs−PS with different concentrations of NP. (A) Langmuir model fitting. (B) D−R model fitting.

Figure A3.
The mitochondrial membrane potential depolarization of Caco−2 cells treated by 40 μmol/L NP, 500 mg/L PS-MPs with different particle sizes, 0.1 μm PS−MPs that absorbed NP at 48 h. Representative photograph from an inverted fluorescence microscope.
Figure A3.
The mitochondrial membrane potential depolarization of Caco−2 cells treated by 40 μmol/L NP, 500 mg/L PS-MPs with different particle sizes, 0.1 μm PS−MPs that absorbed NP at 48 h. Representative photograph from an inverted fluorescence microscope.

References
- Daniel, D.B.; Ashraf, P.M.; Thomas, S.N.; Thomson, K.T. Microplastics in the edible tissues of shellfishes sold for human consumption. Chemosphere 2021, 264, 128554. [Google Scholar] [CrossRef] [PubMed]
- Li, Q.; Feng, Z.; Zhang, T.; Ma, C.; Shi, H. Microplastics in the commercial seaweed nori. J. Hazard. Mater. 2020, 388, 122060. [Google Scholar] [CrossRef] [PubMed]
- Nan, B.; Su, L.; Kellar, C.; Craig, N.J.; Keough, M.J.; Pettigrove, V. Identification of microplastics in surface water and Australian freshwater shrimp Paratya australiensis in Victoria, Australia. Environ. Pollut. 2020, 259, 113865. [Google Scholar] [CrossRef] [PubMed]
- Schwabl, P.; Koppel, S.; Konigshofer, P.; Bucsics, T.; Trauner, M.; Reiberger, T.; Liebmann, B. Detection of various microplastics in human stool: A prospective case series. Ann. Intern. Med. 2019, 171, 453–457. [Google Scholar] [CrossRef] [PubMed]
- Hirt, N.; Body-Malapel, M. Immunotoxicity and intestinal effects of nano- and microplastics: A review of the literature. Part. Fibre Toxicol. 2020, 17, 57. [Google Scholar] [CrossRef] [PubMed]
- Lu, Y.; Zhang, Y.; Deng, Y.; Jiang, W.; Zhao, Y.; Geng, J.; Ding, L.; Ren, H. Uptake and accumulation of polystyrene microplastics in Zebrafish (Danio rerio) and toxic effects in liver. Environ. Sci. Technol. 2016, 50, 4054–4060. [Google Scholar] [CrossRef] [PubMed]
- Mattsson, K.; Johnson, E.V.; Malmendal, A.; Linse, S.; Hansson, L.; Cedervall, T. Brain damage and behavioural disorders in fish induced by plastic nanoparticles delivered through the food chain. Sci. Rep. 2017, 7, 11452. [Google Scholar] [CrossRef] [Green Version]
- Vieira, Y.; Lima, E.C.; Foletto, E.L.; Dotto, G.L. Microplastics physicochemical properties, specific adsorption modeling and their interaction with pharmaceuticals and other emerging contaminants. Sci. Total Environ. 2021, 753, 141981. [Google Scholar] [CrossRef]
- Deng, Y.; Zhang, Y.; Qiao, R.; Bonilla, M.M.; Yang, X.; Ren, H.; Lemos, B. Evidence that microplastics aggravate the toxicity of organophosphorus flame retardants in mice (Mus musculus). J. Hazard. Mater. 2018, 357, 348–354. [Google Scholar] [CrossRef]
- Deng, Y.F.; Yan, Z.H.; Shen, R.Q.; Wang, M.; Huang, Y.C.; Ren, H.Q.; Zhang, Y.; Lemos, B. Microplastics release phthalate esters and cause aggravated adverse effects in the mouse gut. Environ. Int. 2020, 143, 105916. [Google Scholar] [CrossRef]
- Soares, A.; Guieysse, B.; Jefferson, B.; Cartmell, E.; Lester, J.N. Nonylphenol in the environment: A critical review on occurrence, fate, toxicity and treatment in wastewaters. Environ. Int. 2008, 34, 1033–1049. [Google Scholar] [CrossRef]
- Sun, D.; Chen, Q.; Zhu, B.; Zhao, H.; Duan, S. Multigenerational reproduction and developmental toxicity, and HPG axis gene expression study on environmentally-relevant concentrations of nonylphenol in zebrafish. Sci. Total Environ. 2021, 764, 144259. [Google Scholar] [CrossRef]
- Li, M.; You, M.; Li, S.; Qiu, Z.; Wang, Y. Effects of maternal exposure to nonylphenol on learning and memory in offspring involve inhibition of BDNF-PI3K/Akt signaling. Brain Res. Bull. 2019, 146, 270–278. [Google Scholar] [CrossRef]
- Xu, Y.; Sun, M.; Xu, Y.; Ju, J.; Pan, M.; Pan, Z.; Li, X.; Sun, S. Nonylphenol exposure affects mouse oocyte quality by inducing spindle defects and mitochondria dysfunction. Environ. Pollut. 2020, 266, 114967. [Google Scholar] [CrossRef]
- Li, F.F.; Du, P.C.; Yang, W.Y.; Huang, D.F.; Nie, S.P.; Xie, M.Y. Polysaccharide from the seeds of Plantago asiatica L. alleviates nonylphenol induced intestinal barrier injury by regulating tight junctions in human Caco-2 cell line. Int. J. Biol. Macromol. 2020, 164, 2134–2140. [Google Scholar] [CrossRef]
- Uzun, P.; Farazande, S.; Guven, B. Mathematical modeling of microplastic abundance, distribution, and transport in water environments: A review. Chemosphere 2022, 288, 132517. [Google Scholar] [CrossRef]
- Bhandari, G.; Bagheri, A.R.; Bhatt, P.; Bilal, M. Occurrence, potential ecological risks, and degradation of endocrine disrupter, nonylphenol, from the aqueous environment. Chemosphere 2021, 275, 130013. [Google Scholar] [CrossRef]
- Stenholm, Å.; Holmström, S.; Hjärthag, S.; Lind, O. Development of a high-performance liquid chromatography-fluorescence detection method for analyzing nonylphenol/dinonylphenol-polyethoxylate-based phosphate esters. J. Chromatogr. 2009, 1216, 6974–6977. [Google Scholar] [CrossRef]
- Tsuda, T.; Suga, K.; Kaneda, E.; Ohsuga, M. Determination of 4-nonylphenol, nonylphenol monoethoxylate, nonylphenol diethoxylate and other alkylphenols in fish and shellfish by high-performance liquid chromatography with fluorescence detection. J. Chromatogr. 2000, 746, 305–309. [Google Scholar] [CrossRef]
- Liu, P.; Wu, X.; Liu, H.; Wang, H.; Lu, K.; Gao, S. Desorption of pharmaceuticals from pristine and aged polystyrene microplastics under simulated gastrointestinal conditions. J. Hazard. Mater. 2020, 392, 122346. [Google Scholar] [CrossRef]
- Zuo, L.; Li, H.; Lin, L.; Sun, Y.; Diao, Z.; Liu, S.; Zhang, Z.; Xu, X. Sorption and desorption of phenanthrene on biodegradable poly(butylene adipate co-terephtalate) microplastics. Chemosphere 2019, 215, 25–32. [Google Scholar] [CrossRef]
- Ziino, G.; Nalbone, L.; Giarratana, F.; Romano, B.; Cincotta, F.; Panebianco, A. Microplastics in vacuum packages of frozen and glazed icefish (Neosalanx spp.): A freshwater fish intended for human consumption. Ital. J. Food Saf. 2021, 10, 9974. [Google Scholar] [CrossRef]
- Tang, S.; Lin, L.; Wang, X.; Feng, A.; Yu, A. Pb(II) uptake onto nylon microplastics: Interaction mechanism and adsorption performance. J. Hazard. Mater. 2020, 386, 121960. [Google Scholar] [CrossRef]
- Yu, F.; Yang, C.; Huang, G.; Zhou, T.; Zhao, Y.; Ma, J. Interfacial interaction between diverse microplastics and tetracycline by adsorption in an aqueous solution. Sci. Total Environ. 2020, 721, 137729. [Google Scholar] [CrossRef]
- Zhang, J.; Chen, H.; He, H.; Cheng, X.; Ma, T.; Hu, J.; Yang, S.; Li, S.; Zhang, L. Adsorption behavior and mechanism of 9-Nitroanthracene on typical microplastics in aqueous solutions. Chemosphere 2020, 245, 125628. [Google Scholar] [CrossRef]
- Sun, M.; Yang, Y.K.; Huang, M.L.; Fu, S.K.; Hao, Y.Y.; Hu, S.Y.; Lai, D.L.; Zhao, L. Adsorption behaviors and mechanisms of antibiotic norfloxacin on degradable and nondegradable microplastics. Sci. Total Environ. 2022, 807 Pt 3, 151042. [Google Scholar] [CrossRef]
- Calisto, V.; Jaria, G.; Silva, C.P.; Ferreira, C.I.A.; Otero, M.; Esteves, V.I. Single and multi-component adsorption of psychiatric pharmaceuticals onto alternative and commercial carbons. J. Env. Manag. 2017, 192, 15–24. [Google Scholar] [CrossRef] [Green Version]
- Zhou, Y.; Liu, X.; Wang, J. Ecotoxicological effects of microplastics and cadmium on the earthworm Eisenia foetida. J. Hazard. Mater. 2020, 392, 122273. [Google Scholar] [CrossRef]
- Zhang, X.; Wen, K.; Ding, D.X.; Liu, J.T.; Lei, Z.; Chen, X.X.; Ye, G.Z.; Zhang, J.; Shen, H.Q.; Yan, C.Z.; et al. Size-dependent adverse effects of microplastics on intestinal microbiota and metabolic homeostasis in the marine medaka (Oryzias melastigma). Environ. Int. 2021, 151, 106452. [Google Scholar] [CrossRef]
- Liang, B.; Zhong, Y.; Huang, Y.J.; Lin, X.; Liu, J.; Lin, L.; Hu, M.J.; Jiang, J.Y.; Dai, M.Z.; Wang, B.; et al. Underestimated health risks: Polystyrene micro- and nanoplastics jointly induce intestinal barrier dysfunction by ROS-mediated epithelial cell apoptosis. Part. Fibre Toxicol. 2021, 18, 20. [Google Scholar] [CrossRef]
- Visalli, G.; Facciolà, A.; Pruiti Ciarello, M.; De Marco, G.; Maisano, M.; Di Pietro, A. Acute and Sub-Chronic Effects of Microplastics (3 and 10 microm) on the Human Intestinal Cells HT-29. Int. J. Environ. Res. Public Health 2021, 18, 15833. [Google Scholar] [CrossRef] [PubMed]
- Richter, J.W.; Shull, G.M.; Fountain, J.H.; Guo, Z.; Musselman, L.P.; Fiumera, A.C.; Mahler, G.J. Titanium dioxide nanoparticle exposure alters metabolic homeostasis in a cell culture model of the intestinal epithelium and Drosophila melanogaster. Nanotoxicology 2018, 12, 390–406. [Google Scholar] [CrossRef] [PubMed]
- Fernández-Blanco, C.; Juan-García, A.; Juan, C.; Font, G.; Ruiz, M. Alternariol induce toxicity via cell death and mitochondrial damage on Caco-2 cells. Food Chem. Toxicol. 2016, 88, 32–39. [Google Scholar] [CrossRef] [PubMed]
- Wang, Y.L.; Lee, Y.H.; Hsu, Y.H.; Chiu, I.J.; Huang, C.C.Y.; Huang, C.C.; Chia, Z.C.; Lee, C.P.; Lin, Y.F.; Chiu, H.W. The kidney-related effects of polystyrene microplastics on human kidney proximal tubular epithelial cells HK-2 and male C57BL/6 mice. Environ. Health Perspect. 2021, 129, 57003. [Google Scholar] [CrossRef]
- Hesler, M.; Aengenheister, L.; Ellinger, B.; Drexel, R.; Straskraba, S.; Jost, C.; Wagner, S.; Meier, F.; von Briesen, H.; Büchel, C.; et al. Multi-endpoint toxicological assessment of polystyrene nano- and microparticles in different biological models in vitro. Toxicol. Vitr. 2019, 61, 104610. [Google Scholar] [CrossRef]
- Yu, Y.; Mo, W.Y.; Luukkonen, T. Adsorption behaviour and interaction of organic micropollutants with nano and microplastics—A review. Sci. Total Environ. 2021, 797, 149140. [Google Scholar] [CrossRef]
- Singh, N.; Bhagat, J.; Tiwari, E.; Khandelwal, N.; Darbha, G.K.; Shyama, S.K. Metal oxide nanoparticles and polycyclic aromatic hydrocarbons alter nanoplastic’s stability and toxicity to zebrafish. J. Hazard. Mater. 2021, 407, 124382. [Google Scholar] [CrossRef]
- Wang, Q.Q.; Bai, J.L.; Ning, B.; Fan, L.X.; Sun, T.Q.; Fang, Y.J.; Wu, J.; Li, S.; Duan, C.H.; Zhang, Y.C.; et al. Effects of bisphenol A and nanoscale and microscale polystyrene plastic exposure on particle uptake and toxicity in human Caco-2 cells. Chemosphere 2020, 254, 126788. [Google Scholar] [CrossRef]
- Vagner, M.; Boudry, G.; Courcot, L.; Vincent, D.; Dehaut, A.; Duflos, G.; Huveta, A.; Tallec, K.; Zambonino-Infante, J.L. Experimental evidence that polystyrene nanoplastics cross the intestinal barrier of European seabass. Environ. Int. 2022, 166, 107340. [Google Scholar] [CrossRef]
- Lagergren, S. About the theory of so-called adsorption of soluble substances. K. Sven. Vetensk. Handl. Band 1898, 24, 1–39. [Google Scholar]
- Ho, Y.S.; Ng, J.C.Y.; McKay, G. Kinetics of pollutant sorption by biosorbents. Separ. Purif. Method. 2000, 29, 189–232. [Google Scholar] [CrossRef]
- Morris, J.C.; Weber, W.J., Jr. Removal of biologically-resistant pollutants from waste waters by adsorption. Adv. Water Poll. Res. 1964, 269, 231–266. [Google Scholar]
- Bangham, A.D.; Standish, M.M.; Watkins, J.C. Diffusion of univalent ions across the lamellae of swollen phospholipids. J. Mol. Biol. 1965, 13, 238–252. [Google Scholar] [CrossRef]
- Langmuir, I. The adsorption of gases on plane surfaces of glass, mica and platinum. J. Am. Chem. Soc. 1918, 40, 1361–1403. [Google Scholar] [CrossRef] [Green Version]
- Freundlich, H. Ueber die adsorption in loesungen. Z. Phys. Chem. 1996, 57, 385–470. [Google Scholar]
- Rey, F.; Calle, E.; Casado, J. Study of the effects of concentration and pH on the dissociation kinetics of Fe(II)-fulvic acid complexes. Int. J. Chem. Kinet. 1998, 30, 63–67. [Google Scholar] [CrossRef]
Figure 2.
Effects of reaction time on the adsorption and desorption of NP in PS−MPs. (A) Adsorption process of NP solutions (4 mg/L) with 20 μg/mL PS−MPs with different particle size (0.1, 1, 10, 50, and 100 μm). (B) Effect of different initial NP concentrations (4 and 20 mg/L) on time-sorption capacity trends. (C) The desorption behavior of NP on the PS−MPs in the water environment (pH 7.0, 3.5% sodium chloride, 25 ± 2 °C and 150 r/min) and the warm-blood body gastrointestinal environment (pH = 2.8, 15.5 mmol/L sodium taurocholate, 10 g/L of pepsin, 35 ± 2 °C and 100 r/min) was investigated.

Figure 4.
Effects of PS-MPs, NP, and synergistics on the cell viability of Caco-2 cells. Cells were incubated alone with different particle sizes of 500 mg/L PS-MPs (A) and different concentrations of NP (B) for 12 and 48 h. The effect of 0.1 μm PS-MPs alone and in combination with NP on Caco-2 cell viability at 12 h and 48 h (C). Cell viability was measured by CCK-8 assay. * indicates the significant difference between the treatment group and the control group (* p < 0.05, ** p < 0.001, *** p < 0.0005). # indicates the significant difference between the marked groups (# p < 0.05, ### p < 0.0005).

Figure 6.
The mitochondrial membrane potential depolarization of Caco-2 cells treated with 40 μmol/L NP, 500 mg/L PS-MPs (with different particle sizes), and 0.1 μm PS-MPs that absorbed NP at 48 h; the fluorescence values were calculated by Image J software (National Institute of Mental Health, USA) and the ratio of red to green fluorescence reflected the degree of mitochondrial membrane depolarization (2). * indicates the significant difference between the treatment group and the control group (** p < 0.001, *** p < 0.0005). # indicates the significant difference between the marked groups (### p < 0.0005).

Figure 7.
Effects of PS-MPs and NP on the generation of the intracellular ROS of Caco-2 cells at 48 (A) and 72 h (B), expressed as a ratio to the control group. * indicates the significant difference between the treatment group and the control group (* p < 0.05, *** p < 0.0005). # indicates the significant difference between the marked groups (## p < 0.001, ### p < 0.0005).

Table 2.
Kinetic parameters of NP adsorption by the PS-MPs obtained from the pseudo-second-order, Intra-particle diffusion and Bangham models.
Table 2.
Kinetic parameters of NP adsorption by the PS-MPs obtained from the pseudo-second-order, Intra-particle diffusion and Bangham models.
| Kinetic Model | Particle Size (μm) | |||||
|---|---|---|---|---|---|---|
| 0.1 | 1 | 10 | 50 | 100 | ||
| Pseudo-second-order model | ||||||
| k2 (g·mg−1·h−1) | 127.567 | 27.779 | 18.979 | 66.961 | 13.285 | |
| qe (mg·g−1) | 193.923 | 193.870 | 193.859 | 193.851 | 189.560 | |
| R2 | 0.9998 | 0.9998 | 0.9997 | 0.9982 | 0.9987 | |
| Intra-particle diffusion model | ||||||
| kip (mg·g−1 min−1) | k1p | 2.10013 | 0.15685 | 0.26952 | 1.30454 | 0.15907 |
| k2p | 0.20992 | 0.04903 | −0.11312 | 0.02179 | −0.55142 | |
| k3p | −0.01188 | −0.09727 | −0.01576 | −0.12874 | 0.19729 | |
| C (mg·g−1) | C1 | 191.949 | 192.81716 | 192.65587 | 192.38299 | 188.71922 |
| C2 | 193.385 | 193.36525 | 194.11567 | 193.68406 | 191.49437 | |
| C3 | 193.944 | 194.37526 | 193.43371 | 194.81593 | 181.1686 | |
| R2 | 0.9875 | 0.4645 | 0.8277 | 0.9451 | 0.2302 | |
| Bangham model | ||||||
| k | 6.35439 | 5.47685 | 5.40951 | 6.52911 | 7.89394 | |
| z | 0.11868 | 0.02838 | 0.03225 | 0.12528 | 0.3395 | |
| R2 | 0.9519 | 0.2615 | 0.5853 | 0.7581 | 0.4534 | |
Table 3.
Langmuir and D-R parameters for NP sorption by PS-MPs with particle size of 0.1 μm.
| Isotherm Model | |||||||||
|---|---|---|---|---|---|---|---|---|---|
| Langmuir Model | |||||||||
| qmax (mg·g−1) | KL | R2 | RL | ||||||
| 1 | 4 | 10 | 20 | 30 | 40 | 50 | |||
| 1665.6118 | 3.9657 | 0.9880 | 0.2014 | 0.0593 | 0.0246 | 0.0125 | 0.0083 | 0.0067 | 0.0050 |
| D-R model | |||||||||
| qmax (mg·g−1) | KD-R (mol2·KJ−2) | R2 | E | ||||||
| 19.5600 | 1.52938 × 10⁸ | 0.8062 | 5.717 × 10⁻⁵ | ||||||
Publisher’s Note: MDPI stays neutral with regard to jurisdictional claims in published maps and institutional affiliations. |
© 2022 by the authors. Licensee MDPI, Basel, Switzerland. This article is an open access article distributed under the terms and conditions of the Creative Commons Attribution (CC BY) license (https://creativecommons.org/licenses/by/4.0/).
Share and Cite
MDPI and ACS Style
Ding, F.; Zhao, Q.; Wang, L.; Ma, J.; Song, L.; Huang, D. Adsorption Behavior of Nonylphenol on Polystyrene Microplastics and Their Cytotoxicity in Human Caco-2 Cells. Water 2022, 14, 3288. https://doi.org/10.3390/w14203288
AMA Style
Ding F, Zhao Q, Wang L, Ma J, Song L, Huang D. Adsorption Behavior of Nonylphenol on Polystyrene Microplastics and Their Cytotoxicity in Human Caco-2 Cells. Water. 2022; 14(20):3288. https://doi.org/10.3390/w14203288
Chicago/Turabian StyleDing, Fangfang, Qianqian Zhao, Luchen Wang, Juan Ma, Lingmin Song, and Danfei Huang. 2022. "Adsorption Behavior of Nonylphenol on Polystyrene Microplastics and Their Cytotoxicity in Human Caco-2 Cells" Water 14, no. 20: 3288. https://doi.org/10.3390/w14203288
Note that from the first issue of 2016, this journal uses article numbers instead of page numbers. See further details here.