Article

Effects of Environmental Conditions and Bed Configuration on Oxygen Transfer Efficiency in Aerated Constructed Wetlands

1
Centro de Innovación en Ingeniería Aplicada (CIIA), Departamento de Obras Civiles, Facultad de Ciencias de la Ingeniería, Universidad Católica del Maule, Av. San Miguel 3605, Talca 346000, Chile
2
Facultad de Ingeniería, Campus Nueva Granada, Universidad Militar Nueva Granada, Km 2, vía Cajicá, Zipaquirá 250247, Colombia
3
School of Mechanical Engineering, University of Victoria, Victoria, BC V8P 5C2, Canada
4
Department of Biology-Aquatic Biology, Aarhus University, Ole Worms Allé 1, 8000 Aarhus, Denmark
5
WATEC Aarhus University Centre for Water Technology, NyMunkegade, Bldg. 1521, 8000 Aarhus, Denmark
6
Civil and Environmental Engineering Department, University of California, Irvine, CA 92697-2175, USA
7
Water-Energy Nexus Center, University of California, Irvine, CA 92697-2175, USA
*
Author to whom correspondence should be addressed.
Water 2022, 14(20), 3284; https://doi.org/10.3390/w14203284
Submission received: 12 September 2022 / Revised: 7 October 2022 / Accepted: 17 October 2022 / Published: 18 October 2022
(This article belongs to the Special Issue Improved Constructed Wetlands)

Abstract

:
This research evaluated the oxygen transfer efficiency in beds to be used as aerated constructed wetlands. The research methods included oxygen transfer efficiency evaluations in several bed configurations using diffused aeration systems. Experiments were conducted at two locations with different environmental conditions: a) Talca (Chile), 120 m above sea level (m.a.s.l.), 0.99 Atm and b) Cajicá (Colombia), 2550 m.a.s.l., 0.76 Atm. A column with only clean water and three bed configurations representing aerated constructed wetlands were evaluated. These configurations included: (a) coarse gravel, (b) coarse gravel with an empty core in the middle (inner container), and (c) fine gravel. Three airflow rates were evaluated: (a) low, 0.7 L/min; (b) medium, 2.5 L/min; and (c) high, 3.6 L/min. The overall oxygen mass transfer coefficient, standard oxygen transfer rate, and standard oxygen transfer efficiency were the variables calculated from the oxygen transfer evaluation tests. The research results indicated that in diffused aeration systems, oxygen transfer efficiency was negatively influenced by environmental conditions, particularly altitude, which limits the driving force for oxygen transfer into water. Furthermore, the results showed that the size of the gravel used in the bed is related to the oxygen transfer efficiency: the larger the gravel size, the higher the oxygen transfer, regardless of the altitude. Finally, research regarding oxygen transfer in aerated constructed wetlands has signaled the need for a standard procedure for aeration testing, and this work suggests a new methodology.

1. Introduction

Constructed wetlands have been used as treatment alternatives for different kinds of wastewater [1,2,3]. Although constructed wetland technology is used as a nature-based solution, mechanical aeration has been used to intensify and consequently increase the removal efficiency of pollutants or to remove specific contaminants (mainly organics and nitrogen) [4]. In addition, mechanical aeration reduces the land requirement of the technology and can be used to retrofit existing passive constructed wetlands [5,6]. Due to their success, more than 500 systems are currently in operation around the world [6].
In the wastewater treatment industry, diffused aeration has been widely used in the activated sludge process. Aeration systems design fundamentals, such as aeration system operations and maintenance, and factors affecting oxygen transfer efficiency in diffused aeration have been studied in depth [7,8,9]. Recent developments include the dynamic simulation of oxygen transfer efficiency under process conditions [9] and novel advances in diffusers fouling nature [10]. Standard procedures for oxygen transfer testing in clean water [11] and in process water for suspended-growth biological systems [12] are also available. Oxygen transfer testing in clean water is a common practice in diffused aeration system performance evaluations, with clean water as the reference or the best case [7].
The increase in aerobic kinetics through the aeration of constructed wetlands can be considered a way to intensify this natural process with recent developments (last 25 years), compared to an activated sludge process (last century). However, in both processes, practitioners require specific knowledge regarding oxygen transfer from diffused aeration systems [6]. The standard procedures for the evaluation of oxygen transfer in clean water, included in the American Society of Civil Engineers (ASCE) [11], are the overall oxygen gas transfer coefficient (KLa; 1/h), the standard oxygen transfer rate (SOTR; kgO2/h), and the standard oxygen transfer efficiency (SOTE; %), all of which can also be applied to constructed wetland practices [6].
The application of experimental methods for the measurement of oxygen transfer in clean water [11] allows the calculation of KLa as follows:
C = C* − (C* − C0) exp(−KLa)
where C = dissolved oxygen concentration, mg/L, C* = steady state dissolved oxygen saturation concentration, mg/L, C0 = dissolved oxygen concentration at time zero, mg/L, and KLa = liquid-side mass transfer coefficient, 1/h.
The primary result of the oxygen transfer evaluation test is expressed as the SOTR. The oxygen transfer rate (OTR) quantifies the amount of oxygen that the aeration system can supply to the water per unit time [9,11] according to Equation (2):
OTR = KLa (DOsat − DO) V
where KLa is the liquid-side mass transfer coefficient (h−1); DOsat is dissolved oxygen in water at saturation (mg/L), and V is water volume (m3). Then, under standard conditions, as presented per Rosso [9] (clean water; new diffusers, no fouling: F = 1; initial dissolved oxygen concentration = 0 mg/L; water temperature = 20 °C; and standard atmospheric pressure = 101.3 KPa), the standard oxygen transfer rate, SOTR, can be derived from Equation (3):
SOTR = KLa20 × C*∞20 × VTk × 24/1000
For fine bubble diffusers, the oxygen transfer efficiency (OTE, %) is defined as follows in Equation (4):
OTE = OTR/WO2 = (O2,in − O2,out)/O2,in
where WO2 is the mass flow of oxygen fed to the aeration tank (KgO2/h), and O2,in and O2,out represent mass fluxes of oxygen in and out of the clean water volume. More details on oxygen transfer evaluation can be found in reference [9].
On the other hand, advances in aerated constructed wetlands resulted from different approaches, from those commonly considered in aeration systems for activated sludge processes to those found in diffused aeration systems. However, there is little information about oxygen transfer in the context of aerated constructed wetland applications [13,14,15,16]. The lack of developments in aeration system design procedures, aeration control strategies, aeration system maintenance procedures (mainly including blowers and diffusers), and standardized procedures for evaluating oxygen transfer in aerated constructed wetlands have been drivers against the selection of diffused aeration technologies in constructed wetland practice. In addition, because aeration is an energy-intensive process, a better understanding of dissolved oxygen (DO) transfer from the gas phase to the liquid phase in aerated constructed wetland applications will certainly improve energy efficiency [17].
Aerated constructed wetlands use a support medium based on different gravel sizes that should have an impact in the aeration process [18,19,20]. The gravel medium implies aeration process particularities in aerated constructed wetland oxygen transfer rates, fouling phenomena, and mixing characteristics inside the wetland bed. For example, in aerated constructed wetlands SOTE values below 5% have been reported [15,16], different to SOTE reported for diffused air aeration systems, which vary between 4% and 30% [21]. This fact reveals the necessity to study in depth the aeration process in aerated treatment wetlands.
Thus, this paper aims to evaluate the oxygen transfer efficiency when diffused aeration is employed, considering the different gravel sizes and distributions, airflow rates, and environmental conditions proposed for beds in aerated constructed wetlands.

2. Materials and Methods

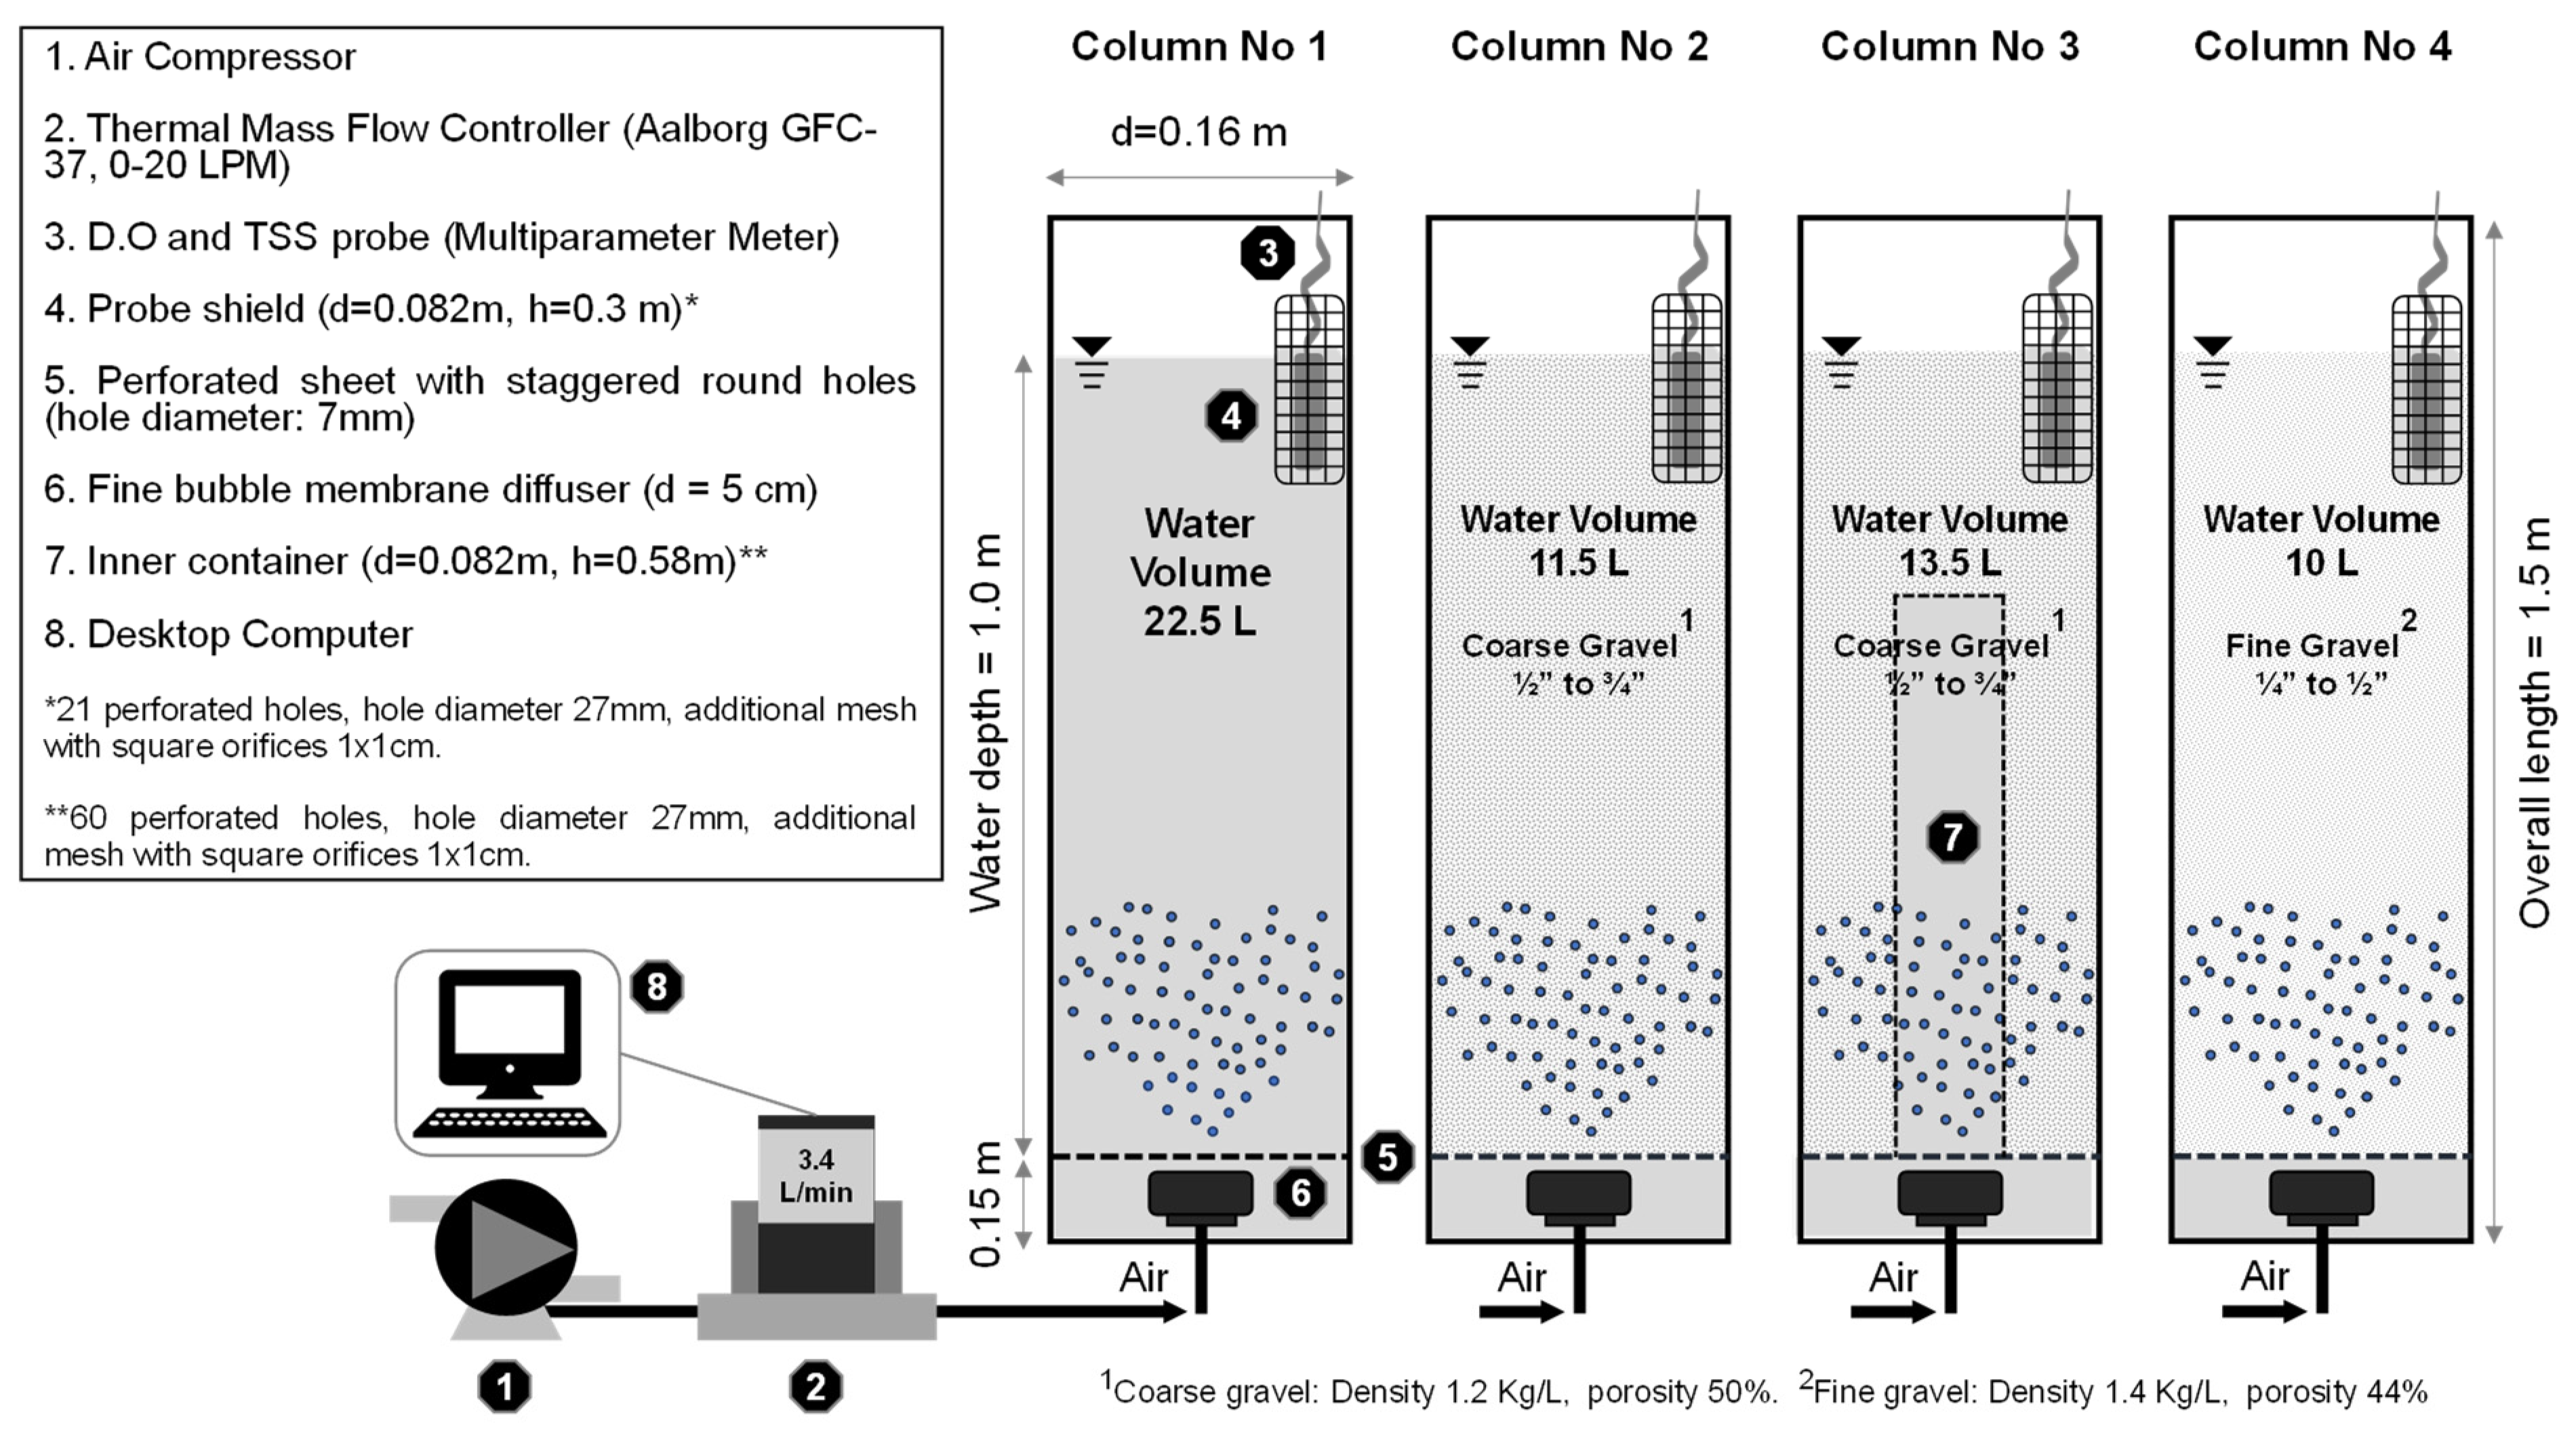
2.1. Experimental Setup

To conduct the oxygen transfer efficiency measurement, three columns representing different bed configurations of actively aerated filters (beds for constructed wetlands) were used. Each column was different from the others in terms of gravel size and inner space above a fine bubble membrane diffuser. Other physical characteristics, such as column diameter, water column depth, and aeration system configuration, were kept constant (Figure 1: columns 2, 3, and 4). A column without gravel and containing only water was also evaluated as blank (Figure 1: column 1). The constructive details and the main components of the evaluated columns are presented in Figure 1.
All experimental columns were built using 0.16 m diameter PVC pipes with a total height of 1.5 m. A total water depth of 1.15 m was used for the tests (Figure 1). Columns 2, 3, and 4 were filled with typical gravel used for construction according to local availability. Characteristics of the gravel employed were: (a) porosity, between 40–50%, (b) density, between 1200–1400 kg/m3. Furthermore, the air diffuser was installed in an empty space in the bottom of each column, separated from the gravel by a perforated sheet with staggered round holes (hole diameter, 7 mm). Finally, the inner container was installed exactly above the air diffuser (Figure 1). The inner container was built using a 0.08 m diameter PVC pipe with a total height of 0.58 m (Figure 1). The wall of the cylindrical inner container was perforated with 60 evenly distributed 27 mm diameter holes, and a stainless-steel mesh of 0.01 m aperture width was installed inside the inner container to prevent gravel entry. At the top, the inner container was closed with a PVC cap.

2.2. Testing Description and Locations

Oxygen transfer tests were conducted in situ at facilities in Chile and Colombia (South America). Location details and environmental testing conditions are presented in Table 1. The definition of evaluated airflow rates followed two criteria: (a) as a lower bound, the specific airflow rate was 0.7 L/min (2.1 m3/m2-h), considering guidelines for actively aerated filters from German guidelines [19], and (b) as a higher bound, the value was 3.6 L/min (10.7 m3/m2-h); this value was extrapolated, taking as a reference a design example of an aeration system for an activated sludge process [8].

2.3. Aeration System

The experimental setup of the aeration system included a compressed airline (up to 120 L/min), a thermal mass flow controller (Aalborg Instruments & Controls, Inc., Orangeburg, NY, USA), tubing, fittings, and an ethylene propylene diene monomer (EPDM) fine pore membrane diffuser (diameter: 50 mm or 5 cm, Figure 1, SSI Aeration, Inc., Arlington, NY, USA). The pilot diffuser housings were custom assembled using PVC components and round coupons of new fine-pore EPDM diffusers (SSI Aeration, Inc., NY, USA). This configuration followed as a reference a diffused aeration setup typically used in activated sludge processes for wastewater treatment [9].

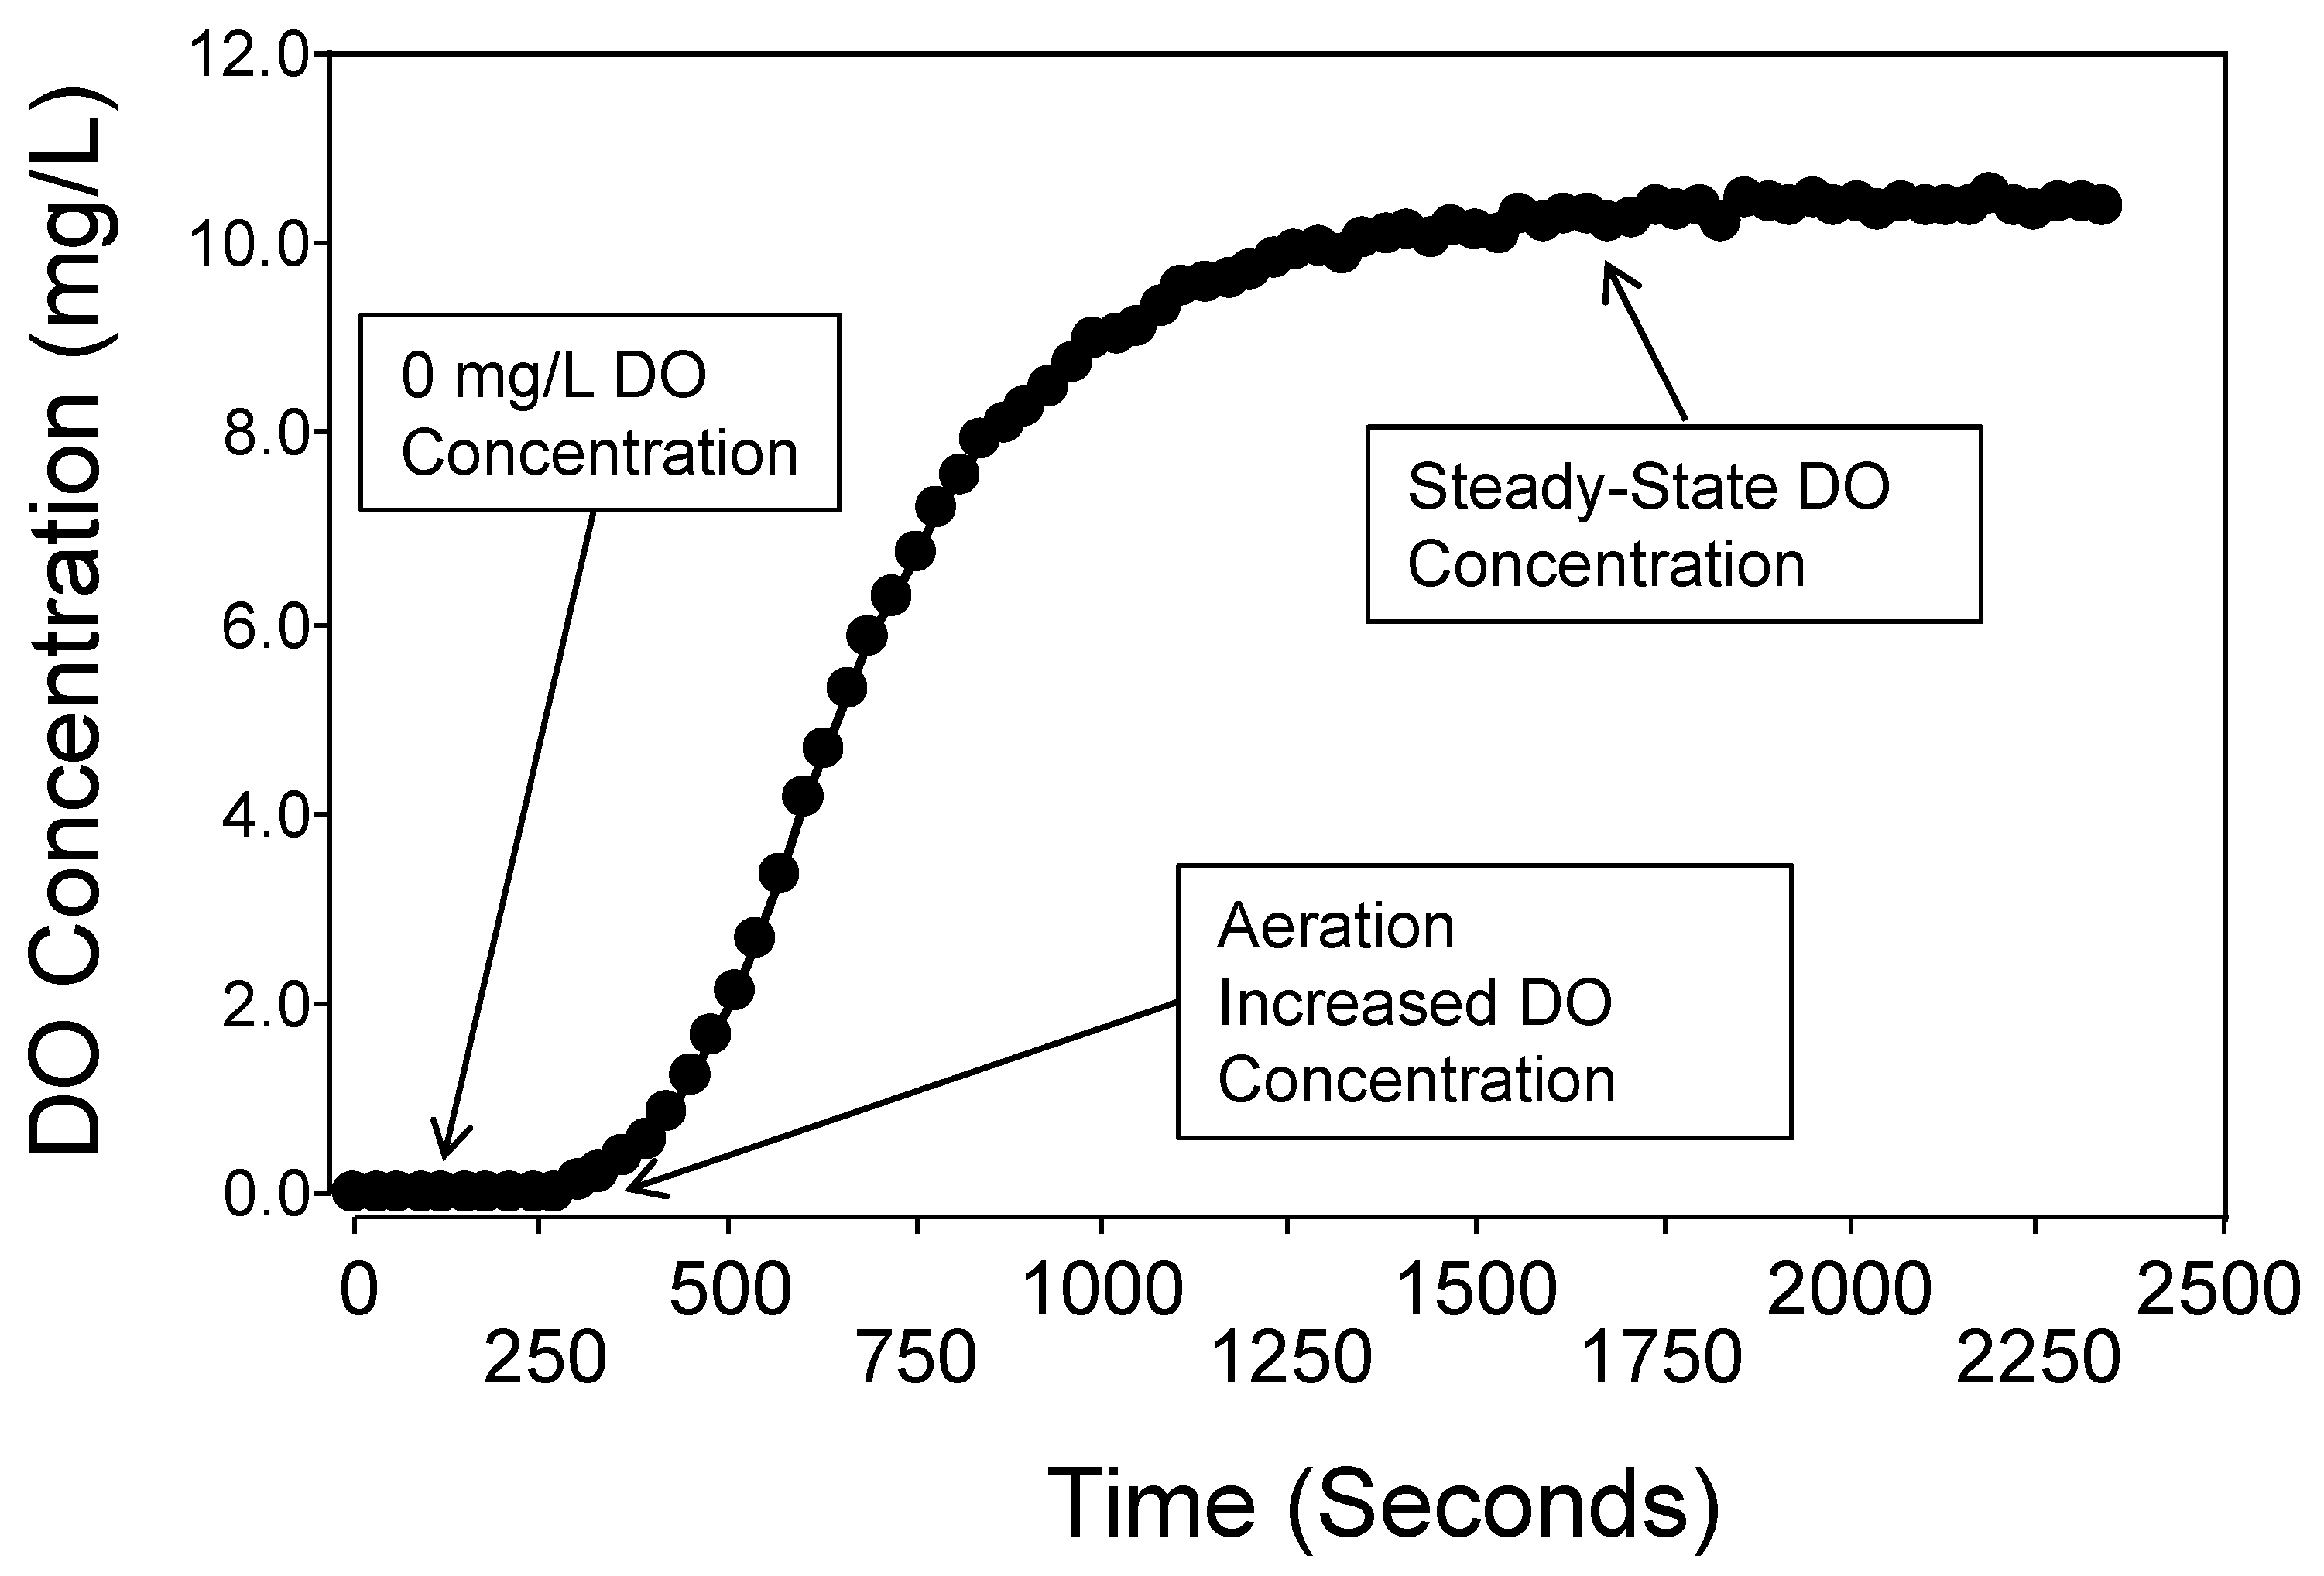
2.4. Data Collection and Instrumentation

Process variables were measured and logged in a plain-text archive at 30 s intervals (Data Logger Lascar EL USB 4). Data collected included water temperature, total dissolved solids, DO concentration, and airflow rate. Water quality parameters were measured with specific electrodes using a multi-parameter Portable Hanna HI 9829. (Hanna Instruments, Woonsocket, RI, USA) Each oxygen transfer evaluation test presented a DO profile following the trend exemplified in Figure 2. This pattern reflects the reaeration process, moving from the absence of DO to the steady state, (i. e., saturation). Airflow regulation was automated using a microcontroller (In-house fabrication) and a thermal mass flow controller (analogue signal, 0-5VDC; airflow controller ALBORG CFC37) (Aalborg Instruments & Controls, Inc., NY, USA). A thermal mass flow controller was used to guarantee that low, medium, and high airflow rate scenarios were comparable in both locations. This air flow measurement technology compensated for air density variations. Figure 1 and Table 1 include details of the references and locations of the sensors and controller.

2.5. Oxygen Transfer Evaluation

Measurements of oxygen transfer in clean water, as described in ASCE [11], were implemented throughout all aeration tests. The test method is based on the removal of DO from the water volume by sodium sulfite (Na2SO3) and cobalt chloride (CoCl2). The DO is reduced to zero via oxidization with sodium sulfite catalyzed with cobalt. Once the DO has been reduced to zero, diffused aeration starts, and as a consequence, the DO returns to a liquid; then, the DO concentration was recorded at 30 s intervals. The test ends once the DO reaches saturation and holds a constant value. The data collected from the reoxygenation test were processed using the ASCE-approved DO Par Ver. 3.0.3 [22]. The results of this tool were different variables representing oxygen transfer to the water: (KLa, 1/h), SOTR (kg/h), and SOTE (%). The KLa, SOTR, and SOTE were calculated according to Equations (1) to (4), described in the introduction section. Normalized STOR and SOTE were calculated using results from Equations (3) and (4), respectively, and then, the results were divided by the water volume contained in each column. Each oxygen transfer test was repeated three times.

2.6. Statistical Analysis

Statistical analysis was conducted to evaluate the calculated parameters KLa, SOTR, and SOTE. The previously mentioned parameters were selected as a representative of oxygen transfer evaluation in diffused aeration systems for wastewater treatment practice [9]. To compare the influence of each configuration (columns 1, 2, 3, and 4) for each airflow rate (low, medium, and high) and to compare the influence of airflow rate (low, medium, and high) for each configuration (columns 1, 2, 3, and 4) at each location (Table 1), a non-parametric Kruskal—Wallis test was employed. To compare the influence of local environmental conditions (atmospheric pressure) at each location (Table 1), the different configurations (columns 1, 2, 3, and 4) and the airflow rate (low, medium, and high), a non-parametric Wilcoxon test was employed. All statistical analysis tests were performed using INFOSTAT V. 2019 [23] with a significance level of α = 0.05.

3. Results

3.1. KLa, SOTR, and SOTE for Different Bed Configurations and Environmental Conditions (Altitude)

The results from the oxygen transfer rate evaluation tests (KLa, SOTR, and SOTE) for each location and bed configuration are presented in Table 2. The results of the statistical test comparison, considering bed configurations and locations, are presented in Table 3.
Mean KLa range were similar between locations. Location 1 (lower altitude above sea level and higher atmospheric pressure) varied between 11 1/h and 33 1/h, and location 2 (higher altitude above sea level and lower atmospheric pressure) varied between 4 and 22 1/h (Table 1). When the KLa behavior between the two locations was compared, non-significant differences (p < 0.05) at medium and high air flow could be found for columns 2 and 3 (Table 2). Therefore, the higher results achieved in this study can be explained by the differences between the evaluated configurations. Furthermore, as a consequence of increasing the airflow rate from low to high, in each location and configuration, the average KLa values increased in a significant way (p < 0.05) (Table 2). Similar results were presented in Du et al. [24], where increasing the airflow rate improved KLa at 20 °C in a significant way (p < 0.05) when experimenting on fine pore diffusers with clean water. When comparing the columns (Table 3), the results showed that for medium air flow at location 2, a non-significant difference (p > 0.05) could be found.
Mean SOTR values vary between 1.0 and 6.5 kgO2/h for location 1 and between 0.8 and 4.5 kgO2/h for location 2 (Table 2). Furthermore, the results showed that for each location and configuration, SOTR values followed a similar trend as KLa; the values increased significantly (p < 0.05) when airflow increased, with the only exception being column 1 in location 1 and column 2 in location 2 (Table 2). Comparisons between the columns showed that the SOTR only shows a non-significant difference (p > 0.05) for location 1 when medium airflow was employed (Table 3). In addition, when comparisons between locations were made, the trend was as follows: column 3 showed no significant differences (p > 0.05) for all the different airflows tested (Table 3). Column 3 was the only configuration with an inner container above the aeration system and coarse gravel (Figure 1). Additionally, when medium airflow was employed, all columns showed non-significant differences (p > 0.05) between the two locations (Table 3).
Contrary to the KLa and SOTR, the SOTE decreased in a significant way (p < 0.05) when the airflow was increased in each location (except for column 1 at location 1 and column 2 at location 2) (Table 2). In the same way as the SOTR, the SOTE only showed a non-significant difference (p > 0.05) between the columns in location 1, when medium airflow was employed. The same tendency was demonstrated by the SOTE compared to the SOTR; (a) when comparisons between locations were made, column 3 showed non-significant differences (p > 0.05) for all airflows tested (Table 3), and (b) when medium airflow was employed, all configurations showed non-significant differences (p > 0.05) between the two locations (Table 3). The SOTE values in Table 2 achieved in these experiments varied between 3% and 20%, which are similar to a typical range between 10% and 30% reported for activated sludge systems using fine bubbles (the same used in the experimental system) [21].

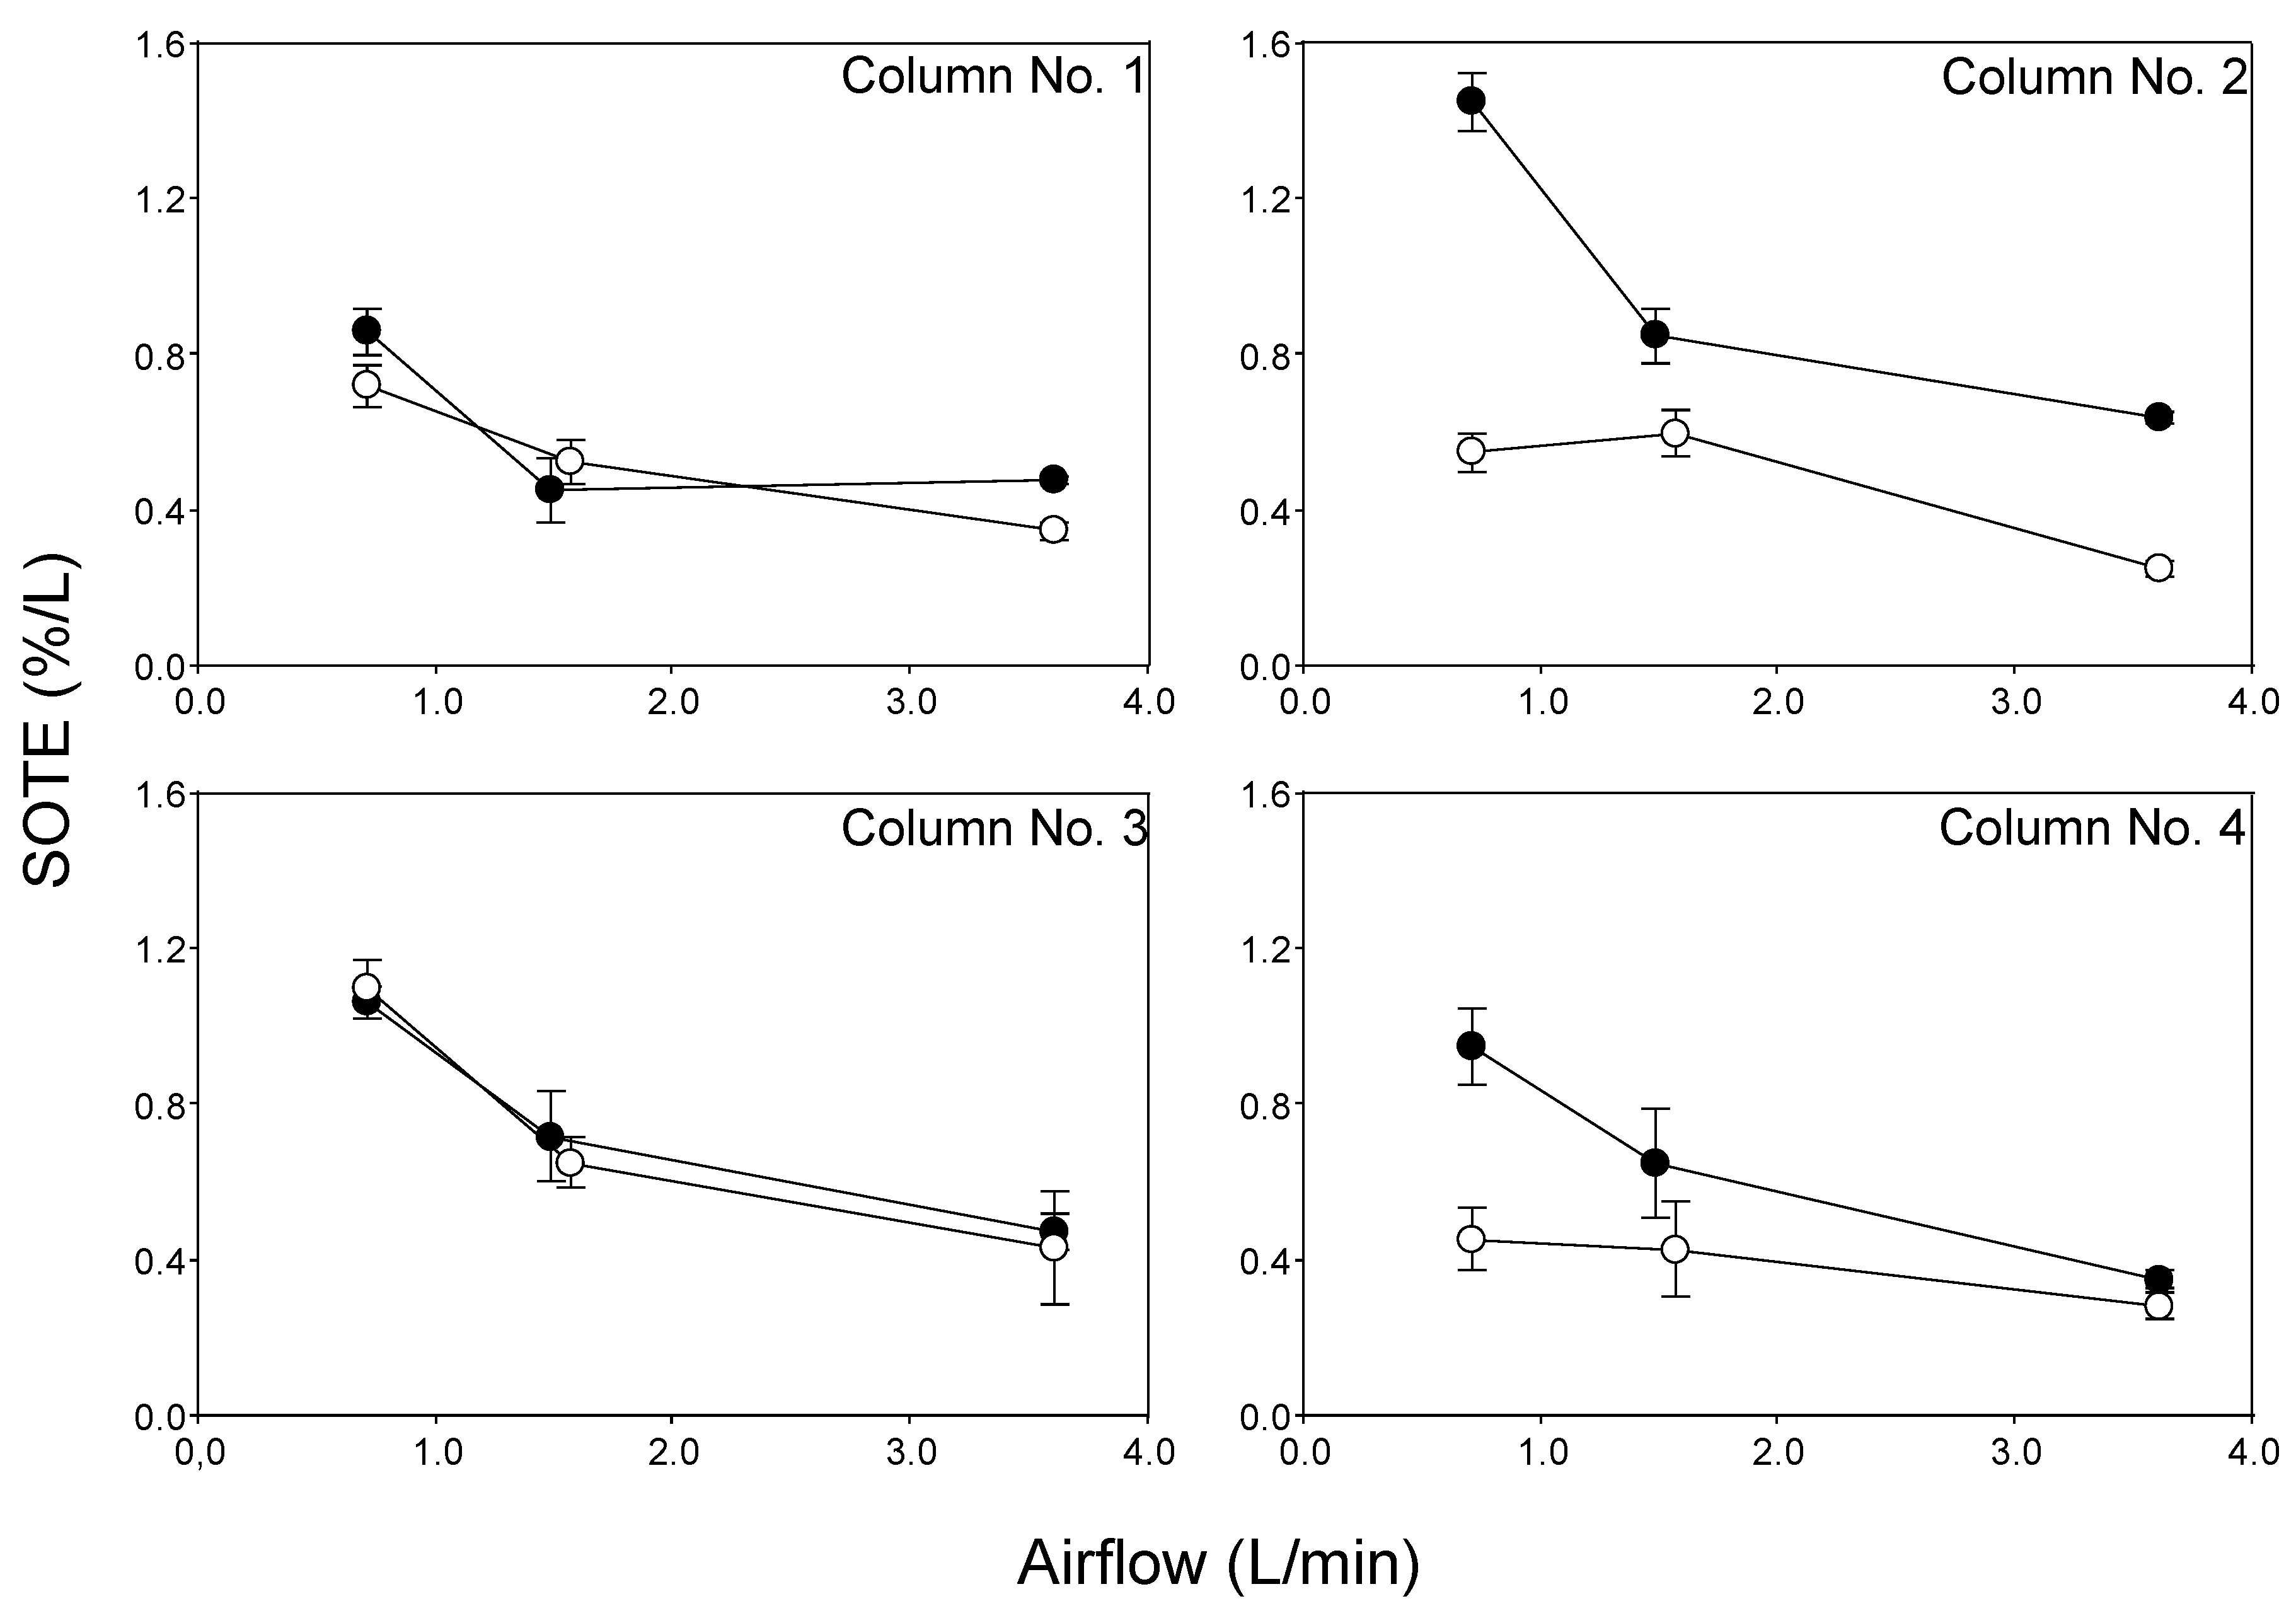
3.2. Normalized SOTR and SOTE

Considering the different volumes of water contained in each column, normalization of the SOTR and SOTE was made per liter of water contained in each column. Normalized values for the SOTR and SOTE are presented in Figure 3 and Figure 4.
For the two locations, the normalized SOTR in Figure 3 increases linearly from around 0.1 gO2/(h-L) up to 0.2–0.3 gO2/(h-L) for all columns (except column 2 in location 1, up to 0.4 gO2/(h-L)), when airflow increases. In addition, Figure 3 shows similar behavior in the normalized SOTR for columns 3 and 4 between the two locations; however, column 3 shows higher values for the different airflows. Columns 3 and 4 have different gravel sizes and airflow distributions, because Column 3 includes an inner container in the middle.
In the case of SOTE, Figure 4 shows that for all the columns and locations, the normalized SOTE decreases when airflow increases. This decrease is higher in columns 2, 3, and 4, showing the effect of inclusion of any element in the bed. In addition, for columns 3 and 4, the normalized SOTE decreases from around 1.2 %/L at lower airflow (0.7 L/min) to around 0.4 %/L at higher airflow (3.6 L/min). This suggests that the normalized SOTE decreased almost three times while the airflow increased around five times. In the case of column 3, similar behaviors in values for the two locations could be found despite a difference of 25 times in altitude and 25% in atmospheric pressure. This result suggests that the proposed configuration for constructing a bed of constructed wetland in column 3 can be used regardless of the location in terms of altitude above sea level and thus in terms of atmospheric pressure.
The results in Figure 2 and Figure 3 show that when the airflow increases for all configurations, the normalized SOTR increases, but the normalized SOTE is reduced in all columns. The reason for the reduced efficiency at a higher airflow rate can be explained through the aggregation of bubbles, which decreases the total transfer area toward the water phase and increases the bubble rising times [13].

4. Discussion

The results of the oxygen transfer efficiency evaluations in diffused aeration systems carried out according to standardized methodology as outlined by the ASCE [11], comparable for tests and systems with equivalent characteristics. Factors affecting oxygen transfer to water include the driving force for the transfer of oxygen to water (influenced by atmospheric pressure and water temperature), reactor configuration (depth and airflow rate per diffuser), diffusers (physical characteristics and distribution), mixing regime, and water quality (presence of surfactants) [7,25,26]. Considering these factors, the comparison of test results is applicable only if the test, geometry, and process conditions are similar. This concern must be considered when comparisons of oxygen transfer efficiency test results from different locations are required. In the present research, tests were carried out under different environmental conditions. However, the reactors evaluated had the same physical characteristics. An analysis of the results for the different response variables considered is presented below.

4.1. Influence of Airflow Rate

Oxygen transfer efficiency decreased as the airflow rate increased (Table 2). This trend was present in all the evaluated columns and locations. As the airflow rate per diffuser increased, so did the bubble size, and therefore, their ascending speed increased, resulting in decreases in their residence time. This relationship between airflow rate and the bubble ascending speed has been previously documented [9]. The influence of airflow rate on SOTE for the evaluated column configurations accounted for variations ranging from 1.60 to 2.55 times for high-altitude conditions and between 1.79 and 2.71 times for low-altitude conditions. As expected, an increase in airflow resulted in a decrease in SOTE (Table 2).
Considering the relationship between airflow rate, oxygen transfer efficiency, energy demand for blower operation, and altitude, the phenomena depicted herein appear to be a relevant concern when designing and operating aerated constructed wetlands. The results show a clear tendency for the effect of the oxygen transfer efficiency (measured as SOTE) to decrease as the airflow rate increases for both locations (Table 2). This relationship is a consequence of the airflow rate per porous membrane unit area. The diffuser area was constant in all oxygen transfer tests; the higher the airflow rate per diffuser, the greater the bubble size. Consequently, a change in the surface-area-to-volume ratio was inversely proportional to the airflow rate. This situation was maintained, despite the inclusion of gravel and an inner container over the aeration system (columns 2, 3, and 4), modifications that clearly showed a positive effect on oxygen transfer in comparison to the column with only water (column 1), but these modifications did not have a positive effect on the tendency of SOTE when the airflow rate increase.

4.2. Influence of Environmental Conditions

The results of the tests developed in different locations (Table 1) were analyzed to assess the effect of environmental conditions on oxygen transfer efficiency to water. The results are consistent with previously depicted relationships between environmental conditions and diffused aeration into water [27]. As dissolved oxygen saturation is a function of atmospheric pressure and water temperature, the driving force for oxygen transfer into water is exclusively dependent on local environmental conditions. The larger the driving force, the greater the oxygen transfer [27]. The results presented herein are limited to gravel beds as recommended for aerated constructed wetlands (Table 2). Aside from the bubble rising speed, which was associated with airflow rate, a location-dependent trend was depicted from the results: location 2 (higher elevation and lower atmospheric pressure) exhibited lower oxygen transfer efficiencies than location 1 (lower elevation and higher atmospheric pressure). This trend can be explained by the correlation between oxygen solubility and the driving force for oxygen transfer to water. Oxygen transfer tests were carried out at two different locations under different atmospheric pressures; the elevation difference of 25 times between locations 1 and 2 caused a 25% reduction in atmospheric pressure (Table 1). Oxygen solubility was inversely correlated with water temperature and directly correlated with atmospheric pressure [28,29]; therefore, location 1 had higher values for oxygen solubility (Table 1). Baquero et al. [27] presented a detailed review of environmental factors, including atmospheric pressure, that affect oxygen solubility in a wastewater treatment context.
The altitude difference had a significant effect (p < 0.05) on the results of KLa, SOTR, and SOTE for all columns at low airflow (except Column 3) and for columns 1 and 4 at high airflow. However, at medium airflow, altitude variation did not exhibit a significant effect (p > 0.05) in any of the columns. This is important because under high-altitude scenarios such as location 2 at 2500 m.a.s.l, the lower driving force for transferring oxygen to water was mitigated by the proposed bed configuration for aerated constructed wetlands used in columns 2 and 3.
Another important factor is water temperature. Water temperature has an effect on oxygen saturation [21] and, therefore, on the driving force for oxygen transfer to water. In the equatorial zone (location 2), this is related to altitude. In the Mediterranean zone (location 2), this is related to the season. In this study, the temperature difference between locations varied only from 1.8 °C to 5.0 °C. This temperature similarity is because at location 1, the experiments were developed during winter. For this reason, and because all results are reported in standard conditions (20 °C), temperature has not been included in the discussion.

4.3. Influence of Inner Container on Aeration System

A novel bed configuration, which combines a gravel-free core (inner container) located over a fine pore diffuser, was evaluated in column 3 (Figure 1). When a higher airflow rate was applied, the results in Table 2 show that the KLa and SOTR increased in a significant way (p < 0.05; see Table 2, different letters). This behavior was observed in the other experimental columns, showing that the inclusion of the inner container did not have a positive or negative effect when a higher airflow rate was applied. When column 3 is compared to the other columns, Table 3 (comparison between columns) shows significant differences (p < 0.05) for each location and airflow rate. In addition, when column 3 was compared to column 2 (same gravel size and only effect of inner container is considered) (results not shown) in location 1, for the three airflows tested, the KLa, SOTR, and SOTE did not show significant differences (p > 0.05). However, in location 2, when column 3 and 2 was compared, non-significant differences (p > 0.05) could be found for KLa, SOTR, and SOTE, only for medium and high airflow. Similarly, column 3 did not show statistically significant differences (p > 0.05) when comparing the SOTR (p > 0.05) and SOTE (p > 0.05) between locations at the different airflow rates tested (Table 3). Thus, from these results two observations arise. First, at location 1, with higher atmospheric pressure, the inclusion of the inner container would allow to it work with a low airflow (0.7 L/min), since oxygen transfer results showed similar behavior compared to the medium airflow (1.5 L/min), but if an increase in oxygen transfer rate is desired, a high airflow (3.6 L/min) can be employed. Second, if a medium or high airflow is employed at any location, regardless of the atmospheric pressure (or altitude), the inner container has a positive effect, because an increase of 17.4% in the water volume is achieved (Figure 1, see water volume in columns 2 and 3), and therefore, treatment capacity increase of the system can be expected.
Furthermore, the inner container in column 3 allowed the achievement of a similar normalized SOTR and SOTE between locations (Figure 3 and Figure 4). When a normalized SOTR was compared to the same gravel size (column 2) but reduced water volume, the normalized SOTR showed an improvement in location 2. The improvement in the oxygen transfer when the free space was included in the bed at a higher altitude can be explained, because when water volume increases, gravel quantity is reduced. Thus, fewer bubbles are imploded by gravel. As an effect of altitude, less oxygen is available in each bubble; therefore, the reduction in the number of bubbles that implode can improve the oxygen transfer to water.

4.4. Influence of Gravel Size

Comparisons of the results when evaluating columns containing different gravel sizes (columns 2 and 4) showed that the gravel size had an effect on oxygen transfer efficiency. In fact, the greater the gravel size, the higher the SOTE. Coarse gravel is related to oxygen transfer efficiency; this fact is promoted by high air-water interface renewal rates as a consequence of fluids traveling through a bed’s empty spaces. The influence on gas-liquid interfacial renewal rates in diffused aeration systems has been previously discussed [25,26]. This is especially relevant for the environmental conditions of location 1 and is promoted by the high driving force for the transfer of oxygen to the water associated with this location (previously described). Considering that the volume of water is dependent on the empty spaces within the gravel bed, column 2 stored a greater water volume than column 4. To confirm the results presented in Table 2, considering the difference in the volumes of water, normalized SOTR and SOTE results in Figure 3 and Figure 4 were included. These results confirm the advantage of coarse gravel in terms of oxygen transfer efficiency for diffused aeration. In fact, column 2 gravel presented the highest oxygen transfer efficiency within the evaluated configurations.
The KLa, SOTR, and SOTE in a coarse gravel bed (column 2) were almost 1.5 to 2.0 times higher than in a fine gravel bed (column 4). This is valid for high atmospheric pressure at lower altitudes above sea level scenarios (location 1). For high altitudes (location 2), similar behaviors were achieved at a low airflow rate, but at a high airflow rate, the trend was different, showing similarities for the KLa, SOTR, and SOTE between columns 2 and 4. These results suggest that at a low altitude (high atmospheric pressure), gravel size increases have a positive effect on the oxygen transfer rate.
By including gravel of any size, the normalized SOTE (%/L) value was at least 30% higher than the control (column 1) in the low-altitude scenario (location 1), for any of the three airflows tested. This result is in line with previous discussions and suggests that a certain amount of porosity must be included in the bed of constructed wetlands with an aerated system to achieve the maximum normalized SOTE. However, Figure 3 shows that higher normalized SOTE was achieved when gravel of ½” to ¾” was employed (column 2). This effect was not evident in the results for high altitude (less atmospheric pressure).

4.5. Complementary Remarks

Aeration systems for constructed wetlands rely on the use of commercial diffusers integrated into a hose that release air according to the pressure exerted [13,19,30]. In this work, a disc diffuser was adopted, referencing the common practice in diffused aeration systems for aerated wastewater treatment [8,9]. Therefore, in constructed wetland aerated systems, diffusers (hose or disc), fouling (organic and inorganic), bed configuration, constructive process, the possibility of oxygen stratification, and diffusers maintenance and replacement are complementary topics to be considered, as these factors could affect the oxygen transfer efficiency throughout the operational life of the systems. Furthermore, these factors should be considered when designing constructed wetlands at a full scale.
During the tests throughout the periods of a few days (less than two weeks), a thin layer of inorganic sediment was observed above the diffuser’s membrane. Thus, the impact of inorganic fouling caused by the bed’s gravel degradation and precipitates of dissolved ions has not been previously documented, and neither has its long-term effects. Although the aerated constructed wetlands do not work on highly concentrated cultures of microorganisms as an activated sludge process that promotes biofouling, the combination of inorganic and biological fouling demands further research. Since aerated wetland technology is now the spearhead of the wetlands treatment technology being established everywhere to treat different pollutants, further research dealing with diffuser fouling and oxygen transfer rates is relevant and necessary. This research will be important to determine accurate design parameters for the aeration systems in aerated constructed wetlands in the same way as is available for the design of aeration systems for the activated sludge process [31]. A better understanding of diffuser fouling phenomena will improve energy savings in aeration, because in different kinds of aerobic technologies, energy expenses represent between 25% and 60% of the operating costs [8,32].

5. Conclusions

The studied beds for aerated constructed wetlands included modifications in gravel size and an inner container evaluated under different atmospheric pressures (different altitudes), and they showed that bed configuration and environmental conditions have a relevant influence on the oxygen transfer efficiency in clean water using fine-pore diffusers.
In high atmospheric pressures at low-altitude locations, the inclusion of an inner container with a gravel size of 1/2”–3/4” is recommended for aerated constructed wetlands operated at low airflow (0.7 L/min). However, a high airflow (3.6 L/min) can be employed if a significant increase in oxygen transfer is the objective.
In low atmospheric pressures at high-altitude locations, these elements can be included. However, it is clear that the inclusion of these elements can only be recommended at a low airflow because at a medium or high airflow, its effect was not significant.
The increase in research on oxygen transfer in aerated constructed wetlands has driven the need for a standard procedure for aeration testing. This work proposed a methodology that can be used to optimize the future design of intensified constructed wetlands with mechanical aeration. In this way, the design and operation of this wastewater treatment alternative can be improved and contribute to expanding the technology to different locations, especially for applications in places located at high elevations above sea level.

Author Contributions

Conceptualization, I.V.-P. and G.B.-R.; methodology, G.B.-R.; software, J.C. and G.B.-R.; validation, G.B.-R.; formal analysis, I.V.-P., J.C., S.M., L.C.-R., H.C. and G.B.-R.; investigation, J.C., S.M., L.C.-R. and H.C.; resources, I.V.-P. and G.B.-R.; data curation, G.B.-R.; writing—original draft preparation, I.V.-P., S.T. and G.B.-R.; writing—review and editing, C.A.A. and D.R.; visualization, I.V.-P. and G.B.-R.; supervision, I.V.-P. and G.B.-R.; project administration, I.V.-P. and G.B.-R.; funding acquisition, I.V.-P. and G.B.-R. All authors have read and agreed to the published version of the manuscript.

Funding

This research was funded by the scholarship platform Academic and Student Mobility of the Pacific Alliance (Programa de Movilidad Estudiantil y Académica de la Alianza del Pacífico, Notification Carta 48/2019); and Agencia Nacional de Investigación y Desarrollo de Chile (ANID), grant number ANID/FONDECYT/11180672. The APC was funded by Universidad Católica del Maule.

Acknowledgments

The authors wish to express their gratitude to grant No. ANID/PCI/MEC80170068 for supporting the collaboration with Carlos A. Arias. Finally, the authors would like to extend their gratitude to the “Universidad Militar Nueva Granada” through “Vicerrectoría de Investigaciones”.

Conflicts of Interest

The authors declare no conflict of interest.

References

  1. Brix, H.; Schierup, H.-H.; Arias, C.A. Twenty years experience with constructed wetland systems in Denmark–what did we learn? Water Sci. Technol. 2007, 56, 63–68. [Google Scholar] [CrossRef]
  2. Vera, I.; García, J.; Sáez, K.; Moragas, L.; Vidal, G. Performance evaluation of eight years experience of constructed wetland systems in Catalonia as alternative treatment for small communities. Ecol. Eng. 2011, 37, 364–371. [Google Scholar] [CrossRef]
  3. Vymazal, J. Constructed wetlands for treatment of industrial wastewaters: A review. Ecol. Eng. 2014, 73, 724–751. [Google Scholar] [CrossRef]
  4. Ortigara, A.; Foladori, P.; Andreottola, G. Kinetics of heterotrophic biomass and storage mechanism in wetland cores measured by respirometry. Water Sci. Technol. 2011, 64, 409. [Google Scholar] [CrossRef] [PubMed]
  5. Boog, J.; Nivala, J.; Aubron, T.; Wallace, S.; van Afferden, M.; Müller, R. Hydraulic characterization and optimization of total nitrogen removal in an aerated vertical subsurface flow treatment wetland. Bioresour. Technol. 2014, 162, 166–174. [Google Scholar] [CrossRef] [PubMed]
  6. Nivala, J.; Murphy, C.; Freeman, A. Recent Advances in the Application, Design, and Operations & Maintenance of Aerated Treatment Wetlands. Water 2020, 12, 1188. [Google Scholar] [CrossRef] [Green Version]
  7. Baquero-Rodríguez, G.; Lara-Borrero, J.; Nolasco, D.; Rosso, D. A Critical Review of the Factors Affecting Modeling Oxygen Transfer by Fine-Pore Diffusers in Activated Sludge. Water Environ. Res. 2018, 90, 431–441. [Google Scholar] [CrossRef]
  8. Metcalf and Eddy. Wastewater Engineering: Treatment and Resource Recovery, 5th ed.; McGraw-Hill Education: New York, NY, USA, 2013. [Google Scholar]
  9. Rosso, D. Aeration, Mixing, and Energy: Bubbles and Sparks, 1st ed.; IWA Publishing: London, UK, 2018. [Google Scholar]
  10. Jiang, L.; Chen, L.; Zhou, Z.; Sun, D.; Li, Y.; Zhang, M.; Liu, Y.; Du, S.; Chen, G.; Yao, J. Fouling characterization and aeration performance recovery of fine-pore diffusers operated for 10 years in a full-scale wastewater treatment plant. Bioresour. Technol. 2020, 307, 123197. [Google Scholar] [CrossRef]
  11. ASCE/EWRI 2-06; Measurement of Oxygen Transfer in Clean Water ASCE Standard. American Society of Civil Engineers (ASCE): Reston, VA, USA, 2007. [CrossRef]
  12. American Society of Civil Engineers (ASCE). Standard Guidelines for In-Process Oxygen Transfer Testing, 2nd ed.; American Society of Civil Engineers: Reston, VA, USA, 2018. [Google Scholar] [CrossRef]
  13. Boog, J.; Kalbacher, T.; Nivala, J.; Forquet, N.; van Afferden, M.; Müller, R.A. Modeling the relationship of aeration, oxygen transfer and treatment performance in aerated horizontal flow treatment wetlands. Water Res. 2019, 157, 321–334. [Google Scholar] [CrossRef]
  14. Boog, J.; Nivala, J.; Kalbacher, T.; van Afferden, M.; Müller, R.A. Do wastewater pollutants impact oxygen transfer in aerated horizontal flow wetlands? Chem. Eng. J. 2020, 383, 123173. [Google Scholar] [CrossRef]
  15. Freeman, A.; Surridge, B.; Matthews, M.; Stewart, M.; Haygarth, P. New approaches to enhance pollutant removal in artificially aerated wastewater treatment systems. Sci. Total Environ. 2018, 627, 1182–1194. [Google Scholar] [CrossRef] [PubMed] [Green Version]
  16. Rous, V.; Vymazal, J.; Hnátková, T. Treatment wetlands aeration efficiency: A review. Ecol. Eng. 2019, 136, 62–67. [Google Scholar] [CrossRef]
  17. Amand, L.; Olsson, G.; Carlsson, B. Aeration control—A review. Water Sci. Technol. 2013, 67, 2374–2398. [Google Scholar] [CrossRef] [PubMed] [Green Version]
  18. Araya, F.; Vera, I.; Sáez, K.; Vidal, G. Effects of aeration and natural zeolite on ammonium removal during the treatment of sewage by mesocosm-scale constructed wetlands. Environ. Technol. 2016, 37, 1811–1820. [Google Scholar] [CrossRef]
  19. DWA-A 262E; Principles for Dimensioning, Construction and Operation of Wastewater Treatment Plants with Planted and Unplanted Filters for Treatment of Domestic and Municipal Wastewater: Grundsätze für Bemessung, Bau und Betrieb von Kläranlagen mit Bepflanzten und Unbepflanzten Filtern zur Reinigung Häuslichen und Kommunalen Abwassers. German Association for Water, Wastewater, and Waste (DWA): Hennef, Germany, 2017. Available online: https://webshop.dwa.de/de/dwa-a-262-waste-water-treatment-plants-11-2017.html (accessed on 31 January 2019).
  20. Uggetti, E.; Hughes-Riley, T.; Morris, R.H.; Newton, M.I.; Trabi, C.L.; Hawes, P.; Puigagut, J.; García, J. Intermittent aeration to improve wastewater treatment efficiency in pilot-scale constructed wetland. Sci. Total Environ. 2016, 559, 212–217. [Google Scholar] [CrossRef] [Green Version]
  21. Von Sperling, M. Basic Principles of Wastewater Treatment, 1st ed.; IWA Publishing: London, UK, 2007. [Google Scholar]
  22. Stenstrom, M.; Kartiki, S.N. DO Parameter Estimation Program, version 3.0.3; UCLA—Civil and Environmental Engineering Department: Los Angeles, CA, USA, 2012; Available online: http://www.seas.ucla.edu/stenstro/DOPar3-0-3.zip (accessed on 30 March 2019).
  23. Di Rienzo, J.; Casanoves, F.; Balzarini, M.; Gonzalez, L.; Tablada, M.; Robledo, C.W. InfoStat Statistical Software; Centro de Transferencia InfoStat, FCA, Universidad Nacional de Córdoba, Argentina: Córdoba, Argentina, 2019; Available online: http://www.infostat.com.ar (accessed on 30 December 2018).
  24. Du, Y.; Chen, F.; Zhou, L.; Qiu, T.; Sun, J. Effects of different layouts of fine-pore aeration tubes on sewage collection and aeration in rectangular water tanks. Aquac. Eng. 2020, 89, 102060. [Google Scholar] [CrossRef]
  25. Rosso, D.; Larson, L.E.; Stenstrom, M.K. Surfactant effects on alpha factors in full-scale wastewater aeration systems. Water Sci. Technol. 2006, 54, 143–153. [Google Scholar] [CrossRef]
  26. Rosso, D.; Huo, D.L.; Stenstrom, M.K. Effects of interfacial surfactant contamination on bubble gas transfer. Chem. Eng. Sci. 2006, 61, 5500–5514. [Google Scholar] [CrossRef]
  27. Baquero-Rodríguez, A.; Martínez, S.; Acuña, J.; Nolasco, D.; Rosso, D. How elevation dictates technology selection in biological wastewater treatment. J. Environ. Manag. 2022, 307, 114588. [Google Scholar] [CrossRef]
  28. Benson, B.B.; Krause, D. The Concentration and Isotopic Fractionation of Gases Dissolved in Freshwater in Equilibrium with the Atmosphere. 1. Oxygen. Limnol. Oceanogr. 1980, 25, 662–671. [Google Scholar] [CrossRef] [Green Version]
  29. Benson, B.B.; Krause, D. The Concentration and Isotopic Fractionation of Oxygen Dissolved in Freshwater and Seawater in Equilibrium with the Atmosphere. Limnol. Oceanogr. 1984, 29, 620–632. [Google Scholar] [CrossRef]
  30. Van Oirschot, D.; Wallace, S.; Van Deun, R. Wastewater treatment in a compact intensified wetland system at the Badboot: A floating swimming pool in Belgium. Environ. Sci. Pollut. Res. 2015, 22, 12870–12878. [Google Scholar] [CrossRef] [PubMed]
  31. Garrido-Baserba, M.; Asvapathanagul, P.; Park, H.; Kim, T.; Baquero-Rodriguez, G.; Olson, B.H.; Rosso, D. Impact of fouling on the decline of aeration efficiency under different operational conditions at WRRFs. Sci. Total Environ. 2018, 639, 248–257. [Google Scholar] [CrossRef] [PubMed]
  32. Vera, I.; Sáez, K.; Vidal, G. Performance of 14 full-scale sewage treatment plants: Comparison between four aerobic technologies regarding effluent quality, sludge production and energy consumption. Environ. Technol. 2013, 34, 2267–2275. [Google Scholar] [CrossRef]
Figure 1. Schematic diagram of the bench-scale testing columns (not to scale).
Water 14 03284 g001
Figure 2. Example dissolved oxygen (DO) profile showing the changing DO concentration during oxygen transfer test.
Water 14 03284 g002
Figure 3. Specific oxygen transfer rate (SOTR) by liter in each location: (Water 14 03284 i001) location 1, Universidad Católica de Maule (Talca, Chile); (Water 14 03284 i002) location 2, Universidad Militar Nueva Granada (Cajicá, Colombia).
Water 14 03284 g003
Figure 4. Specific oxygen transfer efficiency (SOTE) by liter in each location: (Water 14 03284 i003) location 1, Universidad Católica de Maule (Talca, Chile); (Water 14 03284 i004) location 2, Universidad Militar Nueva Granada (Cajicá, Colombia).
Water 14 03284 g004
Table 1. Experimental characteristics for each location.
LocationAltitude (m.a.s.l)Atmospheric Pressure
(Atm)
Water Temperature (°C)Oxygen Solubility
(mg/L)
Airflow Rate
LowMediumHigh
L/minm3/m2-hL/minm3/m2-hL/minm3/m2-h
1 *1020.9911.4–16.510.82–9.670.72.11.54.53.610.7
2 **25500.7613.2–21.57.94–6.660.72.11.64.83.610.7
Note: * Universidad Católica de Maule (Talca, Chile). ** Universidad Militar Nueva Granada (Cajicá, Colombia).
Table 2. Overall oxygen mass transfer coefficient (KLa), specific oxygen transfer rate (SOTR), and specific oxygen transfer efficiency (SOTE) for each configuration, airflow, and location.
Column NoAirflow RateKLa (1/h)SOTR (kgO2/h)SOTE (%)
Location 1Location 2Location 1Location 2Location 1Location 2
1Low11.29 ± 1.04 a6.94 ± 0.66 a2.29 ± 0.16 a1.86 ± 0.15 a19.72 ± 1.42 a15.78 ± 1.23 a
Medium12.95 ± 2.47 a,b12.75 ± 1.17 b2.58 ± 0.47 a2.99 ± 0.32 b10.38 ± 1.91 a11.49 ± 1.25 b
High29.42 ± 1.53 b21.48 ± 2.10 c6.55 ± 0.15 a4.54 ± 0.30 c10.99 ± 0.25 a7.60 ± 0.50 c
2Low19.15 ± 0.75 a6.14 ± 0.56 a1.85 ± 0.09 a0.77 ± 0.07 a15.93 ± 0.81 a6.56 ± 0.58 a
Medium24.06 ± 1.73 a,b13.44 ± 1.04 a,b2.32 ± 0.20 a,b1.18 ± 1.02 a9.32 ± 0.79 a,b7.17 ± 0.69 b
High44.74 ± 1.95 b15.81 ± 1.20 b4.17 ± 0.10 b1.79 ± 0.14 a6.98 ± 0.17 b2.99 ± 0.23 b
3Low14.40 ± 0.17 a8.79 ± 0.37 a1.60 ± 0.06 a1.80 ± 0.12 a13.81 ± 0.52 a15.34 ± 1.03 a
Medium20.15 ± 3.45 a,b14.11 ± 1.99 b2.32 ± 0.20 a,b2.36 ± 0.24 a,b9.32 ± 1.50 a,b9.07 ± 0.91 a,b
High32.98 ± 3.52 b19.54 ± 6.28 b3.66 ± 0.37 b3.59 ± 1.20 b6.13 ± 0.61 b6.00 ± 2.01 b
4Low12.69 ± 1.26 a4.38 ± 0.51 a1.10 ± 0.11 a0.53 ± 0.09 a9.49 ± 0.98 a4.52 ± 0.80 a
Medium16.06 ± 2.79 a,b10.30 ± 3.06 a,b1.61 ± 0.35 a,b1.11 ± 0.32 a,b6.47 ± 1.40 a,b4.25 ± 1.22 a,b
High23.61 ± 1.94 b17.28 ± 2.94 b2.08 ± 0.13 b1.69 ± 0.21 b3.49 ± 0.21 b2.82 ± 0.36 b
Note: Location 1: Universidad Católica de Maule (Talca, Chile); location 2: Universidad Militar Nueva Granada (Cajicá, Colombia). Same letter, non-significative difference (p > 0.05) only for comparison between different airflows at each configuration and location.
Table 3. Results of statistical comparison between columns for each airflow and statistical comparison between the two locations (atmospheric pressures) (p values).
Airflow RateColumn NoComparison between ColumnsComparison between Locations
KLaSOTRSOTEKLaSOTRSOTE
L1L2L1L2L1L2L1L2L1L2L1L2
Low10.0216<0.0010.01560.00010.01560.00010.01210.01210.0121
20.02380.02380.0238
30.02380.09520.0952
40.01670.01670.0167
Medium10.0370.24960.0770.00170.0770.00130.93710.21680.4685
20.10.10.1
30.10.990.99
40.05710.22860.2286
High10.02160.04370.01560.00230.01560.00230.01670.01670.0167
20.05710.05710.0571
30.05710.40.4
40.03570.03570.0357
Note: Values in bold type p > 0.05 showing non-significant difference. L1: location 1; L2: location 2.
Publisher’s Note: MDPI stays neutral with regard to jurisdictional claims in published maps and institutional affiliations.

