

Spatial Variation of Soil Organic Carbon from Bamen Bay Mangrove in Southern China
by
 , and
, and
Wanyu Wen
1,2,3,
Yaojun Zhu
1,2,3,
Jia Guo
1,2,3,
Xu Pan
1,2,
Jing Li
1,2,
Yanru Guo
1,2,
Julan Guo
1,2,
Gaojie Wu
1,2,
Yuhang Wang
1,2,3,* and
Minghao Gong
1,2,3,* 1
Wetland Research Center, Institute of Ecological Conservation and Restoration, Chinese Academy of Forestry, Beijing 100091, China
2
Beijing Key Laboratory of Wetland Services and Restoration, Chinese Academy of Forestry, Beijing 100091, China
3
Zhanjiang National Research Station for Mangrove Wetland Ecosystem, State Forestry and Grassland Administration, Zhanjiang 524448, China
*
Authors to whom correspondence should be addressed.
Water 2022, 14(20), 3278; https://doi.org/10.3390/w14203278
Submission received: 24 August 2022
/
Revised: 24 September 2022
/
Accepted: 11 October 2022
/
Published: 18 October 2022
(This article belongs to the Section Water and Climate Change)
Abstract
:Mangrove forests are large pools of soil organic carbon (SOC) found across the world, and play a vital role in global carbon (C) cycling. In this study, to investigate the effects of spatial factors on SOC in mangrove forests, soil samples at different depth layers from upper estuary (UE), lower estuary (LE), and tidal inlet (TI) in the Qinglangang mangrove forest in Southern China were collected and the differences in SOC among the layers and geomorphological settings were compared. The mean SOC content showed a pattern of LE (4.63 ± 1.28%) > UE (2.94 ± 0.73%) > TI (1.44 ± 0.33%). SOC content and storage decreased with soil depth in TI, but increased in UE. The total SOC storages (0–80 cm) of sites TU, UE, and LE, were 104.41 ± 16.63, 207.14 ± 44.83, and 228.78 ± 19.37 Mg/ha, respectively. The results suggested that top- and subsoil organic C content and storage were largely dependent on their specific location, which underwent different river-sea interactions and human activities. The SOC of the soil profile varied at different sites, implying that the current C storage of mangrove ecosystems can be accurately estimated by quantifying the C of sediments at sites.
1. Introduction
Mangrove forests occur in the intertidal zones of coastal wetlands and are unique forest ecosystems with high productivity and stable structure [1]. These forests have rich biodiversity and important wetland functions [2,3,4,5]. The estimated carbon (C) emissions due to mangrove deforestation are approximately 0.02–0.12 Pg per year, accounting for 10% of C emissions from all tropical deforestation [6,7,8,9,10]. Therefore, mangrove forests play an important role in the global C cycle, although they account for only 2% of the world’s coastal ocean area [11]. Mangrove forests contain soils rich in organic C that are 0.5 to >3 m thick, and account for 49% to 98% of total C storage [6,12,13,14]. However, knowledge about regional estimation of soil organic C (SOC) stocks at different sites is limited, and the distribution characteristics of SOC storage in mangrove forests remain unclear [15] due to the heterogeneity of mangrove sediment. Therefore, elucidating SOC storage at different sites is necessary.
Recently, there have been numerous studies on SOC stocks in mangrove forests. Plant vegetation types differ among mangrove ecosystems, affecting vegetation biomasses, and thus, impacting soil C stocks [16] due to litter fall, root exudates, and microbial processes in specific communities [17,18]. Environmental factors, such as tidal range, flushing, wave, salinity, pH, bulk density, nutrient inputs, and landscape setting, are known to influence C storage and burial rates in mangrove forest sites [19,20,21,22,23,24]. Although previous studies have focused on the effect of biotic and abiotic factors on mangrove C, studies on the spatial distribution characteristics of SOC in different geomorphic settings of mangrove forests are still limited. By comparing the SOC stock from Indo-Pacific mangroves, Donato et al. [6] concluded that SOC content and storage was higher in estuarine sites situated on large alluvial deltas than in oceanic sites situated in marine edge environments. In contrast, Breithaupt et al. [25] showed that SOC sequestration was not statistically different between the estuarine/riverine and oceanic mangrove forests. These contrasting results showed that the influence of geomorphologic settings on C stock and sequestration is controversial. Therefore, to understand how SOC varies under different geomorphologic settings, it is necessary to collect geomorphologic scale data to better understand the role of mangrove forests as C sinks [26].
The aims of this study were to (1) study SOC in different geomorphologic settings and (2) elucidate the distribution characteristics of SOC in various soil layers. To achieve this, through field experiments, we compared SOC concentration and stocks in mangrove forests in three geomorphologic settings: upper estuary (UE), lower estuary (LE), and tidal inlet (TI). We also investigated the variations in characteristics of SOC in soils from mangrove forests at different depths.
2. Materials and Methods
2.1. Study Area
The study area was the Mangrove Nature Reserve of Bamen Bay (19°22′–19°35′ N, 110°40′–110°48′ E) at Qinglan Harbor in Wenchang City, Hainan Province, China (Figure 1), located at the northern edge of the tropics. The reserve covers about 2948 hm2 (including 1223.3 hm2 of mangrove) and contains 24 mangrove species [3], the richest variety of naturally growing mangrove species in China. It is an ideal site to study the distribution pattern of soil C concentrations. The climate is tropical and subtropical with a mean annual temperature of 23.9 °C and a mean annual precipitation of 1974 mm. Bamen Bay is an inner bay with low and high tidal levels of 0.01 and 2.38 m, respectively, and a maximum tidal range of 2.07 m. The mangrove forests are distributed mainly in the coastal area because the bay is protected from wind and waves and holds rich sediments. The soil in this area is acidic and sandy, composed mainly of fine particles deposited by rivers and tides or scoured up by storms.
Our study had three sample sites: TI, UE, and LE in the Bamen Bay Nature Reserve (Table 1). The TI site was located at the mouth of Bamen Bay. It is a coastal marine setting with tidal water and high waves. Sonneratia alba is the dominant species at this site. The UE site was located by the Wenchang river, belonging to the riverine setting, which is near to the lower river and about 2 km away from the estuary. This site is mainly fresh water, with less tidal water. Bruguiera sexangula and Ceriops tagal are the dominant species. The LE site was located at the entry to the river. This site is an estuarine setting with mixed fresh water and tidal water. Sonneratia caseolaris and Lumnitzera racemosa are the dominant species at this site.
2.2. Field Investigation and Soil Sampling
In March 2012, we sampled nine plots (10 × 10 m) in total among the three sampling sites. Three plots, going inland, were set up >20 m apart at each site. In each plot, two 80 cm soil cores were randomly taken with a steel corer of 5 cm in diameter during the low tide period. Each core was separated into 16 segments (0–5, 5–10, 10–15, 15–20, 20–25, 25–30, 30–35, 35–40, 40–45, 45–50, 50–55, 55–60, 60–65, 65–70, 70–75, and 75–80 cm). A semi-open corer was used to ensure the soil cores were not compressed. The two segments of the same depth from the two cores taken at each plot were mixed as a composite sample for subsequent analyses. There were three replicates for each segment of the same soil depth at each site, for a total of 144 soil samples (3 sites × 3 plots × 16 segments). The soil samples were air-dried and sieved through a 100-mesh screen in the laboratory.
2.3. Soil Analysis and Data Analysis
The measuring method of SOC was potassium dichromate external heating oxidation-volumetric. Soil bulk density was measured by cutting-ring method.
SOC storage (Tc, Mg/ha) in the ith soil layer was calculated as follows:
where BDi and OCi are soil bulk density (g/cm3) and SOC content (%) of layer i, respectively, and di is the thickness (cm) of the ith layer [4].
Tc = BDi × OCi × di,
Data were analyzed with Microsoft Excel 2019 MSO (version 2209 Build 16.0.15629.20152) and the statistical package SPSS 16.0 (SPSS Inc. Chicago, IL, USA). The effects of sites and soil depths, and their interaction on SOC, were examined using two-way analysis of variance (ANOVA). Furthermore, Turkey’s honestly significant difference multiple comparisons test was performed to test the different significance of SOC among sites and soil depths. The data were tested for normality of distribution and homogeneity of variance, and no data transformation was needed.
3. Results
3.1. SOC Content of Three Sites
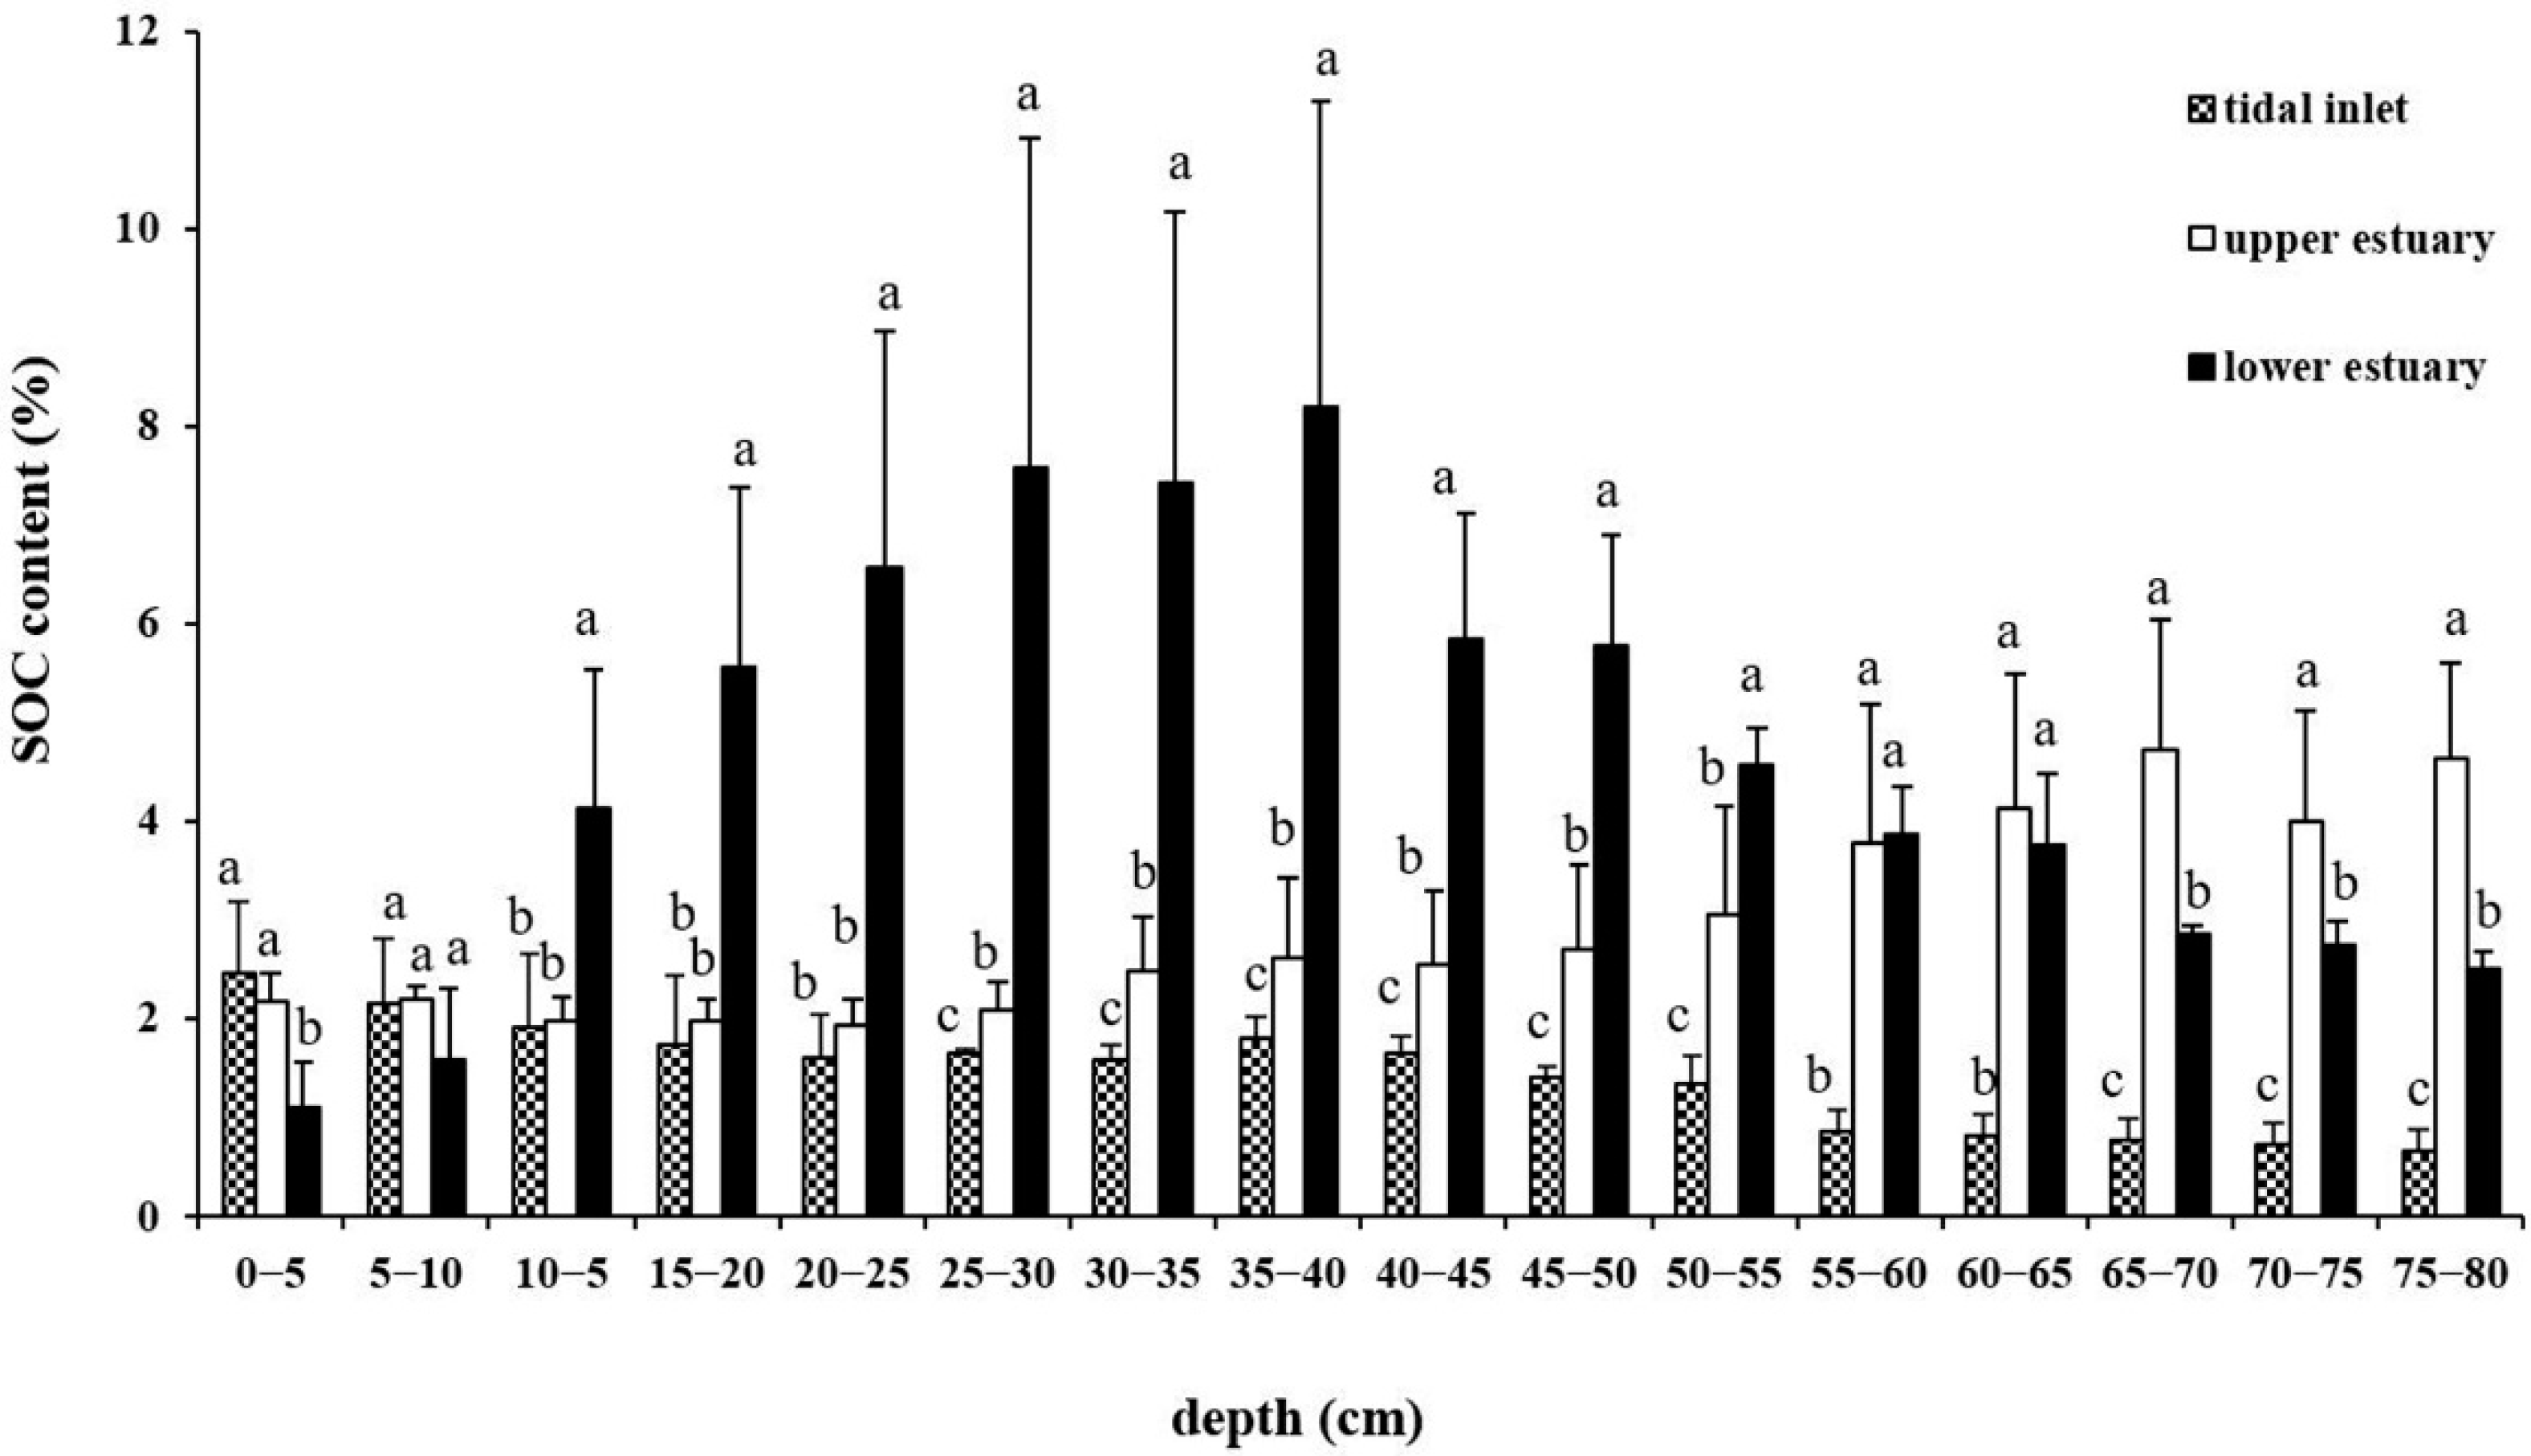
Table S1 shows that there were statistically significant differences for the SOC content of the soil layers among the three geomorphologic settings, and there was interaction between geomorphologic setting and soil depth. Geomorphologic setting impacted SOC content across the soil profile, and the SOC content in TI was significantly lower than that in LE and UE (p < 0.001). There were significant differences for SOC content between upper soil layers and bottom soil layers in UE and TI (p < 0.05), while in LE, the SOC content of surface soil layers was significantly different (p < 0.05).
The average SOC contents for the whole (0–80 cm) soil profile were 1.4 ± 0.3% in TI, 2.9 ± 0.7% in UE and 4.6 ± 1.3% in LE. The average SOC content in TI was lower than that in UE and LE, with LE having the highest SOC content (p < 0.05). The profile patterns of SOC content among the three sites were significantly different (Figure 2). The SOC content in TI decreased with increasing soil depth. The mean SOC content in TI was most abundant at the topsoil, at 2.5 ± 0.7%. The SOC in the 75–80 cm soil layer was the lowest, at 0.7 ± 0.2%. In contrast, the SOC content in UE increased with the increasing soil depth, and reached the highest value of 4.6 ± 0.9% in the 75–80 cm soil layer. The SOC content in LE was the lowest in the topsoil layer at 1.1 ± 0.5%, increased to 8.2 ± 3.1% in the 35–40 cm soil layer, and then decreased with increasing depth. In addition, the spatial variability in SOC contents in soil profiles was assessed by the coefficient of variation (CV) in our study. The CV values were 14.3–69.6%, 13.8–76.3%, and 19.7–64.3% for TI, LE, and UE, respectively. This indicated that SOC content was heterogeneously distributed among the sites.
3.2. SOC Storage in Three Geomorphologic Settings
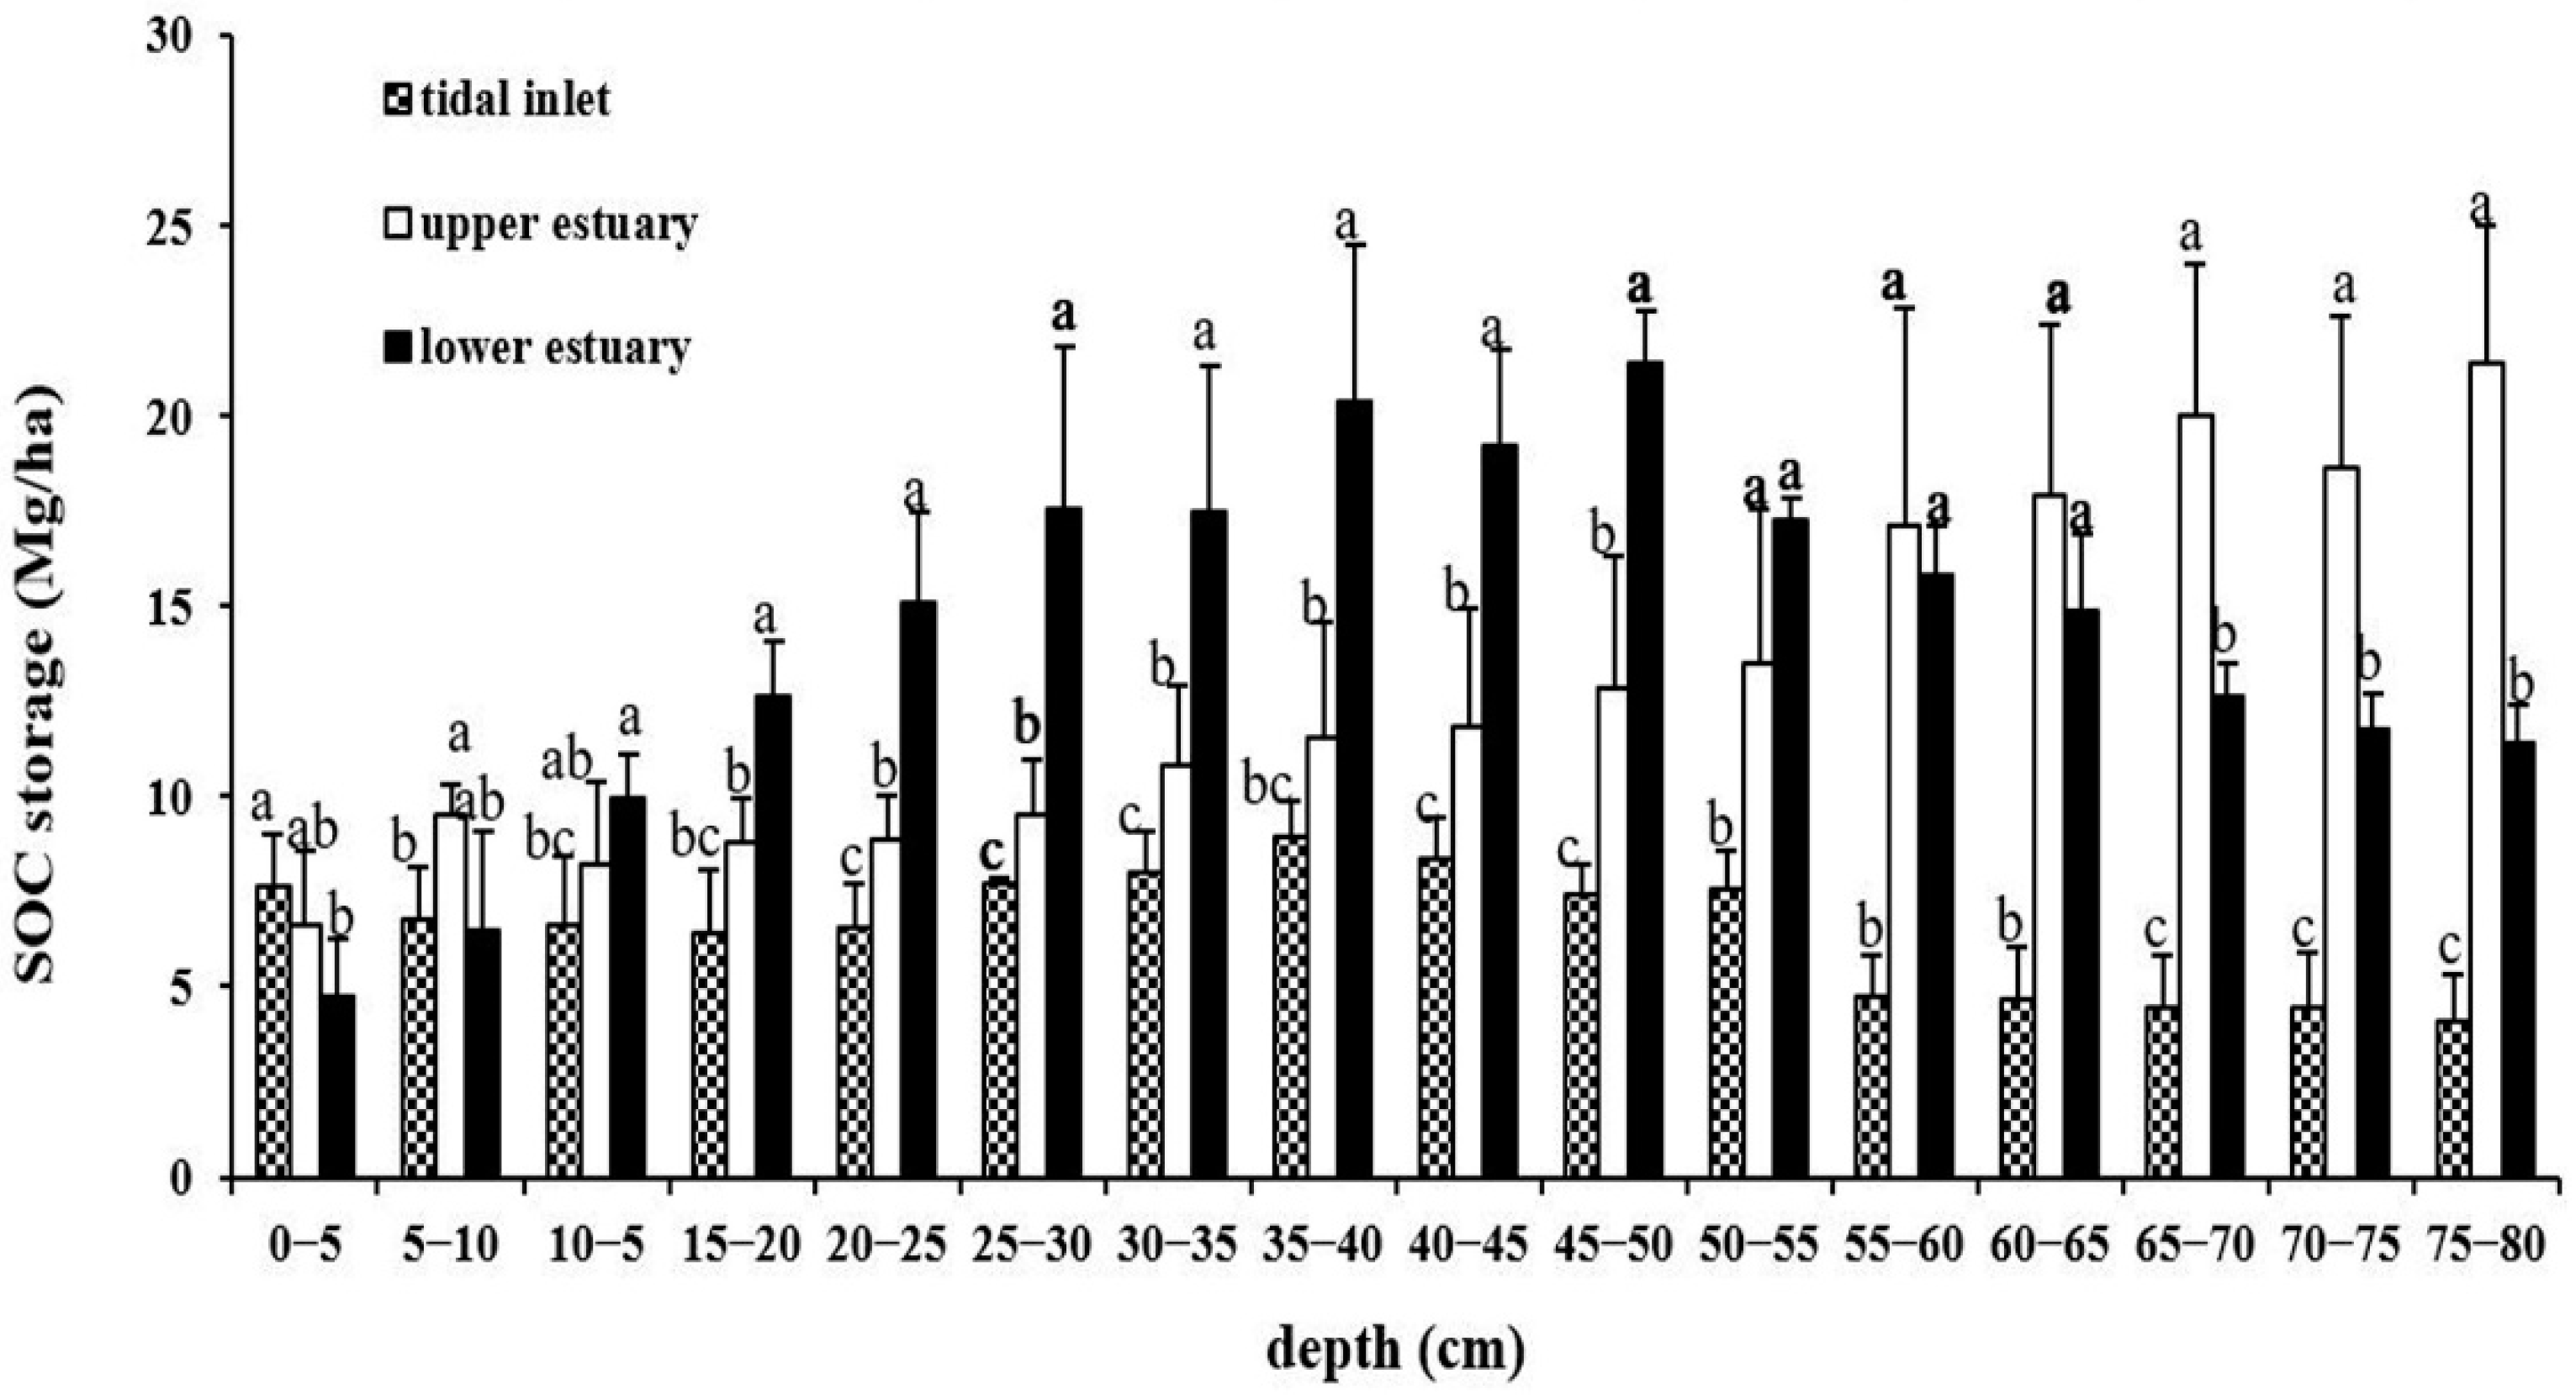
Table S2 shows that there were significant differences in the SOC storage of the various 5 cm soil layers among TI, UE, and LE sites (p < 0.001). SOC storage was much lower in TI than in UE and LE (p < 0.001). The average SOC storage of the entire soil profile (0–80 cm) was highest in LE (14.3 ± 5.7 Mg/ha). The SOC storage in UE and TI was 12.9 ± 6.5 and 6.5 ± 2.4 Mg/ha, respectively. Multiple comparison analysis revealed that SOC storage was significantly different among soil layers in LE. The statistical differences for SOC storage in the various soil layers were not found in TI and UE.
The distribution patterns were similar for SOC concentration and SOC storage in various soil layers (Figure 3). SOC storage in TI was 7.7 ± 1.4 Mg/ha on the soil surface, which first decreased and then increased to 8.4 ± 1.0 Mg/ha in the 40–45 cm soil layer, and finally decreased to 4.1 ± 1.2 Mg/ha in the 75–80 cm soil layer. In UE, SOC storage increased slightly with soil depth, reaching the highest value of 21.4 ± 3.7 Mg/ha in the 75–80 cm soil layer. Since it showed an upward trend, it can be inferred that the SOC storage value in UE may still increase below 80 cm soil depth. In the LE area, the SOC storage significantly increased with soil depth, reaching the highest value of 21.4 ± 1.4 mg/ha at the 45–50 cm soil layer, and then slowly decreased to 11.4 ± 0.9 mg/ha at the 75–80 cm layer, which is still much higher than the C storage in the surface soil (4.8 ± 1.5 Mg/ha). SOC stocks were heterogeneously distributed among sites similar to the SOC contents. CV values were 17.9–57.5%, 11.2–70.9%, and 15.2–57.6% for TI, LE, and UE, respectively.
Overall, there was significantly lower SOC storage in TI than in UE and LE (Table 2). The SOC storage was slightly higher in LE than in UE, although the difference was not significant. In this study, the SOC storages of the 0–80 cm soil layer in TI, UE, and LE were 104.4 ± 16.6, 207.1 ± 44.8, and 228.8 ± 19.4 Mg/ha, respectively.
4. Discussion
SOC in mangrove forests is mostly constrained by geomorphological processes acting at the coastal setting landscape level [27]. Waves, tidal range, and river discharge affect the geomorphologic environmental settings [14], leading to different physical and biochemical characteristics of mangrove soils [28,29]. Variations in SOC storage are linked to changes in vegetation primary productivity and decomposition, which are in turn driven by biochemical and physical factors [30]. Thus, varying geomorphologic settings of mangrove forests often result in different SOC storage. River input in estuarine settings brings a large amount of sediment and nutrients. When the water flow in LE decreased, the reduced wave action by the dense canopy may have retained the more suspended particulate organic matter, which can promote root expansion, leading to the rapid deposition of litter and organic detritus in soil [31,32,33]. Tides also carry abundant sediment, promoting the lateral trapping of mud due to reduced water flow within mangrove forests [34]. Due to the narrow river width and fast flow rate, the soil in mangrove forests in UE could not retain as much organic matter, and the sediment and nutrients were slightly lower than those in LE. Each coastal setting has a distinct environmental signature that controls the type and rate of sediment supply to the coastline, influences nutrient load and limitation, and ultimately, affects carbon accumulation in soil [35,36]. In this study, the TI site, which belongs to the coastal setting, experienced high wave surfing and sediments being taken away. Tides in TI promote nutrient exchange and the aeration of soil layers, enhancing organic matter decomposition rates in mangrove soils [37], and ultimately leading to lower SOC in TI than in UE and LE. This conclusion is consistent with the result that SOC in mangrove forests was lower in oceanic sites than in estuarine sites [6].
Marine, riverine, and estuarine settings have different hydrological processes, such as tidal activity, freshwater inputs, and waves. These hydrological processes influence the chemical and physical conditions in mangrove ecosystems [37,38]. Thus, vegetation biomass (structure) and soil physicochemical properties vary in different geomorphologic settings [30,39]. Generally, higher biomass means more soil C stock [40,41] and biomass and SOC concentration are significantly correlated [37,42]. This indicates that an increase in vegetation biomass will increase mangrove-derived SOC in soil in mangrove forests [43]. In our study, soil from the different geomorphologic settings showed different patterns of SOC change with soil depth. SOC in LE increased with soil depth, reaching a maximum at 50 cm depth before decreasing. This was probably caused by extensive root systems at a depth of approximately 50 cm, which could promote the retention of organic matter and deposition of the finer soil fraction which has a high SOC [44,45]. SOC change in UE decreased with soil depth. From our field observation, the mangrove trees in UE were higher than those in LE. This meant that plant residues and root exudates were transported and stored at 0–80 cm depth under anaerobic conditions, resulting in lower plant litter and root exudate input. According to Sherman et al. [39], less nutrient-rich environments contribute to lower biomass, productivity, and growth efficiency. Due to the high waves and resulting sediment removal, the biochemistry of soil in TI changed and soil nutrients decreased. The decreased root biomass resulted in low SOC, which agreed with the findings of Gleason and Ewel [37] from a study of a Micronesian mangrove forest, where standing living root biomass was positively correlated with the soil C.
SOC storage in mangrove forests is highly variable by latitude, region, and plant community compositions [9,46]. From individual field observations (Table 3), the soil C storage generally decreased as the latitude increased from 0° to 30° [47]. However, soil C storage also significantly varied among sites within the same 10° latitude interval. For example, at 0–10°, the soil C storage in the east of the mouth of Amazon river, Brazil (340.0 Mg C ha−1), was significantly lower than that of the Indonesian Archipelago (466.3 ± 10.9 Mg C ha−1) and Yap and Palau Islands, Micronesia (692.5 Mg C ha−1) [48,49,50] At 10–20, the soil C storage in our present study (180.1 ± 35.2 Mg ha−1) was similar to that found on the southern Red Sea coast of Saudi Arabia (292 ± 4 Mg ha−1) [51], but lower than that found at Sian Ka’an Biosphere Reserve, Quintana Roo State in the Yucatan Peninsula, Mexico (489.0 ± 105.5 Mg C ha−1) [52]. Kauffman et al. [49] speculated that low soil C stocks in the Amazon’s mangrove forests may be related to wave surging and the high tidal range, coupled with coarse textured soils. SOC storage (42.5 ± 5.3 Mg C ha−1) of Red Sea mangrove forests at a latitude of 20–30°, was relatively low due to the low rainfall, nutrient limitation, high temperature, and reducing soil deposition rates [53]. Therefore, the unique environment of field sampling sites could lead to significantly different soil C storage from the other sites at the same latitude intervals. These studies suggest that site-specific geomorphologic settings and other conditions, such as vegetation composition and production, salinity, nutrient limit, and C and nitrogen content of the soil [6,21,22,27,49,54], play a major role in SOC storage in mangrove forests and may cause the patterns observed in this study.
5. Conclusions
The mean SOC showed a pattern of LE > UE > TI, indicating that the different geomorphological settings induced different vegetation biomass (structure) and biochemical characteristics of soil. The patterns of SOC change in the soil profiles varied by site. With increasing soil depth, SOC first increased and then decreased in LE, decreased in TI, and increased in UE. The total SOC storages (0–80 cm) of TI, UE, and LE were 104.41 ± 16.63, 207.14 ± 44.83, and 228.78 ± 19.37 Mg/ha, respectively. Our results showed that it is necessary to quantify C accumulation in sediments at different sites when estimating the present-day C storage of mangrove ecosystems. In addition, due to the heterogeneity of mangrove sediments, there is a need to increase the number of sampling repetitions to make global SOC estimation more accurate.
Supplementary Materials
The following supporting information can be downloaded at: https://www.mdpi.com/article/10.3390/w14203278/s1, Table S1: Two-way ANOVA for testing the effects of geomorphologic setting and soil layer on contents of SOC; Table S2: Two-way ANOVA for testing the effects of geomorphologic setting and soil layer on storages of SOC.
Author Contributions
All authors equally contributed to the review and their specific contributions to the preparation of this review are as follows: original draft preparation, data analysis, investigation and writing: W.W.; review: Y.Z., X.P. and J.L.; investigation: J.G. (Jia Guo), J.G. (Julan Guo), G.W., Y.G.; conceptualization, review and formal analysis: Y.W.; conceptualization, review and funding acquisition: M.G. All authors have read and agreed to the published version of the manuscript.
Funding
This research was funded by Fundamental Research Funds of Chinese Academy of Forestry (No. CAFYBB2016SY033), National Natural Science Foundation of China (No. 41801098), and Fundamental Research Funds of CAF (No. CAFYBB2020QB008).
Data Availability Statement
Not applicable.
Acknowledgments
We thank field personnel for assistance with data collection in Qinglan Mangrove Protection Station of Wenchang City, Hainan province.
Conflicts of Interest
The authors declare no conflict of interest.
References
- Alongi, D.M. Carbon cycling and storage in mangrove forests. Ann. Rev. Mar. Sci. 2014, 6, 195–219. [Google Scholar] [CrossRef] [PubMed]
- Chen, L.; Zeng, X.; Tam, N.F.Y. Comparing carbon sequestration and stand structure of monoculture and mixed mangrove plantations of Sonneratia caseolaris and S, Apetala in Southern China. For. Ecol. Manag. 2012, 284, 222–229. [Google Scholar] [CrossRef]
- Nong, S.Q.; Yang, X.B.; Li, D.H. Vegetation composition in the mangrove forest nature protection area of Qinglan, China. Plant Sci. J. 2011, 29, 459–466, (In Chinese with English Abstract). [Google Scholar]
- Kauffman, J.B.; Heider, C.; Cole, T.G. Ecosystem carbon stocks of Micronesian mangrove forests. Wetlands 2011, 31, 343–352. [Google Scholar] [CrossRef]
- Sitoe, A.A.; Mandlate, L.J.; Guedes, B.S. Biomass and carbon stocks of Sofala Bay mangrove forests. Forests 2014, 5, 1967–1981. [Google Scholar] [CrossRef]
- Donato, D.C.; Kauffman, J.B.; Murdiyarso, D. Mangroves among the most carbon rich forests in the tropics. Nat. Geosci. 2011, 4, 293–297. [Google Scholar] [CrossRef]
- Giri, C.E.; Ochieng, L.L.; Tieszen, Z. Status and distribution of mangrove forests of the world using earth observation satellite data. Glob. Ecol. Biogeogr. 2011, 20, 154–159. [Google Scholar] [CrossRef]
- Pendleton, L.; Donato, D.C.; Murray, B.C. Estimating global “blue carbon” emissions from conversion and degradation of vegetated coastal ecosystems. PLoS ONE 2012, 7, e43542. [Google Scholar] [CrossRef] [PubMed] [Green Version]
- Atwood, T.B.; Connolly, R.M.; Almahasheer, H.; Carnell, P.E.; Lewis, C.J.E. Global patterns in mangrove soil carbon stocks and losses. Nat. Clim. Chang. 2017, 7, 523–528. [Google Scholar] [CrossRef] [Green Version]
- Rozainah, M.Z.; Nazri, M.N.; Sofawi, A.B.; Hemati, Z.; Juliana, W.A. Estimation of carbon pool in soil, above and below ground vegetation at different types of mangrove forests in Peninsular Malaysia. Mar. Pollut. Bull. 2018, 137, 237–245. [Google Scholar] [CrossRef] [PubMed]
- Alongi, D.M.; Mukhopadhyay, S.K. Contribution of mangroves to coastal carbon cycling in low latitude seas. Agric. For. Meteorol. 2015, 213, 266–272. [Google Scholar] [CrossRef]
- Trevor, G.J.; Harifidy, R.R.; Lalao, R. Ecological variability and carbon stock estimates of mangrove ecosystems in northwestern Madagascar. Forests 2014, 5, 177–205. [Google Scholar]
- Cameron, C.; Kennedy, B.; Tuiwawa, S.; Goldwater, N.; Soapi, K.; Lovelock, C.E. High variance in community structure and ecosystem carbon stocks of Fijian mangroves driven by differences in geomorphology and climate. Environ. Res. 2021, 192, 110213. [Google Scholar] [CrossRef] [PubMed]
- Alongi, D.M. Global significance of mangrove blue carbon in climate change mitigation. Science 2020, 2, 67. [Google Scholar] [CrossRef]
- Bouillon, S.; Borges, A.V.; Castaneda-Moya, E. Mangrove production and carbon sinks, a revision of global budget estimates. Glob. Biogeochem. Cycles 2008, 22, 1–12. [Google Scholar] [CrossRef] [Green Version]
- ShyleshChandran, M.S.; Ravi, A.; John, S.M.; Sivan, S.; Asha, M.S.; Mammen, P.C.; Kumar, K.J.S.; Sruthi, S.N. Ecosystem Carbon Stock of Selected Mangrove Forests of Vypin—Cochin Region, Southwest Coast of India. Wetlands 2020, 40, 2263–2273. [Google Scholar] [CrossRef]
- Bosire, J.O.; Dahdouh-Guebas, F.; Kairo, J.G.; Kazungu, J.M.; Dehairs, F.; Koedam, N. Litter degradation and CN dynamics in reforested mangrove plantations at Gazi Bay, Kenya. Biol. Conserv. 2005, 126, 287–295. [Google Scholar] [CrossRef] [Green Version]
- Werry, J.; Lee, S.Y. Grapsid crabs mediate link between mangrove litter production and estuarine planktonic food chains. Mar. Ecol. Prog. Ser. 2005, 293, 165–176. [Google Scholar] [CrossRef] [Green Version]
- Krauss, K.W.; Doyle, T.W.; Twilley, R.R.; Rivera-Monroy, V.H.; Sullivan, J.K. Evaluating the relative contributions of hydroperiod and soil fertility on growth of south Florida mangroves. Hydrobiologia 2006, 569, 311–324. [Google Scholar] [CrossRef]
- Lugo, A.E.; Medina, E.; McGinley, K. Issues and challenges of mangrove conservation in the Anthropocene. Madera Y Bosques. 2014, 20, 11–38. [Google Scholar] [CrossRef] [Green Version]
- Huang, X.; Wang, X.; Li, X.; Xin, K.; Yan, Z.; Sun, Y.; Bellerby, R. Distribution Pattern and Influencing Factors for Soil Organic Carbon (SOC) in Mangrove Communities at Dongzhaigang, China. J. Coast. Res. 2018, 34, 434–442. [Google Scholar] [CrossRef]
- Li, S.; Chen, P.; Huang, J.; Hsueh, M.; Hsieh, L.; Lee, C. Factors regulating carbon sinks in mangrove systems. Glob. Chang. Biol. 2018, 24, 4195–4210. [Google Scholar] [CrossRef]
- Wigand, C.; Eagle, M.; Branoff, B.L.; Balogh, S. Recent Carbon Storage and Burial Exceed Historic Rates in the San Juan Bay Estuary Peri-Urban Mangrove Forests (Puerto Rico, United States). Front. For. Glob. Chang. 2021, 4, 676–691. [Google Scholar] [CrossRef] [PubMed]
- Rovai, A.S.; Twilley, R.R.; Riul, P.; Cifuentes-Jara, M.; Manrow-Villalobos, M.; Horta, P.A.; Simonassi, J.C. Global controls on carbon storage in mangrove soils. Nat. Clim. Chang. 2018, 6, 534–538. [Google Scholar] [CrossRef]
- Breithaupt, J.L.; Smoak, J.M.; Smith III, T.J. Organic carbon burial rates in mangrove sediments: Strengthening the global budget. Glob. Biogeochem. Cycles 2012, 26, GB3011. [Google Scholar] [CrossRef]
- Taillardat, P.; Friess, D.A.; Lupascu, M. Mangrove blue carbonstrategies for climate change mitigation are most effective at the national scale. Biol. Lett. 2018, 14, 20180251. [Google Scholar] [CrossRef] [PubMed] [Green Version]
- Adame, M.F.; Neil, D.; Wright, S.F.; Lovelock, C.E. Sedimentation within and among mangrove forests along a gradient of geomorphological settings, Estuar. Coast. Shelf. Sci. 2010, 86, 21–30. [Google Scholar] [CrossRef]
- Adame, M.F.; Santini, N.S.; Tovilla, C.; Castro, L.; Guevara, M. Carbon stocks and soil sequestration rates of tropical riverine wetlands. Biogeosciences 2015, 12, 3805–3818. [Google Scholar] [CrossRef] [Green Version]
- Mcleod, E.; Chmura, G.L.; Bouillon, S.; Salm, R.; Duarte, C.M.; Lovelock, C.E. A blueprint for blue carbon: Toward an improved understanding of the role of vegetated coastal habitats in sequestering CO2. Front. Ecol. Environ. 2011, 9, 552–560. [Google Scholar] [CrossRef] [Green Version]
- Huxham, M.; Langat, J.; Tamooh, F. Decomposition of mangrove roots, effects of location, nutrients, species identity and mix in a Kenyan forest. Estuar. Coast. Shelf. Sci. 2010, 88, 135–142. [Google Scholar] [CrossRef] [Green Version]
- Adame, M.F.; Lovelock, C.E. Carbon and nutrient exchange of mangrove forests with the coastal ocean. Hydrobiologia 2011, 663, 23–50. [Google Scholar] [CrossRef]
- Salmo III, S.G.; Lovelock, C.E.; Duke, N.C. Vegetation and soil characteristics as indicators of restoration trajectories in restored mangroves. Hydrobiologia 2013, 720, 1–18. [Google Scholar] [CrossRef]
- Woodroffe, C.D.; Rogers, K.; Mckee, K.L.; Lovelock, C.E.; Mendelssohn, I.A.; Saintilan, N. Mangrove sedimentation and response to relative sea-level rise. Ann. Rev. Mar. Sci. 2016, 8, 243–266. [Google Scholar] [CrossRef] [Green Version]
- Twilley, R.R.; Chen, R.H.; Hargis, T. Carbon sinks in mangroves and their implications to carbon budget of tropical coastal ecosystems. Water Air Soil Pollut. 1992, 64, 265–288. [Google Scholar] [CrossRef]
- Harris, P.T.; Heap, A.D.; Bryce, S.M. Classification of Australian clastic coastal depositional environments based upon a quantitative analysis of wave, tidal, and river power. J. Sediment. Res. 2002, 72, 858–870. [Google Scholar] [CrossRef]
- Yang, J.; Gao, J.; Liu, B.; Zhang, W. Sediment deposits and organic carbon sequestration along mangrove coasts of the Leizhou peninsula, southern China. Estuar. Coast. Shelf. S. 2014, 136, 3–10. [Google Scholar] [CrossRef]
- Gleason, S.M.; Ewel, K.C. Organic matter dynamics on the forest floor of a Micronesia mangrove forest, an investigation of species composition shifts. Biotropica 2002, 34, 190–198. [Google Scholar] [CrossRef]
- Cerón-Bretón, J.G.; Cerón-Bretón, R.M.; Rangel-MAarrón, M. Determination of carbon sequestration rate in soil of a mangrove forest in Campeche, Mexico. WSEAS Trans. Environ. Dev. 2011, 7, 55–64. [Google Scholar]
- Sherman, R.E.; Fahey, T.J.; Martinez, P. Spatial patterns of biomass and above-ground net primary productivity in a mangrove ecosystem in the Dominican Republic. Ecosystems 2003, 6, 384–398. [Google Scholar] [CrossRef]
- Ren, H.; Chen, H.; Li, A.Z.; Han, W.D. Biomass accumulation and carbon storage of four different aged Sonneratia apetala plantation in Southern China. Plant Soil 2010, 327, 279–291. [Google Scholar] [CrossRef]
- Sun, L. Study on Carbon Storage of Subtropical Broad-Leaved Forest Ecosystem in the Pearl River Delta; Sun Yat-Sen University: Guangzhou, Chinas, 2011. [Google Scholar]
- Zhang, H.; Guan, D.S.; Song, M.W. Biomass and carbon storage of Eucalyptus and Acacia plantations in the Pearl River Delta, South China. For. Ecol. Manag. 2012, 277, 90–97. [Google Scholar] [CrossRef]
- Wang, G.; Guan, D.; Peart, M.R.; Chen, Y.; Peng, Y. Ecosystem carbon stocks of mangrove forest in Yingluo Bay, Guangdong province of South China. For. Ecol. Manag. 2013, 310, 539–546. [Google Scholar] [CrossRef]
- Sebastian, R.; Chacko, J. Distribution of organic carbon in tropical mangrove sediments (Cochin, India). Int. J. Environ. Stud. 2006, 63, 303–311. [Google Scholar] [CrossRef]
- Zhu, Y.; Bourgeois, C.; Lin, G.; Wu, X.; Guo, Z. Spatial characteristic of grain size of surface sediments in mangrove wetlands in Gaoqiao of Zhanjiang, Guangdong Province of South China. Chin. J. Appl. Ecol. 2012, 23, 2114–2120. [Google Scholar]
- Chen, S.; Chen, B.; Chen, G.; Ji, J.; Yu, W.; Liao, J. Higher soil organic carbon sequestration potential at a rehabilitated mangrove comprised of Aegiceras corniculatum compared to Kandelia obovata. Sci. Total Environ. 2021, 752, 142279. [Google Scholar] [CrossRef]
- Ouyang, X.; Lee, S.Y. Improved estimates on global carbon stock and carbon pools in tidal wetlands. Nat. Commun. 2020, 11, 31–38. [Google Scholar] [CrossRef] [Green Version]
- Murdiyarso, D.; Purbopuspito, J.; Kauffman, J.B.; Warren, M.W.; Sasmito, S.D.; Donato, D.C.; Manuri, S.; Krisnawati, H. The potential of Indonesian mangrove forests for global climate change mitigation. Nat. Clim. Chang. 2015. [Google Scholar] [CrossRef]
- Kauffman, J.B.; Bernardino, A.F.; Ferreira, T.O.; Giovannoni, L.R.; Giovannoni, L.R.; Ruiz, F. Carbon stocks of mangroves and salt marshes of the Amazon region, Brazil. Biol. Lett. 2018, 14, 20180208. [Google Scholar] [CrossRef]
- Donato, D.C.; Kauffman, J.B.; Mackenzie, R.A. Whole-island carbon stocks in the tropical Pacific: Implications for mangrove conservation and upland restoration. J. Environ. Manag. 2012, 97, 89–96. [Google Scholar] [CrossRef]
- Eid, E.M.; Arshad, M. Effect of the conversion of mangroves into shrimp farms on carbon stock in the sediment along the southern Red Sea coast, Saudi Arabia. Environ. Res. 2019, 176, 108536. [Google Scholar] [CrossRef]
- Adame, M.F.; Kauffman, J.B.; Medina, I.; Gamboa, J.N.; Torres, O.; Caamal, J.P.; Reza, M.; Jorge, A. Carbon Stocks of Tropical Coastal Wetlands within the Karstic Landscape of the Mexican Caribbean. PLoS ONE 2013, 8, e56569. [Google Scholar] [CrossRef] [Green Version]
- Almahasheer, H.; Serrano, O.; Duarte, C.M.; Arias-Ortiz, A. Low Carbon sink capacity of Red Sea mangroves. Sci. Rep. 2017, 7, 9700. [Google Scholar] [CrossRef] [PubMed] [Green Version]
- Alongi, D.M. Carbon payments for mangrove conservation: Ecosystem constraints and uncertainties of sequestration potential. Environ. Sci. Policy 2011, 14, 462–470. [Google Scholar] [CrossRef]
- Stringer, C.E.; Trettin, C.C.; Zarnoch, S.J.; Tang, W. Carbon stocks of mangroves within the Zambezi River Delta, Mozambique. For. Ecol. Manag. 2015, 354, 139–148. [Google Scholar] [CrossRef]
- Jacotot, A.; Marchand, C.; Rosenheim, B.E.; Domack, E.W. Mangrove sediment carbon stocks along an elevation gradient: Influence of the late Holocene marine regression (New Caledonia). Mar. Geol. 2018, 404, 60–70. [Google Scholar] [CrossRef]
- Schile, L.M.; Kauffman, J.B.; Crooks, S.; Fourqurean, J.W.; Glavan, J. Limits on carbon sequestration in arid blue carbon ecosystems. Ecol. Appl. 2018, 27, 859–874. [Google Scholar] [CrossRef] [PubMed]
Figure 1.
Location of sample plots (black circles) in Qinglan harbor mangrove forest, Hainan province.
Figure 1.
Location of sample plots (black circles) in Qinglan harbor mangrove forest, Hainan province.

Figure 2.
SOC content of different soil layers in three geomorphologic settings. Different lowercase letters indicate significances among sites at the same soil layer (p < 0.05).
Figure 2.
SOC content of different soil layers in three geomorphologic settings. Different lowercase letters indicate significances among sites at the same soil layer (p < 0.05).

Figure 3.
SOC storage of various soil layers (5 cm) in three geomorphologic settings. Different lowercase letters indicate significances among sites at the same soil layer (p < 0.05).
Figure 3.
SOC storage of various soil layers (5 cm) in three geomorphologic settings. Different lowercase letters indicate significances among sites at the same soil layer (p < 0.05).


Table 1.
Site description in different geomorphological settings.
| Site Name | Longitude and Latitude | Features | Dominant Species |
|---|---|---|---|
| Upper estuary (UE) | 110°47′56.25″, 19°36′59.47″ | More Fresh water, far from the estuary mouth | Sonneratia caseolaris, Lumnitzera racemosa |
| Lower estuary (LE) | 110°47′52.52″, 19°36′7.98″ | Fresh water and tidal water, near to the estuary mouth | Bruguiera sexangula, Ceriops tagal |
| Tidal inlet (TI) | 110°50′20.58″, 19°33′30.90″ | More tidal water, near to the sea | Sonneratia alba |
Table 2.
SOC storage of various soil depth in different geomorphologic settings (mean ± standard errors, n = 3).
Table 2.
SOC storage of various soil depth in different geomorphologic settings (mean ± standard errors, n = 3).
| Sample Depth (cm) | SOC Storage (Mg/ha) | ||
|---|---|---|---|
| TI | UE | LE | |
| 0–10 | 14.4 A ± 2.8 | 16.2 A ± 2.7 | 11.2 A ± 4.1 |
| 0–20 | 27.4 A ± 6.1 | 33.2 A ± 5.9 | 33.8 A ± 1.9 |
| 0–30 | 41.7 B ± 6.8 | 51.6 AB ± 8.4 | 66.5 A ± 5.0 |
| 0–40 | 58.6 B ± 8.1 | 73.9 B ± 14.0 | 104.4 A ± 12.4 |
| 0–50 | 74.5 B ± 9.8 | 98.6 B ± 19.9 | 145.0 A ± 16.0 |
| 0–60 | 86.8 BC ± 11.3 | 129.2 AB ± 29.7 | 178.1 A ± 17.4 |
| 0–70 | 95.9 BC ± 13.9 | 167.1 AB ± 37.9 | 205.6 A ± 19.0 |
| 0–80 | 104.4 B ± 16.6 | 207.1 A ± 44.8 | 228.8 A ± 19.4 |
Note: Means followed by capital letters within rows are significantly different (p < 0.05) according to a one way ANOVA; 3 replicates and 95% confidence level.
Table 3.
Comparison of SOC storage at different sites (mean ± standard errors).
| Location | Latitude | C Storage (Mg /ha) | Soil Layer (cm) | Reference |
|---|---|---|---|---|
| Indonesian Archipelago | 00°40′–07°43′ S | 466.3 ± 10.9 | 0–100 | Murdiyarso et al. [48] |
| Mangroves of east of the mouth of Amazon river, Brazil | 00°38′–00°59′ S | 340.0 ± N | >100 | Kauffman et al. [49] |
| Yap and Babeldoab island, Micronesia | 07°21′–09°35′ N | 415.6 ± 23.5 | 0–100 | Kauffman et al. [4] |
| Two island groups of Micronesia (Yap and Palau) | 07°35′–09°33′ N | 692.5± N | 0–100 | Donato et al. [50] |
| The Encrucijada Biosphere Reserve, in Chiapas, Mexico | 14°43′ N | 505.9 ± 72.6 | <100 | Adame et al. [31] |
| southern Red Sea coast of Saudi Arabia | 17°10′–17°48′ N | 292.0 ± 4.0 | 0–100 | Eid et al. [51] |
| Mangrove Nature Reserve of Bamen Bay at Qinglan harbor, China | 19°22′–19°35′ N | 180.1 ± 35.2 | 0–80 | This study |
| Sian Ka’an Biosphere Reserve, Quintana Roo State in the Yucatan Peninsula, Mexico | 19°28′–20°05′ | 489.0 ± 105.5 | 0–100 | Adame et al. [52] |
| Saudi coast, Central Red Sea | 22°21′–23°00′ N | 42.5 ± 5.3 | 0–100 | Almahasheer et al. [53] |
| Dampier, Port Hedland, Mangrove Bay, Bay of Rest, Northern coast of Western Australia | 20°20′–22°19′ | 338.0 ± N | 0–100 | Alongi et al. [54] |
| Zhanjiang Nature Reserve in Yingluo Bay, South China | 20°14′–21°35′ N | 229.1 ± N | 0–100 | Wang et al. [43] |
| The Zambezi River Delta, Mozambique | about 21° | 158.9 ± 27.8 | 0–110 | Stringer et al. [55] |
| Amboa Swamp, New Caledonia | 21°44′ | 283.2± N | 0–100 | Jacotot et al. [56] |
| Aribian Gulf, United Arab Emirates | 24°20′–25°15′ | 143.5 ± N | 0–100 | Schile et al. [57] |
Note: N Means that the standard error has no value.
Publisher’s Note: MDPI stays neutral with regard to jurisdictional claims in published maps and institutional affiliations. |
© 2022 by the authors. Licensee MDPI, Basel, Switzerland. This article is an open access article distributed under the terms and conditions of the Creative Commons Attribution (CC BY) license (https://creativecommons.org/licenses/by/4.0/).
Share and Cite
MDPI and ACS Style
Wen, W.; Zhu, Y.; Guo, J.; Pan, X.; Li, J.; Guo, Y.; Guo, J.; Wu, G.; Wang, Y.; Gong, M. Spatial Variation of Soil Organic Carbon from Bamen Bay Mangrove in Southern China. Water 2022, 14, 3278. https://doi.org/10.3390/w14203278
AMA Style
Wen W, Zhu Y, Guo J, Pan X, Li J, Guo Y, Guo J, Wu G, Wang Y, Gong M. Spatial Variation of Soil Organic Carbon from Bamen Bay Mangrove in Southern China. Water. 2022; 14(20):3278. https://doi.org/10.3390/w14203278
Chicago/Turabian StyleWen, Wanyu, Yaojun Zhu, Jia Guo, Xu Pan, Jing Li, Yanru Guo, Julan Guo, Gaojie Wu, Yuhang Wang, and Minghao Gong. 2022. "Spatial Variation of Soil Organic Carbon from Bamen Bay Mangrove in Southern China" Water 14, no. 20: 3278. https://doi.org/10.3390/w14203278
Note that from the first issue of 2016, this journal uses article numbers instead of page numbers. See further details here.