
Seasonal Variation of Water Quality Modulated Redox Regulatory System in the Apple Snail Pila globosa and Its Use as a Bioindicator Species in Freshwater Ecosystems across India

 , and
, and
Abstract
:
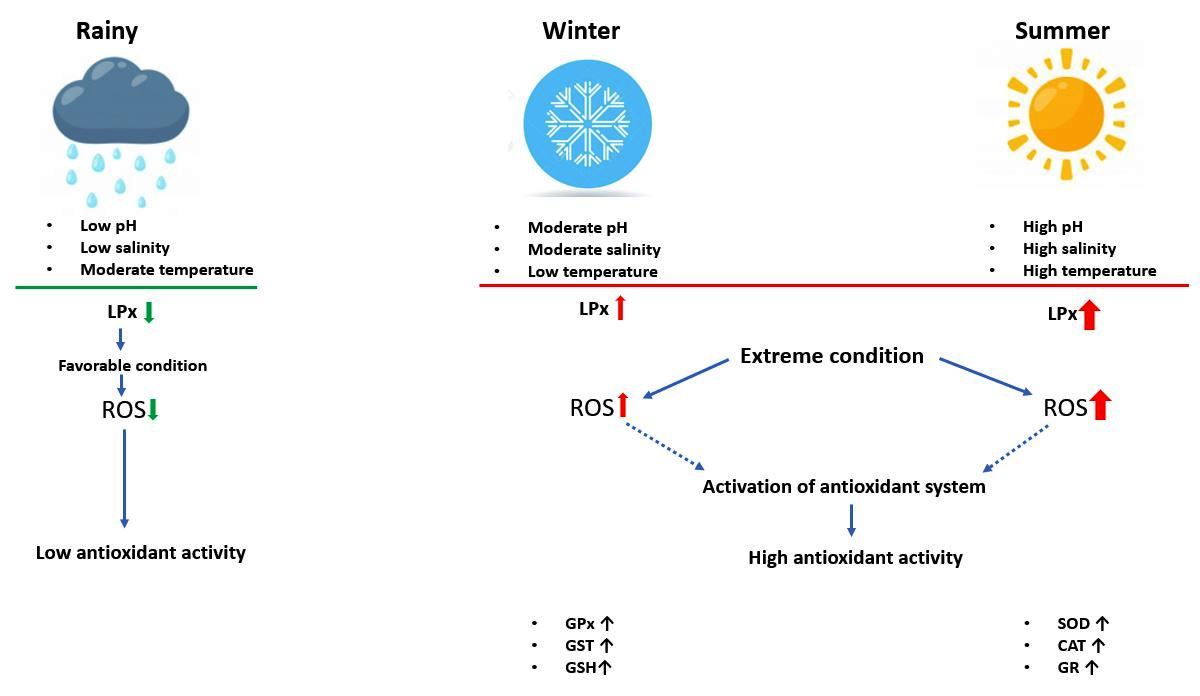
1. Introduction
2. Materials and Methods
2.1. Sampling Sites and Animals
2.2. Tissue Processing
2.3. Determination of Oxidative Stress
2.4. Determination of Antioxidant Activities
2.4.1. Superoxide Dismutase (SOD)
2.4.2. Catalase (CAT)
2.4.3. Glutathione Peroxidase (GPx)
2.4.4. Glutathione Reductase (GR)
2.5. Measurement of Small Redox Regulatory Molecule and Bio-Transferring Enzyme Activity
2.5.1. Ascorbic Acid (AA)
2.5.2. Non-Protein Sulfhydryl (-SH) Group
2.5.3. Glutathione-S-Transferase (GST)
2.6. Determination of Total Antioxidant Activity
2.7. Statistical Analysis
3. Result
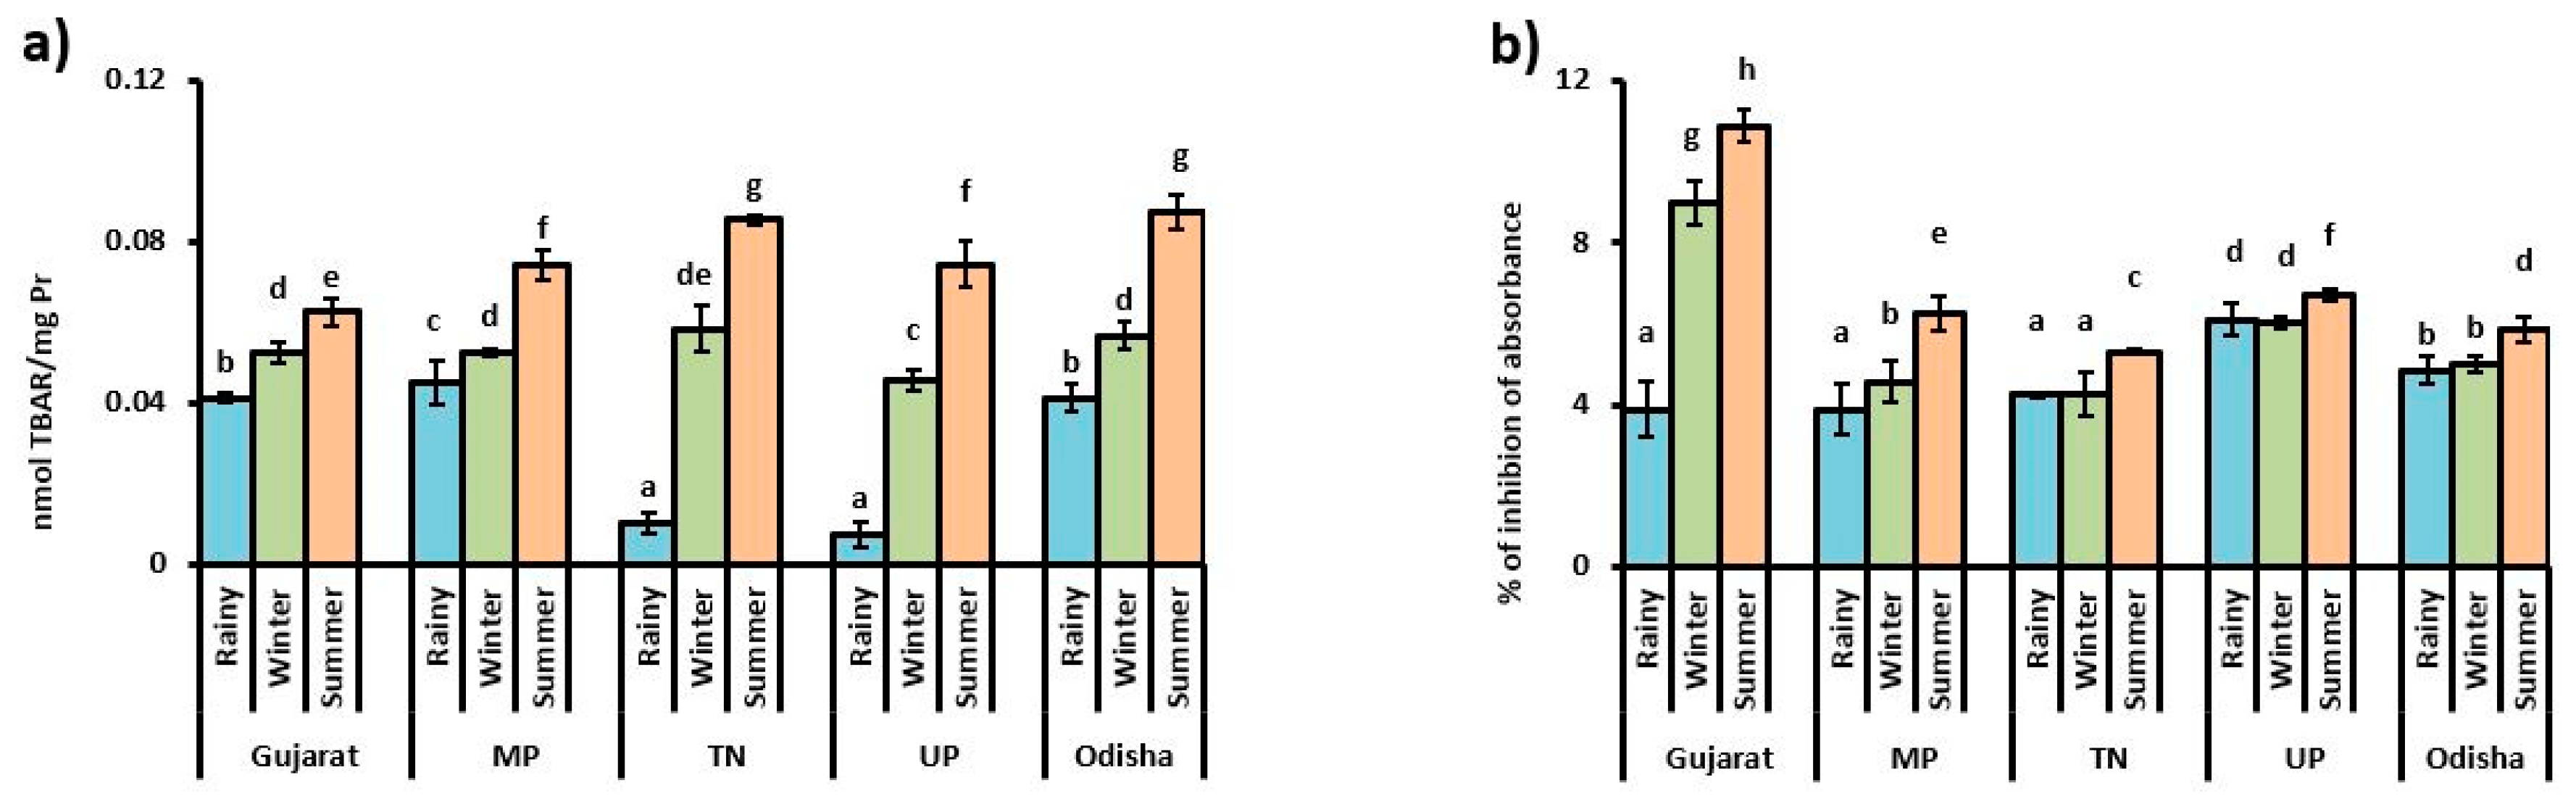
3.1. Oxidative Stress Indicator
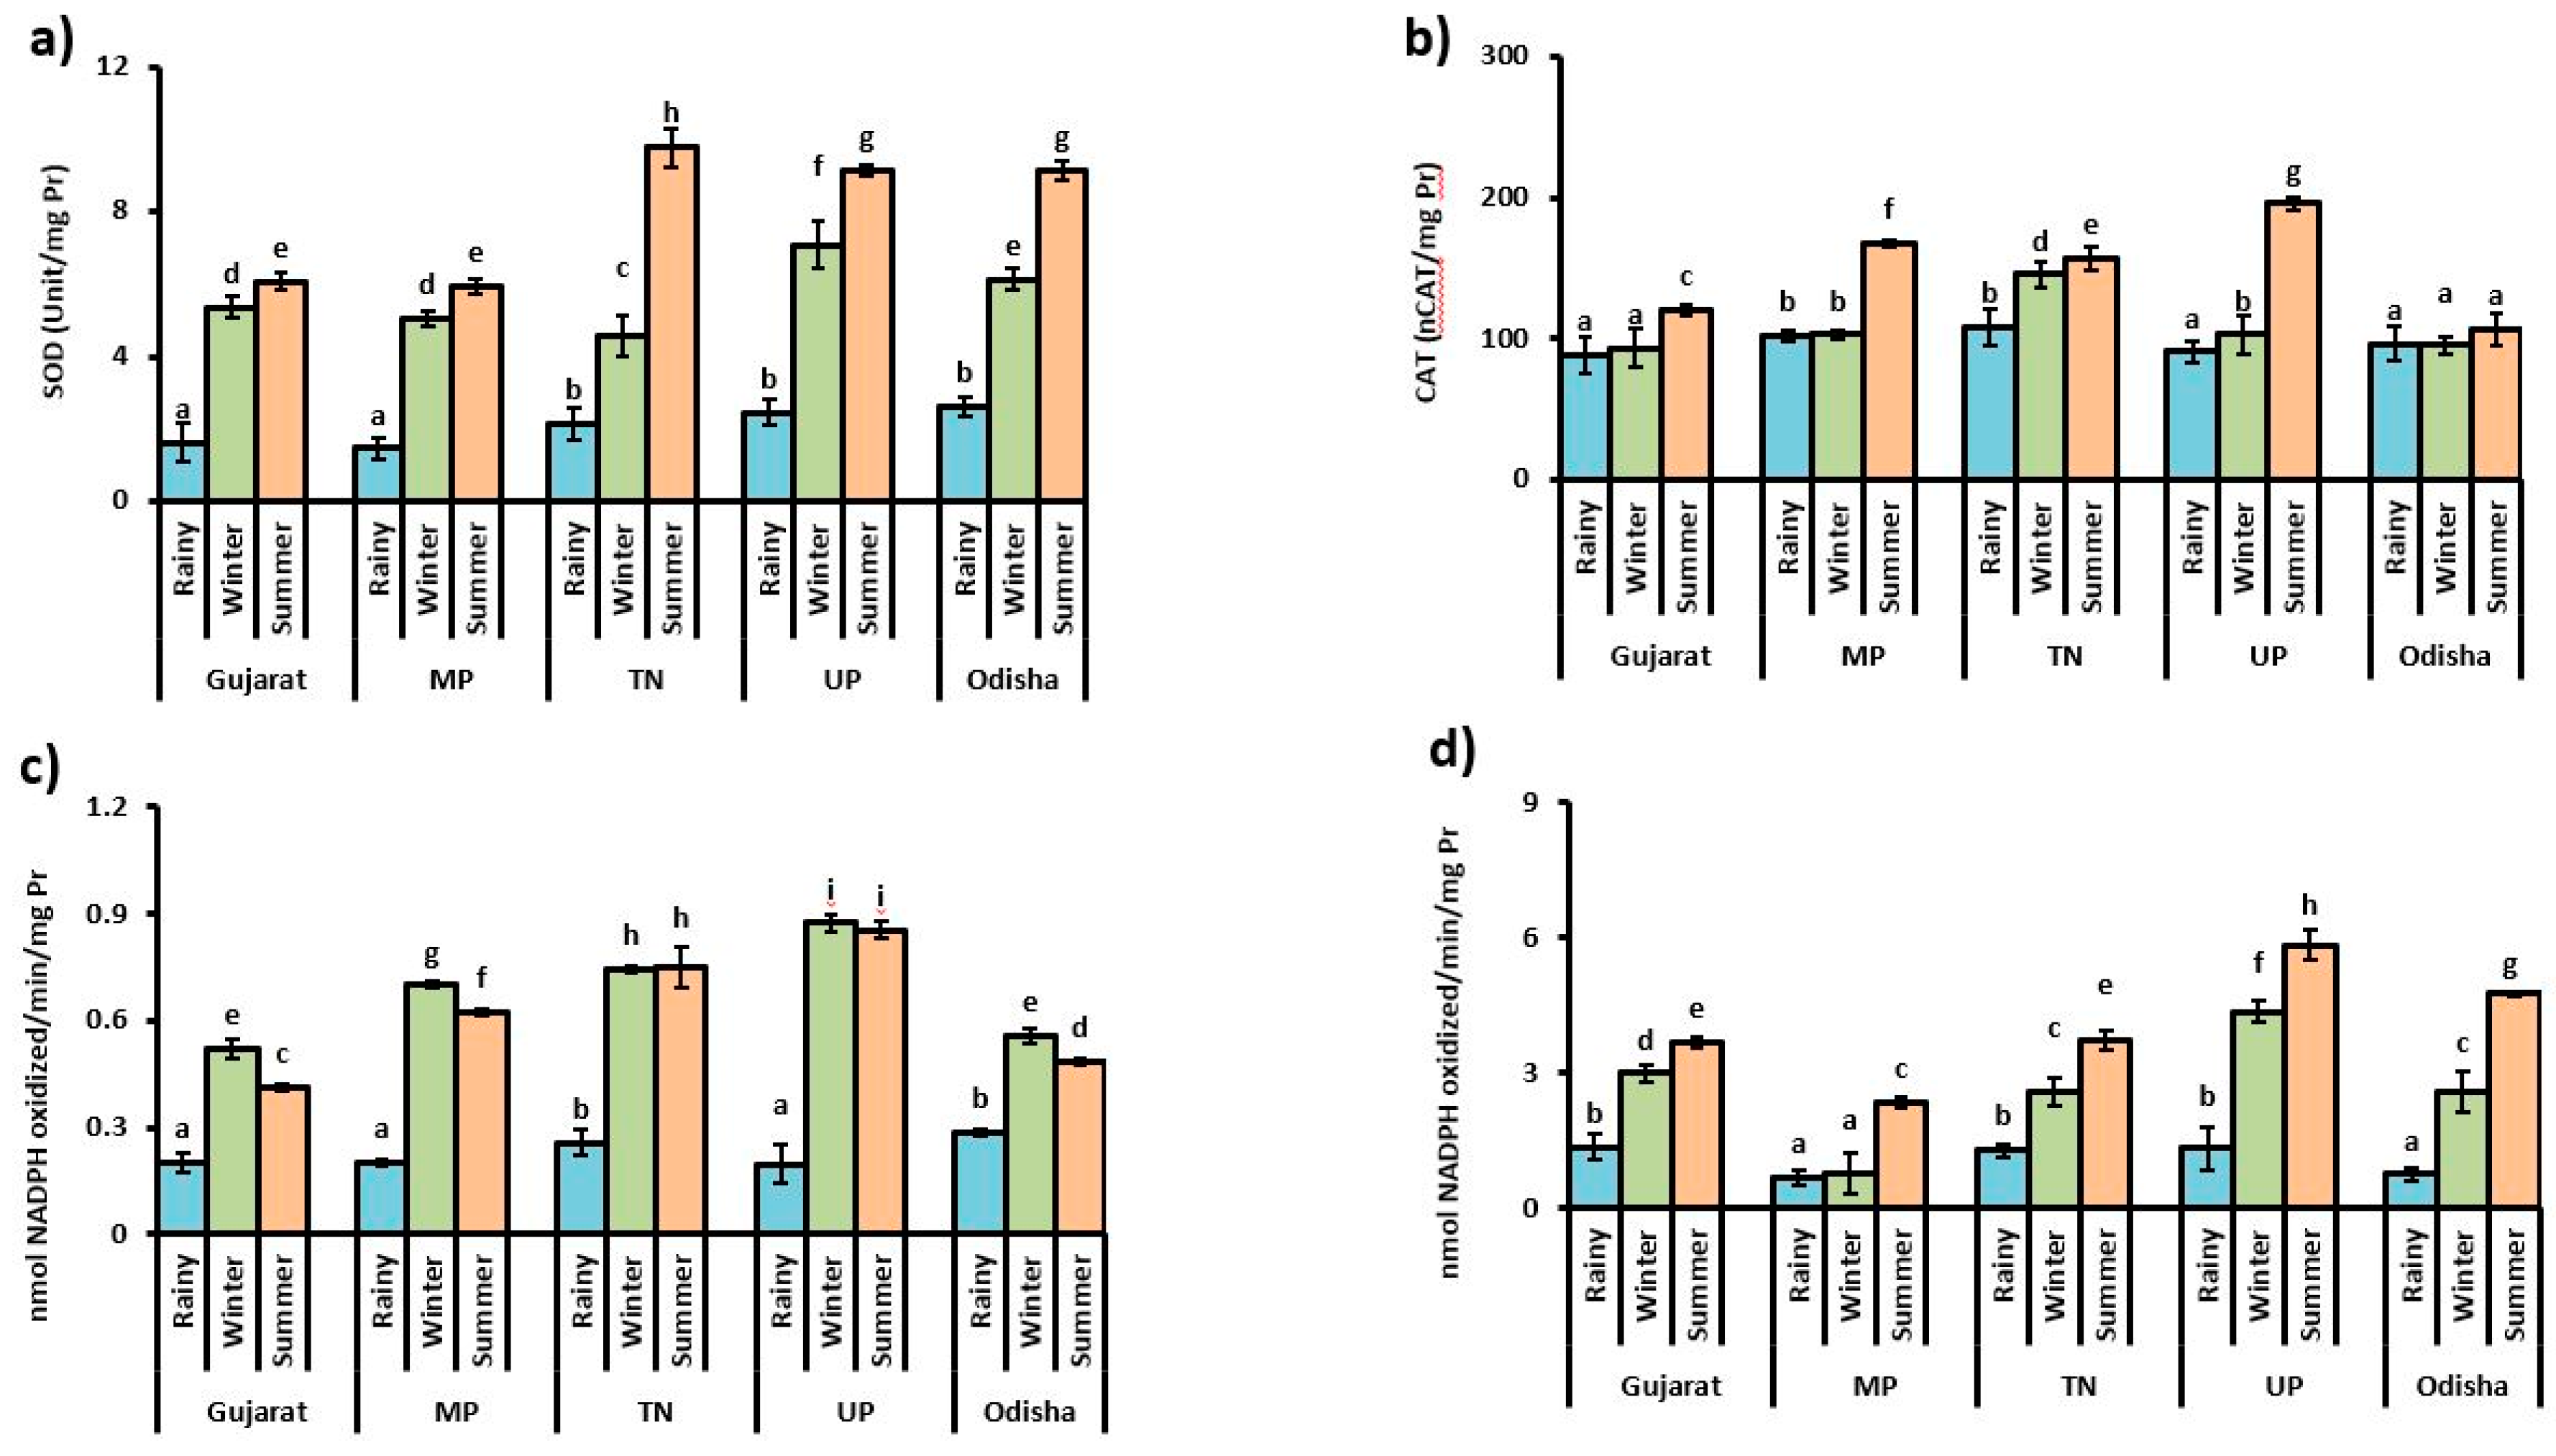
3.2. Antioxidant Enzyme Activities
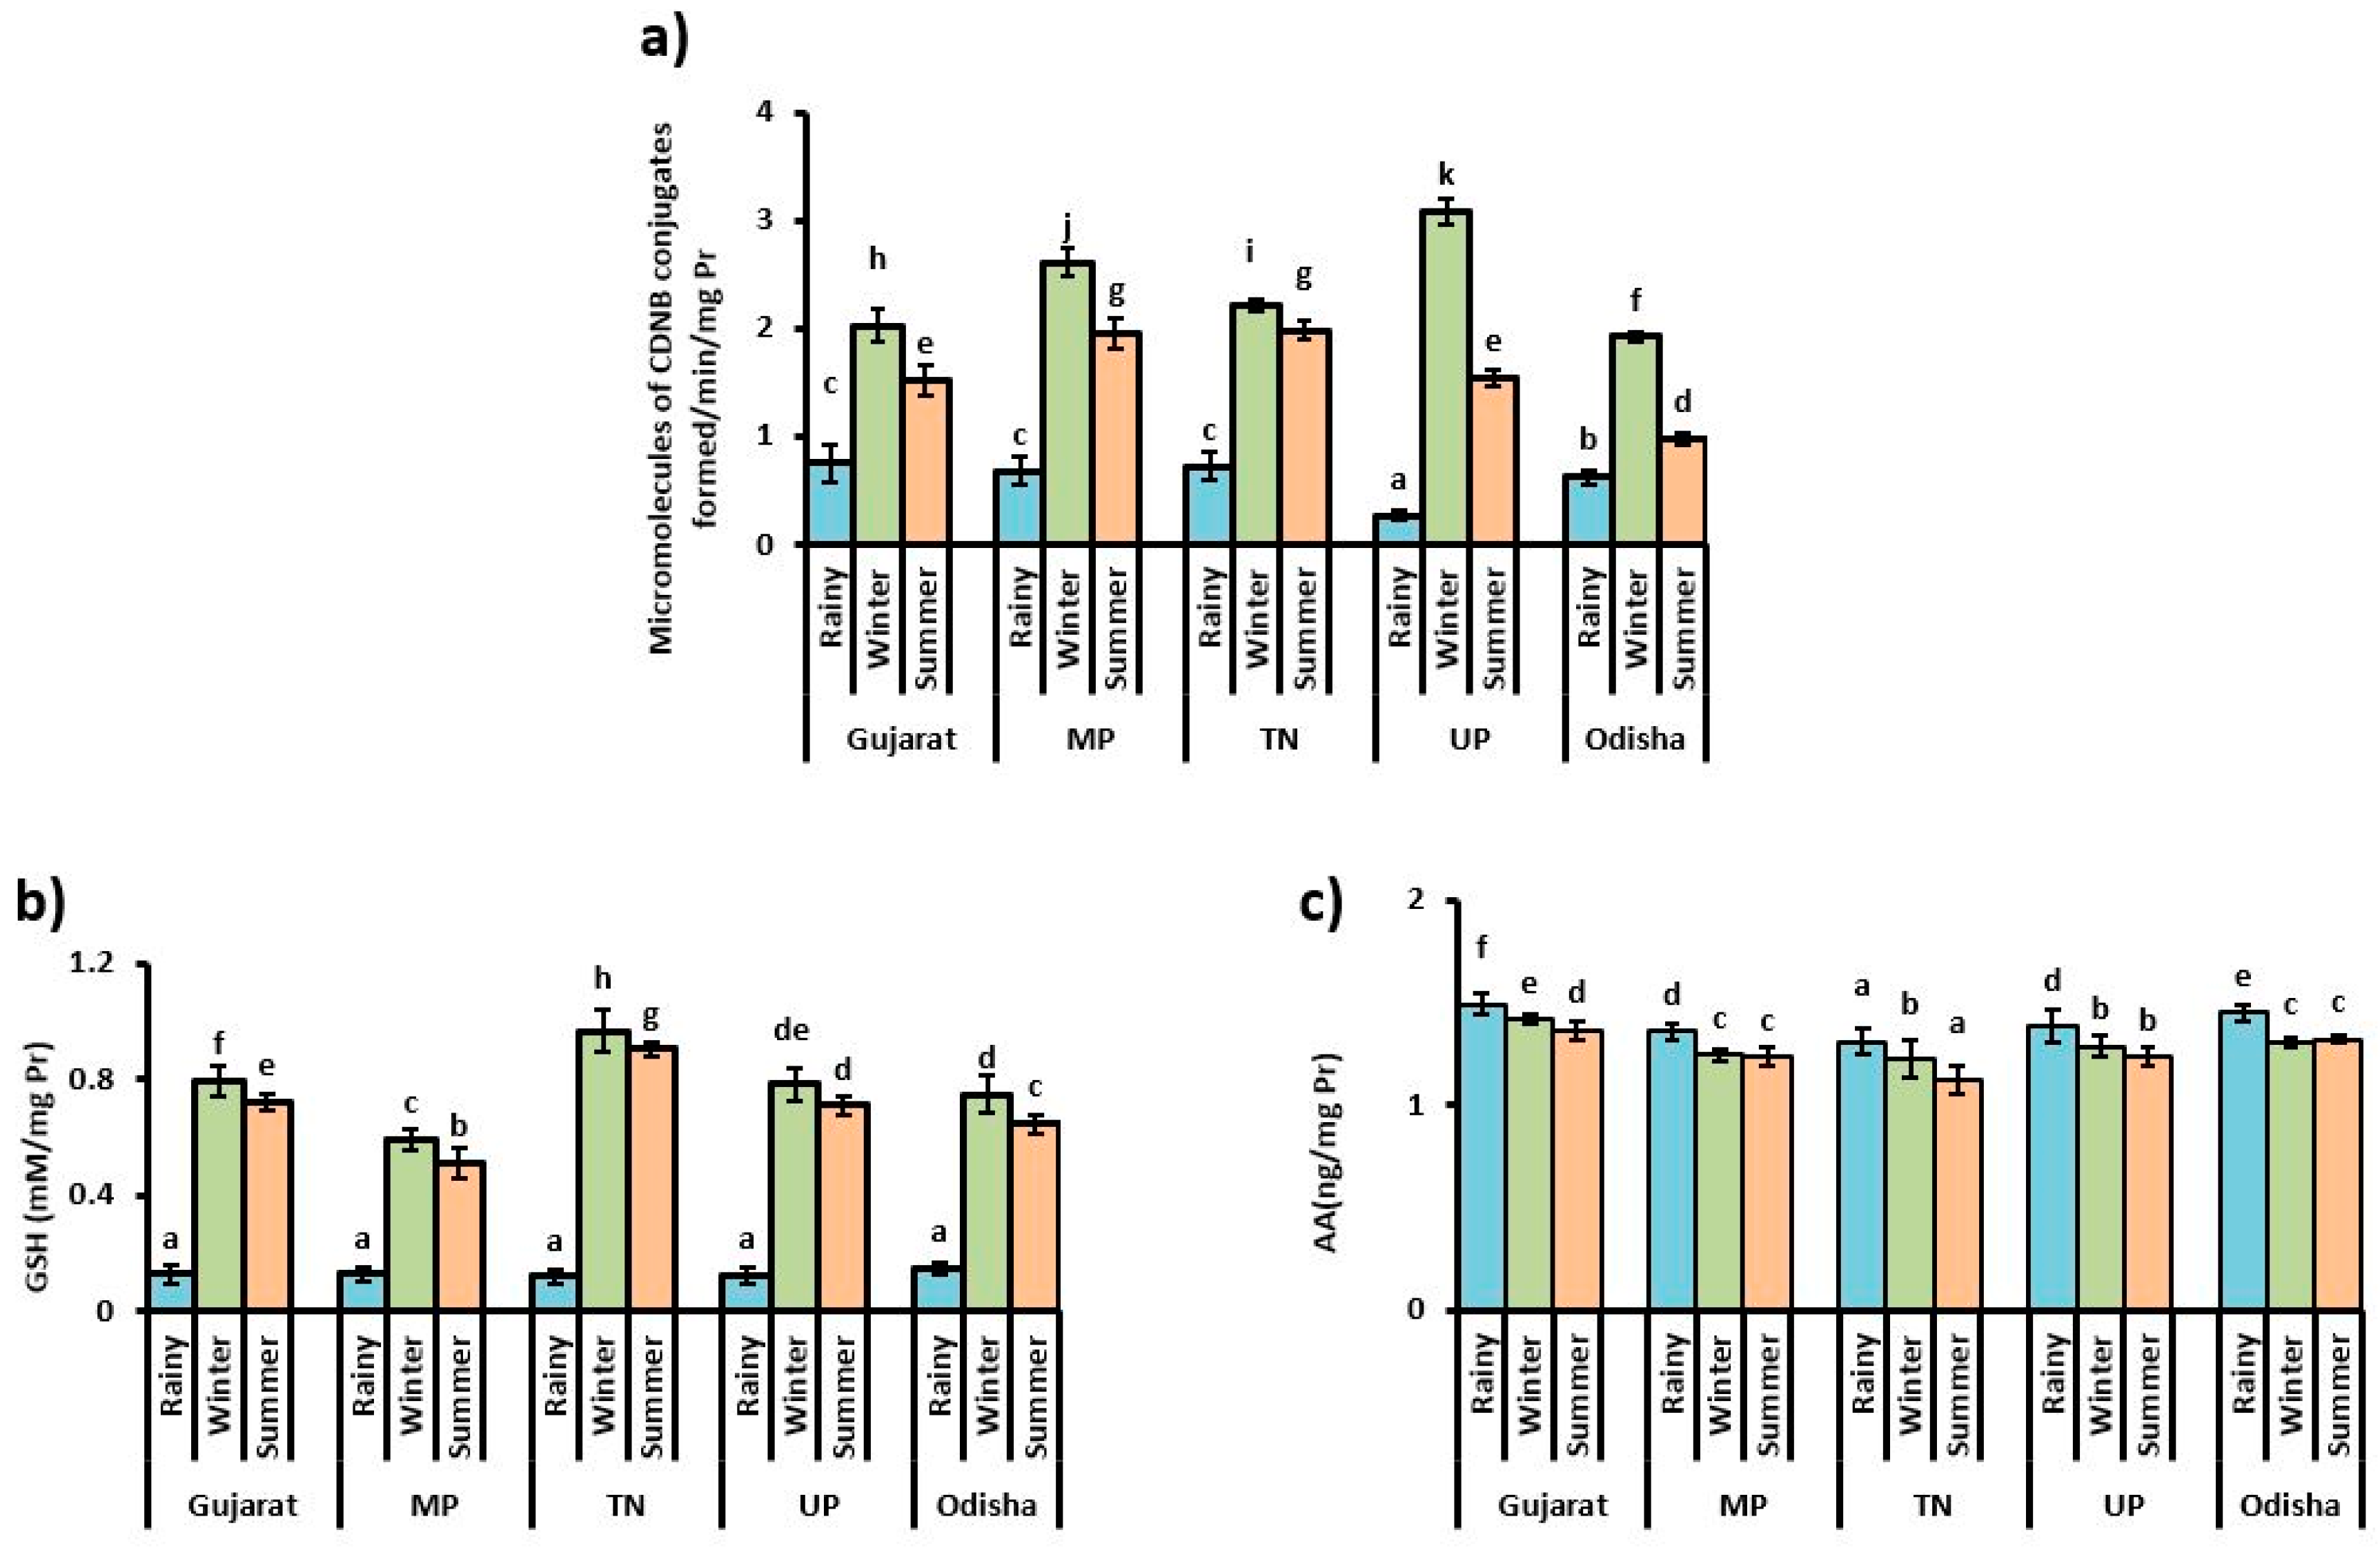
3.3. Content of Small Antioxidant Molecules and Bio-Transferring Enzyme Activity
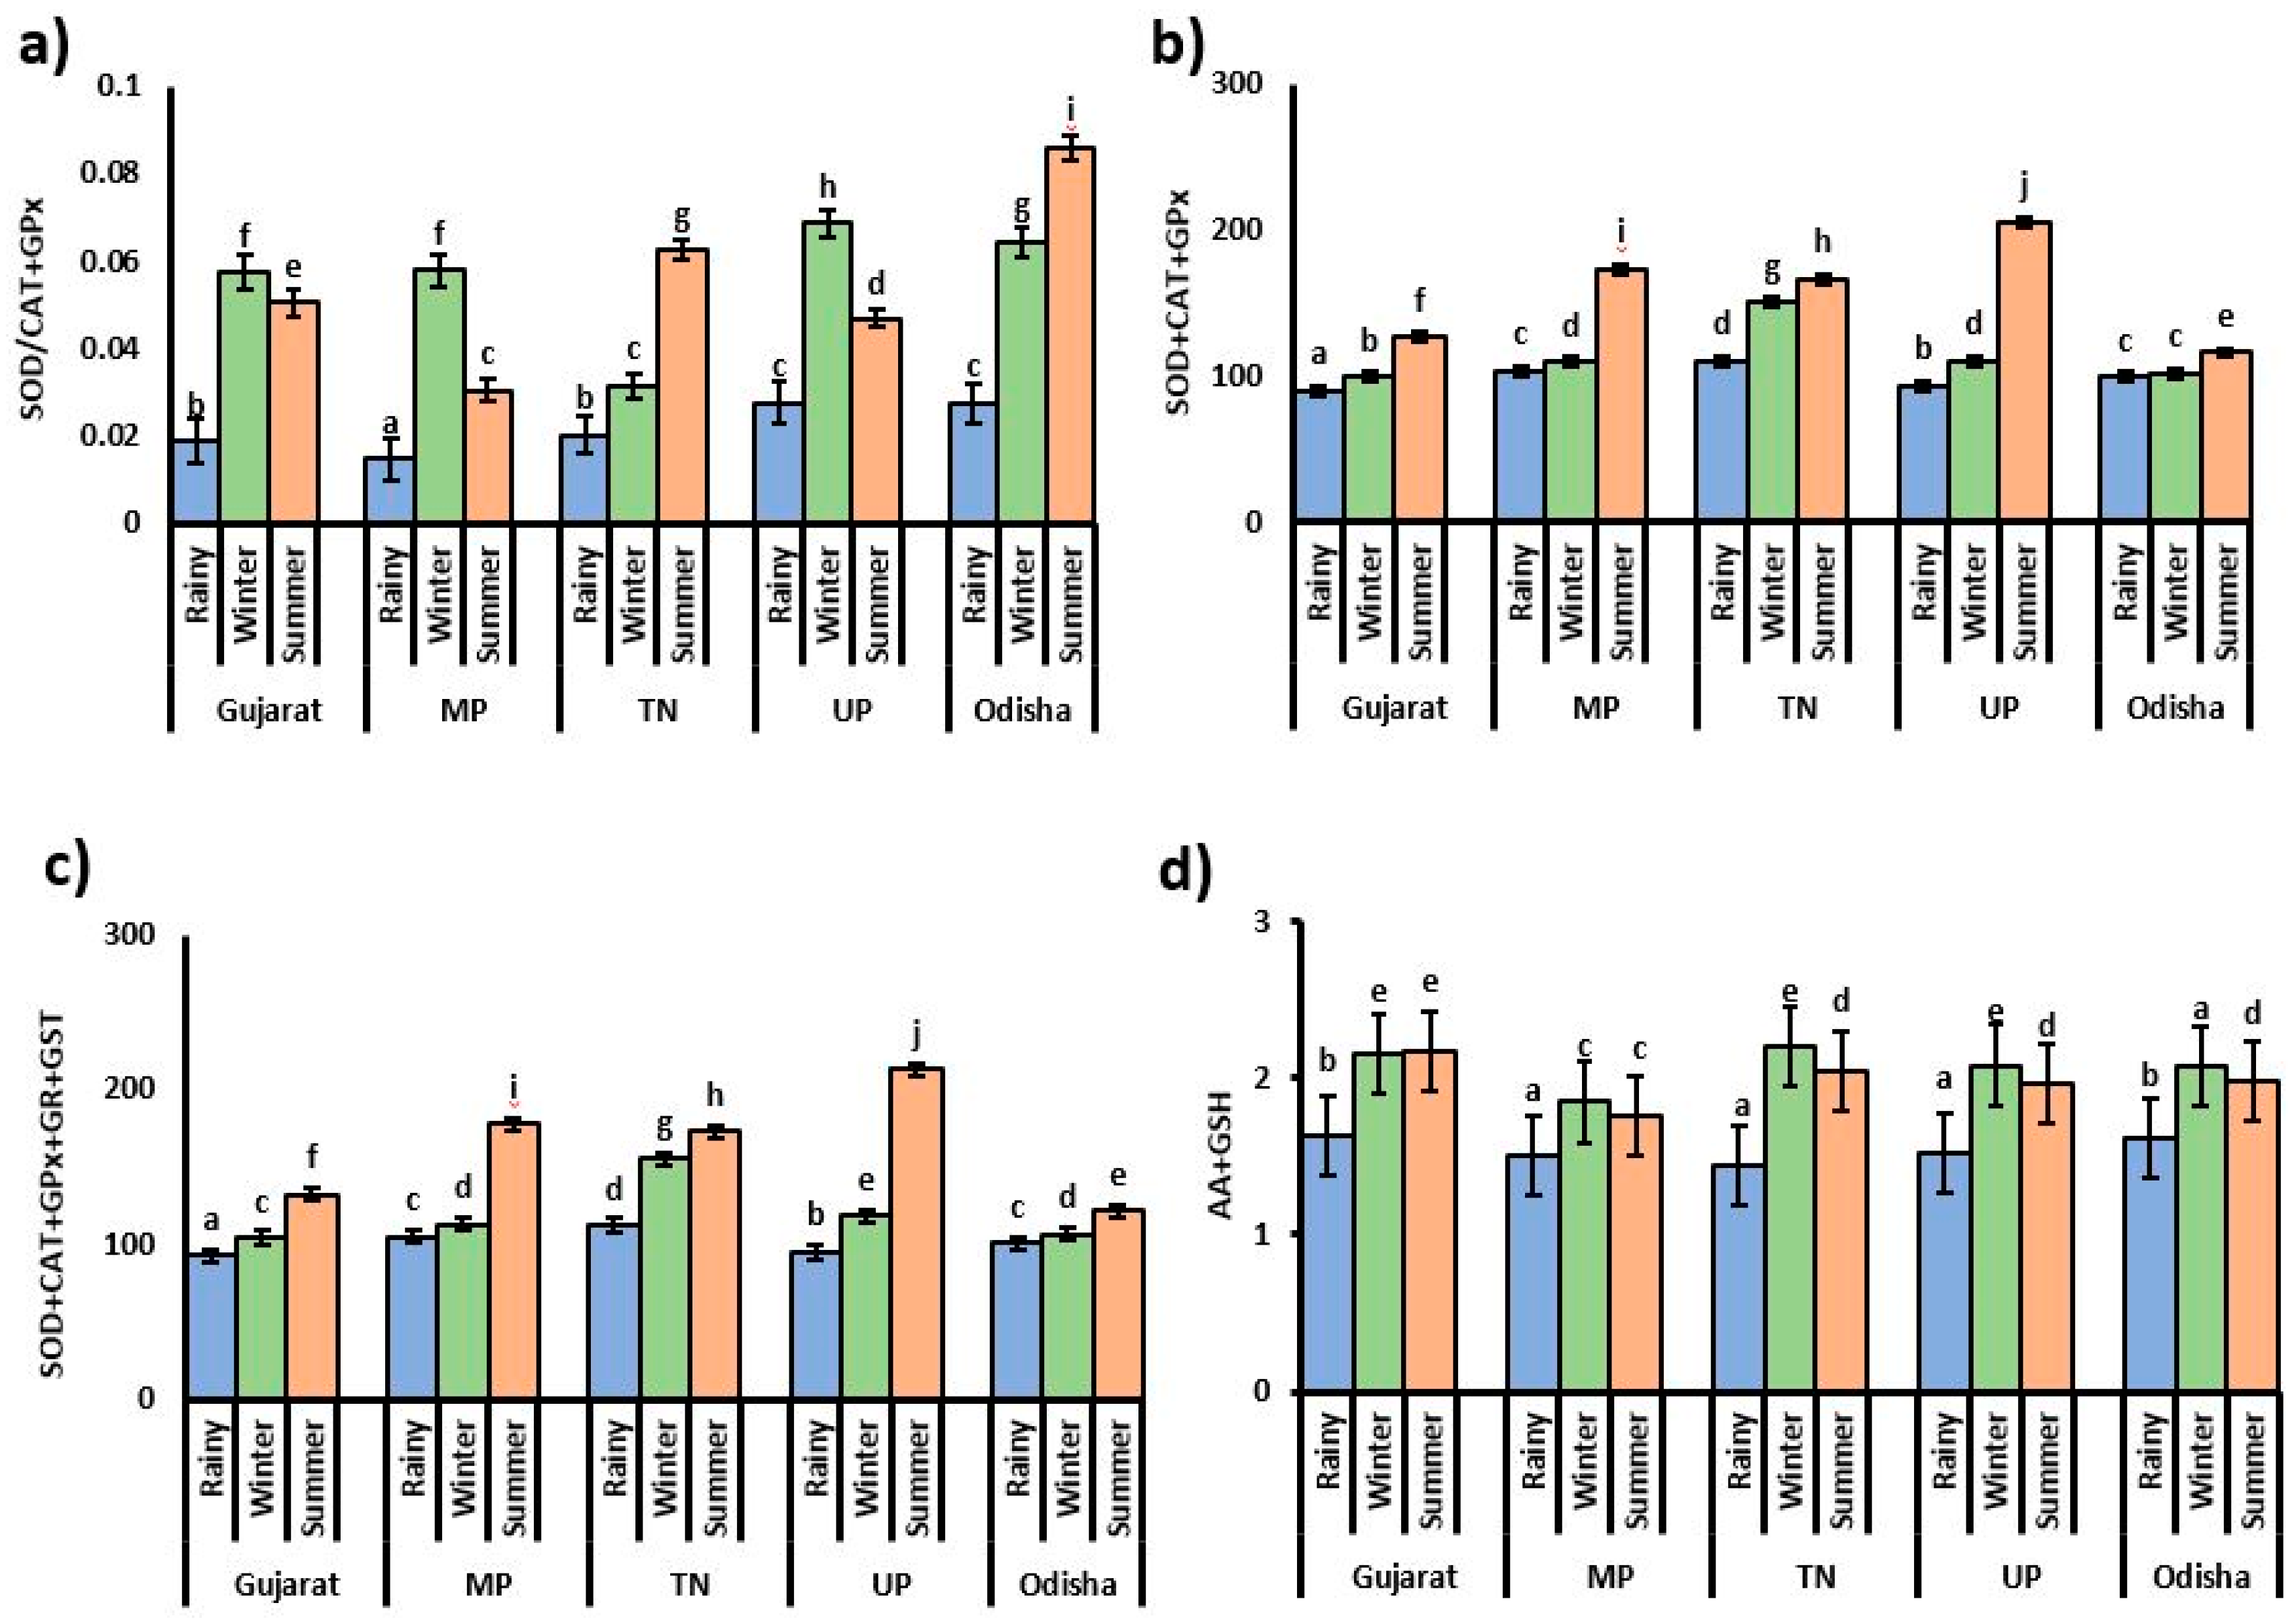
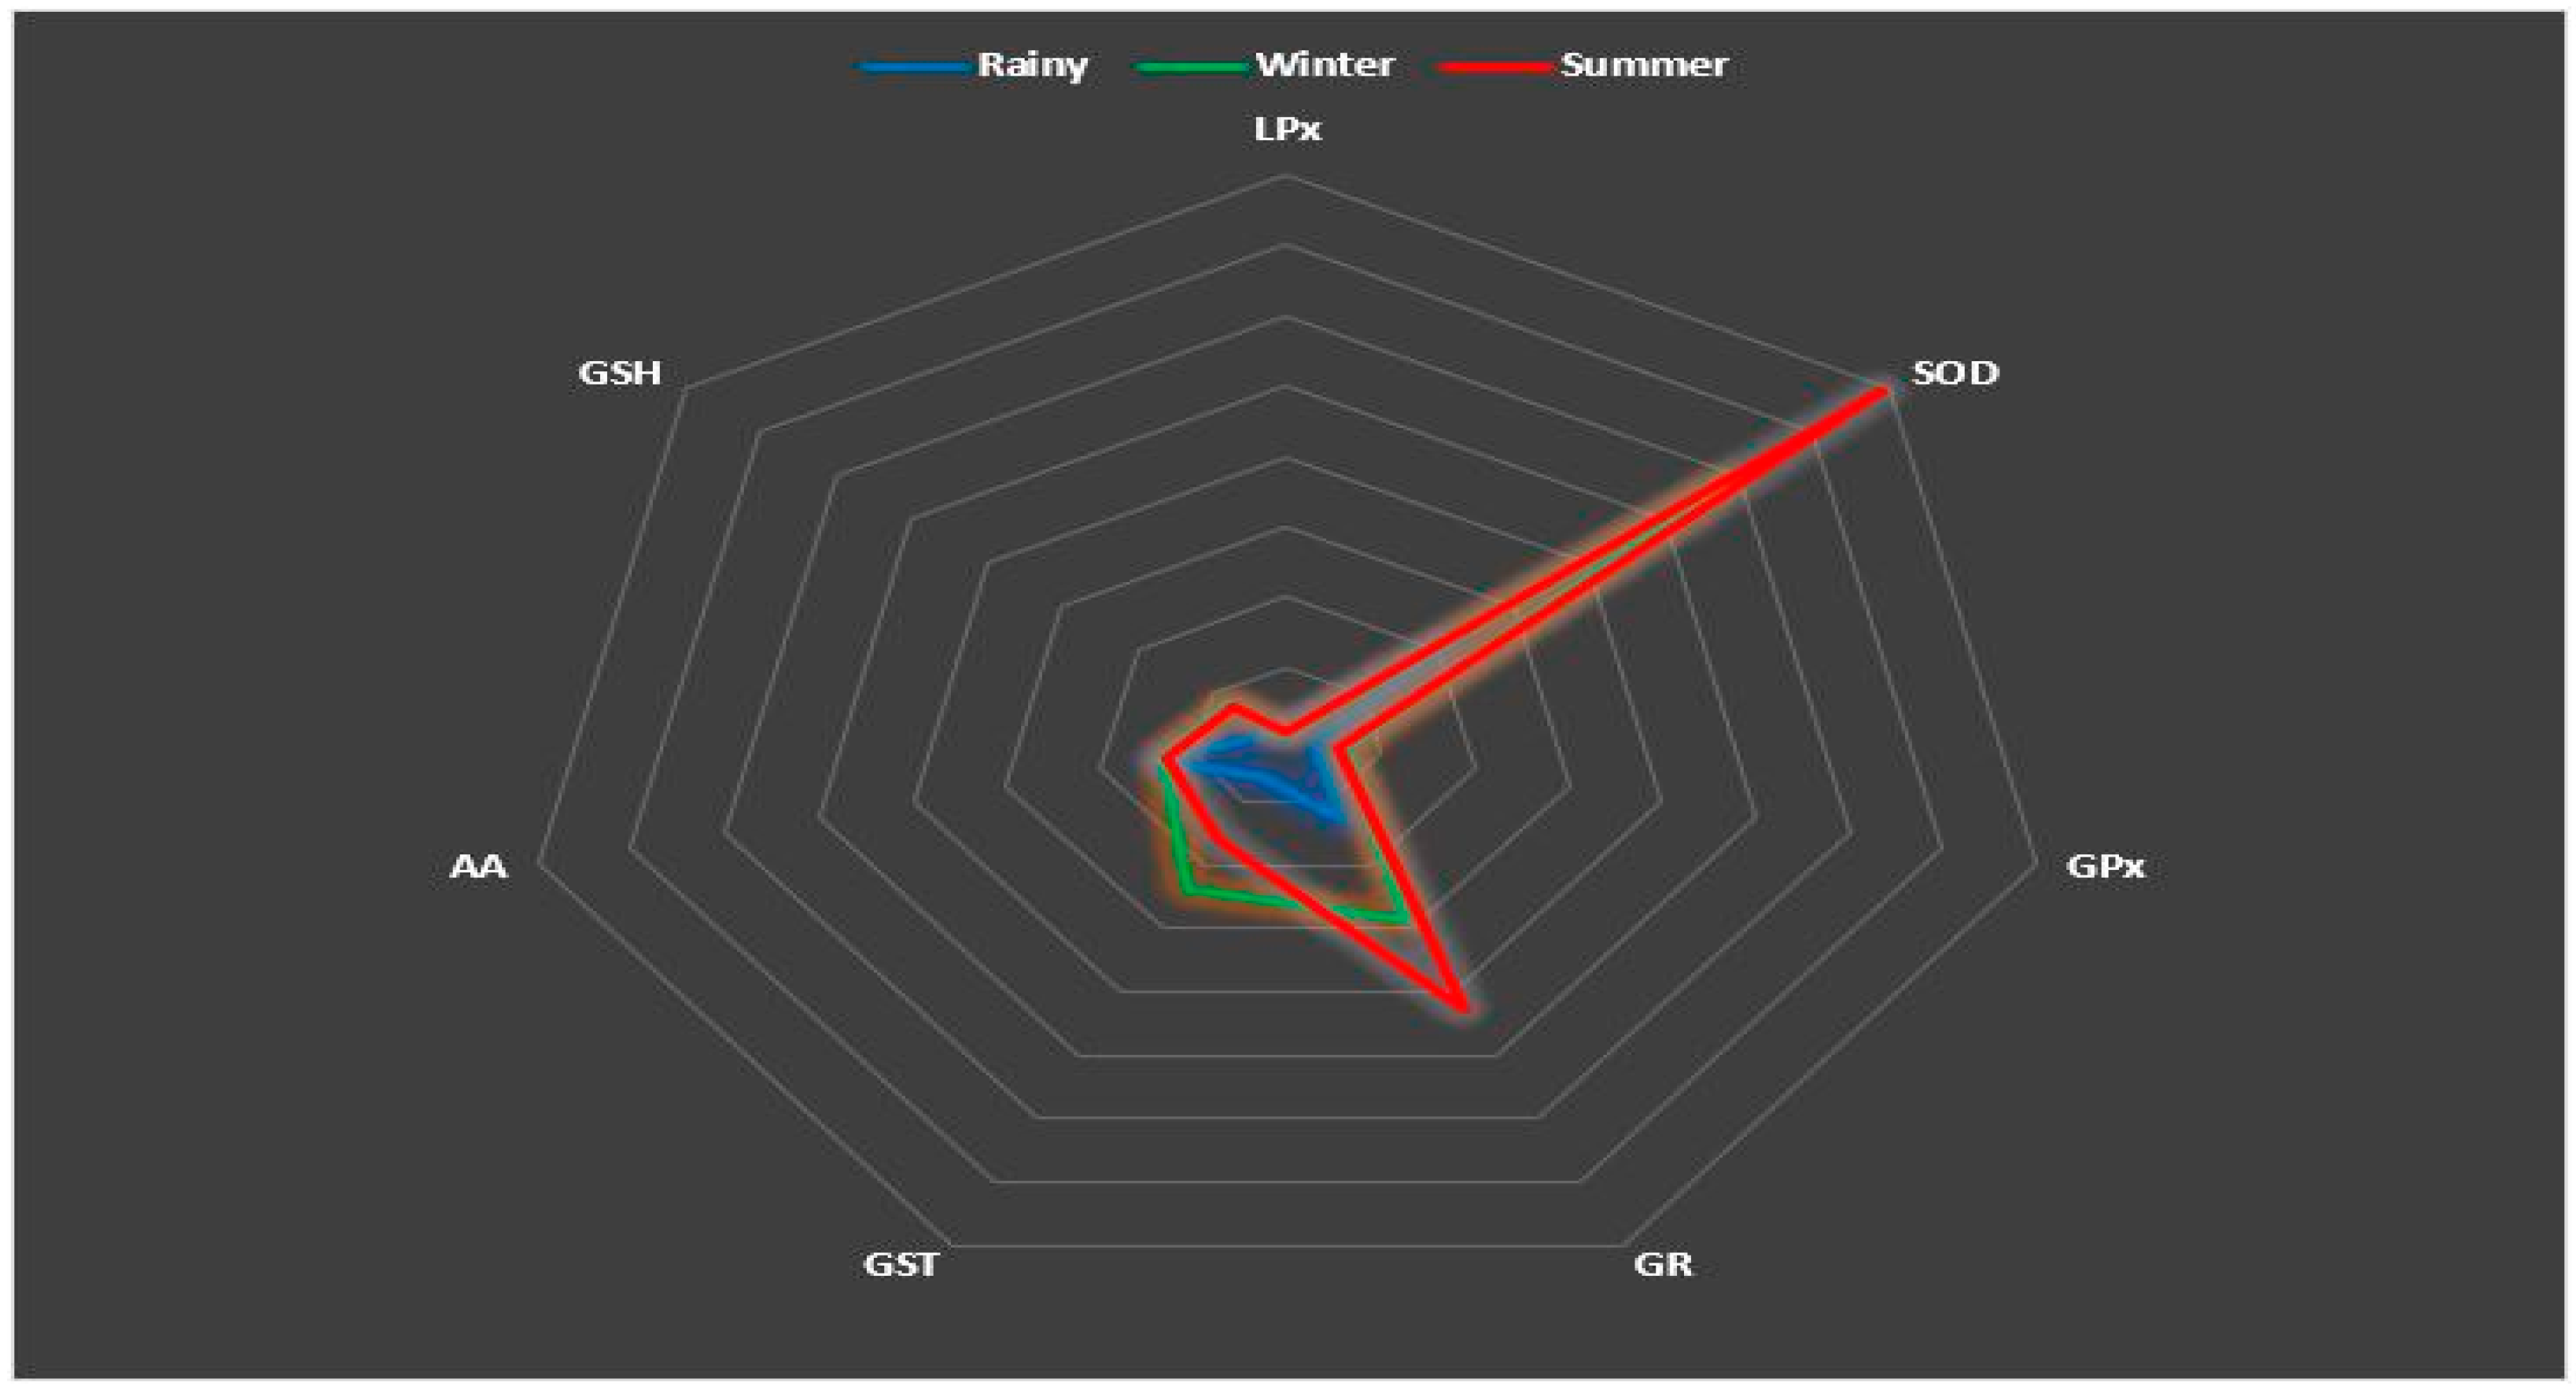
3.4. Relationships between Antioxidant Parameters
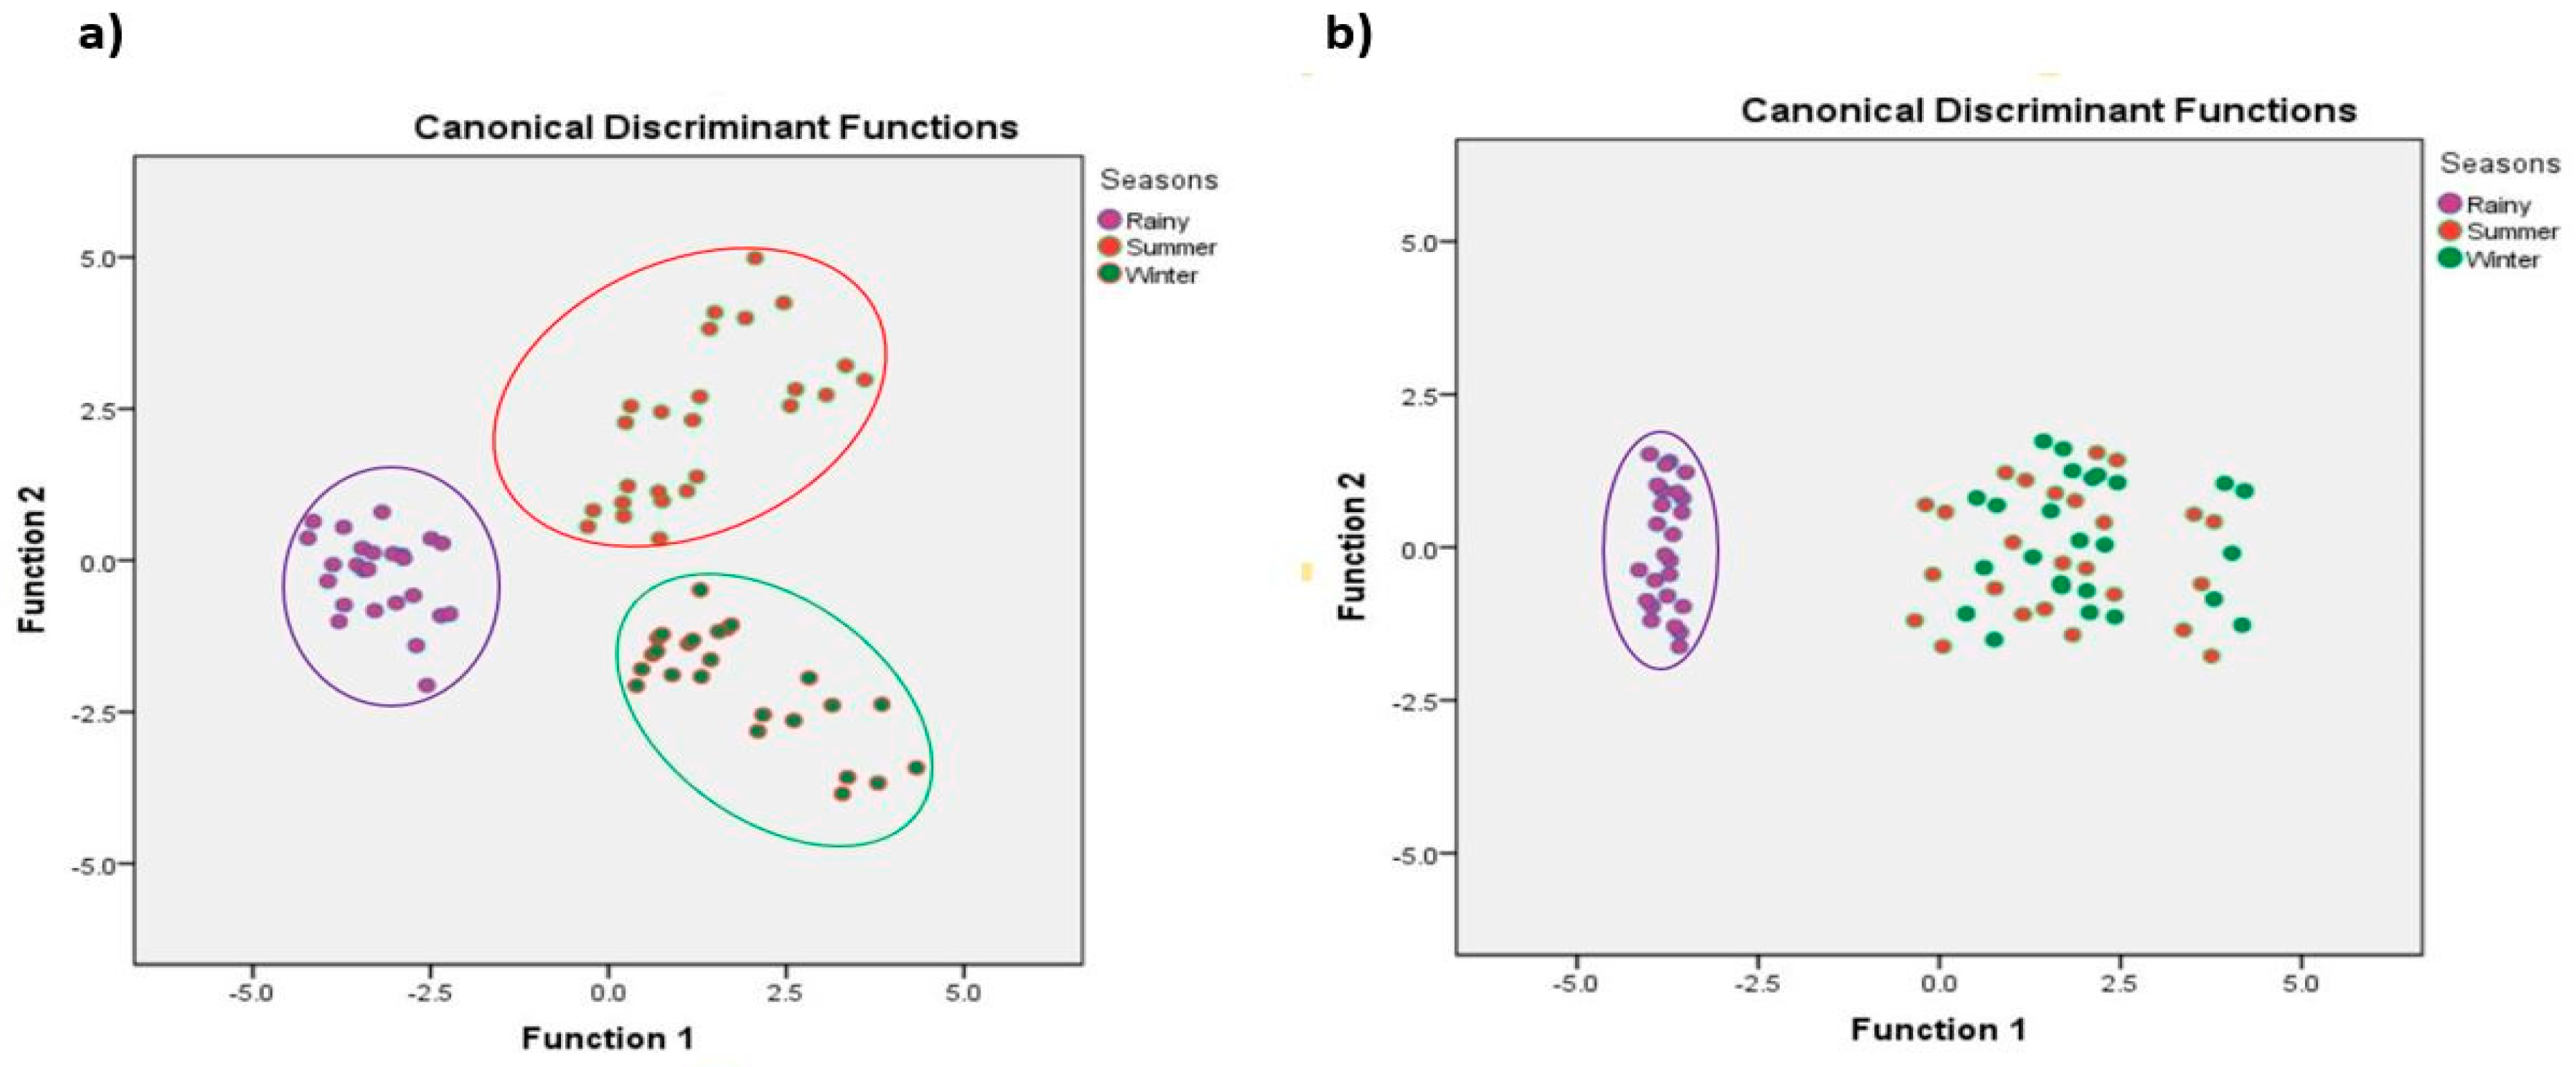
3.5. Correlation and DFA Analysis
4. Discussion
5. Conclusions
Author Contributions
Funding
Institutional Review Board Statement
Informed Consent Statement
Data Availability Statement
Acknowledgments
Conflicts of Interest
References
- Abele, D.; Zenteno-Savin, T.; Vazquez-Medina, J.P. Oxidative Stress in Aquatic Ecosystems; John Wiley & Sons: Hoboken, NJ, USA, 2011. [Google Scholar] [CrossRef]
- Halliwell, B. Biochemistry of Oxidative Stress. Biochem. Soc. Trans. 2007, 35, 1147–1150. [Google Scholar] [CrossRef] [PubMed]
- Paital, B.; Chainy, G.B.N. Effects of temperature on complex I and II mediated mitochondrial respiration, ROS generation and oxidative stress status in gills of the mud crab Scylla serrata. J. Therm. Biol. 2014, 41, 104–111. [Google Scholar] [CrossRef]
- Paital, B. Removing Small Non-Enzymatic Molecules for Biochemical Assay of Redox Regulatory Enzymes; An Exemplary Comments on “Antioxidant Responses in Gills and Digestive Gland of Oyster Crassostrea Madrasensis (Preston) under Lead Exposure. Ecotoxicol. Environ. Saf. 2018, 154, 337–340. [Google Scholar] [CrossRef]
- Birnie-Gauvin, K.; Costantini, D.; Cooke, S.J.; Willmore, W.G. A Comparative and Evolutionary Approach to Oxidative Stress in Fish: A Review. Fish Fish. 2017, 18, 928–942. [Google Scholar] [CrossRef]
- Paital, B.; Chainy, G.B.N. Antioxidant Defenses and Oxidative Stress Parameters in Tissues of Mud Crab (Scylla Serrata) with Reference to Changing Salinity. Comp. Biochem. Physiol. Part C Toxicol. Pharmacol. 2010, 151, 142–151. [Google Scholar] [CrossRef] [PubMed]
- Paital, B. Antioxidant and Oxidative Stress Parameters in Brain of Heteropneustes Fossilis under Air Exposure Condition; Role of Mitochondrial Electron Transport Chain. Ecotoxicol. Environ. Saf. 2013, 95, 69–77. [Google Scholar] [CrossRef] [PubMed]
- Dobal, V.; Suárez, P.; Ruiz, Y.; García-Martín, O.; San Juan, F. Activity of Antioxidant Enzymes in Mytilus Galloprovincialis Exposed to Tar: Integrated Response of Different Organs as Pollution Biomarker in Aquaculture Areas. Aquaculture 2022, 548, 737638. [Google Scholar] [CrossRef]
- Panda, F.; Pati, S.G.; Bal, A.; Mathur, S.; Nirmaladevi, R.; Paital, B. Temporal Morphometric Analyses of Pila Globosa in India for Its Use in Aquaculture and Food Industry. J. Basic Appl. Zool. 2021, 82, 17. [Google Scholar] [CrossRef]
- Pati, S.G.; Panda, F.; Samanta, L.; Paital, B. Spatio-Temporal Changes in Oxidative Stress Physiology Parameters in Apple Snail Pila Globosa as a Function of Soil Mg, Ca, Organic Carbon and Aquatic Physico-Chemical Factors. Environ. Geochem. Health 2022, 1–20. [Google Scholar] [CrossRef]
- Ohkawa, H.; Ohishi, N.; Yagi, K. Assay for Lipid Peroxides in Animal Tissues by Thiobarbituric Acid Reaction. Anal. Biochem. 1979, 95, 351–358. [Google Scholar] [CrossRef]
- Das, K.; Samanta, L.; Chainy, G.B.N. A Modified Spectrophotometric Assay of Superoxide Dismutase Using Nitrite Formation by Superoxide Radicals. Indian J. Biochem. Biophys. 2000, 37, 201–204. [Google Scholar]
- Aebi, H. Catalase. Methods of Enzymatic Analysis; Second, E., Ed.; Academic Press: Cambridge, MA, USA, 1974; pp. 673–684. ISBN 978-0-12-091302-2. [Google Scholar]
- Paglia, D.E.; Valentine, W.N. Studies on the Quantitative and Qualitative Characterization of Erythrocyte Glutathione Peroxidase. J. Lab. Clin. Med. 1967, 70, 158–169. [Google Scholar] [CrossRef] [PubMed]
- Massey, V.; Williams, C.H. On the Reaction Mechanism of Yeast Glutathione Reductase. J. Biol. Chem. 1965, 240, 4470–4480. [Google Scholar] [CrossRef]
- Mitsui, A.; Ohta, T. Photooxidative consumption and photoreductive formation of ascorbic acid in green leaves. Plant Cell Physiol. 1961, 2, 31–44. [Google Scholar] [CrossRef]
- Sedlak, J.; Lindsay, R.H. Estimation of Total, Protein-Bound, and Nonprotein Sulfhydryl Groups in Tissue with Ellman’s Reagent. Anal. Biochem. 1968, 25, 192–205. [Google Scholar] [CrossRef]
- Keen, J.H.; Habig, W.H.; Jakoby, W.B. Mechanism for the Several Activities of the Glutathione S-Transferases. J. Biol. Chem. 1976, 251, 6183–6188. [Google Scholar] [CrossRef]
- Bal, A.; Pati, S.G.; Panda, F.; Paital, B. Modification of the Time of Incubation in Colorimetric Method for Accurate Determination of the Total Antioxidants Capacity Using 2,2-Diphenyl-1-Picrylhydrazyl Stable Free Radical. J. Appl. Biol. Biotechnol. 2021, 9, 156–161. [Google Scholar] [CrossRef]
- Singh, R.P.; Chidambara Murthy, K.N.; Jayaprakasha, G.K. Studies on the Antioxidant Activity of Pomegranate (Punica Granatum) Peel and Seed Extracts Using in Vitro Models. J. Agric. Food Chem. 2002, 50, 81–86. [Google Scholar] [CrossRef] [PubMed]
- Bal, A.; Panda, F.; Pati, S.G.; Das, K.; Agrawal, P.K.; Paital, B. Modulation of Physiological Oxidative Stress and Antioxidant Status by Abiotic Factors Especially Salinity in Aquatic Organisms. Comp. Biochem. Physiol. Part C Toxicol. Pharmacol. 2021, 241, 108971. [Google Scholar] [CrossRef]
- Panda, F.; Pati, S.G.; Bal, A.; Das, K.; Samanta, L.; Paital, B. Control of Invasive Apple Snails and Their Use as Pollutant Ecotoxic Indicators: A Review. Environ. Chem. Lett. 2021, 19, 4627–4653. [Google Scholar] [CrossRef]
- Ramos-Vasconcelos, G.R.; Cardoso, L.A.; Hermes-Lima, M. Seasonal Modulation of Free Radical Metabolism in Estivating Land Snails Helix Aspersa. Comp. Biochem. Physiol. Part C Toxicol. Pharmacol. 2005, 140, 165–174. [Google Scholar] [CrossRef] [PubMed]
- Viarengo, A.; Canesi, L.; Pertica, M.; Livingstone, D.R. Seasonal Variations in the Antioxidant Defence Systems and Lipid Peroxidation of the Digestive Gland of Mussels. Comp. Biochem. Physiol. Part C Comp. Pharmacol. 1991, 100, 187–190. [Google Scholar] [CrossRef]
- Power, A.; Sheehan, D. Seasonal Variation in the Antioxidant Defence Systems of Gill and Digestive Gland of the Blue Mussel, Mytilus Edulis. Comp. Biochem. Physiol. Part C Pharmacol. Toxicol. Endocrinol. 1996, 114, 99–103. [Google Scholar] [CrossRef]
- Wilhelm Filho, D.; Tribess, T.; Gáspari, C.; Claudio, F.D.; Torres, M.A.; Magalhães, A.R.M. Seasonal Changes in Antioxidant Defenses of the Digestive Gland of the Brown Mussel (Perna Perna). Aquaculture 2001, 203, 149–158. [Google Scholar] [CrossRef]
- Giraud-Billoud, M.; Abud, M.A.; Cueto, J.A.; Vega, I.A.; Castro-Vazquez, A. Uric Acid Deposits and Estivation in the Invasive Apple-Snail, Pomacea Canaliculata. Comp. Biochem. Physiol. Part A Mol. Integr. Physiol. 2011, 158, 506–512. [Google Scholar] [CrossRef] [PubMed]
- Lushchak, V.I.; Bagnyukova, T. V Temperature Increase Results in Oxidative Stress in Goldfish Tissues. 1. Indices of Oxidative Stress. Comp. Biochem. Physiol. Part C Toxicol. Pharmacol. 2006, 143, 30–35. [Google Scholar] [CrossRef] [PubMed]
- Shirai, N.; Suzuki, H.; Toukairin, S.; Wada, S. Spawning and Season Affect Lipid Content and Fatty Acid Composition of Ovary and Liver in Japanese Catfish (Silurus Asotus). Comp. Biochem. Physiol. Part B Biochem. Mol. Biol. 2001, 129, 185–195. [Google Scholar] [CrossRef]
- Afshari, A.T.; Shirpoor, A.; Farshid, A.; Saadatian, R.; Rasmi, Y.; Saboory, E.; Ilkhanizadeh, B.; Allameh, A. The Effect of Ginger on Diabetic Nephropathy, Plasma Antioxidant Capacity and Lipid Peroxidation in Rats. Food Chem. 2007, 101, 148–153. [Google Scholar] [CrossRef]
- Djordjevic, A.; Spasic, S.; Jovanovic-Galovic, A.; Djordjevic, R.; Grubor-Lajsic, G. Oxidative Stress in Diabetic Pregnancy: SOD, CAT and GSH-Px Activity and Lipid Peroxidation Products. J. Matern. Neonatal Med. 2004, 16, 367–372. [Google Scholar] [CrossRef]
- Pakay, J.L.; Withers, P.C.; Hobbs, A.A.; Guppy, M. In Vivo Downregulation of Protein Synthesis in the Snail Helix Apersa during Estivation. Am. J. Physiol. Integr. Comp. Physiol. 2002, 283, R197–R204. [Google Scholar] [CrossRef]
- Carter, C.G.; Houlihan, D.F. Protein Synthesis. In Nitrogen Excretion; Academic Press: Cambridge, MA, USA, 2001; Volume 20, pp. 31–75. ISBN 1546-5098. [Google Scholar]
- Antunes, F.; Han, D.; Cadenas, E. Relative Contributions of Heart Mitochondria Glutathione Peroxidase and Catalase to H2O2 Detoxification in in Vivo Conditions. Free Radic. Biol. Med. 2002, 33, 1260–1267. [Google Scholar] [CrossRef]
- Chen, J.; Bhandar, B.; Kavdia, M. Interaction of ROS and RNS with GSH and GSH/GPX Systems. FASEB J. 2015, 29, 636–637. [Google Scholar] [CrossRef]
- Olawale, O.; Onwurah, I. Glutathione S-Transferase (GST) Activity as a Biomarker in Ecological Risk Assessment of Pesticide Contaminated Environment. Afr. J. Biotechnol. 2007, 6, 1455–1459. [Google Scholar]
- Burns, J.J.; Evans, C. The synthesis of l-ascorbic acid in the rat from d-glucuronolactone and l-gulonolactone. J. Biol. Chem. 1956, 223, 897–905. [Google Scholar] [CrossRef]
- Moreau, R.; Kaushik, S.J.; Dabrowski, K. Ascorbic Acid Status as Affected by Dietary Treatment in the Siberian Sturgeon (Acipenser Baeri Brandt): Tissue Concentration, Mobilisation and L-Gulonolactone Oxidase Activity. Fish Physiol. Biochem. 1996, 15, 431–438. [Google Scholar] [CrossRef] [PubMed]
- Ighodaro, O.M.; Akinloye, O.A. First Line Defence Antioxidants-Superoxide Dismutase (SOD), Catalase (CAT) and Glutathione Peroxidase (GPX): Their Fundamental Role in the Entire Antioxidant Defence Grid. Alex. J. Med. 2018, 54, 287–293. [Google Scholar] [CrossRef] [Green Version]
- Rodriguez-Rodriguez, A.; Egea-Guerrero, J.J.; Murillo-Cabezas, F.; Carrillo-Vico, A. Oxidative Stress in Traumatic Brain Injury. Curr. Med. Chem. 2014, 21, 1201–1211. [Google Scholar] [CrossRef]


| Organism | Modulator | OS | AE | SA | BTE |
|---|---|---|---|---|---|
| Mytilus edulis (Blue mussel) | BaP(50 ppb) | LPx↑ (16.4%) | GPx↑ (7.3%) CAT↑ (21.5%) SOD↑ (9.2%) | GSH↑ (550%) | GST↓ (74.28%) |
| Helix aspera (Brown garden snail) | Microcystin (0.5 µg/g) | MDA↑ (50%) | GPx↑ (33%) CAT↑ (180%) SOD↑ (15%) | GSH↑ (550%) | GST↓ (74.28%) |
| Mytilus edulis (Blue mussel) | Menadione (1 ppm) | LPx↑ (42.8%) | GPx ↓ (16.2%) SOD↓ (23.8%) CAT↑ (8.9%) | NA | NA |
| Biomphalaria alexandrina (Ram’s horn snail) | Oxyfluorfen (4.48 mg/L) | MDA↑ (82.2%) | SOD↑ (59.3%) CAT↑ (36.3%) | GSH↓ (56.3%) | NA |
| Geukensia demissa (Ribbed mussel) | Paraquet (1 mM for 6 h) | LPx↑ (22.3%) | SOD↑ (8.5%) CAT↑ (66.9%) | GSH↑ (4%) | NA |
| Monacha cartusiana (Cartusiana snail) | ZnO (740 µg/L) | MDA↑ (125.75%) | GPx↑ (187.5%) CAT↑ (163.2%) | NA | GST↑ (43.3%) |
| Unio tumidus (Swollen river mussel) | Cupper (30 μg/L) | NA | SOD↑ (6.4%) CAT↓ (9.1%) GPx↓ (15%) | NA | NA |
| Theba pisana (White garden snail) | Acrylamide (2.28 µg/g) | LPO↑ (31%) | CAT↑ (125%) | GSH↓ (10.2%) | GST↑ (68%) |
| Unio tumidus (Swollen river mussel) | Thiram (100 μg/L) | NA | SOD↓ (6%) CAT↓ (9.8) GPx↑ (10.7%) | NA | NA |
| Chilina parchapii | Pyrethroid cypermethrine (10 mg/L) | NA | GPx↑ (200%) CAT↓ (20%) | GSH↑ (20%) | GST↑ (140%) |
| Location | Season | PH | Salinity (PPT) | Temperature (°C) |
|---|---|---|---|---|
| Rainy | 8.54 a | 2.50 a | 26 b | |
| GUJARAT | Winter | 8.75 b | 2.70 b | 17 a |
| Summer | 8.92 c | 3.00 c | 36 c | |
| Rainy | 8.12 a | 2.50 a | 25 b | |
| MP | Winter | 8.25 b | 2.60 b | 21 a |
| Summer | 8.92 c | 2.90 c | 42 c | |
| Rainy | 8.31 a | 2.20 a | 32 b | |
| TN | Winter | 8.56 b | 2.50 b | 25 a |
| Summer | 8.72 c | 2.90 c | 39 c | |
| Rainy | 8.10 a | 2.10 a | 36 b | |
| UP | Winter | 8.63 b | 2.40 b | 25 a |
| Summer | 8.81 c | 3.00 c | 44 c | |
| Rainy | 7.26 a | 1.60 a | 28 b | |
| ODISHA | Winter | 7.96 b | 1.90 b | 21 a |
| Summer | 8.23 c | 2.40 c | 41 c |
| Parameters pH | Salinity | Temperature | |||||||||||||
|---|---|---|---|---|---|---|---|---|---|---|---|---|---|---|---|
| Gujarat | MP | TN | UP | Odisha | Gujarat | MP | TN | UP | Odisha | Gujarat | MP | TN | UP | Odisha | |
| LPx | 0.61 | 0.73 | 0.94 | 0.85 | 0.78 | 0.6 | 0.73 | 0.92 | 0.9 | 0.86 | ns | 0.67 | ns | ns | 0.66 |
| SOD | 0.93 | ns | 0.94 | 0.98 | 0.96 | 0.86 | 0.61 | 0.98 | 0.91 | 0.97 | ns | ns | 0.66 | ns | 0.60 |
| CAT | 0.89 | 0.99 | 0.98 | 0.77 | 0.97 | 95 | 0.95 | 0.92 | 0.97 | 0.78 | 0.79 | 0.98 | ns | 0.75 | 0.86 |
| GPx | 0.72 | ns | 0.76 | 0.89 | 0.83 | 0.59 | 0.49 | 0.63 | 0.61 | 0.57 | ns | ns | ns | ns | ns |
| GR | 0.81 | 0.74 | 0.82 | 0.94 | 0.88 | 0.78 | 0.72 | 0.82 | 0.87 | 0.92 | ns | 0.72 | ns | ns | 0.63 |
| GST | 0.62 | ns | 0.84 | 0.67 | ns | ns | ns | 0.71 | ns | ns | ns | ns | ns | −0.61 | −0.55 |
| AA | ns | ns | ns | ns | ns | ns | ns | ns | ns | ns | ns | ns | ns | ns | ns |
| GSH | 0.93 | ns | 0.89 | 0.93 | 0.9 | 0.85 | 0.63 | 0.78 | 0.68 | 0.67 | ns | ns | ns | ns | ns |
| DPPH | 0.86 | 0.5 | ns | ns | ns | 0.81 | 0.51 | ns | ns | ns | ns | ns | ns | ns | ns |
| Parameters | Function 1 | Function 2 |
|---|---|---|
| SOD | 0.655 | 0.767 |
| CAT | 0.001 | 0.93 |
| GPx | 0.131 | −0.488 |
| GR | −0.119 | −0.111 |
| GST | 0.658 | −0.614 |
| AA | −0.297 | 0.975 |
| GSH | 1.015 | 0.101 |
Publisher’s Note: MDPI stays neutral with regard to jurisdictional claims in published maps and institutional affiliations. |
© 2022 by the authors. Licensee MDPI, Basel, Switzerland. This article is an open access article distributed under the terms and conditions of the Creative Commons Attribution (CC BY) license (https://creativecommons.org/licenses/by/4.0/).
Share and Cite
Panda, F.; Pati, S.G.; Anwar, T.N.; Samanta, L.; Paital, B. Seasonal Variation of Water Quality Modulated Redox Regulatory System in the Apple Snail Pila globosa and Its Use as a Bioindicator Species in Freshwater Ecosystems across India. Water 2022, 14, 3275. https://doi.org/10.3390/w14203275
Panda F, Pati SG, Anwar TN, Samanta L, Paital B. Seasonal Variation of Water Quality Modulated Redox Regulatory System in the Apple Snail Pila globosa and Its Use as a Bioindicator Species in Freshwater Ecosystems across India. Water. 2022; 14(20):3275. https://doi.org/10.3390/w14203275
Chicago/Turabian StylePanda, Falguni, Samar Gourav Pati, Taslima Nasim Anwar, Luna Samanta, and Biswaranjan Paital. 2022. "Seasonal Variation of Water Quality Modulated Redox Regulatory System in the Apple Snail Pila globosa and Its Use as a Bioindicator Species in Freshwater Ecosystems across India" Water 14, no. 20: 3275. https://doi.org/10.3390/w14203275