Article

Assessments of Roof-Harvested Rainwater in Disctrict Dir Lower, Khyber Pakhtunkhwa Pakistan

1
Department of Environmental Science, International Islamic University, Islamabad 44000, Pakistan
2
Department of Environmental Sciences, COMSATS University Islamabad (CUI), Abbottabad Campus, Abbottabad 22060, Pakistan
3
Department of Botany, University of Malakand, Chakdara 18800, Pakistan
4
Department of Civil Engineering, COMSATS University Islamabad (CUI), Abbottabad Campus, Abbottabad 22060, Pakistan
5
Department of Civil and Environmental Engineering, King Fahd University of Petroleum & Minerals, Dhahran 31261, Saudi Arabia
6
Interdisciplinary Research Center for Construction and Building Materials, King Fahd University of Petroleum and Minerals, Dhahran 31261, Saudi Arabia
7
Research Centre, Future University in Egypt, New Cairo 11835, Egypt
*
Authors to whom correspondence should be addressed.
Water 2022, 14(20), 3270; https://doi.org/10.3390/w14203270
Submission received: 11 August 2022 / Revised: 7 September 2022 / Accepted: 10 September 2022 / Published: 17 October 2022

Abstract

:
The main objective of this study was to assess the quality and quantity of roof-harvested rainwater to overcome the water shortage problem in the study area. We also aimed to find health hazards associated with rainwater in the study area. For this purpose, rainwater samples were collected from five sites in the study area. The samples were analyzed using standard methods of the World Health Organization and the American Public Health Association in a laboratory. The analysis showed that all the physicochemical parameters were within the permissible limits of the WHO’s guidelines except pH, turbidity, and some trace metals such as iron (Fe) and lead (Pb). The mean values of pH range from 5.18 to 6.26, indicating slight acidity, while the highest mean turbidity was found at 5.77 NTU. Similarly, the highest mean concentrations of Fe and Pb were 0.95 mg/L and 0.056 mg/L, respectively, which was above the permissible limit of the WHO’s guidelines for drinking water. The annual rainwater-harvesting potential was assessed using the formula annual rainfall × roof area× runoff coefficient. The annual rainwater-harvesting potential of the study area was 56.803 L per household. At the same time, the average monthly rainwater-harvesting potential was 4733 L in the study area. This shows the potential for roof-harvested rainwater in the study area. A risk assessment of heavy metals showed that the rainwater of the study area is safe and does not pose any risk. This study concludes that rainwater is suitable for drinking and other domestic consumption if proper care is taken to clean the roof area and storage system and divert the first flush from the storage system.

1. Introduction

Rainwater harvesting (RWH) is an old water provision technique that plays an important role in meeting the increasing water demand and also plays an important role in controlling climate change and irregularity. Rainwater harvesting is a technique of storing, collecting, and conserving surface runoff for subsequent use. RWH is defined as a method of persuading, collecting, storing, and conserving local surface runoff for successive use. Rainwater from surfaces such as road surfaces, rooftop terraces, and land surfaces is stored in underground or surface storage tanks for subsequent use [1,2,3]. Rainwater harvesting is not a modern practice; human beings have used rainwater for drinking and other domestic purposes for 4000 years [4]. Ancient civilizations also developed different methods for storing rainwater, such as the construction of dams and reservoirs in urban areas [5]. RWH systems consist of many components and procedures, including the collecting surface, storage system, gutter, and filtration system before storage [6,7].
Filtration is carried out before storage to stop the inflow of leaves, debris, and sediment into the storage system. A first-flush diverter may also divert the initial portion of rainwater from a storage system so the quality of rainwater can be improved [8]. Rainwater is a renewable resource for rural areas population [9,10]. It is a significant water resource used to eradicate the problem of water deficiency [11]. Rainwater is also considered as a cleaner of atmospheric pollutants. At the same time, it also contaminates water; one of the most important areas to be considered regarding rainwater is its quality. The quality of rainwater is affected by several features, such as environmental contamination, roofing material, the existence of dirt and birds or rodent feces on the rooftop, and the condition of the storage system for collecting rainwater [10,12,13].
The quality of roof-collected rainwater is often determined by the environment in which a given rainwater system is situated and the materials used to build said system [14]. The contaminants that exist in the atmosphere contaminate rainwater. Airborne particulate matter and gaseous pollutants are often cleaned by rainwater. This cleaning process affects rainwater’s chemical nature and pH [15]. Heavy metals are responsible for the biggest problems we currently face because their levels increase in rainwater storage tanks above the permissible limit, making rainwater unsuitable for human use [16,17,18,19]. Construction materials, such as lead paint or lead fittings, can increase the concentrations of lead, zinc, and copper in roof-harvested rainwater [20]. The contamination of rainwater storage tanks and supply systems can occur when animal feces enter the rainwater storage system, but may also arise during the washing and mending of storage tanks. The atmospheric pollution and local climate are the two features that affect roof-collected rainwater’s quality [14]. Rainwater quality can be improved by considering these three designs such as storage material, treatment, and catchment material [21].
Many studies show that the microbiological and physicochemical qualities of roof-collected rainwater are affected by the storage tank material. Contaminants found in rainwater comprise metals, such as copper (Cu), lead (Pb), iron (Fe), zinc (Zn), and manganese (Mn), and microbial pathogens, such as E. coli cryptosporidium, Giardia, total coliform, and fecal coliform. The chemical contamination of roof-collected rainwater can occur in two ways: those which occur from off-site sources such as vehicular emission, spray drift, and industrial emission and occur from on-site sources, which include tank materials, gutters, roof materials, and emission from domestic wood burners [22]. A suitable scheme should be implemented to remove the initial runoff from the storage tank to improve rainwater quality. At the same time, this process also reduces the quantity of roof-collected rainwater [23,24]. Many machine learning techniques are used to assess water [25,26,27,28,29,30]. The quantity of roof-collected rainwater can be determined using a technique used for very slight urban catchments. This method depends on the roof area, the runoff coefficient, and the amount of rainfall.
The runoff coefficient denotes diminution due to evaporation and seepage [24]. The annual rainwater-harvesting potential (in L/year) of a roof area can be calculated based on the average annual rainfall, the catchment area, and the runoff coefficient, as denoted by the equation RWH potential = R × A × RC. This equation takes an idea from the method used to determine the runoff rate of any watershed area [31,32,33,34,35]. The runoff coefficient represents the losses due to the catchment surface’s evaporation, leakage, spillage, and wetting. The RC value represents the portion of rainfall that becomes runoff. The procedure of rainwater harvesting is of huge importance for Pakistan, as the country faces a severe water scarcity problem. Pakistan is a water-scarce state in South Asia. Therefore, rainwater could be considered the best alternative source of drinking water for this area [35,36]. Additionally, it is tough to ensure access to water because many of the total population live in rural and hilly areas. Ensuring water supply to hilly areas is time-consuming and expensive [37].
Briscoe et al. [38] pronounce rainwater harvesting as the most appropriate and feasible tactic for the hilly and rural areas of Pakistan. In the study area, people use rainwater stored in tanks without knowing its quality and effects on health. There is a possibility of waterborne diseases arising from physical, chemical, and microbial contamination. Moreover, there is a water shortage in the study area; rainwater harvesting is a good option to overcome this problem. Therefore, this study carried out qualitative and quantitative assessments of roof-harvested rainwater in the study area. Therefore, this study was conducted: (i) to assess the quality of roof-harvested rainwater in the study area; (ii) to determine the rainwater-harvesting potential in the study area; and (iii) to assess the health risk associated with rainwater.

2. Materials and Methods
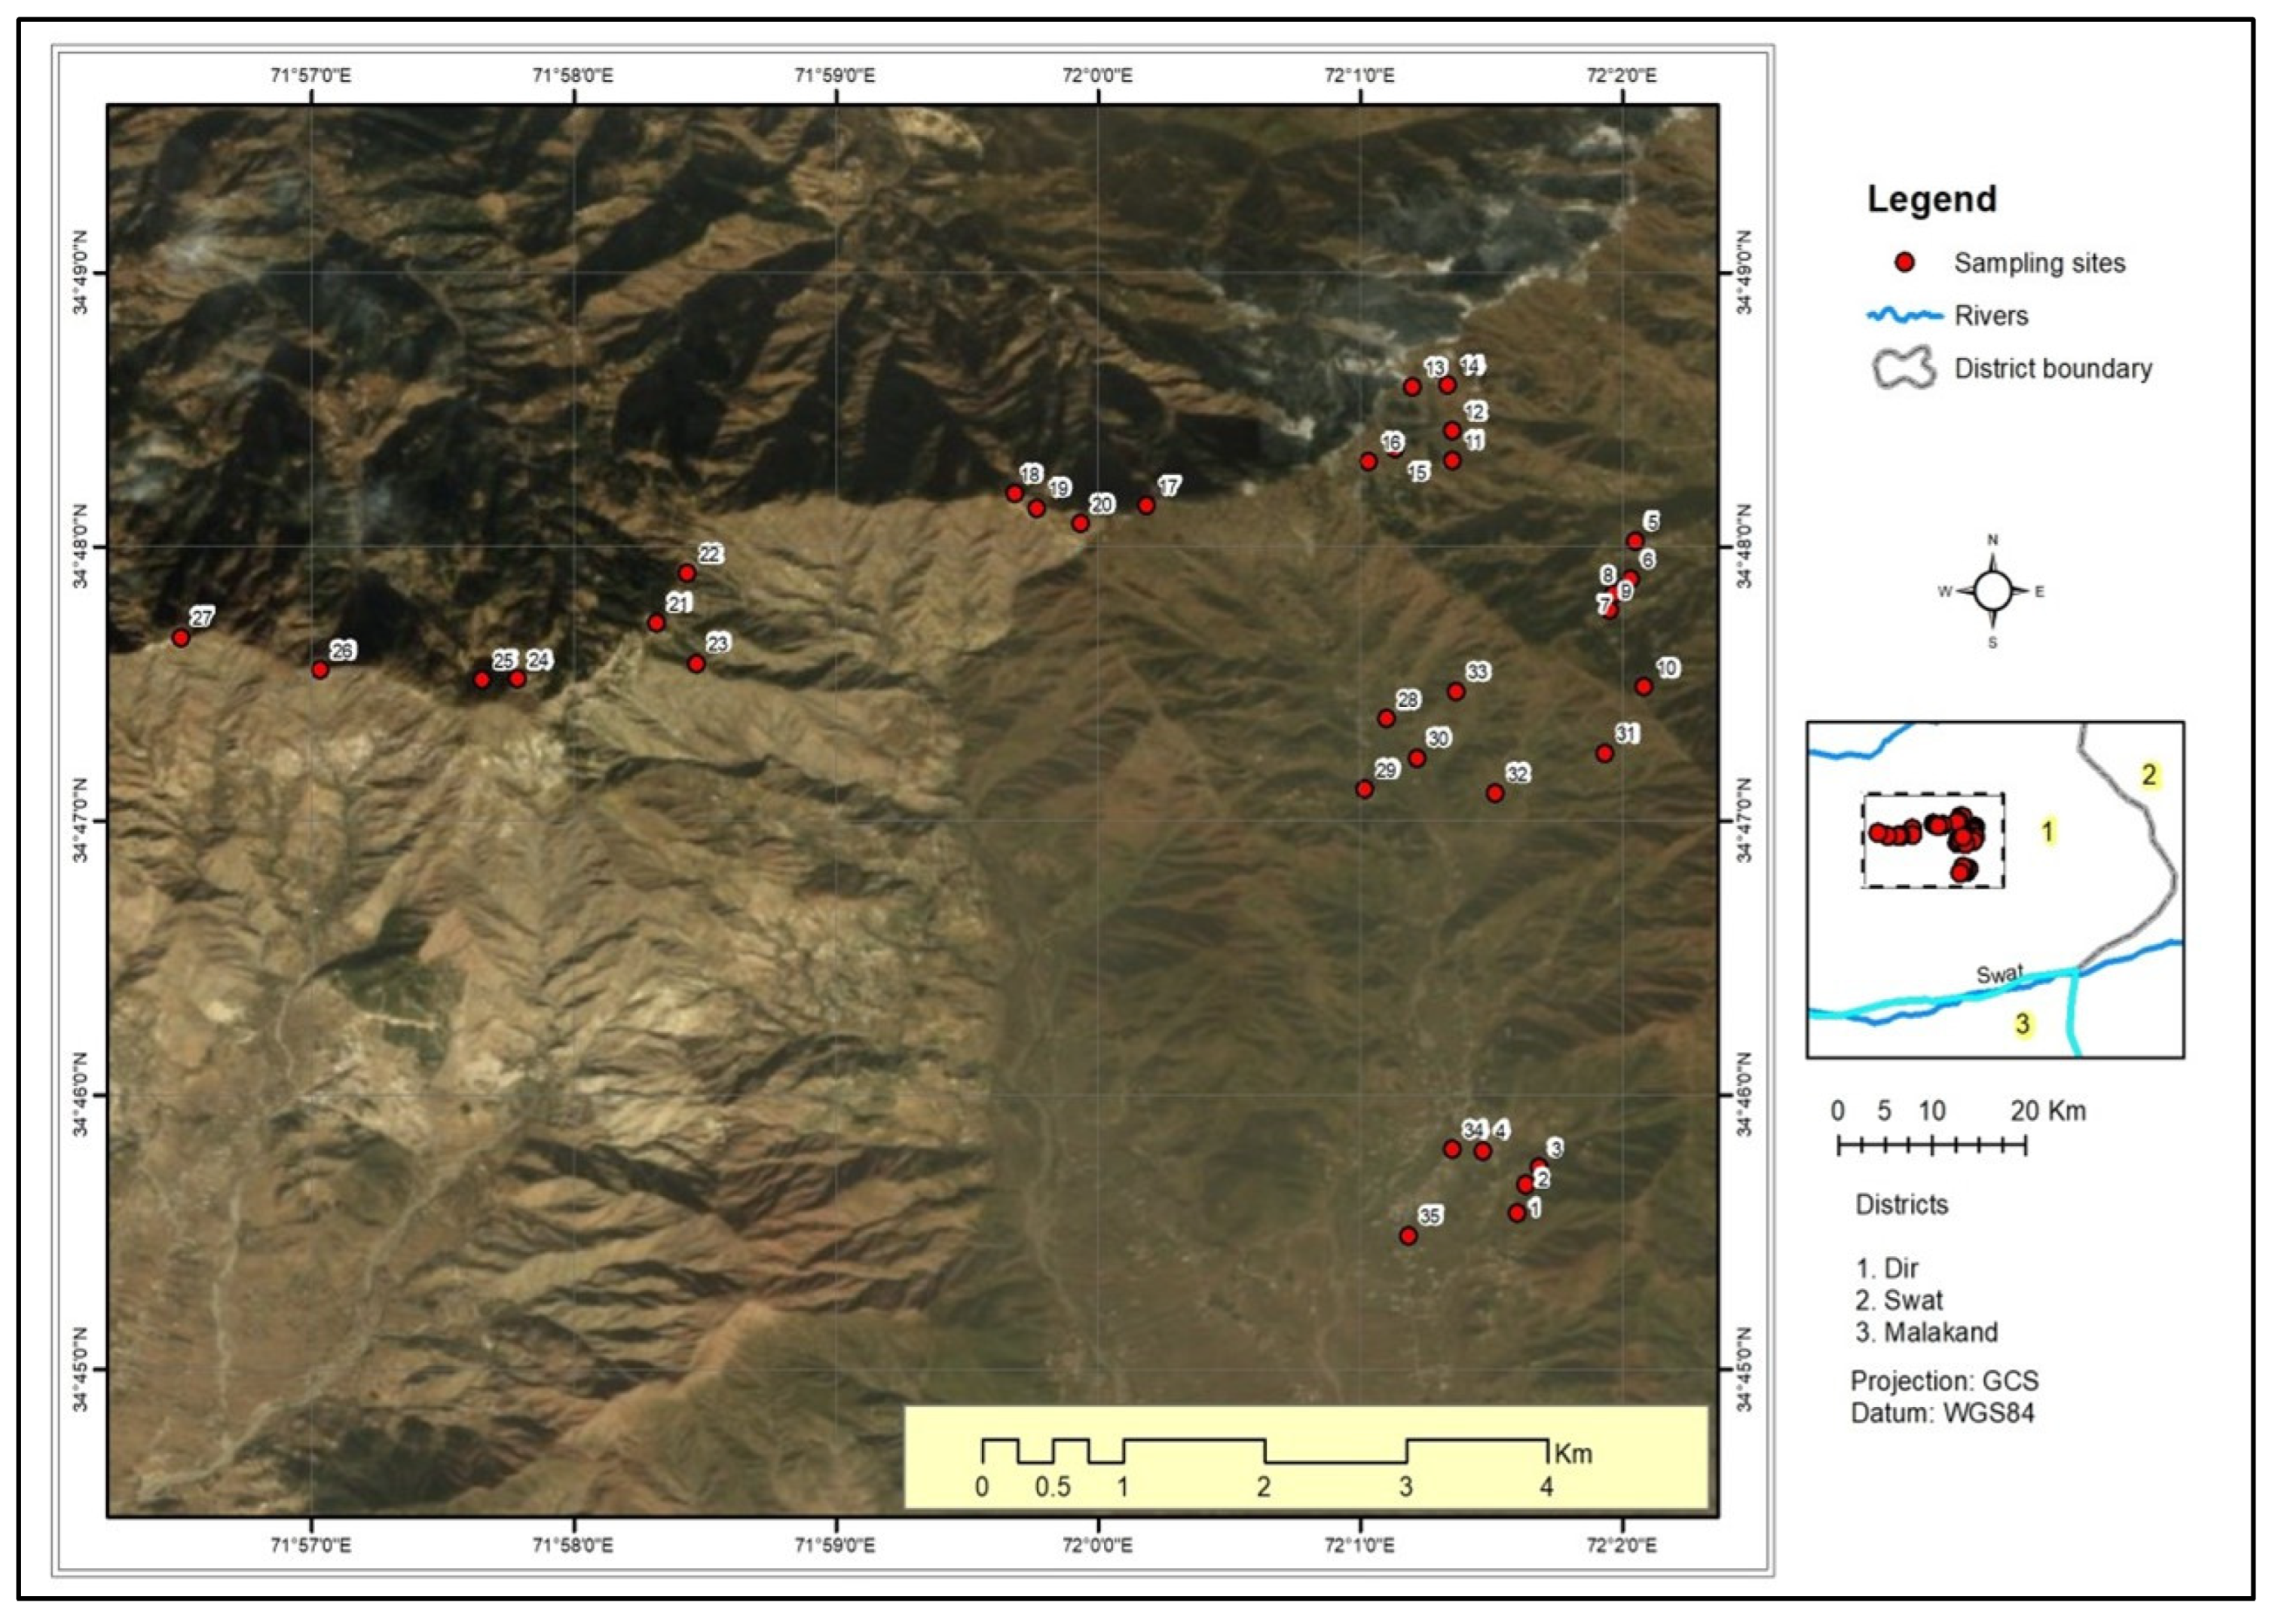
2.1. Study Area

The Lower Dir District is situated in the Khyber Pakhtunkhwa province of Pakistan. In 1969, Dir became a part of Pakistan; beforehand, it was an independent state. Then, in 1996, it was divided into two districts, namely Lower Dir and UpperDir. Malakand District lies in the south, Upper Dir in the north, Swat District the east, and Bajaur Agency the west. It is placed in the Hindukush range 71°50′ to 71°83′ E in longitude and 35°10′ to 35°16′ N in latitude, as presented in Figure 1. The total land area of the Lower Dir District is 1582 km2 (611 sq mi). Snowfall begins in December and remains up until June and July on high mountains, increasing the area’s beauty [39]. Most people work in agriculture in some capacity, and the main source of drinking water is wells and springs. The closest meteorological station is located in Upper Dir. The climatic data from the station illustrate that July is the hottest month, at 15 °C to 32 °C, while January and February are the coldest months, and the temperature is 11 °C to −2 °C. The highest rainfall in the study area occurred in March at 242 mm and the lowest in July, October, and November [40].

2.2. Sample Collection

The samples were collected from rainwater storage tanks in the study area. The samples were obtained randomly where the rainwater storage tanks were found in the study area. A total of 35 samples were collected from different storage tanks. The samples were obtained in polyethylene (PE) bottles and cleaned with nitric acid and deionized water before use. The sample bottles were enclosed and saved in a dim place at a constant temperature range of 4–10 °C to prevent any infection and effects of light and temperature. The sampling was conducted by following the standard methods [41]. The samples were transported in a box filled with ice, brought to the laboratory, and kept in the freezer at 4 °C until further analysis. In the laboratory, samples were analyzed using standard methods for water quality analysis.

2.3. Physicochemical Analysis

The physical and chemical parameters of roof-harvested rainwater were assessed by applying the American public health association stock method. The parameters, such as taste and odor, were determined using the senses of taste and flavor. For the determination of color, the given rainwater sample was categorized into two classes depending on whether it had color or was colorless. The color of the given rainwater samples was assessed through naked-eye observations. The pH of the given rainwater samples was set using a pH meter (model HANNA). Electrical conductivity and total dissolved solids were determined using the conductivity meter, while TDS was assessed by changing the mode from conductivity to TDS (model HANNA). Turbidity was determined by using a turbidity meter (model). For the determination of fluoride in the given rainwater samples, a fluoride meter was used (model). The chloride and sulfate values were determined using a titrimetric method and a spectrophotometric method, respectively [42]. Heavy metal analysis was performed using an atomic absorption spectrophotometer (Perkinelmer) following the APHA standard method.

2.4. Quantity Assessment

The quantity of roof-harvested rainwater was estimated using the formula: Harvested rainwater = Average annual rainfall × Average roof area× runoff coefficient. These three are the key parameters for calculating the quantity of roof-harvested rainwater [43]. The rainfall data of the study area were obtained from the Peshawar meteorological station. Data covering five years were obtained. Then, the average annual rainfall from these was determined. The total roof area was determined by taking a representative sample of rooftop areas and extrapolating it to the total area [44]. In this way, an estimated rooftop area was obtained. The runoff coefficient represents loss due to evaporation and leakage. Mostly, the runoff coefficient value ranges from 0.5 to 0.9 for different roofing materials. However, typically, for iron and a concrete roof, it is 0.8 [45].

2.5. Health Risk

For the determination of health risks associated with the consumption of heavy metals in roof-harvested rainwater, a questionnaire was prepared and distributed among different respondents in the study area that uses rainwater for drinking purposes. The questions were about body weight, age, daily consumption of rainwater for drinking, cooking, and different waterborne diseases. The questionnaires were filled with responses with great care and clarity. After this, the MDI of water and HRI were determined using Equations (1) and (2) [46].
MDI = C × DI/BW
where C denotes the number of heavy metals, BW represents the average body weight (70 kg), and DI means daily water intake (2 L/day).
HRI = MDI/RfD
MDI represents the maximum daily intake, and RfD represents a reference dose, which shows the acceptable daily intake. RfD values are 3.6 × 10⁻¹, 3.7 × 10⁻¹, 7.0 × 10⁻¹ and 3.0 × 10⁻¹ for Pb, Cu, Fe and Zn [47].

3. Results

This study highlights the qualitative and quantitative aspects of roof-harvested rainwater in reference to the WHO’s water standards. The results are presented as graphs and tables for both qualitative and quantitative assessments.

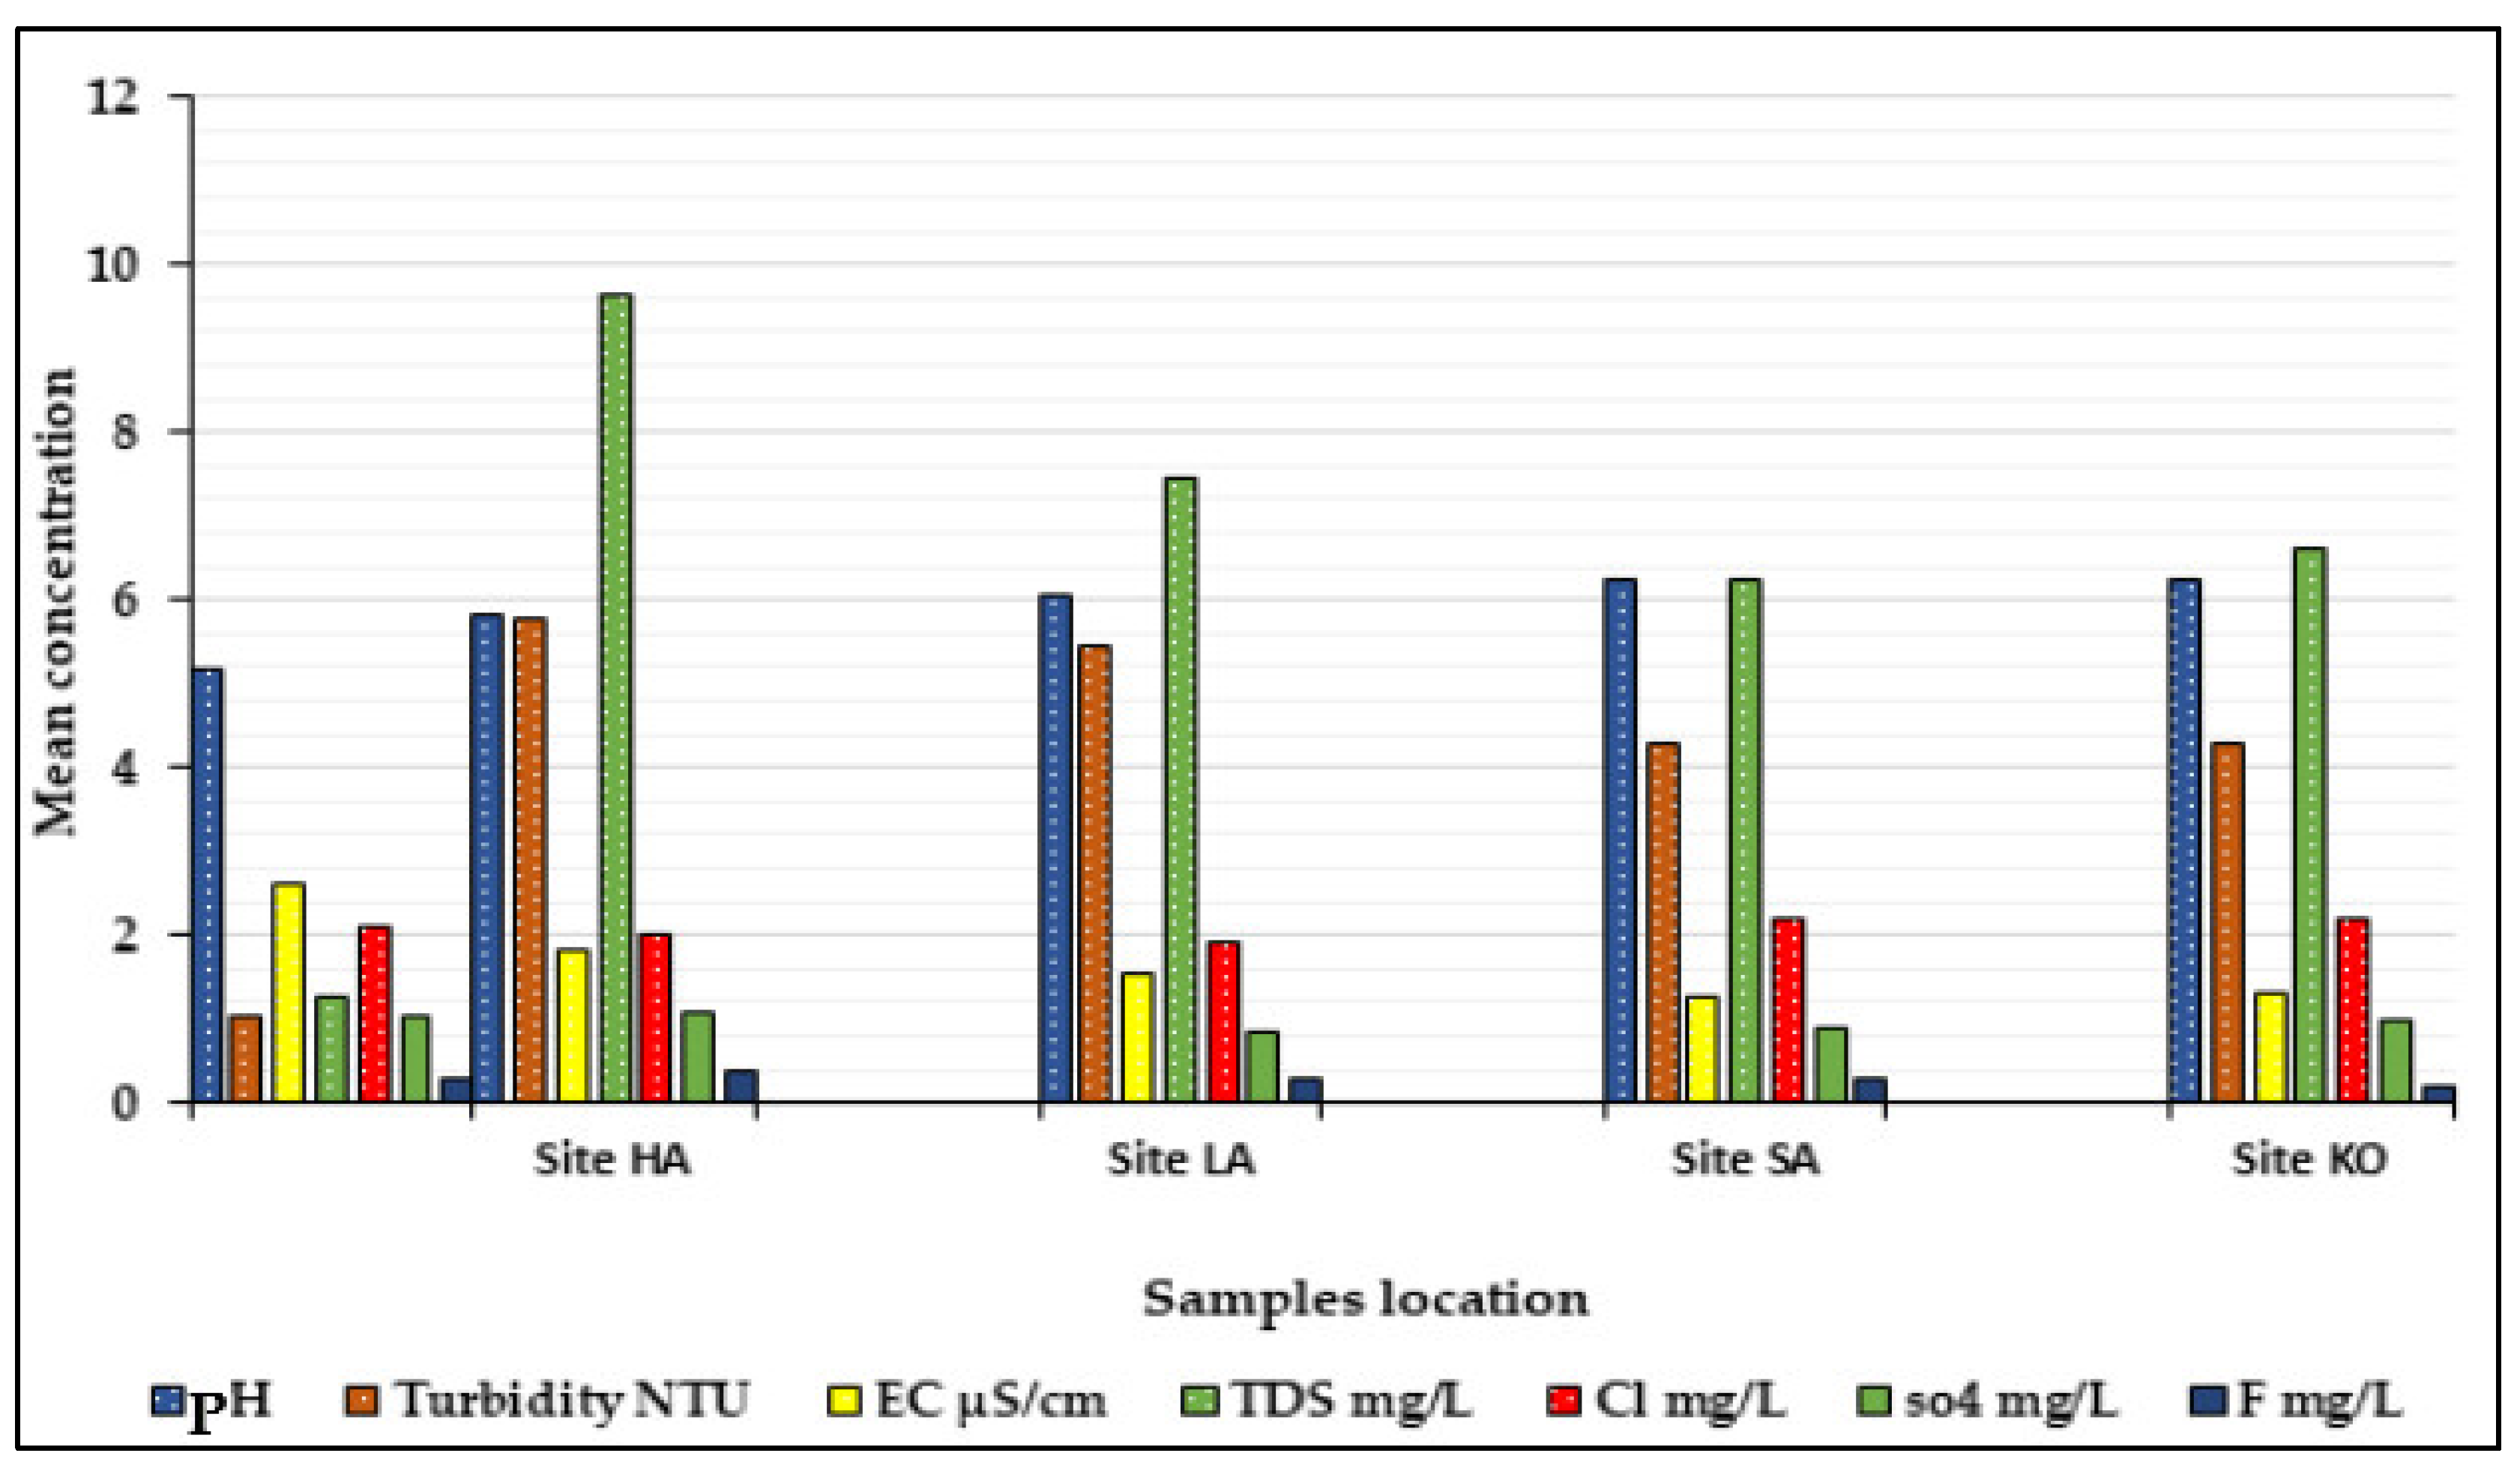
3.1. Qualitative Assessment

The qualitative assessment included both physical and chemical parameters. The physical parameters, such as taste, odor, and color, were normal, and nothing was considered unpleasant. The maximum, minimum, and mean values of different parameters of roof-harvested rainwater are shown in Table 1 and compared with the WHO drinking water standards. Figure 2 shows the physicochemical parameters of roof-harvested rainwater. The mean turbidity values in all five study area sites were 1.05, 5.77, 5.45, 4.27, and 4.29 NTU. The highest mean value of turbidity was 5.77 NTU in site HA and 5.45 NTU in site LA, while the lowest mean value of turbidity was 1.05 NTU in site SI. The results show that the turbidity values were within the safe limit of the WHO’s guidelines (5 NTU), except for site HA and LA. A higher turbidity value in water is related to the greater presence of a pathogenic microbe, including bacteria and other parasites studied; as reported [48], turbidity is not necessarily dangerous for humans but can affect the degree of acceptability due to visible cloudiness. The turbidity values seemed acceptable when compared to those of the study conducted by Mendez et al., 2011 [49].
Table 1. Physicochemical parameters of roof-harvested rainwater.
StatisticPHTurbidity NTUEC µS/cmTDS mg/LCl mg/LSO4 mg/LF mg/L
LocationsWHO6.5–8.5540010002502501.5
Site SIMean5.181.052.621.282.121.040.3
SD1.276.172.661.268.580.120.14
Site HAMean5.825.771.829.622.011.070.39
SD0.915.761.014.936.350.190.13
Site LAMean6.055.451.527.451.920.840.29
SD0.886.951.235.781.010.160.13
Site SAMean6.224.271.256.262.180.910.3
SD0.735.961.045.169.090.210.15
Site KOMean6.264.291.326.612.20.990.21
SD0.394.682.118.324.720.190.12
Figure 2. Physicochemical parameters of roof-harvested rainwater.
Water 14 03270 g002
Table 1 shows the mean pH values of each site (SI, HA, LA, SA, and KO). The highest mean pH value was in site KO (6.26), while the low mean pH was 5.18 in site SI. This shows that rainwater samples of the study area are not strongly acidic, so they will not cause any harmful effects on consumer health. The acidity of rainwater mostly occurs due to the reaction of rainwater with carbon dioxide, which leads to the formation of carbonic acid [50]. The pH of rainwater usually ranges from 4.5 to 6.5, but increases slightly after falling on the roof and during storage in tanks [51]. The pH value, when compared with the results of previous studies, ranging from 5.5 to 8.5, looked acceptable [12,52]. The highest mean conductivity value was in site SI, at 2.62 µS/cm, while the lowest mean value was 1.25 µS/cm in site SA. It is clear from Table 1 that all the mean values of EC were below the permissible limit as outlined by the WHO, which is 2500 µS/cm. The overall quantity of dissolved ions or salts in water can be deduced from conductivity. The values of EC were mostly lower in the rainwater samples. A value of EC lower than 100 µS/cm highlights less minerals in rainwater [53]. The lower values of conductivity in the roof-collected rainwater of the study area showed that there were no dissolved solids and other contaminants from the roof, gutters, and pipes.
In the same way, the highest mean value of TDS was found in site HA at 9.62 mg/L, while the lowest mean value of TDS was 1.28 mg/L in site SI. However, overall, the mean values of TDS were within the safe and permissible limit outlined by the WHO (1000 mg/L). A TDS value below 600 mg/L is generally suitable for drinking water, while one above 1000 mg/L is usually unacceptable [30]. The highest mean fluoride concentration was reported to be 0.39 mg/L in site HA. At the same time, the lowest mean concentration of 0.21 mg/L was found in site KO. All the values of the given rainwater samples were below the acceptable limit of the WHO, that is, 1.5 mg/L. The highest mean chloride value was 2.18 mg/L in site SA.
On the other hand, the lowest mean was 1.92 mg/L in site LA. All the chloride values were within the permissible limit of the WHO, which is 250 mg/L. Similarly, the mean sulfate concentration was also found to be below the permissible limit of the WHO, which is 250 mg/L. The highest mean value of sulfates was 1.07 mg/L in site HA, while the lowest mean value was 0.84 mg/L.

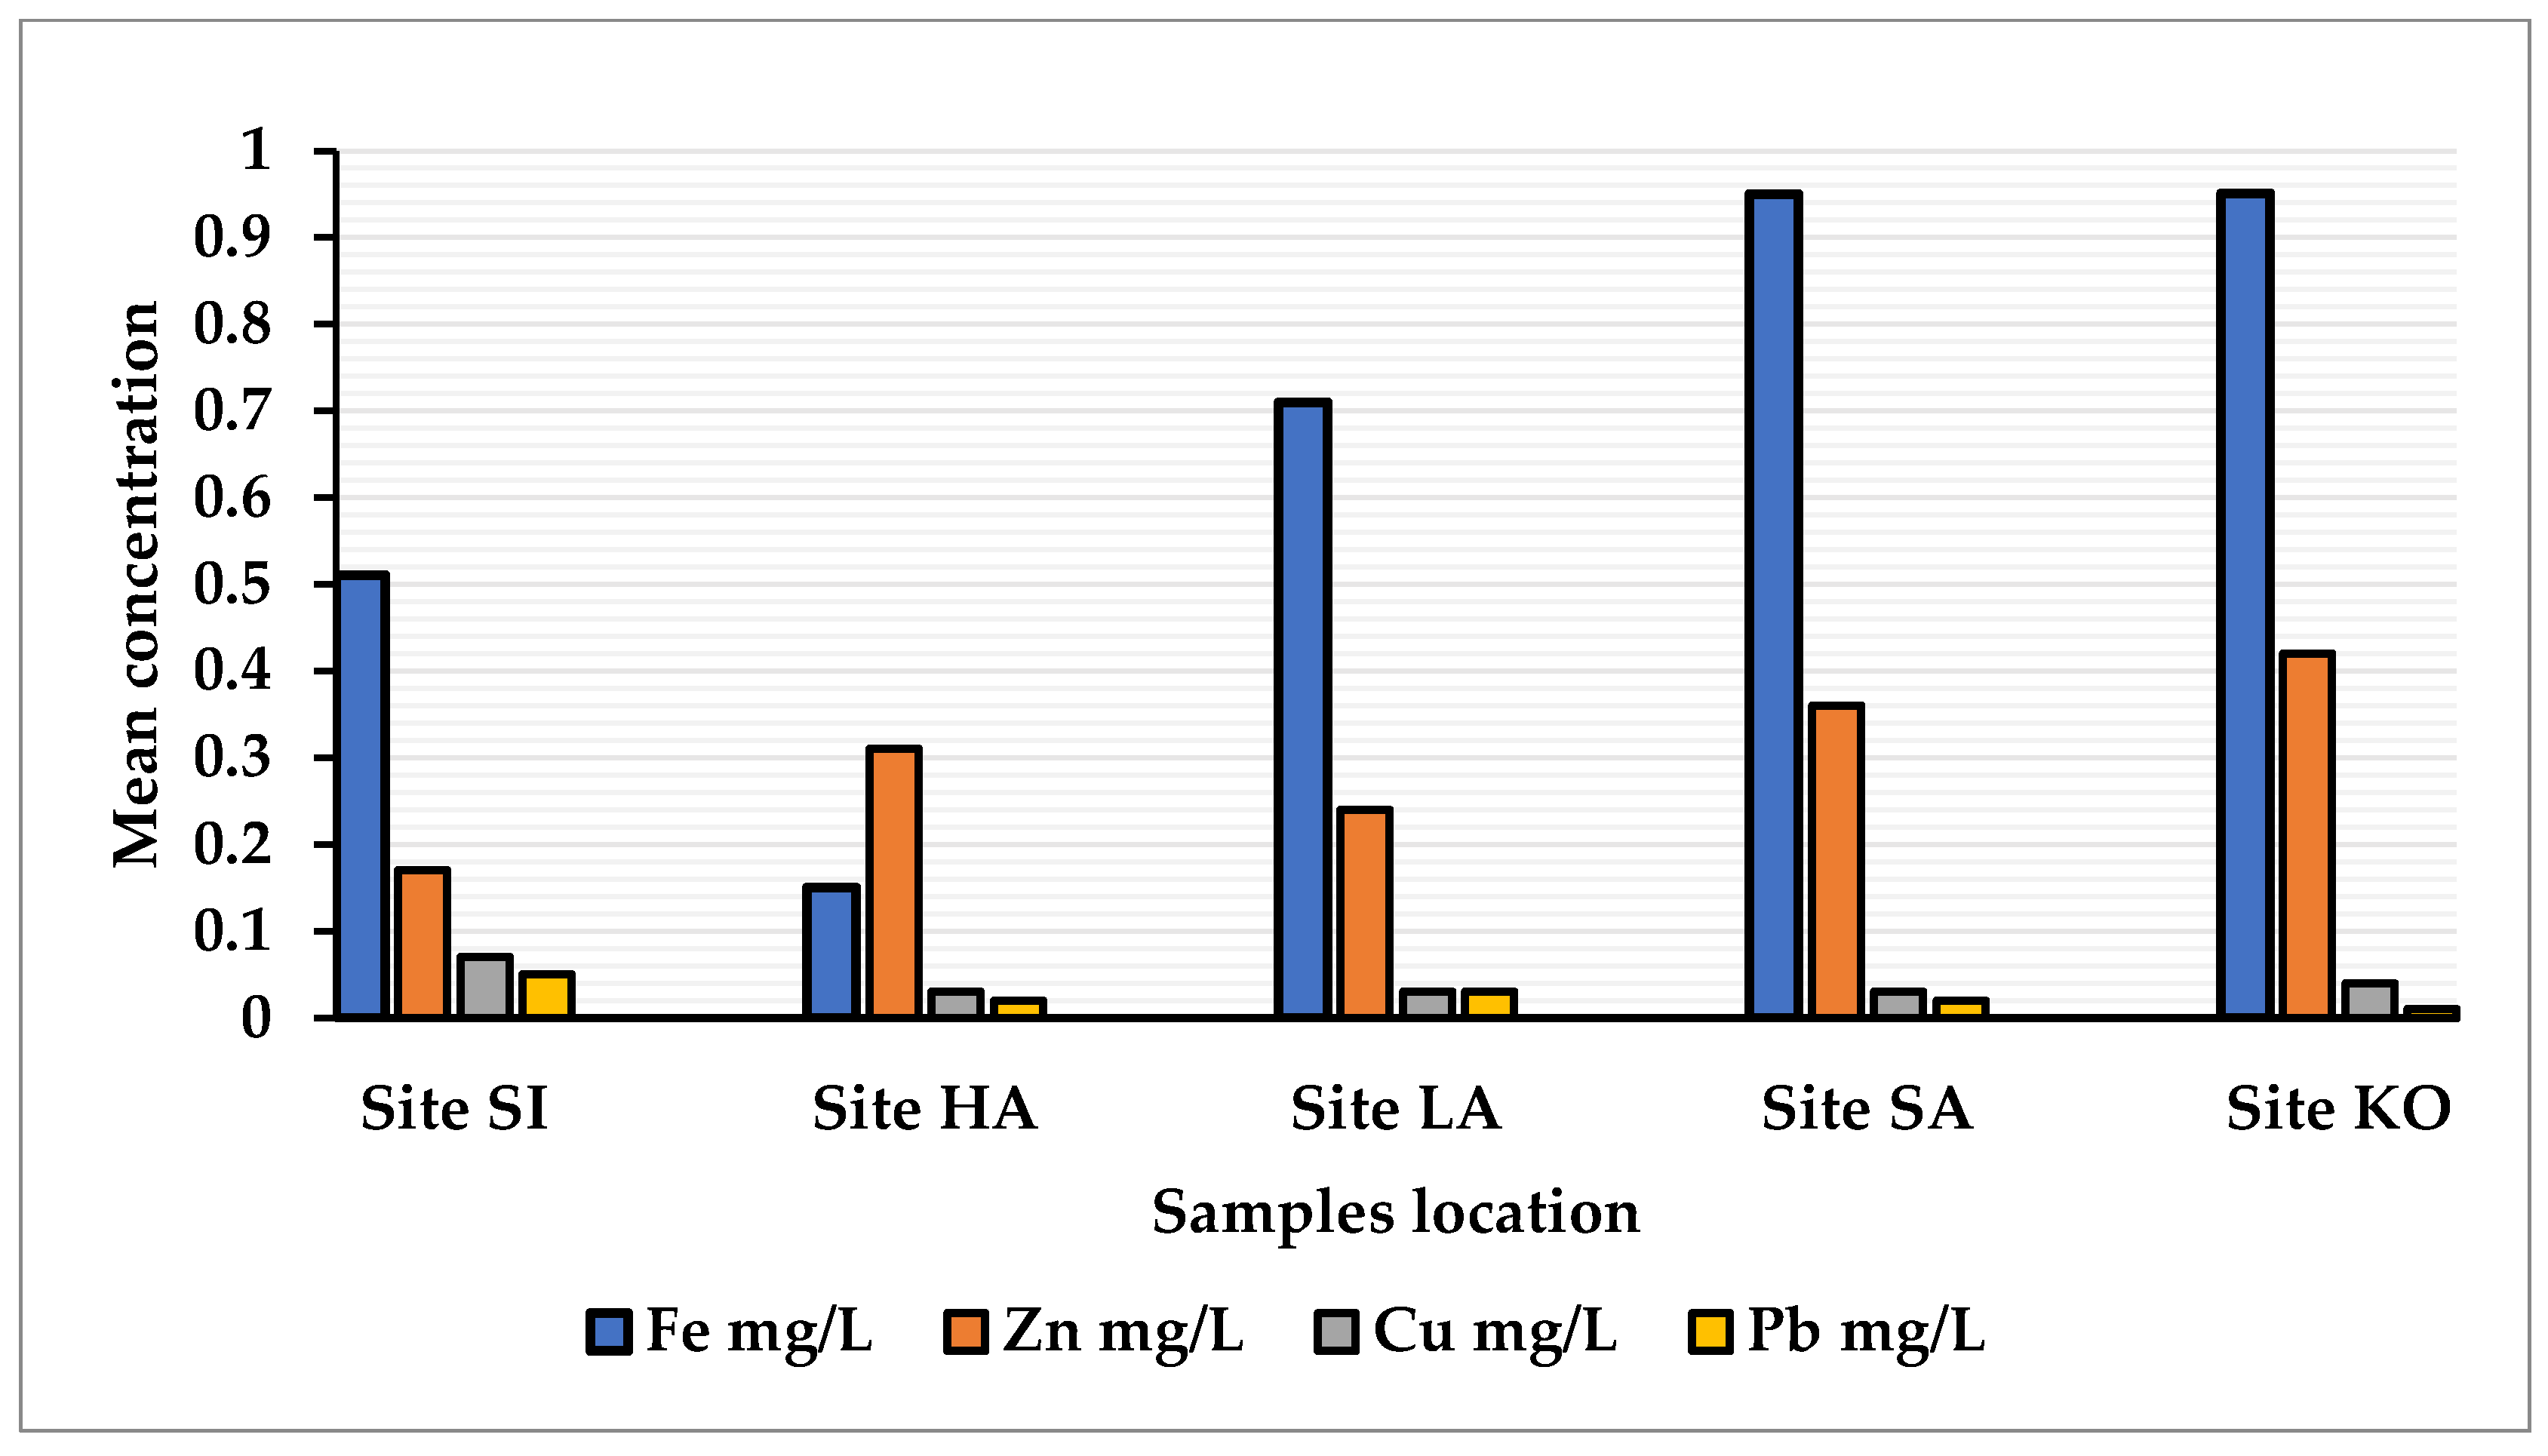
3.2. Heavy Metals Analysis

Four heavy metals, Fe, Zn, copper (Cu), and Pb, were analyzed in the given rainwater samples of the study area because these four heavy metals are mostly found in rainwater. Table 2 and Figure 3 show the concentration of heavy metals in different sites of the study area in roof-harvested rainwater. The mean concentrations of Fe in roof-harvested rainwater were found to be 0.51, 0.15, 0.71, 0.95, and 0.95 mg/L in sites SI, HA, LA, SA, and KO, respectively. The highest mean value of Fe was found to be 0.95 mg/L in sites SA and KO, respectively, while the lowest mean value of Fe was found to be 0.15 mg/L in site HA. It was clear from the results that the mean concentration of (Fe) in rainwater samples was above the acceptable limit of the WHO, except for site HA. The acceptable limit of the WHO for Fe is 0.3 mg/L. This high value of iron is related to the presence of old iron sheets in the study area. The high quantity of Fe may cause hemorrhagic necrosis and affect the stomach’s inner wall. The highest mean value of Zn (0.42 mg/L) was in site KO, while the lowest mean value was in site SI, which is 0.17 mg/L. The results show that Zn was below the acceptable limit of the WHO, which is 5 mg/L. The mean Zn value of harvested rainwater was 0.12 mg/L by [34], which is lower than the safe limits advised by the WHO. Heavy metals become a concern as their values increase over the acceptable level, making rainwater unfit for human use [21,22]. The long-term exposure and accretion of heavy metals in the human body can cause different health effects, such as lung fibrosis, renal dysfunction, cardiovascular diseases, neurological diseases, and several kinds of cancer. In some cases, heavy metals accumulate in the human body, damaging mental and central nervous functions [54,55].
Table 2. Descriptive statistic of heavy metals in roof-harvested rainwater.
LocationsStatisticFe mg/LZn mg/LCu mg/LPb mg/L
WHO0.351.30.015
Site SIRange0.16–0.930.08–0.290.03–0.010.01–0.10
Mean ± SD0.51 ± 0.270.17 ± 0.0740.07 ± 0.0210.05 ± 0.035
Site HARange0.05–0.400.16–0.440.01–0.050.003–0.04
Mean ± SD0.15 ± 0.110.31 ± 0.0980.03 ± 0.0140.02 ± 0.014
Site LARange0.49–1.200.12–0.400.01–0.050.01–0.08
Mean ± SD0.71 ± 0.230.24 ± 0.0970.03 ± 0.0130.03 ± 0.022
Site SARange0.57–1.270.19–0.620.01–0.070.006–0.07
Mean ± SD0.95 ± 0.240.36 ± 0.140.03 ± 0.0210.02 ± 0.021
Site KORange0.91–0.970.29–0.480.02–0.060.01–0.03
Mean ± SD0.95 ± 0.0210.42 ± 0.0660.04 ± 0.0150.01 ± 0.005
Figure 3. Concentration of heavy metals in roof-harvested rainwater.
Water 14 03270 g003
The heavy metals Zn and Fe do not exert any health effects if their concentrations are low. However, they may disturb the aesthetic value of water [56]. It was clear from the results that the mean values of Cu in all rainwater samples were below the permissible limit of the WHO, which is 1.3 mg/L. Similarly, the highest mean value of Cu was in site SI, which was 0.078 mg/L, while the lowest mean value was 0.030 mg/L, which was found in site SA.
In the same way, the highest mean value of Pb was reported in site SI, which is (0.056 mg/L), while the lowest mean value was determined in site KO, which is 0.019 mg/L. It is clear from Table 2 that the values of Pb were above the permissible limit of the WHO, which is 0.015 mg/L. The high value of Pb in the given rainwater sample of the study area may be related to the presence of lead-containing paint on the roof surface, which then enters rainwater storage tanks [57,58,59,60]. During sample collection, the authors noticed that the stairs and railings of the building roofs were painted and that these paints contain Pb. Roofing material painted with Pb may be oxidized by weathering, which can then be washed away to accumulate in the reservoir of harvested rainwater [61]. Another source of Pb could be the gutter and bottom pipe. Zhang and Lin [62] reported that Pb could leach from unplasticized polyvinyl chloride pipes because Pb-based compounds are used as a stabilizer during the unplasticized polyvinyl chloride manufacturing process.
Moreover, the deposition of Pb particles on the roof surface may enter the harvested rainwater due to Pb emissions from industrial discharges and exhaust [63]. Lead is regarded as one of the most significant contaminants that cause different problems in human health, such as kidney problems and damaged nervous and reproductive systems. It may cause learning and behavioral disorders [64].

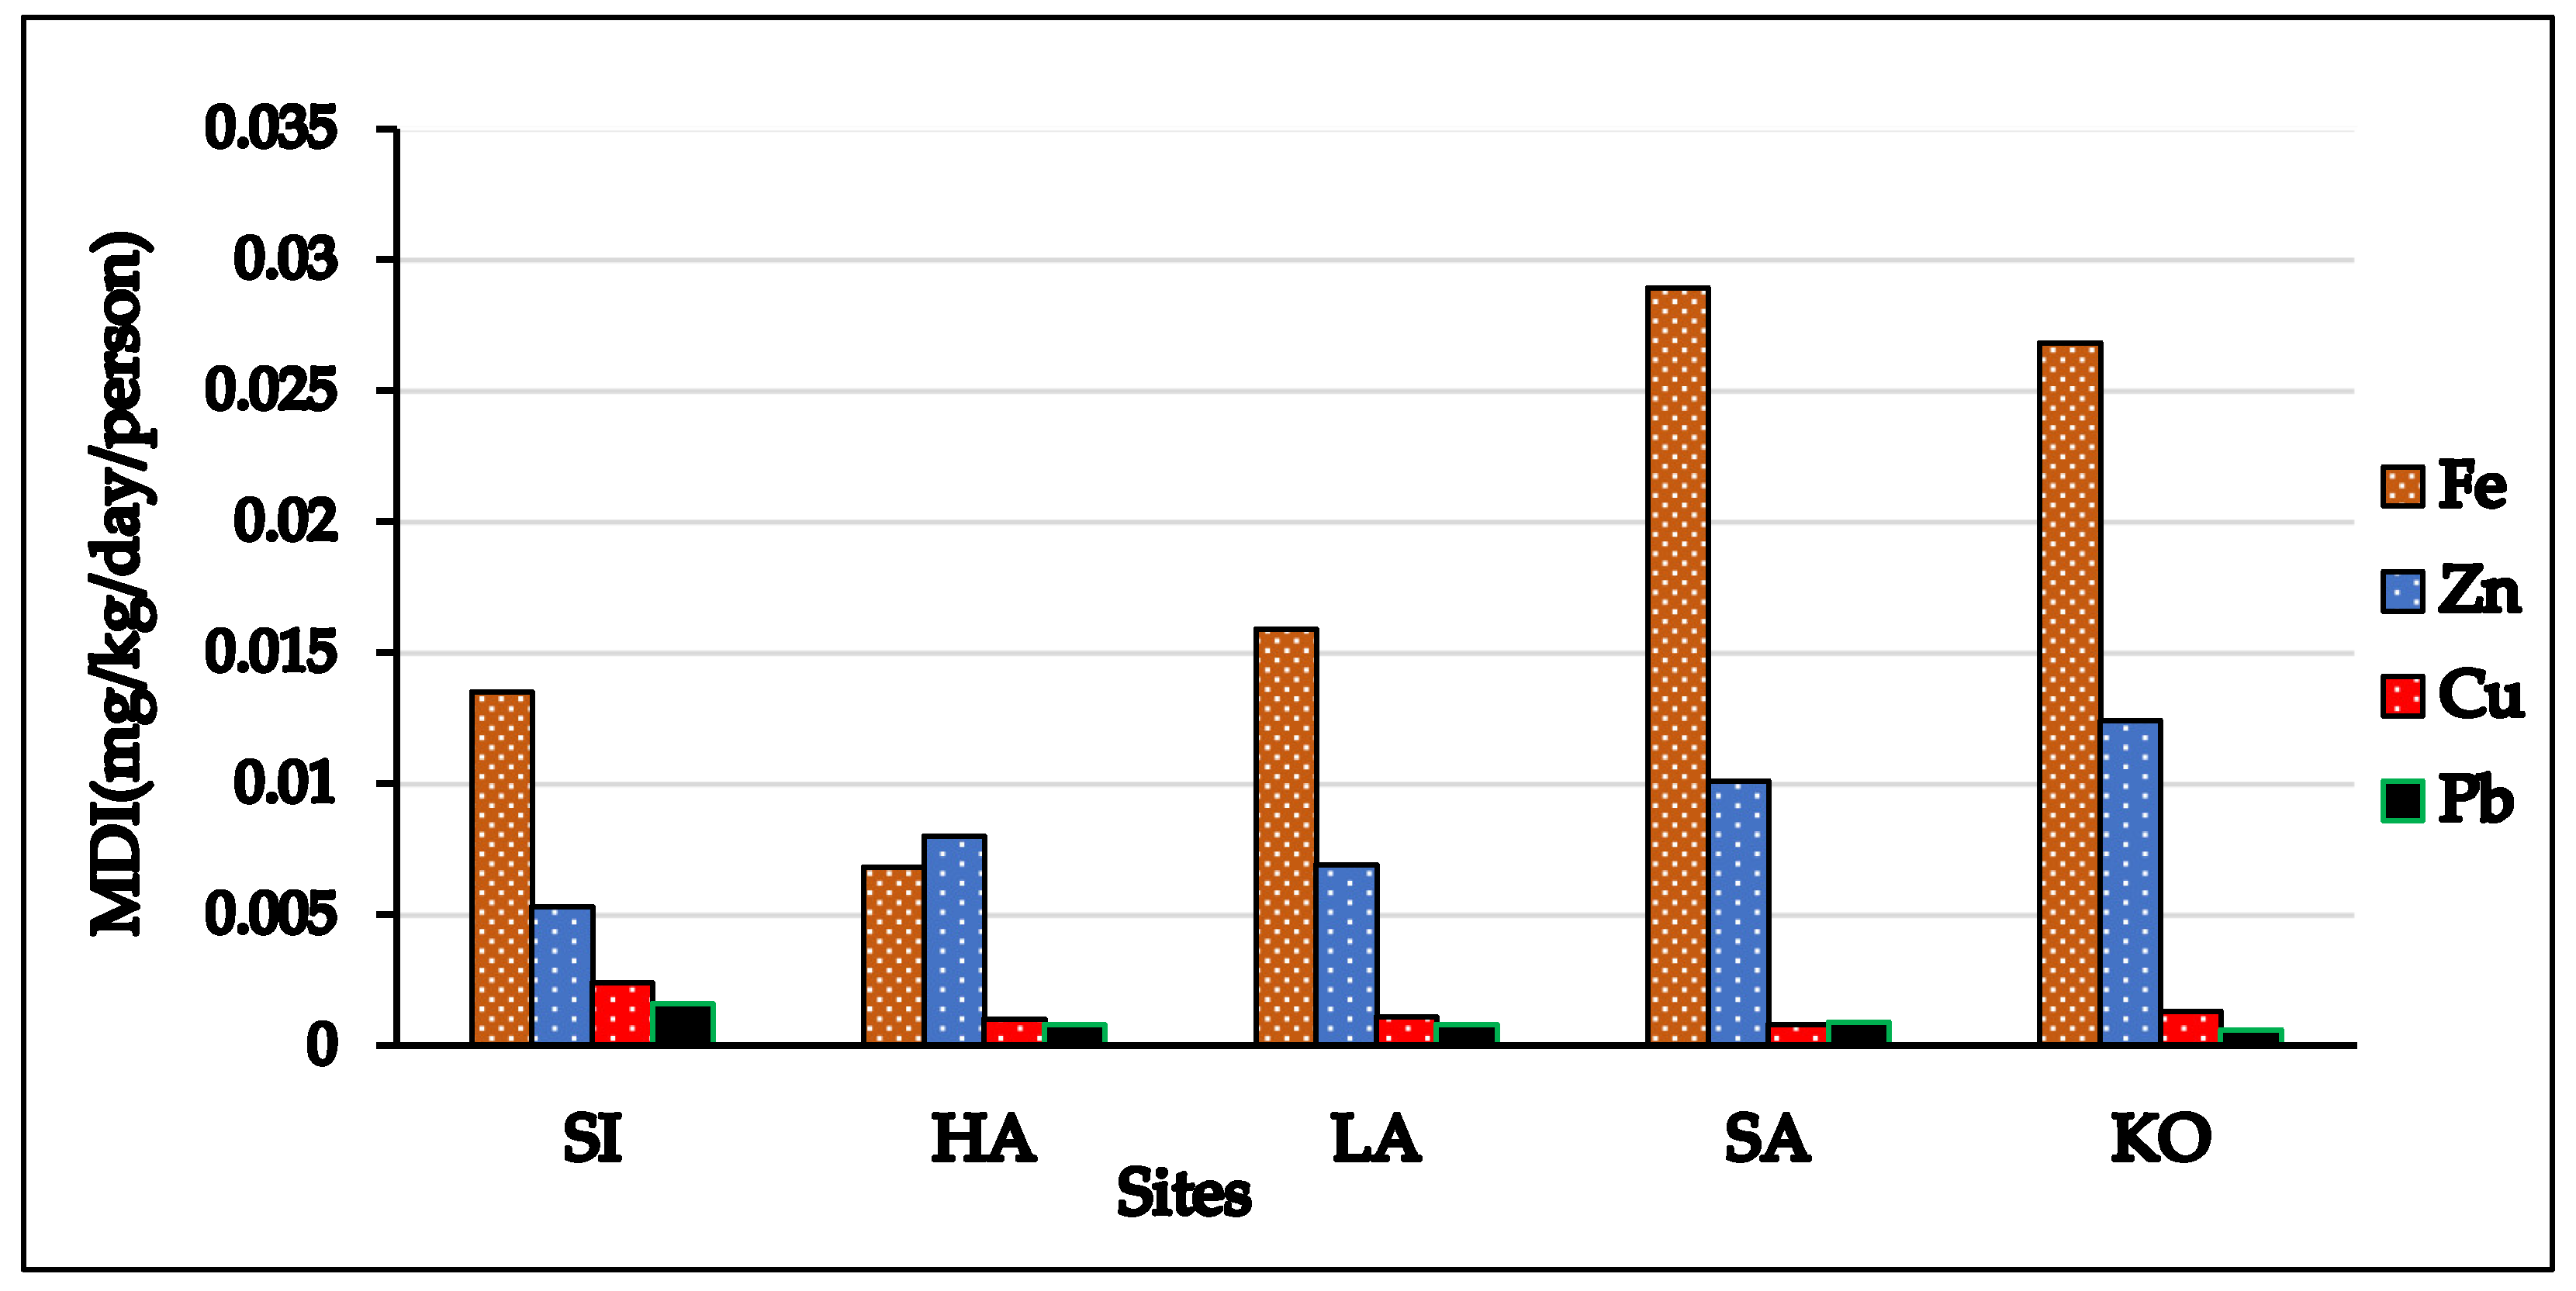
3.3. Health Risk Assessment

We assessed health risks related to rainwater in the study area due to the heavy metal intake. The indicators of health risks, MDI and HRI, were obtained from Equations (1) and (2), and their results are presented in Table 3 and Table 4.

3.3.1. Maximum Daily Intake (MDI)

The results of MDI for heavy metals are shown in Table 3 and Figure 4. These results show that the mean values of MDI for Fe were 0.013, 0.0067, 0.015, 0.028, and 0.026 mg/kg-day in sites SI, HA, LA, SA, and KO, respectively. The graph shows that the highest mean value was found (0.028 mg/kg-day) in site SA. In contrast, the lowest mean of MDI for Fe was found (0.0067 mg/kg-day) in site HA.
Table 3. MDI index of heavy metals in roof-harvested rainwater.
LocationsStatisticFeZnCuPb
Site SIRange0.004–0.020.002–0.0080.001–0.0030.0005–0.003
Mean0.010.0050.0020.001
Site HARange0.001–0.020.002–0.0010.0004–0.0010.0004–0.001
Mean0.0060.0080.0010.0008
Site LARange0.003–0.0210.003–0.010.0007–0.0010.0001–0.002
Mean0.010.0060.0010.0008
Site SARange0.01–0.030.005–0.010.0004–0.0020.0002–0.002
Mean0.020.010.00080.0009
Site KORange0.02–0.0280.008–0.010.0007–0.0010.0004–0.0009
Mean0.020.010.0010.0006
Similarly, the mean MDI values for Zn were 0.0053, 0.0080, 0.0069, 0.010, and 0.012 mg/kg-day in sites SI, HA, LA, SA, and KO, respectively. The mean MDI values of Cu were 0.0024, 0.00099, 0.0011, 0.00082, and 0.0012 mg/kg-day in sites SI, HA, LA, SA, and KO, respectively. In the same way, the mean values of Pb in sites SI, HA, LA, SA, and KO were 0.0016, 0.0008, 0.00081, 0.0009, and 0.0006 mg/kg-day. Table 3 shows the MDI values of heavy metals. The highest mean MDI value found in site SA was 0.028 mg/kg-day for Fe, while the lowest mean MDI was 0.00057 mg/kg-day in site KO for Pb. So, it is clear from the results that the maximum intake occurs for Fe and Pb in the rainwater of the study area. Thus, MDI in the study area was shown to be in the order of Fe > Zn > Cu > Pb.

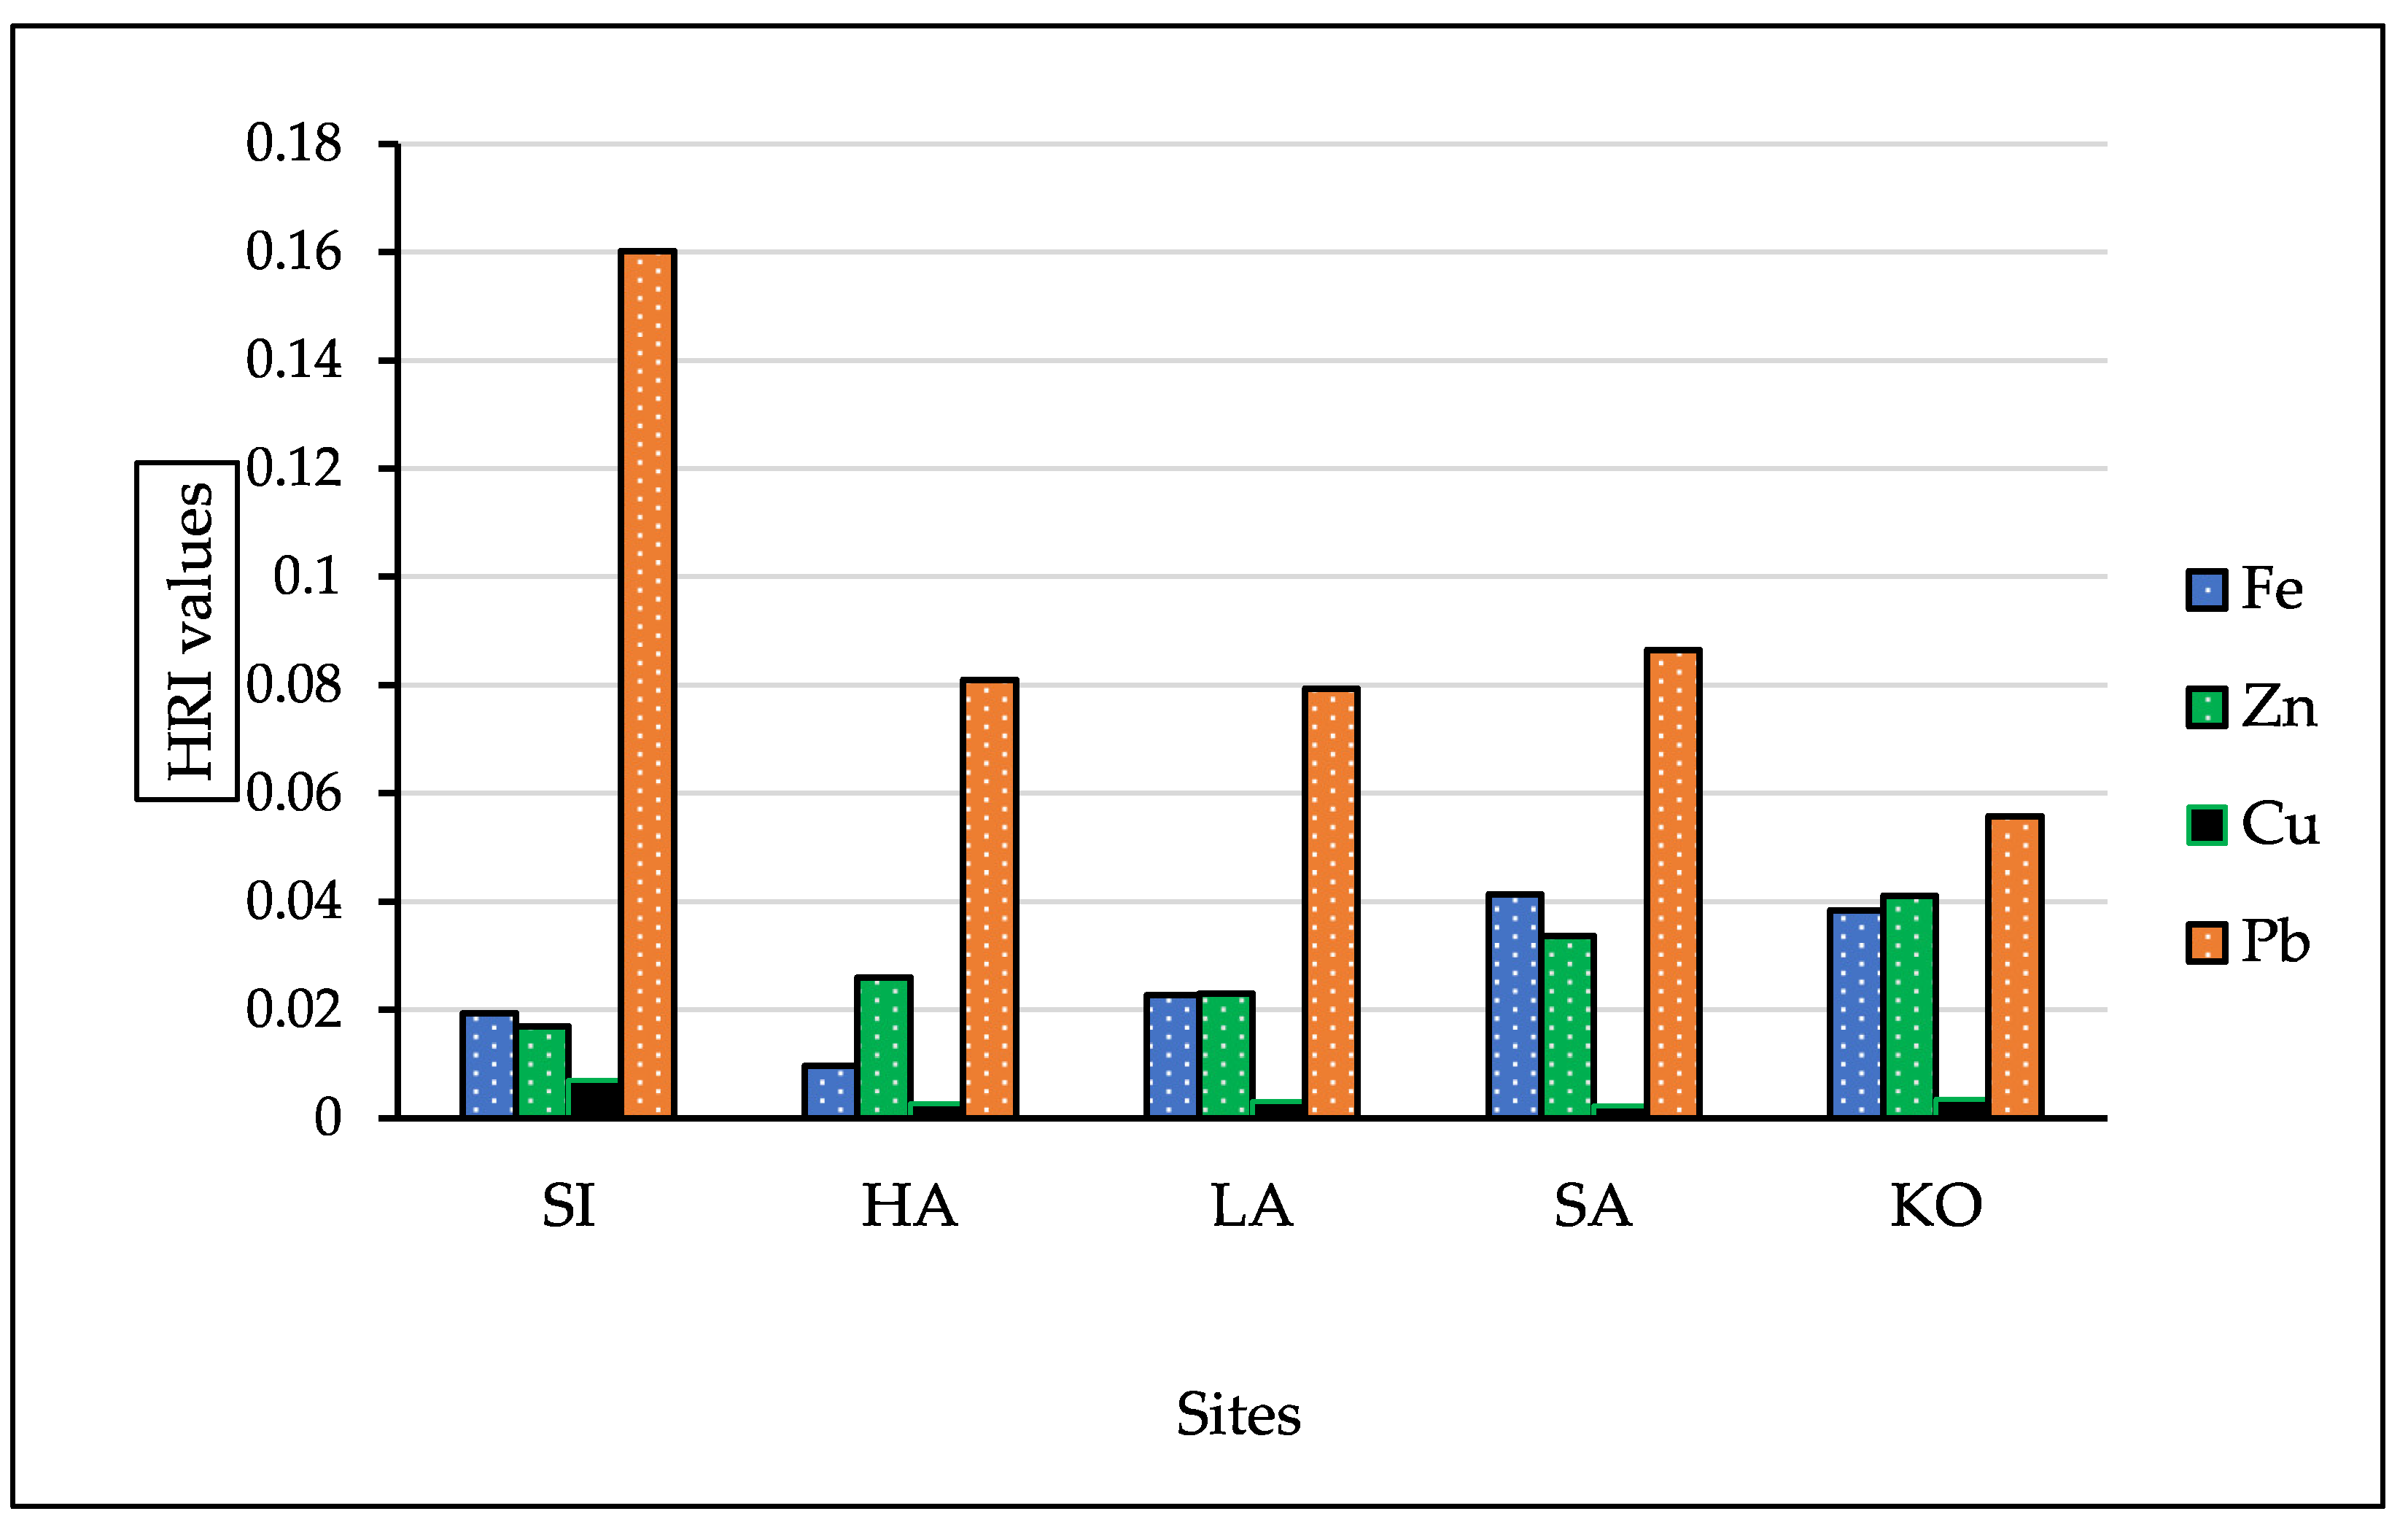
3.3.2. Health Risk Index (HRI)

In site SI, the mean HRI values for Fe, Zn, Cu, and Pb were detected (0.019, 0.017, 0.007, and 0.16). Similarly, for site HA, the mean HRI for Fe, Zn, Cu, and Pb were 0.0097, 0.026, 0.0027, and 0.080 mg/kg-day, as shown in Table 4.
Table 4. HRI for heavy metal via consumption of roof-harvested rainwater.
LocationsStatisticFeZnCuPb
Site SIRange6.7 − 03–3.8 − 028.2 − 03–2.7 − 025.0 − 03–8.0 − 034.6 − 02–3.01 − 01
Mean ± SD1.9 ± 021.7 ± 027.0 ± 031.6 ± 01
Site HARange2.4 − 03–3.0 − 029.6 − 03–4.2 − 021.2 − 03–3.7 − 033.7 − 02–1.3 − 01
Mean ± SD9.7 ± 022.6 ± 022.7 ± 038.0 ± 02
Site LARange5.1 − 03–3.0 − 021.2 − 02–3.5 − 021.9 − 03–4.6 − 039.4 − 03–2.2 − 01
Mean ± SD2.2 ± 022.3 ± 023.0 ± 037.9 ± 02
Site SARange2.3 − 02–5.2 − 021.8 − 02–5.9 − 021.0 − 03–5.9 − 031.8 − 02–1.9 − 01
Mean ± SD4.1 ± 023.3 ± − 022.2 ± 038.6 ± 02
Site KORange3.3 − 02–3.9 − 022.8 − 02–4.6 − 021.9 − 03–5.2 − 033.9 − 02–8.5 − 02
Mean ± SD3.8 ± 024.1 ± 023.4 ± 035.5 ± 02
The mean HRI values of site LA were found at 0.022, 0.023, 0.0030, and 0.0793 mg/kg-day for Fe, Zn, Cu, and Pb, respectively. The mean HRI values for Fe, Zn, Cu, and Pb were found to be 0.041, 0.033, 0.0022, and 0.086 mg/kg-day, respectively, in site SA. Similarly, in site KO, the mean HRI values for Fe, Zn, Cu, and Pb were determined (0.038, 0.041, 0.0034, and 0.055 mg/kg-day). The graph showed that the highest HRI was found in site SI (0.1601) for Pb, presented in Figure 5. In contrast, the lowest HRI value was recorded (0.034) in site KO for Cu. The HRI for heavy metals was calculated in the order of Pb > Fe > Zn > Cu. The results showed that this study’s HRI values for Fe, Zn, Cu, and Pb are less than 1 (HRI <1). An HRI value less than one (HRI < 1) is safe, while an HRI greater than 1 is unsafe [65]. So, it was clear that the rainwater in the study area was safe for drinking. The HRI for heavy metals showed no health risk to the resident of the study area when the results were compared to those of US EPA [45].

3.4. Quantitative Assessment
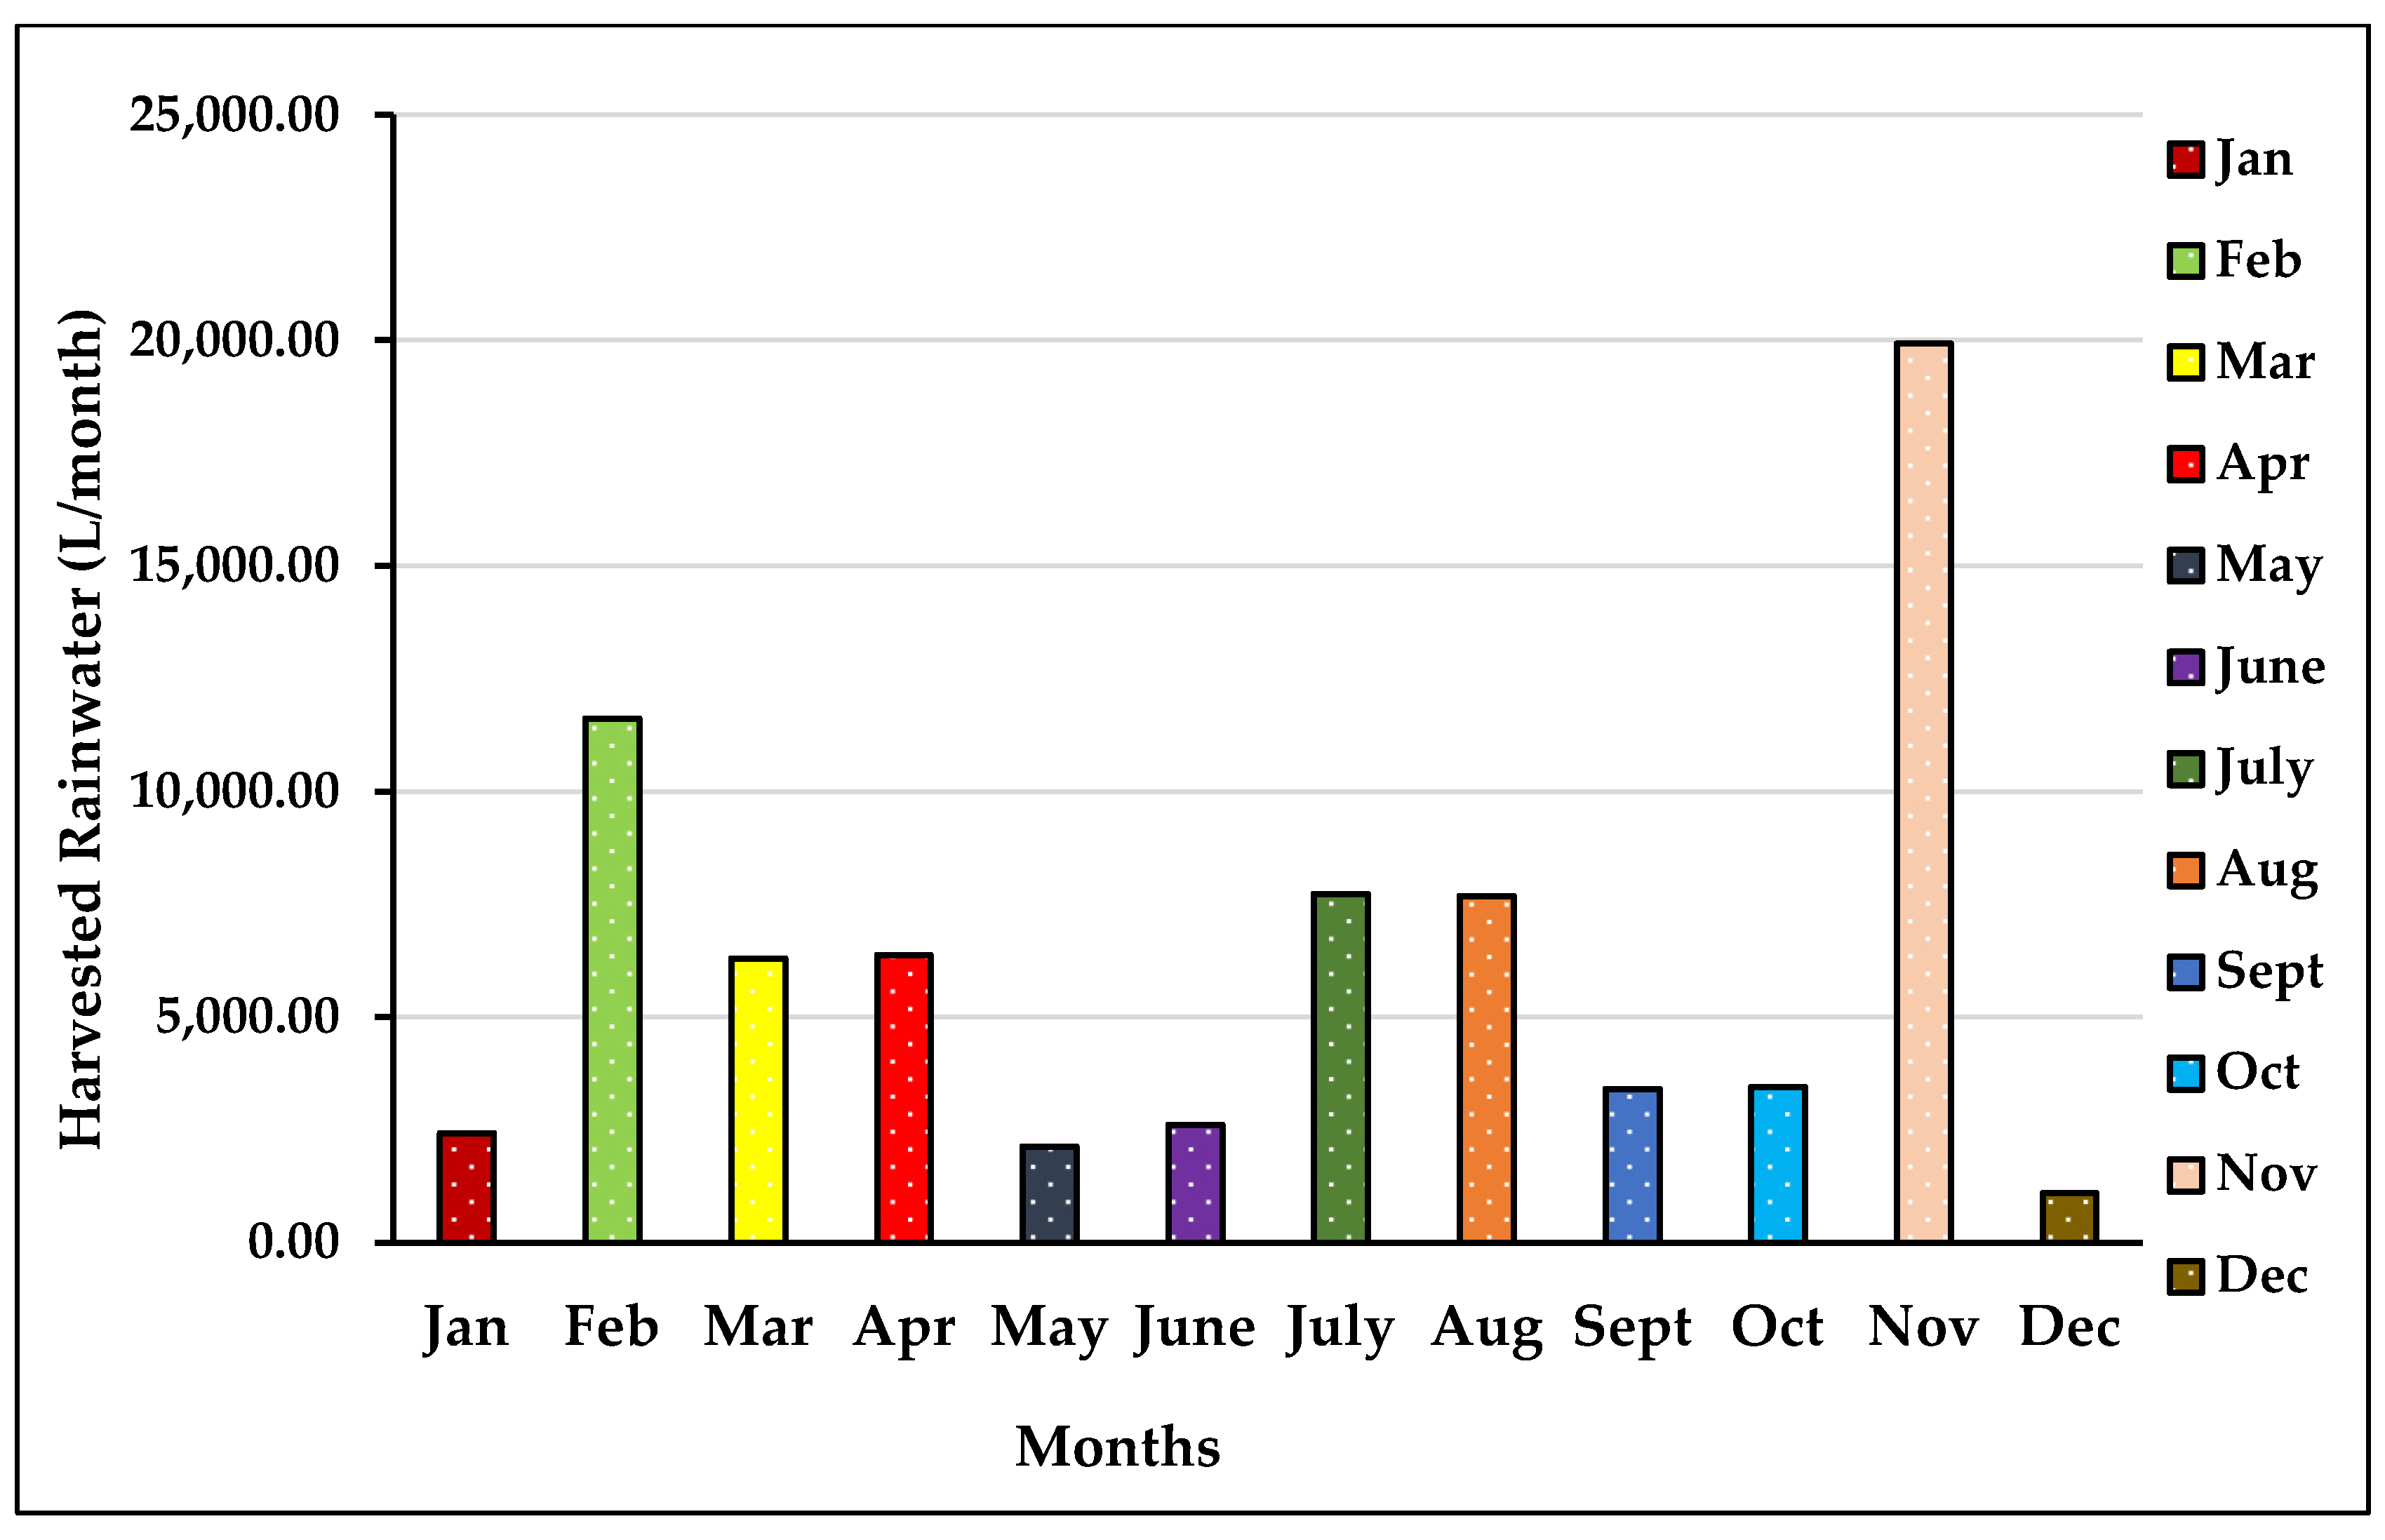
The results of the quantitative assessment are presented in Table 5 and Figure 6, Figure 7 and Figure 8. To determine the annual rainwater-harvesting potential of the study area based on the equation, we used the equation RW potential = R × A × RC, where R represents the average annual rainfall, A represents the roof area (80 m2), and Rc represents the runoff coefficient (0.8). These are the key parameters for determining the quantity of roof-harvested rainwater [66,67].
Table 5. Monthly harvested rainwater potential of the study area.
MonthsAverage Monthly Rainfall (mm)Average Roof Area (m2)Runoff CoefficientMonthly Harvested Rainwater (L/month)
Jan38800.82432
Feb181.66800.811,626.24
Mar98.35800.86294.4
Apr99.66800.86378.24
May33.25800.82128
June40.83800.82613.12
July120.86800.87735.04
Aug120.16800.87690.24
Sept53.3800.83411.2
Oct54800.83456
Nov30.33800.81941.12
Dec17.16800.81098.24
Total887.56--56,803.84
Average73.96--4733.65

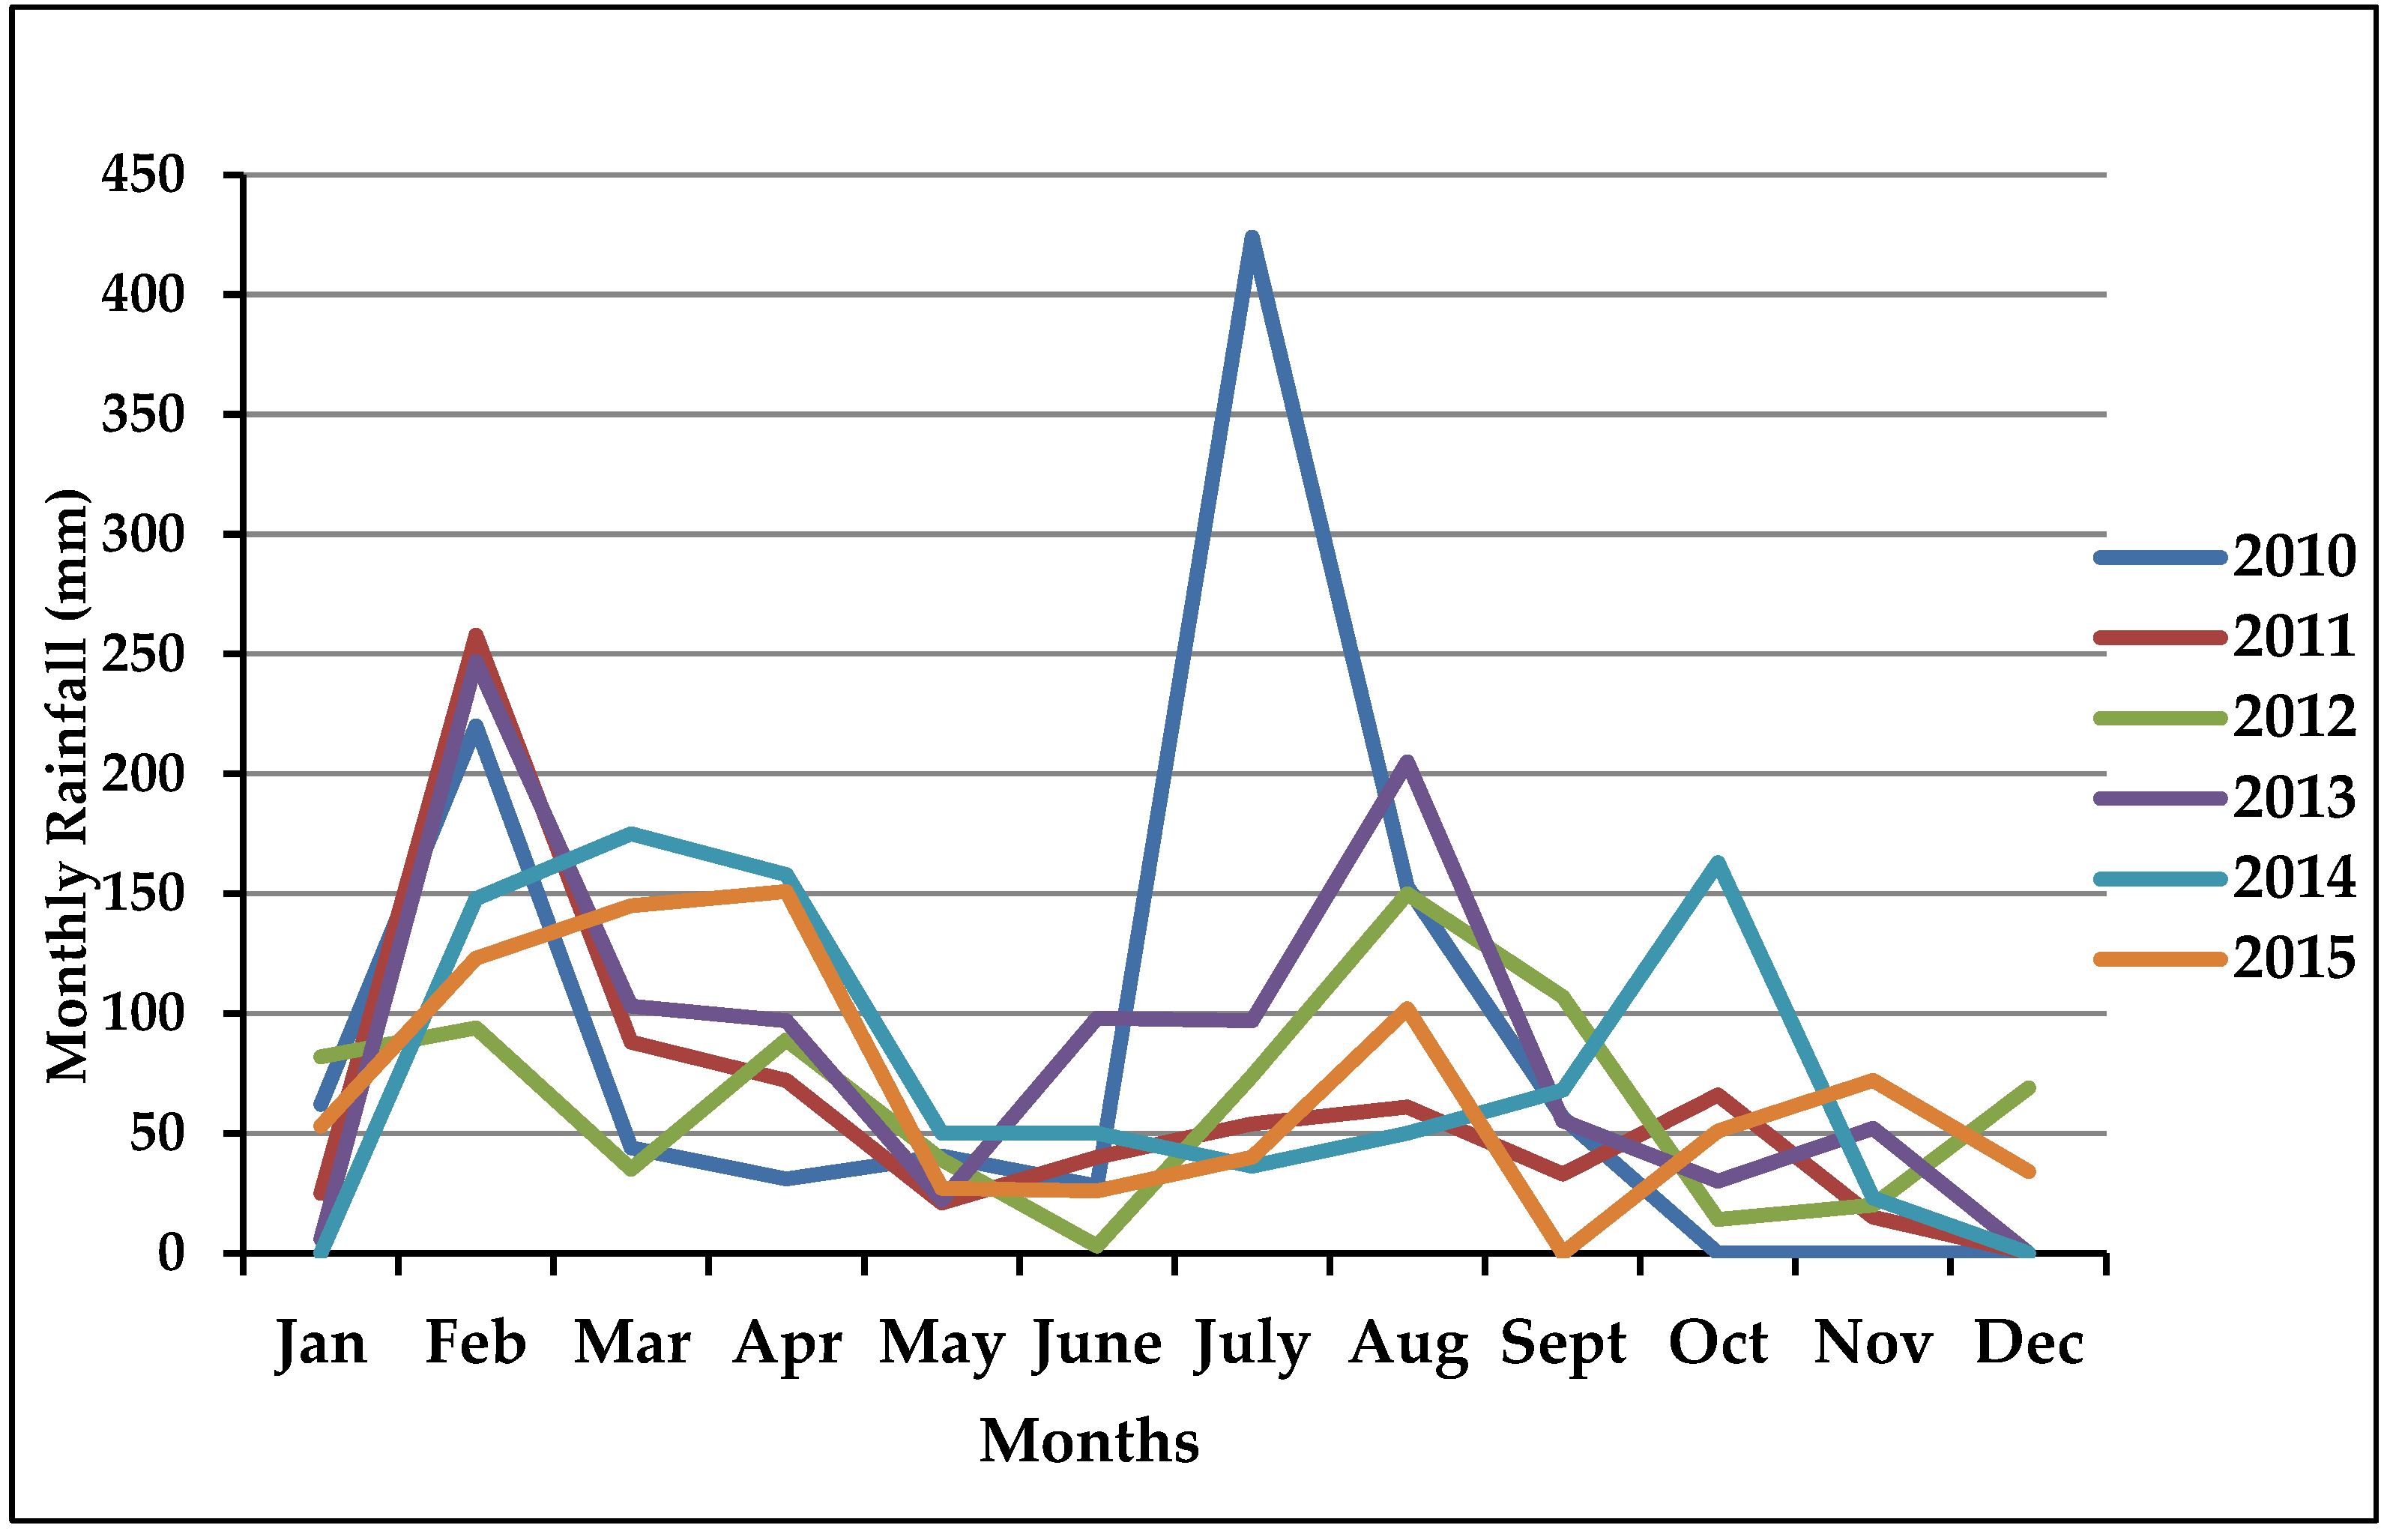
3.4.1. Monthly Rainfall

The average monthly rainfall distribution of Lower Dir District is shown in Figure 6 based on rainfall data from 2010 to 2015. According to the given figure, an increase in rainfall occurs in January and February, and then sharp decreases occur in May and April in 2011, 2012, 2013, 2014, and 2015. Similarly, a sharp increase occurs in July and August and then decreases up until December. The graph shows that there are two sharp increases between January and July and regular sharp decreases in May and September. The figure shows that the highest average monthly rainfall occurs in February, July, and August (181.23, 120.45, and 120.67 mm, respectively). The lowest average monthly rainfall occurred in May and December (33.56 mm and 17.23 mm, respectively).
Figure 6. Average monthly rainfall distribution in the study area (2010–2015).
Water 14 03270 g006

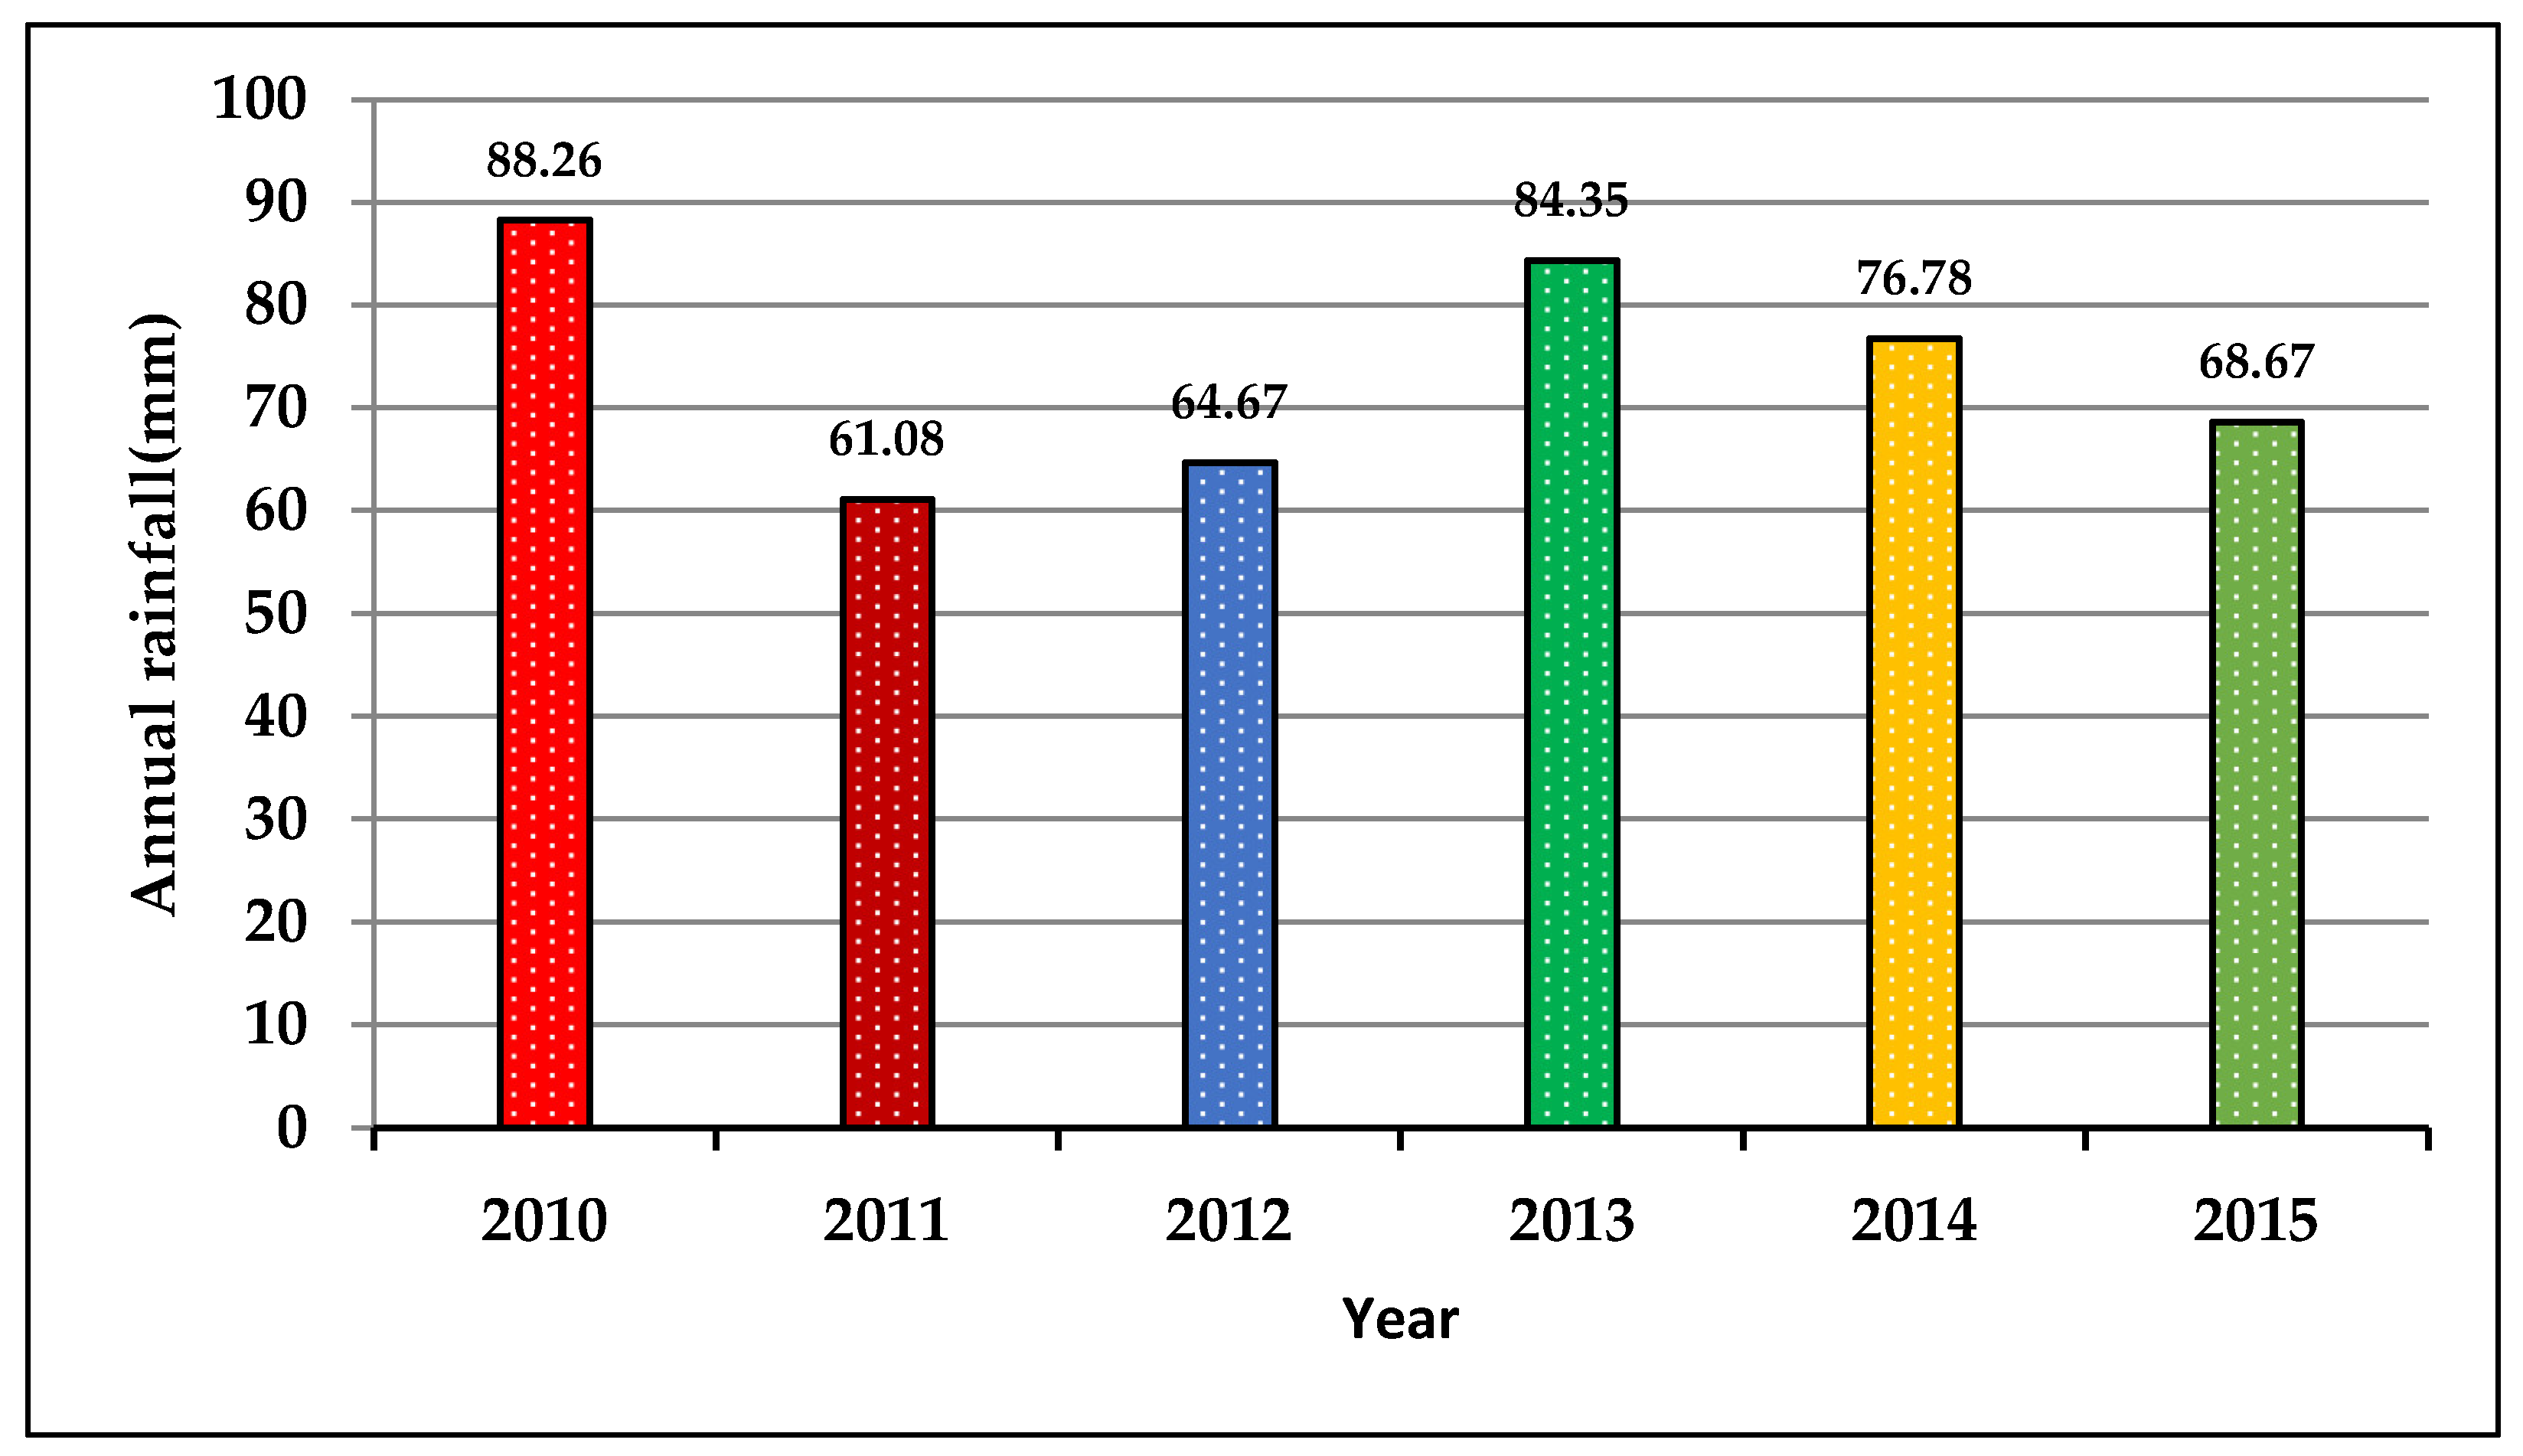
3.4.2. Annual Rainfall

Similarly, Figure 7 shows the average annual rainfall of the study area from 2010 to 2015. The graph shows the variation in the annual rainfall pattern. The maximum average rainfall, 88.25 mm, was observed in 2010, while the minimum annual rainfall, 61.08 mm, was observed in 2011. The figure showed annual variability in rainfall data. The graph showed a decrease in the average annual rainfall of the study area from 2010 to 2015. The rainfall distribution changes are related to climate change [68]. There was high changeability in the rainfall pattern, but the average annual rainfall of the study area was 73.96 mm, as determined from the five-year rainfall data.
Figure 7. Annual rainfall pattern from 2010 to 2015 in the study area.
Water 14 03270 g007

3.4.3. Rainwater-Harvesting Potential

Table 5 shows the rainwater-harvesting potential of the study area per household, for which the equation RW = R × obtained A × RC was used, where R = 73.96 mm. In contrast, an average roof area (80 m2) was determined for the study area, and RC was taken as 0.80. We found that the annual rainwater-harvesting potential per household was 56,803.24 L/year. The highest volume were collected in February, 11,626.24 L/month. In contrast, the lowest was 1098.24 L in December. In comparison, the average annual harvested rainwater was 4733.35 L, as shown in Figure 8. Collecting rainwater depends on the monthly rainfall, roof area, and roof runoff coefficient [69]. As determined in the literature, the roof area varies between 25 and 200 m2 [70,71]. Furthermore, the roof runoff coefficient (RC) varies between 0.75 and 0.95 in the literature [72]. An RC value of 0.8 was adopted for this study, as utilized by [69,73], and leakage, spillage, infiltration, roof surface wetting, and evaporation were accounted for in 70–85% of the harvestable rainfall, as suggested by [74].
Figure 8. Monthly harvested rainwater in the study area.
Water 14 03270 g008

4. Conclusions

The results of this study showed that all the water quality parameters were within acceptable limits compared to the WHO’s permissible limits. In contrast, the values of some parameters, such as pH, turbidity, and heavy metal Fe and Pb, were above the permissible limits outlined by the WHO. In the same way, the health risk assessment showed that the rainwater samples of the study area were safe and not risky for human health. The high levels of Fe and Pb do not currently cause any harmful effects, but may cause health effects in the future through gradual accumulation in the human body. The compromised rainwater quality could be affected by natural and anthropogenic activities, which increase the number of atmospheric pollutants. So, it is necessary to avoid Pb-containing paint to reduce the effects of Pb on health. As shown by the quantitative assessment, the study area has great potential for rainwater harvesting. So, it was concluded from the present study that roof-harvested rainwater was safe for drinking and other domestic consumption. The quality of rainwater can be enhanced by taking proper care of the cleanness of the roof area, storage system, and diversion of the first flush from the storage tank. Regular cleaning and proper management would reduce health risks related to rainwater consumption. Overall, the rainwater quality in the study area was acceptable, but improvements should be made. Proper monitoring and management are necessary to maintain the quality of roof-harvested rainwater. Education and awareness should change people’s perceptions of rainwater quality and harvesting. The government should make policies and plans around the rainwater-harvesting system and make it mandatory as a strategy for water conservation to solve the problem of water shortage at the country level. To solve the problem of water scarcity, the government should launch a small-scale project to make rainwater storage tanks for residents of the study area because most of the people in this area are poor.

Author Contributions

Conceptualization, B.R. and W.U.; methodology, R.U.; software, T.A.A.; validation, Z.A.; formal analysis, M.F.J.; investigation, N.A.K.; resources, data curation, O.K.; writing—review and editing, I.D.; visualization, S.U.; project administration, M.A.; funding acquisition, A.M. All authors have read and agreed to the published version of the manuscript.

Funding

This research received no external funding.

Institutional Review Board Statement

Not applicable.

Informed Consent Statement

Not applicable.

Data Availability Statement

All the data is presented in the manuscript and is available in this publication.

Conflicts of Interest

The authors declare no conflict of interest.

References

  1. Lasage, R.; Verburg, P.H. Evaluation of small scale water harvesting techniques for semi-arid environments. J. Arid Environ. 2015, 118, 48–57. [Google Scholar] [CrossRef]
  2. Campisano, A.; Butler, D.; Ward, S.; Burns, M.J.; Friedler, E.; DeBusk, K.; Fisher-Jeffes, L.N.; Ghisi, E.; Rahman, A.; Furumai, H.; et al. Urban rainwater harvesting systems: Research, implementation and future perspectives. Water Res. 2017, 115, 195–209. [Google Scholar] [CrossRef] [PubMed]
  3. Asadi, E.; Isazadeh, M.; Samadianfard, S.; Ramli, M.F.; Mosavi, A.; Nabipour, N.; Shamshirband, S.; Hajnal, E.; Chau, K.W. Groundwater quality assessment for sustainable drinking and irrigation. Sustainability 2020, 12, 177. [Google Scholar] [CrossRef] [Green Version]
  4. Liaw, C.H.; Chiang, Y.C. Dimensionless analysis for designing domestic rainwater harvesting systems at the regional level in Northern Taiwan. Water 2014, 6, 3913–3933. [Google Scholar] [CrossRef] [Green Version]
  5. Mays, L.W. Survey of ancient water technologies in semi-arid and arid regions: Traditional knowledge for the future. Water Supply 2017, 17, 1278–1286. [Google Scholar] [CrossRef] [Green Version]
  6. Ahmed, W.; Gardner, T.; Toze, S. Microbiological quality of roof-harvested rainwater and health risks: A review. J. Environ. Qual. 2011, 40, 13–21. [Google Scholar] [CrossRef] [Green Version]
  7. Krishna, H.J.; Brown, C.; Gerston, J.; Colley, S. The Texas Manual on Rainwater Harvesting, 3rd ed.; Texas Water Development Board: Austin, TX, USA, 2005. [Google Scholar]
  8. Kus, B.; Kandasamy, J.; Vigneswaran, S.; Shon, H.K. Analysis of first flush to improve the water quality in rainwater tanks. Water Sci. Technol. 2010, 61, 421–428. [Google Scholar] [CrossRef]
  9. Jamal, R.; Kamel, A.Z.; Adnan, A.H.; Rida, A.A. Quality Assessment of Harvested Roof Top Rainwater for Domestic Uses. Environ. Earth Sci. 2008, 6, 149–155. [Google Scholar]
  10. Quality_Assessment_of_Harvested_Rainwater_for_Domestic_Uses. Available online: https://www.researchgate.net/publication/268047323_ (accessed on 15 June 2022).
  11. Ubuoh, E.A. Susceptibility of Roofing Sheets to Atmospheric-Borne Corrosive Agents in Owerri, Nigeria. Int. People-Ware Appl. Gatew. Anal. Learn. 2012, 1, 1–10. [Google Scholar]
  12. Susceptibility of Roofing Sheets to Atmospheric-Borne Corrosive Agents in Owerri, Nigeria. International People-ware Appliance for Gateway to Analytical Learning (Pakistan). Available online: https://www.bing.com/search?q=Ubuoh%2C+E.+A.+(2012).+Susceptibility+of+Roofing+Sheets+to+Atmospheric-Borne+Corrosive+Agents+in+Owerri%2C+Nigeria‖.+International+People-ware+Appliance+for+Gateway+to+Analytical+Learning+(Pakistan)%2C+1%2C+1-10.&cvid=bc3ae91 (accessed on 15 June 2022).
  13. Cheng, C.L.; Liao, M.C. Regional rainfall level zoning for rainwater harvesting systems in northern Taiwan. Resour. Conserv. Recycl. 2009, 53, 421–428. [Google Scholar] [CrossRef]
  14. Igbinosa, I.H.; Osemwengie, O.V. On-site assessment of environmental and sanitary qualities of Rainwater Harvesting System (RWH) in a rural community in Benin City, Nigeria. J. Appl. Sci. Environ. Manag. 2016, 20, 320–324. [Google Scholar] [CrossRef]
  15. Meera, V.; Ahammed, M.M. Factors Affecting the Quality of Roof-Harvested Rainwater; Springer: Cham, Switzerland, 2018; pp. 195–202. [Google Scholar] [CrossRef]
  16. Li, Z.; Boyle, F.; Reynolds, A. Rainwater harvesting and greywater treatment systems for domestic application in Ireland. Desalination 2010, 260, 1–8. [Google Scholar] [CrossRef] [Green Version]
  17. Abbasi, T.; Abbasi, S.A. Sources of pollution in rooftop rainwater harvesting systems and their control. Crit. Rev. Environ. Sci. Technol. 2011, 41, 2097–2167. [Google Scholar] [CrossRef]
  18. Flues, M.; Hama, P.; Lemes, M.J.L.; Dantas, E.S.K.; Fornaro, A. Evaluation of the rainwater acidity of a rural region due to a coal-fired power plant in Brazil. Atmos. Environ. 2002, 36, 2397–2404. [Google Scholar] [CrossRef]
  19. Magyar, M.I.; Mitchell, V.G.; Ladson, A.; Diaper, C. Determining the sediment dynamics in a rainwater tank. In Novatech 2007-6ème Conférence sur les techniques et stratégies durables pour la gestion des eaux urbaines par temps de pluie/Sixth International Conference on Sustainable Techniques and Strategies in Urban Water Management; GRAIE: Lyon, France, 2007. [Google Scholar]
  20. Han, M.Y.; Mun, J.S. Particle behaviour consideration to maximize the settling capacity of rainwater storage tanks. Water Sci. Technol. 2007, 56, 73–79. [Google Scholar] [CrossRef] [PubMed]
  21. Schets, F.M.; Italiaander, R.; Van Den Berg, H.H.J.L.; de Roda Husman, A.M. Rainwater harvesting: Quality assessment and utilization in The Netherlands. J. Water Health 2010, 8, 224–235. [Google Scholar] [CrossRef]
  22. Chang, M.; McBroom, M.W.; Beasley, R.S. Roofing as a source of nonpoint water pollution. J. Environ. Manag. 2004, 73, 307–315. [Google Scholar] [CrossRef]
  23. Hamilton, K.A.; Parrish, K.; Ahmed, W.; Haas, C.N. Assessment of water quality in roof-harvested rainwater barrels in greater Philadelphia. Water 2018, 10, 92. [Google Scholar] [CrossRef] [Green Version]
  24. Lei, X.; Chen, W.; Avand, M.; Janizadeh, S.; Kariminejad, N.; Shahabi, H.; Costache, R.; Shahabi, H.; Shirzadi, A.; Mosavi, A. GIS-based machine learning algorithms for gully erosion susceptibility mapping in a semi-arid region of Iran. Remote Sens. 2020, 12, 2478. [Google Scholar] [CrossRef]
  25. Band, S.S.; Janizadeh, S.; Chandra Pal, S.; Saha, A.; Chakrabortty, R.; Melesse, A.M.; Mosavi, A. Flash flood susceptibility modeling using new approaches of hybrid and ensemble tree-based machine learning algorithms. Remote Sens. 2020, 12, 3568. [Google Scholar] [CrossRef]
  26. Choubin, B.; Mosavi, A.; Alamdarloo, E.H.; Hosseini, F.S.; Shamshirband, S.; Dashtekian, K.; Ghamisi, P. Earth fissure hazard prediction using machine learning models. Environ. Res. 2019, 179, 108770. [Google Scholar] [CrossRef]
  27. Qasem, S.N.; Samadianfard, S.; Sadri Nahand, H.; Mosavi, A.; Shamshirband, S.; Chau, K.W. Estimating daily dew point temperature using machine learning algorithms. Water 2019, 11, 582. [Google Scholar] [CrossRef] [Green Version]
  28. Mosavi, A.; Sajedi Hosseini, F.; Choubin, B.; Goodarzi, M.; Dineva, A.A.; Rafiei Sardooi, E. Ensemble boosting and bagging based machine learning models for groundwater potential prediction. Water Resour. Manag. 2021, 35, 23–37. [Google Scholar] [CrossRef]
  29. Shabani, S.; Samadianfard, S.; Sattari, M.T.; Mosavi, A.; Shamshirband, S.; Kmet, T.; Várkonyi-Kóczy, A.R. Modeling pan evaporation using Gaussian process regression K-nearest neighbors’ random forest and support vector machines; comparative analysis. Atmosphere 2020, 11, 66. [Google Scholar] [CrossRef] [Green Version]
  30. Adeniyi, I.F.; Olabanji, I.O. The physico-chemical and bacteriological quality of rainwater collected over different roofing materials in Ile-Ife, southwestern Nigeria. Chem. Ecol. 2005, 21, 149–166. [Google Scholar] [CrossRef]
  31. Stewart, C.; Kim, N.D.; Johnston, D.M.; Nayyerloo, M. Health Hazards Associated with Consumption of Roof-Collected Rainwater in Urban Areas in Emergency Situations. Int. J. Environ. Res. Public Health 2016, 13, 1012. [Google Scholar] [CrossRef] [Green Version]
  32. Gikas, G.D.; Tsihrintzis, V.A. Assessment of water quality of first-flush roof runoff and harvested rainwater. J. Hydrol. 2012, 466–467, 115–126. [Google Scholar] [CrossRef]
  33. Abdulla, F.A.; Al-Shareef, A.W. Roof rainwater harvesting systems for household water supply in Jordan. Desalination 2009, 243, 195–207. [Google Scholar] [CrossRef]
  34. McCuen, R.H. Hydrologic Analysis and Design; Pearson Prentice Hall: Upper Saddle River, NJ, USA, 2004; p. 790. [Google Scholar]
  35. Viessman, W.J., Jr.; Lewis, G.L. (Eds.) Introduction to Hydrology; Harper Collins College: New York, NY, USA, 1996; ISBN 9780673993373. Available online: https://www.amazon.com/Introduction-Hydrology-5th-Warren-Viessman/dp/067399337X (accessed on 15 June 2022).
  36. Angrill, S.; Petit-Boix, A.; Morales-Pinzón, T.; Josa, A.; Rieradevall, J.; Gabarrell, X. Urban rainwater runoff quantity and quality—A potential endogenous resource in cities? J. Environ. Manag. 2017, 189, 14–21. [Google Scholar] [CrossRef] [PubMed] [Green Version]
  37. Aladenola, O.O.; Adeboye, O.B. Assessing the potential for rainwater harvesting. Water Resour. Manag. 2010, 24, 2129–2137. [Google Scholar] [CrossRef]
  38. Briscoe, J.; Qamar, U.; Contijoch, M.; Amir, P.; Blackmore, D. Pakistan’s Water Economy: Running Dry; World Bank: Washington, DC, USA, 2005. [Google Scholar]
  39. Islam, M.A.; Akber, M.A.; Rahman, M.A.; Islam, M.A.; Kabir, M.P. Evaluation of harvested rainwater quality at primary schools of southwest coastal Bangladesh. Environ. Monit. Assess. 2019, 191, 80. [Google Scholar] [CrossRef] [PubMed]
  40. Igbinosa, I.H.; Aighewi, I.T. Quality assessment and public health status of harvested rainwater in a peri-urban community in Edo State of Nigeria. Environ. Monit. Assess. 2017, 189, 1–12. [Google Scholar] [CrossRef]
  41. Baguma, D.; Loiskandl, W.; Jung, H. Water Management, Rainwater Harvesting and Predictive Variables in Rural Households. Water Resour. Manag. 2010, 24, 3333–3348. [Google Scholar] [CrossRef]
  42. Ullah, S.; Hasan, Z.; Li, Z.; Zuberi, A.; Zorriehzahra, M.J.; Nabi, G. Diversity and community composition of ichthyofauna at Konhaye Stream, district Dir Lower, Pakistan. Iran. J. Fish. Sci. 2020, 19, 2322–2339. [Google Scholar] [CrossRef]
  43. Akmal, M. Hand Pumps’ Water Quality Analysis for Drinking and Irrigation Purposes at District Dir Lower, Khyber Pakhtunkhwa Pakistan. Eur. Acad. Res. 2014, 2, 1560–1571. [Google Scholar]
  44. American Public Health Association; American Water Works Association; Water Environment Federation. Standard Methods for the Examination of Water and Wastewater, 20th ed.; No. 6000; American Public Health Association: Washington, DC, USA, 1998. [Google Scholar]
  45. Ghisi, E.; Montibeller, A.; Schmidt, R.W. Potential for potable water savings by using rainwater: An analysis over 62 cities in southern Brazil. Build. Environ. 2006, 41, 204–210. [Google Scholar] [CrossRef]
  46. Lee, J.Y.; Bak, G.; Han, M. Quality of roof-harvested rainwater—Comparison of different roofing materials. Environ. Pollut. 2012, 162, 422–429. [Google Scholar] [CrossRef]
  47. Thomas, T.H.; Martinson, D.B. Roofwater Harvesting: A Handbook for Practitioners; International Water and Sanitation Centre: The Hague, The Netherlands, 2007. [Google Scholar]
  48. Muhammad, S.; Shah, M.T.; Khan, S. Health risk assessment of heavy metals and their source apportionment in drinking water of Kohistan region, northern Pakistan. Microchem. J. 2011, 98, 334–343. [Google Scholar] [CrossRef]
  49. Scope, C. Guidance for Performing Aggregate Exposure and Risk Assessments; No. 202; Office of Pesticide Programs-Environmental Protection Agency: Arlington, VA, USA, 1999.
  50. Shittu, O.B.; Olaitan, J.O.; Amusa, T.S. Physico-chemical and bacteriological analyses of water used for drinking and swimming purposes in Abeokuta, Nigeria. Afr. J. Biomed. Res. 2010, 11, 285–290. [Google Scholar] [CrossRef] [Green Version]
  51. Salam, M.; Alam, F.; Hossain, M.; Saeed, M.A.; Khan, T.; Zarin, K.; Rwan, B.; Ullah, W.; Khan, W.; Khan, O. Assessing the drinking water quality of educational institutions at selected locations of district Swat, Pakistan. Environ. Earth Sci. 2021, 80, 322. [Google Scholar] [CrossRef]
  52. Mendez, C.B.; Klenzendorf, J.B.; Afshar, B.R.; Simmons, M.T.; Barrett, M.E.; Kinney, K.A.; Kirisits, M.J. The effect of roofing material on the quality of harvested rainwater. Water Res. 2011, 45, 2049–2059. [Google Scholar] [CrossRef]
  53. Duggal, K.N. Element of Environmental Engineering Water Quality Analysis, Ram Nagar, New Delhi; Channel and Company Ltd.: Westborough, MA, USA, 2004; Available online: https://pdfgoal.com/downloads/elements_of_environmental_engineering_pdf_by_k_duggal (accessed on 15 June 2022).
  54. Meera, V.; Ahammed, M.M. Water quality of rooftop rainwater harvesting systems: A review. J. Water Supply Res. Technol. 2006, 55, 257–268. [Google Scholar] [CrossRef]
  55. Zhu, K.; Zhang, L.; Hart, W.; Liu, M.; Chen, H. Quality issues in harvested rainwater in arid and semi-arid Loess Plateau of northern China. J. Arid Environ. 2004, 57, 487–505. [Google Scholar] [CrossRef]
  56. Nevondo, T.S.; Cloete, T.E. Bacterial and chemical quality of water supply in the Dertig village settlement. Water 1999, 25, 215–220. [Google Scholar]
  57. Al-Khatib, I.A.; Arafeh, G.A.; Al-Qutob, M.; Jodeh, S.; Hasan, A.R.; Jodeh, D.; van der Valk, M. Health risk associated with some trace and some heavy metals content of harvested rainwater in Yatta area, Palestine. Water 2019, 11, 238. [Google Scholar] [CrossRef] [Green Version]
  58. Eletta, O.A.A.; Oyeyipo, J.O. Rainwater harvesting: Effect of age of roof on water quality. Int. J. Appl. Chem. 2008, 4, 157–162. [Google Scholar]
  59. Lamprea, K.; Ruban, V. Characterization of atmospheric deposition and runoff water in a small suburban catchment. Environ. Technol. 2011, 32, 1141–1149. [Google Scholar] [CrossRef] [PubMed]
  60. Davis, A.P.; Shokouhian, M.; Ni, S. Loading estimates of lead, copper, cadmium, and zinc in urban runoff from specific sources. Chemosphere 2001, 44, 997–1009. [Google Scholar] [CrossRef]
  61. Islam, M.M.; Chou, F.N.F.; Kabir, M.R.; Liaw, C.H. Rainwater: A Potential Alternative Source for Scarce Safe Drinking and Arsenic Contaminated Water in Bangladesh. Water Resour. Manag. 2010, 24, 3987–4008. [Google Scholar] [CrossRef]
  62. Zhang, Y.; Lin, Y.P. Leaching of lead from new unplasticized polyvinyl chloride (uPVC) pipes into drinking water. Environ. Sci. Pollut. Res. 2014, 22, 8405–8411. [Google Scholar] [CrossRef]
  63. Gould, J. Is rainwater safe to drink? A review of recent findings. In Proceedings of the 9th International Rainwater Catchment Systems Conference, Petrolina, Brazil, 6–9 July 1999. [Google Scholar]
  64. ATSDR. Lead—ToxFAQs. 2007. Available online: https://wwwn.cdc.gov/dcs/ContactUs/Form (accessed on 15 June 2022).
  65. Yousaf, S.; Begum, S.; Afridi, I.; Shakil, M.; Tariq, M. Assessment of drinking water quality and human health risks in the tehsils of Jamrud and Landikotal, Khyber Agency, Pakistan. J. Himal. Earth Sci. 2016, 49, 58–67. [Google Scholar]
  66. Traboulsi, H.; Traboulsi, M. Rooftop level rainwater harvesting system. Appl. Water Sci. 2017, 7, 769–775. [Google Scholar] [CrossRef] [Green Version]
  67. Taher, T.M. Quantity and Quality Considerations of Rooftop Rainwater Harvesting as a Substantial Resource to Face Water Supply Shortages. Int. J. Water Resour. Arid Environ. 2014, 3, 1–10. Available online: https://www.researchgate.net/publication/306058157_Quantity_and_Quality_Considerations_of_Rooftop_Rainwater_Harvesting_as_a_Substantial_Resource_to_Face_Water_Supply_Shortages (accessed on 15 June 2022).
  68. Qin, M.M.; Chen, D.; Averyt, Z.R.; Miller, K.B.; Solomon, H.L.; Manning, S.C.; Marquis, M.R.; Tignor, M. IPCC, 2007: Summary for Policymakers. 2007. Available online: https://www.semanticscholar.org/paper/IPCC%2C-2007%3A-Summary-for-Policymakers-Qin-Chen/8109ccb13ca3c75354bbaaf9f7e0c825b438eb44 (accessed on 15 June 2022).
  69. Woltersdorf, L.; Liehr, S.; Döll, P. Rainwater Harvesting for Small-Holder Horticulture in Namibia: Design of garden variants and assessment of climate change impacts and adaptation. Water 2015, 7, 1402–1421. [Google Scholar] [CrossRef] [Green Version]
  70. Otti, V.I.; Ezenwaji, E.E. Enhancing community-driven initiative in rainwater harvesting in Nigeria. Int. J. Eng. Res. Technol. 2013, 3, 73–79. [Google Scholar]
  71. Biswas, B.K.; Mandal, B.H. Construction and Evaluation of Rainwater Harvesting System for Domestic Use in a Remote and Rural Area of Khulna. Bangladesh ISRN Otolaryngol. 2014, 2014, 751952. [Google Scholar] [CrossRef]
  72. Helmreich, B.; Horn, H. Opportunities in rainwater harvesting. Desalination 2009, 248, 118–124. [Google Scholar] [CrossRef]
  73. Shittu, O.I.; Okareh, O.T.; Coker, A.O. Development of rainwater harvesting technology for securing domestic water supply in Ibadan, Nigeria. Int. J. Eng. Res. Technol. 2015, 4, 32–37. [Google Scholar]
  74. Fernandes, L.F.S.; Terencio, D.P.S.; Racheco, F.A.L. Rainwater harvesting systems for low demanding applications. Sci. Total Environ. 2015, 529, 91–100. [Google Scholar] [CrossRef]
Figure 1. Map of the study area showing sampling points.
Water 14 03270 g001
Figure 4. MDI of heavy metals in roof-harvested rainwater.
Water 14 03270 g004
Figure 5. HRI for heavy metals in roof-harvested rainwater.
Water 14 03270 g005
Publisher’s Note: MDPI stays neutral with regard to jurisdictional claims in published maps and institutional affiliations.

