
Coastal Soil Salinity Amelioration and Crop Yield Improvement by Biomaterial Addition in East China
by
 ,
,
Yunpeng Sun
1, 
Xiaobing Chen
2,*,
Jingsong Yang
1,
Yongming Luo
1,
Rongjiang Yao
1,
Xiangping Wang
1,
Wenping Xie
1 and
Xin Zhang
1,* 1
State Key Laboratory of Soil and Sustainable Agriculture, Institute of Soil Science, Chinese Academy of Sciences, Nanjing 210008, China
2
Yantai Institute of Coastal Zone Research, Chinese Academy of Sciences, Yantai 264003, China
*
Authors to whom correspondence should be addressed.
Water 2022, 14(20), 3266; https://doi.org/10.3390/w14203266
Submission received: 17 September 2022
/
Revised: 12 October 2022
/
Accepted: 13 October 2022
/
Published: 17 October 2022
(This article belongs to the Special Issue Monitoring, Reclamation and Management of Salt-Affected Lands)
Abstract
:A field experiment was conducted to investigate the effects of biochar (BC), fulvic acid (FA) and Bacillus subtilis (BS) on soil properties and crop growth in the coastal salt-affected soil. Four levels of BC (0, 7.5, 15, 30 t ha−1), two levels of FA (0, 1.5 t ha−1) and BS suspension (0, 108 CFU mL−1) were designed during the maize cultivation. The results showed that 30 t ha−1 BC treatment was the most beneficial for improving the soil qualities. The grain yields in treatments containing FA and BS were lower than that in the BC treatments, and they were lower than that in the CK treatment. The treatment of 15 t ha−1 BC + BS obtained the highest grain yield, which was 1.75 times more than CK. An antagonism effect of the combination of FA and BS induced a grain yield decrease, and a higher content application of BC alleviated the negative effects.
1. Introduction
Soil salinity is the main obstacle factor in developing farmland in a coastal tidal flat reclamation region. The way to address this challenge will be a long-term mission. Efforts have been made to control soil salinity by various technological means, including physical, hydrological, chemical, biological techniques and combined remediation techniques. Soil conditioner is a mixture of various substances, which has great potential in salt removal [1], promotion of crop growth [2], improvement of crop quality and amelioration of soil culture [3]. The present study pertains to the soil conditioner and provides more information about it for further research.
Biochar (BC) is a classic type of charcoal, which is produced by heating wood, crop waste or other biomass in a tightly closed container with little or no available air at relatively low temperatures (<700 °C) [4]. As an agricultural amendment, the use of biochar has attracted much attention for the coastal amelioration of saline-alkali soil. Biochar is commonly alkaline; it can be used to increase the pH in acidic soils [5]. Although the properties of biochar effects are limited by the reaction vessel, the original organic material, the heating rate, the highest temperature and the holding time of pyrolysis, porosity and a stable structure are its common properties. In addition, carbonates are the major alkaline components in biochar, its metal cations being generated from the different feedstock [6]. Therefore, we can take advantage of its porosity and stability properties for saline-alkali soil conditions improvement after reducing its carbonate content.
Fulvic acid (FA) is a water-soluble humic material, which is well known as a kind of plant biostimulant for enhancing nutrient uptake and growth by the plant, controlling soil-borne diseases and improving soil condition. Bacillus subtilis (BS) is beneficial for plants by promoting growth and inducing disease suppression [7,8,9]. The strain has the ability to adapt to the soil environment by exchanging linked blocks of genes and maintaining gene diversification [10]. The isolation of halotolerant Bacillus subtilis was conducted in many research works, and it has been proven that it exerts positive effects on the physiology characterization of plants under salinity stress [11].
Each year, China produces approximately 800 million tons of agricultural straw, but almost 40 percent is burned in the fields as waste [12]. The biochar produced from these agricultural residues could be applied to agricultural land for an efficient use of resources, which could also help reach the goals of carbon reduction and sequestration. Maize is one of the most important cereal crops in the world as a salt-sensitive crop [13]. The promising material ‘biochar’ and fulvic acid could be added into soil with maize plantations, and then, the influence of different treatments on soil properties and the physiological character of the plants could be compared. Maize planting experiments would be an effective approach to improve the soil habitat and develop coastal area agriculture.
Therefore, our objective for the study was to investigate the effects of biochar, fulvic acid and Bacillus subtilis on soil properties and maize agronomic characteristics. We hypothesized that biomaterial additions would improve plant performance in the coastal tidal flat region and provide assistance for saline agricultural development by using the optimal result of the research.
2. Materials and Methods
2.1. Experimental Site and Soil
The field experiment was conducted in Huanghaiyuan Farm (32°38′42.01″ N, 120°54′8.04″ E), which is located in Jianggang village of Dongtai city, Jiangsu province, China. The experimental field was reclaimed in 2005, and it is approximately 2 km away from the coastline of the China Yellow Sea. The climate of the study area is subtropical, and it is influenced by the transition, oceanity and monsoon, with large seasonal fluctuations in temperature and rainfall as well. The mean annual precipitation in the study area is 1042 mm, occurring mostly during the rainy season from June to September, which is about 70% of the annual precipitation. The mean annual evaporation is 1417 mm, and the average annual temperature, wind velocity and relative humidity are 14.6 °C, 3.3 m s−1 and 81%, respectively.
In the study area, marine deposits are the main soil parent materials, and soil salinity is known as the main barrier factor. The soil in the study area is typical coastal saline soil in east China. Silty loam is the predominant soil type in the study area because it has a poor soil environment, such as low porosity (42%), high infiltration and soil impedance (cone index 4.86 Mpa), as well as low organic matter content (3.2 g kg−1).
2.2. Characterization of Biochar, Fulvic Acid and Bacillus Subtilis
Biochar was derived from wheat straw residue by temperature treatment at 350–550 °C and a furnace residence time of 8 h in a biogas energy pyrolysis system (Sanli New Energy. Ltd., Xinxiang City, China). It contained 467 g kg−1 organic carbon, 0.6 g cm−3 bulk density with a surface area of 8.92 m2 g−1 and a cation exchange capacity of 21.7 cmol kg−1. The pH and EC values of biochar were 10.41 and 1.01 ds m−1, determined at 1:20 biochar to deionized water extraction (GB/T 12496.7 1999), respectively.
FA was produced by Hongtudi Humic Acid Company in JiangXi Province. The FA was produced using straws—first by cutting the wheat straw to average 0.5 cm fragments, then combining the straw with microbial fermentation and adjusting the pH of the combination to 7.5. After 2 weeks of cultivation, the liquid was extracted, and a 0.1 mol L−1 NaOH solution was added to obtain the sediments, which were then left to set for 1 h. The FA powder was produced by passing the sediments through 100 meshes. The pH value of FA measured in the extraction deionized water was 5.65; the water was 1:5 FA. Otherwise, the Bacillus subtilis was purchased from Kelvfeng Biochemistry Science and Technology Company in Baoding city. It was produced starting from the test tube strain. The culture was increased by step expansion, and finally, Bacillus subtilis was fermented by a mechanical stirring tank. The cultivation media consisted of wheat straw, sugar, protein, water and salt solutions. The Bacillus subtilis agent had approximately one billion live bacteria per gram.
2.3. Experimental Design
A field experiment design was established in June 2015 using a completely randomized factorial design to investigate the effects of applying different proportions of BC and/or FA and/or BS on the properties of soil and on the growth and productivity of maize. Some measures were implemented to reduce the salinity of biochar. Firstly, we ground the biochar to pass it through a sieve of 2 mm and soaked the biochar in deionized water for 24 h and stirred it for some time before filtrating the water. Then, we wetted the biochar to 25% (w/w) to prevent the ashes from floating away. The FA were sprayed on a BC surface with the treatment design containing BC and FA. Bacillus subtitles was used for the treatment of maize seeds, and the seeds were soaked in the bacterial suspension incubated at 27 °C for 2 h [14]. The seeds were air-dried after BS incubation for sowing in the soil.
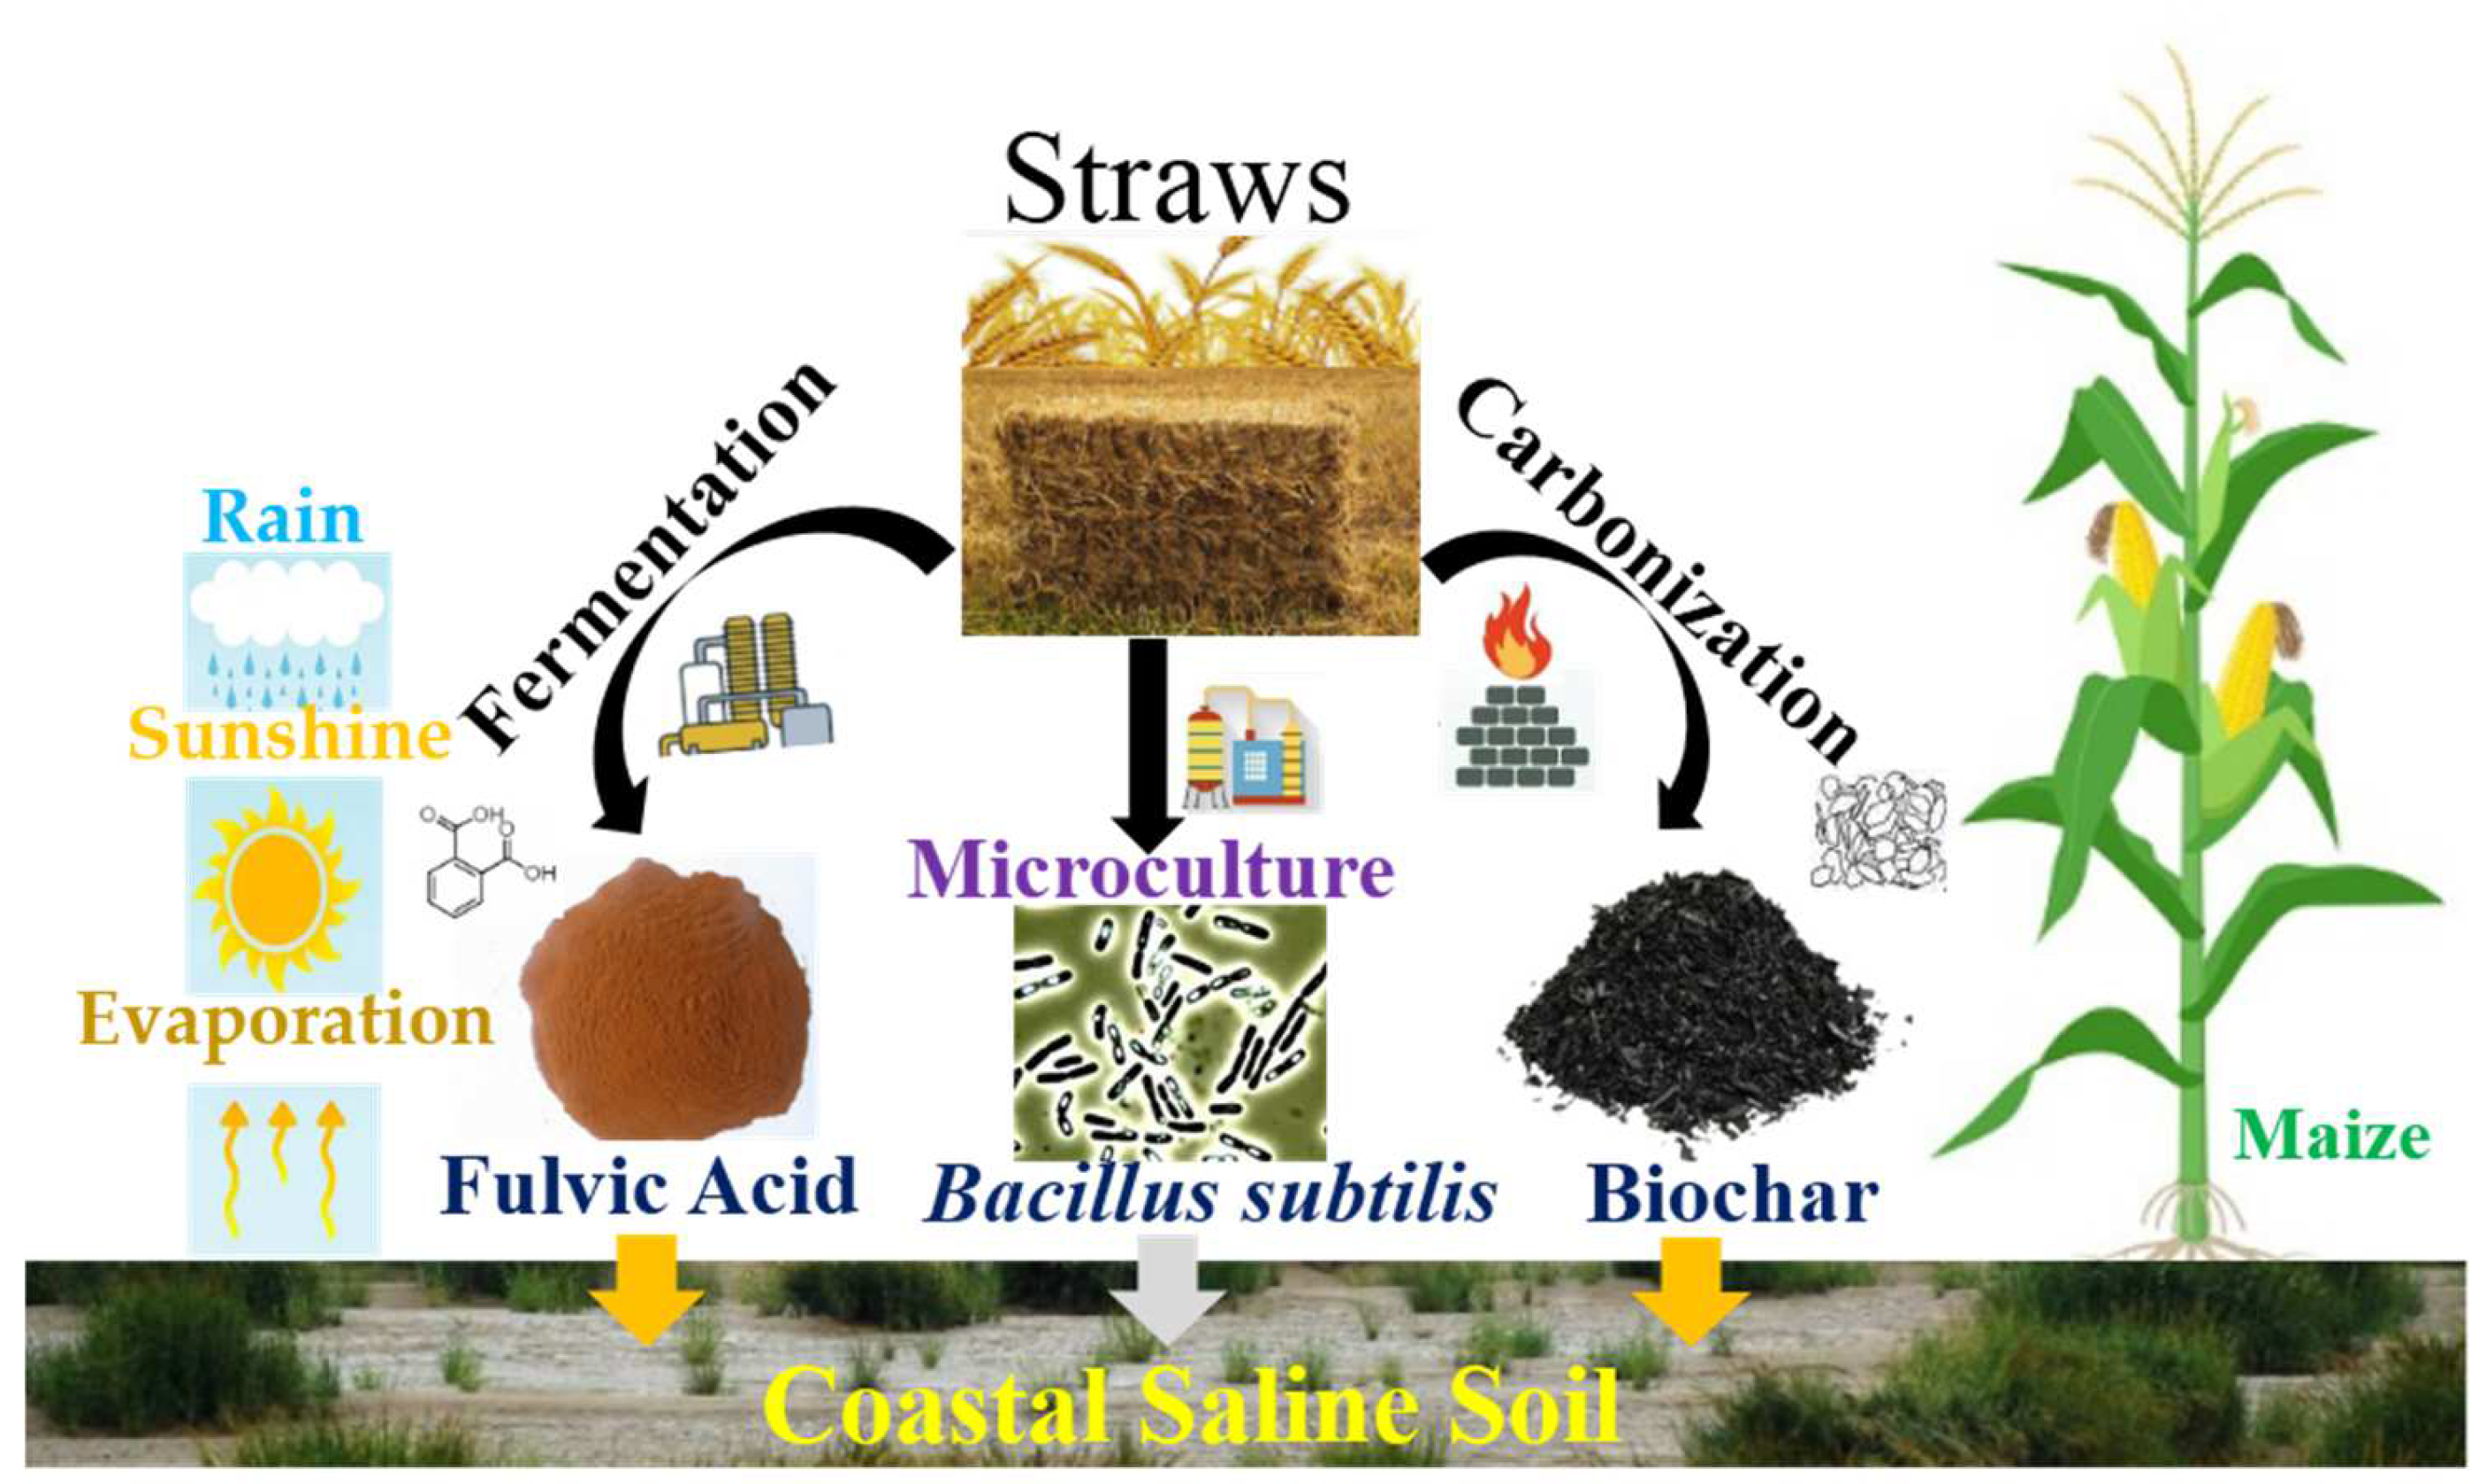
Four levels of biochar were designed in the study: 0 t ha−1, 7.5 t ha−1, 15 t ha−1 and 30 t ha−1. The amount of FA was 0, 1.5 t ha−1, and the concentration of the BS suspension was 108 CFU ml−1. A summary of the treatments is provided in Table 1. Each treatment was designed in triplicate, and each plot was arranged in a completely randomized block design. Each plot of 4 × 4 m in the area was separated with a drainage ditch 30 cm in width and 20 cm in depth. The treated biochar was spread on the soil surface, and then, we mixed it into the uppermost 15 cm of the soil within a plow. The FA was used in the soil following the same treatment procedure as BC treatments, which contained the FA without BC. The treatment group underwent the same tillage treatment as the plots with biochar. A week after amending the biochar in the soil, the maize cultivar Changjiangyv-9 was directly sown in each plot after treatment with the bacterial suspension. The sowing depth was 5–6 cm. The crop management was normal, and no irrigation was applied during the cultivation. Inorganic fertilizers were used in the experiment; total N, P fertilizers were applied at the rates of 240 kg N ha−1 and 135 kg P2O5 ha−1 in the forms of urea and monoammonium phosphate (MAP). A graphical representation of the experiment design is shown in Figure 1.
2.4. Sampling, Measurements and Analyses
Soil samples (0–20 cm) were collected by using a soil auger in each plot before applying the BC and FA, then air-dried and ground to pass through a 0.25 mm sieve for the soil organic C (SOC) analysis. The undisturbed soils (0–10 cm) were sampled with a ring knife to measure the bulk density (BD). The average values of soil water content (WC), soil saturated water content (SWC), capillary water holding capacity (CHC), soil total porosity (STP), capillary porosity (CP) and noncapillary porosity (NP) were measured by the ring knife test method. After planting maize, we took soil samples (0–20 cm) four times during the growth period to measure soil electrical conductivity (EC) and acidity (pH). The sampling periods were the seedling period (10 June), the elongating period (2 July), the tasseling period (28 July) and the ripping period (15 September), respectively. Subsequently, the samples were air-dried and passed through a 1 mm mesh sieve. During the ripping period, soil samples were obtained by a soil auger and a ring knife for the SOC and BD measurements. The saturated water content and field water capacity were measured with the ring knife. For measuring the maize growth characters, the heights of ten plants in each plot were recorded, and their grains were collected.
The parameters of SOC, BD, WC, TP and CP were determined as follows. The SOC was measured with the K2Cr2O7-H2SO4 oxidation testing method [15]. The EC and pH were measured at a solid/water ratio of 1:5 by a pH meter (pH 211 microprocessor pH meter, HANNA, Woonsocket, RI, USA) and an EC meter (EC 215 conductivity meter, HANNA, Sarmeola di Rubano, Italy). The soil bulk density (BD) and soil water holding capacity (SWC and CHC) were measured with the ring-cutting method (diameter and height of the ring knife were 5 and 5 cm, respectively) [15]. Total porosity (TP) was calculated from the bulk density and particle density (assumed to be 2.65 g cm−3), calculating the capillary porosity (CP) and noncapillary porosity (NP) as well. For maize yield measurement, the grains in each plot were collected and weighed after drying at 65 °C.
2.5. Statistical Analyses
All data were analyzed using SPSS (Statistical Product and Service Solutions) 19.0 (IBM company, New York, NY, USA) for Windows software. Significant differences for all data were tested with one-way ANOVA analysis followed by least significant differences (LSD) at p < 0.05.
3. Results
3.1. Soil Properties
3.1.1. Soil Bulk Density
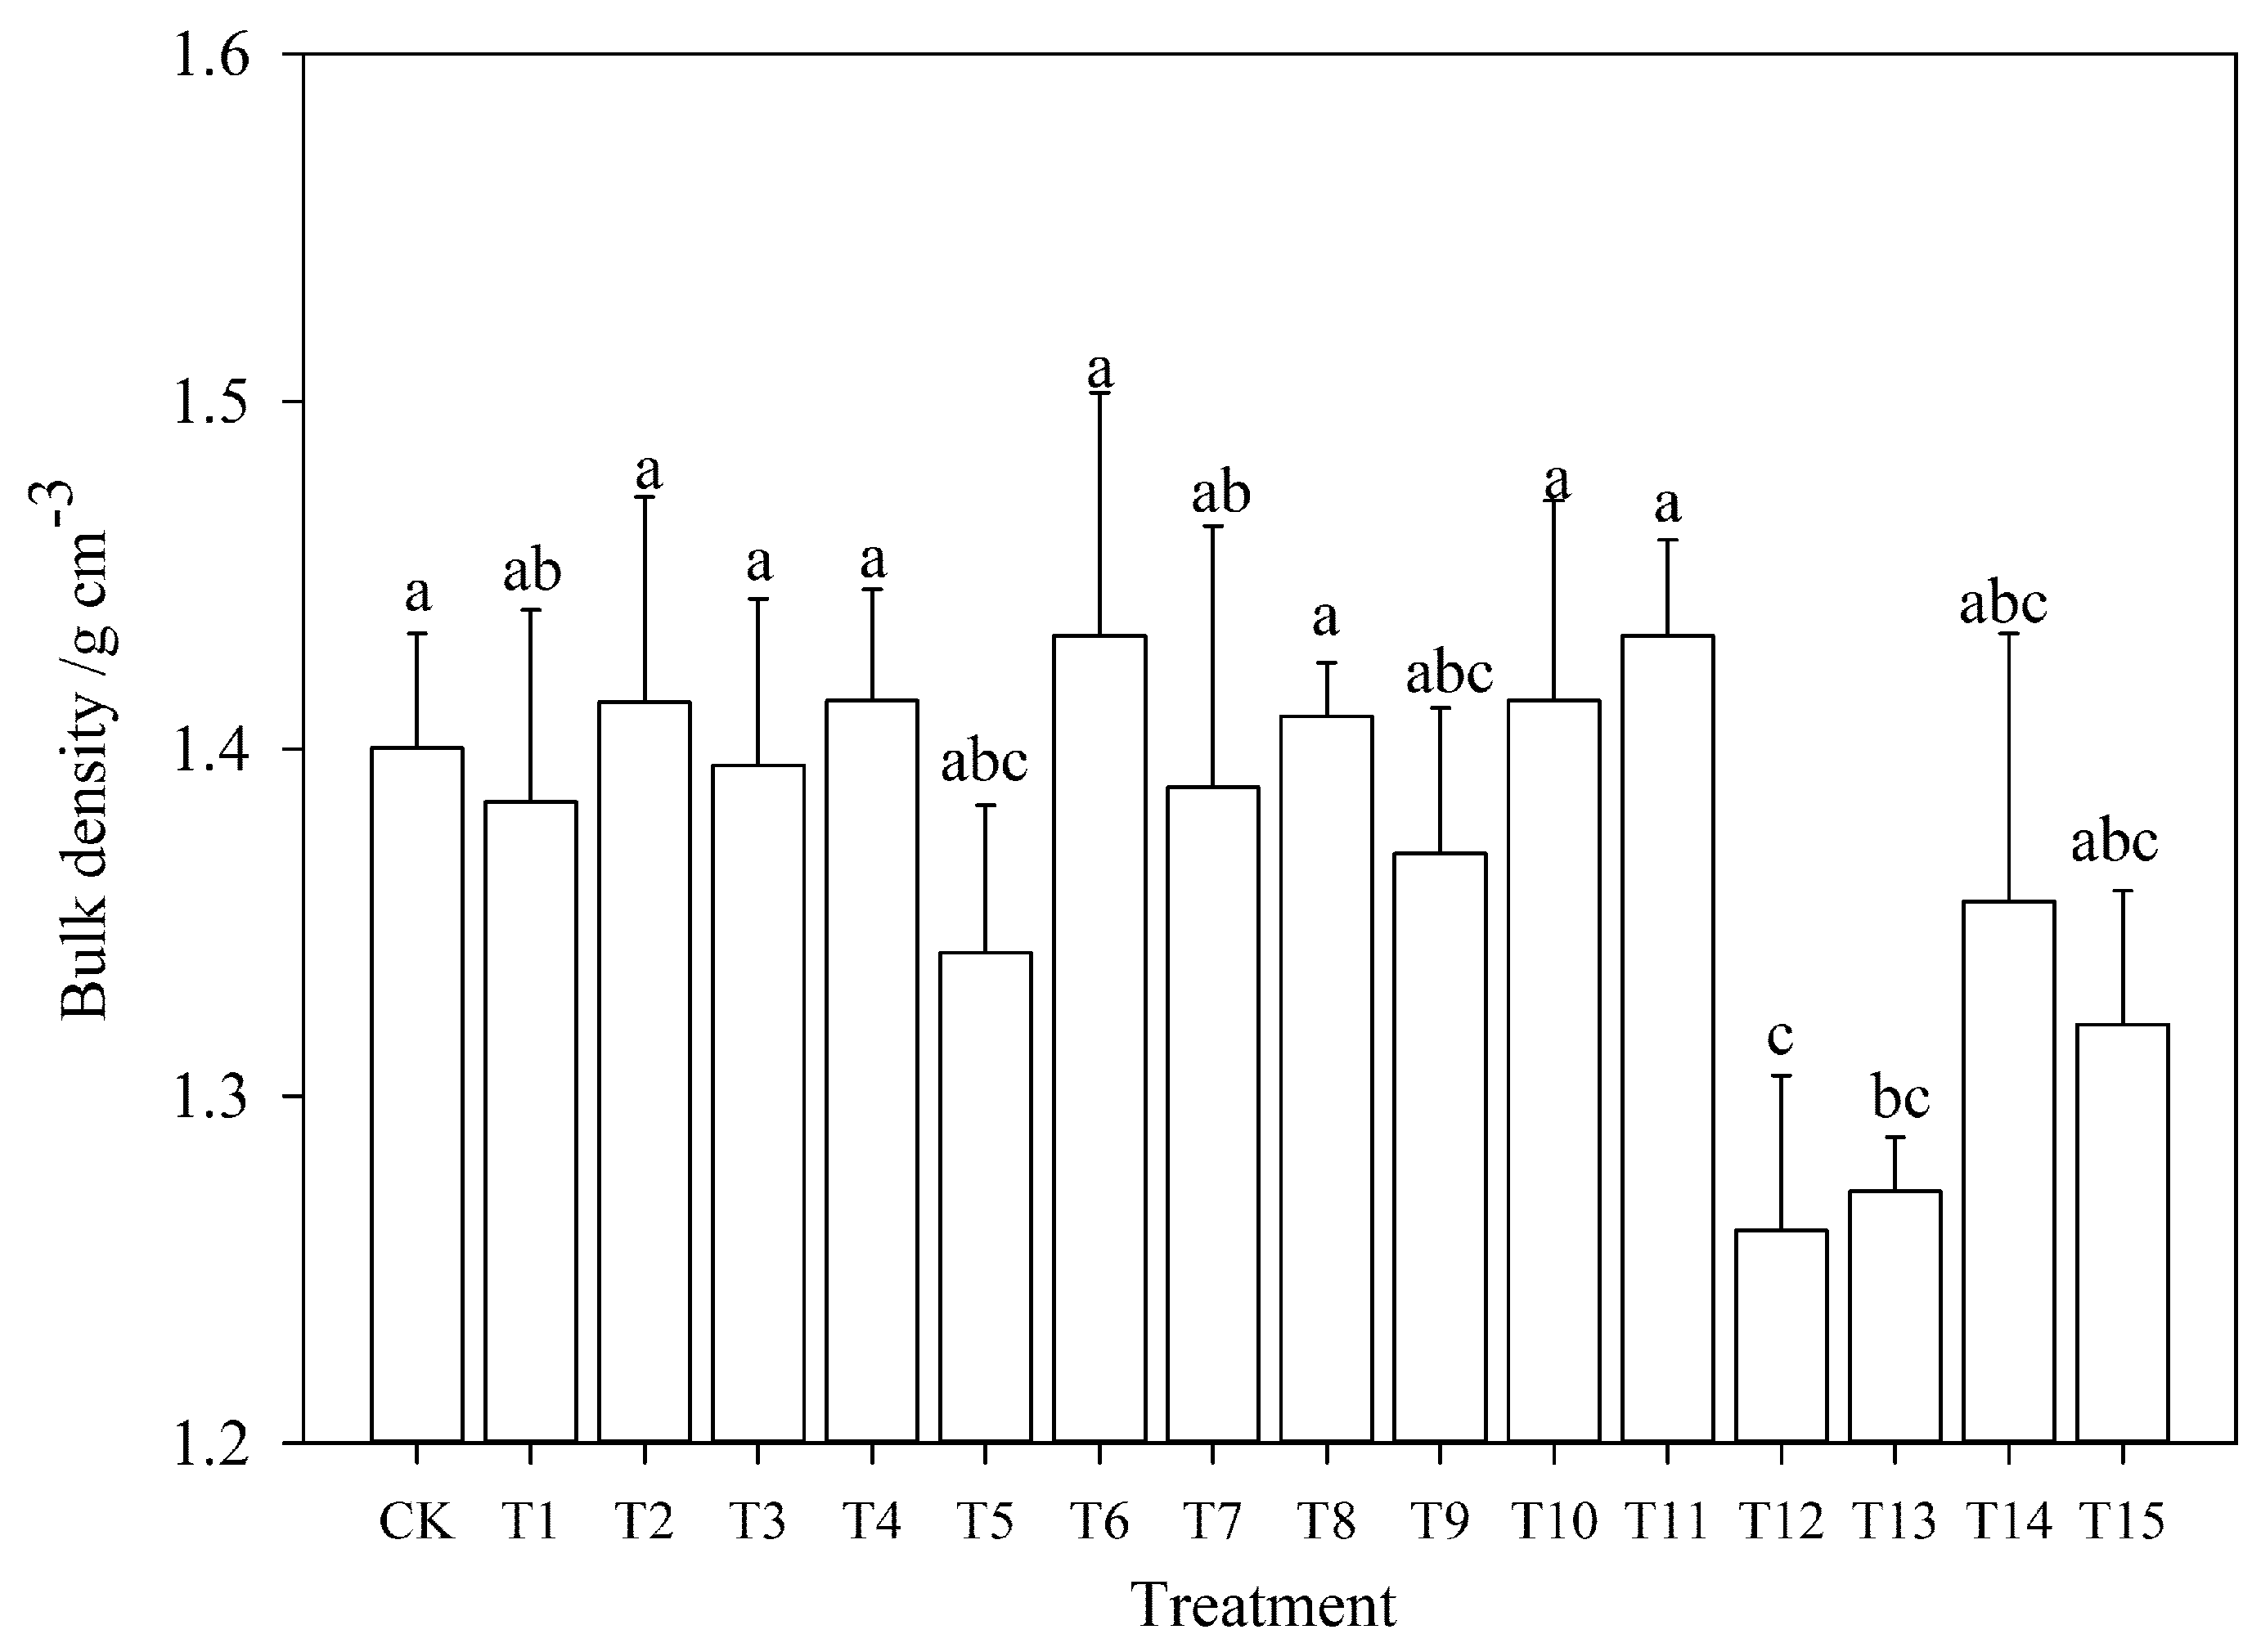
More biochar addition had stronger interactive effects on the soil bulk density. In all treatments, only T12, T13, T14, T15, which were treated with 30 t ha−1 biochar, decreased the BD by 4.47%, 4.62%, 0.02% and 3.59%, respectively. No significant differences (p > 0.05) were found between T5 (BC 7.5 t ha−1 + BS), T9 (BC15 t ha−1 + BS) and T12 to T15. Biochar addition was the major factor, which reduced the BD of soil. Treatments with 15 t ha−1 biochar (T8, T9, T10, T11) increased the BD by 7.59%, 6.29%, 5.33% and 8.41%, separately. T2 (1.5 t ha−1 Fulvic acid) resulted in the highest improvement rate of 8.49% of BD, which increased from 1.30 g cm−3 to 1.41 g cm−3. The average growth rate of BD compared with the initial value of different biochar dosages of 0, 7.5, 15 and 30 t ha−1 was 5.39%, 4.17%, 6.91% and −3.17%, respectively (Figure 2).
3.1.2. Soil Water Content, Saturated Water Content, Capillary Water Holding Capacity, Soil Porosity
During the maize ripping period, treatments with 30 t ha−1 biochar had larger values in WC, SWC, CHC, STP, CP and NP than other treatments. Biochar addition improved the soil water holding capability and soil porosity. Compared with the initial value, the WC and CP were lower among all treatments, and the NP was larger than the other parameters. Experimental incubation improved the soil properties through restricting salt accumulation in soil surface layer along the capillary. Lower biochar level (0, 7.5 and 15 t ha−1) could not increase SWC, CHC and STP, but all values were larger than CK, and T12, T13, T14, T15 with 30 t ha−1 biochar addition showed the most appealing effects. T12 (30 t ha−1 BC) had the highest WC, SWC, CHC, STP and CP of 26.47%, 38.31%, 35.03%, 54.32% and 42.4%. The NP of all treatments was 1.75 to 3.85 times larger than the initial value, T10 (biochar 15 t ha−1 + fulvic acid 1.5 t ha−1), with the highest NP of 17.85%. The WC of T6 (biochar 7.5 t ha−1 + fulvic acid 1.5 t ha−1) reached a saturation situation and accounted for 92.18% per cent of SWC, and the WC of T12 (biochar 30 t ha−1) resulted in a minimum rate of 69.08% (Table 2).
3.1.3. EC, pH
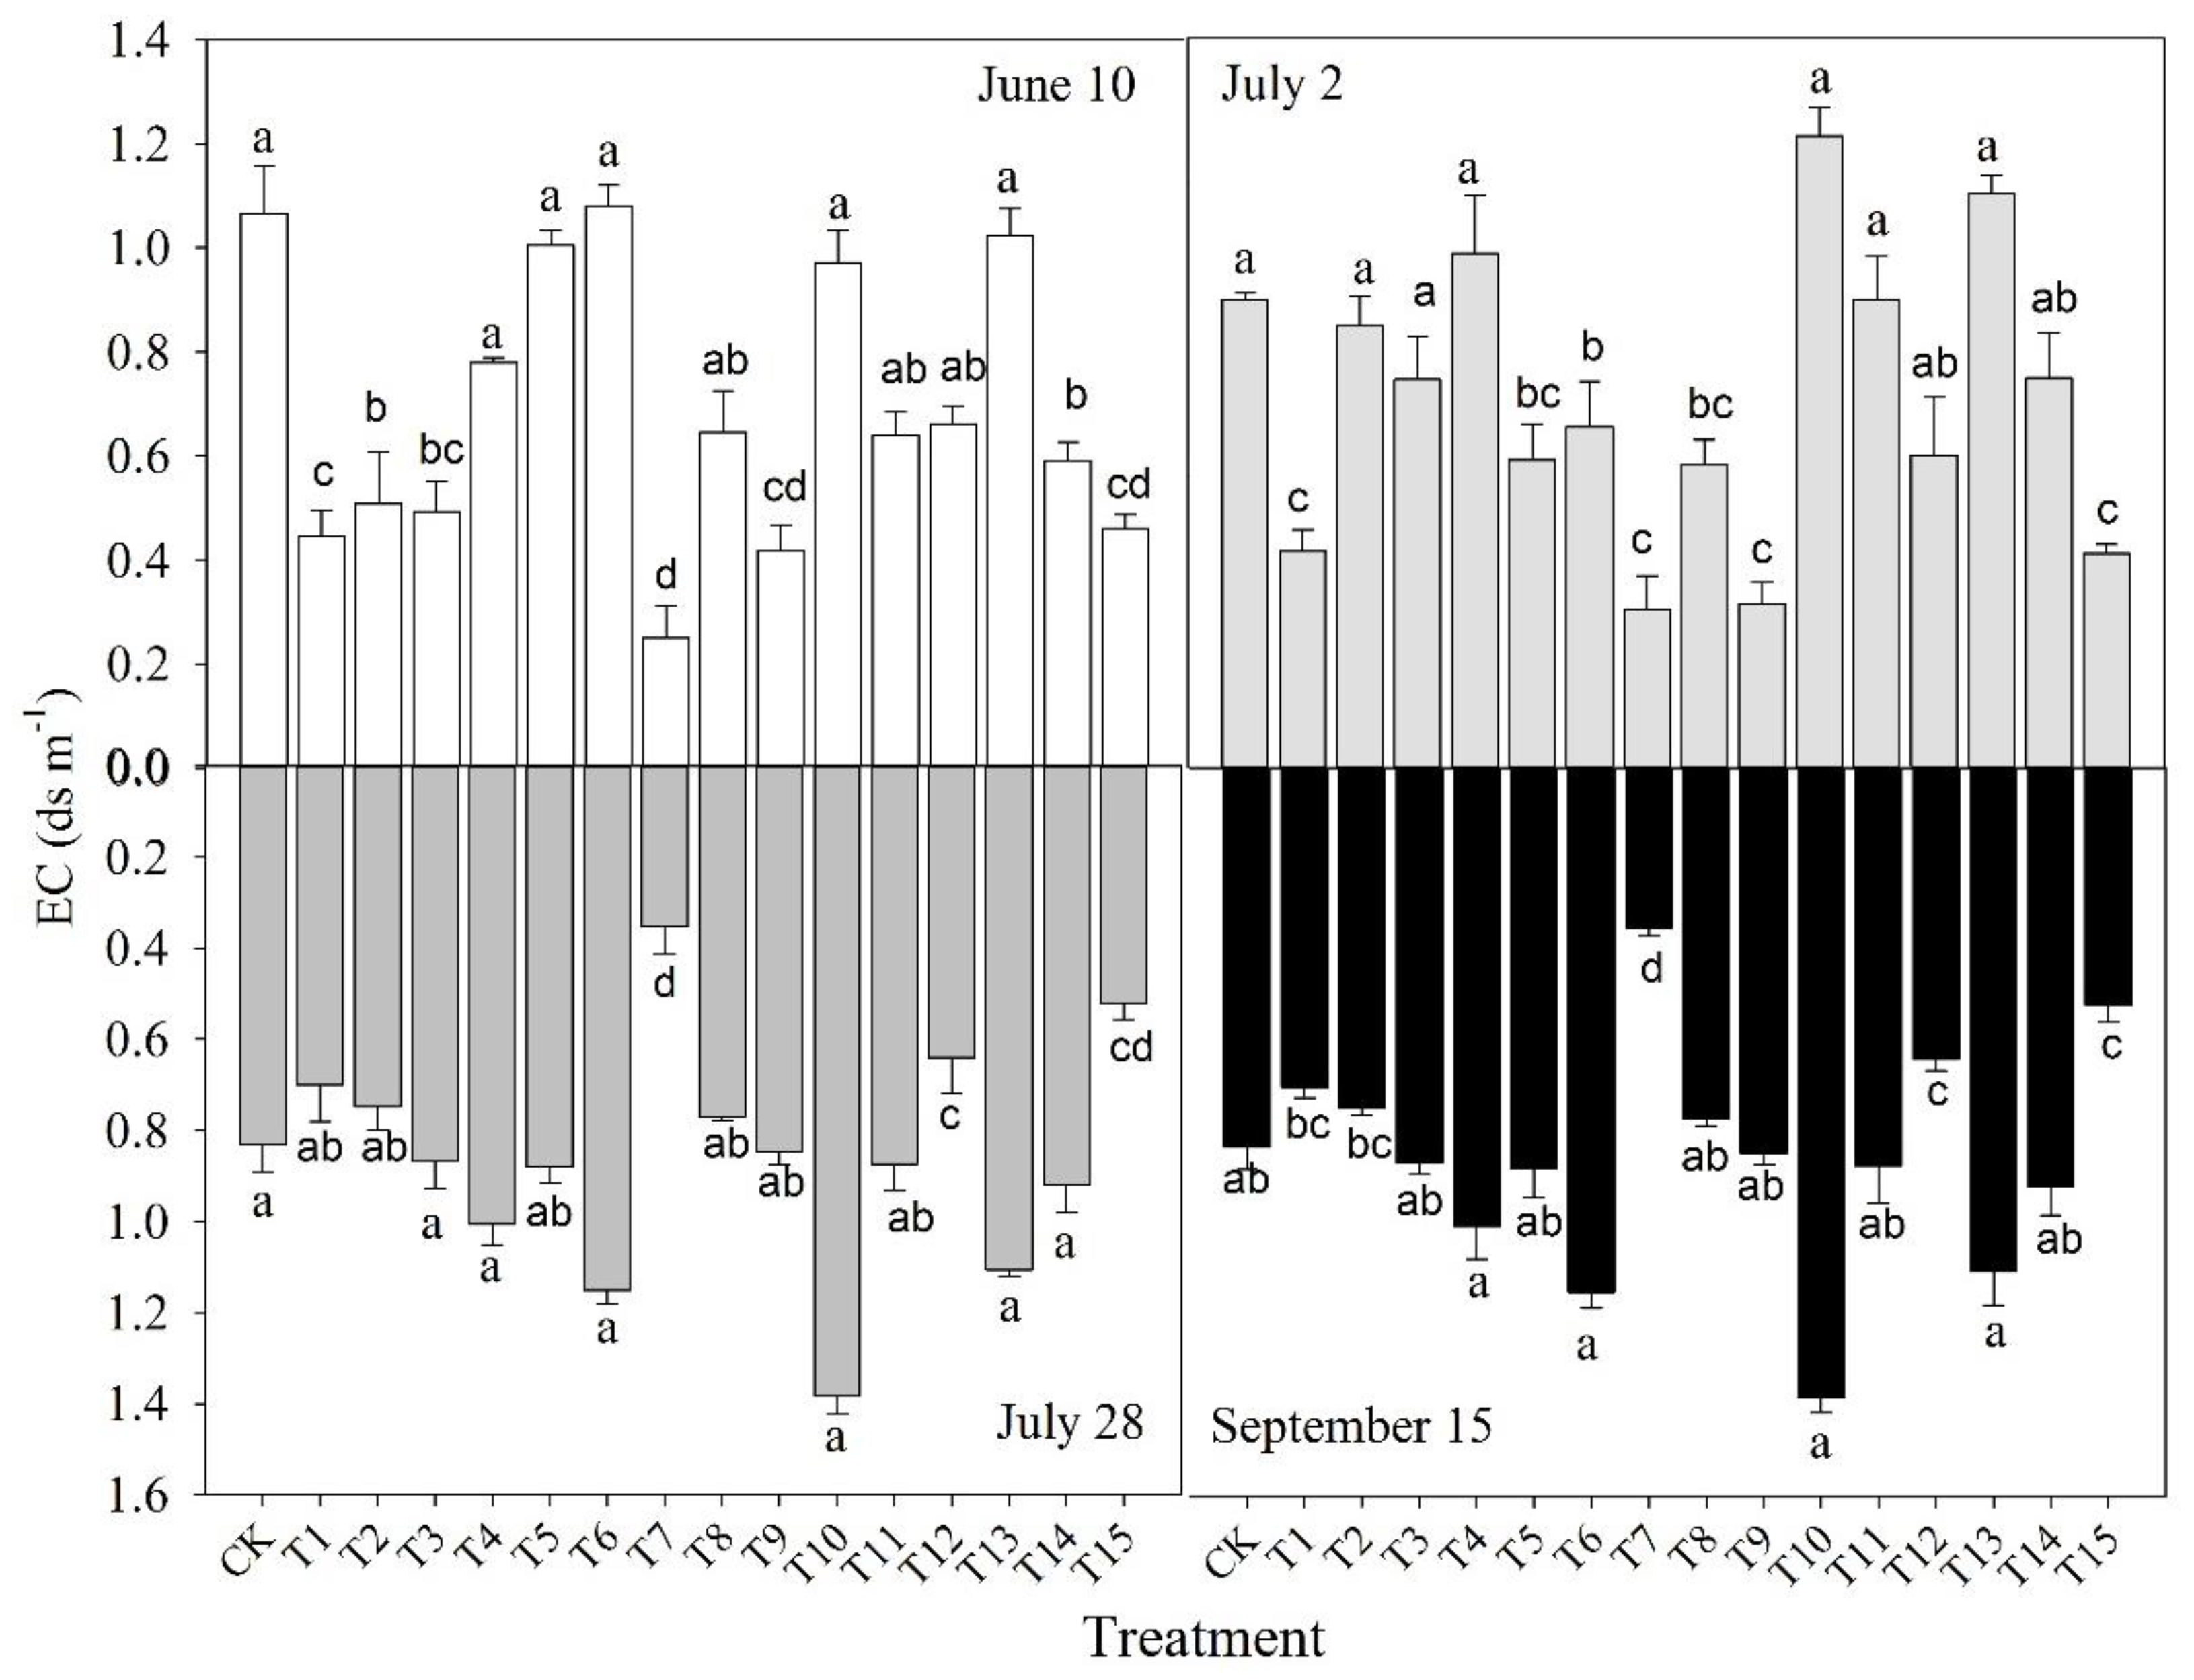
The EC in different maize growth periods expressed the variation trends of the soil salt content. Soil alkalinity was determined by the soil pH. Although the initial soil salt content was uneven, there were three fluctuations in soil salinity as the time went on. Firstly, the EC value decreased from 10 June to 2 July and then increased until 15 September in CK, T1, T4, T5, T8, T9, T11, T12, T13 and T15. Secondly, the EC of T2, T3 and T11 consistently grew from 10 June to 15 September. Thirdly, the EC reduced from 10 June to 2 July, then increased until 28 July and finally dropped by 15 September in T6, T7, T10 and T14. The third growth period was the best time for soil salt rejection (Figure 3). The EC of T6 (biochar 7.5 t ha−1 + fulvic acid 1.5 t ha−1) on 15 September was less than that on 10 June, and it was the most effective treatment for salt removal among all plots.
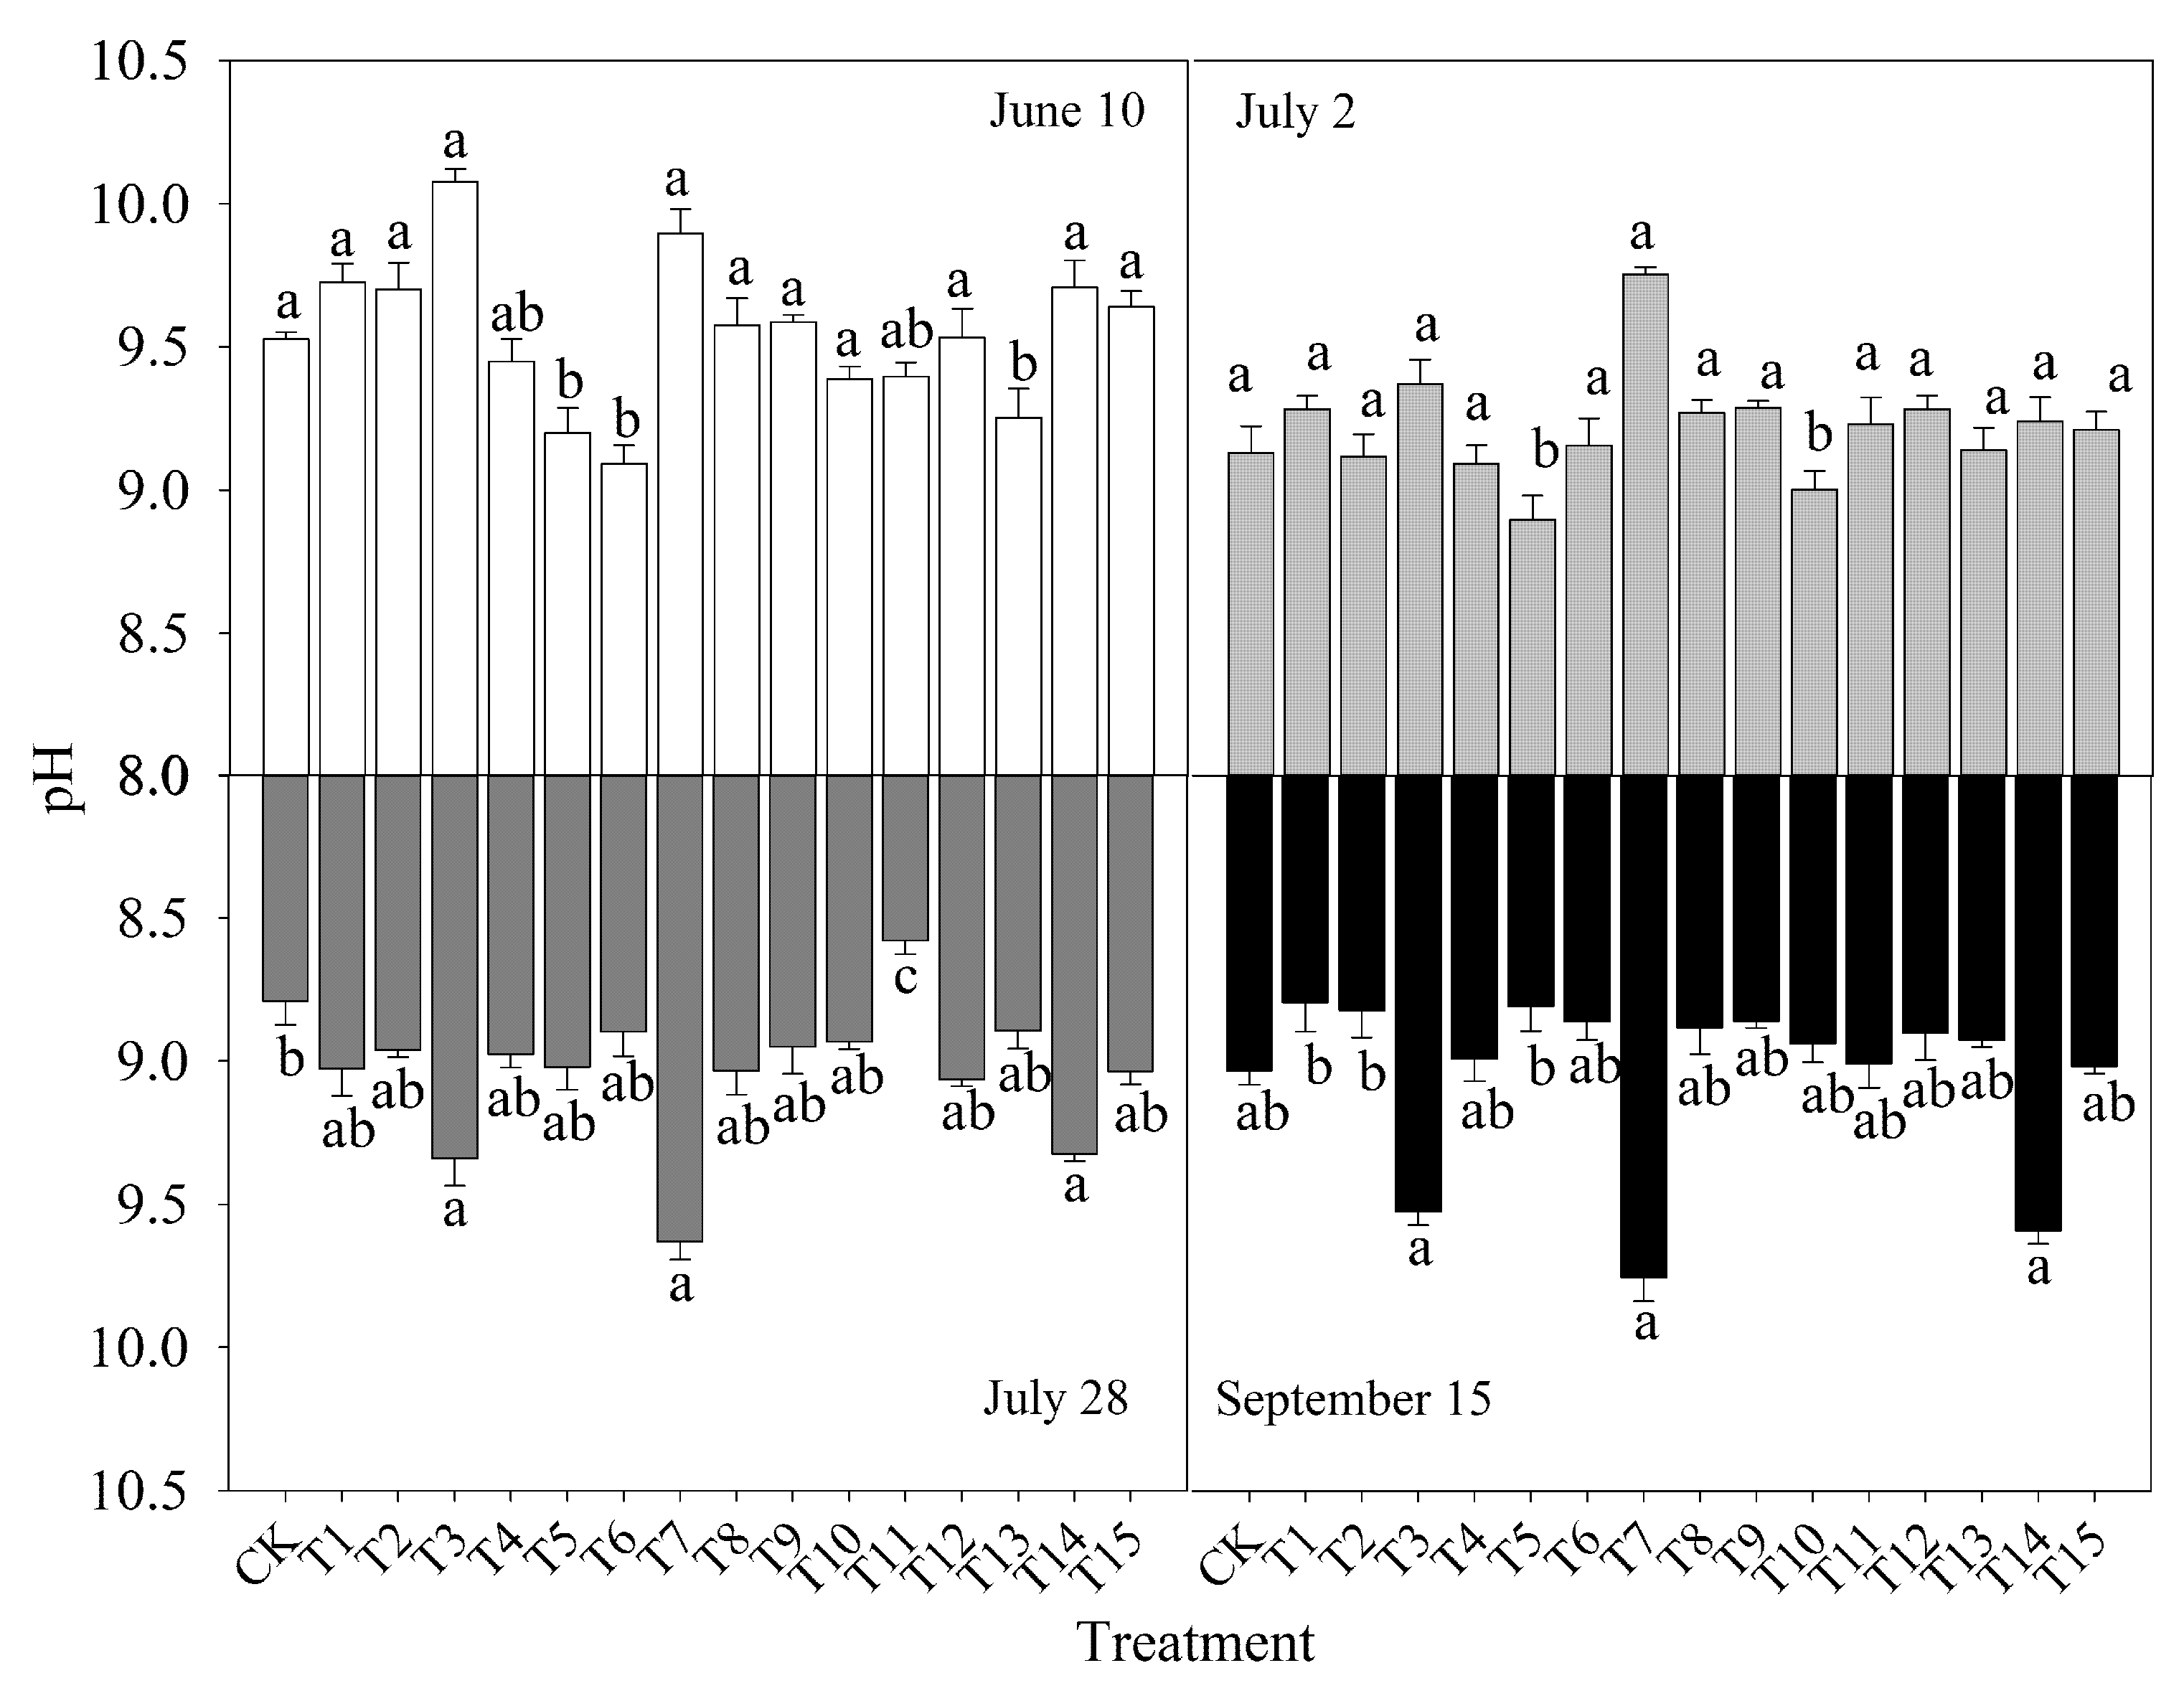
Contrary to the various variations of the EC, the pH decreased gradually, and the values of all treatments were larger than 8.5. Moreover, in all treatments, T7 (7.5 t ha−1 BC + 1.5 t ha−1 FA + BS) had a minimal difference during the growth period (Figure 4). Biochar addition slightly increased the pH; therefore, soil salinization and alkalinity were the primary agricultural nature barriers in the study area, as per usual.
3.2. SOC
Biochar addition had little effect on increasing SOC in T6 (BC 7.5 t ha−1 + FA), T7 (BC 7.5 t ha−1 + FA + BS) and CK (Table 3) treatments. Biochar addition rates significantly influenced the SOC content; the order of the mean of SOC-2nd classified with different BC dosage was 30 t ha−1 (T11,T12,T13, T14) 5.79 g kg−1 > 15 t ha−1 (T7, T8, T9, T10) 5.09 g kg−1 > 0 t ha−1 (CK, T1,T2,T3) 4.38 g kg−1 > 7.5 t ha−1 (T4, T5, T6, T7) 4.33 g kg−1. The order of the mean of SOC2nd minus SOC1st classified with different biochar dosage was the same as the mean of SOC2nd, with values 2.21 g kg−1 > 1.69 g kg−1 > 0.52 g kg−1 > 0.24 g kg−1. There were no significant differences (p > 0.05) found between different BC usage plots in the SOC2nd. Significant differences (p > 0.05) were found between T1 and T7, T3 and T12, T7 and T12. BC combined with FA or BS had an extremely significant effect on SOC improvement in treatments with 7.5 t ha−1 BC, but the increase extent was lower than that in the BC treatments.
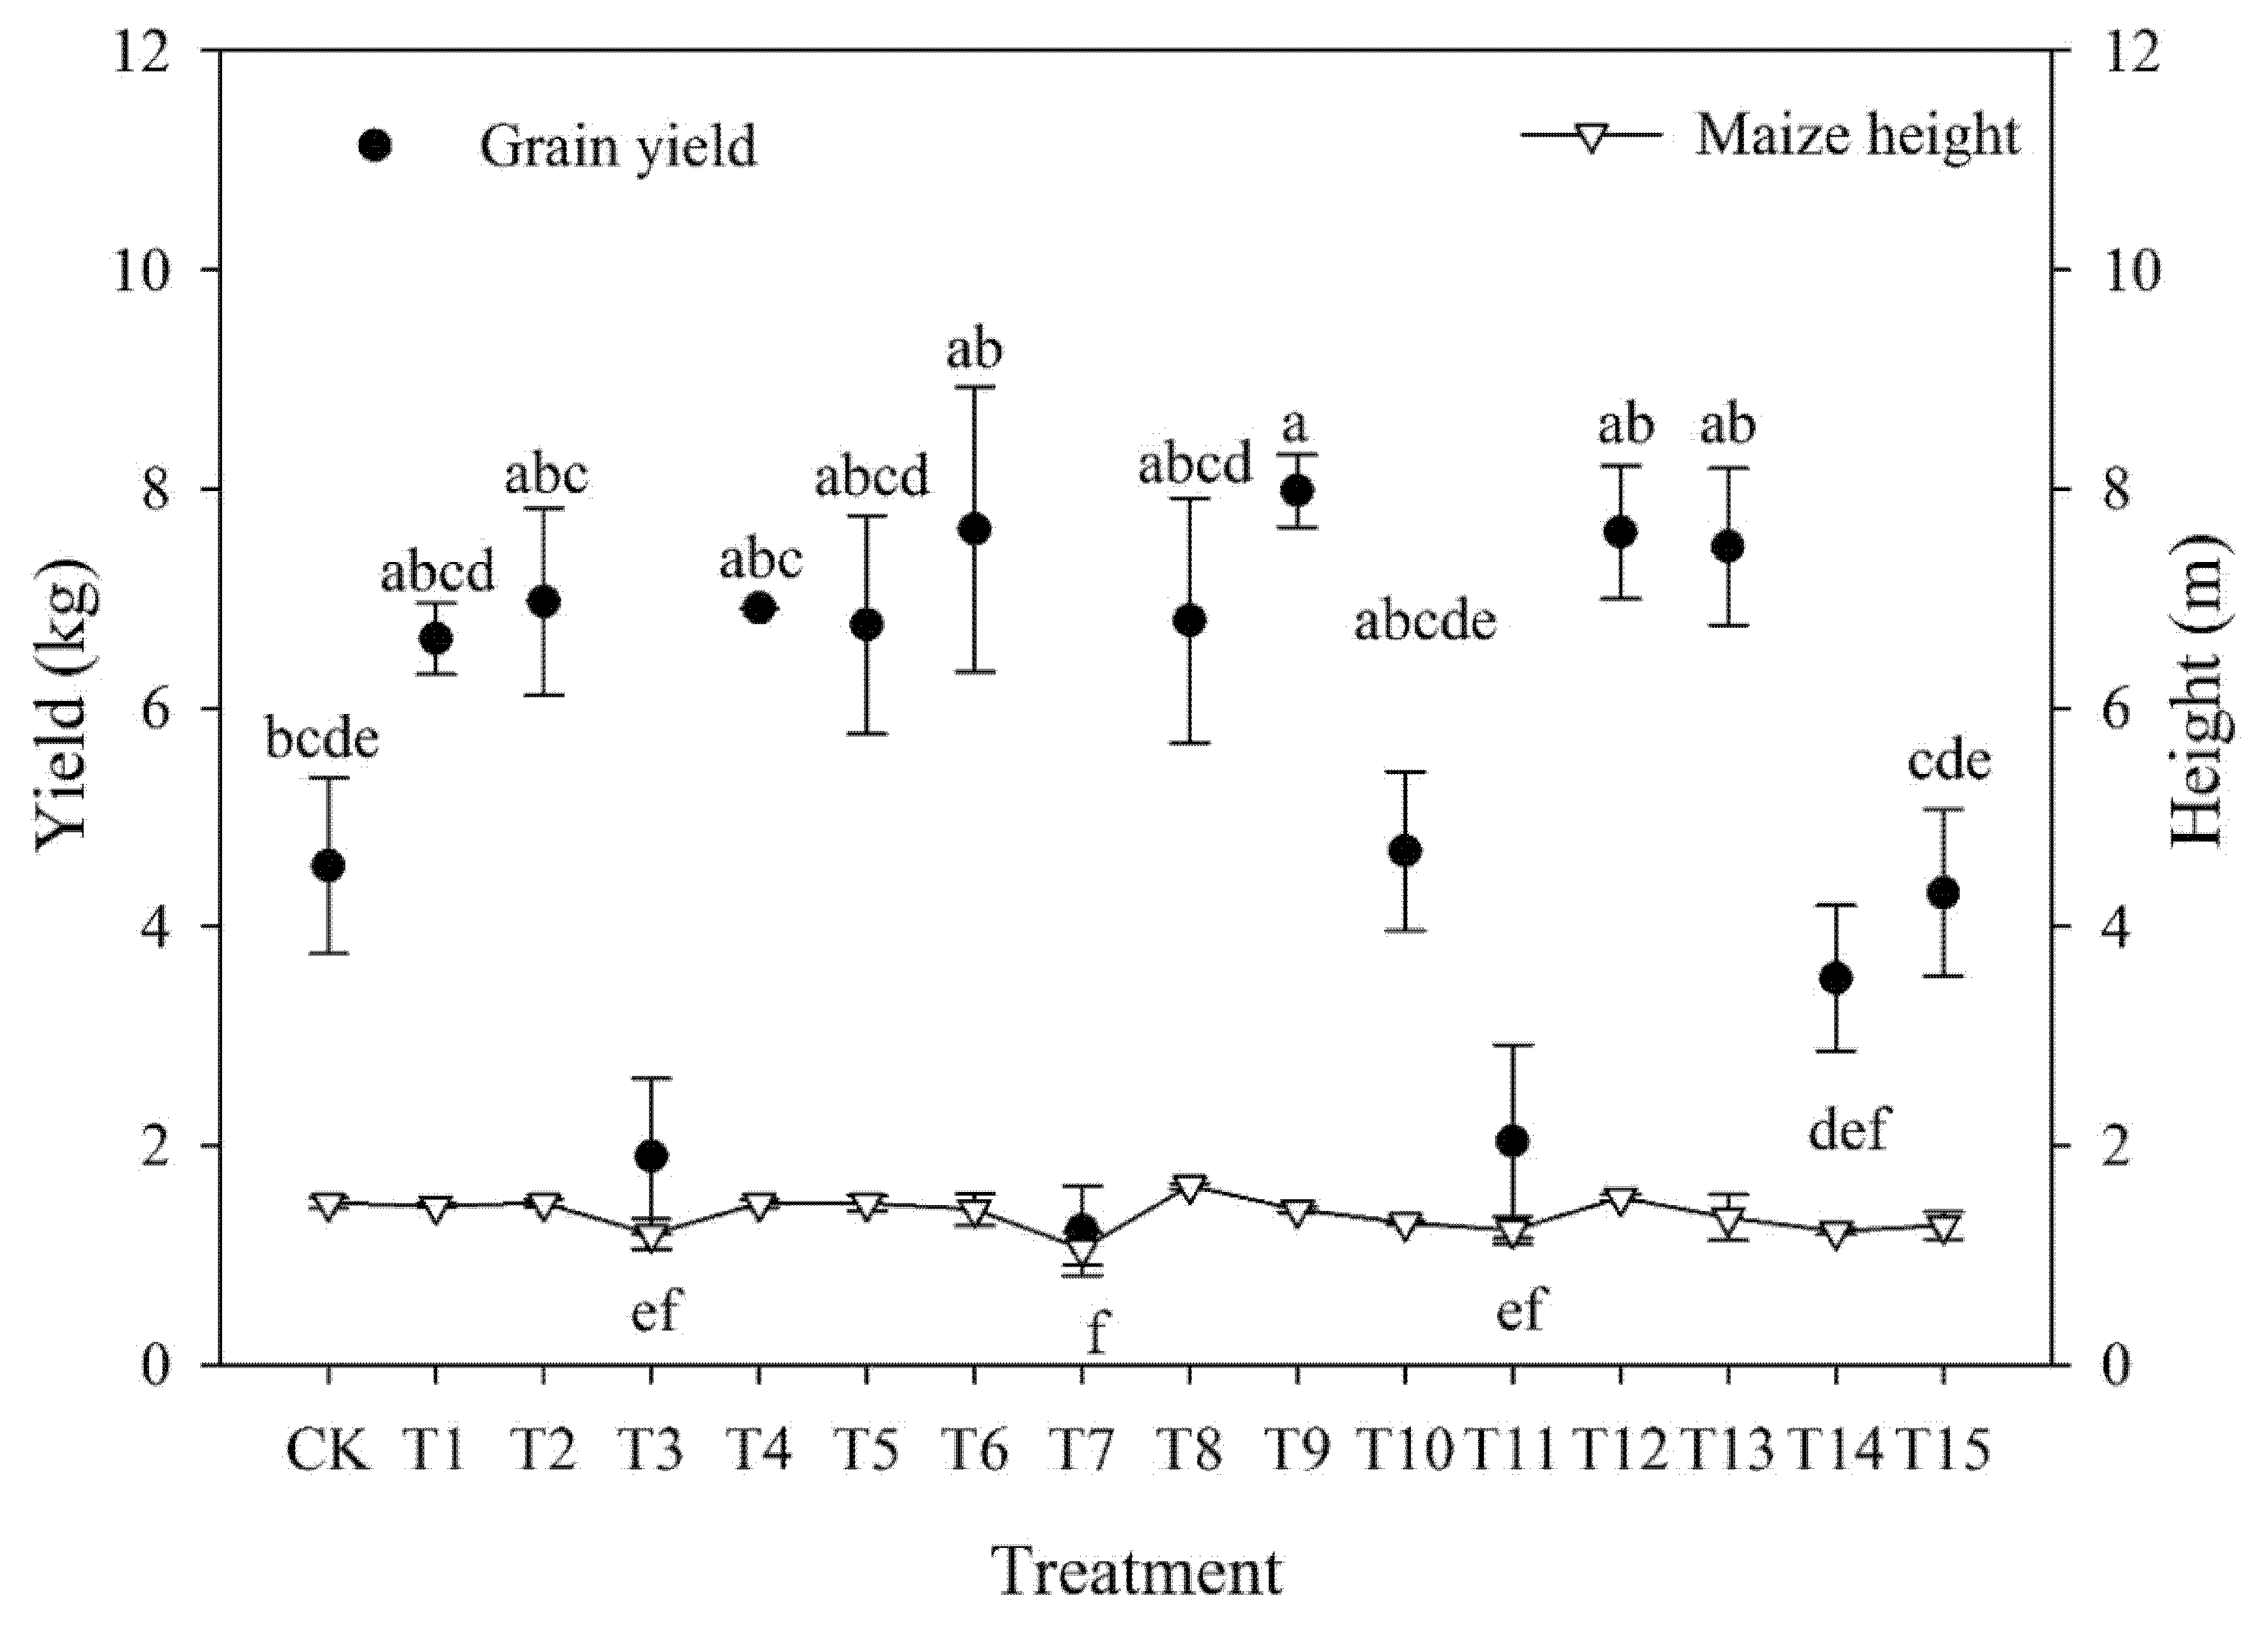
3.3. Plant Height and Grain Yield
The maize grain yields in BC, BC + BS, FA or BS treated plots were higher than with other treatments. T9 (BC 15 t ha−1 + BS) produced the highest grain yield, 7.98 kg, and a significant difference between T9 and CK was observed (p < 0.05). T3, T7, T11, T14 had no significant differences in grain yield, and they had the lowest production with different BC dosages compared with other treatments (Figure 5). The more BC that was added, the higher the standard variation of the grain yield was observed. The maize height of T3, T7, T11 and T14 showed the same properties of the grain yield, and they were the minimum values among the four treatments with the same BC content. The BC + FA + BS combination treatment had slight effects on improving the maize grain yield and maize height. The maize grain yield reduced with the amount of BC added in BC + FA treatments. The grain yield was uneven in FA with BC dosage 0, 7.5 and 15 t ha−1 treated plots. The appropriate BC application rate and the right combination resulted in a considerable crop production, in treatments T6 and T9, which were 67.69 and 75.39% higher than the treatment with CK.
4. Discussion
The soil parameters measured in this paper included the bulk density (BD), soil saturated water content (SWC), capillary water holding capacity (CHC), soil total porosity (STP), capillary porosity (CP) and noncapillary porosity (NP), electrical conductivity (EC), pH and soil organic carbon (SOC). Biochar addition resulting in reduced BD has been reported in many studies. For example, the application of 5, 10, 20 t ha−1 BC in this study brought about an average reduction of 2.86% compared with the control in paddy soil [16], with 5 t ha−1 BC reducing the BD from 1.41 to 1.36 g cm−3 in rainfed Alfisol [17], with woodchip biochar inducing greater decreases in BD in the coarse-textured Planosol [18], with the 22.5 Mg/ha BC decreasing the bulk density of the alkaline cambosols by 10.3% compared with the control [19], and the same decreasing effect was reported in a salt-stressed cropland [20]. Although biochar possessed a larger porosity [21] and a lower density [22] than soil [23], it was difficult to decrease the soil bulk density when the rain induced soil hardening in this study. We found that the treatments containing 30 t ha−1 biochar decreased the BD by more than its initial value and CK as well. On the contrary, treatments containing 0, 7.5 and 15 t ha−1 biochar addition had little effect on reducing the bulk density (Figure 2). The water content, SWC, CHC, STP and CP in all treatments were larger than those of CK [24,25,26,27], which increased with the biochar addition dosage and showed no correlation with the fulvic acid addition and BS treatment (Table 2). The pH decreased during the four-time soil sampling (Figure 4), and the result was contrary to many pot and field experiments [28,29,30]. Lynne et al. [31] demonstrated that soil pH and EC were all increased in the pot experiment with alkaline Calcisol under the application of biochar. In the present study, increases in EC accompanied by pH reduction were found in all treatments. Soil EC and pH under field trials were mainly affected by groundwater, wind, sunshine, rainfall and saltwater intrusion in the study area. Soil alkalinity was mainly influenced by the sodium carbonate content; therefore, the decreases in pH may have been caused by the reduction in alkaline salt. Hence, the tillage method or natural factors decreased the reduction effect of BC on soil bulk density. Firstly, the initial value was measured before biochar addition, with no soil plowed. The soil was disturbed through plowing and rain washing before the second soil sampling time. Secondly, the integrated effect of the natural and human action disturbed the soil balance in the field. However, the more biochar-amended soil had higher water holding ability and total porosity, and lower bulk density, than the unamended control soil [32]. The SOC content can greatly affect soil quality by maintaining and determining the important soil physical conditions, properties and soil functions [33]. In this study, biochar amendment improved soil physical properties. The more biochar addition, the higher the SOC content in soil. The SOC content of treatments including biochar and fulvic acid (FA) was lower than biochar-only treatments, which contained the same dosage. Treatments with biochar 15 t ha−1 and fulvic acid even resulted in lower SOC than the initial value. The stimulation of FA activated the microbial activities [34] and accelerated the decomposition of biochar. The effect and the change of microbial activity under the BC and FA treatment were reported by Rutigliano [35]. The study shows that after approximately four months in one maize growing season, microbial activity increased immediately in a short time. Biochar and humic acid amendments could improve the microbial biomass C of the growth media, and it accelerated soil carbon consumption [36].
The crop growth response to treatments mainly depends on the properties of the biochar [37], Bacillus subtilis [8] and fulvic acid [38], climatic conditions [39], soil conditions [40], underground water, irrigation and drainage system [41], cultivation method [42], crop type and crop variety [43]. In this study, the maize height and grain weight were merely affected by the amount of biochar with or without FA and BS combination. The FA + BS and BC + FA + BS treatments obtained a lower grain yield than other treatments within the same biochar addition. Seeds were sown a week after biochar was plowed into the soil, and this indicated that FA and BC + FA treatments inhibited the growth of maize seedling after BS pretreatment. Bakry [44] reported that humic acid + mycorrhiza + biochar treatment had a significantly superior effect on many agronomic characteristics than other combinations. Sun [45] found that all biochars were able to support Bacillus mucilaginosus to peat at densities analogous to the population. The adsorption of FA onto BS was strongly pH dependent, and it would separate with the soil pH improvement. The lower absorption of FA when compared with humic acid may be affected by its lower hydrophobicity [46]; therefore, this indicated the antagonism effect between FA and BS, which inhibited crop nutrition adsorption, and biochar addition ameliorated the unhealthy soil situation and increased the grain yield (Figure 5).
5. Conclusions
The field experiment showed that the three biomaterial—biochar, fulvic acid and Bucillus subtilis—application affected the soil properties and the characteristics of maize. The bulk density increased in the control group and lower biochar addition plots, and total porosity decreased by more than the initial value in control plots. This phenomenon indicated the soil degradation tendency during the plant cultivation period in the study area. Soil organic carbon increased with more biochar addition. Soil salinity and alkalinity were mainly affected by the natural environment, and the pH decreased with the EC increasing. Biochar and other measures improved the quality of the soil and provided benefits for maize growth. The antagonism effects in FA and BS combination treatments resulted in a lower grain yield and plant height, but BC addition improved the soil physical properties and soil aeration, thus increasing soil production. To extend our work in investigating the biological factors related to plant growth, the underlying mechanisms of aged biochar and other biomaterials affecting the soil microbial composition in plant rhizosphere need to be researched.
Author Contributions
Conceptualization, Y.S. and X.C.; methodology, Y.S. and J.Y.; software, Y.S.; validation, X.Z., Y.S. and R.Y.; formal analysis, Y.S.; investigation, Y.S.; resources, X.Z.; data curation, X.C.; writing—original draft preparation, Y.S.; writing—review and editing, Y.S.; visualization, X.C. and Y.L.; supervision, X.Z., W.X., X.W. and Y.L.; project administration, J.Y.; funding acquisition, X.Z. All authors have read and agreed to the published version of the manuscript.
Funding
This research was funded by the National Key Research & Development Program of China, grant number 2019YFD1002702; the Natural Science Foundation of China, grant number U1806215; and the National Natural Science Foundation of China (General Program), grant number 41977015.
Acknowledgments
The authors would like to acknowledge the Dongtai Coastal Saline Soil Institute for providing the working area and equipment for this study.
Conflicts of Interest
The authors declare no conflict of interest.
References
- Maomao, H.; Xiaohou, S.; Yaming, Z. Effects of Different Regulatory Methods on Improvement of Greenhouse Saline Soils, Tomato Quality, and Yield. Sci. World J. 2014, 2014, 953675. [Google Scholar] [CrossRef] [PubMed] [Green Version]
- Effect of Soil Salinity and Sodicity with and Without Soil Conditioner (polyacrylamide) on the Seedling Emergence and Growth of Different Wheat Varieties. Pak. J. Appl. Sci. 2002, 2, 631–636. [CrossRef]
- Kant, C.; Aydin, A.; Turan, M. Ameliorative Effect of Hydro Gel Substrate on Growth, Inorganic Ions, Proline, and Nitrate Contents of Bean under Salinity Stress. J. Plant Nutr. 2008, 31, 1420–1439. [Google Scholar] [CrossRef]
- Lehmann, J.; Joseph, S. Biochar for Environmental Management: An Introduction. In Biochar for Environmental Management: Science and Technology; Earthscan: London, UK, 2009; pp. 1–9. ISBN 9781844076581. [Google Scholar]
- Slavich, P.G.; Sinclair, K.; Morris, S.G.; Kimber, S.W.L.; Downie, A.; Van Zwieten, L. Contrasting effects of manure and green waste biochars on the properties of an acidic ferralsol and productivity of a subtropical pasture. Plant Soil 2013, 366, 213–227. [Google Scholar] [CrossRef]
- Yuan, J.-H.; Xu, R.-K.; Zhang, H. The forms of alkalis in the biochar produced from crop residues at different temperatures. Bioresour. Technol. 2011, 102, 3488–3497. [Google Scholar] [CrossRef] [PubMed]
- Pishchik, V.N.; Vorobyev, N.I.; Moiseev, K.G.; Sviridova, O.V.; Surin, V.G. Influence of Bacillus subtilis on the physiological state of wheat and the microbial community of the soil under different rates of nitrogen fertilizers. Eurasian Soil Sci. 2015, 48, 77–84. [Google Scholar] [CrossRef]
- Lee, S.-W.; Lee, S.-H.; Balaraju, K.; Park, K.-S.; Nam, K.-W.; Park, J.-W.; Park, K. Growth promotion and induced disease suppression of four vegetable crops by a selected plant growth-promoting rhizobacteria (PGPR) strain Bacillus subtilis 21-1 under two different soil conditions. Acta Physiol. Plant. 2014, 36, 1353–1362. [Google Scholar] [CrossRef]
- Kumar, S.; Bauddh, K.; Barman, S.; Singh, R.P. Amendments of microbial biofertilizers and organic substances reduces requirement of urea and DAP with enhanced nutrient availability and productivity of wheat (Triticum aestivum L.). Ecol. Eng. 2014, 71, 432–437. [Google Scholar] [CrossRef]
- Graham, J.B.; Istock, C.A. Gene Exchange and Natural Selection Cause Bacillus subtilis to Evolve in Soil Culture. Science 1979, 204, 637–639. [Google Scholar] [CrossRef] [PubMed]
- Higashio, S.; Morishita, H. Salt-resistant Bacillusin Salty Natto. Jpn. J. Food Microbiol. 1997, 14, 43–47. [Google Scholar] [CrossRef]
- Clare, A.; Shackley, S.; Joseph, S.; Hammond, J.; Pan, G.; Bloom, A.A. Competing uses for China’s straw: The economic and carbon abatement potential of biochar. GCB Bioenergy 2015, 7, 1272–1282. [Google Scholar] [CrossRef]
- Ding, N.; Xiao, Z.; Xiao, H.; Xia, T.; Zheng, Y.; Qiu, F. Revelation of the early responses of salt tolerance in maize via SSH libraries. Genes Genom. 2012, 34, 265–273. [Google Scholar] [CrossRef]
- Yildrim, E.; Donmez, M.F.; Turan, M. Use of Bioinoculants in Ameliorative Effects on Radish Plants Under Salinity Stress. J. Plant Nutr. 2008, 31, 2059–2074. [Google Scholar] [CrossRef]
- Bao, S.D. Analytical Methods of Soil and Agricultural Chemistry; Chinese Agricultural Science and Technology Press: Beijing, China, 2008; pp. 30–32. ISBN 9787109066441. (In Chinese) [Google Scholar]
- Qin, X.; Li, Y.; Wang, H.; Liu, C.; Li, J.; Wan, Y.; Gao, Q.; Fan, F.; Liao, Y. Long-term effect of biochar application on yield-scaled greenhouse gas emissions in a rice paddy cropping system: A four-year case study in south China. Sci. Total Environ. 2016, 569–570, 1390–1401. [Google Scholar] [CrossRef] [PubMed]
- Pandian, K.; Subramaniayan, P.; Gnasekaran, P.; Chitraputhirapillai, S. Effect of biochar amendment on soil physical, chemical and biological properties and groundnut yield in rainfed Alfisol of semi-arid tropics. Arch. Agron. Soil Sci. 2016, 62, 1293–1310. [Google Scholar] [CrossRef]
- Burrell, L.D.; Zehetner, F.; Rampazzo, N.; Wimmer, B.; Soja, G. Long-term effects of biochar on soil physical properties. Geoderma 2016, 282, 96–102. [Google Scholar] [CrossRef]
- Zhao, X.; Wang, J.W.; Xu, H.J.; Zhou, C.J.; Wang, S.Q.; Xing, G.X. Effects of crop-straw biochar on crop growth and soil fertility over a wheat-millet rotation in soils of China. Soil Use Manag. 2014, 30, 311–319. [Google Scholar] [CrossRef]
- Lashari, M.S.; Liu, Y.; Li, L.; Pan, W.; Fu, J.; Pan, G.; Zheng, J.; Zheng, J.; Zhang, X.; Yu, X. Effects of amendment of biochar-manure compost in conjunction with pyroligneous solution on soil quality and wheat yield of a salt-stressed cropland from Central China Great Plain. Field Crops Res. 2013, 144, 113–118. [Google Scholar] [CrossRef]
- Quin, P.; Cowie, A.; Flavel, R.; Keen, B.; Macdonald, L.; Morris, S.; Singh, B.; Young, I.; Van Zwieten, L. Oil mallee biochar improves soil structural properties—A study with x-ray micro-CT. Agric. Ecosyst. Environ. 2014, 191, 142–149. [Google Scholar] [CrossRef]
- Peake, L.R.; Reid, B.J.; Tang, X. Quantifying the influence of biochar on the physical and hydrological properties of dissimilar soils. Geoderma 2014, 235, 182–190. [Google Scholar] [CrossRef]
- Zhai, L.; Caiji, Z.; Liu, J.; Wang, H.; Ren, T.; Gai, X.; Xi, B.; Liu, H. Short-term effects of maize residue biochar on phosphorus availability in two soils with different phosphorus sorption capacities. Biol. Fertil. Soils 2015, 51, 113–122. [Google Scholar] [CrossRef]
- Sekar, S.; Hottle, R.D.; Lal, R. Effects of Biochar and Anaerobic Digester Effluent on Soil Quality and Crop Growth in Karnataka, India. Agric. Res. 2014, 3, 137–147. [Google Scholar] [CrossRef] [Green Version]
- Jinghua, W.; Erda, L. The impacts of potential climate change and climate variability on simulated maize production in China. Water Air Soil Pollut. 1996, 92, 75–85. [Google Scholar] [CrossRef]
- Bruun, E.W.; Petersen, C.T.; Hansen, E.H.; Holm, J.K.; Hauggaard-Nielsen, H. Biochar amendment to coarse sandy subsoil improves root growth and increases water retention. Soil Use Manag. 2014, 30, 109–118. [Google Scholar] [CrossRef]
- Yoo, G.Y.; Kim, H.; Chen, J.J.; Kim, Y. Effects of Biochar Addition on Nitrogen Leaching and Soil Structure following Fertilizer Application to Rice Paddy Soil. Soil Sci. Soc. Am. J. 2013, 78, 852–860. [Google Scholar] [CrossRef]
- Upadhyay, K.P.; George, D.; Swift, R.S.; Galea, V. The Influence of Biochar on Growth of Lettuce and Potato. J. Integr. Agric. 2014, 13, 541–546. [Google Scholar] [CrossRef]
- Liang, F.; Li, G.-T.; Lin, Q.-M.; Zhao, X.-R. Crop Yield and Soil Properties in the First 3 Years After Biochar Application to a Calcareous Soil. J. Integr. Agric. 2014, 13, 525–532. [Google Scholar] [CrossRef]
- Song, Y.; Zhang, X.; Ma, B.; Chang, S.X.; Gong, J. Biochar addition affected the dynamics of ammonia oxidizers and nitrification in microcosms of a coastal alkaline soil. Biol. Fertil. Soils 2014, 50, 321–332. [Google Scholar] [CrossRef]
- Macdonald, L.M.; Farrell, M.; Van Zwieten, L.; Krull, E.S. Plant growth responses to biochar addition: An Australian soils perspective. Biol. Fertil. Soils 2014, 50, 1035–1045. [Google Scholar] [CrossRef]
- Hardie, M.; Clothier, B.; Bound, S.; Oliver, G.; Close, D. Does biochar influence soil physical properties and soil water availability? Plant Soil 2014, 376, 347–361. [Google Scholar] [CrossRef]
- Merante, P.; Dibari, C.; Ferrise, R.; Sánchez, B.; Iglesias, A.; Lesschen, J.P.; Kuikman, P.; Yeluripati, J.; Smith, P.; Bindi, M. Adopting soil organic carbon management practices in soils of varying quality: Implications and perspectives in Europe. Soil Tillage Res. 2017, 165, 95–106. [Google Scholar] [CrossRef] [Green Version]
- Priya, B.N.V.; Mahavishnan, K.; Gurumurthy, D.S.; Bindumadhava, H.; Ambika, P.U.; Navin, K.S. Fulvic Acid (FA) for Enhanced Nutrient Uptake and Growth: Insights from Biochemical and Genomic Studies. J. Crop Improv. 2014, 28, 740–757. [Google Scholar] [CrossRef]
- Rutigliano, F.; Romano, M.; Marzaioli, R.; Baglivo, I.; Baronti, S.; Miglietta, F.; Castaldi, S. Effect of biochar addition on soil microbial community in a wheat crop. Eur. J. Soil Biol. 2014, 60, 9–15. [Google Scholar] [CrossRef]
- Zhang, L.; Sun, X.-Y.; Tian, Y.; Gong, X.-Q. Biochar and humic acid amendments improve the quality of composted green waste as a growth medium for the ornamental plant Calathea insignis. Sci. Hortic. 2014, 176, 70–78. [Google Scholar] [CrossRef]
- Zhang, A.; Liu, Y.; Pan, G.; Hussain, Q.; Li, L.; Zheng, J.; Zhang, X. Effect of biochar amendment on maize yield and greenhouse gas emissions from a soil organic carbon poor calcareous loamy soil from Central China Plain. Plant Soil 2012, 351, 263–275. [Google Scholar] [CrossRef]
- Meena, H.M.; Sharma, R.P. Long-Term Effect of Fertilizers and Amendments on Different Fractions of Organic Matter in an Acid Alfisol. Commun. Soil Sci. Plant Anal. 2016, 47, 1430–1440. [Google Scholar] [CrossRef]
- Gummadi, S.; Kadiyala, M.; Rao, K.; Athanasiadis, I.; Mulwa, R.; Kilavi, M.; Legesse, G.; Amede, T. Simulating adaptation strategies to offset potential impacts of climate variability and change on maize yields in Embu County, Kenya. PLoS ONE 2020, 15, e0241147. [Google Scholar] [CrossRef]
- Sun, B.; Zheng, X.-Q.; Hu, F.; Li, H.-X.; Kong, B.; Wang, L.-L.; Sui, Y.-Y. Effect of temperature, rainfall and soil properties on farmland soil nitrification. Huanjing Kexue 2009, 30, 206–213. (In Chinese) [Google Scholar]
- Jiang, J.; Feng, S.; Ma, J.; Huo, Z.; Zhang, C. Irrigation management for spring maize grown on saline soil based on SWAP model. Field Crops Res. 2016, 196, 85–97. [Google Scholar] [CrossRef]
- Welde, K.; Gebremariam, H.L. Effect of different furrow and plant spacing on yield and water use efficiency of maize. Agric. Water Manag. 2016, 177, 215–220. [Google Scholar] [CrossRef]
- Swanckaert, J.; Pannecoucque, J.; VAN Waes, J.; DE Cauwer, B.; Latre, J.; Haesaert, G.; Reheul, D. Harvest date does not influence variety ranking in Belgian forage maize variety trials. J. Agric. Sci. 2015, 154, 1040–1050. [Google Scholar] [CrossRef]
- Bakry, B.A.; Ibrahim, O.M.; Eid, A.R.; Badr, E.A. Effect of Humic Acid, Mycorrhiza Inoculation, and Biochar on Yield and Water Use Efficiency of Flax under Newly Reclaimed Sandy Soil. Agric. Sci. 2014, 5, 1427–1432. [Google Scholar] [CrossRef] [Green Version]
- Sun, D.; Meng, J.; Liang, H.; Yang, E.; Huang, Y.; Chen, W.; Jiang, L.; Lan, Y.; Zhang, W.; Gao, J. Effect of volatile organic compounds absorbed to fresh biochar on survival of Bacillus mucilaginosus and structure of soil microbial communities. J. Soils Sediments 2015, 15, 271–281. [Google Scholar] [CrossRef]
- Moura, M.N.; Martín, M.J.; Burguillo, F.J. A comparative study of the adsorption of humic acid, fulvic acid and phenol onto Bacillus subtilis and activated sludge. J. Hazard. Mater. 2007, 149, 42–48. [Google Scholar] [CrossRef] [PubMed]
Figure 1.
The experimental design of biomaterials obtained from straws for saline soil amelioration.
Figure 1.
The experimental design of biomaterials obtained from straws for saline soil amelioration.

Figure 2.
Soil bulk density (BD) of different treatments after maize planting. The error bar is standard deviation, and the different letters indicate significant difference under different treatments during maize ripping at p < 5%.
Figure 2.
Soil bulk density (BD) of different treatments after maize planting. The error bar is standard deviation, and the different letters indicate significant difference under different treatments during maize ripping at p < 5%.

Figure 3.
The average value of electrical conductivity (EC) during different maize growth periods of every third treatment plot. The EC was measured in a soil–water (1:5 w/w) solution, using an EC meter (EC 215 conductivity meter, HANNA, Italy). Different letters indicate significant differences between treatments at the p < 0.05 level.

Figure 4.
The average value of pH during different maize growth periods of every third treatment plot. The pH was measured at a solid/water ratio of 1:5 by pH meter (pH 211 microprocessor pH meter, HANNA, Italy). Different letters indicate significant differences between treatments at the p < 0.05 level.

Figure 5.
Effects of BC, FA and BS treatment on yield and height of maize. BC = biochar, FA = fulvic acid, BS = Bacillus subtilis. Different letters indicate significant differences between treatments at the p < 0.05 level.
Figure 5.
Effects of BC, FA and BS treatment on yield and height of maize. BC = biochar, FA = fulvic acid, BS = Bacillus subtilis. Different letters indicate significant differences between treatments at the p < 0.05 level.


Table 1.
The experimental treatments and their coding.
| Medium | Treatments | ||
|---|---|---|---|
| Biochar (t ha−1) | Fulvic Acid (1.5 t ha−1) | BS Suspension Soak Seed | |
| CK | 0 | N | N |
| T1 | 0 | N | Y |
| T2 | 0 | Y | N |
| T3 | 0 | Y | Y |
| T4 | 7.5 | N | N |
| T5 | 7.5 | N | Y |
| T6 | 7.5 | Y | N |
| T7 | 7.5 | Y | Y |
| T8 | 15 | N | N |
| T9 | 15 | N | Y |
| T10 | 15 | Y | N |
| T11 | 15 | Y | Y |
| T12 | 30 | N | N |
| T13 | 30 | N | Y |
| T14 | 30 | Y | N |
| T15 | 30 | Y | Y |
Note: The ‘Y’ represents the design implemented in this treatment; ‘N’ represents the design not implemented in this treatment. BS: Bacillus subtilis.
Table 2.
The average value of soil water content (WC), soil saturated water content (SWC), capillary water holding capacity (CHC), soil total porosity (STP), capillary porosity (CP) and noncapillary porosity (NP) measured in different treatment plots compared with the initial values of soil properties.
| Treatment | WC (%) | SWC (%) | CHC (%) | STP (%) | CP (%) | NP (%) |
|---|---|---|---|---|---|---|
| CK | 15.69 | 18.41 | 17.65 | 42.36 | 26.96 | 15.40 |
| T1 | 21.62 | 25.49 | 24.06 | 45.41 | 34.81 | 10.60 |
| T2 | 18.99 | 24.23 | 22.66 | 43.25 | 34.07 | 9.18 |
| T3 | 20.57 | 24.90 | 23.25 | 45.26 | 33.72 | 11.54 |
| T4 | 16.69 | 22.04 | 20.88 | 46.52 | 29.59 | 16.93 |
| T5 | 24.01 | 30.46 | 28.52 | 49.20 | 38.39 | 10.81 |
| T6 | 20.11 | 21.82 | 20.95 | 42.91 | 31.70 | 11.21 |
| T7 | 23.50 | 26.68 | 24.58 | 45.38 | 35.57 | 9.81 |
| T8 | 25.19 | 29.45 | 28.04 | 46.98 | 39.39 | 7.59 |
| T9 | 23.60 | 26.58 | 24.80 | 46.94 | 34.87 | 12.07 |
| T10 | 25.85 | 30.40 | 23.05 | 49.00 | 31.15 | 17.85 |
| T11 | 23.20 | 26.28 | 25.24 | 44.74 | 36.96 | 7.78 |
| T12 | 26.47 | 38.31 | 35.03 | 54.32 | 42.40 | 11.92 |
| T13 | 22.16 | 30.11 | 26.79 | 50.39 | 35.22 | 15.17 |
| T14 | 22.69 | 26.07 | 24.57 | 45.53 | 35.47 | 10.06 |
| T15 | 25.32 | 33.36 | 28.96 | 51.85 | 36.95 | 14.90 |
| Initial Value | 28.12 | 33.29 | 32.36 | 48.31 | 44.30 | 4.00 |
Table 3.
Soil organic carbon (SOC) measured in the no-seedling period (SOC1st) and the ripping period (SOC2nd). Different letters in the same column indicate significant difference at p ≤ 5%.
Table 3.
Soil organic carbon (SOC) measured in the no-seedling period (SOC1st) and the ripping period (SOC2nd). Different letters in the same column indicate significant difference at p ≤ 5%.
| Treatment | SOC1st (g kg−1) | SOC2nd (g kg−1) | SOC2nd–SOC1st (g kg−1) | ||
|---|---|---|---|---|---|
| Mean | Standard Deviation | Mean | Standard Deviation | ||
| CK | 5.20 a | 0.43 | 4.67 abc | 0.07 | −0.53 |
| T1 | 3.63 cde | 0.74 | 4.33 ab | 0.67 | 0.70 |
| T2 | 3.42 cde | 1.22 | 4.72 abc | 0.28 | 1.30 |
| T3 | 3.43 cde | 1.38 | 4.09 bc | 0.64 | 0.66 |
| T4 | 4.09 abcd | 0.27 | 4.66 abc | 0.30 | 0.57 |
| T5 | 3.71 cde | 0.76 | 4.98 abc | 0.85 | 1.27 |
| T6 | 5.09 ab | 0.14 | 4.38 abc | 1.12 | −0.71 |
| T7 | 3.48 cde | 0.52 | 3.30 c | 0.89 | −0.18 |
| T8 | 4.13 abcd | 0.61 | 5.86 ab | 1.28 | 1.73 |
| T9 | 3.26 cde | 0.27 | 4.86 abc | 0.89 | 1.60 |
| T10 | 3.32 cde | 1.09 | 4.41 abc | 1.26 | 1.09 |
| T11 | 2.86 de | 0.76 | 5.21 ab | 1.12 | 2.35 |
| T12 | 3.60 cde | 0.22 | 6.20 a | 0.87 | 2.60 |
| T13 | 4.24 abc | 0.73 | 5.96 ab | 1.79 | 1.72 |
| T14 | 2.66 e | 1.20 | 5.55 ab | 2.46 | 2.89 |
| T15 | 3.86 bcde | 0.58 | 5.46 ab | 1.40 | 1.61 |
| F probability | * | ns | |||
| LSD (0.05) | 1.29 | - | |||
Note: * Significant difference at p ≤ 0.05 level; ns, not significant; - indicates that the LSD was not calculated due to non-significant results. Different letters in the same column indicate significant differences (p < 0.05) between the treatments.
Publisher’s Note: MDPI stays neutral with regard to jurisdictional claims in published maps and institutional affiliations. |
© 2022 by the authors. Licensee MDPI, Basel, Switzerland. This article is an open access article distributed under the terms and conditions of the Creative Commons Attribution (CC BY) license (https://creativecommons.org/licenses/by/4.0/).
Share and Cite
MDPI and ACS Style
Sun, Y.; Chen, X.; Yang, J.; Luo, Y.; Yao, R.; Wang, X.; Xie, W.; Zhang, X. Coastal Soil Salinity Amelioration and Crop Yield Improvement by Biomaterial Addition in East China. Water 2022, 14, 3266. https://doi.org/10.3390/w14203266
AMA Style
Sun Y, Chen X, Yang J, Luo Y, Yao R, Wang X, Xie W, Zhang X. Coastal Soil Salinity Amelioration and Crop Yield Improvement by Biomaterial Addition in East China. Water. 2022; 14(20):3266. https://doi.org/10.3390/w14203266
Chicago/Turabian StyleSun, Yunpeng, Xiaobing Chen, Jingsong Yang, Yongming Luo, Rongjiang Yao, Xiangping Wang, Wenping Xie, and Xin Zhang. 2022. "Coastal Soil Salinity Amelioration and Crop Yield Improvement by Biomaterial Addition in East China" Water 14, no. 20: 3266. https://doi.org/10.3390/w14203266
Note that from the first issue of 2016, this journal uses article numbers instead of page numbers. See further details here.