
Plausible Differences between the Laboratory and Prototype Behaviors of Spillway Aerator Flows


1
Vattenfall AB, R&D Hydraulic Laboratory, 81426 Älvkarleby, Sweden
2
Department of Civil and Architectural Engineering, KTH Royal Institute of Technology, 10044 Stockholm, Sweden
3
Department of Civil Engineering, National Chung Hsing University, 40227 Taichung, Taiwan
*
Author to whom correspondence should be addressed.
Water 2022, 14(20), 3264; https://doi.org/10.3390/w14203264
Submission received: 25 September 2022
/
Revised: 7 October 2022
/
Accepted: 13 October 2022
/
Published: 16 October 2022
(This article belongs to the Section Hydraulics and Hydrodynamics)
Abstract
:An aerator, installed to prevent cavitation damages in spillways and outlet works, generates a typical two-phase flow affected by its configuration and flow conditions. The major parameters of concern include air demand, jet trajectory and streamwise changes of air concentration near chute bottom. This study reviews the theoretical basis and deals with several aspects of physical scale modeling, supported exclusively by field measurements. Analyses reveal that the sub-atmospheric pressure generated in the air cavity should also be scaled in physical modeling, which is seldom the case in the laboratory environment. Thus, the conventional approach to upscale the air demand is controversial. With the data from both fields and laboratories, it is demonstrated that a direct conversion of air flow from model to prototype is justified only if the approach flow velocity in the model exceeds 7.0–7.5 m/s or the Reynolds number exceeds 1.58 × 10⁶. Failing to meet this premise would bring about errors for prototype predictions; the error extent depends on both model scale and flow magnitude. In terms of cavity pressure drop, the prototype differs by a factor of less than 10 from its scale model with sufficient air supply. In a model, the air concentration along the chute bottom drops considerably within one to two trajectory lengths. The prototype differs from its model in such a way that the air concentration decay is much slower, with a higher level that is maintained over a longer distance downstream of the impact location. This study is intended to provide insight for laboratory studies and engineering design.
1. Introduction
For medium- and high-head dams, the discharge of the high-velocity flows is the major concern in the design of both surface spillways and low-level outlets. Potential cavitation risks require that proper countermeasures should be adopted to guarantee their safe operations. Cavitation occurs if the static pressure of the flow drops, due to high flow velocity, to below the vapor pressure of the water, which gives rise to the formation of small vapor-filled cavities or voids in the water. If transported by the flow to a location subjected to higher pressure, the cavities then collapse and implode, thus producing strong shock waves that damage solid surfaces as time elapses. The cavitation risk is assessed in terms of cavitation potential expressed by a cavitation index:
where p = patm + pg is local reference pressure, patm = the atmospheric pressure, pg = gauge pressure, pv = vapor pressure of the water, v = mean reference velocity and ρ = density of the water. This index expresses the relationship between the difference of a local absolute pressure from the vapor pressure of the water and the kinetic energy per volume, which is used to characterize the potential of the flow to cavitate. Cavitation damages are expected at locations where Ca is below 0.2. In addition to flow velocity and depth, the occurrence of the damages also depends on local surface irregularities, material strength, structure elevation and length of spillway operation. Since Ca depends on the local flow velocity and pressure, the maximum flow discharge does not necessarily produce the highest cavitation potential for a specific location.
The first known aerator installation is at Yellowtail dam [1]. Since then, aerators have become the common engineering practice to avoid cavitation damages in spillways. It separates the flow from the channel bottom to form an air cavity, so that air is entrained into the lower jet nappe from underneath. The main mechanisms of the air entrainment are jet disintegration and mixing process at the re-attachment location. Downstream of the cavity, the flow jet is confined by the bottom and strong turbulent mixing occurs in the impact zone. The entrained air then becomes successively detrained. It is the entrained air in the close vicinity of the chute bottom that prevents cavitation from occurring. Each aerator thus protects a limited chute area downstream [2,3,4,5,6,7,8,9].
The introduction of free air bubbles into the flow increases the compressibility of the water and inhibits thus the formation of vapor-filled bubbles. In such a way, the development of undesirable sub-atmospheric pressures on the channel bottom is counteracted. Laboratory studies show that a bottom air concentration Cb = (1–2)% already mitigates the damages and the degree of mitigation is proportional to Cb. If the concentration exceeds Cb = 5%, the damages disappear completely [1,4,5,10,11,12]. Mortenseen [13] shows that, with high-strength concrete (31–55 N/mm2) for chute construction, Cb = 0.5% would be sufficient to protect the chute from cavitation risk. As a defensive measure, aeration is nowadays the engineering standard for cavitation damage prevention in surface spillways, outlet works and other flood structures.
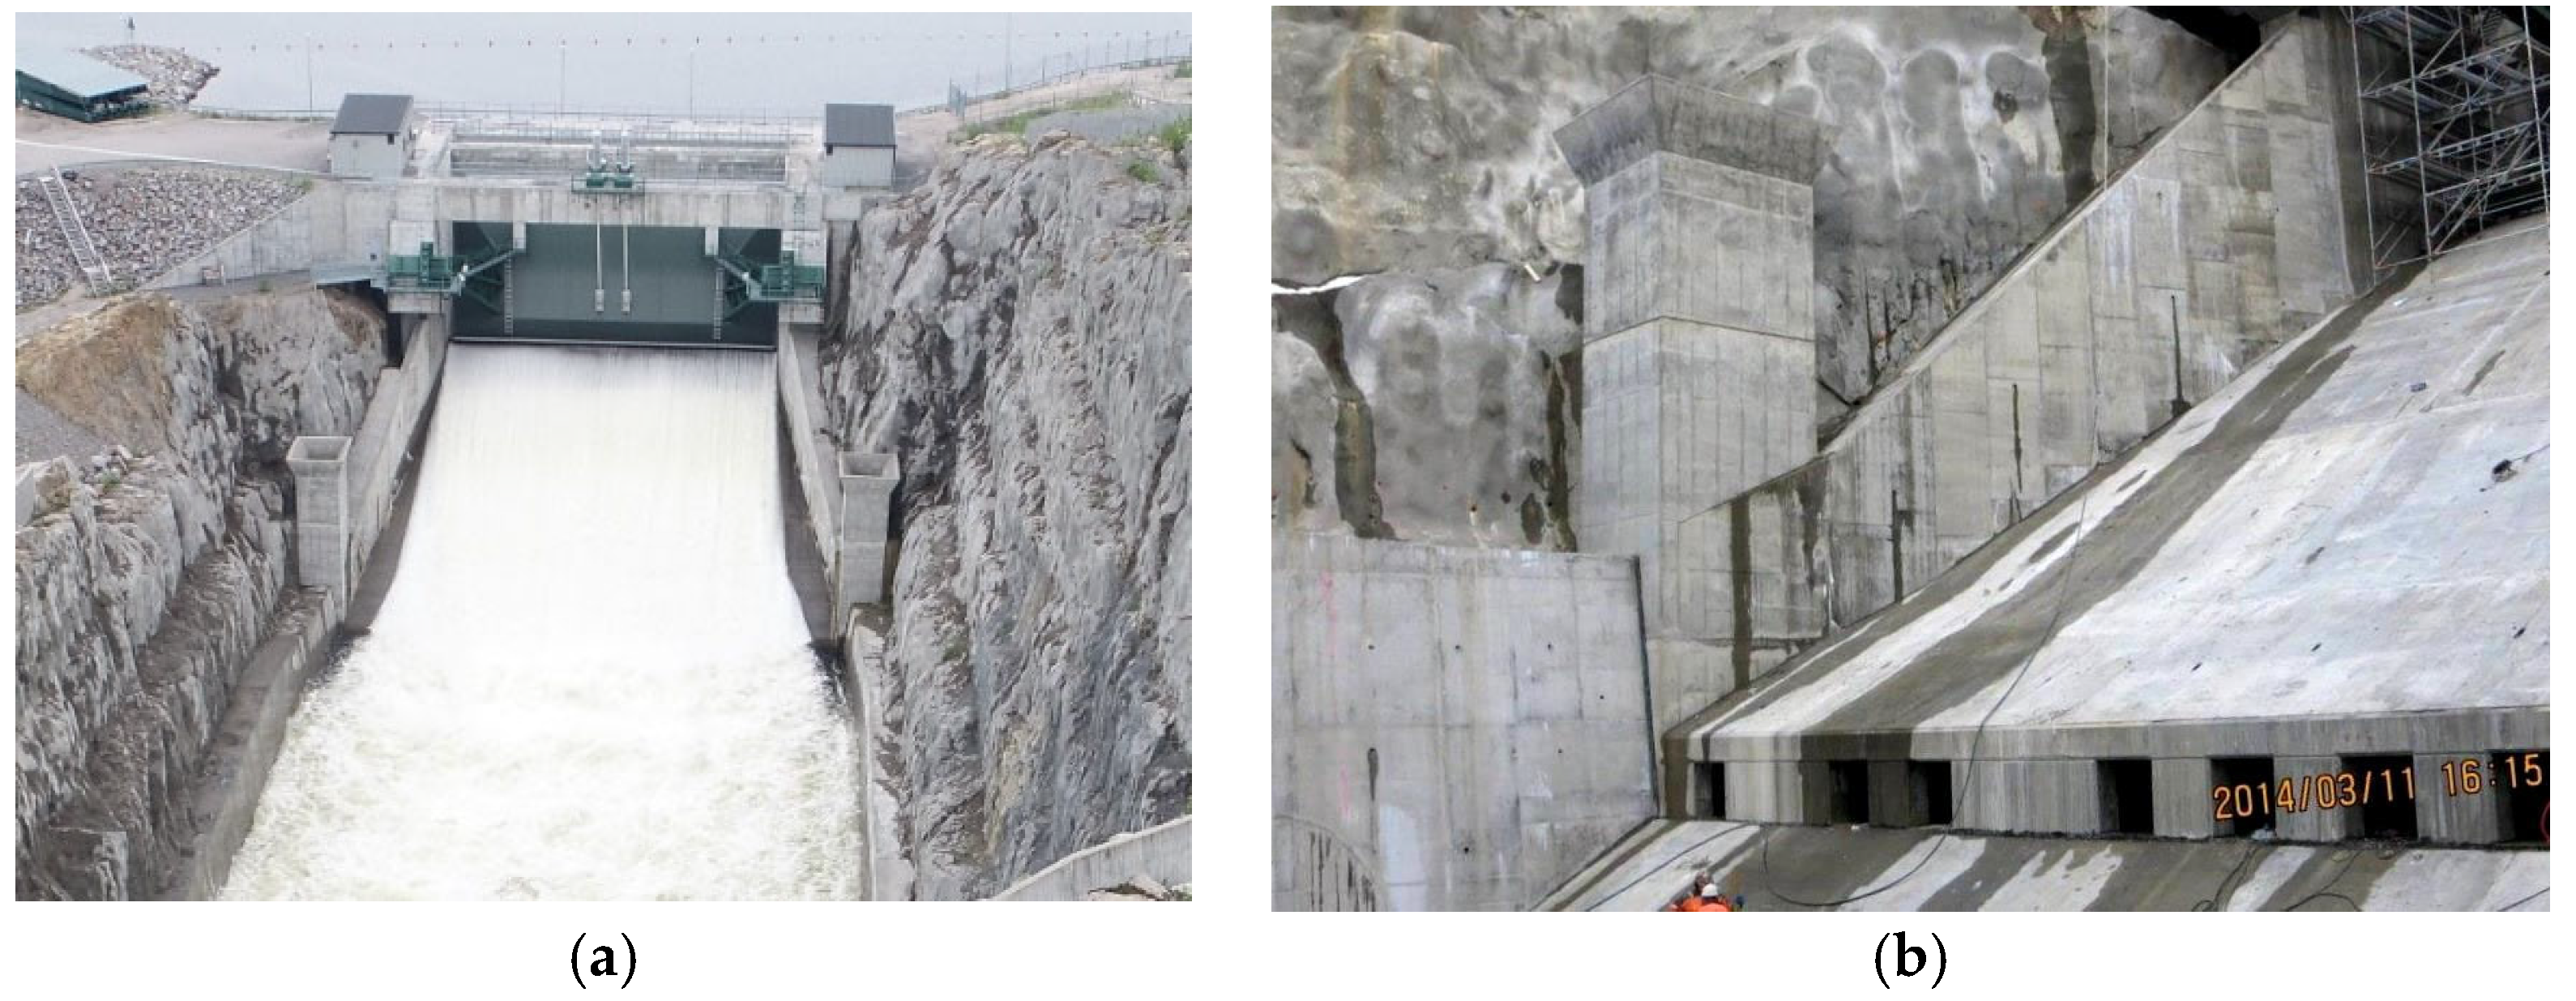
Most existing aerators are built-in surface spillway chutes. Figure 1 presents a 35.0 m wide aerator in Sweden, accomplished in 2014 [14]. Its radial gate is 25.0 m wide, with a linear expanding chute downstream, which is the largest single opening in Sweden. At the free discharge, the flow rate amounts to 1500 m3/s at the full reservoir water level. The aerator includes an air duct with 13 air vents symmetrically placed about the chute center plane. On each side, air is supplied from an air shaft, between which the chute is 35.0 m wide.
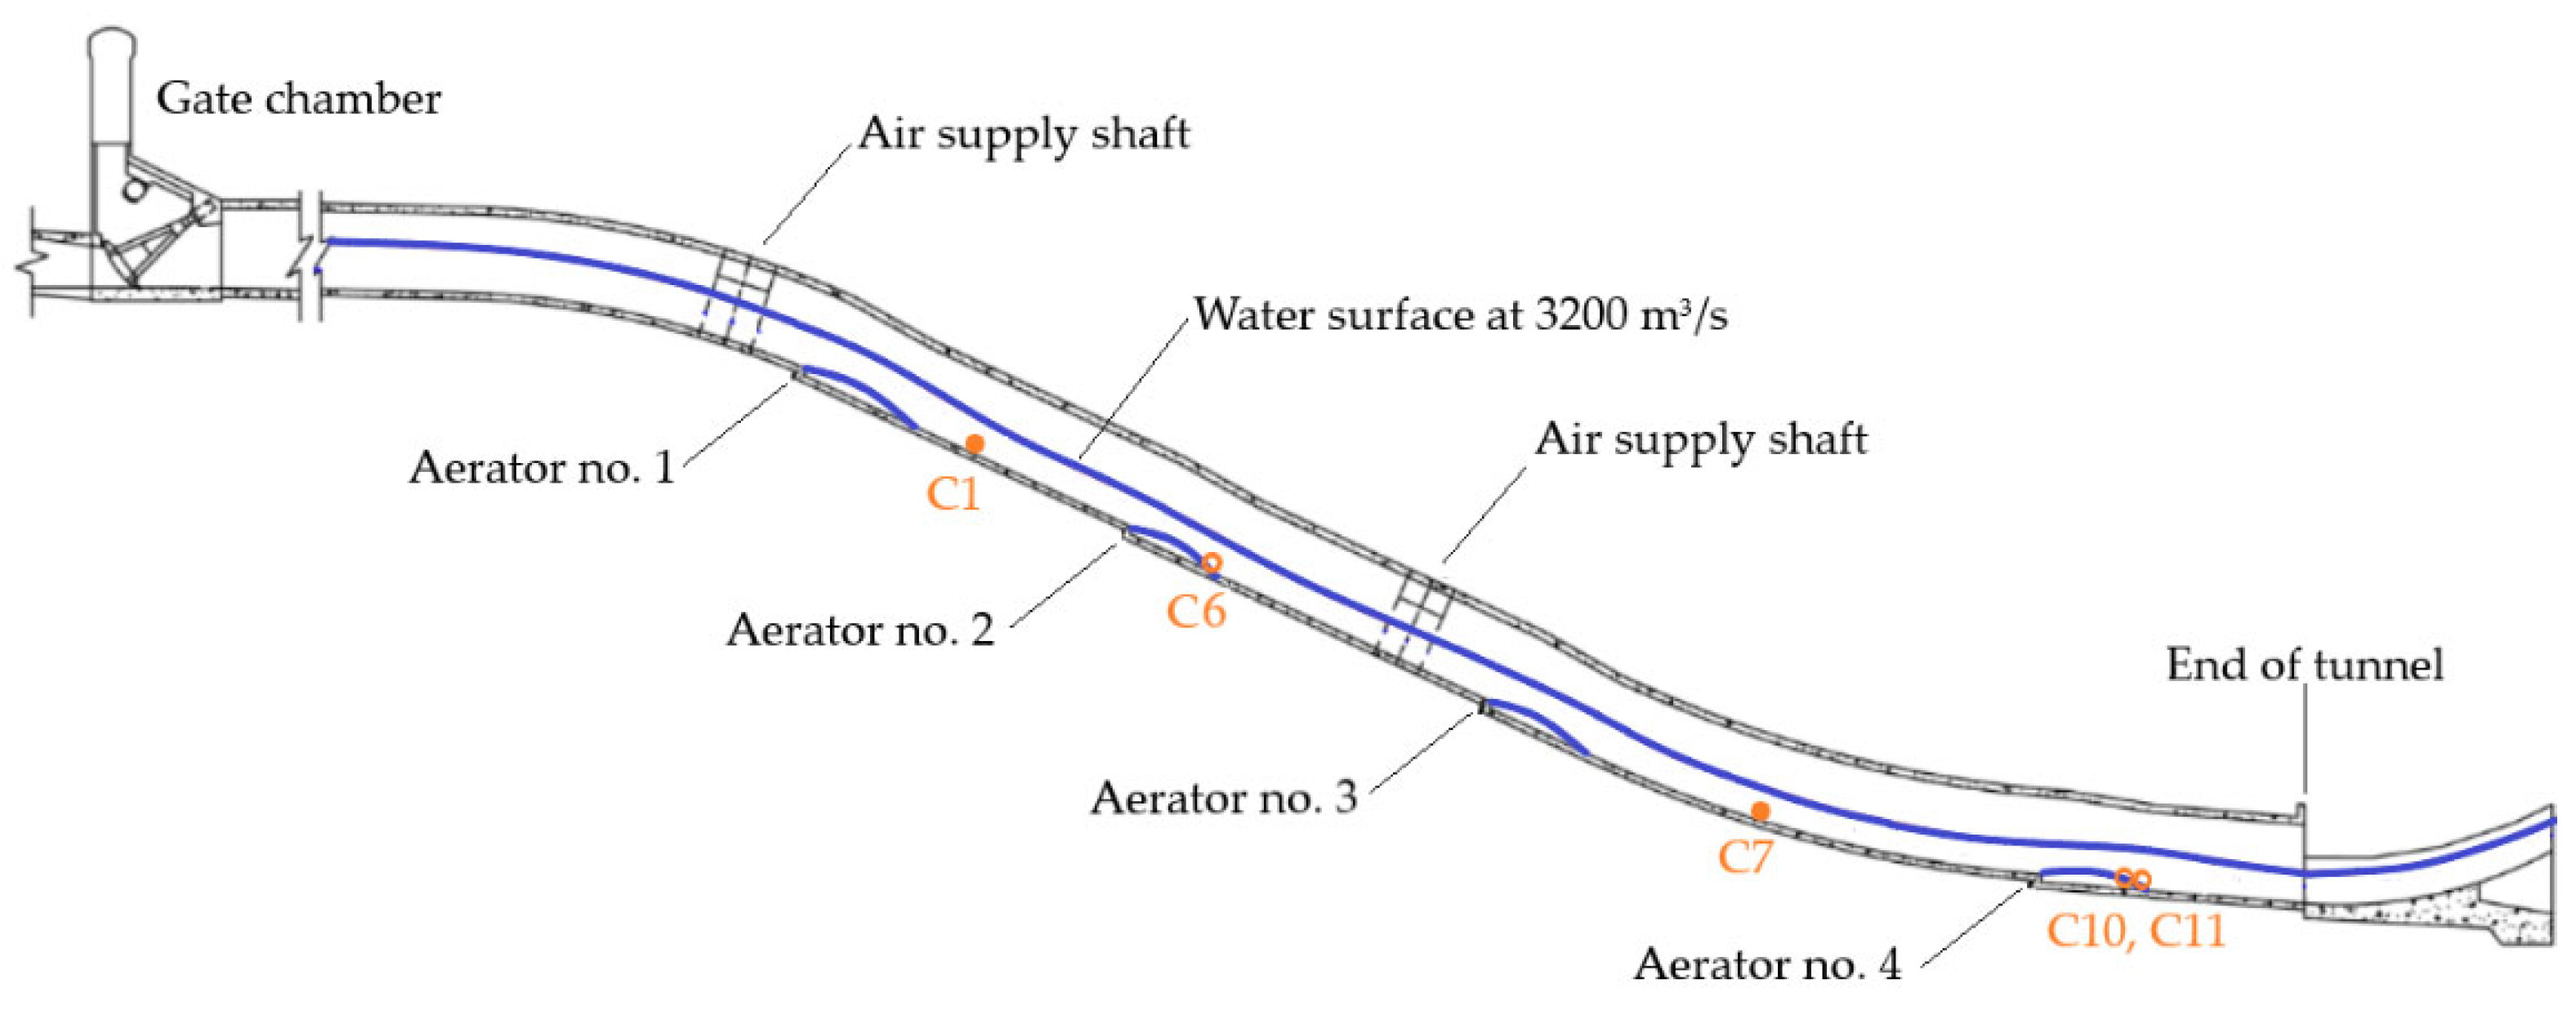
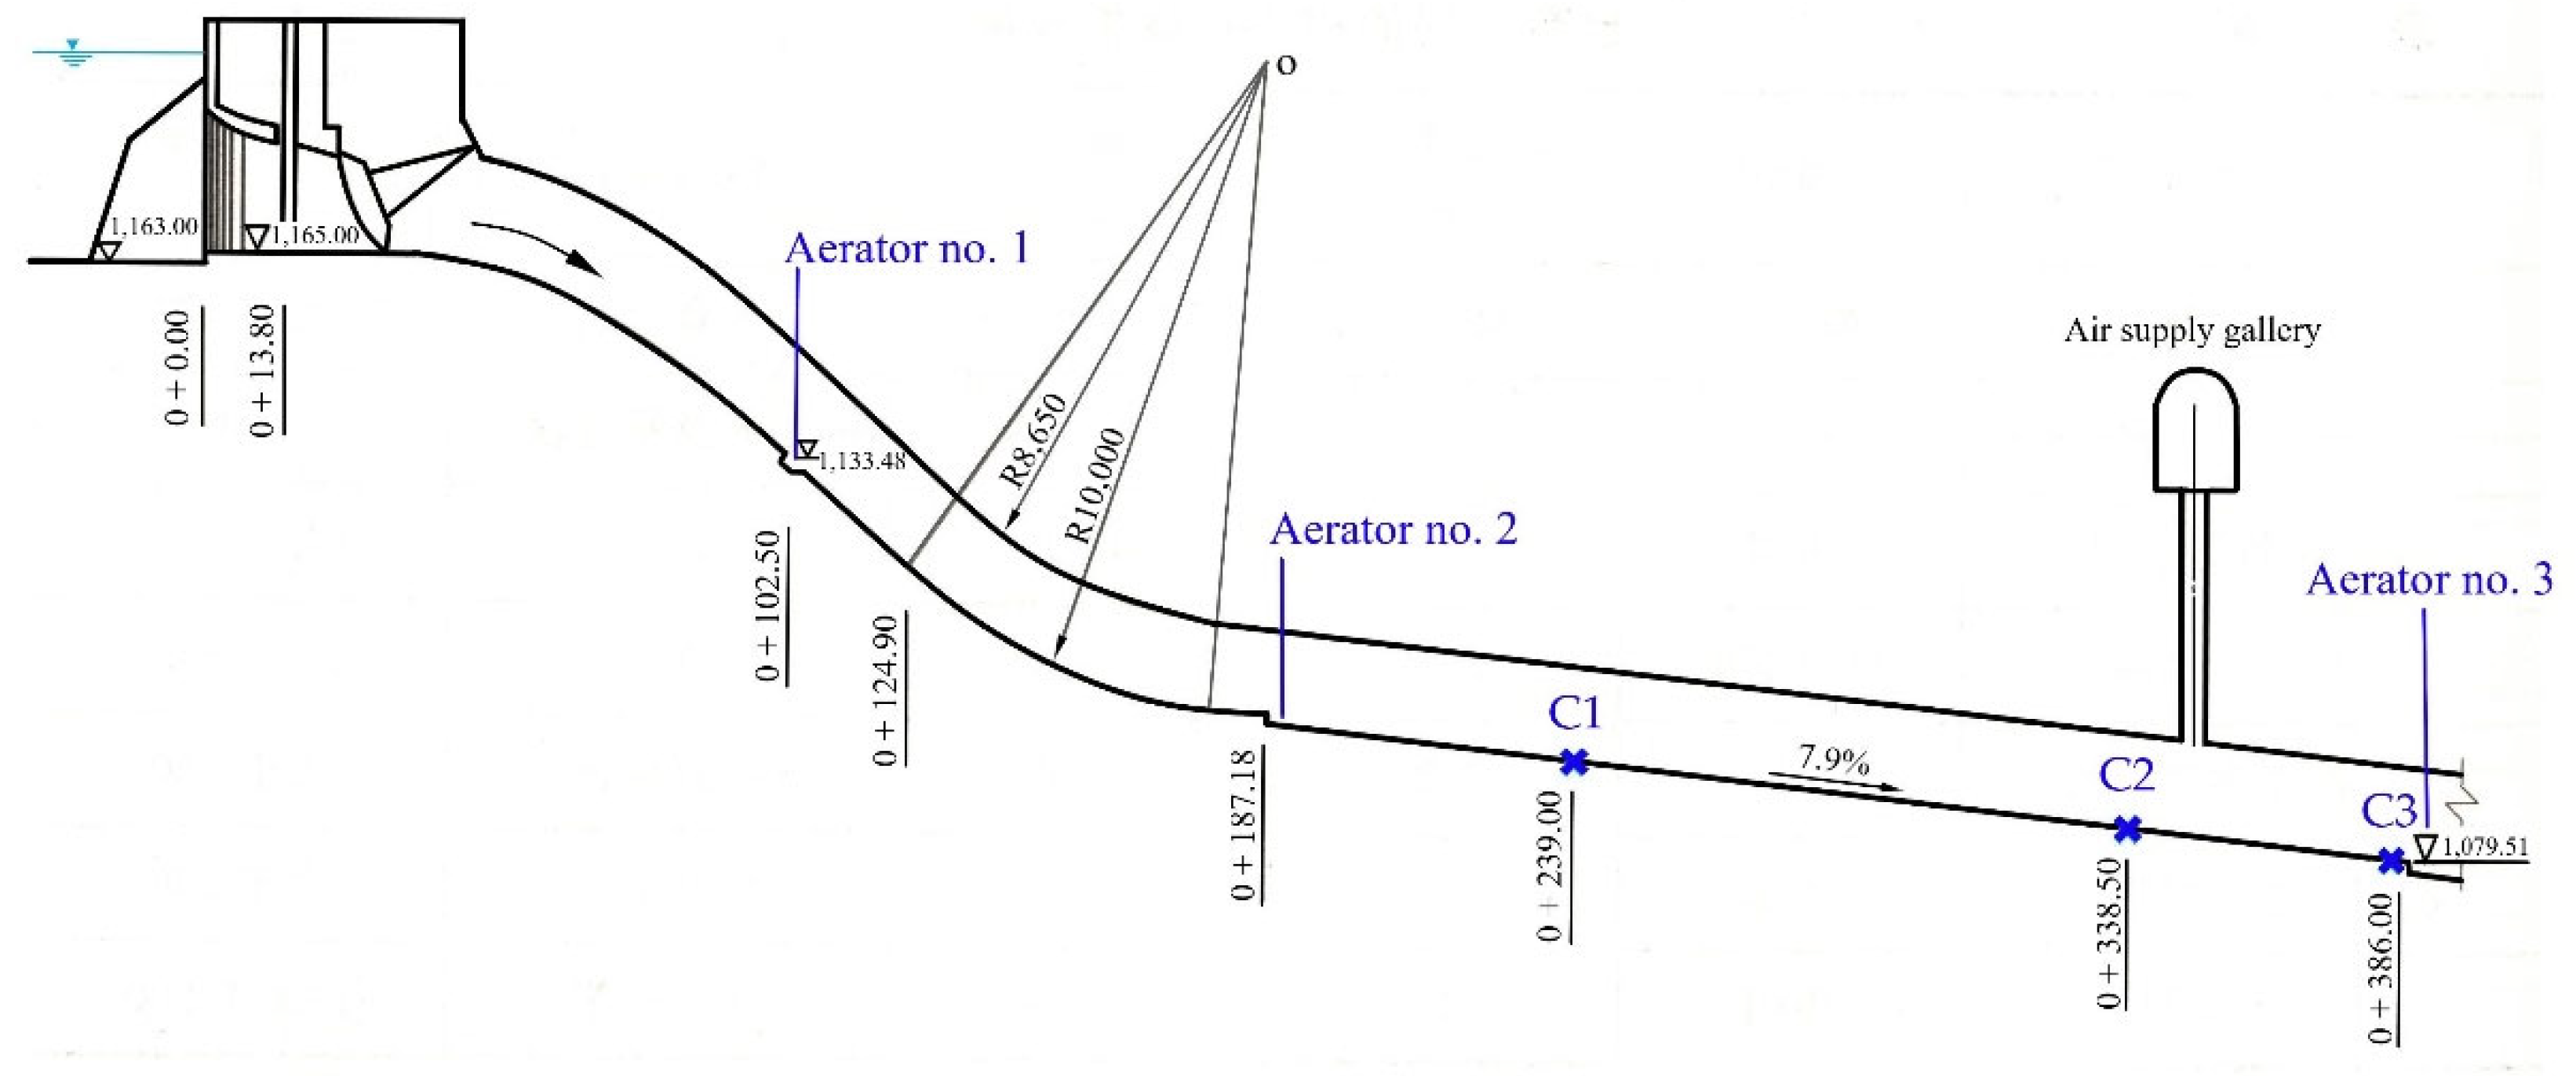
Aerators are also used in tunnel spillways and outlet structures. During the past decade, many large dams have been constructed in narrow river valleys in mountainous areas. Flood diversion tunnels are often drilled in one or both riverbanks. They are then converted to permanent tunnel spillways when the construction is complete. In most cases, it is still free-surface flow with sufficient freeboard. Due to the large length and high velocity, several aerators are usually constructed. Figure 2 shows such a case with Jinping-I flood discharge tunnel, with four aerators [15]. The tunnel length and width are 1407 m and 13 m, respectively. According to Coleman et al. [16], tunnel aerators should be verified by a physical model unless an extremely close approximation can be made to an existing design that is experimentally tested. This is because a different tunnel longitudinal profile leads to an appreciably different two-phase flow pattern at the aerators.
An aerator in a chute bottom is the most common type. Downstream of the jet impact region, the entrained air bubbles gradually detrain with distance, engendering a decrease in air concentration. If Cb drops below (6–8)%, another aerator is required to protect the chute [4]. In some circumstances, the flow features even large water depth. As a result, cavitation damages cannot be prevented only by the bottom aerator. Side or lateral aerators are required, usually denoted as 3D aeration [17].
The commonly used aerators include an offset, a deflector (ramp), a groove and a combination of some of these features [1]. An attachment of a deflector to the offset is considered the optimum alternative. Air to an aerator is supplied in different ways and often from both sides of the chute. The chute width has a bearing on the choice of aerator layout. In a flood tunnel, the air supply is often via a ventilation shaft or tunnel.
This paper first reviews, through dimensional analysis and an analytical solution, the correlation among geometrical and flow parameters that govern the aerator flow. Here, it is explained why the upscaling from model to prototype suffers from errors. The dependence of air flow on model scales is then illustrated. Supported by prototype measurements and high-velocity flume tests, the threshold flow velocity for correctly upscaling the air flow to prototype is explained. Comparisons of cavity air pressure as well as streamwise change of bottom air concentration downstream of jet impingement location are made between model and prototype.
2. Theoretical Background
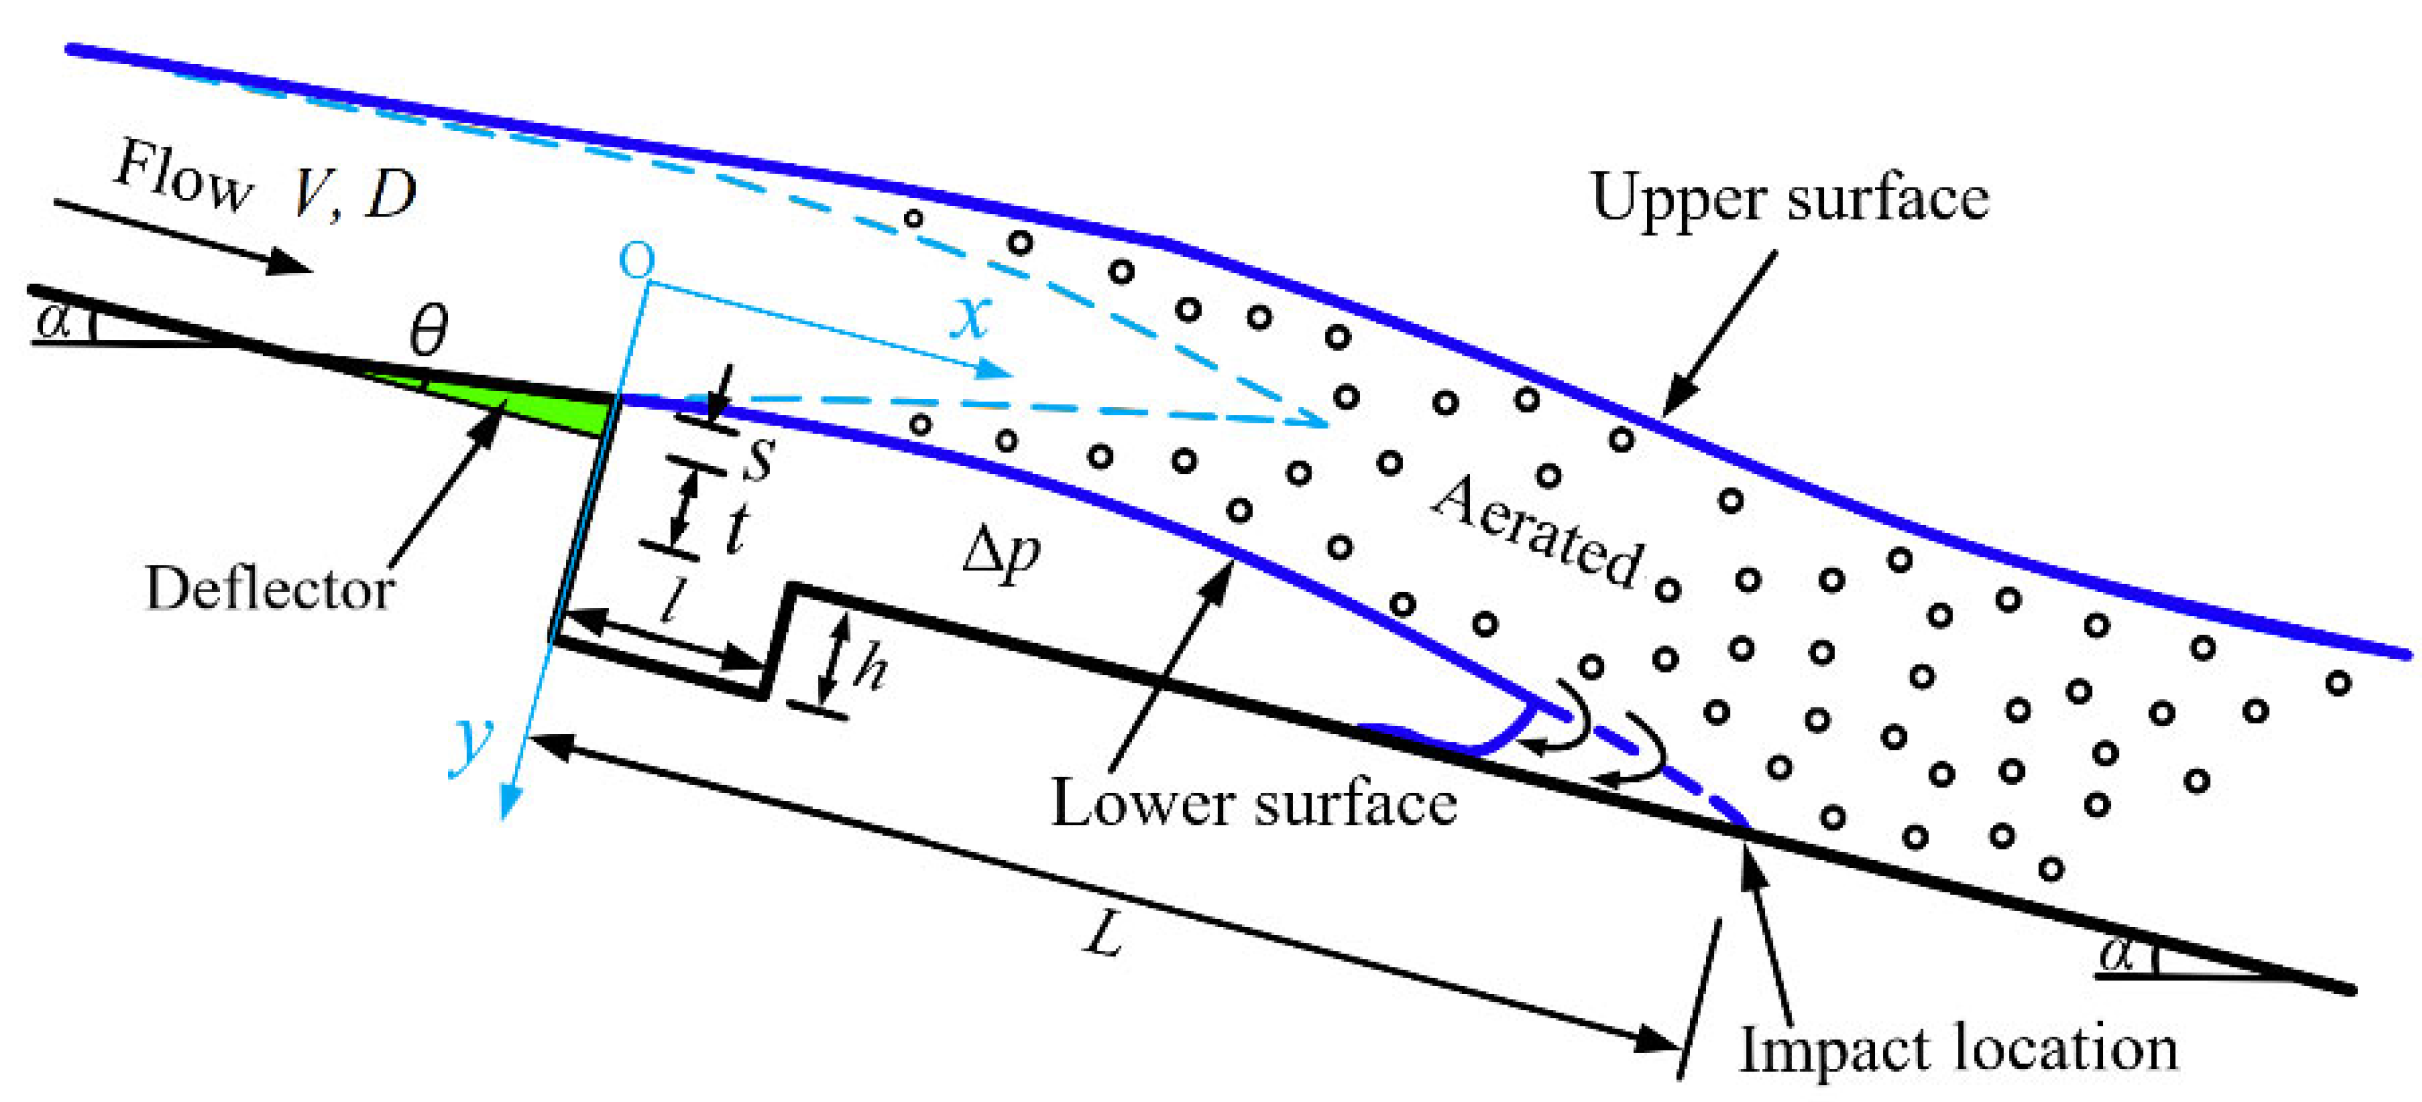
The aerator flow is a typical two-phase flow phenomenon affected by factors such as spillway layout, aerator configuration, approach flow conditions and air cavity characteristics. The air flow rate Qa is also affected by the geometry of the air passage. Figure 3 sketches a typical aerator layout with flow pattern. The functional relationship is expressed as [18]:
in which Q = water flow discharge, Δp = cavity air pressure drop (= |Pg|), V and D = approach flow velocity and depth, α = chute slope with the horizontal, t = chute bottom offset at the aerator, s and θ = deflector height and angle with the chute bottom, l and h = groove length and height, ks = chute surface roughness, ρa = air density, μ = dynamic viscosity of water, σ = surface tension of water, g = gravitational acceleration and f1 = functional symbol.
In light of the Π theorem, the dimensional analysis is made, with μ, g and D chosen as dimensionally independent quantities. The remaining ones reduce to the following dimensionless forms:
in which Πi = theorem symbol. The equations represent the aerator’s air-water system independent of the choice of dimensionless quantities. To simplify, new non-dimensional groups are introduced by rearrangement.
where β = ratio of air flow rate to water-flow discharge, φ = factor related to geometrical layout of the aerator, F = the Froude number, R = the Reynolds number, W = the Weber number, E = the Euler number and f = functional symbol. As R and W usually have negligible effects on the air flow, Equation (4) reduces to [19]
where f2 = functional symbol. Consequently, F, E and φ are the parameters that govern the aerator two-phase flow. In other words, the cavity air pressure is one of the factors that affects the air flow and ought to be scaled in physical model tests.
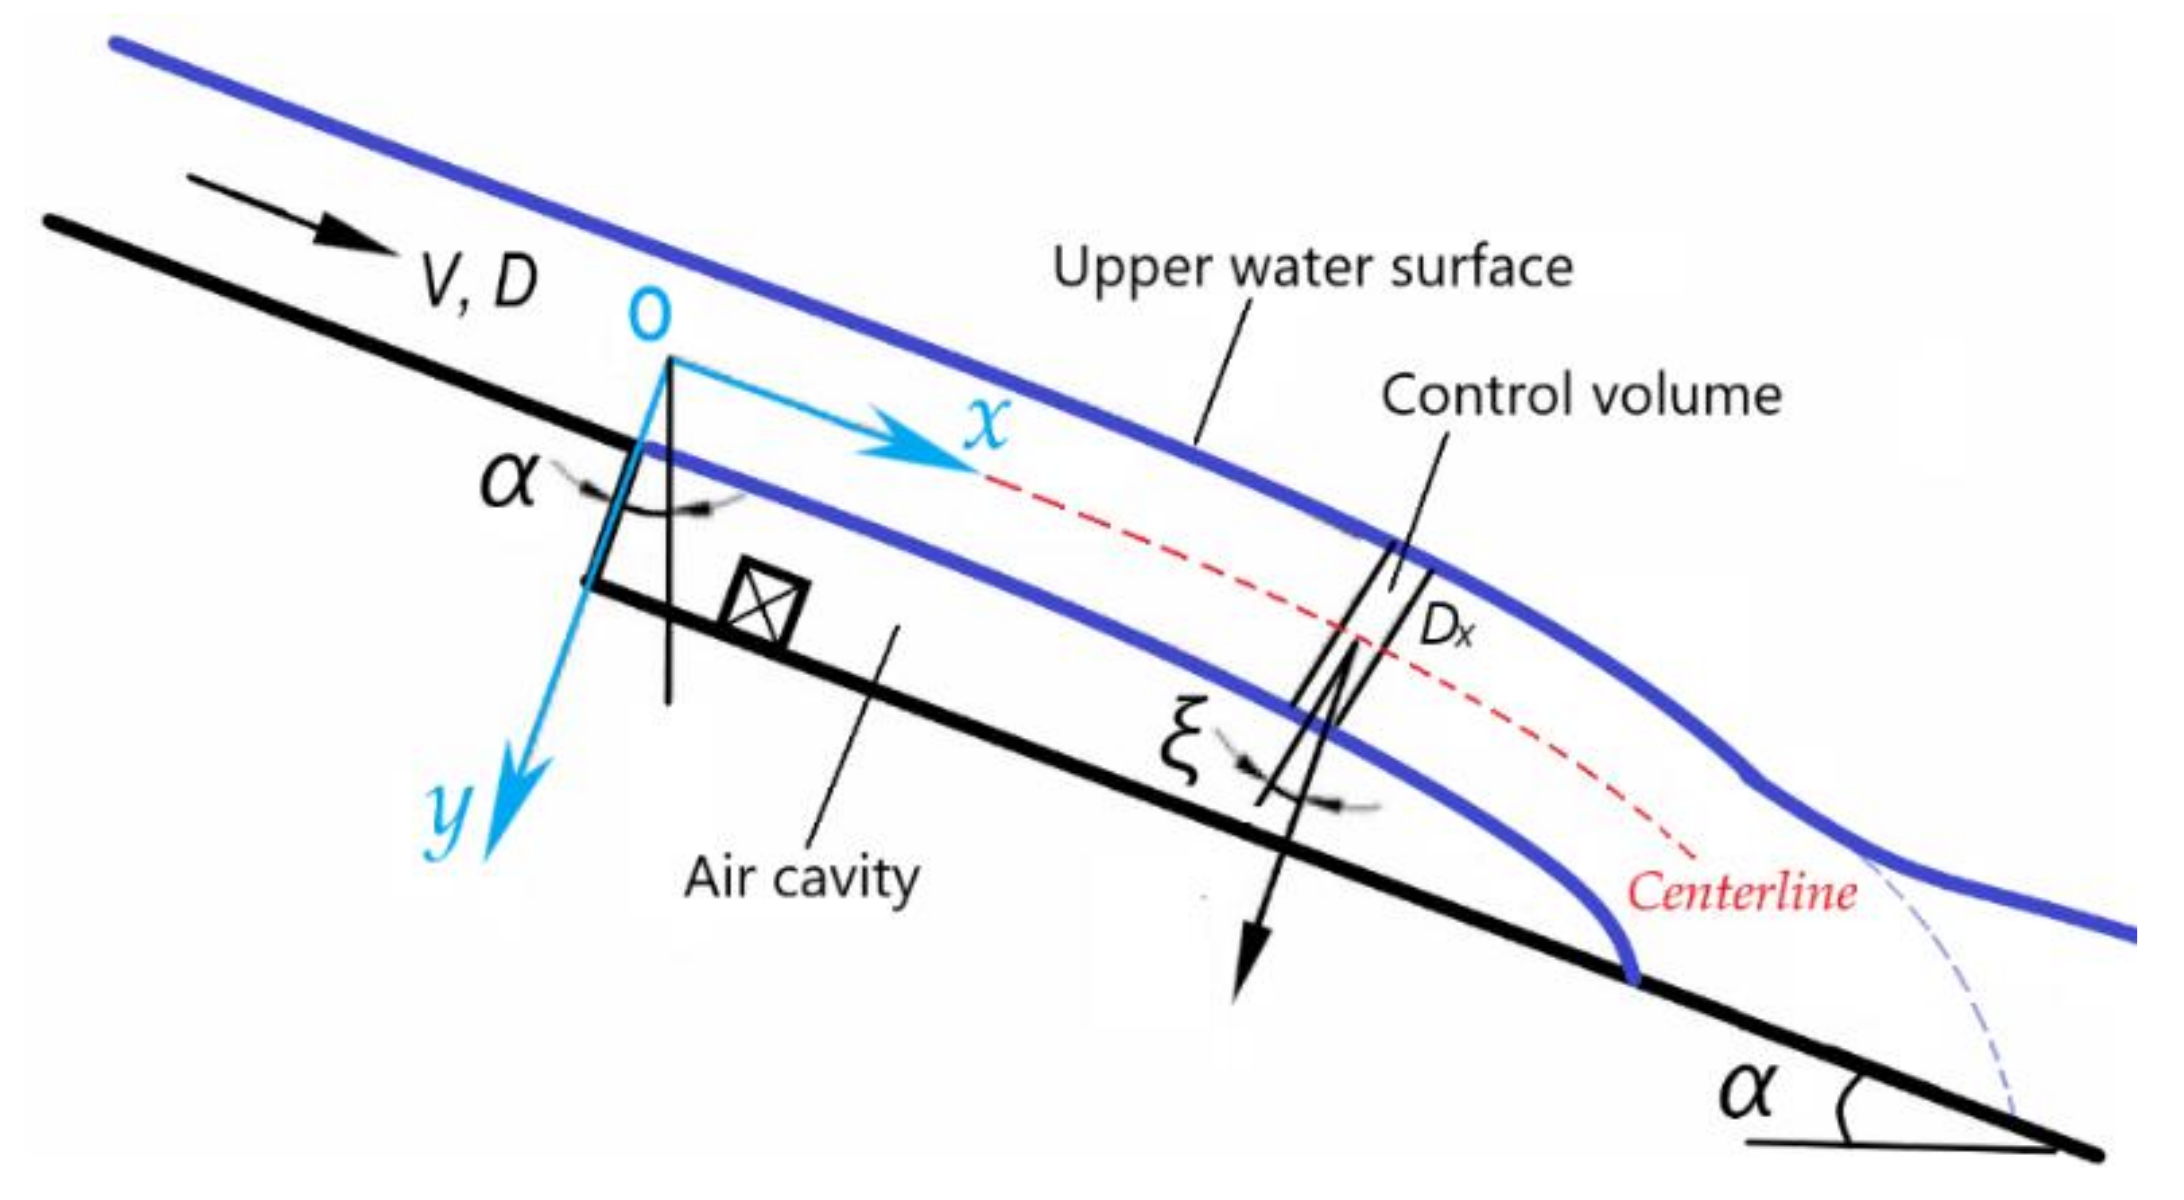
The dependence of the aerator air flow on air cavity pressure can also be corroborated an analytical estimation of the jet trajectory [20]. Figure 4 depicts schematically the aerator flow, treated as a single-phase flow without air entrainment and subjected to the pressure drop Δp in the cavity. A (x, y) coordinate system is set up, with x parallel to the chute bed (x = 0 at the offset) and y perpendicular to it (y = 0 at the mid-depth (centerline) of the approach flow).
Choose a control volume along the trajectory over the cavity, with ξ denoting its angle with the y axis and Dx the jet thickness at location x. Based on the equilibrium of the acting forces including Δpdx (per unit width), the trajectory can be expressed as:
in which t = time. As the jet curvature is small in the flow direction and the change in jet thickness is limited, which holds approximately true, especially at high flow velocity, it is assumed that ξ ≈ 0 and Dx ≈ D. With this approximation, the solution of the jet trajectory centerline is obtained.
Hence, y is dependent on Δp. For a given x, y becomes larger with an increment in Δp. This means that the aerator jet trajectory bends down more if the cavity is subjected to a larger pressure drop. If both the jet surfaces are exposed to the atmospheric pressure (or any equal pressure), then Δp = 0 and the jet trajectory bends down least.
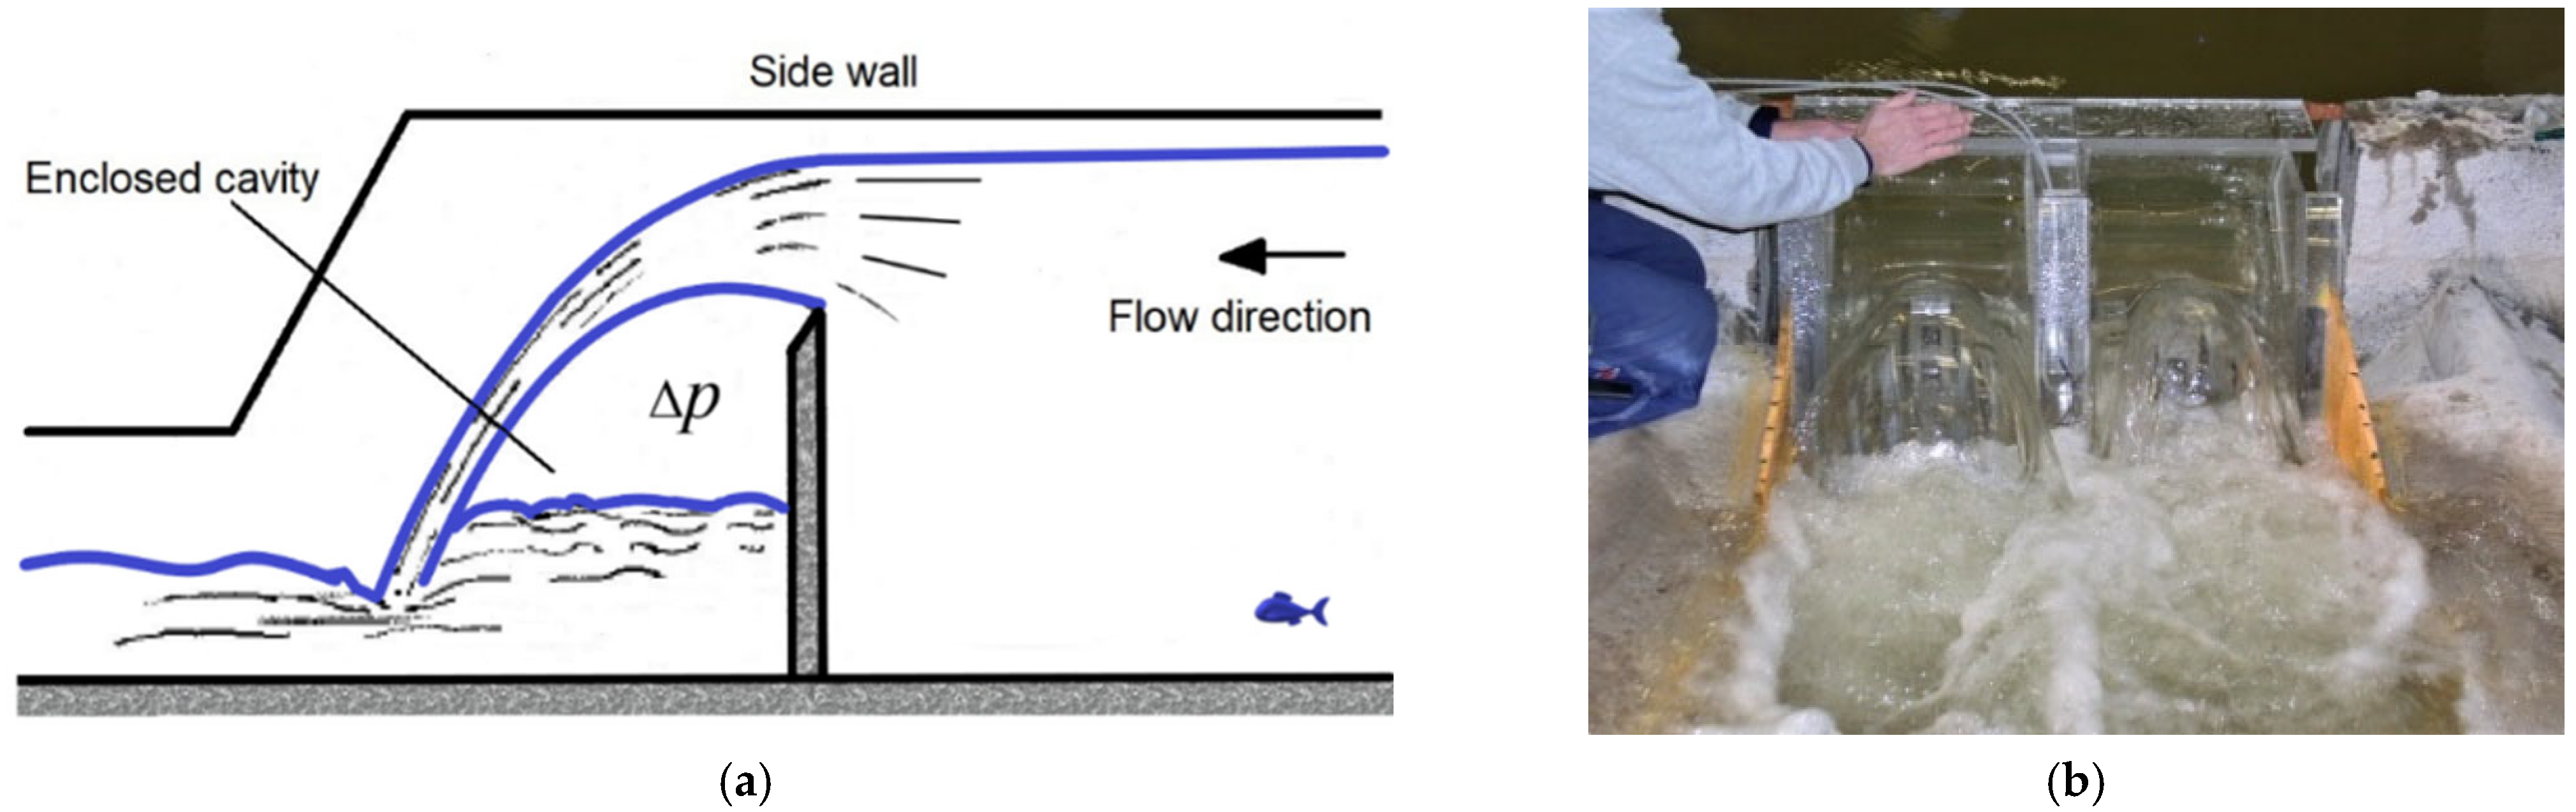
There are other flow cases where sub-atmospheric pressure air is enclosed in form of an air cavity and the jet trajectory behavior is affected. Figure 5 provides two examples, which are paralleled with the aerator flow. The former is the free-falling jet over a rectangular sharp-edged weir surrounded by walls (piers) on both sides, the latter is ski-jump flow over three flip buckets in the spillway opening [21]. This means that, for the aerator flow with an air cavity subjected to negative pressure, the Euler law of similarity (term E in Equation (5)) should be satisfied. However, the requirement of air cavity pressure scaling is seldom met in the ordinary laboratory environment. This is the partial reason why the model–prototype conversion may suffer from upscaling errors.
3. Model Scale and Air Demand
Physical aerator models are based on the Froude law and the air-cavity pressure scaling is disregarded. Let λ denote the model scale. The similarity reads: water discharge scale λQ = λ2.5, water flow velocity scale λV = λ0.5 and water flow pressure λP = λ. To address the scale effects of air flow, Pinto and Neidert [22] examined the scale effects of Foz do Areia spillway and found that reasonable results could be obtained from the = 8 and 15 scale models. Volkart and Rutschmann [23] performed experiments in a λ = 18.75 model and made comparisons with the prototype. Tan [24] constructed a λ = 8 model to mitigate the scale effects of air entrainment. It was recommended that a model must be large enough to reduce the scale effects, preferably λ < 10. Morton number, expressed in terms of F, W and R, is also a key variable for addressing the scale effects in modelling air–water flows [7,8,25,26,27,28,29]. If the Froude and Reynolds numbers exceed the minimum values, i.e., W = 110 and R = 1.7 × 10⁵, the effects of surface tension and viscous force are negligible [30,31,32,33].
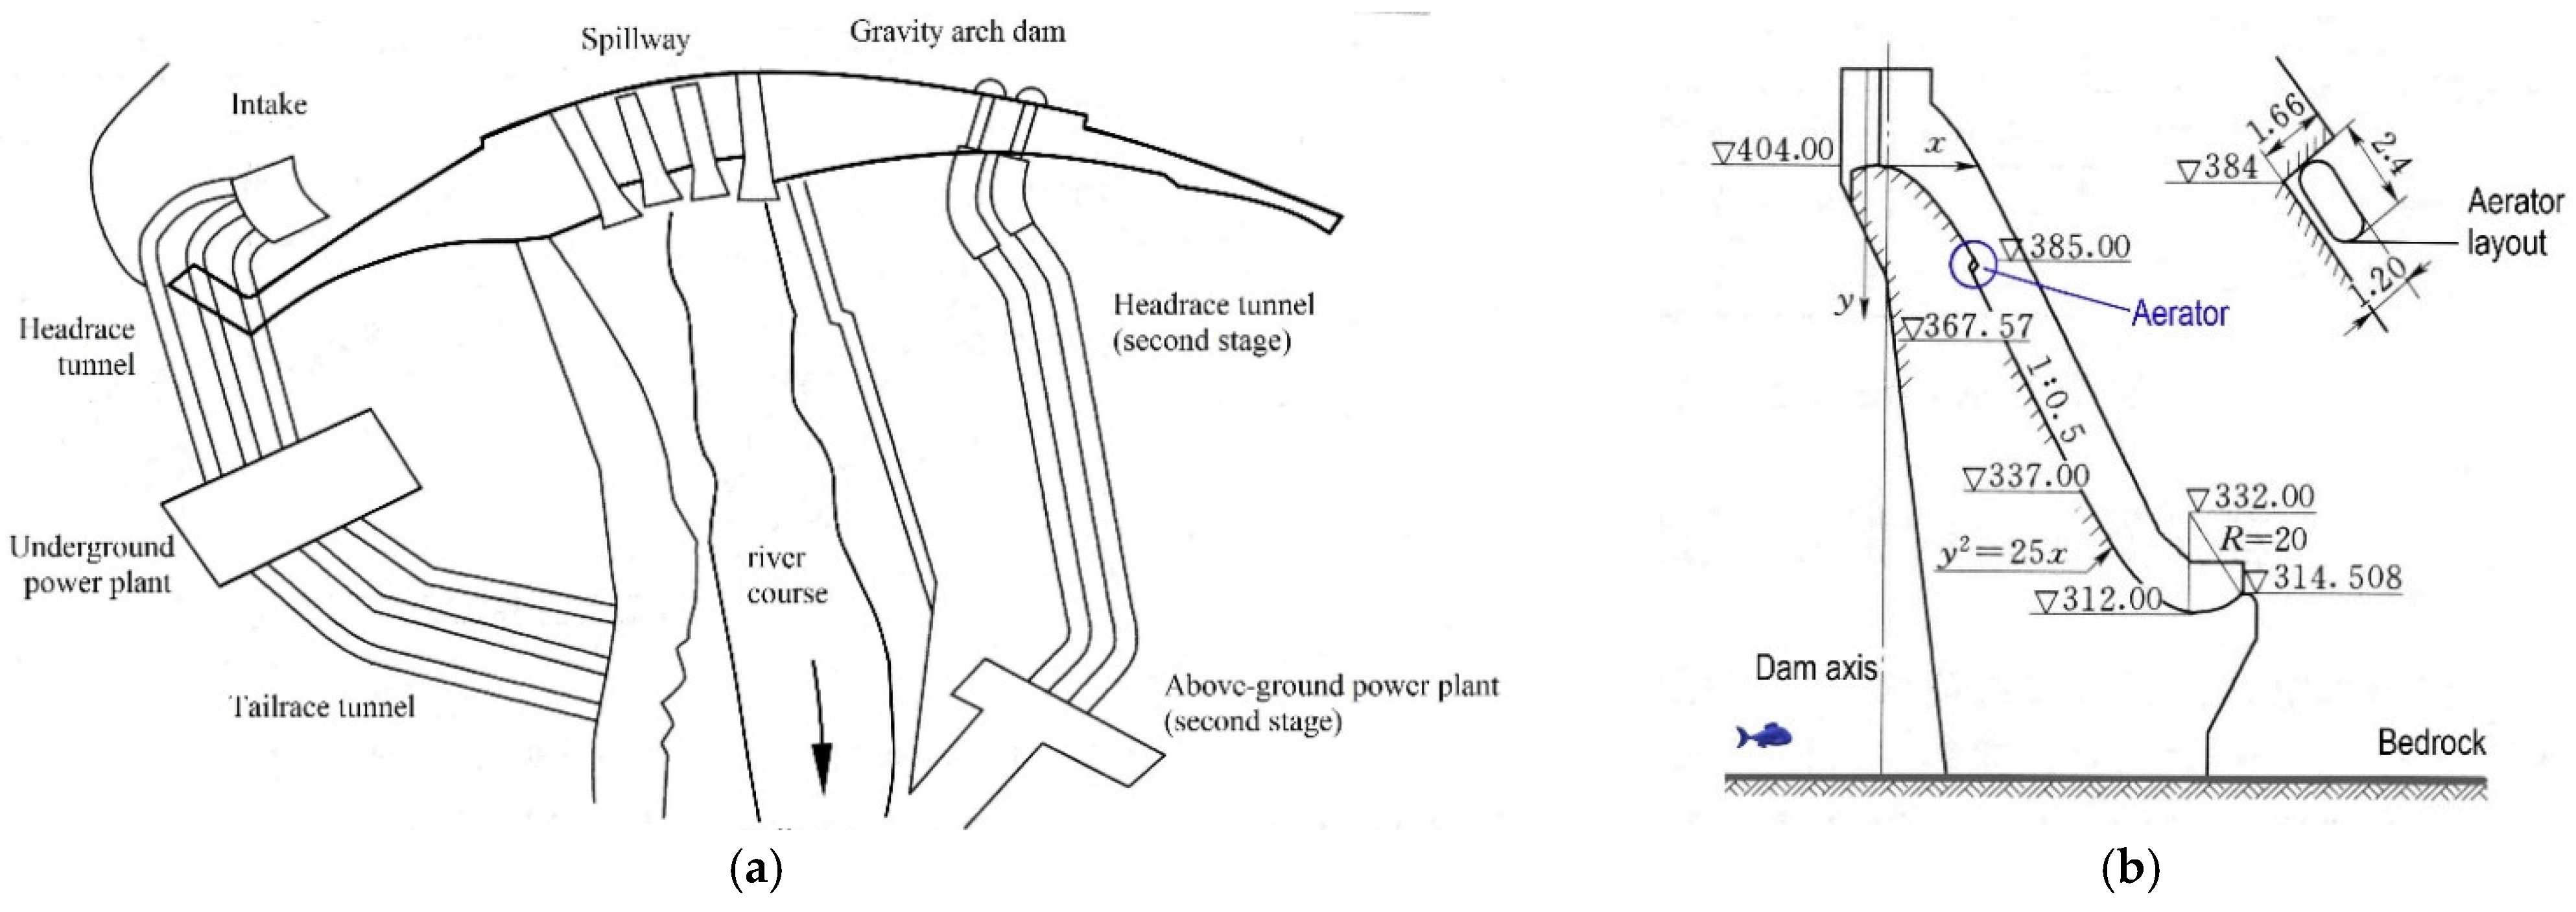
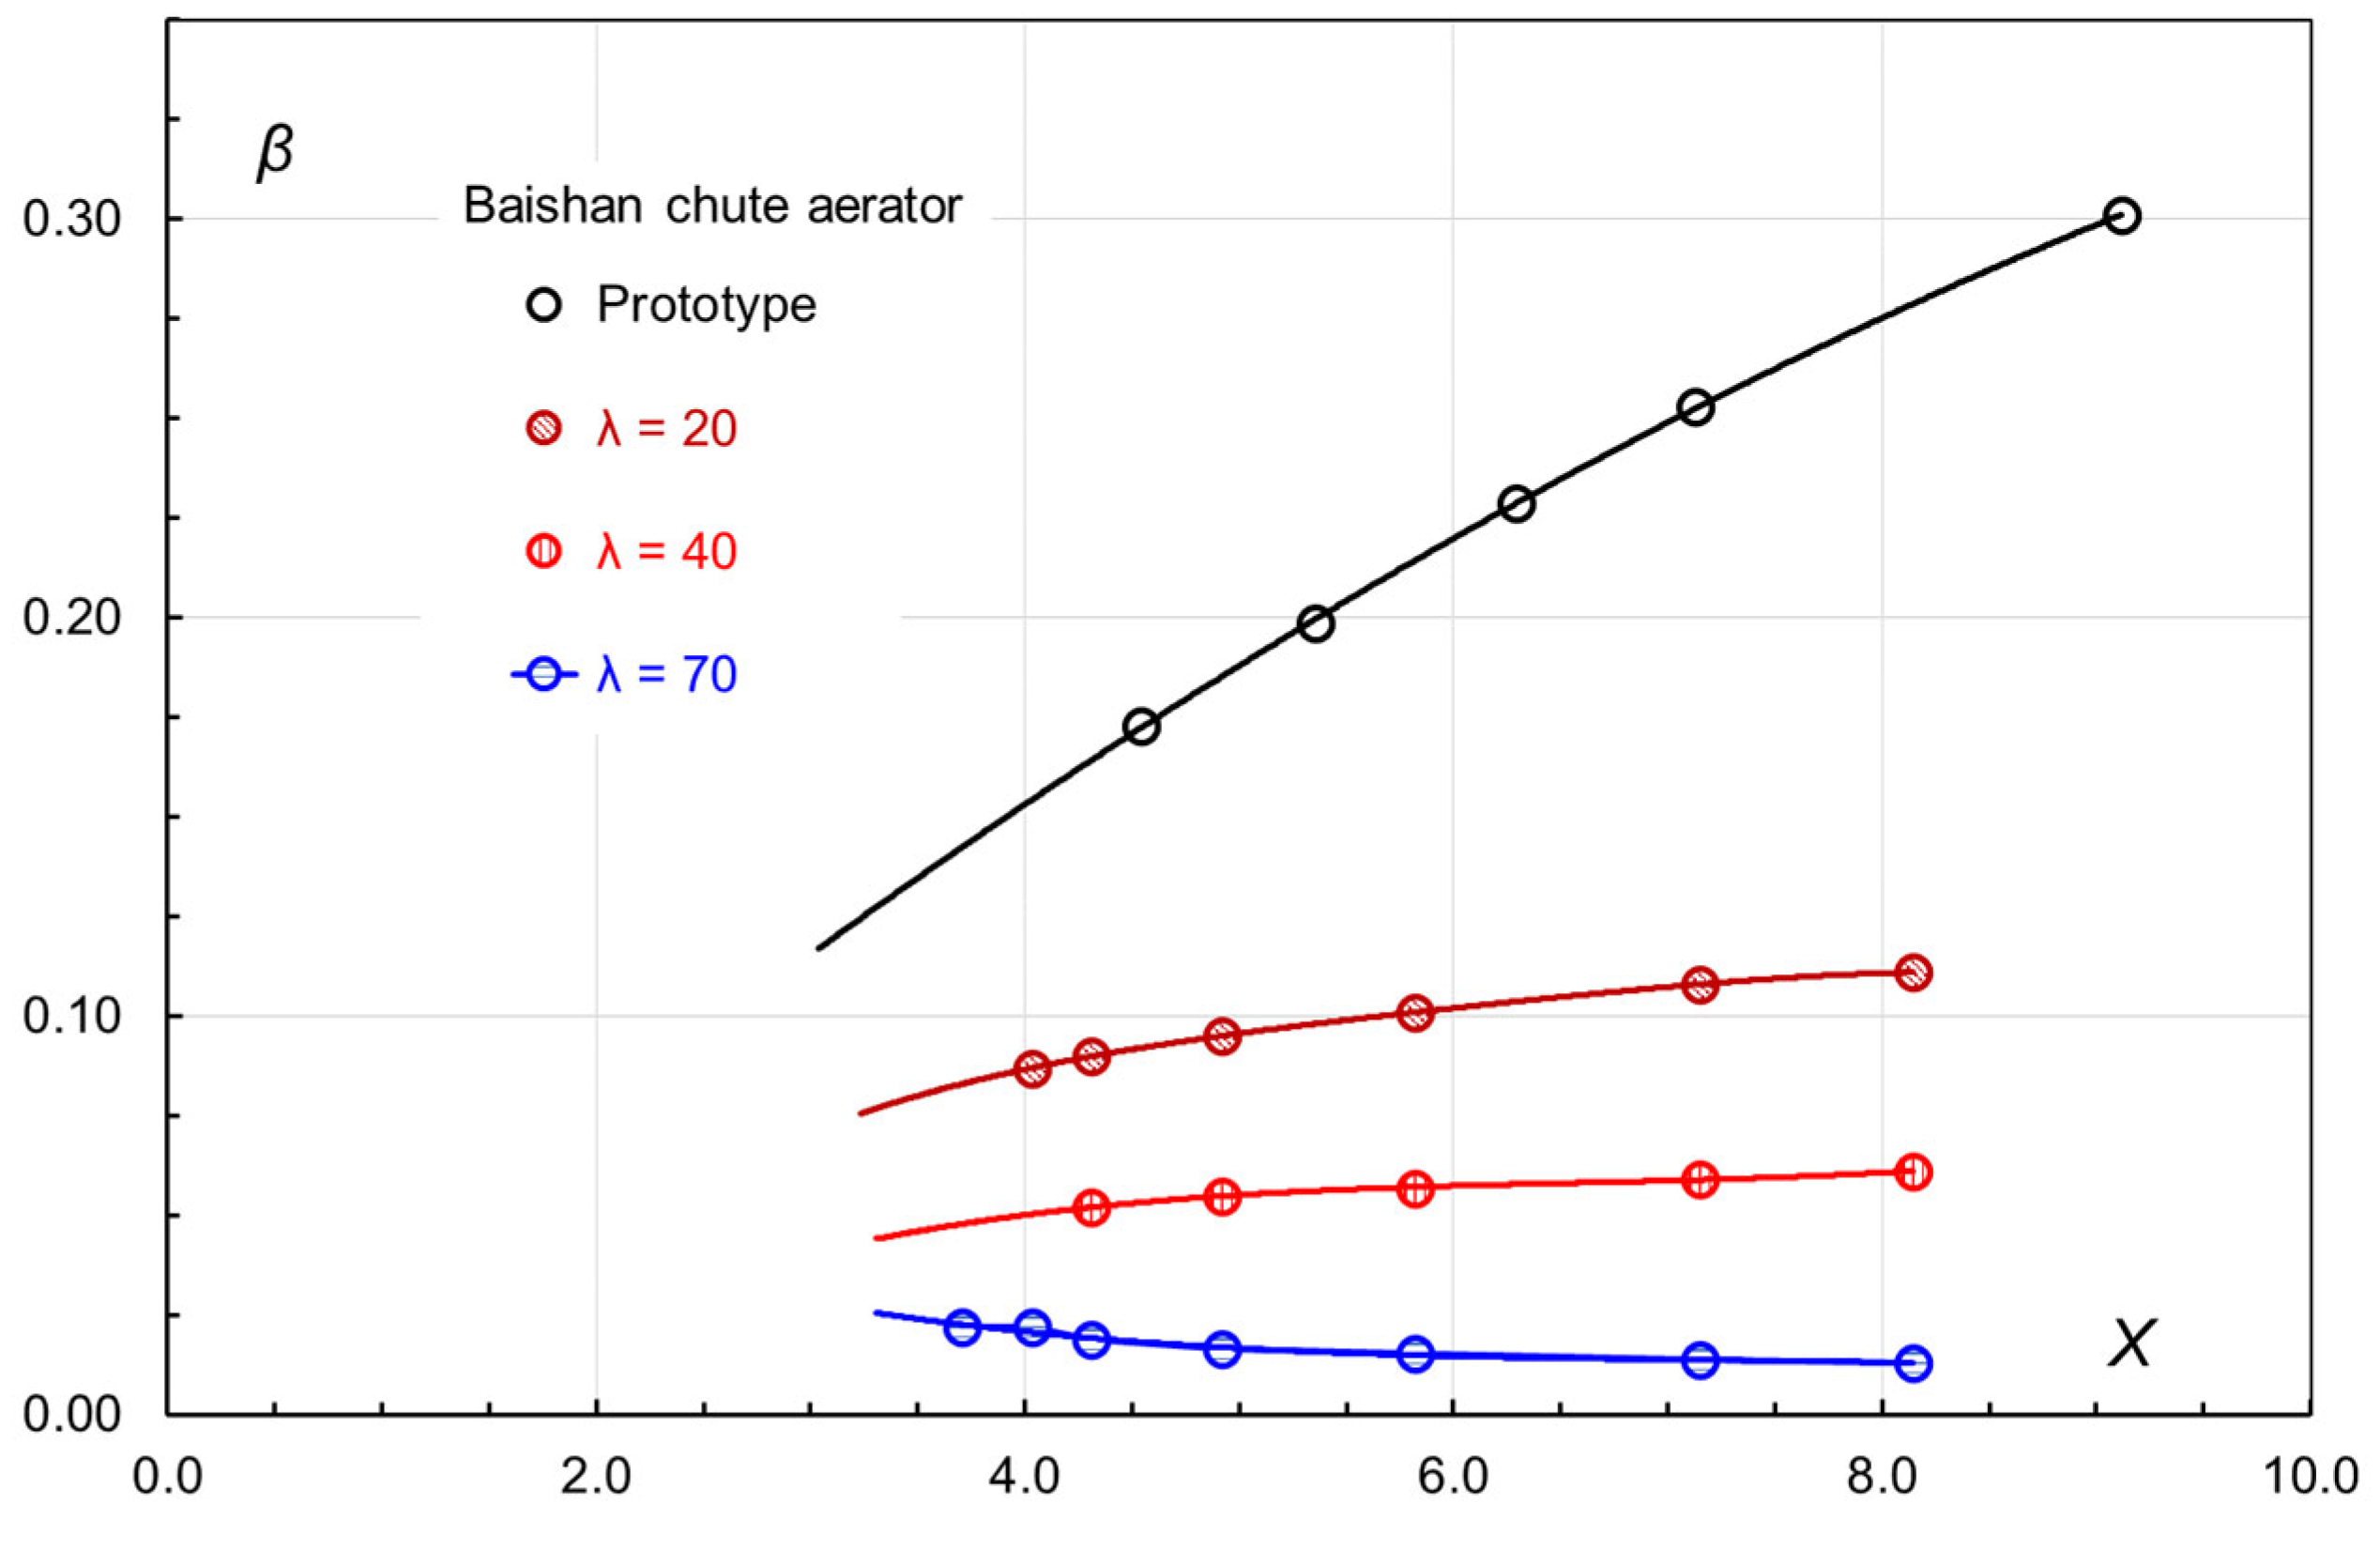
In a Froude model, the water flow is exposed to the atmospheric pressure. For high dams, aeration tests are sometimes made in different scales to better understand the flow behaviors. One representative example is Baishan dam, with a 149.5 m structural height [12]. Figure 6 shows its layout with the spillway longitudinal profile. The spillway has four gated overflow openings, and each gate is 12.0 m wide. Their sill elevations are the same, +404.0 m. The full reservoir level varies between +420 and 422 m. The design discharge per gate amounts to 2750 m3/s. The aerator offset is at elevation +384.0 m and the offset height is 1.66 m. Model tests were performed in three distinct scales, i.e., λ = 20, 40 and 70, which resulted in significant differences in model flow rates. Upon the dam spillway commissioning, prototype observations of air flows were also made, in which several flow discharges were examined. Together with the field data, Figure 7 plots the model test results as a function of X, in which:
Variable X is a composite parameter reflecting both the chute aerator geometry and approach flow conditions, which is derived from dimensional analysis. For a given model scale, β is weakly dependent on X. A larger model gives obviously rise to more air flow discharge. In the prototype, the tangent of the β-X curve becomes larger and the dependence of β on is significant, implying that a higher flow velocity leads to more air entrainment. The model–prototype difference is large.
Another typical example is the aerators in the Jinping-I flood tunnel on Yalong River [15]. The 1407 m long tunnel, designed for a 3200 m3/s flood discharge, is built with a horseshoe-shaped cross-section and four aerators at varying intervals (Figure 2). Each of the three upstream aerators is composed of both an offset and a deflector. All the offsets are 1.5 m high, and the deflectors are 0.5, 0.4 and 0.2 m high, respectively. The fourth one is shaped in a three-dimensional configuration, featuring sudden-narrowed sidewalls and a convex deflector. From up- to downstream, their protection lengths are 81.0, 87.8, 128.6, and 115.6 m, respectively. An air shaft connects each aerator to the atmosphere.
The Froude model tests were made in scale λ = 30. The air flow from the model tests was converted to the prototype by the same scale as the water flow (i.e., upscaled by λ2.5). After the competition, efforts were made to perform prototype measurements of air flow rate, cavity pressure, air concentration, etc., which provided valuable information to the engineering profession. A comparison is made between the prototype and model results of air demand at the design discharge Q = 3200 m3/s. The results show that, at aerators No. 2 and 4, the prototype values are 3.4 and 2.3 fold the model ones, respectively. Air demand in the prototype is considerably larger than the upscaled values from the model.
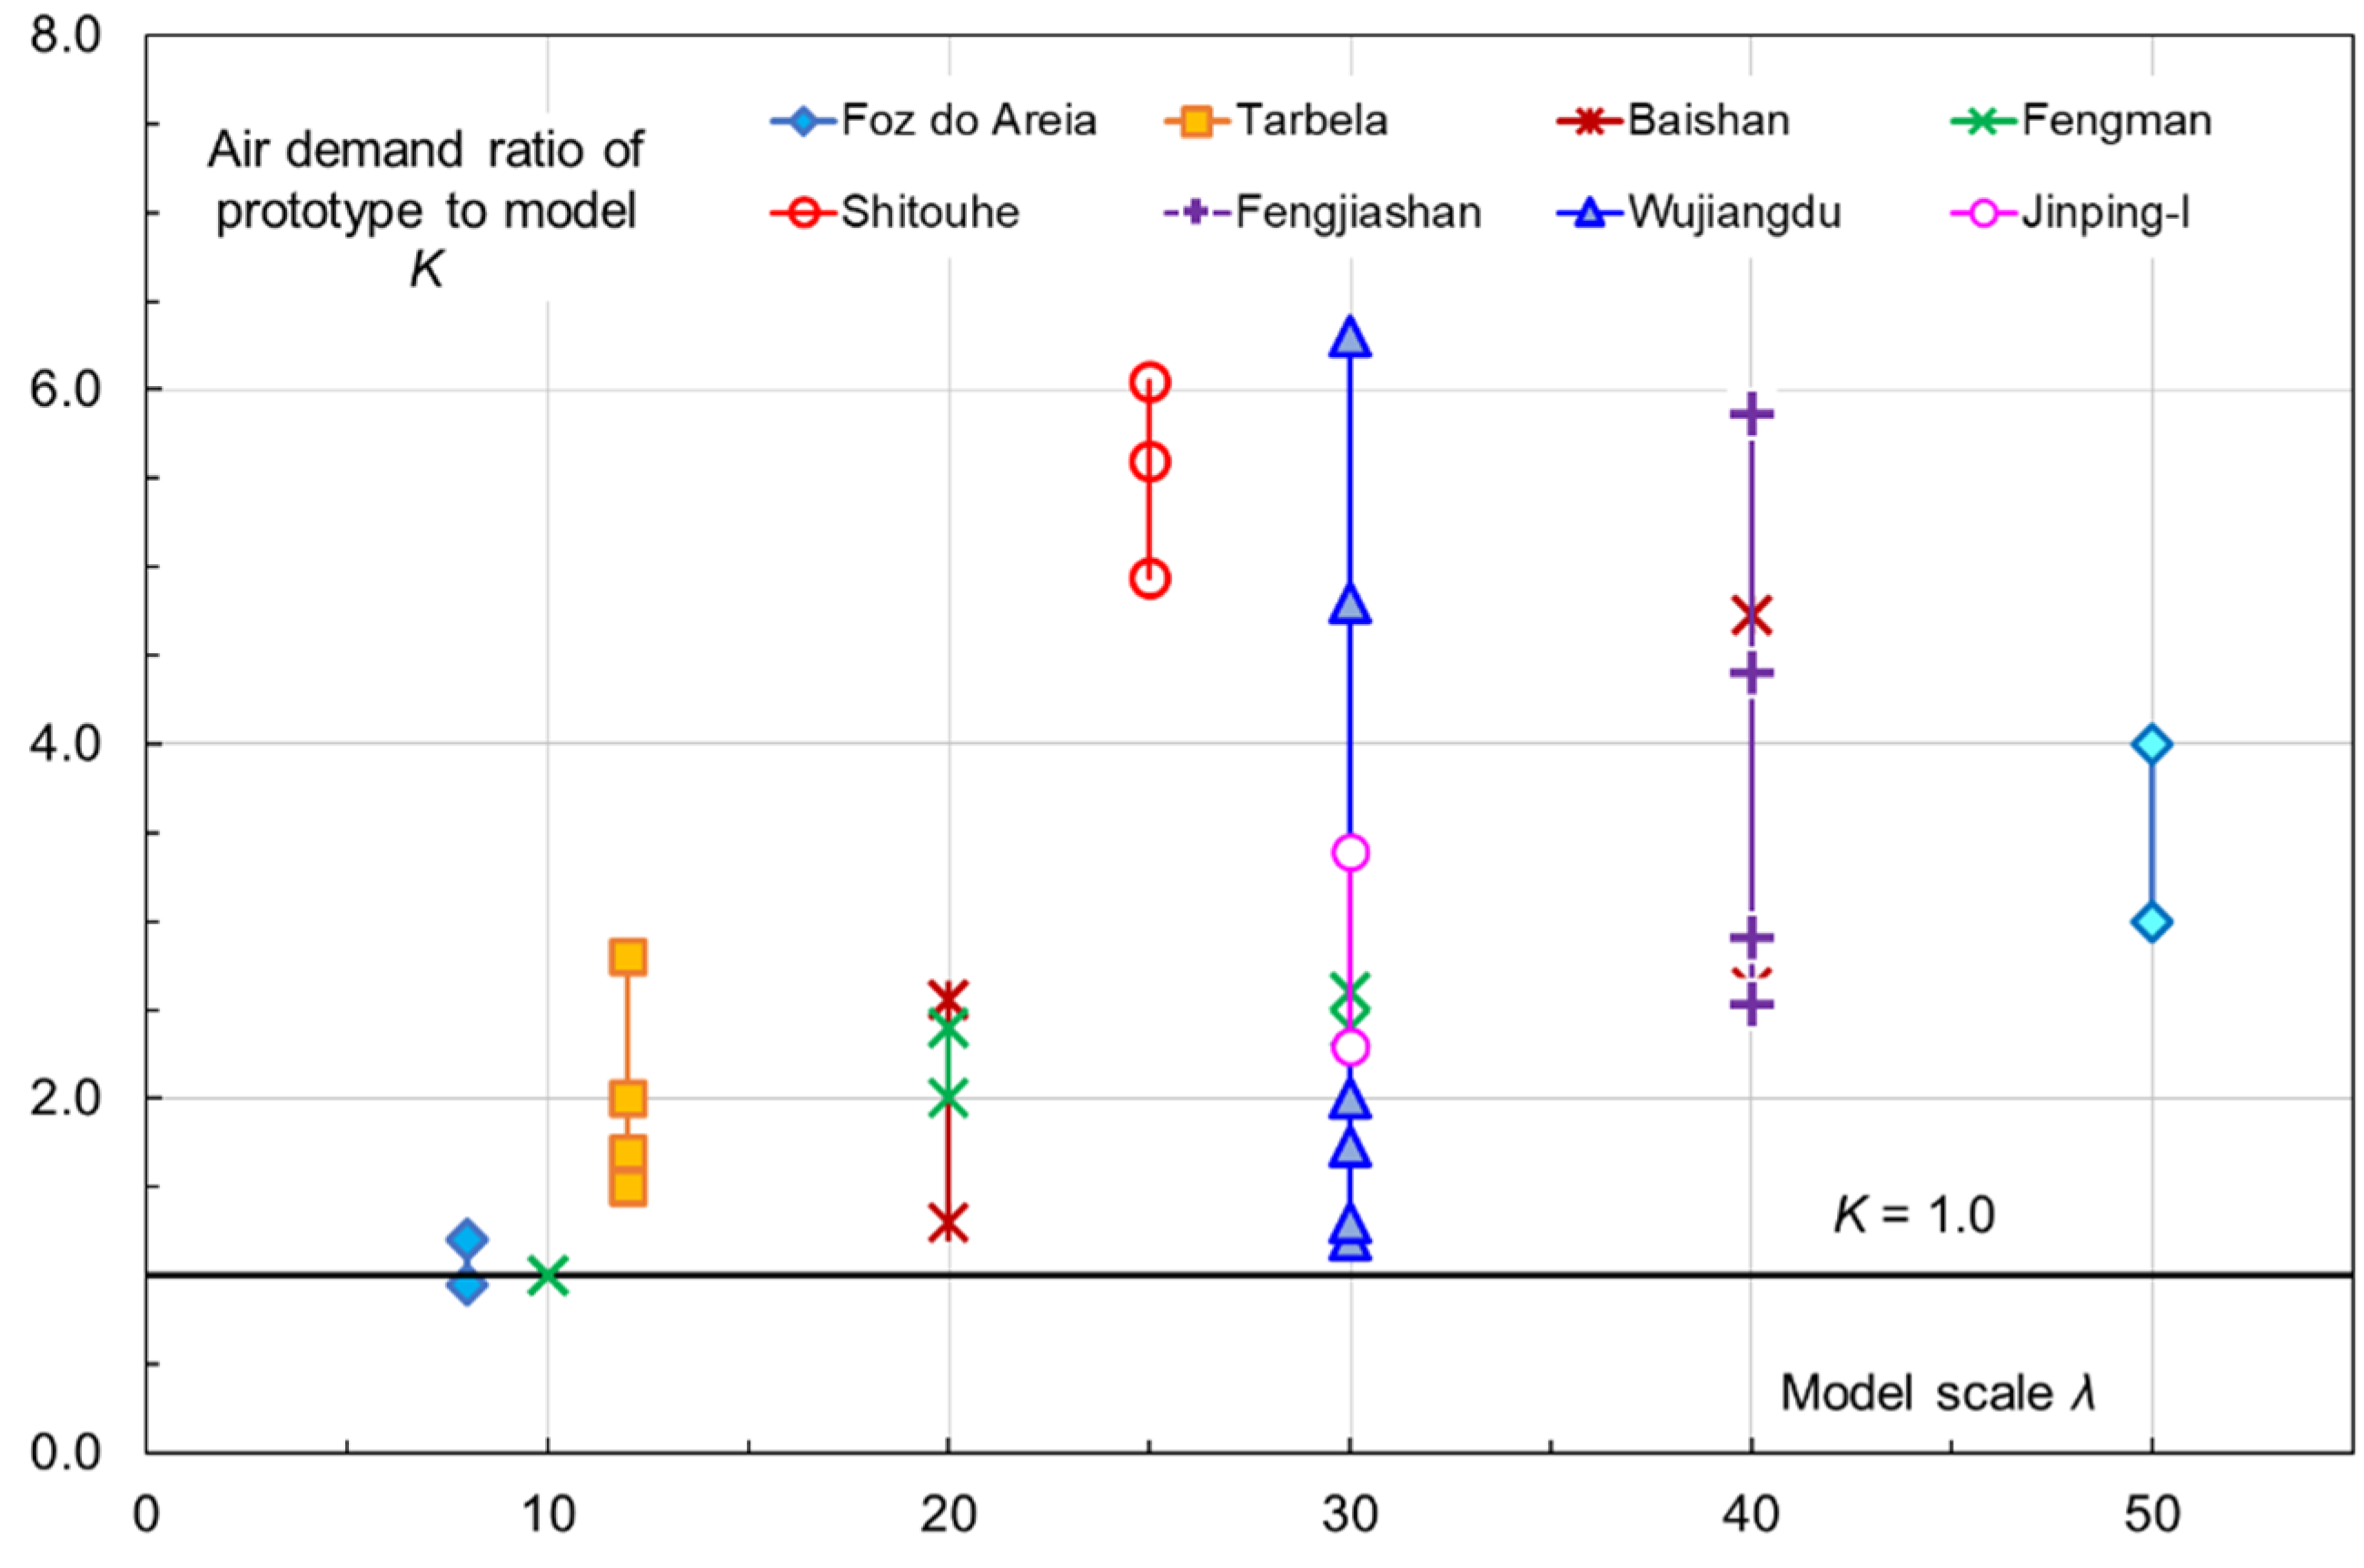
Figure 8 compares the model scale-based K results for aerators in eight facilities including Jinping-I [15], in which K = air-demand ratio of prototype to model. A very small model can hardly predict the air flow. Like the Baishan spillway, λ = 70, K = 14.6 and it is excluded in the plot. Depending on the model scale, the air demand can differ by a factor of up to 4–7. For the model tests performed for Foz do Areia (λ = 8) and Fengman (λ = 10), the models match the prototype behaviors (K ≈ 1). Pinto and Neidert [22], Tan [24] and Lian et al. [15] suggest that a model dimension be sufficiently large (λ ≤ 10) to make correct predictions. However, the statement is not theoretically strict. As a matter of fact, it is the water flow velocity and not solely the model scale that dictate the air flow in the model. For example, for low-head aerators, even the model size is large (λ < 10), the conversion would still lead to significant errors.
The results in Figure 8 demonstrate the effects of model scales on air flow. For the same model, the air flow is also dependent on the approach flow conditions. Based upon the data for five aerators collected by Shi [12] and Foz do Areia aerator by Pinto and Neidert [22], Figure 9 presents the model–prototype correlation in another constellation, i.e., the K changes as a function of the logarithmic Reynolds number, ln(R). Except for Fengman aerator, several flow cases are available for each model scale. At low ln(R) values, K is meaninglessly large. K approaches K = 1 with an increase in R. Excluding the Foz do Areia results, Shi [12] provides a K-Ln(R) relationship:
If Ln(R) ≥ 14.3, i.e., R ≥ 1.58 × 10⁶, thus K = 1, implying that the flow velocity exceeds 7.5 m/s and the air flow rate can be converted from model to prototype in light the Froude law. If 13.6 < Ln(R) < 14.3, i.e., 0.85 × 10⁶ < R < 1.58 × 10⁶, thus K is within the range 1.0–1.86 and direct would give rise to errors. If R becomes even smaller, the flow velocity falls below 4.0 m/s and more significant errors are introduced.
4. Threshold Velocity of Approach Flow
The aerator experiments were performed in a large test rig at the Institute of Water Resources and Hydropower Research (IWHR), Beijing [12,34,35]. It was specifically designed for tests of chute aerators subjected to high flow velocities. The layout is shown in Figure 10. The chute was 15.0 m long and 0.20 m wide, with both sides bounded by Plexiglas walls. Its slope was designed to be variable, within the range α = 0–49°. Both ends of the flume were equipped with wheels that moved along their respective horizontal and vertical rails. Driven by a servomotor, it could be locked at any desired position. At its max. angle, the upper chute end was positioned ~13 m above the floor. At the chute base, an air duct (groove) was built to cover the chute width, without any offset but with replaceable deflectors. A pipe of sufficiently large diameter was connected to the duct on each side, through which air was sucked into the cavity. The deflector height s = 3–25 mm, with a constant ramp angle, tanθ = 1:10.
In the rig, Q was adjustable, with a maximum of 0.342 m3/s. It was measured using a flow meter and an overflow weir. Their relative measurement errors were less than ±3% and ±1%. Air was supplied to the cavity through a lateral duct, with Qa = 0.0756 m3/s at maximum. Qa was determined by a calibrated airflow anemometer, with an inaccuracy within ±(1.5–2)%. A propeller-type water-flow velocimeter measured the flow velocity in the flume, with an inaccuracy level of below ±(2–4)%. Water depths were directly measured with a point gauge and referred to the depth in the direction perpendicular to the flume. For a given cross-section, the obtained water-depth result was also checked against Q and its flow velocity. Measurements of flow velocity and water depth were made in the so-called black-water area upstream from the air cavity. The approach flow velocity and depth, measured at the end of the deflector, amounted to V = 6.6–15.4 m/s and D = 0.050–0.251 m, respectively. F = 4.34–21.90, R = (0.69–1.41) × 106 and W = 325–490. Data affected by air entrainment from the upper free surface are excluded.
Together with the field data from two prototype spillways (Baishan and Fengjiashan) and their corresponding scale models [12], Figure 11 presents, as a β1-X relationship, the flume test results, in which:
The results demonstrate that, if the approach velocity V in the models exceeds 7.5 m/s, the upscaled results coincide with the prototype data; the model velocity within the range V = 6.6–7.02 m/s gives close results. In Figure 12, the model–prototype results are compared for Foz do Areia spillway aerator. For λ = 8 and 15, their model velocity is higher than 7.5 m/s; the air flow results from either model can be reasonably upscaled to its prototype. The smaller models in λ = 30 and 50 differ significantly from their prototype.
Air entrainment in a water surface is pronouncedly affected by the magnitude of flow velocity. If the flow velocity reaches a critical value, air entrainment can be converted from model to prototype. This is often referred to as the threshold flow velocity (Vc) for air entrainment in free surface flows including the aerator flow. In the literature, three classical theoretical explanations are found.
- (1).
- Based on the relative flow motion between water and air in an open channel, Vojnovich and Schwartz [36] attributed the air entrainment mechanism to surface water fragmentation and concluded that Vc = 6.92–7.05 m/s.
- (2).
- Considering the turbulence intensity of water-air interface, the research work performed by Wood [37] led to Vc = 6.25–7.50 m/s.
- (3).
- Based upon the eddy energy approach and in combination with his experimental measurements, Yang [38] showed that Vc = 7.05–7.48 m/s for jet flows.Although some differences exist due to different analytical assumptions and experimental conditions, the commonly used range is Vc = 7.00–7.50 m/s.
For estimation of the air demand, the IWHR experiments gives [12]:
which is valid for V ≥ Vc = 7.00–7.50 m/s. The formula can be used for estimation of air demand in prototype facilities. For engineering design, the air demand per unit width is often expressed in the form.
where K0 = empirical coefficient and L = air cavity length, referring to the distance from the aerator offset to the reattachment point (maximum flow pressure) on the chute bottom. A partial list based on about 10 prototype spillways is given by Shi [12] and Lian et al. [15]. With exception of a large value at Guri dam (K0 = 0.074), K0 ranges between 0.010 and 0.041, which is still significant. K0 depends obviously on both geometrical layout and flow conditions at the aerator. Note also that the L definition varies in different studies. It may be based on visual observations, air concentration criterion or maximum (stagnation) pressure acting on chute bottom.
It should also be pointed out that empirical or semi-empirical formulas for aerator flow estimations are many. Some are based on prototype observations and others on laboratory tests, between which a distinction should be made. The former should be more reliable than the latter. Especially, one should pay attention to those results which spring from model tests with velocities (well) below Vc = 6.50–7.50 m/s. A detailed experimental description of aerator water-air flow features is found in Hager et al. [39]. The book written by Shi [12] contains a compilation of detailed flume test data of varying aerator configurations, results from spillway aerator models for different dams and, most of all, invaluable field observation data from quite a few existing dam facilities.
5. Pressure Drop in Air Cavity
As an essential design parameter, the air-cavity pressure drop (Δp) is also an indicator of the aerator behavior. As documented by Marcano and Patiño [40,41] and cited by Pfister [9], the Guri Dam in Venezuela was heightened from 100 to 150 m, thus steepening the spillway chute. To counteract this, a deflector was provisionally added (s = 0.14 m), however without transverse groove over the 48 m chute width. Studies showed Δp changed from 40 to 66 kPa with an increase in unit discharge from 18.8 to 100 m2/s. Model tests confirmed that the air cavity zone was choked, with Δp ≈ 70 kPa at the maximum flow per unit width 125 m2/s. Afterwards, the deflector was improved, with s = 0.37 m and θ = 5°, which enlarged the transverse cavity in cross section and allowed for more air flow to reach the chute center. Δp varied thus between 5 and 18 kPa within the same discharge interval. 95 days of spillway operation did not see any cavitation damages. The final aerator design included the 0.37 m deflector and a large bottom offset, with an air gallery supplying air from inside the dam [42].
In the laboratory experiments at IWHR [12], high flow velocity was achieved, with F = 4.34–21.90. Δp was below 0.6 kPa in most tests, its maximum corresponded to 0.8 kPa. Many other model test studies provided also Δp results. However, due to small model sizes, they are not included here. For the chute aerators at Fengjiashan, WuJiangdu and Ertan, prototype air pressure measurements were made, with Δp = 4.1, 4.0 and 5.8 kPa at maximum. Prototype measurements of several other aerators indicate that Δp = 4.0–8.0 kPa [12]. It can be stated that Δp in a prototype aerator often differs by a factor of less than 10 from that in its reasonably large model with sufficient air supply. Suppose that less air is supplied in a scale model, a somewhat larger pressure drop is thus generated. As a result, the jet trajectory is bent more downwards, which in turn shortens the trajectory and curtails the air demand. Nevertheless, the cavity air pressure is not scaled in the model; neither can it be converted to its prototype.
For tunnel aerators, the cavity sub-pressure can be lower than in surface chute aerators due to long air supply passage (shaft). The results of field measurements in Jinping-I flood tunnel [15] is representative, in which dynamic air-pressure transducers are used. Figure 13 plots the results. In both aerators, Δp increases with an increasing flow rate. At high discharges, it remains almost unchanged as Q varies from 2130 to 3200 m3/s. Within the discharge range tested, Δp = 6.26 to 15.77 kPa.
Lacking air, the aerator would not “breathe” freely, which results in undesirable sub-pressure and can even actively provoke cavitation and cause local damages. It is thus essential to pay attention to the air supply system, so that enough air is provided without resulting in significant pressure drop. An aerodynamic design of the system is thus necessary, typically by providing large cross-sections. Furthermore, the transversal air flow distribution in the cavity is of importance to feed the whole chute width with air. If necessary, air can be supplied into the cavity via air vents at a number of transversal locations, especially if the chute is wide [14,43].
6. Chute Bottom Air Concentration
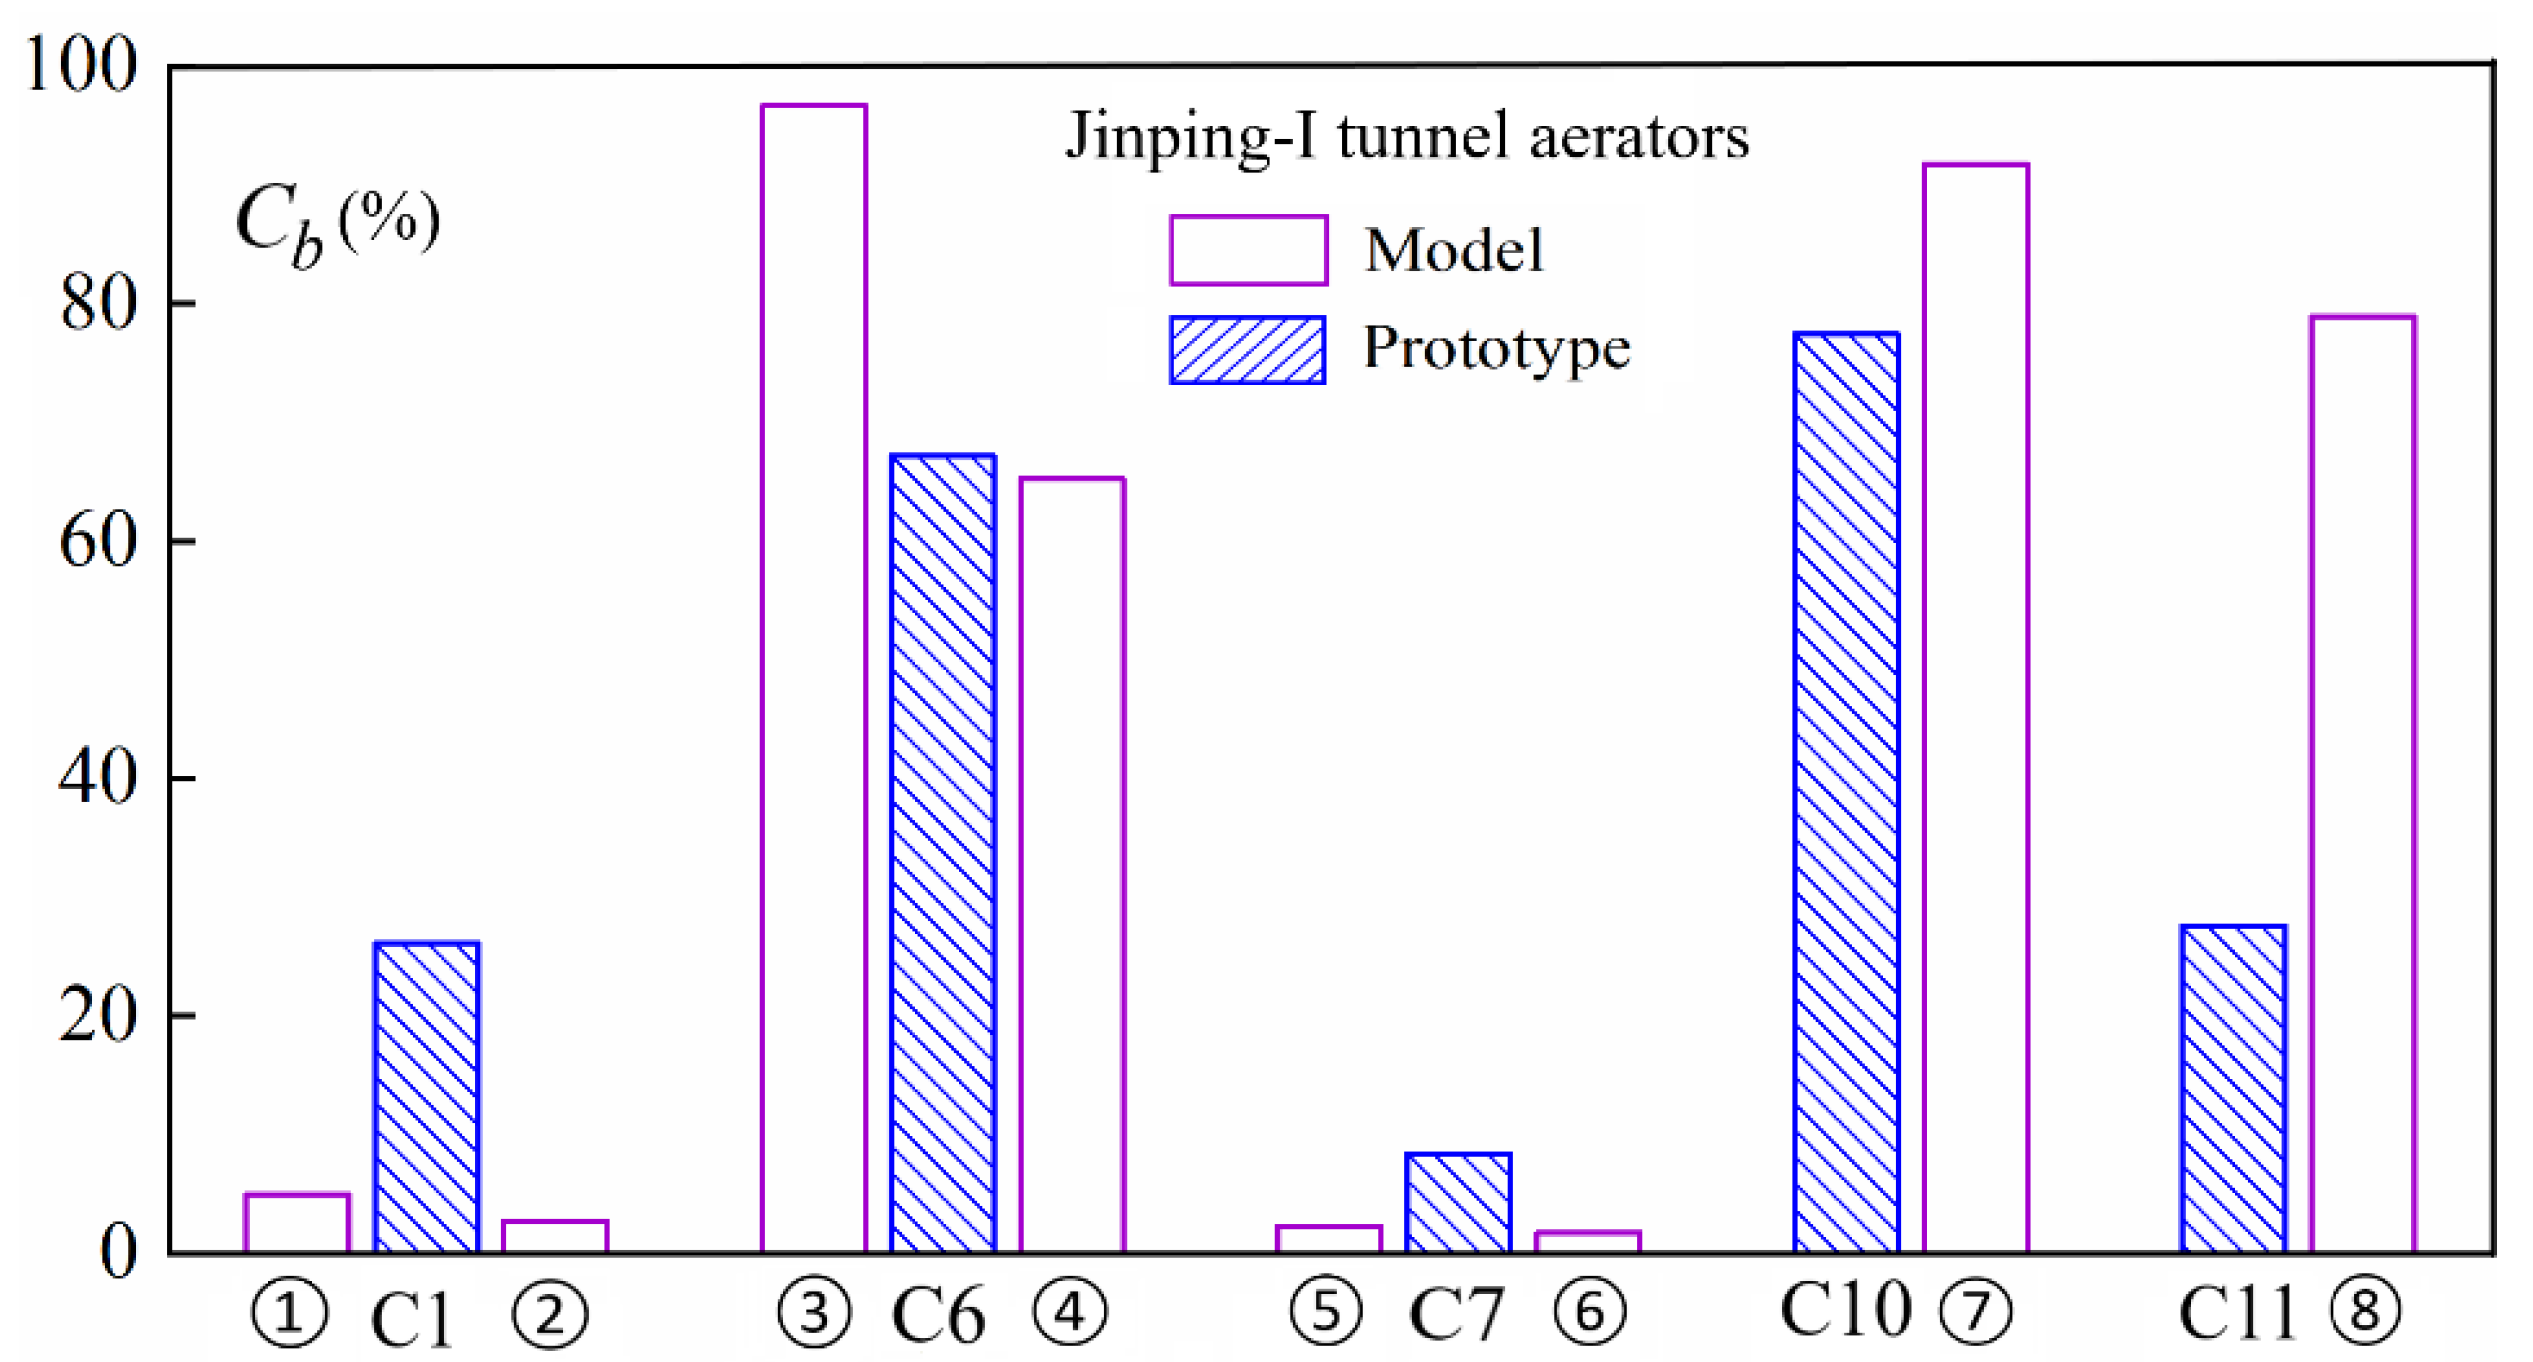
Determination of near-bottom air concentration (Cb) and its streamwise development is the major issue in aerator design and concerns the prediction of the chute length protected by an aerator. The data from the Jinping-I aerators [15] exemplify a generalized pattern. Figure 14 presents a comparison of Cb between its scale model and prototype. C1, C6, C7, C10 and C11 are prototype monitoring stations, with their approximate locations shown in Figure 2. Points ①–⑧ are model measurement points in the vicinity of their respective prototype locations. ①, ③ and ⑤ are 1.65, 4.20 and 5.74 m upstream, and points ②, ④, ⑥, ⑦ and ⑧ are 2.00, 2.11, 8.59,1.00 and 1.51 m downstream (all in prototype size). In both model and prototype, all the points are placed along the tunnel centerline. Transducers used are of resistance type.
Examinations of the results by Lian et al. [15] show that stations C1 and C7 are downstream of their respective jet impact location. For either station, Cb is several times its model value. Though the points are not at the same positions in the model and the prototype, a direct correlation is not unreasonable. The entrained air detrains much quicker in the model because its flow velocity differs times from the prototype value. Stations C6 and C10 are right in the impact area or in the backwater within the cavity. At either station, the Cb level in the model is close to its prototype values and the concentration is high. Probably due to the difference in trajectory length between the model and the prototype, it is intricate to tell the exact locations of C11 and ⑧ relative to the impact position. This is the reason why it is not straightforward to explain the Cb levels at C11 and ⑧.
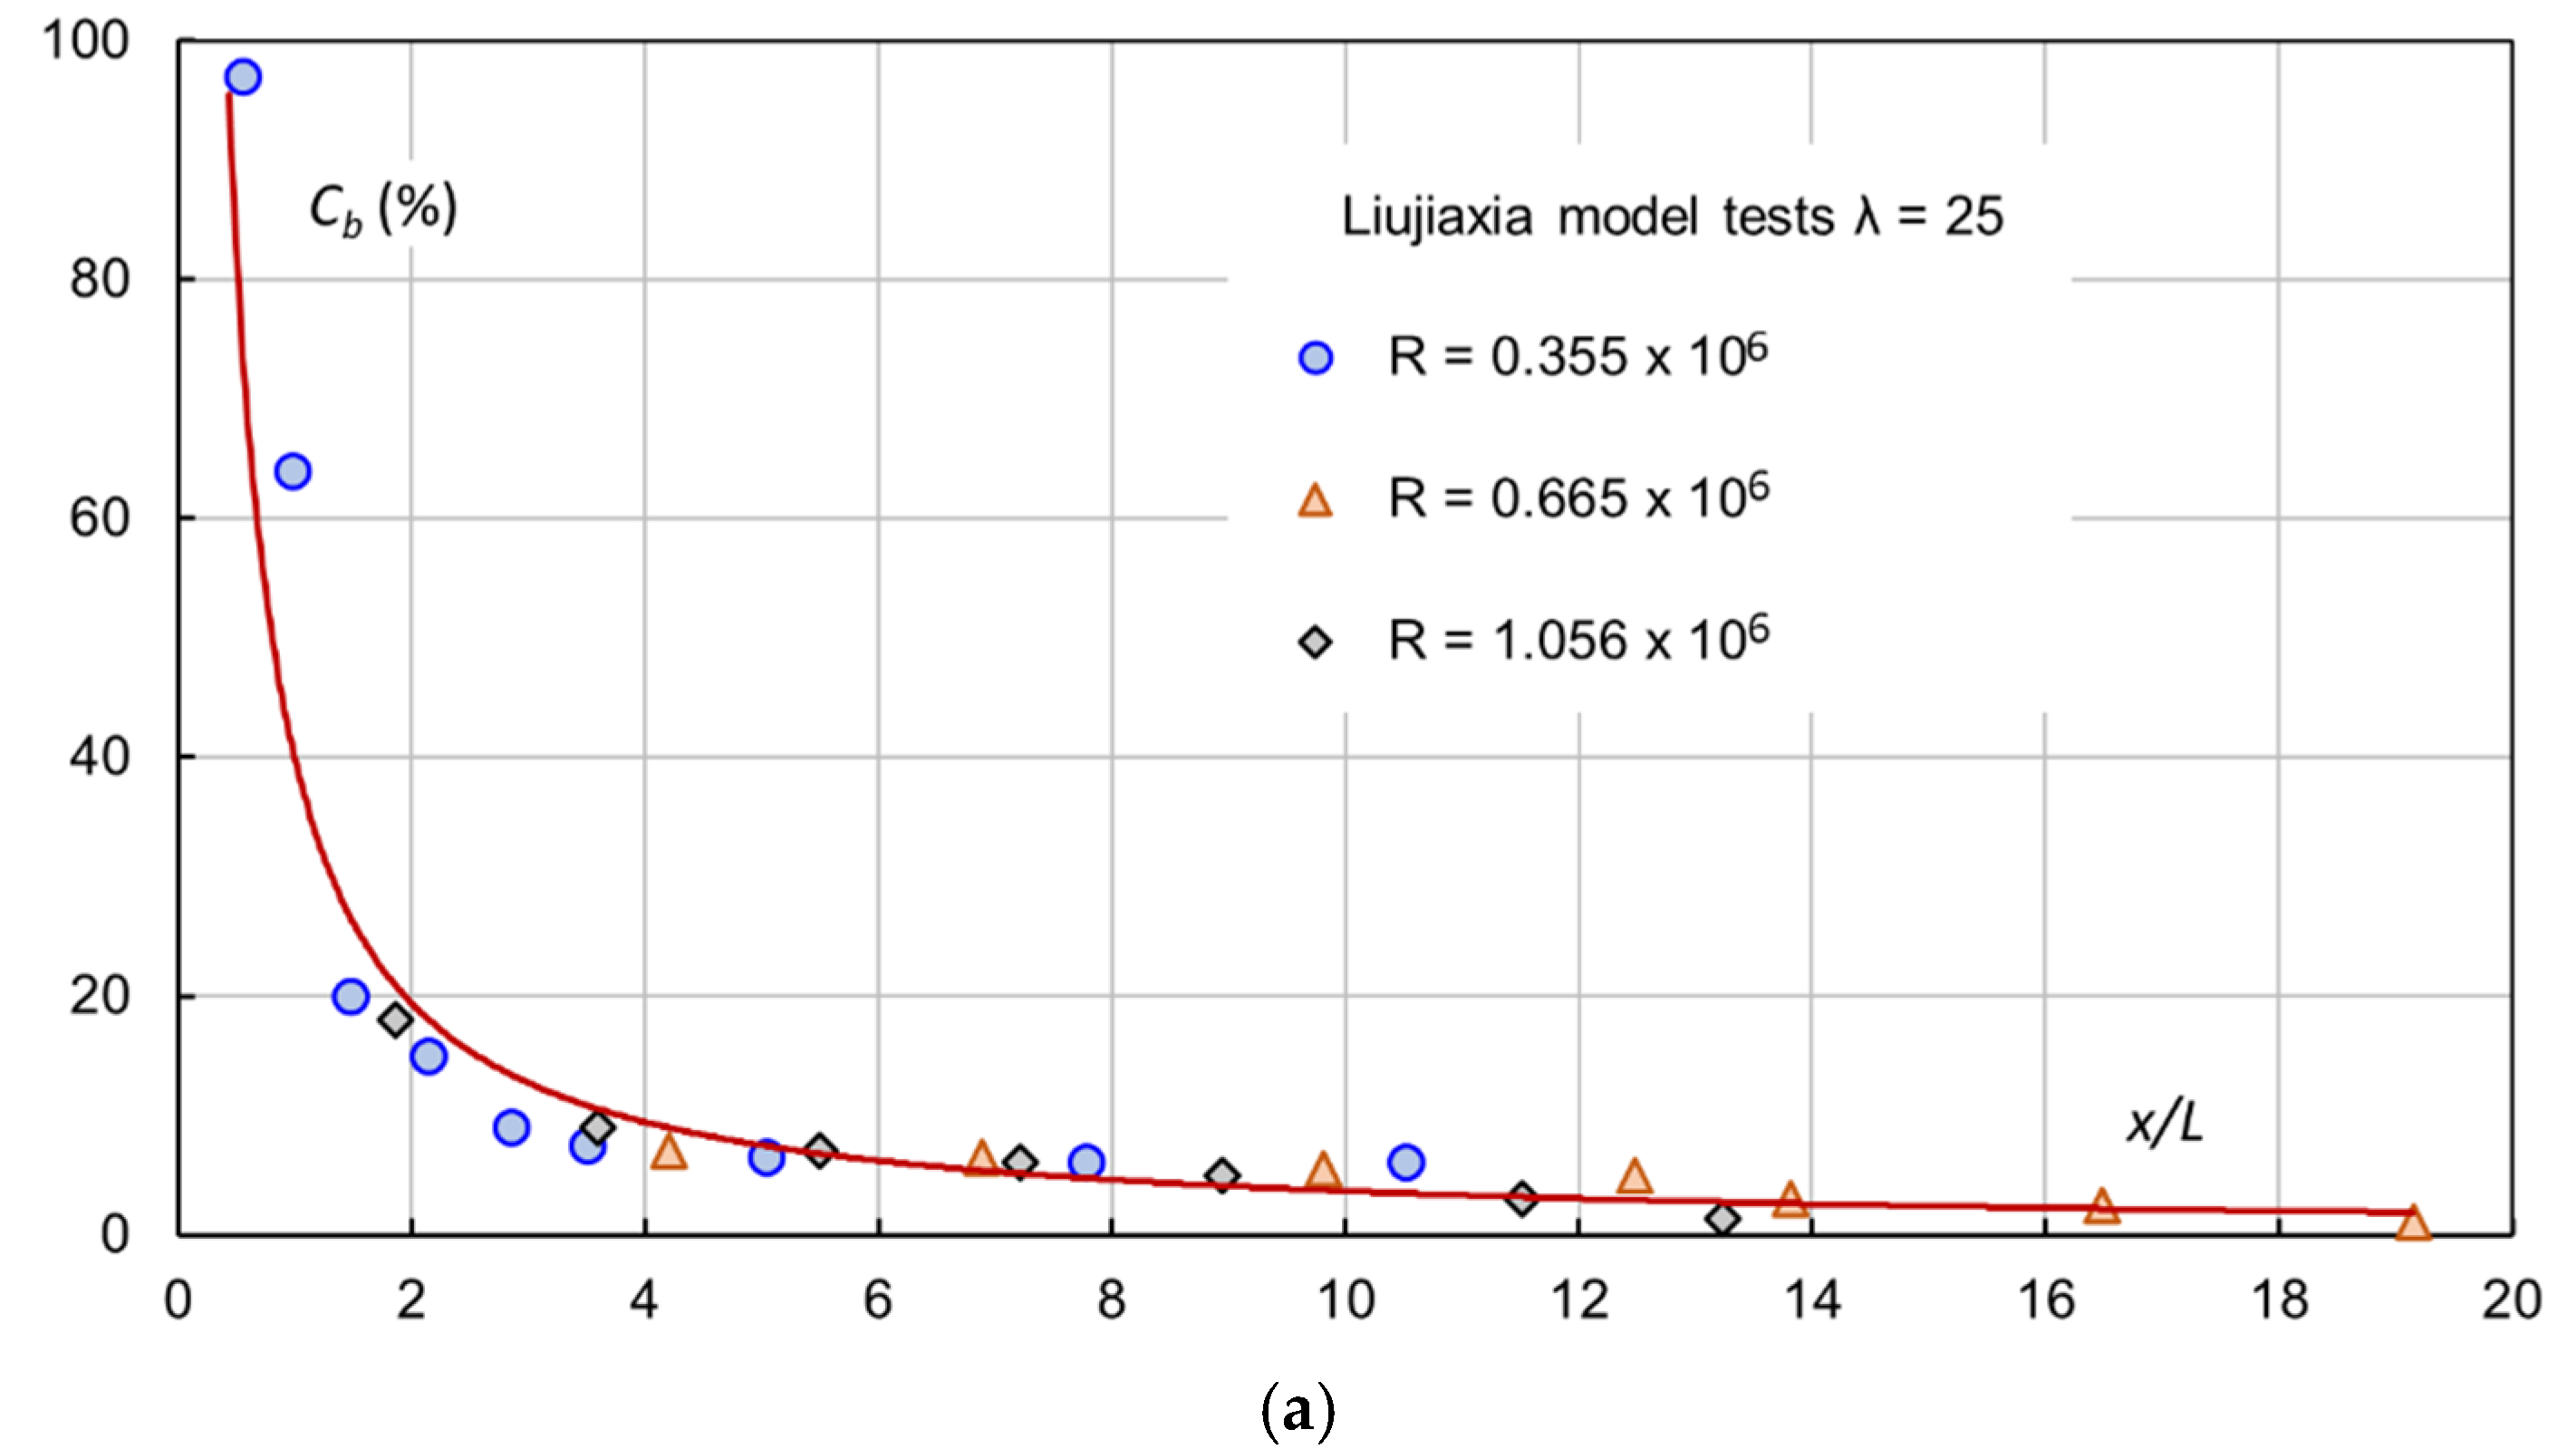
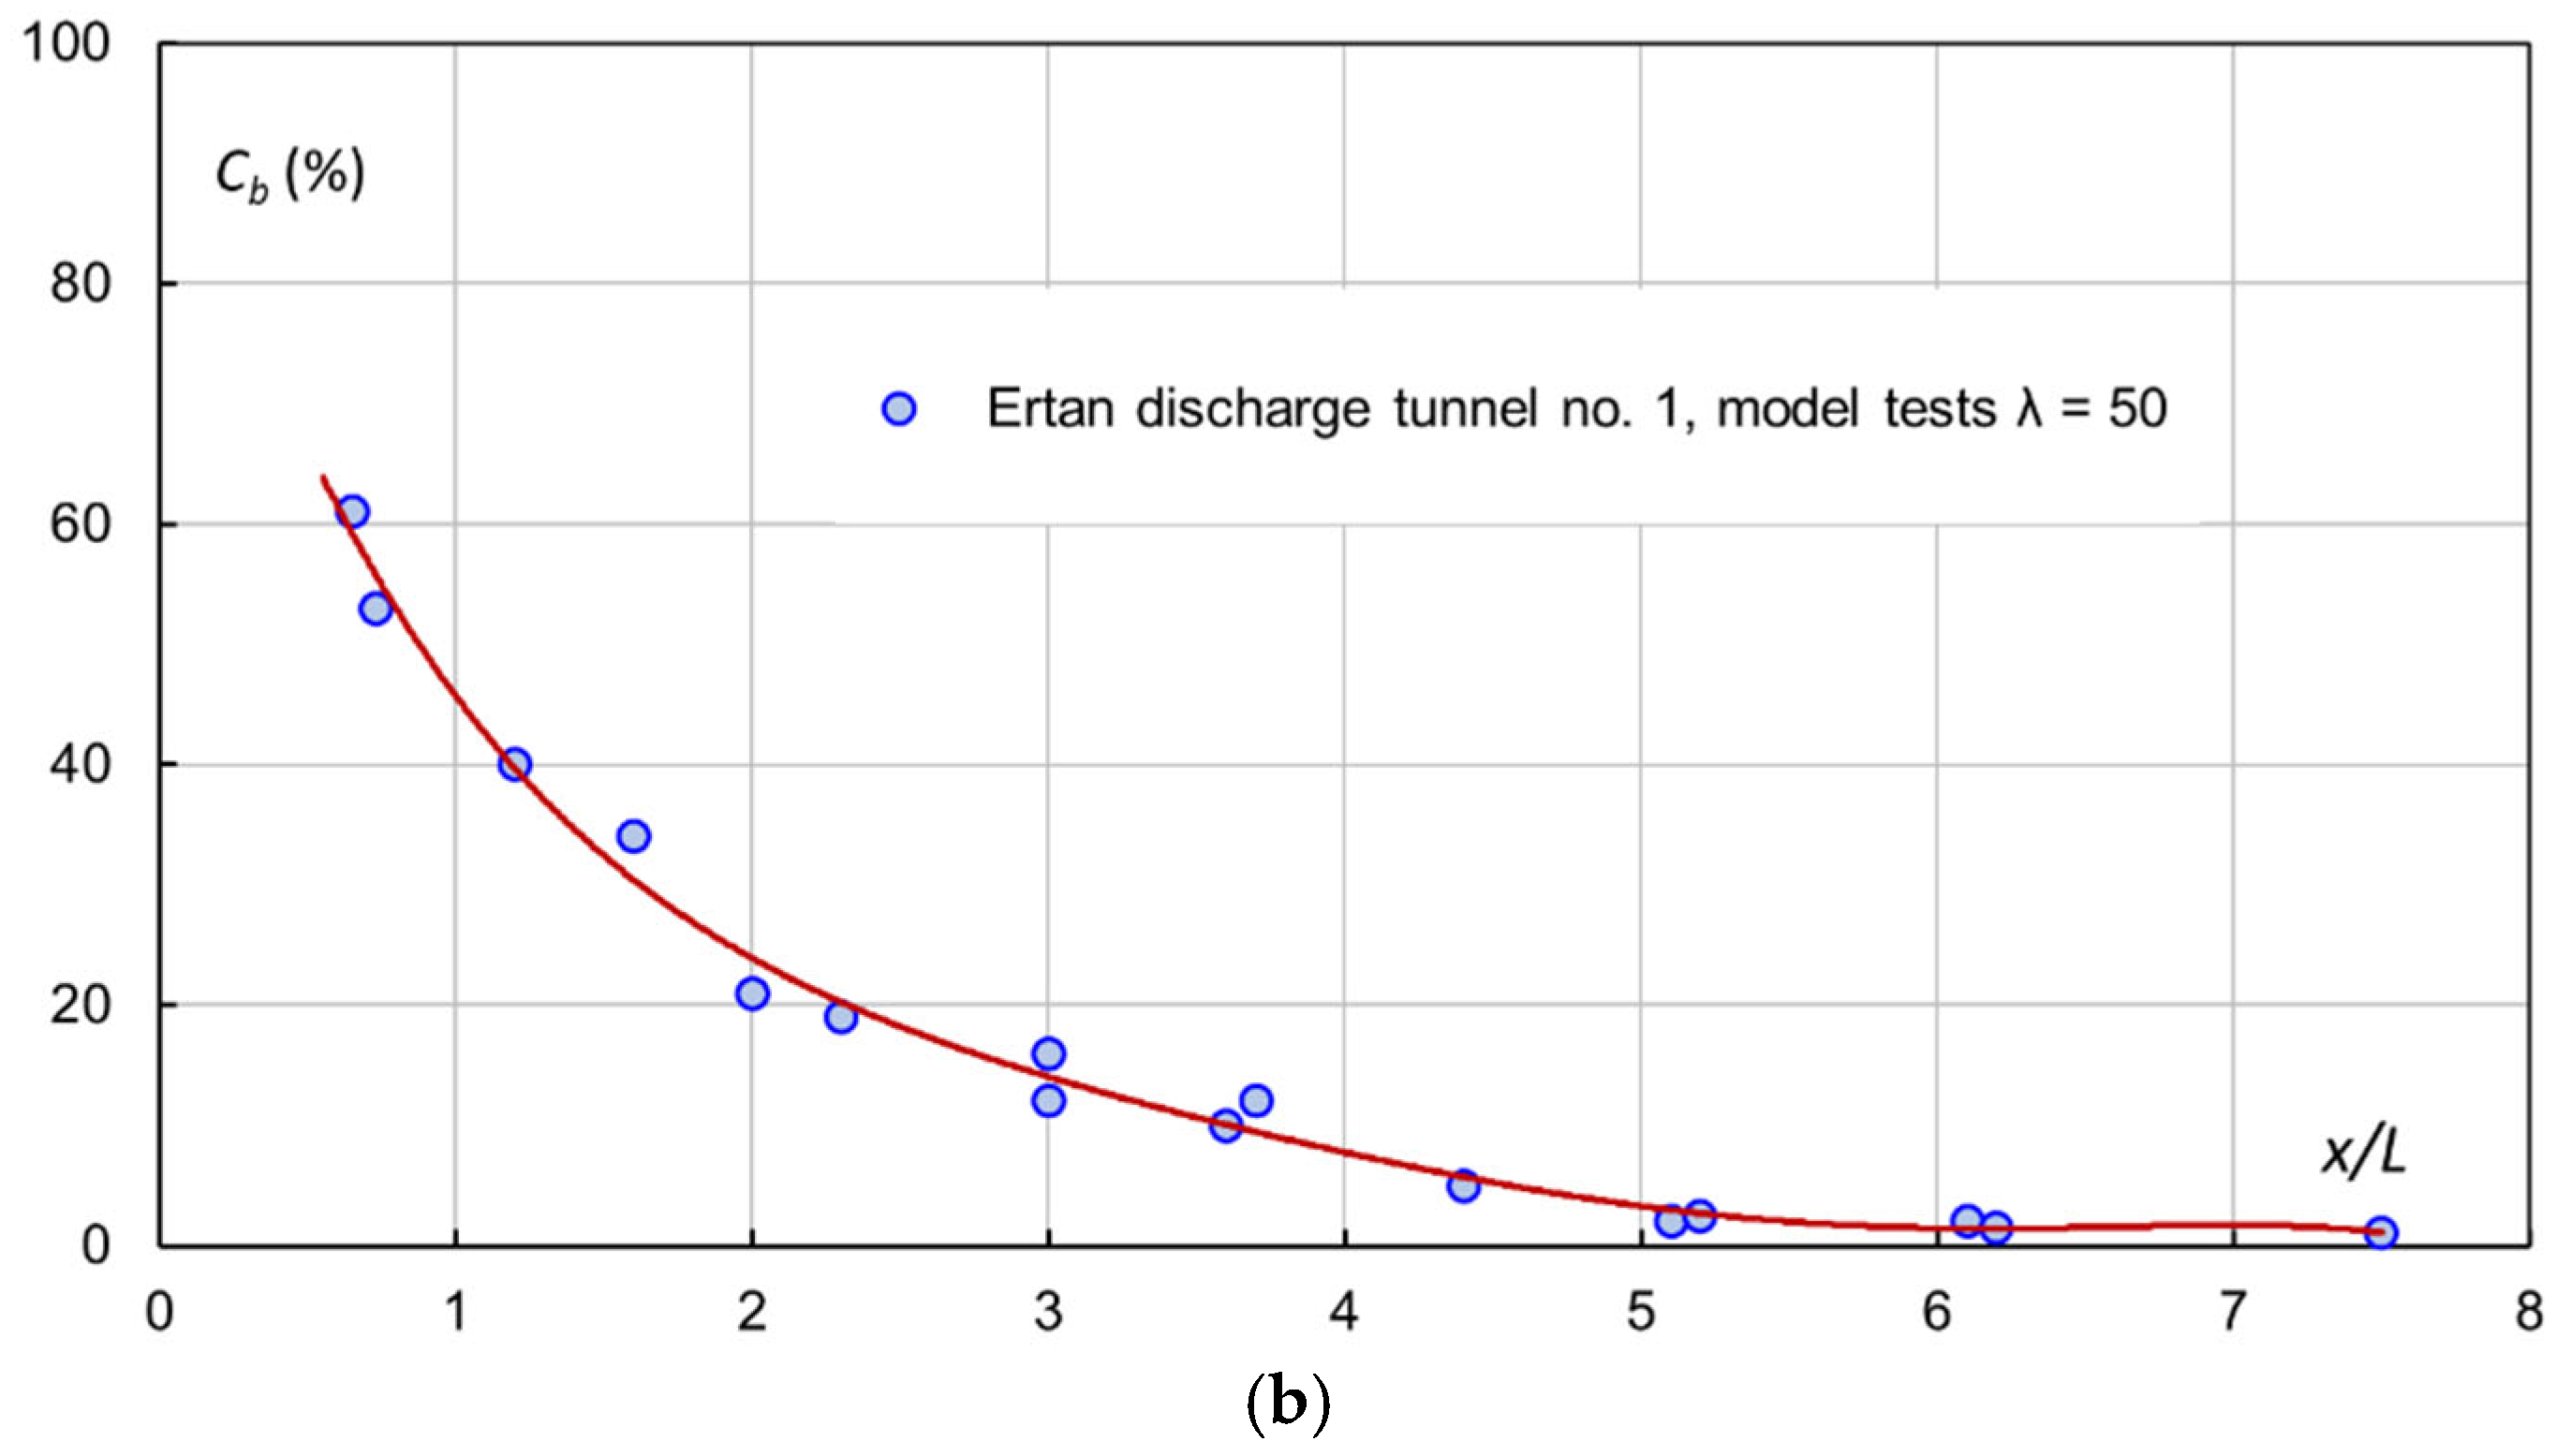
The following examples illustrate the differences in Cb and its decay between the models and the prototypes. Hydraulic model tests were performed for the aerators in Liujiaxia spillway (λ = 25) and Ertan (λ = 50), and measurements of Cb were made at several flow discharges [12]. The layout of the discharge tunnel at Ertan is shown in Figure 15. It is 926.0 m long, 13.0 m wide and 13.5 m high. As free-surface flow, the max. discharge per unit width amounts to 288 m2/s and the flow velocity can be as high as 44–50 m/s. Five aerators exist in the tunnel. The data given here refer to aerator no. 2, at t = 1.4 m, s = 0.5, tanθ = 1:12 and tanα = 7.9%. Figure 16 presents their streamwise Cb distribution from the two models, with x defined in Figure 1 or 2. No model–prototype conversion is made.
For the Liujiaxia aerator (Figure 16a), its Cb change downstream of the aerator offset can be approximated by
Similar results are found from other model tests [12]. In the models, Cb is characterized by a substantial drop within one to two cavity lengths downstream of the impact location. The chute length needed for Cb to approach zero is also moderately affected by the chute slope. Together with other model test data, it can be stated that, for the same aerator configuration, Cb exhibits a slower decay if the model size becomes larger.
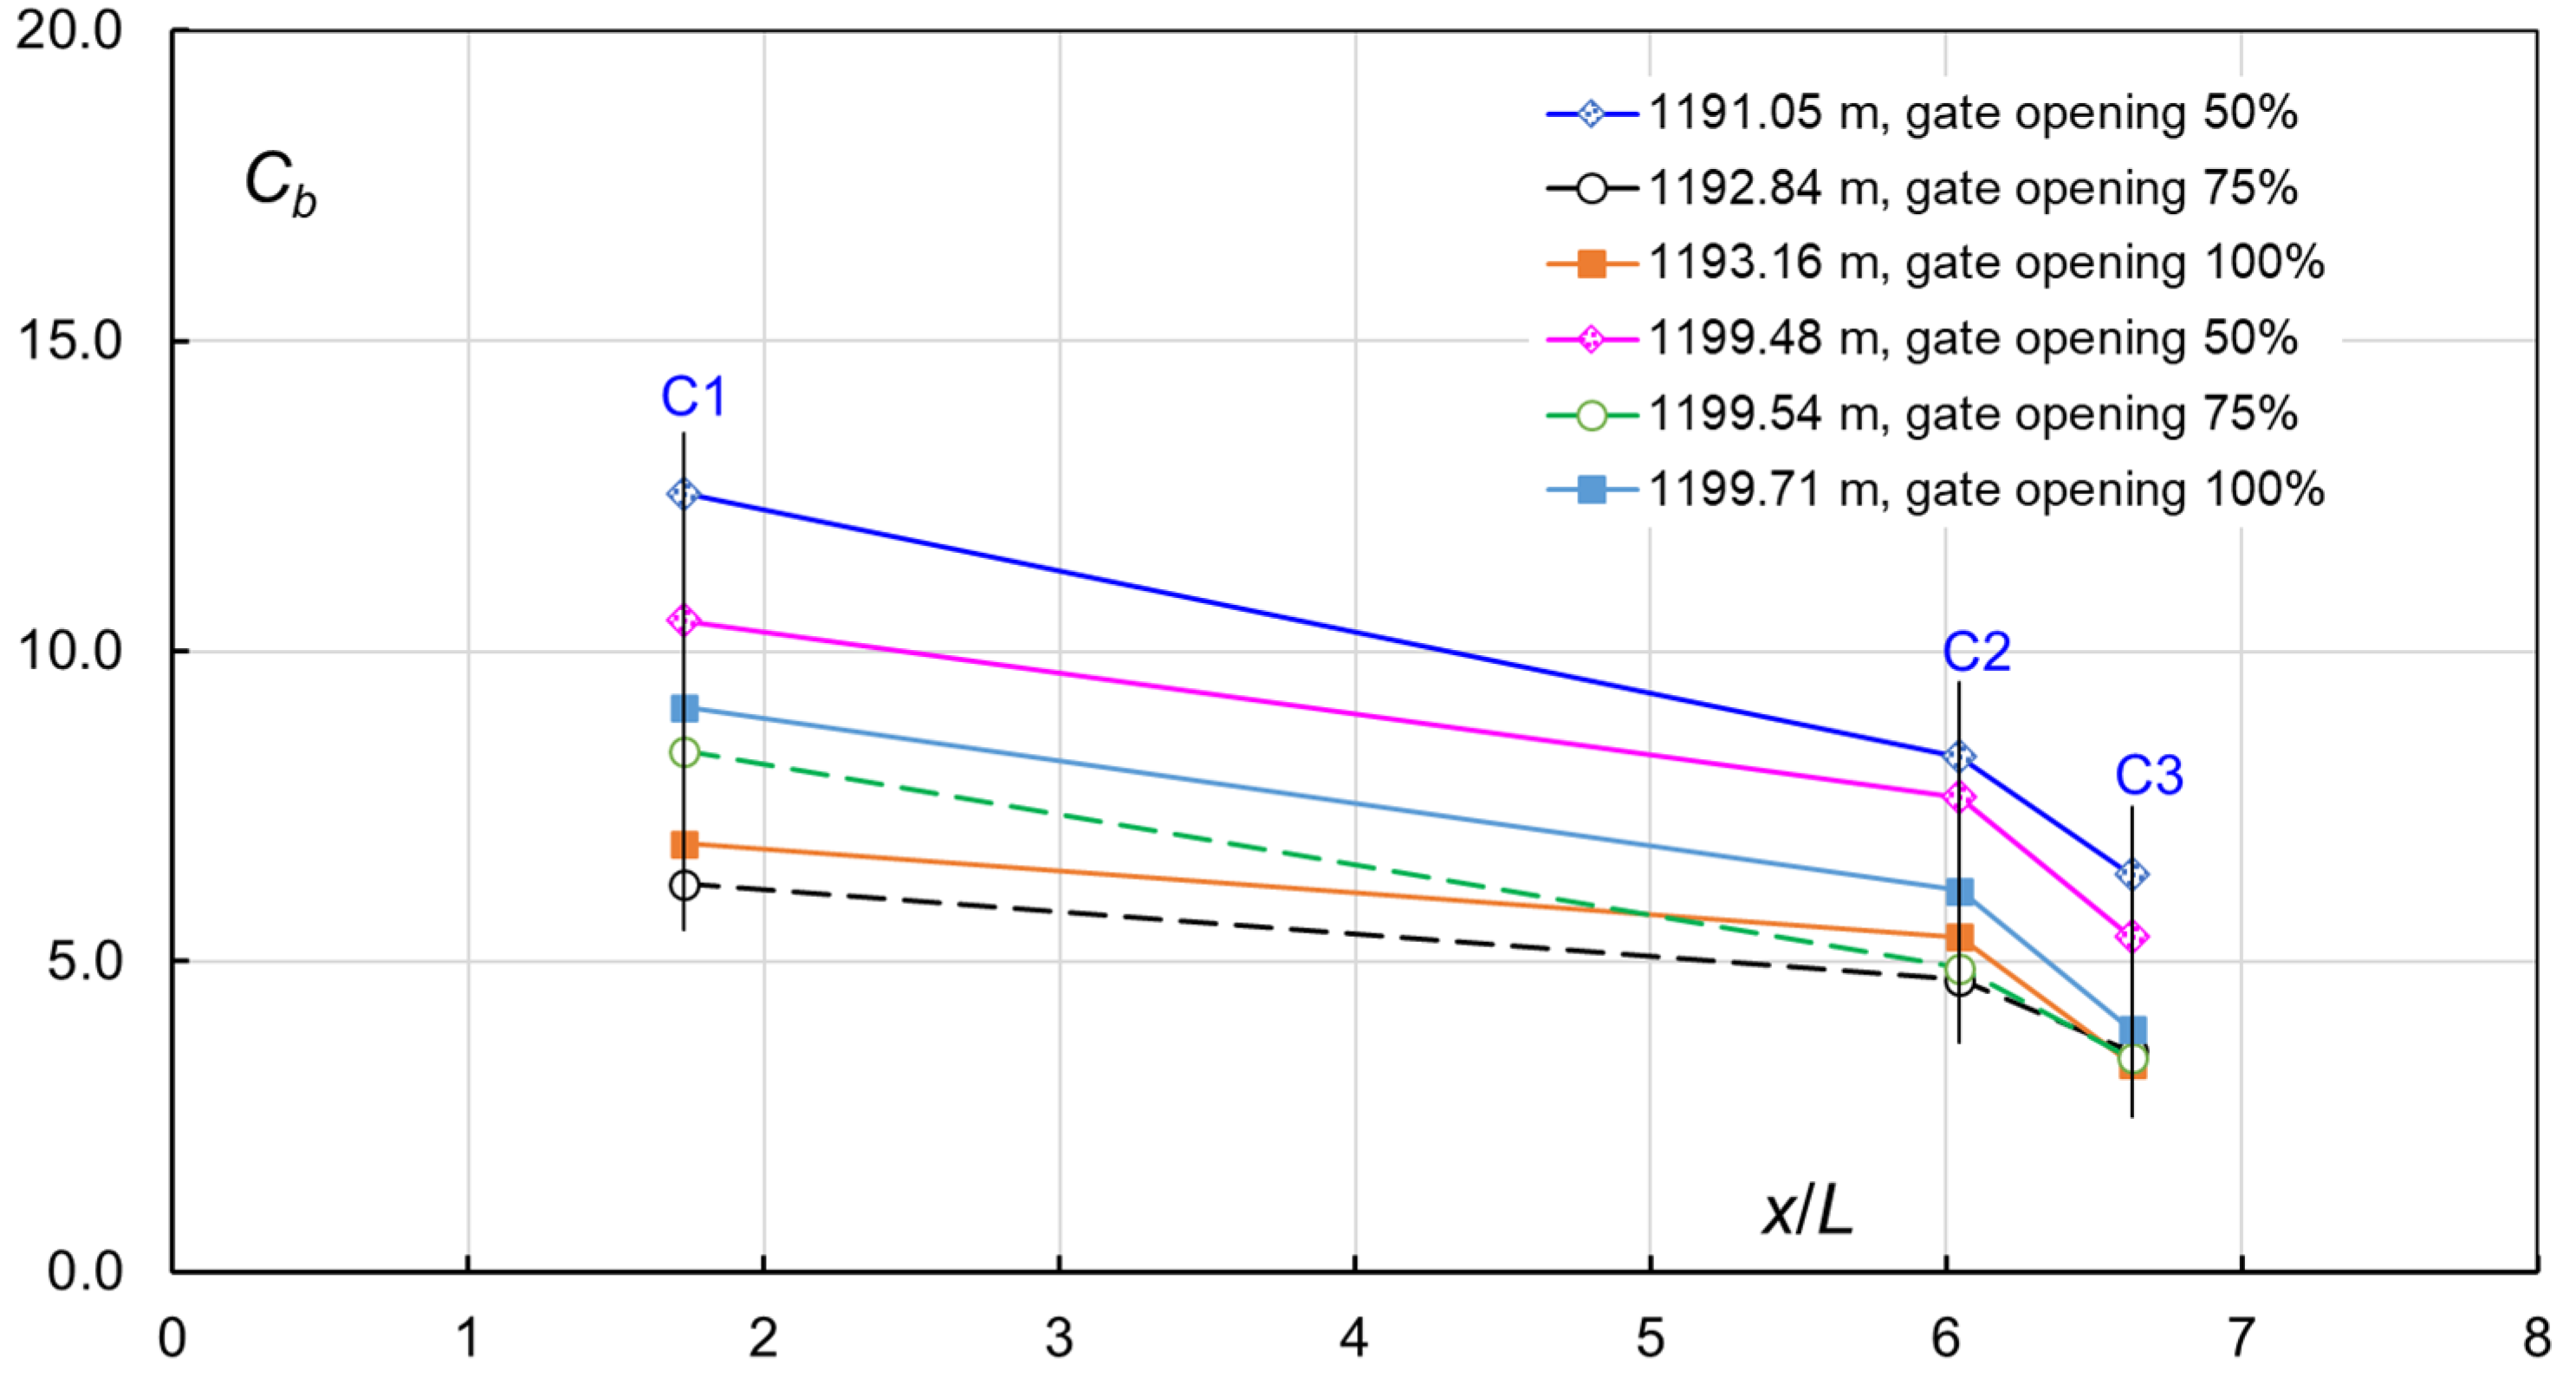
For the Ertan tunnel aerator, Figure 17 plots the prototype measurement data of Cb [12]. The gauge points C1, C2 and C3 are 51.8, 181.3 and 198.8 m from the aerator offset. C2 is right on the deflector of aerator no. 3. Several reservoir levels are tested, combined with varying gate openings. For this aerator, L = 28–32 m. Obviously, over a length of 5L (up to point C2) downstream of the impact location, Cb maintains a high level above 5%.
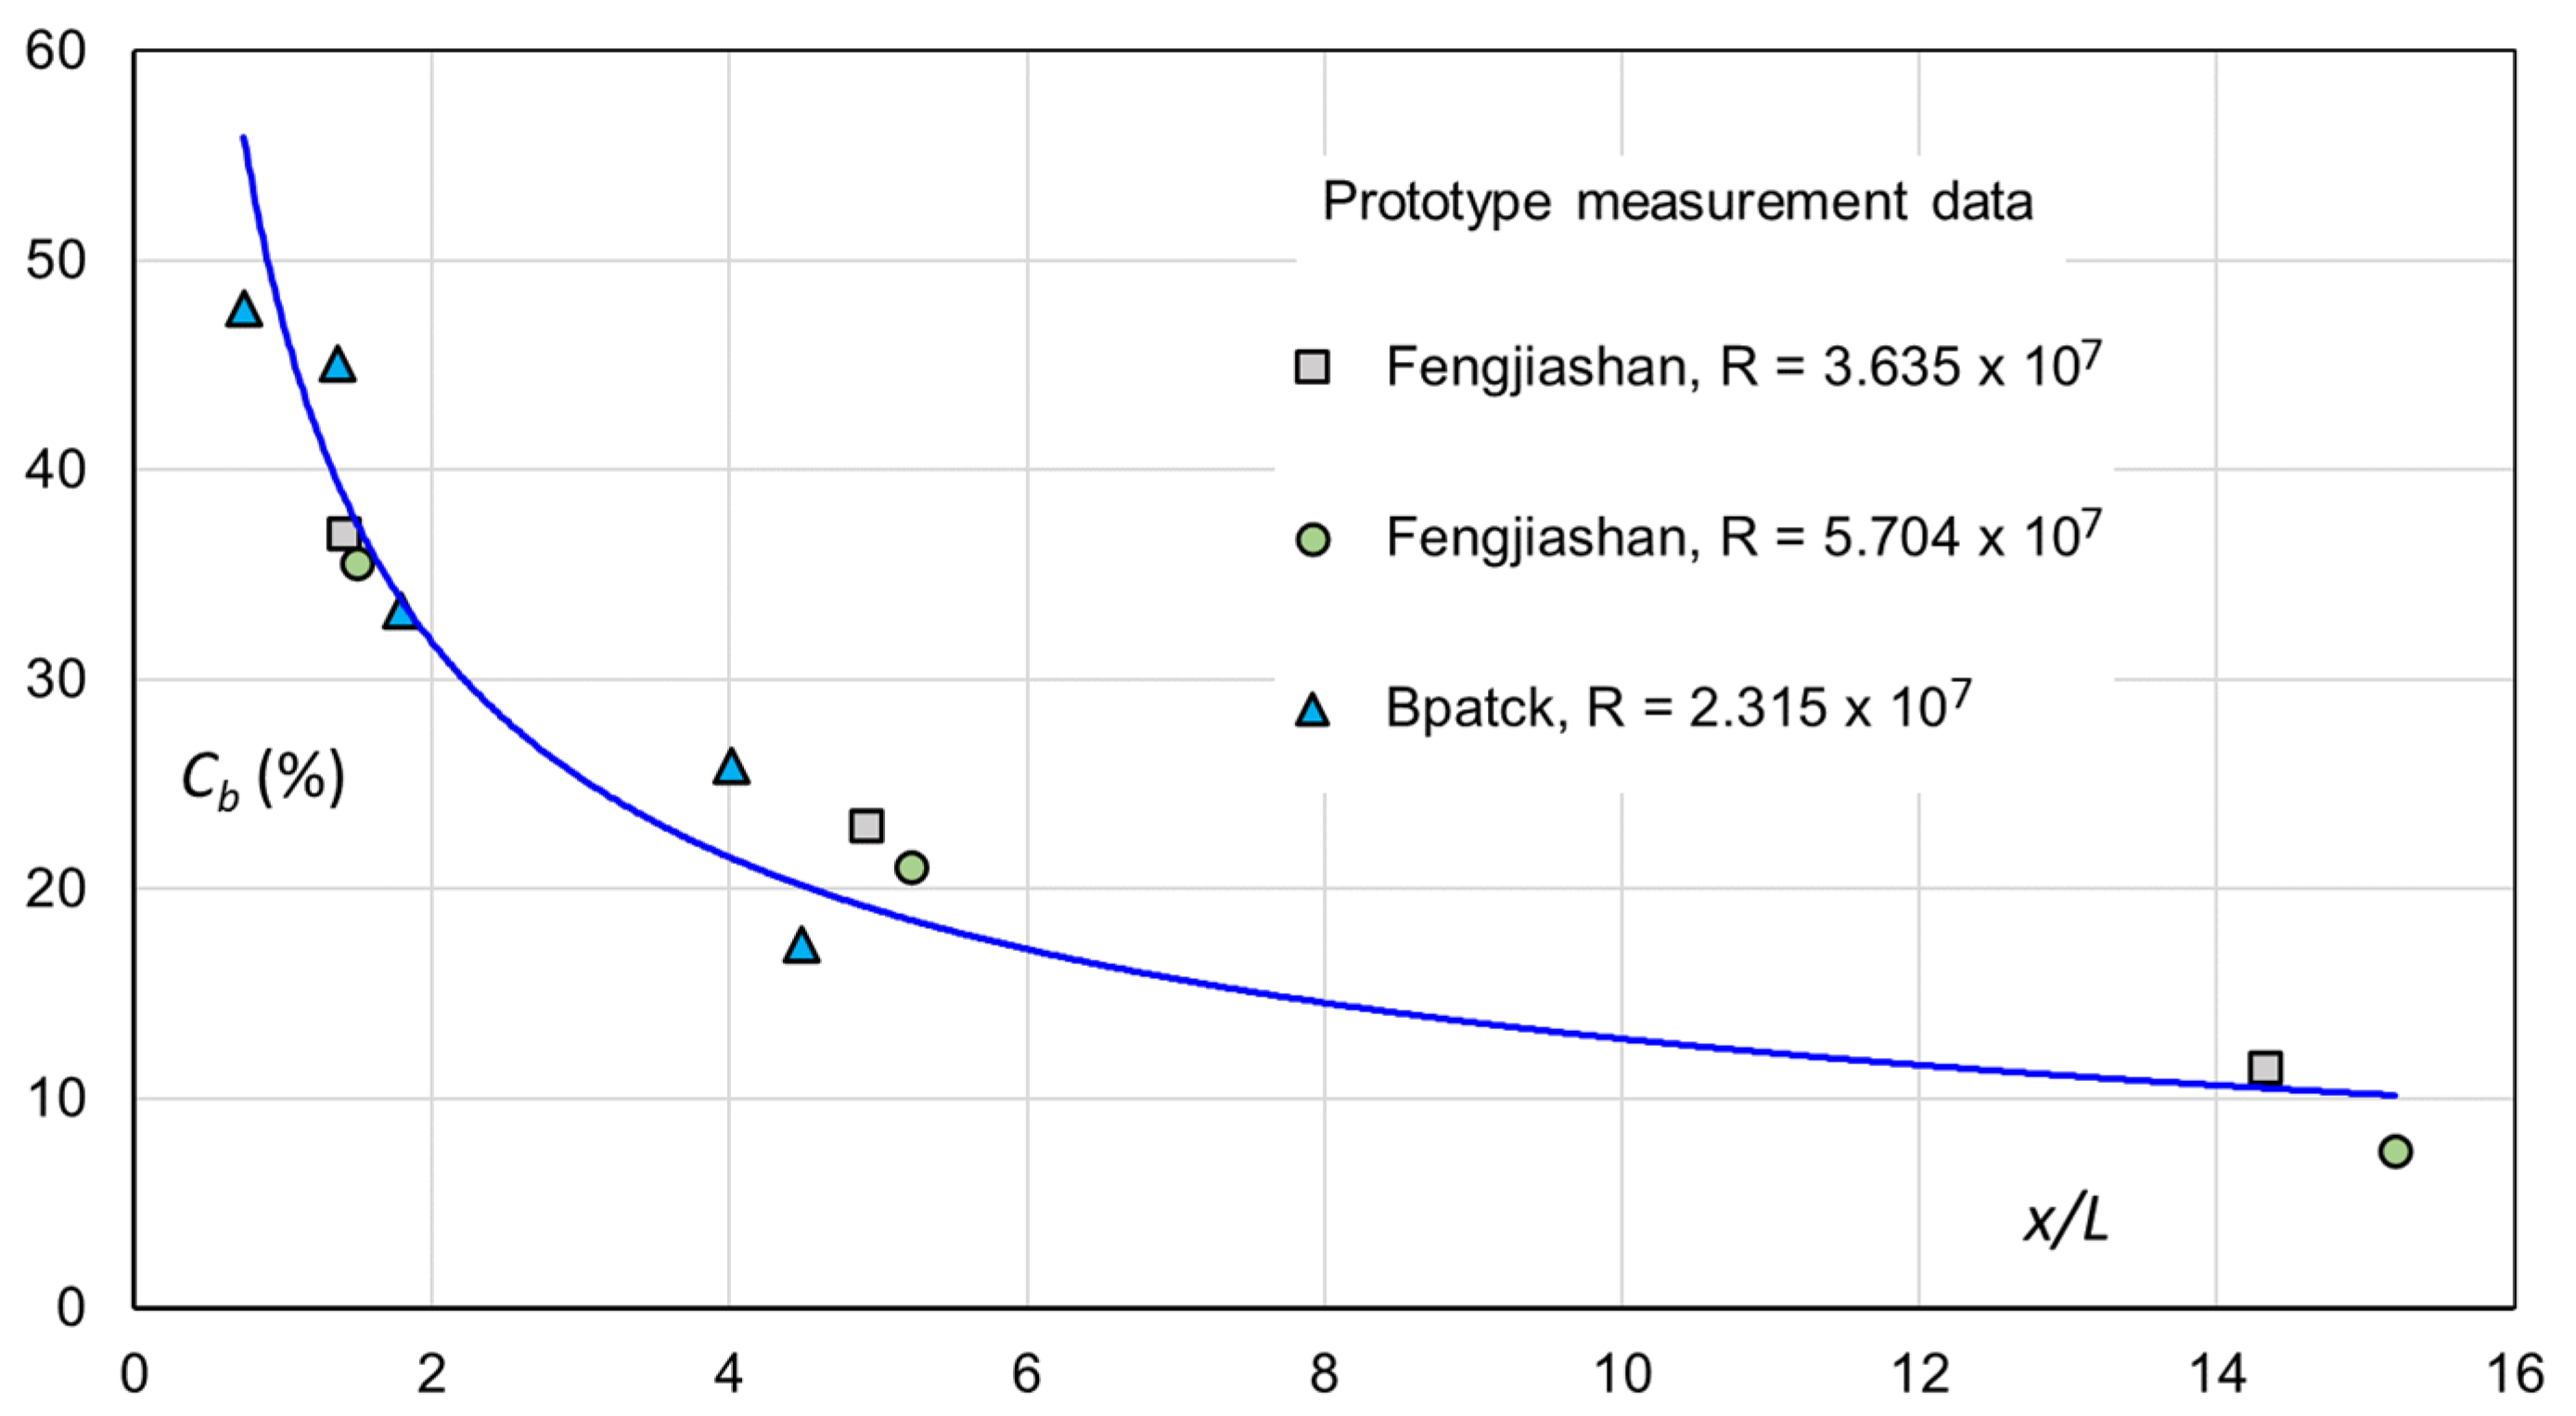
For the Fengjiashan aerator, prototype measurements were made at two flow discharges, corresponding to R = 3.63 × 10⁷ and 5.70 × 10⁷. Together with the prototype results from the Bpatck spillway aerator, the streamwise Cb variations are plotted in Figure 18 and expressed in the form [12]
Figure 18 demonstrates that the bottom air concentration in the prototype differs appreciably from in its model. The prototype decay is much slower. Along a significantly longer distance downstream of the impact, Cb maintains a relatively high level. The model–prototype comparisons made for Jinping-I also confirm this. To use a model for prediction of the protected chute length would therefore give rise to significant underestimation. There are no established criteria to upscale or convert air concentration from model to prototype. In this regard, engineering experiences are probably more useful than laboratory tests. Normally, with a ~30 m/s flow velocity at the aerator, the aerator can protect a chute length of (17–20)L. Attaining more data from prototype observations is crucial for the design of future projects.
7. Conclusions
A physical model of the Froude similitude only applies to flow phenomena with all free water surfaces subjected to the atmospheric pressure. If an air cavity arises and becomes enclosed, it probably suffers from sub-atmospheric air pressure, which is the case in the aerator flow. With the theoretical analysis and review of prototype and laboratory results, the following conclusions are drawn. The availability of the prototype measurement data plays a significant role herein.
Theoretical analyses show that the cavity air pressure of the aerator flow ought to be scaled in physical hydraulic modelling. Unfortunately, this is seldom the case with most spillway models in the laboratory. There are studies in which aerator behaviors are examined in a vacuum flume or tank. However, their primary purposes are not to scale the aerator flow but to detect the potential risk of cavitation damages, for which the cavitation similarity is met by maintaining the same incipient cavitation number in the model as in the prototype [44].
Model–prototype comparisons show that, to correctly upscale the air flow rate, the approach flow velocity at the aerator should exceed the 7.00–7.50 m/s threshold or the Reynolds number should be above 1.58 × 10⁶. If this condition is not met, any attempts to scale up the air flow would lead to errors. The error extent depends on both model scale and flow magnitude. Despite minor differences, the experimental velocity threshold agrees with the three analytical approaches of surface air entrainment.
Not correctly downscaled in the model, upscaling of cavity pressure from model to prototype is neither correct. The cavity pressure drop in a prototype is often less than one order of magnitude as high as in its model. For tunnel aerators, the pressure drop can be larger due to the long shaft as air supply passage. In combination with the flow velocity criterion, sufficient air supply in the model is also a prerequisite for aerator model tests.
Model tests show that the air concentration near the chute bottom drops substantially to a low level within one to two cavity lengths downstream of the impact location. Field measurements demonstrate that the decay in the prototype differs in an obvious manner from that in its model. The process of air detrainment is much slower in the prototype, which is due to the significantly higher flow velocity and turbulence intensity.
The purpose of modeling, either physical or numerical, is to reasonably capture the flow features of a spillway. Physical model tests have since long been the primary tool for the purpose. However, with respect to two-phase flow, especially at high velocity, not all the answers can be attained from a physical model. There are seemingly no upscaling criteria to follow with respect to such parameters as cavity pressure drop and bottom air concentration. A combination with reliable numerical tools would provide better insight into the aerator flow and contribute to a more reasonable design.
Author Contributions
Conceptualization, funding, methodology, formal analysis, photos and figures, and writing—original draft preparation and revision, J.Y.; project assistance, dimensional analysis, and writing—review and comments, S.L.; conceptualization, project participation, and writing—review and comments, C.L. All authors have read and agreed to the published version of the manuscript.
Funding
As part of research project Quality and trust of numerical modeling of water-air flows for safe spillway discharge, this study is funded by the Vattenfall R&D and Swedish Hydropower Centre (SVC). The SVC has been established by the Swedish Energy Agency, Energiforsk and Svenska Kraftnät together with Luleå University of Technology, the Royal Institute of Technology, Chalmers University of Technology and Uppsala University. Participating companies and industry associations are AFRY, Andritz Hydro, Boliden, Fortum Generation, Holmen Energi, Jämtkraft, Karlstads Energi, LKAB, Mälarenergi, Norconsult, Rainpower, Skellefteå Kraft, Sollefteåforsens, Statkraft Sverige, Sweco Energuide, Sweco Infrastructure, Tekniska verken i Linköping, Uniper, Vattenfall R&D, Vattenfall Vattenkraft, Voith Hydro, WSP Sverige and Zinkgruvan.
Acknowledgments
J.Y. thanks Anders Ansell of Royal Institute of Technology and Holger Ecke of Vattenfall R&D for coordination of diverse issues. This research is also part of the collaboration between KTH Royal Institute of Technology and National Chung Hsing University.
Conflicts of Interest
The authors declare no conflict of interest.
References
- Falvey, H.T. Cavitation in Chutes and Spillways; Engineering Monograph 42; United States Department of the Interior, Bureau of Reclamation: Denver, CO, USA, 1990. [Google Scholar]
- Pinto, N.L.S.; Neidert, S.H.; Ota, J.J. Aeration at high velocity flows. Water Power Dam Constr. 1982, 34, 34–38. [Google Scholar]
- ICOLD. Spillways for Dams; Bulletin 58; International Commission on Large Dams (ICOLD): Paris, France, 1987. [Google Scholar]
- ICOLD. Spillways. Shockwaves and Air Entrainment. Review and Recommendations; Bulletin 81; International Commission on Large Dams (ICOLD): Paris, France, 1992. [Google Scholar]
- Kramer, K. Development of Aerated Chute Flow. Ph.D. Thesis, Versuchsanstalt für Wasserbau, Hydrologie und Glaziologie, ETH, Zurich, Switzerland, 2004. [Google Scholar]
- Kramer, K.; Hager, W.H. Air transport in chute flows. Int. J. Multiph. Flow 2005, 31, 1181–1197. [Google Scholar] [CrossRef]
- Pfister, M.; Hager, W.H. Chute aerators. I: Air transport characteristics. J. Hydraul. Eng. 2010, 136, 352–359. [Google Scholar] [CrossRef]
- Pfister, M.; Hager, W.H. Chute aerators. II: Hydraulic design. J. Hydraul. Eng. 2010, 136, 360–367. [Google Scholar] [CrossRef]
- Pfister, M. Chute aerators: Steep deflectors and cavity subpressure. J. Hydraul. Eng. 2011, 137, 1208–1215. [Google Scholar] [CrossRef]
- Peterka, A.J. The effect of entrained air on cavitation pitting. In Proceedings of the International Hydraulics Convention, Joint Meeting, AIRH-ASCE, Minneapolis, MN, USA, 1–4 September 1953. [Google Scholar]
- Peterka, A.J. Hydraulic Design of Stilling Basins and Energy Dissipators; Engineering Monograph No. 25, Revised Edition; United States Department of the Interior, Bureau of Reclamation: Denver, CO, USA, 1978. [Google Scholar]
- Shi, Q.S. High-Velocity Aerated Flow; China Water and Power Press: Beijing, China, 2007. [Google Scholar]
- Mortenseen, J. Collaborative Studies to Reduce Flow-Induced Damage on Concrete Surfaces. Research and Development; Office Final Report No. ST-2020-1885-01; US Bureau of Reclamation: Denver, CO, USA, 2020. [Google Scholar]
- Teng, P.H.; Yang, J. CFD modelling of two-phase flow of a spillway chute aerator of large width. J. Appl. Water Eng. Res. 2016, 4, 163–177. [Google Scholar] [CrossRef]
- Lian, J.; Qi, C.; Liu, F.; Gou, W.; Pan, S.; Ouyang, Q. Air entrainment and air demand in the spillway tunnel at the Jinping-I dam. Appl. Sci. 2017, 7, 930. [Google Scholar] [CrossRef] [Green Version]
- Coleman, H.W.; Wei, C.Y.; Lindell, J.E. Hydraulic Design of Spillways, Hydraulic Design Handbook; McGraw-Hill: New York, NY, USA, 2004. [Google Scholar]
- Li, S.; Zhang, J.M.; Xu, W.L.; Chen, J.G.; Peng, Y. Evolution of pressure and cavitation on side walls affected by lateral divergence angle and opening of radial gate. J. Hydraul. Eng. 2016, 142, 05016003. [Google Scholar] [CrossRef]
- Chanson, H. Study of Air Entrainment and Aeration Devices on Spillway Model. Ph.D. Thesis, University of Canterbury, Christchurch, New Zealand, 1988. [Google Scholar]
- Li, S.C.; Yang, J.; Liu, W. Estimation of aerator air demand by an embedded multi-gene genetic programming. J. Hydroinform. 2021, 23, 1000–1013. [Google Scholar] [CrossRef]
- Zheng, S.L.; Li, Z.Y.; Ma, J.M. Similarity law of physical model on air entrainment to alleviate cavitations. In Proceedings of the International Symposium on Hydraulic Physical Modeling and Field Investigation, Nanjing, China, 13–15 September 2010. [Google Scholar]
- Teng, P.H.; Yang, J. Modeling and prototype testing of flows over flip-bucket aerators. J. Hydraul. Eng. 2018, 144, 04018069. [Google Scholar] [CrossRef]
- Pinto, N.L.S.; Neidert, S.H. Model prototype conformity in aerated spillway flow. In Proceedings of the International Conference on Hydraulic Modelling of Civil Engineering Structures, Coventry, UK, 22–24 September 1982. [Google Scholar]
- Volkart, P.; Rutschmann, P. Rapid flow in spillway chutes with and without deflectors—A model-prototype comparison. In Proceedings of the Symposium on Scale Effects in Modelling Hydraulic Research, Esslingen, Germany, 3–6 September 1984. [Google Scholar]
- Tan, T.P. Model Studies of Aerators on Spillways. Ph.D. Thesis, University of Canterbury, Christchurch, New Zealand, 1984. [Google Scholar]
- Heller, V. Scale effects in physical hydraulic engineering models. J. Hydraul. Res. 2011, 49, 293–306. [Google Scholar] [CrossRef]
- Pfister, M.; Chanson, H. Discussion: Scale effects in physical hydraulic engineering models. J. Hydraul. Res. 2012, 50, 244–246. [Google Scholar] [CrossRef] [Green Version]
- Pfister, M.; Chanson, H. Scale effects in modelling two-phase air-water flows. In Proceedings of the 2013 IAHR World Congress, Chengdu, China, 8–13 September 2013. [Google Scholar]
- Pfister, M.; Chanson, H. Two-phase air–water flows: Scale effects in physical modeling. J. Hydrodyn. 2014, 26, 291–298. [Google Scholar] [CrossRef] [Green Version]
- Pfister, M.; Hager, W.H. History and significance of the Morton number in hydraulic engineering. J. Hydraul. Eng. 2014, 140, 02514001. [Google Scholar] [CrossRef] [Green Version]
- Maxwell, W.H.C.; Weggel, J.R. Surface tension in Froude models-correction. J. Hydraul. Div. ASCE 1970, 96, 845. [Google Scholar] [CrossRef]
- Novak, P.; Cabelka, J. Models in Hydraulic Engineering; Pitman: Boston, MA, USA, 1981. [Google Scholar]
- Novak, P.; Moffat, A.I.B.; Nalluri, C.; Narayanan, R. Hydraulic Structures; E&FN Spon: London, UK, 1997. [Google Scholar]
- Peakall, J.; Warburton, J. Surface tension in small hydraulic river models—The significance of the Weber number. J. Hydrol. N. Z. 1996, 35, 199–212. [Google Scholar]
- Zhang, H.W.; Liu, Z.P.; Zhan, D.; Wu, Y.H. Numerical simulation of aerated high velocity flow downstream of an aerator. Chin. J. Hydraul. Eng. 2008, 39, 1302–1308. [Google Scholar]
- Yang, J.; Teng, P.H.; Zhang, H.W. Experiments and CFD modelling of high-velocity two-phase flow in a large chute aerator facility. Eng. Appl. Comput. Fluid Mech. 2018, 13, 48–66. [Google Scholar]
- Vojnovich, V.A.; Schwartz, A.I. A uniform motion of aerated water flows. VNIIG (In Russian). 1946, 31. [Google Scholar]
- Wood, I.R. (Ed.) Air Entrainment in Free-Surface Flows; A.A. Balkema: Rotterdam, The Netherlands, 1991. [Google Scholar]
- Yang, Y.S. Studies of Air Concentration Distributions in Air-Water Two-Phase Flows. Ph.D. Thesis, Chengdu University of Science and Technology, Chengdu, China, 1991. [Google Scholar]
- Hager, W.H.; Schleiss, A.J.; Boes, R.M.; Pfister, M. Hydraulic Engineering of Dams; CRC Press, Taylor&Francis Group: London, UK, 2021. [Google Scholar]
- Marcano, A.; Castillejo, N. Model-prototype comparison of aeration devices of Guri Dam spillway. In Proceedings of the Scale Effects in Modelling Hydraulic Structures, Esslingen, Germany, 3–6 September 1984. [Google Scholar]
- Marcano, A.; Patiño, A. Cavitation damage at Chute 3 Stage II of Guri Spillway and solution to the problem. In Proceedings of the Congresso Internacional sobre Casos e Acidentes em Sistemas Fluidos, São Paulo, Brazil; 1989. [Google Scholar]
- Castillejo, N.; Marcano, A. Aeration at Guri Final Stage Spillway. Model-Prototype Correlation of Hydraulic Structures (Burgi Energy Dissipation); ASCE: New York, NY, USA, 1988. [Google Scholar]
- Yang, J.; Teng, P.H.; Lin, C. Air-vent layouts and water-air flow behaviors of a wide spillway aerator. Theor. Appl. Mech. Lett. 2019, 9, 130–143. [Google Scholar] [CrossRef]
- Hu, Y.A.; Ruan, S.P.; Yan, X.J. Study on test method of chute aerator in vacuum tank. In Proceedings of the 2013 IAHR World Congress, Chengdu, China, 8–13 September 2013. [Google Scholar]
Figure 1.
An aerator in a 25 m wide single-opening spillway, Sweden. (a) spillway during discharge, looking upstream; (b) aerator with air shaft and air vents. At the aerator, the chute is 35 m wide between the air shafts. There are 13 air vents (each 1.0 m2 in area) connecting the chute with the air duct (5.0 m2 in area) leading to the shafts (each 8.7 m2 in area). At the aerator, the unit flow discharge amounts to ~43 m2/s at the full reservoir water stage.

Figure 2.
Aerators in Jinping-I flood discharge tunnel with free-surface flow (adapted from [15]). At the design reservoir water level, Q = 3200 m3/s at the 100% gate opening.
Figure 2.
Aerators in Jinping-I flood discharge tunnel with free-surface flow (adapted from [15]). At the design reservoir water level, Q = 3200 m3/s at the 100% gate opening.

Figure 3.
Chute aerator configuration with air-cavity formation and flow pattern.

Figure 4.
Definition sketch of aerator flow, derivation of jet trajectory centerline expression.

Figure 5.
Two examples of formation of enclosed air cavity subjected to sub-atmospheric pressure. (a) Air pocket behind a horizontal sharp-edged weir bounded by side walls; (b) air cavity surrounded by the flow jets over the flip buckets in gated spillway openings [21].
Figure 5.
Two examples of formation of enclosed air cavity subjected to sub-atmospheric pressure. (a) Air pocket behind a horizontal sharp-edged weir bounded by side walls; (b) air cavity surrounded by the flow jets over the flip buckets in gated spillway openings [21].

Figure 6.
Baishan hydropower scheme. (a) dam layout; (b) longitudinal profile of chute spillway with aerator (adapted from [12]).
Figure 6.
Baishan hydropower scheme. (a) dam layout; (b) longitudinal profile of chute spillway with aerator (adapted from [12]).

Figure 7.
Baishan spillway aerator, β results from model tests of three scales (λ = 20, 40, 70) and prototype measurements (adapted from [12]).
Figure 7.
Baishan spillway aerator, β results from model tests of three scales (λ = 20, 40, 70) and prototype measurements (adapted from [12]).

Figure 8.
Comparisons of air flows between prototype and model, air demand ratio K based on model scales for eight spillway aerators (based on the data in [12,15]).

Figure 9.
Reynolds number-based comparisons of aerator air flows between prototypes and models. Six chute spillway aerators are included (based on the data in [12,22]).

Figure 10.
Large test rig of chute spillway aerator at IWHR. The flume is 15.0 m long and 0.2 wide, with its angle adjustable between α = 0–49°. (1) water from pump; (2) rotatable pipe joint; (3) flow meter; (4) control valve; (5) water supply pipe; (6) water supply in flume bottom; (7) test flume with aerator; (8) 3D measurement carriage; (9) tailwater; (10) observation window; (11) horizontal rail; (12) horizontally moving wheel; (13) expansion pipe section; (14) vertically moving wheel; (15) water intake to flume; (16) counterweight (not shown); (17) vertical rail; (18) hoister; (19) safety brake; (20) lifting cradle; (21, 22) lifting wire and guide wheel.

Figure 11.
Comparisons of air demand (β1-X) among IWHR high-velocity flume tests, and model and prototype data from the Fengjiashan and Baishan aerators (adapted from [12]).
Figure 11.
Comparisons of air demand (β1-X) among IWHR high-velocity flume tests, and model and prototype data from the Fengjiashan and Baishan aerators (adapted from [12]).

Figure 12.
Model–prototype comparisons of air demand (β1-X) for Foz do Areia spillway aerator (based on the data in [22]).
Figure 12.
Model–prototype comparisons of air demand (β1-X) for Foz do Areia spillway aerator (based on the data in [22]).

Figure 13.
Jinping-I aerators, pressure drop in the air cavities (Δp) from the prototype measurements (based on the data in [15]).
Figure 13.
Jinping-I aerators, pressure drop in the air cavities (Δp) from the prototype measurements (based on the data in [15]).

Figure 14.
Jinping-I tunnel aerators, model–prototype comparisons of chute bottom air concentration Cb (adapted from [15]). Points ①–⑧ are model measurement points in the vicinity of their respective prototype locations.
Figure 14.
Jinping-I tunnel aerators, model–prototype comparisons of chute bottom air concentration Cb (adapted from [15]). Points ①–⑧ are model measurement points in the vicinity of their respective prototype locations.

Figure 15.
Layout of Ertan flood discharge tunnel, with five aerators (three are shown here). C1, C2 and C3 are prototype measurement points of bottom air concentration.
Figure 15.
Layout of Ertan flood discharge tunnel, with five aerators (three are shown here). C1, C2 and C3 are prototype measurement points of bottom air concentration.

Figure 16.
Aerator model tests, streamwise change of air concentration Cb downstream of the impact location. (a) Liujiaxia in scale λ = 25; (b) Ertan in scale λ = 50 (based on the data in [12]).
Figure 16.
Aerator model tests, streamwise change of air concentration Cb downstream of the impact location. (a) Liujiaxia in scale λ = 25; (b) Ertan in scale λ = 50 (based on the data in [12]).


Figure 17.
Prototype measurement results of Cb at aerator no. 2 in Ertan flood discharge tunnel (based on the data in [12]).
Figure 17.
Prototype measurement results of Cb at aerator no. 2 in Ertan flood discharge tunnel (based on the data in [12]).

Figure 18.
Prototype measurement results from the Fengjiashan and Bpatck aerators, streamwise change of bottom air concentration Cb downstream of the impact location (based on the data in [12]).
Figure 18.
Prototype measurement results from the Fengjiashan and Bpatck aerators, streamwise change of bottom air concentration Cb downstream of the impact location (based on the data in [12]).

Publisher’s Note: MDPI stays neutral with regard to jurisdictional claims in published maps and institutional affiliations. |
© 2022 by the authors. Licensee MDPI, Basel, Switzerland. This article is an open access article distributed under the terms and conditions of the Creative Commons Attribution (CC BY) license (https://creativecommons.org/licenses/by/4.0/).
Share and Cite
MDPI and ACS Style
Yang, J.; Li, S.; Lin, C. Plausible Differences between the Laboratory and Prototype Behaviors of Spillway Aerator Flows. Water 2022, 14, 3264. https://doi.org/10.3390/w14203264
AMA Style
Yang J, Li S, Lin C. Plausible Differences between the Laboratory and Prototype Behaviors of Spillway Aerator Flows. Water. 2022; 14(20):3264. https://doi.org/10.3390/w14203264
Chicago/Turabian StyleYang, James, Shicheng Li, and Chang Lin. 2022. "Plausible Differences between the Laboratory and Prototype Behaviors of Spillway Aerator Flows" Water 14, no. 20: 3264. https://doi.org/10.3390/w14203264
Note that from the first issue of 2016, this journal uses article numbers instead of page numbers. See further details here.