Article

Macroplastics Pollution in the Surma River in Bangladesh: A Threat to Fish Diversity and Freshwater Ecosystems

by
Abul Hasnat Abdullah
1,
Gourab Chowdhury
1,
Diponkor Adikari
1,
Israt Jahan
1,
Yochi Okta Andrawina
2,
Mohammad Amzad Hossain
1,*,
Petra Schneider
3,* and
Mohammed Mahbub Iqbal
1
1
Department of Fish Biology and Genetics, Sylhet Agricultural University, Sylhet 3100, Bangladesh
2
Asian School of the Environment, Nanyang Technological University, Singapore 639798, Singapore
3
Department for Water, Environment, Civil Engineering and Safety, Magdeburg-Stendal University of Applied Sciences, Breitscheidstraße 2, D-39114 Magdeburg, Germany
*
Authors to whom correspondence should be addressed.
Water 2022, 14(20), 3263; https://doi.org/10.3390/w14203263
Submission received: 31 August 2022 / Revised: 10 October 2022 / Accepted: 14 October 2022 / Published: 16 October 2022

Abstract

:
Plastic pollution is one of the pressing issues in freshwater ecosystems that may further contribute to coastal pollution. The present study aimed to address the state of macroplastics pollution in the Surma River system, Bangladesh. Six sampling sites were allocated in the river starting from upstream to downstream, water parameters and fin fish assemblage were recorded, and plastic debris was collected from each site. Afterward, macroplastics were categorized and weighed to measure their abundance. Previous data on rainfall, water discharge, and depth were aggregated to study the trend of river depth changes. A survey was conducted to identify the possible sources of plastic pollution in the river and awareness of the pollution. The results showed that Kazir Bazar (Site 4) and Beter Bazar (Site 5), comparatively contained poor water quality, diverse macroplastics categories, and higher macroplastics abundance. The water pollution index (WPI) also ranked the above sites as extremely polluted. Similarly, biodiversity indices revealed lower diversity at Site 4 and Site 5. The river depth analysis revealed that there was no remarkable tendency to change the depth. To conclude, the Surma River system is being polluted due to inadvertent plastic dumping. Contemporary awareness is highly required, and proper policies should be implemented to minimize the detrimental effects of macroplastics.

Graphical Abstract

1. Introduction

Plastics are currently considered one of the extensively distributed pollutants in aquatic environments [1,2]. Plastic is a general term for polymeric materials that may incorporate additional ingredients to enhance performance, decrease production cost, and/or generate the desired color [3,4]. Several assimilations of polymer resins make up the polymers needed to create desired plastic items such as polyethylene terephthalate (PET), high-density polyethylene (HDPE), polyvinyl chloride (PVC), low-density polyethylene (LDPE), polypropylene (PP), polystyrene (PS), polycarbonate (PC), acrylic, and nylon, which are the common polymer types in plastic production worldwide [4,5,6]. Due to the frequent presence of plastic particles in the environment and the subsequent negative environmental impact, the growth in plastic deposition and resulting garbage have become a great concern in the freshwater ecosystem of Bangladesh. A massive expansion of the production of various plastic wastes on a global scale has been reported between 1950 and 2015 [7,8]. About 6300 million metric tons (MMT) of plastic garbage was produced in 2015, of which 9% was recycled, 12% was burned, and 79% was piled up in the natural environment [9,10]. By 2050, approximately 12,000 million metric tons (MMT) of plastic garbage would remain untreated and 12,000 million MT would be burned, if the current production rate and waste management approaches continue [9,11,12].
Plastic pollution has become a crucial environmental hazard and a potential threat to nature globally [11,13,14,15]. The final destination of land-based plastic debris is the freshwater and afterward the coastal environment; therefore, a massive amount of plastic litter from urban discharge, agricultural and industrial mismanaged products, domestic garbage, municipal sewage, and pluvial discharge are deposited into the freshwater river system [16,17,18]. In turn, freshwater river systems are used to transport a large quantity of plastic garbage toward the oceans [19,20]. However, previous studies reported that only a small proportion of plastic garbage has been transported by the rivers into the oceans, which means a larger amount is still retained within the river systems [21,22,23]. Henceforth, the freshwater systems are considered significant reservoirs of plastic debris globally [1]. Due to the slow degradability and long persistency of plastics debris, most of it has existed for an extended period in the environment and macroplastics (>25 mm) are broken down into mesoplastics (5–25 mm), microplastics (<5 mm), and nanoplastics (<100 nm) through the action of the sun, water, and other factors in the aquatic environments [24,25,26]. Finally, the tiny plastic particles are consumed by fish and other aquatic creatures, with potentially harmful effects on the trophic web [27,28]. The nano, micro, and macro forms of plastics are reported to be linked with microbiological, chemical, and particle toxicities, and other hazardous consequences in aquatic ecosystems [2]. Fish are considered a mostly affected biotic component in response to diverse forms of environmental stress in the aquatic ecosystem [29,30,31]. Plastic litter may cause a notable reduction in total fish production or abundance in an aquatic habitat due to its adverse effect on the existing ecosystem [11,32]. Therefore, all the aforementioned issues ultimately can cause a serious threat to freshwater biodiversity and ecosystem services [33,34,35]. Global inadequate management of plastic wastes, and its dispersion, bioaccumulation, and biological toxicity of micro- and nanoplastics impose a negative influence not only on ecology and animals but also on humans [11,28,36].
Plastic pollution is one of the growing environmental concerns in Bangladesh. The early recognition of this problem led Bangladesh to become the first nation to outlaw plastic bags in 2002 [8]. Bangladesh is a riverine territory containing approximately 700 large and small rivers and channels including tributaries and canals across the country [37]. Most of the rivers in Bangladesh that flow through the major cities have become polluted over the past 20 to 25 years with a variety of anthropogenic pollution [38], plastic being one of the predominant issues [37,39,40]. The northeastern section of Bangladesh is made up of the Surma River, a sub-basin of the Bengal Basin. The Barak River forms the Surma River’s notable watershed, and it originates on the Shillong and Meghalaya hillside slopes, then flows through Sylhet town, afterwards running west and southwest [38]. Later, it flows through the major cities where it became polluted over the past 20 to 25 years through a variety of anthropogenic sources [38], plastic being one of the predominant issues. At least eight million residents rely directly or indirectly on the water from the Surma Basin for their daily needs and other uses. However, a recent study found that the river water quality has been seriously threatened by human activity and industrial effluents [38,41,42]. Urban discharges, surface runoff, intentional or involuntary dumping of plastic debris such as shopping bags, polythene sheets, plastic wrappers, beverage bottles, one-time plastic products, foam and disposable containers, personal care products, and so forth is causing detrimental effects to the Surma River ecosystem.
Therefore, it is essential at this point to investigate the status of plastic pollution in the Surma River and raise concerns among local people about the consequences of plastic pollution. Unfortunately, no previous research is available on the plastic pollution in the Surma River. To the best of the author’s knowledge, the present study would be the first investigation on macroplastics pollution in the Surma River system. The current research aimed to address the recent status of macroplastics pollution in the Surma River, which included a thorough examination of the availability of major disposed macroplastics items and their abundance in the river systems, an analysis of the surrounding water quality, and fish diversity indices, additional river depth study through previous data analysis. Finally, the aim was to identify possible sources of plastic pollution in the Surma River and raise awareness among the common people of plastic pollution.

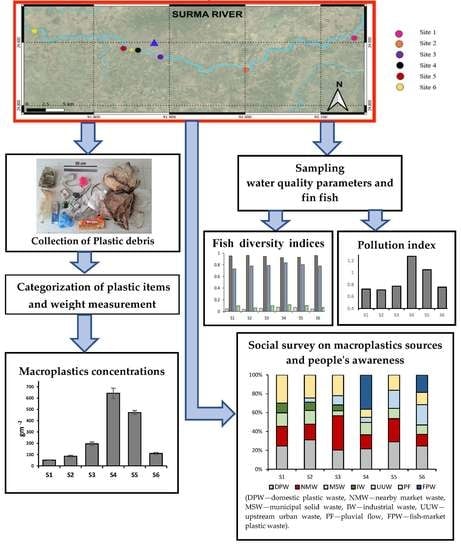
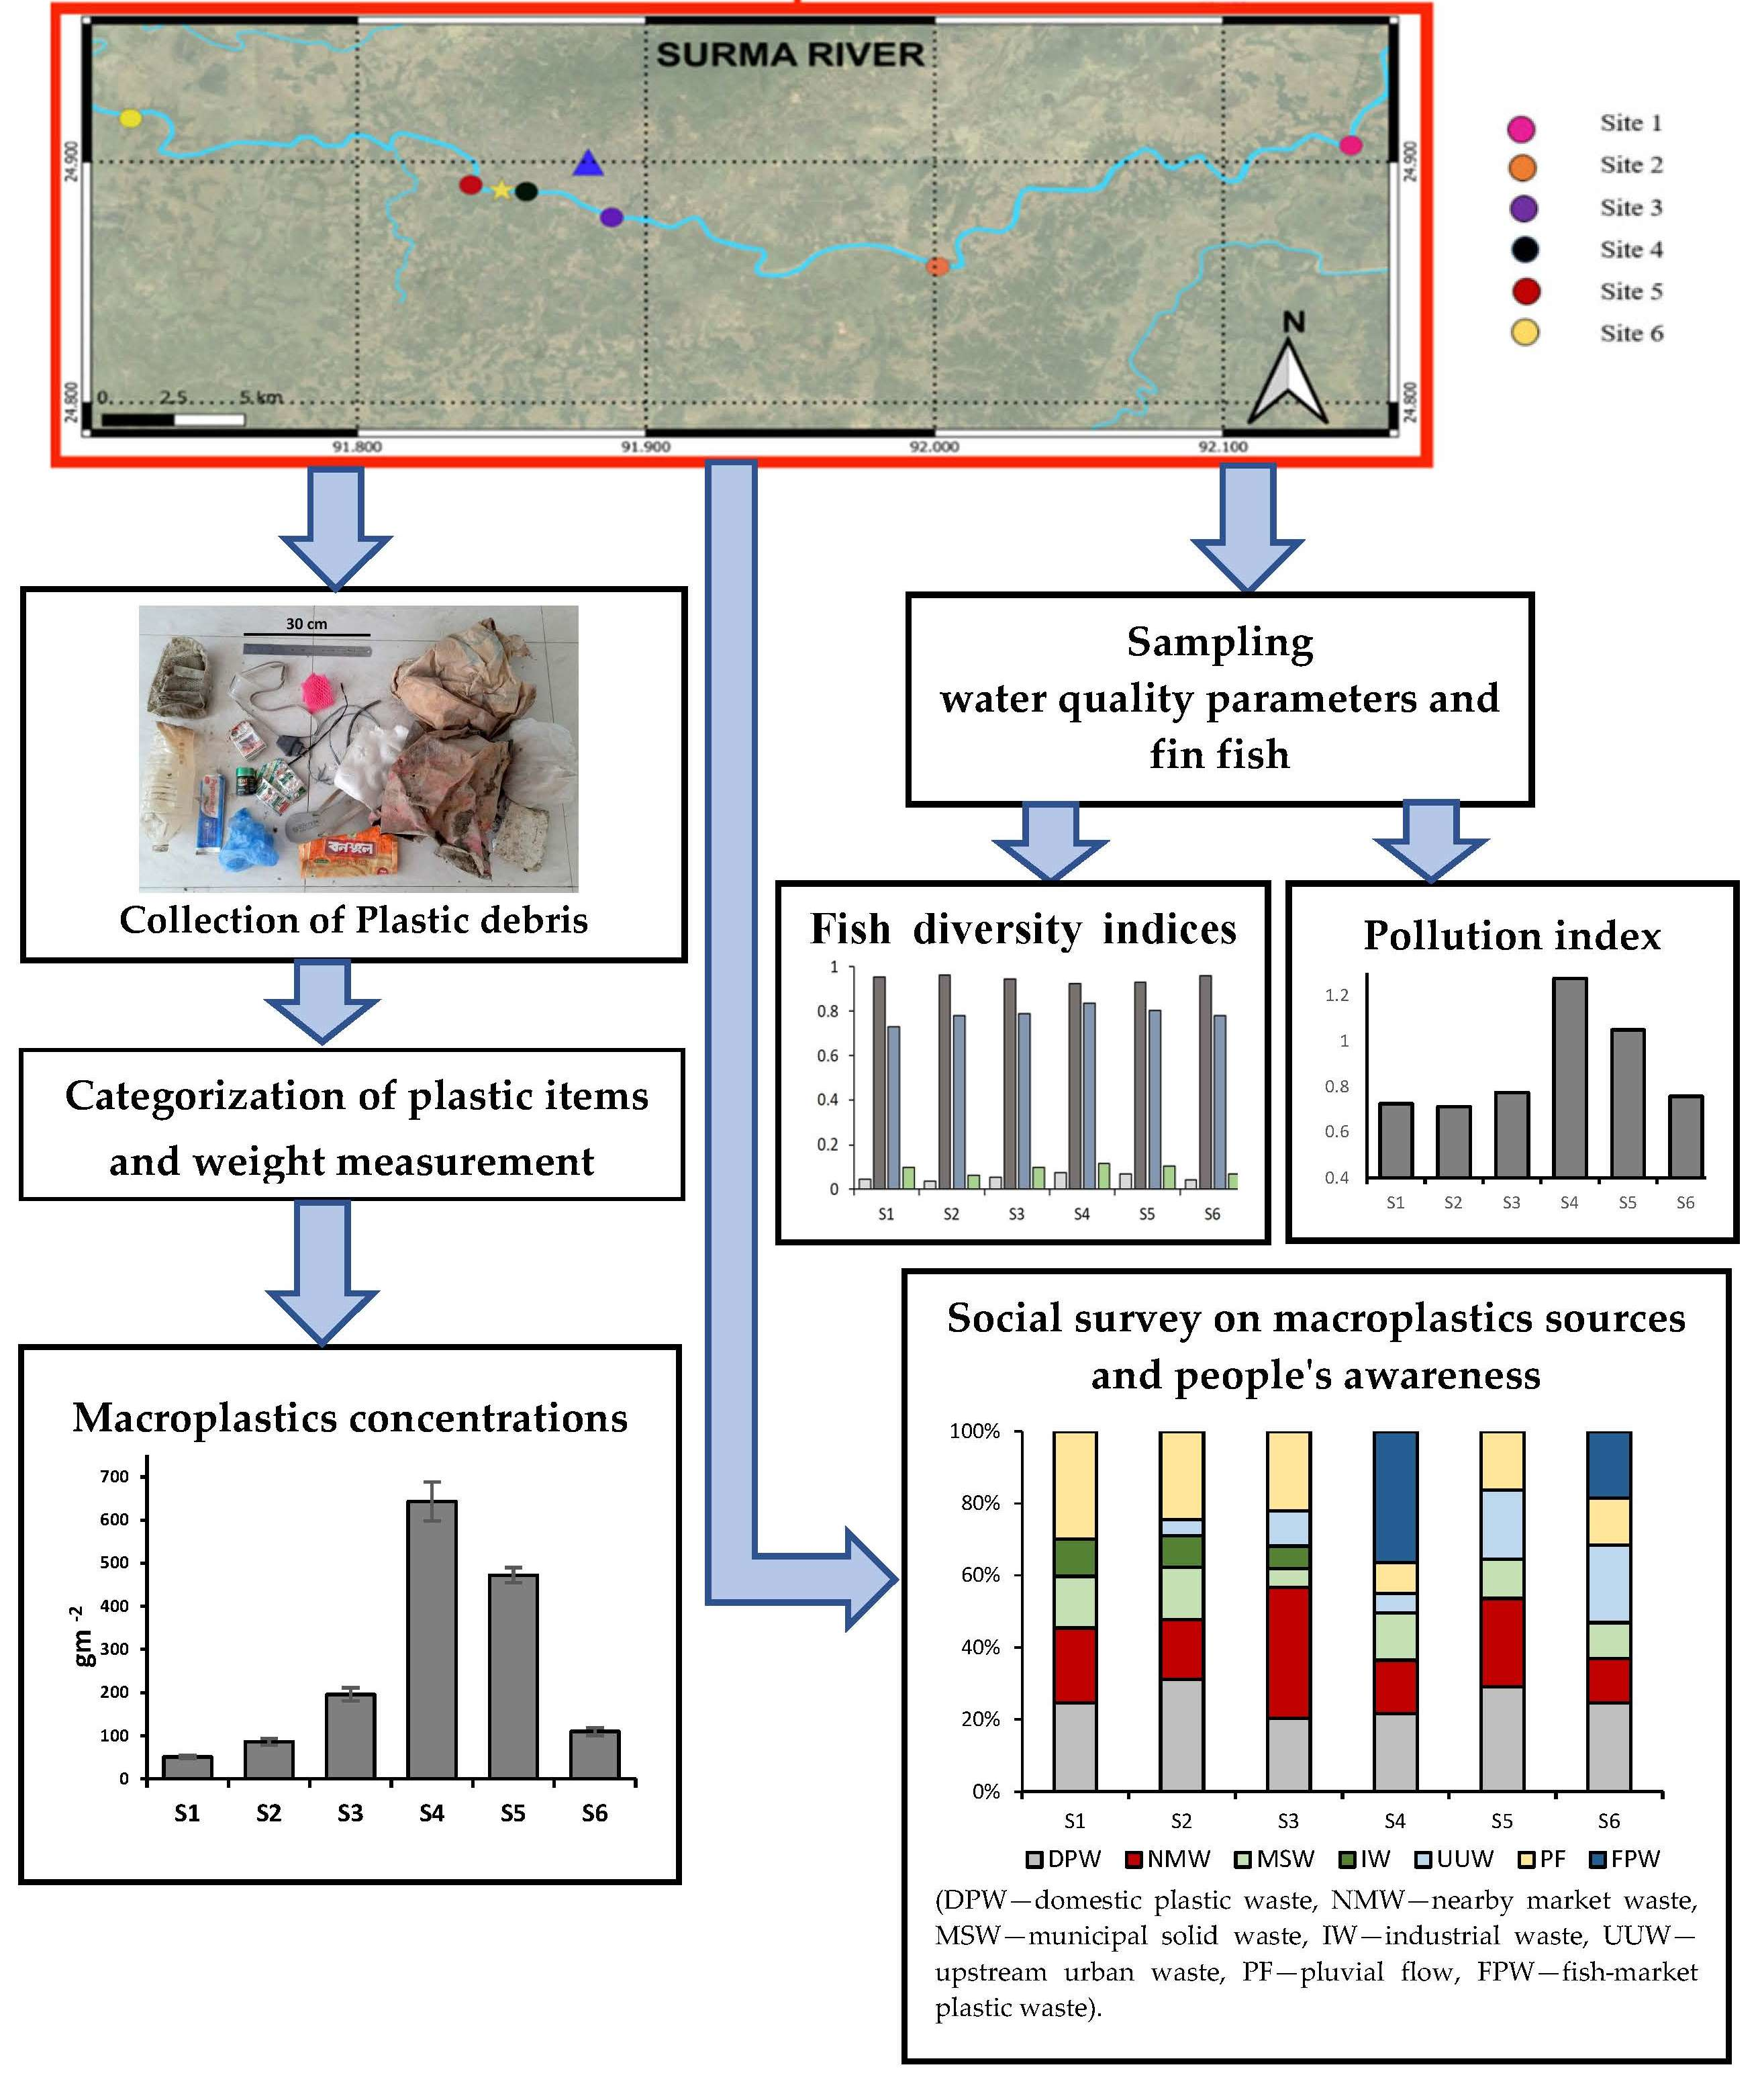
2. Materials and Methods

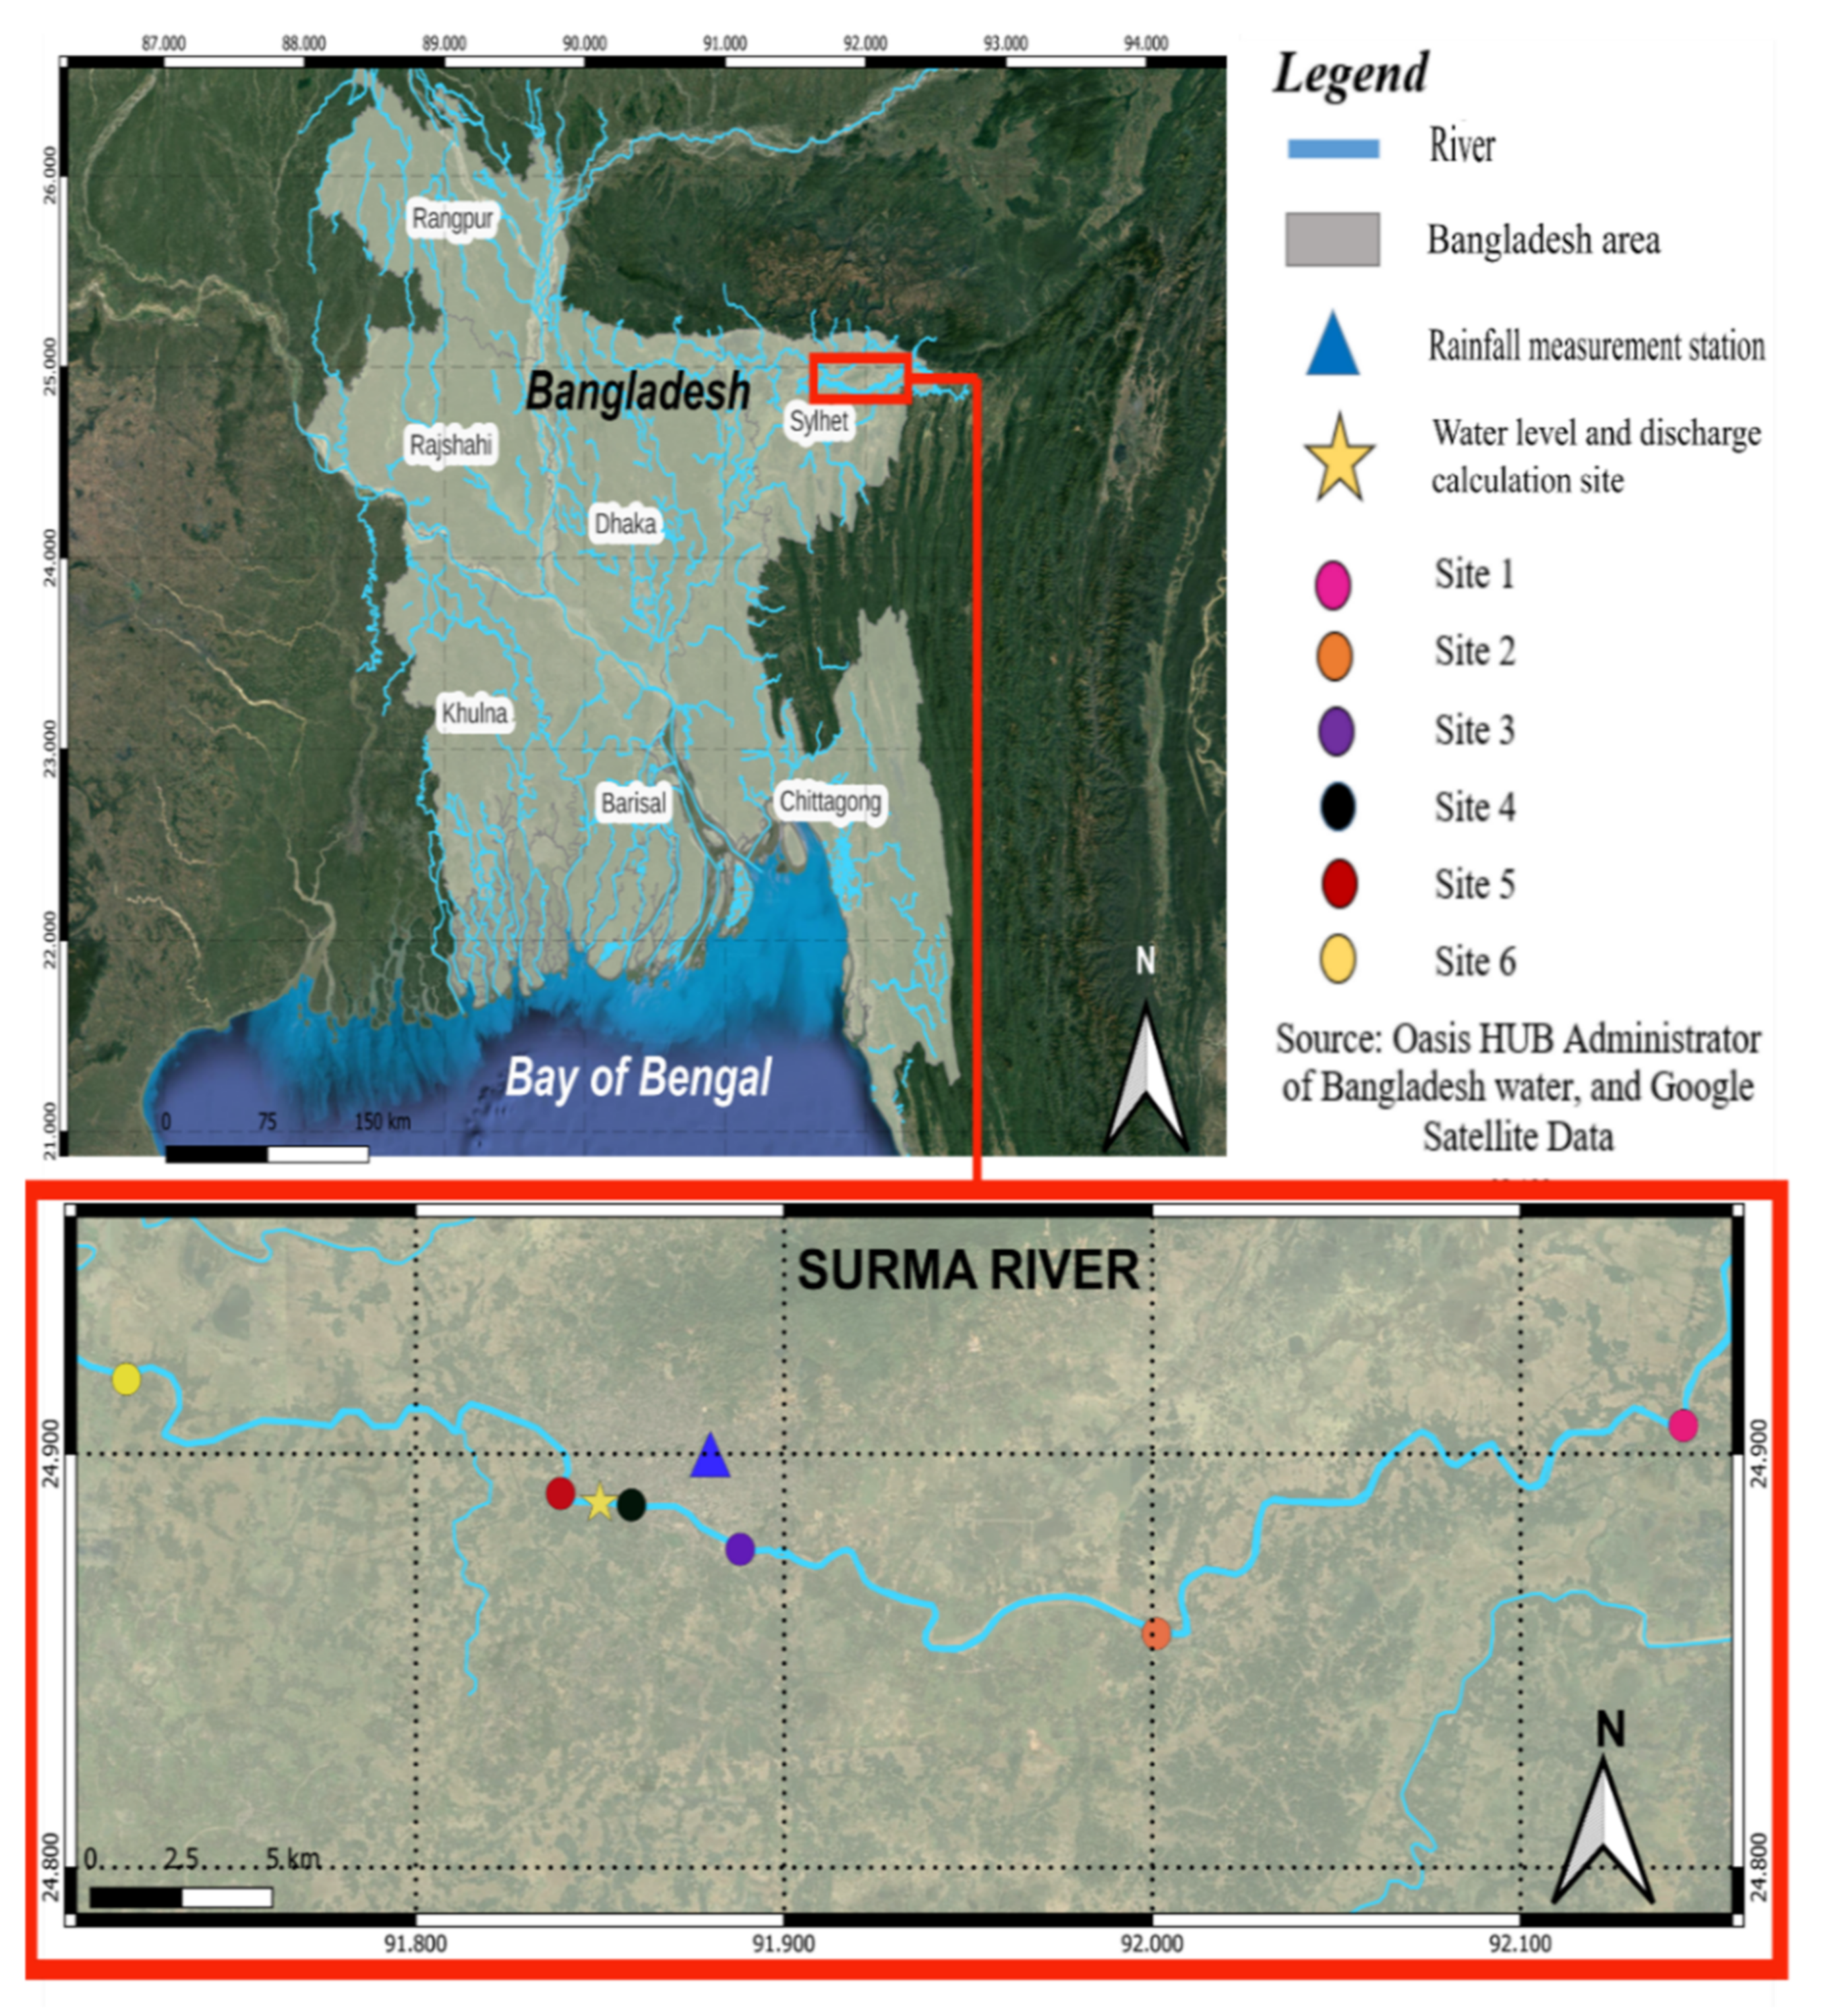
2.1. Study Area and Period

Six consecutive sampling sites were identified in the Surma River system, from upstream to downstream, considering a wide range of pollution types, human activities, and adjacent infrastructural establishment. The Surma River is an essential part of the Meghna River system in Bangladesh, which receives water flows from Shilong and Meghalaya, and is mediated through the Barak River in India [38,43]. Annual rainfall has been significantly reduced in the past 50 years in this area and therefore this has caused a reduction in river discharge and reshaped the overall morphological structure [44]. Figure 1 shows the geographical locations of the sampling sites, while Table 1 depicts the visual observations at selected sites during the sampling period. The sampling sites cover approximately 70 km of area, and data on water quality and fin fish diversity as well as plastic debris were collected during March 2022.

2.2. Acquisition of Water Quality Parameters

Physicochemical overview parameters of water, such as temperature, pH, salinity, dissolved oxygen (DO), total dissolved solids (TDS), and conductivity were recorded from each sampling site using an automated professional YSI ProDSS Multiparameter (Model 6050000). Three random measurements for each parameter in each site were taken at 6 h, 12 h, and 18 h time points to represent the environmental features of a whole day.

2.3. Plastic Debris Collection from Sampling Sites

Macroplastics collection from each sampling site was conducted by adopting and modifying the methodology of [45]. Three transects of 20 m long and 3 m wide (60 m2 area) were considered in such a way as to reflect the state of contamination in the visual assessment and each site was sampled in triplicate. Therefore, at each site plastic debris was collected from an area of 180 m2 in total. Transects were selected parallel to the riverbank. Macroplastics visible within transects were thoroughly collected by hand.

2.4. Categorization of Plastic Items and Weight Measurement

Collected plastic items were brought back to the laboratory facilities of the Faculty of Fisheries, Sylhet Agricultural University, and macroplastics were visually categorized based on their functional origin and composition following the NOAA classification [46]. Then, plastics from different categories were separately weighed to calculate the abundance of macroplastics in each sampling site. During this overall procedure, safety precautions were followed to avoid any kind of contamination from the collected plastic debris.

2.5. Calculation of Pollution Index and Fish Diversity Index

The water pollution index (WPI), was computed by using the recorded water quality parameters (temperature, pH, salinity, DO, TDS and conductivity) and compared with the standard limits in the freshwater systems [47,48]. The WPI was calculated using the following equation.
WPI   =   1 n i = 1 n P L i ,
where n is the number of parameters and PLi is the total pollution load of the ith parameter [48]. The table shows the limits of the rating classes in the water pollution index (Table 2).
Fish were sampled using the traditional cast netting approach and three consecutive casts were conducted at each site covering approximately 1 km in area. The average diameters of the cast nets were 3.04 m with an approved mesh size of 17.78 mm for including small indigenous fishes. To evaluate fish diversity indices, data were recorded for each catching effort at sampling sites and then processed in Excel sheets. Finally, dominance, evenness, Shannon, Simpson, Margalef, Berger–Parker, and Fisher’s alpha diversity indices were computed using diversity tools in PAST software v4.03.

2.6. Data for Depth Analysis

A 21-year span of data (2001–2021) on annual water level frequency, discharge, and annual rainfall in the Surma River for the selected studied area were collected from the Bangladesh Water Development Board (http://www.bwdb.gov.bd/, accessed on 16 June 2022). The obtained data were processed and analyzed to summarize in line graphs the characteristic changes in water level, discharge, and overall depth for the past 21 years.

2.7. Social Survey for Source Identification and People’s Awareness towards Plastic Pollution

A field survey was conducted by preparing a standard questionnaire to identify the possible major sources of riverine plastic pollutants and to categorize the level of consciousness among the common people towards plastic pollution. Data were collected using a combination of quantitative and qualitative approaches and recorded by filling out the questionnaire. The survey was conducted through face-to-face interviews with the participants. A total of 300 adult participants from diverse professions (50 from each site) were interviewed on site in their houses, or in nearby market areas to reach enough participants. A structured interview schedule was prepared with both open and defined closed questions. Questionnaires were designed to extract information about the source identification of macroplastics, and level of participants’ awareness, and their perceptions toward the maintenance and disposal of plastic wastes responsibly. A 20–30-min interview was held with each of the participants, and help from a local representative or language interpreter was needed in some cases where participants only spoke a regional language. Eleven (11) responses out of 300 were rejected at the final stages of data curation due to irrelevant information, restrictions on revealing the person’s identity, interpretation, and transcribing difficulties of extracted information. The closed questions were intended to categorize participants into different levels of awareness. The major form of closed question used to survey awareness among participants in the current research was: “1. Do you consider macroplastics as pollutants in the Surma River? 2. Are you concerned the Surma River is polluted by macroplastics? 3. Do you think that macroplastics pollution in the Surma River needs urgent action to mitigate it? 4. Do you agree that macroplastics wastes need responsible disposal? 5. Do you practice responsible disposal of macroplastics wastes occasionally? 6. Do you practice responsible disposal of macroplastics wastes regularly? 7. Do you choose to use other non-plastic materials instead of plastic when/where applicable? 8. Do you feel the responsibility of encouraging other people to be aware about pollution, maintenance, and responsible treatment of macroplastics wastes in the Surma River?” with the possible answer yes or no. The respondents who gave a positive response (yes) for questions 1–4 were categorized as “aware but careless”; those with a positive response for questions 1–5 as “aware and trying to maintain”; and those with a positive response for questions 1–8 as in the “well conscious and maintaining” category. The respondents who answered with a negative response (no) for questions 1–3 were termed as “not aware”. Finally, field collected data were transcribed and processed using the analytical method and represented in graphs and diagrams to summarize the findings.

2.8. Visualization and Data Analysis

QGIS v3.26 was used to construct the study area map. All raw data were processed in Excel at first, then analyzed with SPSS software v26 with one-away ANOVA at a significance level of p < 0.05. Graphs and line diagrams were constructed from SPSS analyzed data using Excel tools in Office 365. Principle component analysis (PCA) was performed in PAST software v4.03 where a scatter biplot was obtained based on PC scores and loading plot.

3. Results

3.1. Water Quality Analysis

Table 3 illustrates the status of water overview parameters at different study locations. Statistical distinctions among different sites were identified in the case of all parameters (p < 0.05). Moreover, S4 and S5 were significantly different (p < 0.05) from other sites. For temperature and conductivity, S1 was statistically detached (p < 0.05) from other sampling sites, while from higher to lower significance the trend was S4, S5, S6 > S2, S3, and S4, S5 > S2, S3, S6, respectively. In the case of pH and DO, only S4 and S5 had a statistical variance in comparison with other sites (statistical variations were obtained between S4 and S5 for pH values, but no differences for DO). Salinity and TDS at S4 and S5 were most significantly different (p < 0.05) from S1 and S2, followed by S6.
The results of the overview water quality parameters indicate a neutral (between 6.5 and 7.7; excepting S4 being slightly acid) low mineralized water (between 204 and 292 mS/cm) at all sampling sites. The low electric conductivity represents a low mineralization that was mainly dominated by major ions and therefore correlates with the low salinity. The temperature was measured between 26 and 28 °C. The sampling sites S4 and S5 represented different conditions in terms of DO and TDS in comparison to the other sampling sites, as a DO content between 2.97 and 3.68 mg/L indicates oxygen consuming conditions. This correlates with the slightly higher TDS content of 135 to 137 mg/L at those sites. Even though the visual assessment indicated high turbidity at S4 and low turbidity at S5, there was measured a higher content of total dissolved solids at both locations in comparison to the other sampling sites. This leads to the conclusion that S4 had a higher content of visible total dissolved solids than S5 where the total dissolved solids are likely to have a smaller grain size, a conclusion that correlates with the field observation of sandy soil at S4 and clayey soil at S5. Both sites are prone to sediment particle movement as they are close to ferry routes and used for washing and bathing activities. However, these two sampling sites have already undergone a degradation in water quality as the oxygen consuming conditions clearly indicate.

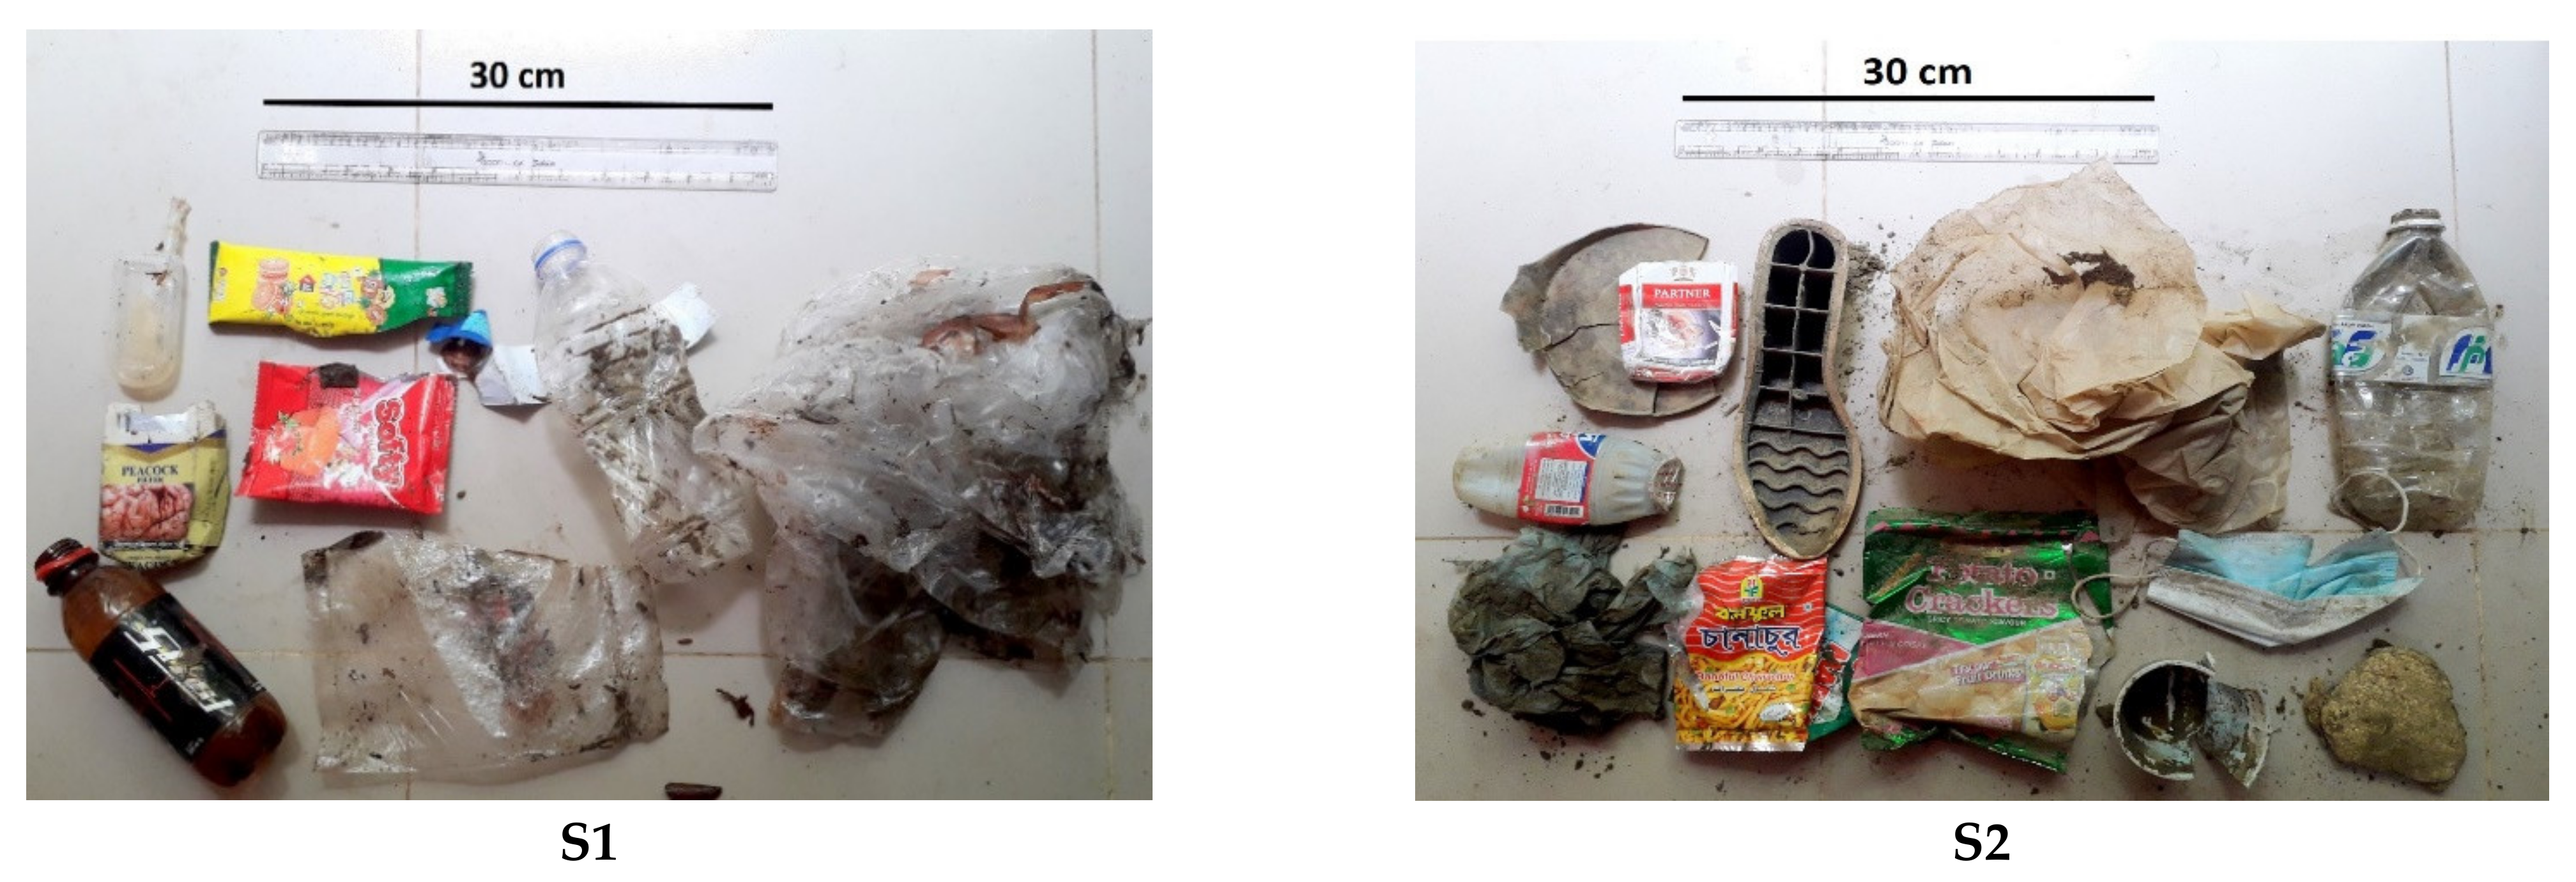
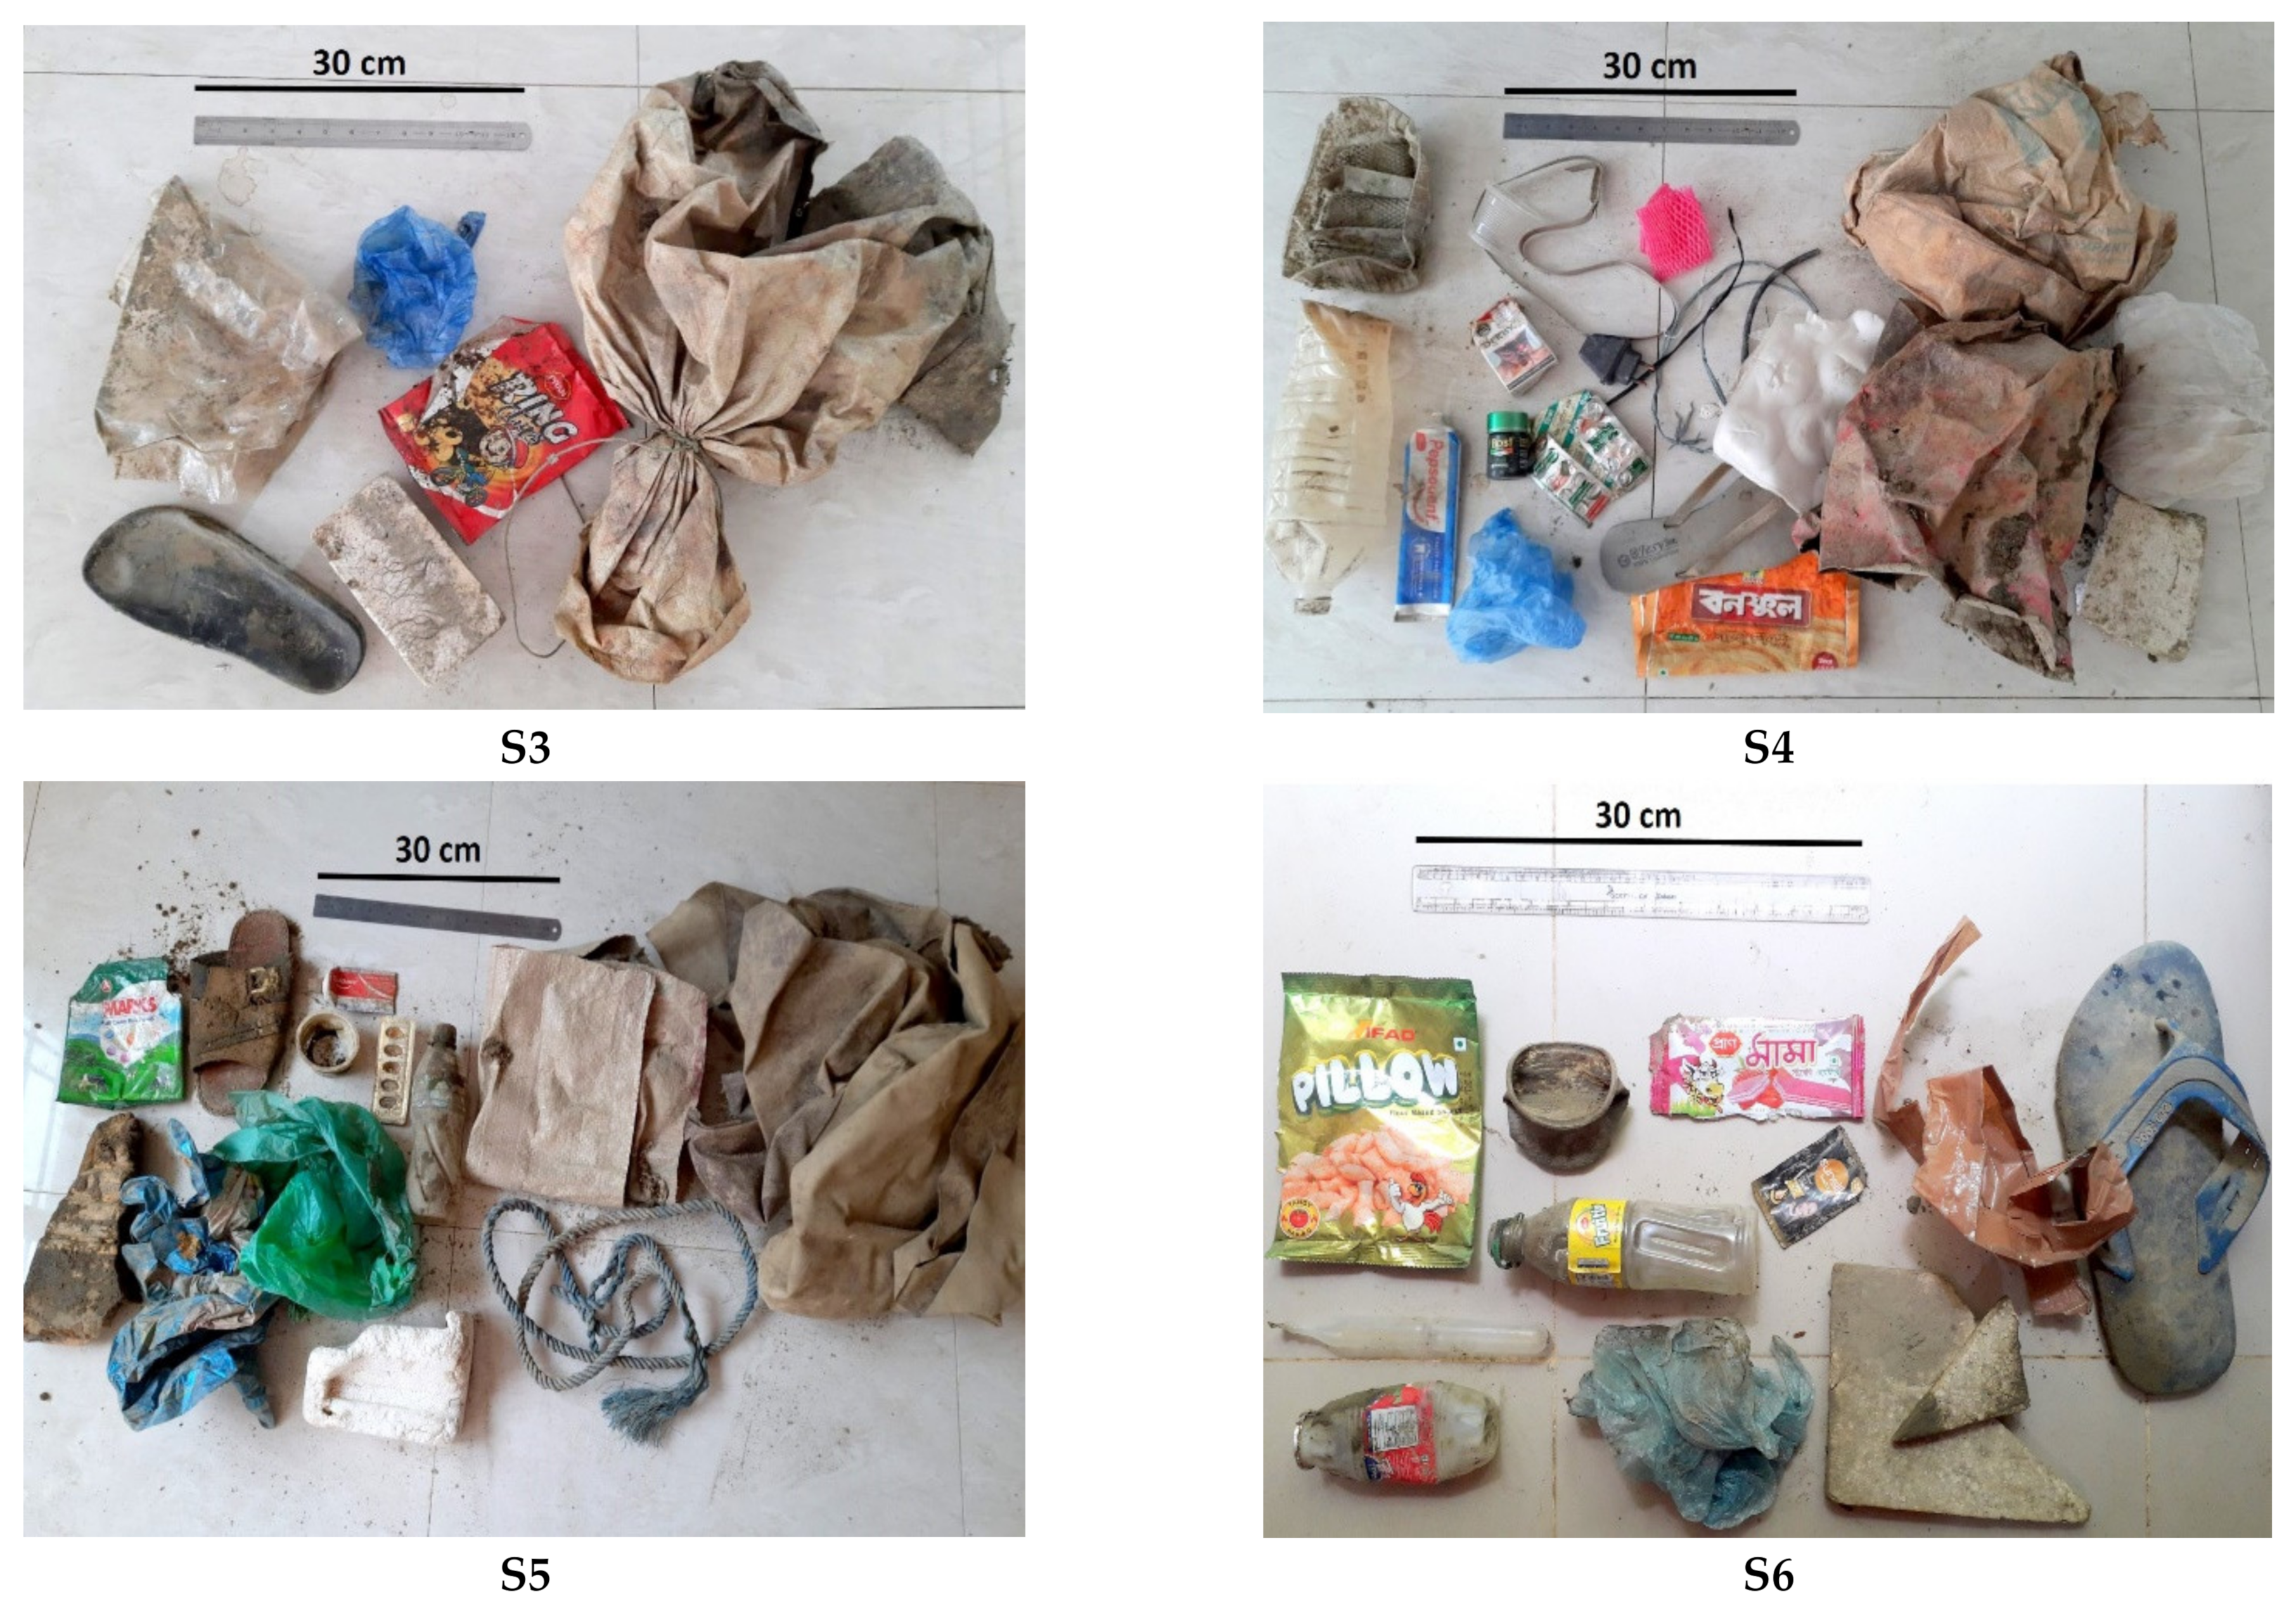
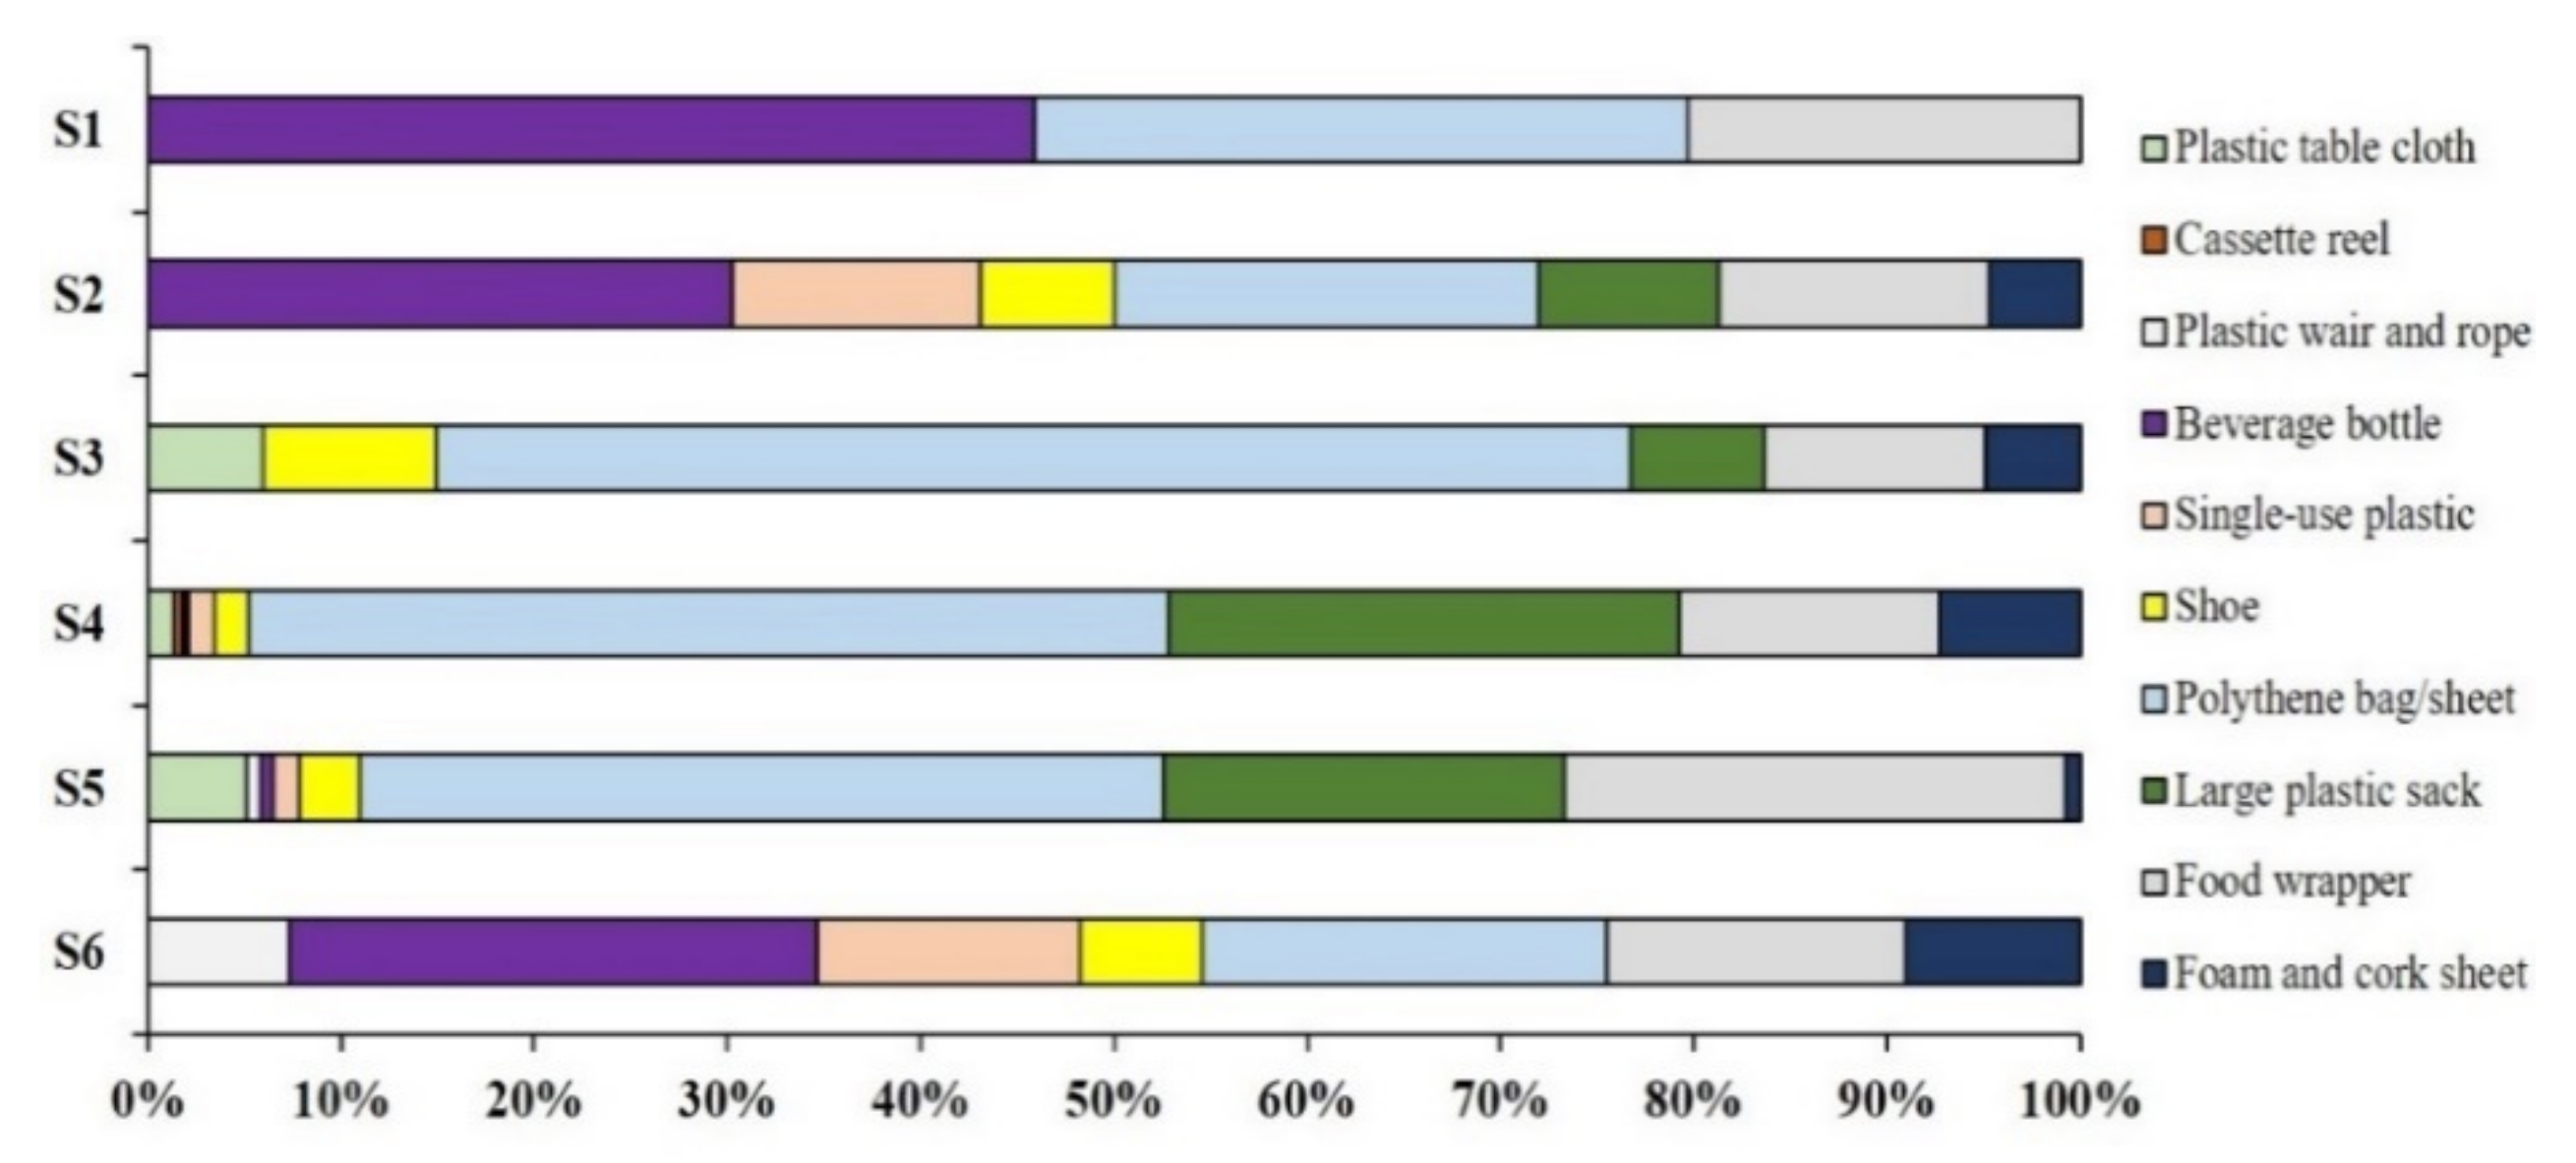
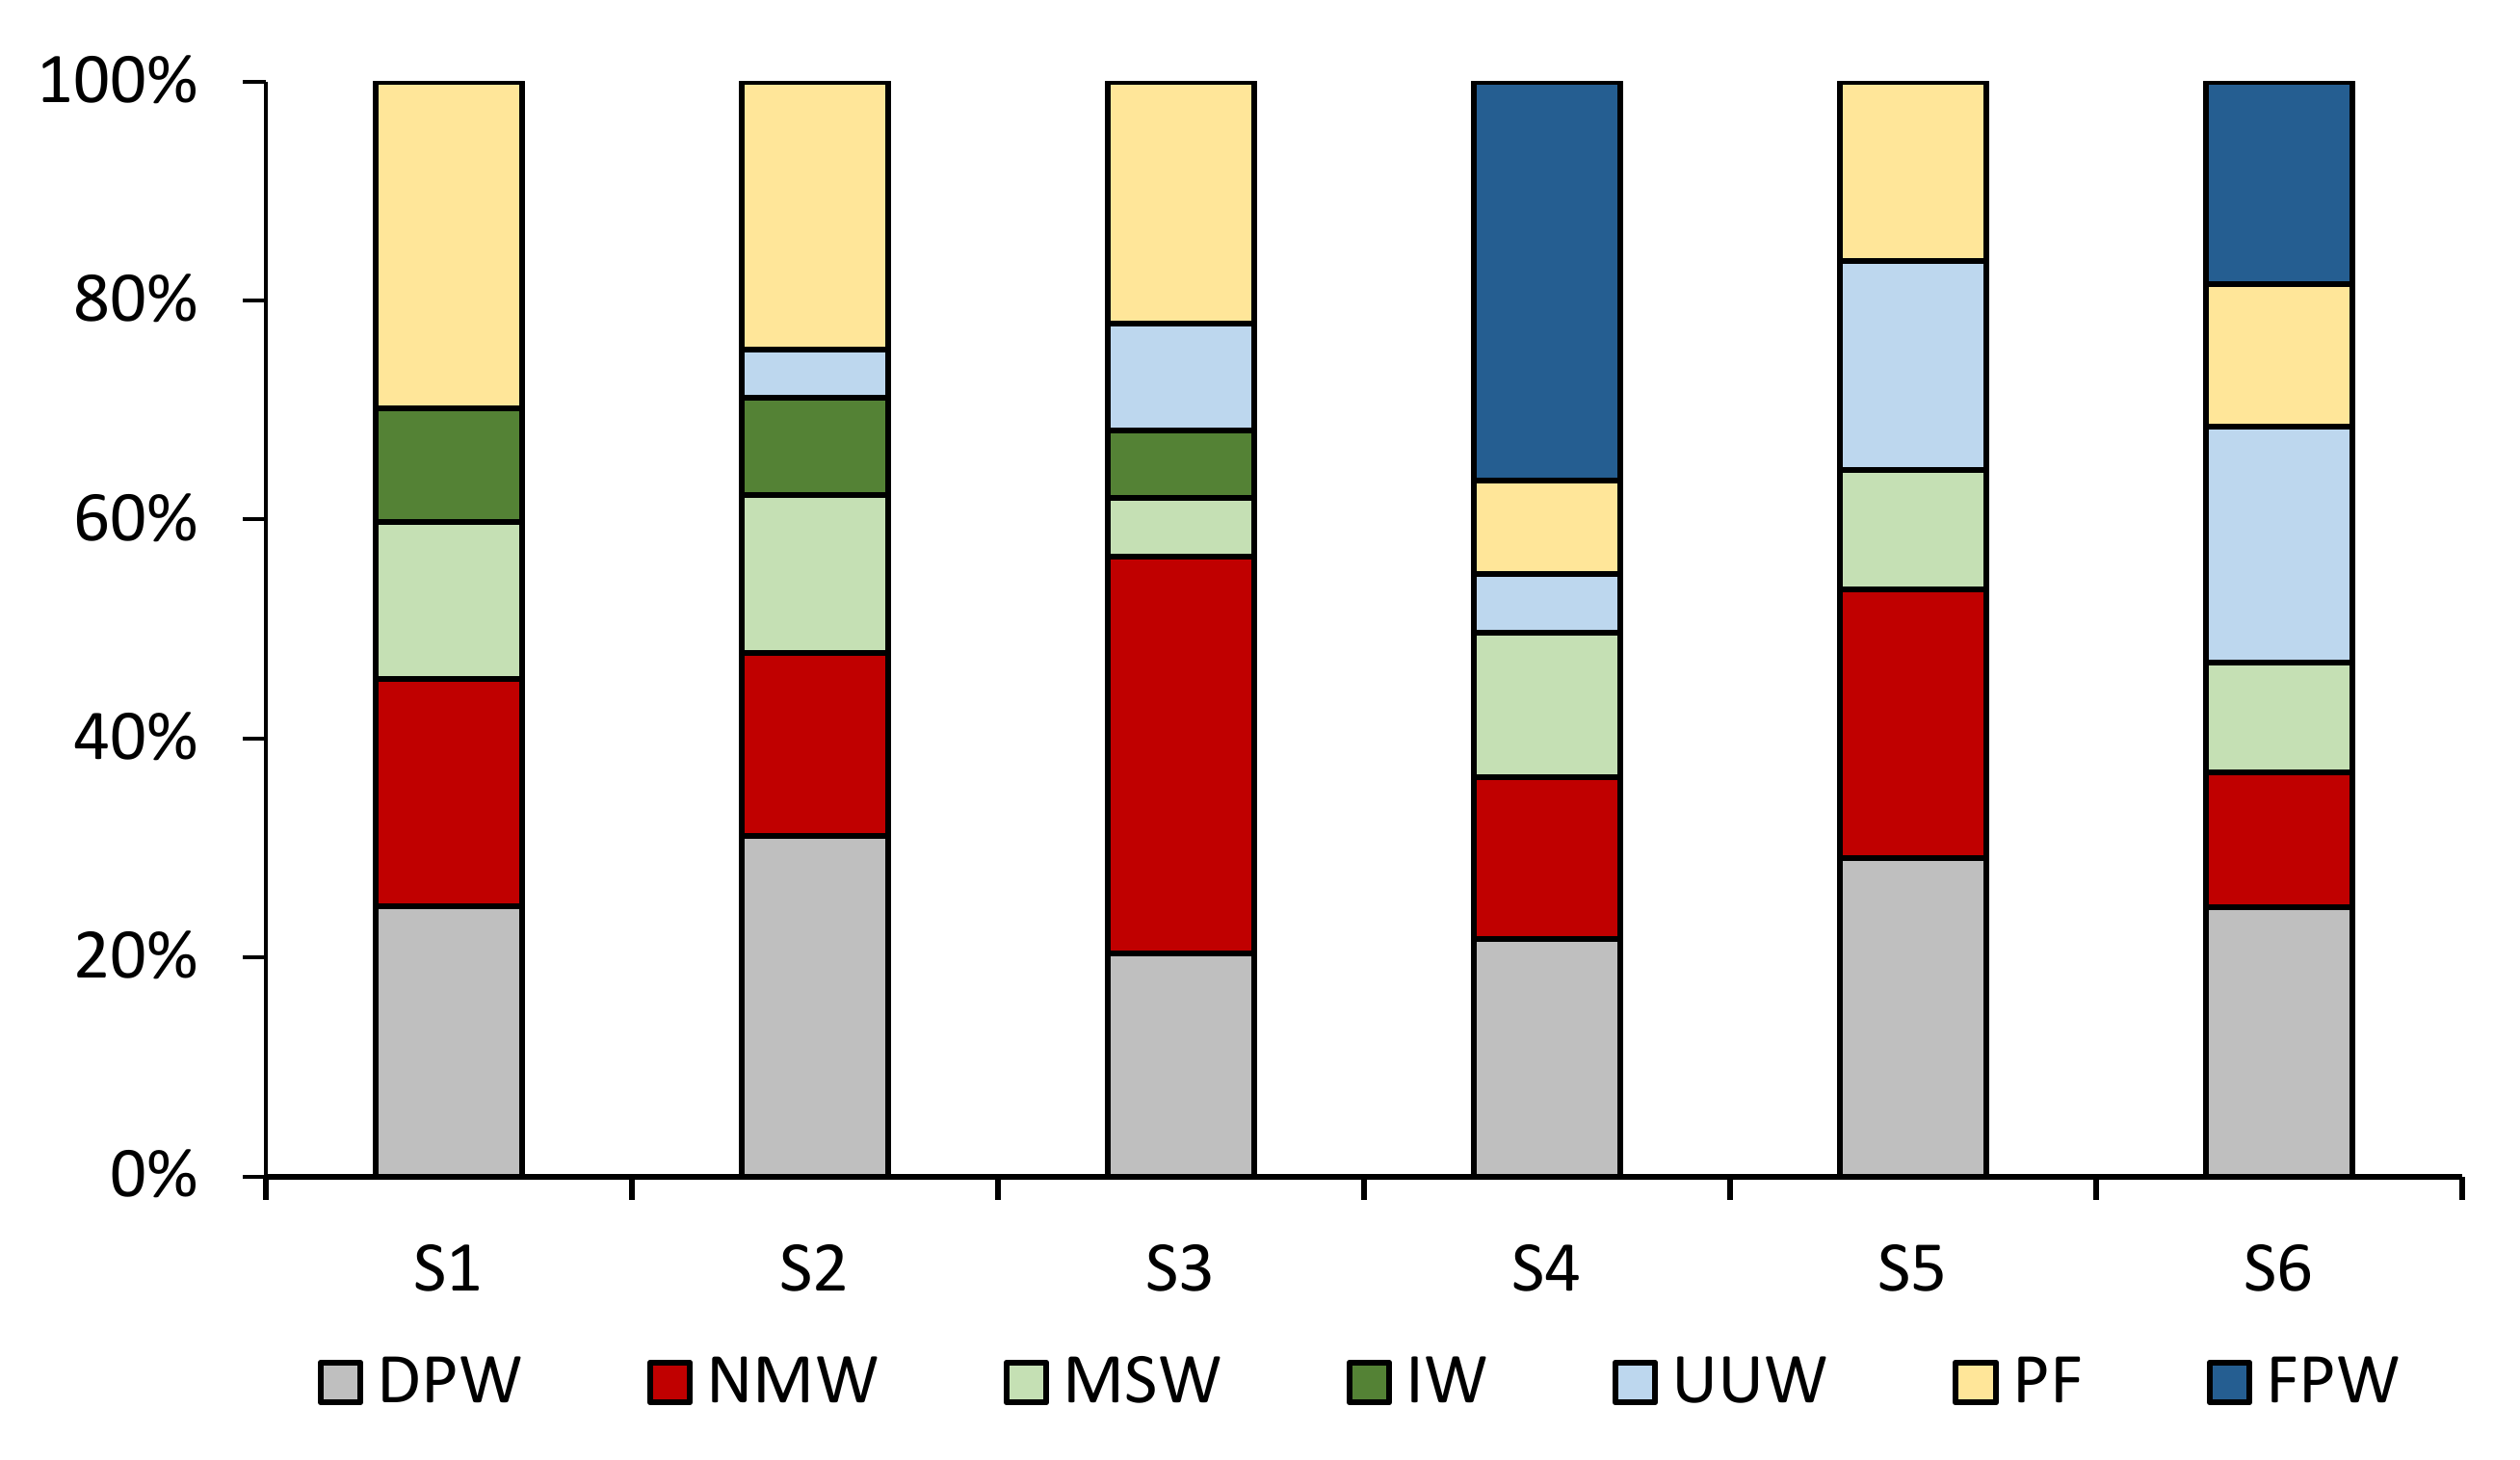
3.2. Categorization of Macroplastics

A total of 12 categories of macroplastics items were identified in the current study. Table 4 and Figure 2 represent the available macroplastics items with their polymer types collected from different sampling sites. The common types were disposable plastic table cloths, old plastic cassette reels, pieces of plastic rope and electrical wire, beverage bottles (predominantly soft drinks, oil, and water bottles), and single-use plastic products such as glass, plates, straws, spoons, cups, etc., disposable shoes, plastics of pharmaceutical origin (medication packets and pots), personal care products (toothpaste cover, shampoo bottles, etc.), polythene bags (predominantly shopping bags, trash bags, single-use bags, etc.), large polythene sheets, large plastic sacks (mainly cement bags), food and fruit wrappers of different size, and throwaway foam and cork sheet pieces. The lowest number of plastic categories was collected from S1, in contrast, the highest plastic categories were recorded at S4 followed by S5.

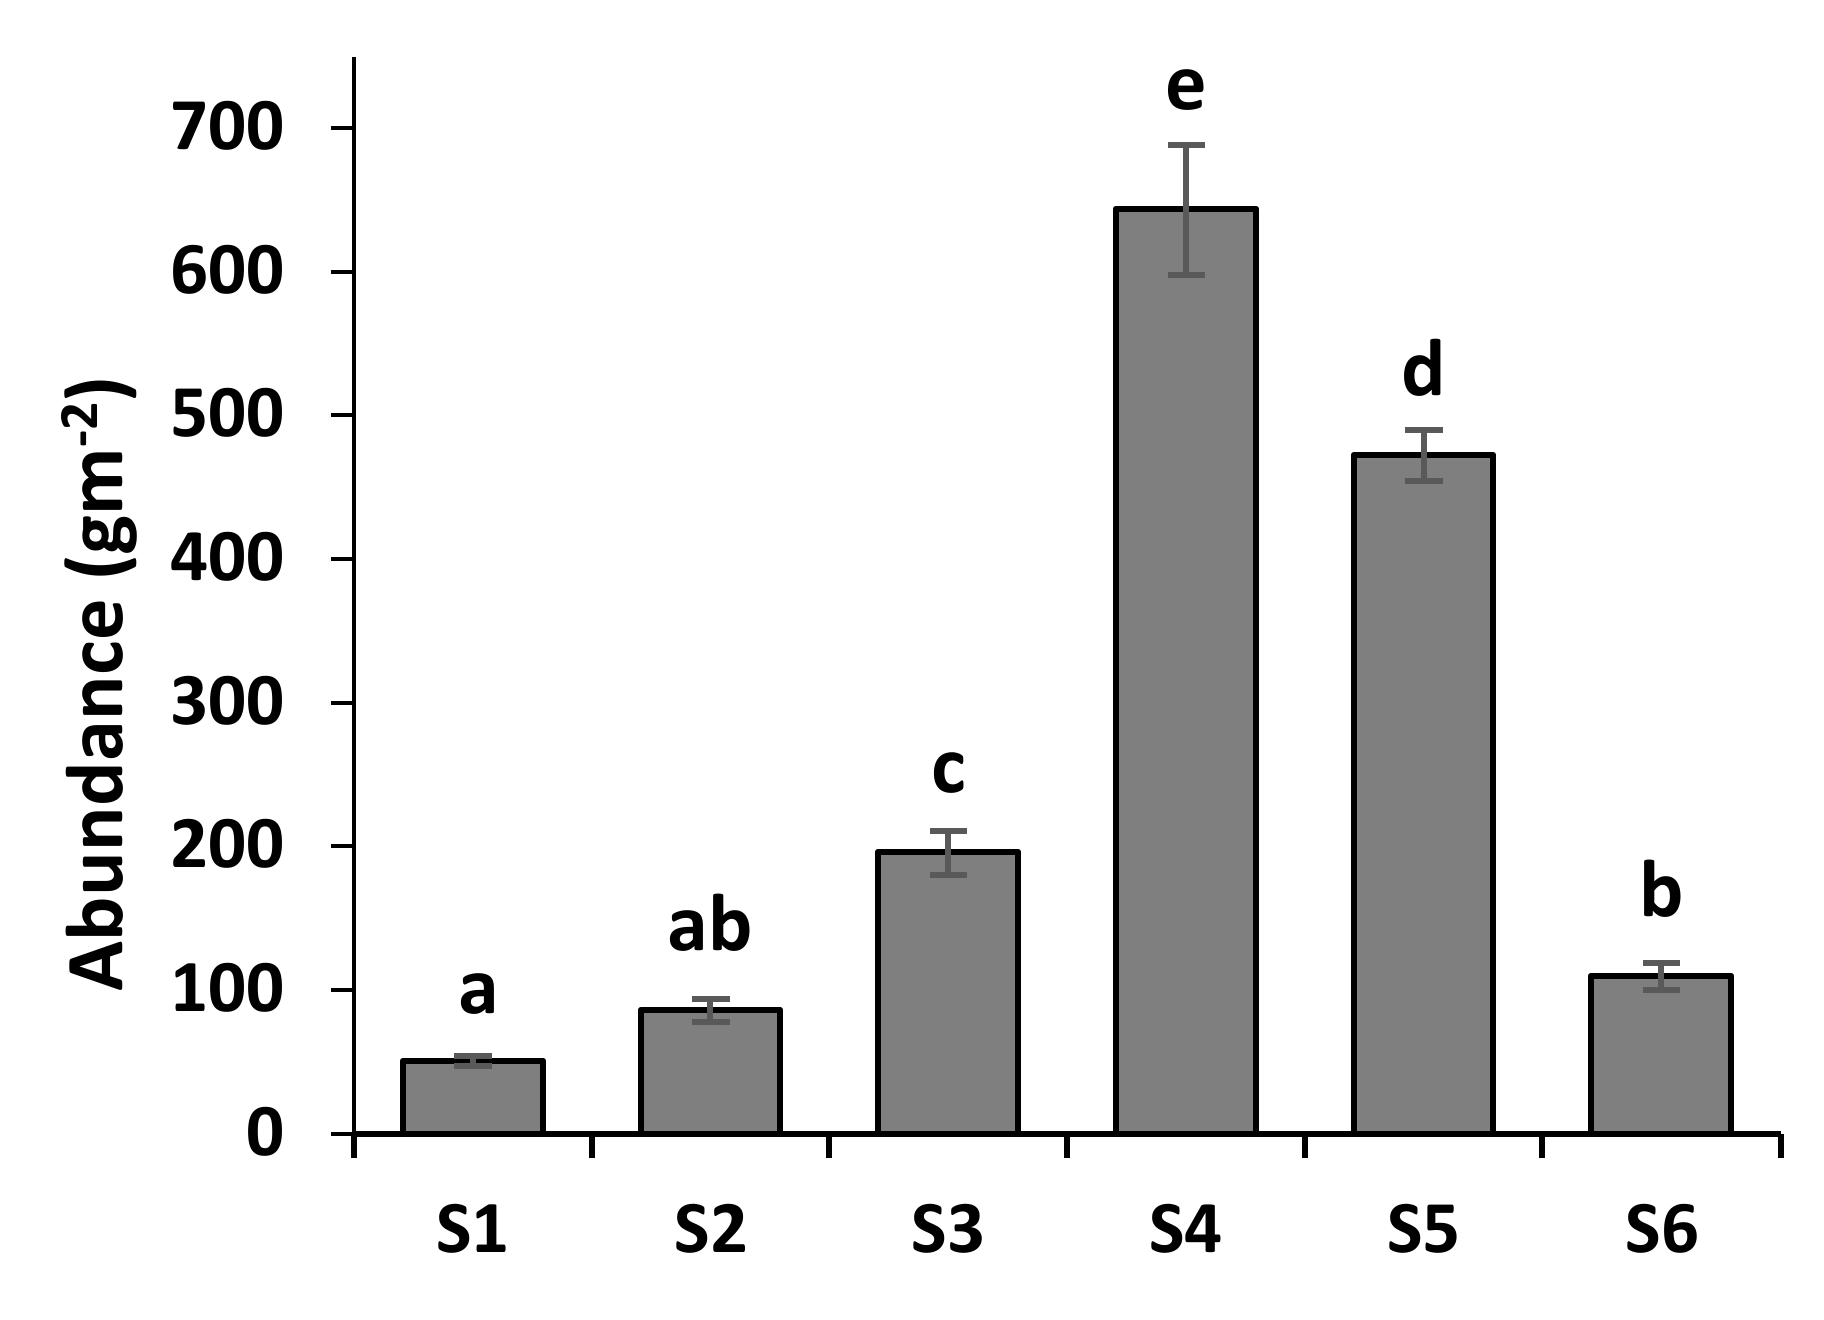
3.3. Total Macroplastics Concentration at Sampling Sites

In the present study, the highest amount of macroplastics were documented at S4 (643.41 gm−2) followed by S5 (472.36 g m−2), S3 (195.81 g m−2), and S6 (109.84 g m−2) (p < 0.05) (Figure 3). In contrast, the lowest amount was obtained from S1 (50.94 g m−2) (Figure 3). No statistical distinction was observed between S2, S1, and S6. Figure 4 illustrates the proportion of major macroplastics types collected from the sampling sites. The study showed that polythene bags were the major macroplastics item found predominantly on almost every site. Plastic beverage bottles were the second highest debris; however, they were absent at S3, and very minor percentages were recorded at S4 and S5. Additionally, food wrappers and large plastic sacks were also dominating in different study areas, however, plastic sacks were absent at S1 and S6 (Figure 4).

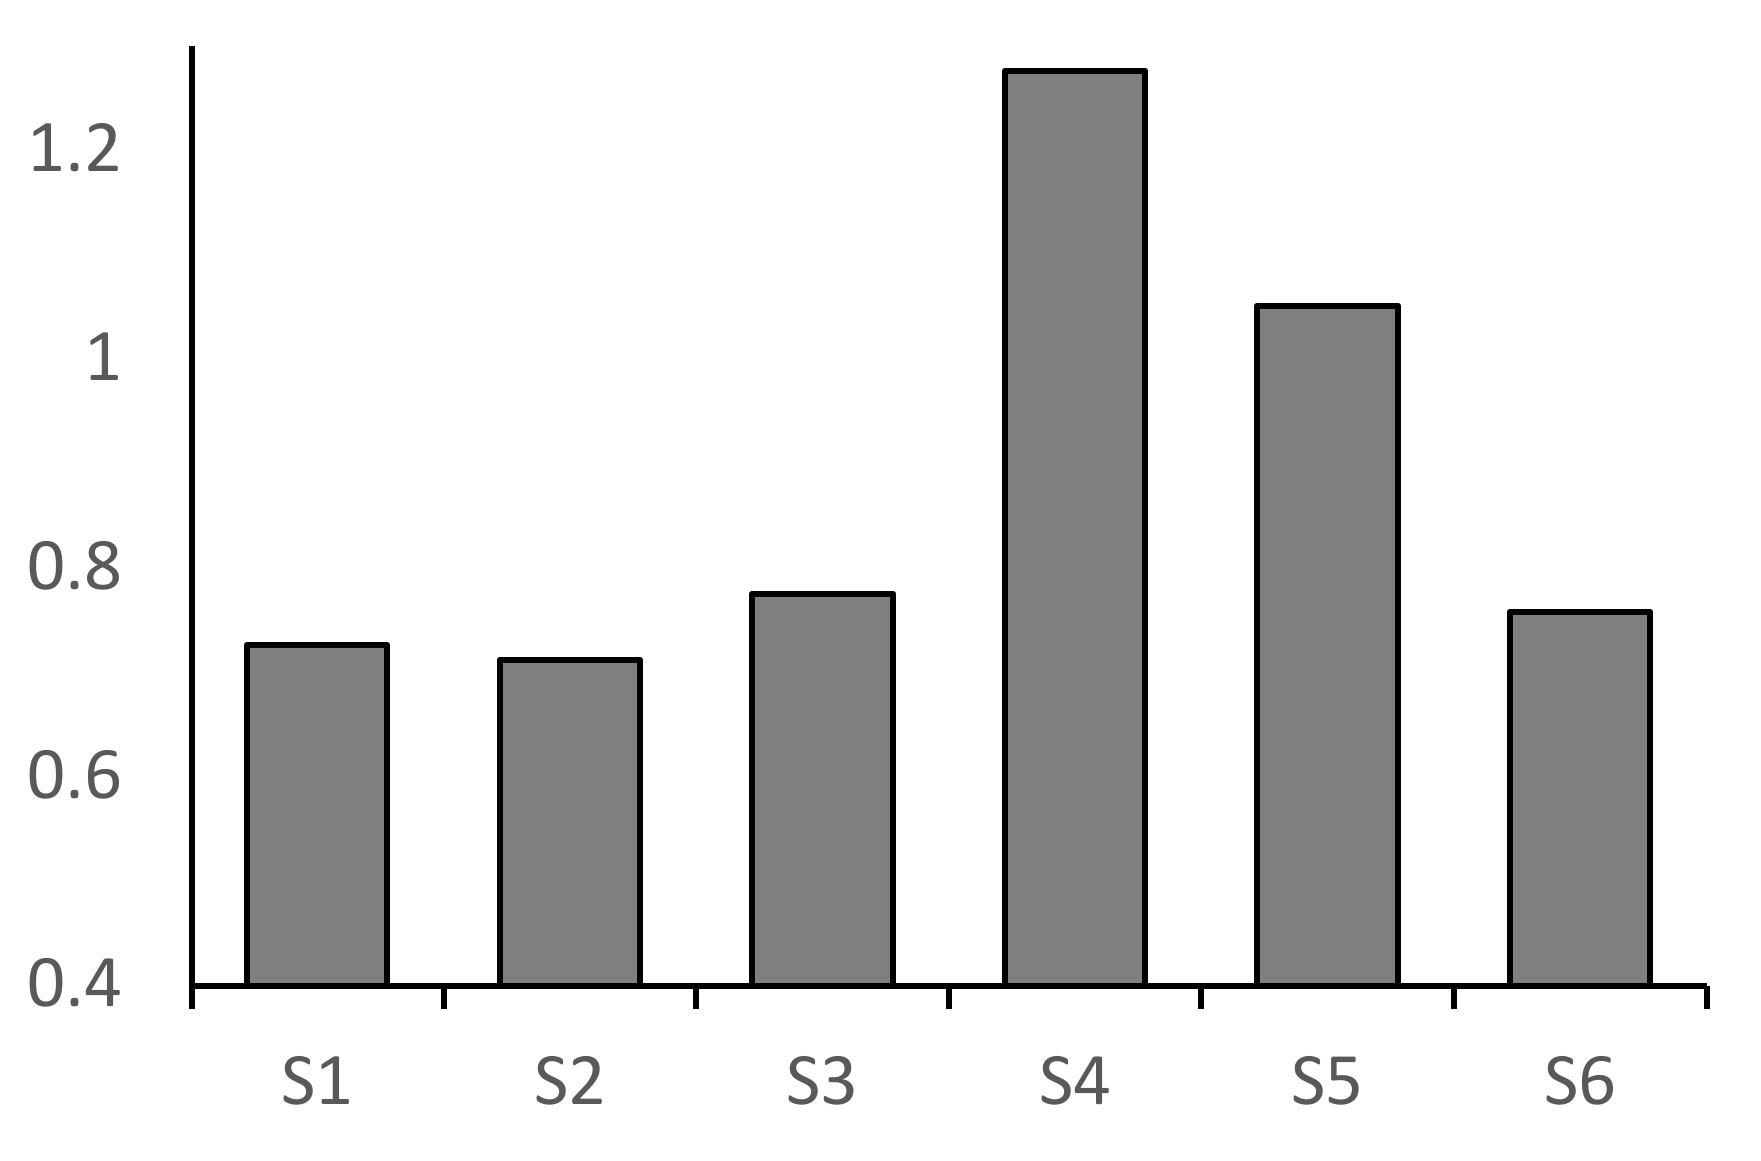
3.4. Pollution Index and Fish Diversity Indices

The current study found the highest WPI value for S4 followed by S5 (Figure 5), indicating extreme pollution status on those two sites with respect to standard WPI scores (Table 2). Consistently, S3 was marked as a moderately polluted site, while S1, S2, and S6 were recognized as comparatively less polluted sites (Figure 5) according to standard WPI scores (Table 2). Figure 6 delineates seven fish diversity indices for six study locations. Shannon, Margalef, and Fisher’s alpha indicated comparatively lower diversity at S4 followed by S5 and S3, while S2 and S6 had higher index values followed by S1 (Figure 6A). Similarly, Simpson and evenness indices also showed a better diversity condition at S1, S2, and S6 in comparison with S4, S5, and S3 (Figure 6B). Again, the dominance index was higher at S1, S2, S3, and S6, while the Berger–Parker index was higher at S1, S3, S4, and S5.

3.5. PCA of Water Parameters and Diversity Indices with Total Plastics

The PCA between plastics abundance with water quality parameters and fish diversity indices explained 96.68% and 95.41% of the total variance, respectively. Figure 7A shows that salinity and total plastic values were poorly correlated with the other parameters. A clear formation of two correlated groups of pH and DO as well as temperature, TDS, and conductivity have been reported, while the parameter values in these two groups changed inversely. The other variables slightly influenced the location of points S1–S6 concerning the first axis, while conductivity, DO, TDS, pH, and temperature influenced the arrangement of points S1–S6 along the second axis. Consequently, the lowest values of DO and pH were found at S4, S3, and S1, and the highest at S5. On the other hand, S2 was characterized by values close to the mean values of these parameters. This was evidenced by the location of the S2 point near the zero value on axis 2. Again, in Figure 7B the right angle between the vectors representing total plastic and most of the indices (except evenness and Berger–Parker) shows that there is no correlation between them. Similarly, the location of points along axis 1 was primarily determined by total plastic, and to a lesser extent by evenness and Berger–Parker. The graph also clearly shows that the other indicators were very weakly correlated with total plastic, and the dominance changed inversely to the Fisher’s alpha–Simpson group.

3.6. Depth Analysis of the Surma River

Figure 8 illustrates the annual river discharge, rainfall, and water level of the Surma River from 2001 to 2021. Integrated analysis elucidated that fluctuations in average river water levels were concomitant with annual river discharge and annual rainfall. However, the water level was not in line with river discharge from the years 2018 to 2021. River discharge level was quite a bit higher from 2018 to 2021; in contrast, the water level went down following the annual rainfall trend. On the other side, a massive plastic deposition on the riverbed was clearly visible during the sampling period (Figure 9A). The frequent plastic availability in riverbeds ensured a high abundance of macroplastics in the Surma River (Figure 9B), indicating the potential aggregation of plastic debris on the river floor. Moreover, a higher discharge level leads to higher flow velocities, and in this case, bigger microplastic particles can also be transported along the flow path.

3.7. Plastic Source Identification and Awareness of Plastic Pollution

Table 5 portrays a brief description of the gender, age group, education level, and occupation of participants in the survey. Based on the present survey, a total of seven major sources of plastic pollution were identified. They were domestic plastic waste, nearby market waste, municipal solid waste, industrial waste, upstream urban waste, pluvial flow, and finally fish-market plastic waste (Figure 10). House-borne plastic waste, nearby local market waste, and pluvial flow were the almost predominant pollution sources in every study area (Figure 11).
Furthermore, it was also noted that riverside wholesale fish markets were also a substantial source of plastic pollution when adjacent to study locations (S4 and S6). Although the Surma River is subjected to being polluted by a wide range of sources, the local people are still nonchalant about the consequences.
Figure 12 depicts the categorization of awareness of plastic pollution among local people in different study areas. According to the current findings, overall, 19% of people were unaware of plastic pollution and throw plastic debris extensively on riversides, while 30% of total participants were found to be aware of the pollution, but still pollution was increasing due to their ignorance. Awareness is gradually building among the people; the survey recorded that 39% of participants were aware of macroplastics pollution and trying to practice responsible disposal. Again, very few (11%) participants were found to be well aware of plastic pollution, and maintaining responsible disposal, though the survey could not record a single person at S4 and S5 who was totally conscious of plastic pollution and managing disposable plastic debris properly. Finally, after analyzing the entire study, some obstacles to managing plastic waste and possible future initiatives were documented as summarized in Table 6.

4. Discussion

The water quality of a certain environment is quite significant in understanding the health condition of a water body and/or the extent of pollution in an aquatic system [51]. The disposal of pollutants into an aquatic habitat might cause a wide fluctuation in vital physicochemical properties of water [47]. Over the past few decades, the water quality of the Surma River has deteriorated notably, which is a big concern for the surrounding people who directly or indirectly rely on this river for drinking water and/or for other purposes [38]. According to the present findings, S4 and S5 showed poor water quality, which was beyond the standard limit, particularly for pH (S4) and DO (both). The present findings are aligned with the investigation of Shahnawaz et al. [52]. The deterioration of the water quality in those particular areas might be because of the large amount of pollution and from the discharge of wastewater, as indicated by oxygen consuming conditions.
Throwaway macroplastics from human residences are the predominant source of plastic pollution and are most visible in the environment. Authors from previous studies identified a wide variety of plastic garbage, for instance, beverage bottles, food wrappers, polythene bags, foam and cork sheets for packaging, plastic containers, cigarette butts, single-use plastic products, etc., on the freshwater river bank [2,10,45,53]. A massive abundance of macroplastics on the river bank was reported in the current study when compared with Blettler et al. [2], who documented only 6.88 g m−2 plastic debris on the shoreline of a freshwater lake. Bir et al. [53] also mentioned the presence of plastic debris in the Rupsha River; however, the abundances were not as high as those identified in the current investigation. The total amount of plastic garbage collected from the middle stream of the Surma River was significantly higher in comparison with the previous studies, possibly due to the mismanagement of disposable plastic products [10,45]. From physical observation, it was noted that the Surma riverbank at S4 and S5 was treated as a dumping area for plastics and other wastes. Besides, the nearby commercial infrastructures, recycling factories, and large fish markets were also disposing of their wastes on the riverbank, and might be a potential source of the higher number of plastics recorded at S4 and S5.
WPI, the most recent and reliable pollution index, is being validated for the understanding of surface and groundwater pollution status [48,54,55]. According to the standard range, S4 and S5 were recognized as highly polluted in the current study, probably due to the higher amount of waste dumping, and due to the other means of pollutants and/or toxicants. The present findings corroborated the works of Hossain and Patra [48]. The Shannon–Weaver index value recorded in the current study was parallel with the 3.40 documented in Hakaluki Haor, signifying a propitious diversity status [56]. The previous investigation also assumed that the diversity index values fluctuated from 2 to 2.7 in the Kushiara and the Surma Rivers, depending on various months of the year [34,57,58]. In contrast, 1.805 to 1.994 index values in the Shari-Goyain River [59] indicated a lower fish diversity due to natural and diverse man-made causes, which were also identified at two sampling sites (S4 and S5) of the current study. The Margelef diversity index varied from 2.1 to 8.9 in several freshwater systems because of seasonality [60,61,62] and notably due to poor waste management and degradation of water quality [58,63]. On the other hand, the high extent of pollution had a negative impact on the fish diversity in the Surma River. The diversity indices exhibited a poor status along with high dominance and evenness at S4 and S5, possibly because of a low oxygen content resulting from poor water quality, human activities, and most significantly due to physical barriers interrupting the normal fish migration [52]. The concrete structures supporting the bridge across the Surma River, and massive plastic deposition, decrease the river depth, which are perhaps the reason for losing fish diversity at S4. The findings of the current study remained aligned with the findings of Shahnawaz et al. and Galib et al. [52,60].
The factor analysis built a clear relationship between total plastics and water quality, and fish diversity. The S4 and S5 were separated from the other sites due to their extreme pollution rate. The total plastic availability was poorly correlated with salinity and slightly related to remaining physicochemical variables for most of the studied sites. Again, the majority of the diversity indices were also reported to show no correlation with the total plastic concentration. Similar findings were also noted with a higher extent of plastics in the Ganga River water [64]. The current factorial analysis also exhibited the dominancy of particular types of species and evenness (indirectly lower fish diversity) with the increase of plastic abundance, which is probably due to poor water conditions and the availability of pollutants in the environment [33,56,60].
Based on the previous data on water level, discharge and rainfall, there was not clear evidence for decreased depth of the Surma River. It might be said that due to elevated discharge and less rainfall in the past five years, the water level was down, which did not mean that the river depth was increasing or there was less plastic deposition on the riverbed [44]. During the sampling period, the water level of the river was quite low because of the dry season, while the plastics deposition in the Surma River was obvious, which surprisingly made a small island of plastic garbage in the middle of the river. Plastics, therefore, act as particles under certain flow conditions which caused the replacement of the natural form of sandbank at that location. It might be a potential reason for decreasing the depth of the river at certain river points, which can raise a plethora of complications in the near future; for instance, it may raise the possibility of flash flooding during monsoons [65], disturb the movement of residents species, have an impact in feeding and natural behavior of organisms, and eventually could be the major cause of the destruction of the ecological balance [52].
Previous studies demonstrated that plastic debris might enter the freshwater systems through natural transport systems and/or man-made activities [1,9,13]. Natural pathways include pluvial flow, wind, flood, etc., whereas man-made causes comprise direct dumping of garbage into the water or on riverbanks from domestic, industrial, agricultural, and municipal sources [13]. The key sources of riverine plastic pollution identified from the current examination were similar to these findings, while plastic wastes being dumped directly into the water from the surrounding wholesale fish market is a critical issue. Garbage dumping sites have been identified along the riverine systems in Chile [66]. Similarly, the freshwater systems in the Romanian Carpathians were subjected to being polluted with a high level of plastic waste dumped directly into the rivers and lakes [67]. The main reason for this is improper waste management across the city water bodies. Therefore it is proven that macroplastics pollution in freshwater systems is a global issue [9,37,68]. The current investigation pointed out the fact that plastic pollution in the Surma River is a big concern at this moment. On the other hand, a current survey among the local community revealed that people need a proper place where they can dispose of plastic waste with an appropriate management system. Additionally, suitable alternatives to daily used plastic products are also urgently needed [13]. In these circumstances, not only is awareness of the problem required but proper initiatives should also be implemented to minimize the detrimental effects [10]. Without these, the Surma River might lose its beauty, biodiversity, and other resources in the near future, with a subsequent impact on human life.

5. Conclusions

The Surma River system is being polluted due to inadvertent plastic dumping along the river. Consequently, the water quality is deteriorating day by day, which impacts fish diversity and other aquatic resources. The high amount of plastic deposition on the river floor might be a potential threat that decreases river depth and may cause massive floods during monsoon. The massive dumping of macroplastics has also compromised the quality of consumable fish and aquatic organisms as well as the water purity of study sites. Continuing this practice in the Surma River system would be a serious threat to its ecosystem components and be responsible for the spreading of vast microplastic sources through the coastal ecosystem. Hence, there is an urgent need to raise awareness among the common people regarding the fate and consequences of plastic pollution. Additionally, policymakers should focus on developing appropriate rules and regulations suitable for the country and its citizens. Finally, enforcement of laws in a proper way is required to reduce the severity of pollution.

Author Contributions

A.H.A. and G.C.—conceptualization, methodology, writing, and original draft preparation; D.A., Y.O.A. and I.J.—reviewing the literature, data curation, writing, and validation; M.A.H.—conceptualization, data curation, formal analysis, review, editing, and manuscript publication; P.S.—review, editing, and manuscript publication; M.M.I.—supervision, project administration, funding acquisition, conceptualization, and development of methodology. All authors have read and agreed to the published version of the manuscript.

Funding

The research was funded by the SAURES and UGC in referring budget code SAURES-UGC-21-22-64, Bangladesh.

Data Availability Statement

Data will be available from the corresponding author by request.

Acknowledgments

The authors acknowledge all the participants who spare their valuable moments to take part in the survey for current investigations.

Conflicts of Interest

The author declares there is no conflict of interest.

References

  1. Emmerik, T.; Mellink, Y.; Hauk, R.; Waldschläger, K.; Schreyers, L. Rivers as Plastic Reservoirs. Front. Water 2022, 3, 1–8. [Google Scholar] [CrossRef]
  2. Blettler, M.C.M.; Ulla, M.A.; Rabuffetti, A.P.; Garello, N. Plastic Pollution in Freshwater Ecosystems: Macro-, Meso-, and Microplastic Debris in a Floodplain Lake. Environ. Monit. Assess. 2017, 189, 581. [Google Scholar] [CrossRef]
  3. Hahladakis, J.N.; Velis, C.A.; Weber, R.; Iacovidou, E.; Purnell, P. An Overview of Chemical Additives Present in Plastics: Migration, Release, Fate and Environmental Impact during Their Use, Disposal and Recycling. J. Hazard. Mater. 2018, 344, 179–199. [Google Scholar] [CrossRef]
  4. Li, W.C.; Tse, H.F.; Fok, L. Plastic Waste in the Marine Environment: A Review of Sources, Occurrence and Effects. Sci. Total Environ. 2016, 566–567, 333–349. [Google Scholar] [CrossRef] [PubMed]
  5. Yuan, Z.; Nag, R.; Cummins, E. Ranking of Potential Hazards from Microplastics Polymers in the Marine Environment. J. Hazard. Mater. 2022, 429, 128399. [Google Scholar] [CrossRef] [PubMed]
  6. Law, K.L.; Narayan, R. Reducing Environmental Plastic Pollution by Designing Polymer Materials for Managed End-of-Life. Nat. Rev. Mater. 2022, 7, 104–116. [Google Scholar] [CrossRef]
  7. Almeshal, I.; Tayeh, B.A.; Alyousef, R.; Alabduljabbar, H.; Mustafa Mohamed, A.; Alaskar, A. Use of Recycled Plastic as Fine Aggregate in Cementitious Composites: A Review. Constr. Build. Mater. 2020, 253, 119146. [Google Scholar] [CrossRef]
  8. UNEP. Single-Use Plastic: A Roadmap for Sustainability; United Nations Environment Programme: Nairobi, Kenya, 2018; ISBN 9789280737059. [Google Scholar]
  9. Zhao, J.R.; Zheng, R.; Tang, J.; Sun, H.J.; Wang, J. A Mini-Review on Building Insulation Materials from Perspective of Plastic Pollution: Current Issues and Natural Fibres as a Possible Solution. J. Hazard. Mater. 2022, 438, 129449. [Google Scholar] [CrossRef]
  10. Winton, D.J.; Anderson, L.G.; Rocliffe, S.; Loiselle, S. Macroplastic Pollution in Freshwater Environments: Focusing Public and Policy Action. Sci. Total Environ. 2020, 704, 135242. [Google Scholar] [CrossRef]
  11. Kasavan, S.; Yusoff, S.; Rahmat Fakri, M.F.; Siron, R. Plastic Pollution in Water Ecosystems: A Bibliometric Analysis from 2000 to 2020. J. Clean. Prod. 2021, 313, 127946. [Google Scholar] [CrossRef]
  12. Geyer, R.; Jambeck, J.R.; Law, K.L. Production, Use, and Fate of All Plastics Ever Made. Sci. Adv. 2017, 3, e1700782. [Google Scholar] [CrossRef] [PubMed] [Green Version]
  13. Emmerik, T.; Schwarz, A. Plastic Debris in Rivers. WIREs Water 2020, 7, 1–24. [Google Scholar] [CrossRef] [Green Version]
  14. Khan, F.R. Prevalence, Fate and Effects of Plastic in Freshwater Environments: New Findings and Next Steps. Toxics 2020, 8, 72. [Google Scholar] [CrossRef] [PubMed]
  15. Windsor, F.M.; Tilley, R.M.; Tyler, C.R.; Ormerod, S.J. Microplastic Ingestion by Riverine Macroinvertebrates. Sci. Total Environ. 2019, 646, 68–74. [Google Scholar] [CrossRef] [PubMed]
  16. Blettler, M.C.M.; Abrial, E.; Khan, F.R.; Sivri, N.; Espinola, L.A. Freshwater Plastic Pollution: Recognizing Research Biases and Identifying Knowledge Gaps. Water Res. 2018, 143, 416–424. [Google Scholar] [CrossRef] [Green Version]
  17. Giarrizzo, T.; Andrade, M.C.; Schmid, K.; Winemiller, K.O.; Ferreira, M.; Pegado, T.; Chelazzi, D.; Cincinelli, A.; Fearnside, P.M. Amazonia: The New Frontier for Plastic Pollution. Front. Ecol. Environ. 2019, 17, 309–310. [Google Scholar] [CrossRef]
  18. González, D.; Oosterbaan, L.; Tweehuysen, G.; Palatinus, A.; Hohenblum, P.; Holzhauer, M.; Hanke, G.; Bellert, B. Riverine Litter Monitoring: Options and Recommendations: MSFD GES TG Marine Litter Thematic Report; European Commission, Joint Research Centre: Ispra, Italy, 2017. [Google Scholar]
  19. Lebreton, L.C.M.; Van Der Zwet, J.; Damsteeg, J.W.; Slat, B.; Andrady, A.; Reisser, J. River Plastic Emissions to the World’s Oceans. Nat. Commun. 2017, 8, 1–10. [Google Scholar] [CrossRef] [Green Version]
  20. Schmidt, C.; Krauth, T.; Wagner, S. Export of Plastic Debris by Rivers into the Sea. Environ. Sci. Technol. 2017, 51, 12246–12253. [Google Scholar] [CrossRef]
  21. Newbould, R.A.; Powell, D.M.; Whelan, M.J. Macroplastic Debris Transfer in Rivers: A Travel Distance Approach. Front. Water 2021, 3, 1–14. [Google Scholar] [CrossRef]
  22. Ryan, P.G.; Perold, V. Limited Dispersal of Riverine Litter onto Nearby Beaches during Rainfall Events. Estuar. Coast. Shelf Sci. 2021, 251, 107186. [Google Scholar] [CrossRef]
  23. Meijer, L.J.J.; van Emmerik, T.; van der Ent, R.; Schmidt, C.; Lebreton, L. More than 1000 Rivers Account for 80% of Global Riverine Plastic Emissions into the Ocean. Sci. Adv. 2021, 7, 1–14. [Google Scholar] [CrossRef] [PubMed]
  24. Stock, F.; Kochleus, C.; Bänsch-Baltruschat, B.; Brennholt, N.; Reifferscheid, G. Sampling Techniques and Preparation Methods for Microplastic Analyses in the Aquatic Environment—A Review. TrAC—Trends Anal. Chem. 2019, 113, 84–92. [Google Scholar] [CrossRef]
  25. Zhang, K.; Hamidian, A.H.; Tubić, A.; Zhang, Y.; Fang, J.K.H.; Wu, C.; Lam, P.K.S. Understanding Plastic Degradation and Microplastic Formation in the Environment: A Review. Environ. Pollut. 2021, 274, 116554. [Google Scholar] [CrossRef] [PubMed]
  26. McGivney, E.; Cederholm, L.; Barth, A.; Hakkarainen, M.; Hamacher-Barth, E.; Ogonowski, M.; Gorokhova, E. Rapid Physicochemical Changes in Microplastic Induced by Biofilm Formation. Front. Bioeng. Biotechnol. 2020, 8. [Google Scholar] [CrossRef] [PubMed] [Green Version]
  27. Monteiro, R.C.P.; Ivar do Sul, J.A.; Costa, M.F. Plastic Pollution in Islands of the Atlantic Ocean. Environ. Pollut. 2018, 238, 103–110. [Google Scholar] [CrossRef]
  28. Okunola A, A.; Kehinde I, O.; Oluwaseun, A.; Olufiropo E, A. Public and Environmental Health Effects of Plastic Wastes Disposal: A Review. J. Toxicol. Risk Assess. 2019, 5, 1–13. [Google Scholar] [CrossRef]
  29. Hossain, M.; Sutradhar, L.; Sarker, T.; Saha, S.; Iqbal, M. Toxic Effects of Chlorpyrifos on the Growth, Hematology, and Different Organs Histopathology of Nile Tilapia, Oreochromis niloticus. Saudi J. Biol. Sci. 2022, 29, 103316. [Google Scholar] [CrossRef]
  30. Hussain, M.; Hossain, M.A.; Begum, M.; Roy, N.C. Freshwater Mussel (Lamelliedens marginalis) to Reduce the Lead (Pb) Bioaccumulation in Aquaculture of Stinging Catfish, Heteropneustes fossilis. J. Appl. Aquac. 2022, 1–17. [Google Scholar] [CrossRef]
  31. Islam, M.R.; Hossain, M.A.; Afrose, F.; Roy, N.C.; Iqbal, M.M. Effect of Temperature on the Growth Performance, Haematological Properties and Histomorphology of Gill, Intestine and Liver Tissues in Juvenile Butter Catfish Ompok bimaculatus. Aquac. Fish Fish. 2022, 2, 277–286. [Google Scholar] [CrossRef]
  32. Wagner, M.; Scherer, C.; Alvarez-Muñoz, D.; Brennholt, N.; Bourrain, X.; Buchinger, S.; Fries, E.; Grosbois, C.; Klasmeier, J.; Marti, T.; et al. Microplastics in Freshwater Ecosystems: What We Know and What We Need to Know. Environ. Sci. Eur. 2014, 26, 12. [Google Scholar] [CrossRef]
  33. Azevedo-Santos, V.M.; Brito, M.F.G.; Manoel, P.S.; Perroca, J.F.; Rodrigues-Filho, J.L.; Paschoal, L.R.P.; Gonçalves, G.R.L.; Wolf, M.R.; Blettler, M.C.M.; Andrade, M.C.; et al. Plastic Pollution: A Focus on Freshwater Biodiversity. Ambio 2021, 50, 1313–1324. [Google Scholar] [CrossRef] [PubMed]
  34. Chowdhury, M.A.; Karim, M.A.; Rahman, M.T.; Shefat, S.H.T.; Rahman, A.; Hossain, M.A. Biodiversity Assessment of Indigenous Fish Species in the Surma River of Sylhet Sadar, Bangladesh. Punjab Univ. J. Zool. 2019, 34, 73–77. [Google Scholar] [CrossRef]
  35. Khan, H.M.S.; Setu, S. Microplastic Ingestion by Fishes from Jamuna River, Bangladesh. Environ. Nat. Resour. J. 2022, 20, 1–11. [Google Scholar] [CrossRef]
  36. Consoli, P.; Andaloro, F.; Altobelli, C.; Battaglia, P.; Campagnuolo, S.; Canese, S.; Castriota, L.; Cillari, T.; Falautano, M.; Pedà, C.; et al. Marine Litter in an EBSA (Ecologically or Biologically Significant Area) of the Central Mediterranean Sea: Abundance, Composition, Impact on Benthic Species and Basis for Monitoring Entanglement. Environ. Pollut. 2018, 236, 405–415. [Google Scholar] [CrossRef] [PubMed]
  37. Chowdhury, G.W.; Koldewey, H.J.; Duncan, E.; Napper, I.E.; Niloy, M.N.H.; Nelms, S.E.; Sarker, S.; Bhola, S.; Nishat, B. Plastic Pollution in Aquatic Systems in Bangladesh: A Review of Current Knowledge. Sci. Total Environ. 2021, 761, 143285. [Google Scholar] [CrossRef]
  38. Howladar, M.F.; Chakma, E.; Jahan Koley, N.; Islam, S.; Al Numanbakth, M.A.; Ahmed, Z.; Chowdhury, T.R.; Akter, S. The Water Quality and Pollution Sources Assessment of Surma River, Bangladesh Using, Hydrochemical, Multivariate Statistical and Water Quality Index Methods. Groundw. Sustain. Dev. 2021, 12, 100523. [Google Scholar] [CrossRef]
  39. Hossain, S.; Rahman, M.A.; Ahmed Chowdhury, M.; Kumar Mohonta, S. Plastic Pollution in Bangladesh: A Review on Current Status Emphasizing the Impacts on Environment and Public Health. Environ. Eng. Res. 2020, 26, 200535. [Google Scholar] [CrossRef]
  40. Rakib, M.R.J.; Hossain, M.B.; Kumar, R.; Ullah, M.A.; Al Nahian, S.; Rima, N.N.; Choudhury, T.R.; Liba, S.I.; Yu, J.; Khandaker, M.U.; et al. Spatial Distribution and Risk Assessments Due to the Microplastics Pollution in Sediments of Karnaphuli River Estuary, Bangladesh. Sci. Rep. 2022, 12, 8581. [Google Scholar] [CrossRef]
  41. Nadiruzzaman, M.; Shewly, H.J.; Esha, A.A. Dhaka Sitting on a Plastic Bomb: Issues and Concerns around Waste Governance, Water Quality, and Public Health. Earth 2022, 3, 18–30. [Google Scholar] [CrossRef]
  42. Banik, P.; Hossain, M.B.; Nur, A.-A.U.; Choudhury, T.R.; Liba, S.I.; Yu, J.; Noman, M.A.; Sun, J. Microplastics in Sediment of Kuakata Beach, Bangladesh: Occurrence, Spatial Distribution, and Risk Assessment. Front. Mar. Sci. 2022, 9, 1–13. [Google Scholar] [CrossRef]
  43. Kadir, A.; Ahmed, Z.; Uddin, M.M.; Xie, Z.; Kumar, P. Integrated Approach to Quantify the Impact of Land Use and Land Cover Changes on Water Quality of Surma River, Sylhet, Bangladesh. Water 2021, 14, 17. [Google Scholar] [CrossRef]
  44. Akter, S.; Howladar, M.F.; Ahmed, Z.; Chowdhury, T.R. The Rainfall and Discharge Trends of Surma River Area in North-Eastern Part of Bangladesh: An Approach for Understanding the Impacts of Climatic Change. Environ. Syst. Res. 2019, 8, 28. [Google Scholar] [CrossRef] [Green Version]
  45. Blettler, M.C.M.; Garello, N.; Ginon, L.; Abrial, E.; Espinola, L.A.; Wantzen, K.M. Massive Plastic Pollution in a Mega-River of a Developing Country: Sediment Deposition and Ingestion by Fish (Prochilodus Lineatus). Environ. Pollut. 2019, 255, 113348. [Google Scholar] [CrossRef] [PubMed]
  46. Lippiatt, S.; Opfer, S.; Arthur, C. Marine Debris Monitoring and Assessment: Recommendations for Monitoring Debris Trends in the Marine Environment; Office of Response and Restoration: Nantucket Shoals, MA, USA, 2013; 82. [Google Scholar]
  47. Uddin, M.; Alam, M.; Mobin, M.; Miah, M. An Assessment of the River Water Quality Parameters: A Case of Jamuna River. J. Environ. Sci. Nat. Resour. 2014, 7, 249–256. [Google Scholar] [CrossRef] [Green Version]
  48. Hossain, M.; Patra, P.K. Water Pollution Index—A New Integrated Approach to Rank Water Quality. Ecol. Indic. 2020, 117, 106668. [Google Scholar] [CrossRef]
  49. Government of the People’s Republic of Bangladesh. Environmental Quality Standard (EQS); Bangladesh Gazette, registered nr. DA-1; Ministry of Environment, Government of Bangladesh: Dhaka, Bangladesh, 1997.
  50. Sarker, M.; Razzaque, A.; Hoque, M.; Roy, S.; Hossain, M. Investigation of Effluent Quality from an Effluent Treatment Plant of a Textile Industry, Fakir Knitwear Ltd. Narayangonj, Bangladesh. J. Environ. Sci. Nat. Resour. 2015, 8, 25–31. [Google Scholar] [CrossRef] [Green Version]
  51. Yisa, J.; Jimoh, T. Analytical Studies on Water Quality Index of River Landzu. Am. J. Appl. Sci. 2010, 7, 453–458. [Google Scholar] [CrossRef] [Green Version]
  52. Shahnawaz, A.; Venkateshwarlu, M.; Somashekar, D.S.; Santosh, K. Fish Diversity with Relation to Water Quality of Bhadra River of Western Ghats (INDIA). Environ. Monit. Assess. 2010, 161, 83–91. [Google Scholar] [CrossRef]
  53. Bir, J.; Golder, M.R.; Biswas, P.; Tasrin, S.; Chowdhury, S.Z. Plastic Pollution in an Estuary: A Preliminary Study on the Rupsha River in Southwestern Bangladesh. Bangladesh J. Fish. 2022, 33, 295–304. [Google Scholar] [CrossRef]
  54. Calmuc, M.; Calmuc, V.; Arseni, M.; Topa, C.; Timofti, M.; Georgescu, L.P.; Iticescu, C. A Comparative Approach to a Series of Physico-Chemical Quality Indices Used in Assessing Water Quality in the Lower Danube. Water 2020, 12, 3239. [Google Scholar] [CrossRef]
  55. Grzywna, A.; Sender, J. The Assessment of the Amount of Water Pollution and Its Suitability for Drinking of the Tyśmienica River Basin, Poland. Environ. Monit. Assess. 2021, 193, 315. [Google Scholar] [CrossRef] [PubMed]
  56. Iqbal, M.; Kanon, M.H.; Hossain, M.A.; Hossain, A.; Nasren, S.; Islam, M.J.; Rahman, M.A. Diversity of Indigenous Fish Species in Konoskhaihaor, Northeast Bangladesh. Punjab Univ. J. Zool. 2015, 30, 73–79. [Google Scholar]
  57. Hossain, M.A.; Akter, M.; Iqbal, M.M. Diversity of Fish Fauna in Kusiara River (Fenchungonj Upazilla), Northeast Bangladesh. J. Aquac. Trop. 2017, 32, 1–13. [Google Scholar]
  58. Mia, R.; Uddin, S.; Alam, T.; Pandit, D.; Mazumder, S.K. Habitat and Biodiversity Degradation of the Surma River, Bangladesh and Implications for Future Management. J. Bangladesh Agric. Univ. 2022, 20, 103–115. [Google Scholar] [CrossRef]
  59. Das, S.R.; Pandit, D.; Harun-Al-Rashid, A.; Tasnim, N.; Kunda, M. Impacts of Brush Pile Fishing on Fish Biodiversity: A Case Study of the Shari-Goyain River in Bangladesh. Heliyon 2022, 8, e09903. [Google Scholar] [CrossRef]
  60. Galib, S.M.; Naser, S.M.A.; Mohsin, A.B.M.; Chaki, N.; Hassan, F. Fish Diversity of the River Choto Jamuna, Bangladesh: Present Status and Conservation Needs. Int. J. Biodivers. Conserv. 2013, 5, 389–395. [Google Scholar] [CrossRef]
  61. Siddique, M.A.B.; Hussain, M.A.; Flowra, F.A.; Alam, M.M. Assessment of Fish Fauna in Relation to Biodiversity Indices of Chalan Beel, Bangladesh. Int. J. Aquat. Biol. 2016, 4, 345–352. [Google Scholar]
  62. Das, S.K.; Roy, N.C.; Hossain, M.A. Diversity of Indigenous Fish Species in Ratargul Freshwater Swamp Forest, Bangladesh. Int. J. Sci. Res. Environ. Sci. 2017, 5, 28–35. [Google Scholar] [CrossRef]
  63. Aziz, M.S.B.; Hasan, N.A.; Mondol, M.M.R.; Alam, M.M.; Haque, M.M. Decline in Fish Species Diversity Due to Climatic and Anthropogenic Factors in Hakaluki Haor, an Ecologically Critical Wetland in Northeast Bangladesh. Heliyon 2021, 7, e05861. [Google Scholar] [CrossRef]
  64. Sarkar, D.J.; Das Sarkar, S.; Das, B.K.; Manna, R.K.; Behera, B.K.; Samanta, S. Spatial Distribution of Meso and Microplastics in the Sediments of River Ganga at Eastern India. Sci. Total Environ. 2019, 694, 133712. [Google Scholar] [CrossRef]
  65. Windsor, F.; Durance, I.; Horton, A.A.; Thompson, R.C.; Tyler, C.R.; Ormerod, S.J. A Catchment-scale Perspective of Plastic Pollution. Glob. Chang. Biol. 2019, 25, 1207–1221. [Google Scholar] [CrossRef] [PubMed] [Green Version]
  66. Rech, S.; Macaya-Caquilpán, V.; Pantoja, J.F.; Rivadeneira, M.M.; Campodónico, C.K.; Thiel, M. Sampling of Riverine Litter with Citizen Scientists—Findings and Recommendations. Environ. Monit. Assess. 2015, 187, 1–18. [Google Scholar] [CrossRef] [PubMed]
  67. Mihai, F.C. Rural Plastic Emissions into the Largest Mountain Lake of the Eastern Carpathians. R. Soc. Open Sci. 2018, 5, 172396. [Google Scholar] [CrossRef] [PubMed]
  68. Nelms, S.E.; Duncan, E.M.; Patel, S.; Badola, R.; Bhola, S.; Chakma, S.; Chowdhury, G.W.; Godley, B.J.; Haque, A.B.; Johnson, J.A.; et al. Riverine Plastic Pollution from Fisheries: Insights from the Ganges River System. Sci. Total Environ. 2021, 756, 143305. [Google Scholar] [CrossRef] [PubMed]
Figure 1. The geographical location of sampling sites selected for the current study (Site 1—Charkhai, Site 2—Golapganj, Site 3—Alampur, Site 4—Kazir Bazar, Site 5—Beter Bazar, and Site 6—Lamakazi).
Water 14 03263 g001aWater 14 03263 g001b
Figure 2. Different types of plastic items collected from different study areas (S1S6).
Water 14 03263 g002aWater 14 03263 g002b
Figure 3. Total macroplastics concentrations in different study areas. Different letters exhibit significant differences (p < 0.05).
Water 14 03263 g003
Figure 4. Proportions of different types of plastic items identified from study areas.
Water 14 03263 g004
Figure 5. Water pollution index (WPI) at different study locations.
Water 14 03263 g005
Figure 6. Fish diversity indices at different study locations. (A) Shannon, Margalef, and Fisher’s alpha indices, (B) dominance, Simpson, evenness, and Berger–Parker indices.
Water 14 03263 g006
Figure 7. Principal component analysis (PCA). (A) Total plastics with water parameters, and (B) total plastics with fish diversity indices.
Water 14 03263 g007
Figure 8. River discharge, rainfall, and water level of the Surma River from 2001 to 2021.
Water 14 03263 g008
Figure 9. Pollution scenario in the Surma River at Kazir Bazar (S4) study area (captured in March 2022). (A) Photo indicates high plastic deposition in the riverbed, while (B) shows the plastic frequency in the river water.
Water 14 03263 g009
Figure 10. Schematic diagram of the major sources of plastic pollution in the Surma River.
Water 14 03263 g010
Figure 11. Source of plastic pollution in different study areas. (DPW—domestic plastic waste, NMW—nearby market waste, MSW—municipal solid waste, IW—industrial waste, UUW—upstream urban waste, PF—pluvial flow, FPW—fish-market plastic waste).
Water 14 03263 g011
Figure 12. Categorization of awareness towards plastic pollution among local people at different study areas (NA—not aware, AC—aware but careless, ATM—aware and trying to maintain, CM—well aware and maintaining).
Water 14 03263 g012
Table 1. Physical and infrastructural observation of sampling sites (+ indicates ‘yes’ sign).
Visual ObservationSite 1Site 2Site 3Site 4Site 5Site 6
Placement
Far from human residence++
Near human residence ++++
Near ferry cross + ++
Close to factory ++
Close to riverside fish market + +
Adjacent to cement bag washing and recycling factory +
Human Activities
Fishing++++ +
Bathing and washing clothes ++ +++
Dumping domestic waste
Washing utensils of the fish market +++++
Dumping waste of fish market + +
Cement and plastic sack washing ++
Dumping of nearby market waste ++++
Water Appearance
Low turbid+++ ++
Highly turbid +
Seems dirty +
Sediment Condition
Sandy clay+ ++
Sandy and rocky +
Mostly clay ++
Bank Status
Natural++ ++
Both natural and artificial ++
Pollution Status
Low++ +
Moderate +
High ++
Note: Site 1—Charkhai, Site 2—Golapganj, Site 3—Alampur, Site 4—Kazir Bazar, Site 5—Beter Bazar, and Site 6—Lamakazi.
Table 2. Justification of water pollution level based on WPI scores [48].
ValueStatus
<0.5Excellent
0.5–0.75Good
0.75–1Moderately polluted
>1Extremely polluted
Table 3. Physicochemical properties of water at different sampling locations with standard values (values are mean ± standard error; the column with different superscripts indicates significant differences at p < 0.05).
SitesTemperature
(°C)
pHSalinity
(mgL−1)
DO
(mgL−1)
TDS
(mgL−1)
Electric
Conductivity
(μS/cm)
S126.57 ± 0.09 a7.73 ± 0.05 c0.08 ± 0.005 a7.0 ± 0.14 b97.0 ± 4.55 a205 ± 5 a
S227.23 ± 0.12 b7.47 ± 0.12 c0.09 ± 0.005 a6.87 ± 0.25 b102.67 ± 1.70 a221 ± 3 b
S327.47 ± 0.09 b7.70 ± 0.08 c0.11 ± 0.003 bc6.19 ± 0.39 b108.17 ± 0.62 bc226 ± 2 b
S428.60 ± 0.36 c6.43 ± 0.21 a0.13 ± 0.003 c2.97 ± 0.50 a135.0 ± 2.12 c289 ± 5 c
S528.50 ± 0.08 c6.97 ± 0.09 b0.13 ± 0.005 c3.68 ± 0.70 a137.17 ± 1.03 c293 ± 3 c
S628.97 ± 0.26 c7.53 ± 0.05 c0.10 ± 0.005 b6.73 ± 0.05 b110.67 ± 2.62 b226 ± 5 b
Standard20–30
[49]
6.5–8.5 [47,48,50]-4–6
[47]
<400
[50]
800–1000
[47]
Note: S1—Charkhai, S2—Golapganj, S3—Alampur, S4—Kazir Bazar, S5—Beter Bazar, and S6—Lamakazi.
Table 4. Categorization of macroplastics item polymer types [2,13] and availability at different sampling sites.
Plastic CategoryPolymer TypesS1S2S3S4S5S6
Plastic tableclothPVC
Cassette reelPVC
Plastic wire and ropeLDPE, HDPE, PVC, EPR, PP, PA
Beverage bottlesPET, LDPE, HDPE, PS
Single-use plastic productsLDPE, HDPE, PET, PS, PP, EPS
ShoesPU, PVC, EVA
Pharmaceutical origin PET, HDPE, PP, PVC
Personal care productsHDPE, PP, PET
Polythene bags/sheetsLDPE, HDPE
Large plastic sackHDPE, PP
Food wrappersLDPE, HDPE, PP, PS
Foam and cork sheetEPS, PP, PU
Notes: PVC: polyvinyl chloride, LDPE: low-density polyethylene, HDPE: high-density polyethylene, EPR: ethylene-propylene elastomers, PP: polypropylene, PA: polyamide, PET: polyethylene terephthalate, PS: polystyrene, EPS: expanded polystyrene, PU: polyurethane, EVA: ethylene vinyl acetate, S1—Charkhai, S2—Golapganj, S3—Alampur, S4—Kazir Bazar, S5—Beter Bazar, and S6—Lamakazi; ✓ refers presence of the respective plastics type in sites.
Table 5. Major specifications of participants in the survey.
Participant’s SpecificationDescriptionPercentage
GenderMale70.24
Female29.76
Age group18–3029.07
31–4541.87
46–6021.45
Above 607.61
EducationIlliterate25.26
Primary level32.18
Secondary level30.45
Tertiary level12.11
OccupationFish trader13.49
Boatman13.49
Fisherman16.96
Housewife11.76
Daily labor11.42
Labour in ice industries2.77
Large-scale business holder3.11
Small-scale business holder6.23
Farming and agriculture5.88
Motor vehicle driver3.81
Govt. service provider3.11
NGOs and private service holder7.96
Table 6. Obstacles in minimizing plastic pollution and future initiatives.
ObstaclesInitiatives to be Taken
  • Poor management of the municipal drainage system
  • Poor waste management
  • Lack of awareness
  • People arrogance
  • Properly organized plastic disposal system and place
  • Separation disposal of plastic and other waste
  • Figure out the alternatives to substitute plastics
  • Raise public awareness
  • Proper management of plastic debris
  • Encourage people to use perishable products
  • Contemporary policy by the Government
  • Implementation of rules strictly
Publisher’s Note: MDPI stays neutral with regard to jurisdictional claims in published maps and institutional affiliations.

