
Economic Evaluation of Drought Resistance Measures for Maize Seed Production Based on TOPSIS Model and Combination Weighting Optimization
Abstract
:1. Introduction
2. Materials and Methods
2.1. Description of the Experimental Site
2.2. Experimental Design and Field Management
2.3. Measurements and Calculations
2.3.1. Soil Moisture Content
2.3.2. Plant Yield
2.3.3. Water Consumption and Water Use Efficiency
2.3.4. Quality
2.3.5. Determination of Weights
- (1)
- Establishment of the declining hierarchical structure. The relationship and affiliating among every factors were divided into multiple levels, including criterion layer, target layer, and scheme layer, according to the different characteristics of factors.
- (2)
- Construction of pairwise judgment matrix. Pairwise comparison of factors in the criterion layer was carried out to construct a pairwise comparison matrix among factors, and a nine-point scale method was adopted (Table 2). Then, a pairwise comparison judgment matrix was formed from the quantization results .
- (3)
- Calculation of the relative weight of the factors. The relative weight of the factors was calculated by the judgment matrix, and the weight of all the elements in this layer in the upper layer was calculated and further synthesized by the calculation results of the weight of a single layer. By weight sorting, the optimal scheme was selected and the consistency of the judgment matrix was tested to ensure the scientific and reliable calculation.

| Scaling | Meaning |
|---|---|
| 1 | Equally important |
| 3 | Slightly important |
| 5 | Obviously important |
| 7 | Strongly important |
| 9 | Extremely important |
| 2, 4, 6, 8 | The median of the above two adjacent judgments |
| reciprocal | A is compared to B if the scale is 3, then B is 1/3 compared to A |
- a.
- Arithmetic average method
- b.
- Geometric average method
- c.
- Feature vector method
- a.
- Calculation of consistency indicators :
- b.
- Calculation of the corresponding average random consistency index (RI) (Table 3).
- c.
- Calculation of consistency ratio :
- (1)
- The indexes to be calculated are formed into a numerical matrix to judge whether there is a negative number in the input matrix. If so, it should be re-normalized to a non-negative range to ensure that every element is a non-negative number to form a positive matrix .
- (2)
- The non-negative matrix Z is obtained through normalization, and the proportion of the ith sample in the jth index is calculated, which is regarded as the probability used in relative entropy calculation:
- (3)
- Calculations of the information entropy of each indicator, the information utility value, and the entropy weight of each indicator through normalization were conducted as follows:
- (a)
- Use different weighting methods (L kinds) to weight the participating indicators and construct the basic weight vector set.
- (b)
- Construction of the linear combination q of weight vectors. The linear combination of the above L vectors is:
- (c)
- where u is the weight set after linear combination, and is the coefficient of linear combination. In order to minimize the deviation with each, the equilibrium idea of GT is used to optimize , i.e.,
- (d)
- After obtaining the optimal linear combination coefficient according to Equation (19), it is processed with the improved normalization formula [34], i.e.,
- (e)
- By applying GT, the comprehensive weight vector is obtained by combining AHP and EWM:
2.4. TOPSIS Model Evaluation Method
- (1)
- Construct the weighted evaluation matrix.
- (2)
- Determine positive and negative ideal solutions.First, the weighting matrix was forward—that is, the benefit index—and then the matrix was obtained by normalizing and removing the dimension. Finally, the positive ideal solution set was formed by the maximum value of each participating index in the scheme, and the negative ideal solution set was formed by the minimum value.
- (3)
- Calculate Euclidean distance.For each evaluation scheme, the distance to the positive ideal solution and the distance to the negative ideal solution were calculated as follows:
- (4)
- Calculate the comprehensive score.According to Equation (25), the proximity Si of each scheme to the optimal scheme was first calculated, and then the comprehensive score of each evaluation scheme was obtained after normalization according to Equation (26):
2.5. Statistics Analysis
3. Results
3.1. Selection of Evaluation Indicators
3.2. Determination of the Weight of Indices in the Evaluation System
3.2.1. The Analytic Hierarchy Process
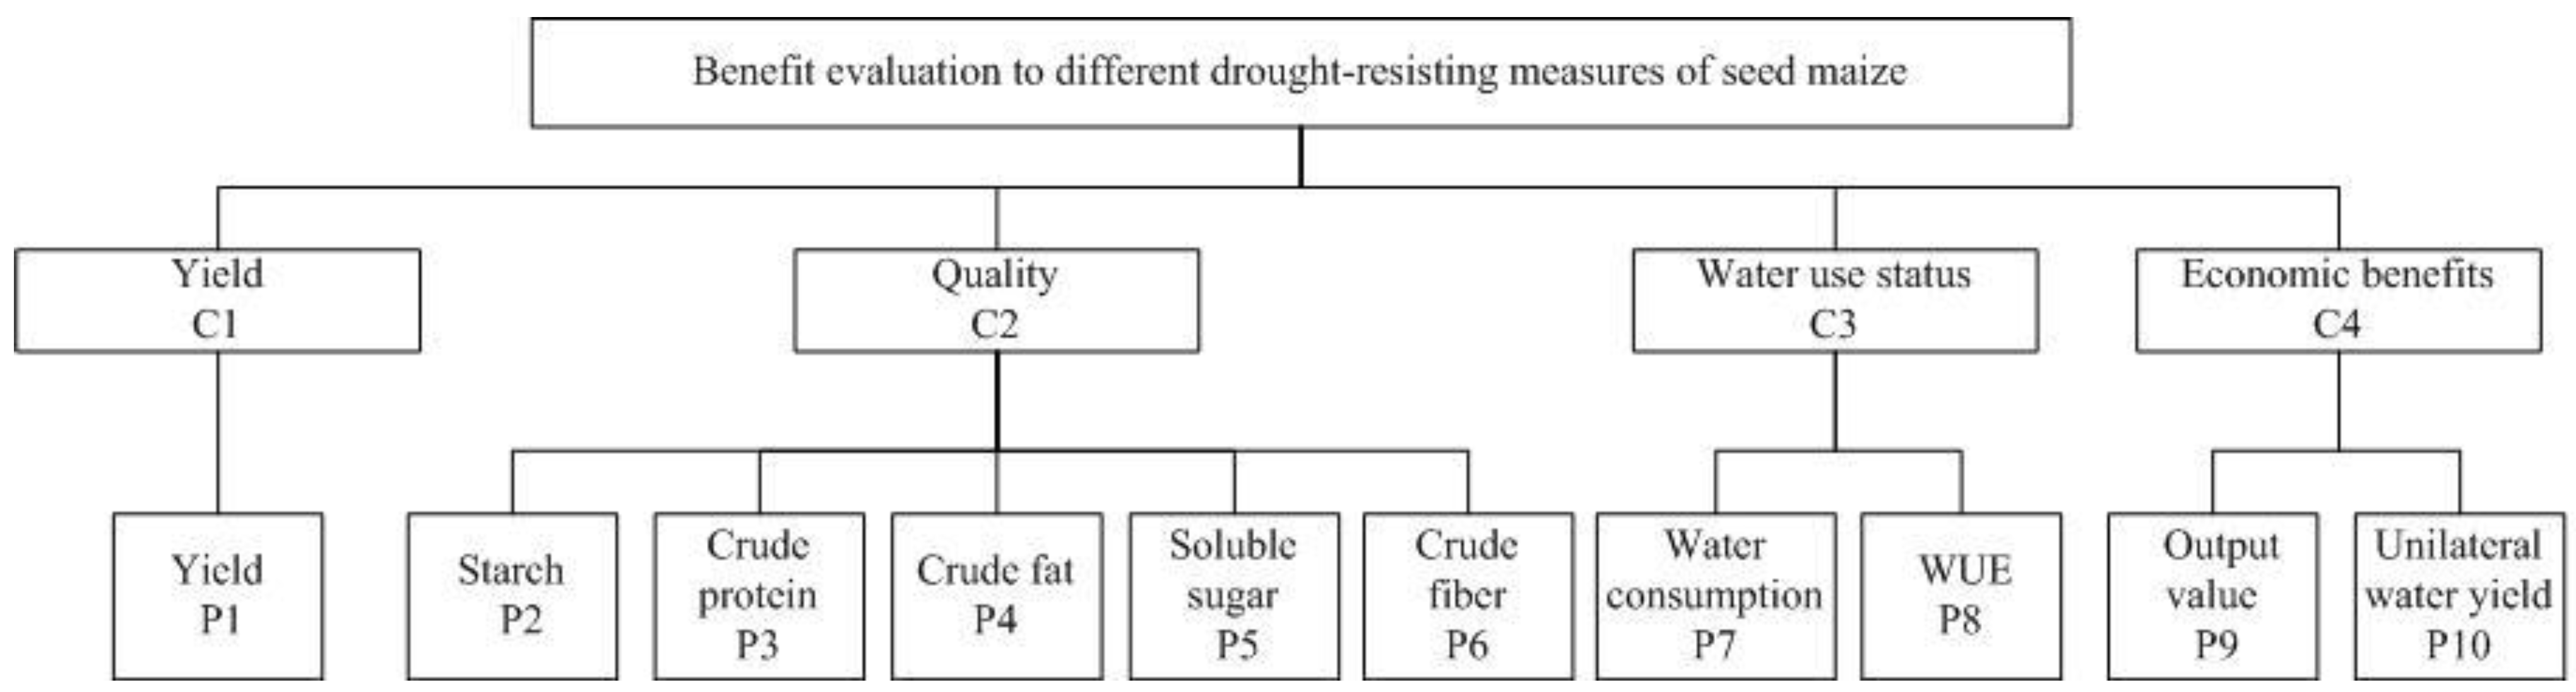
- (1)
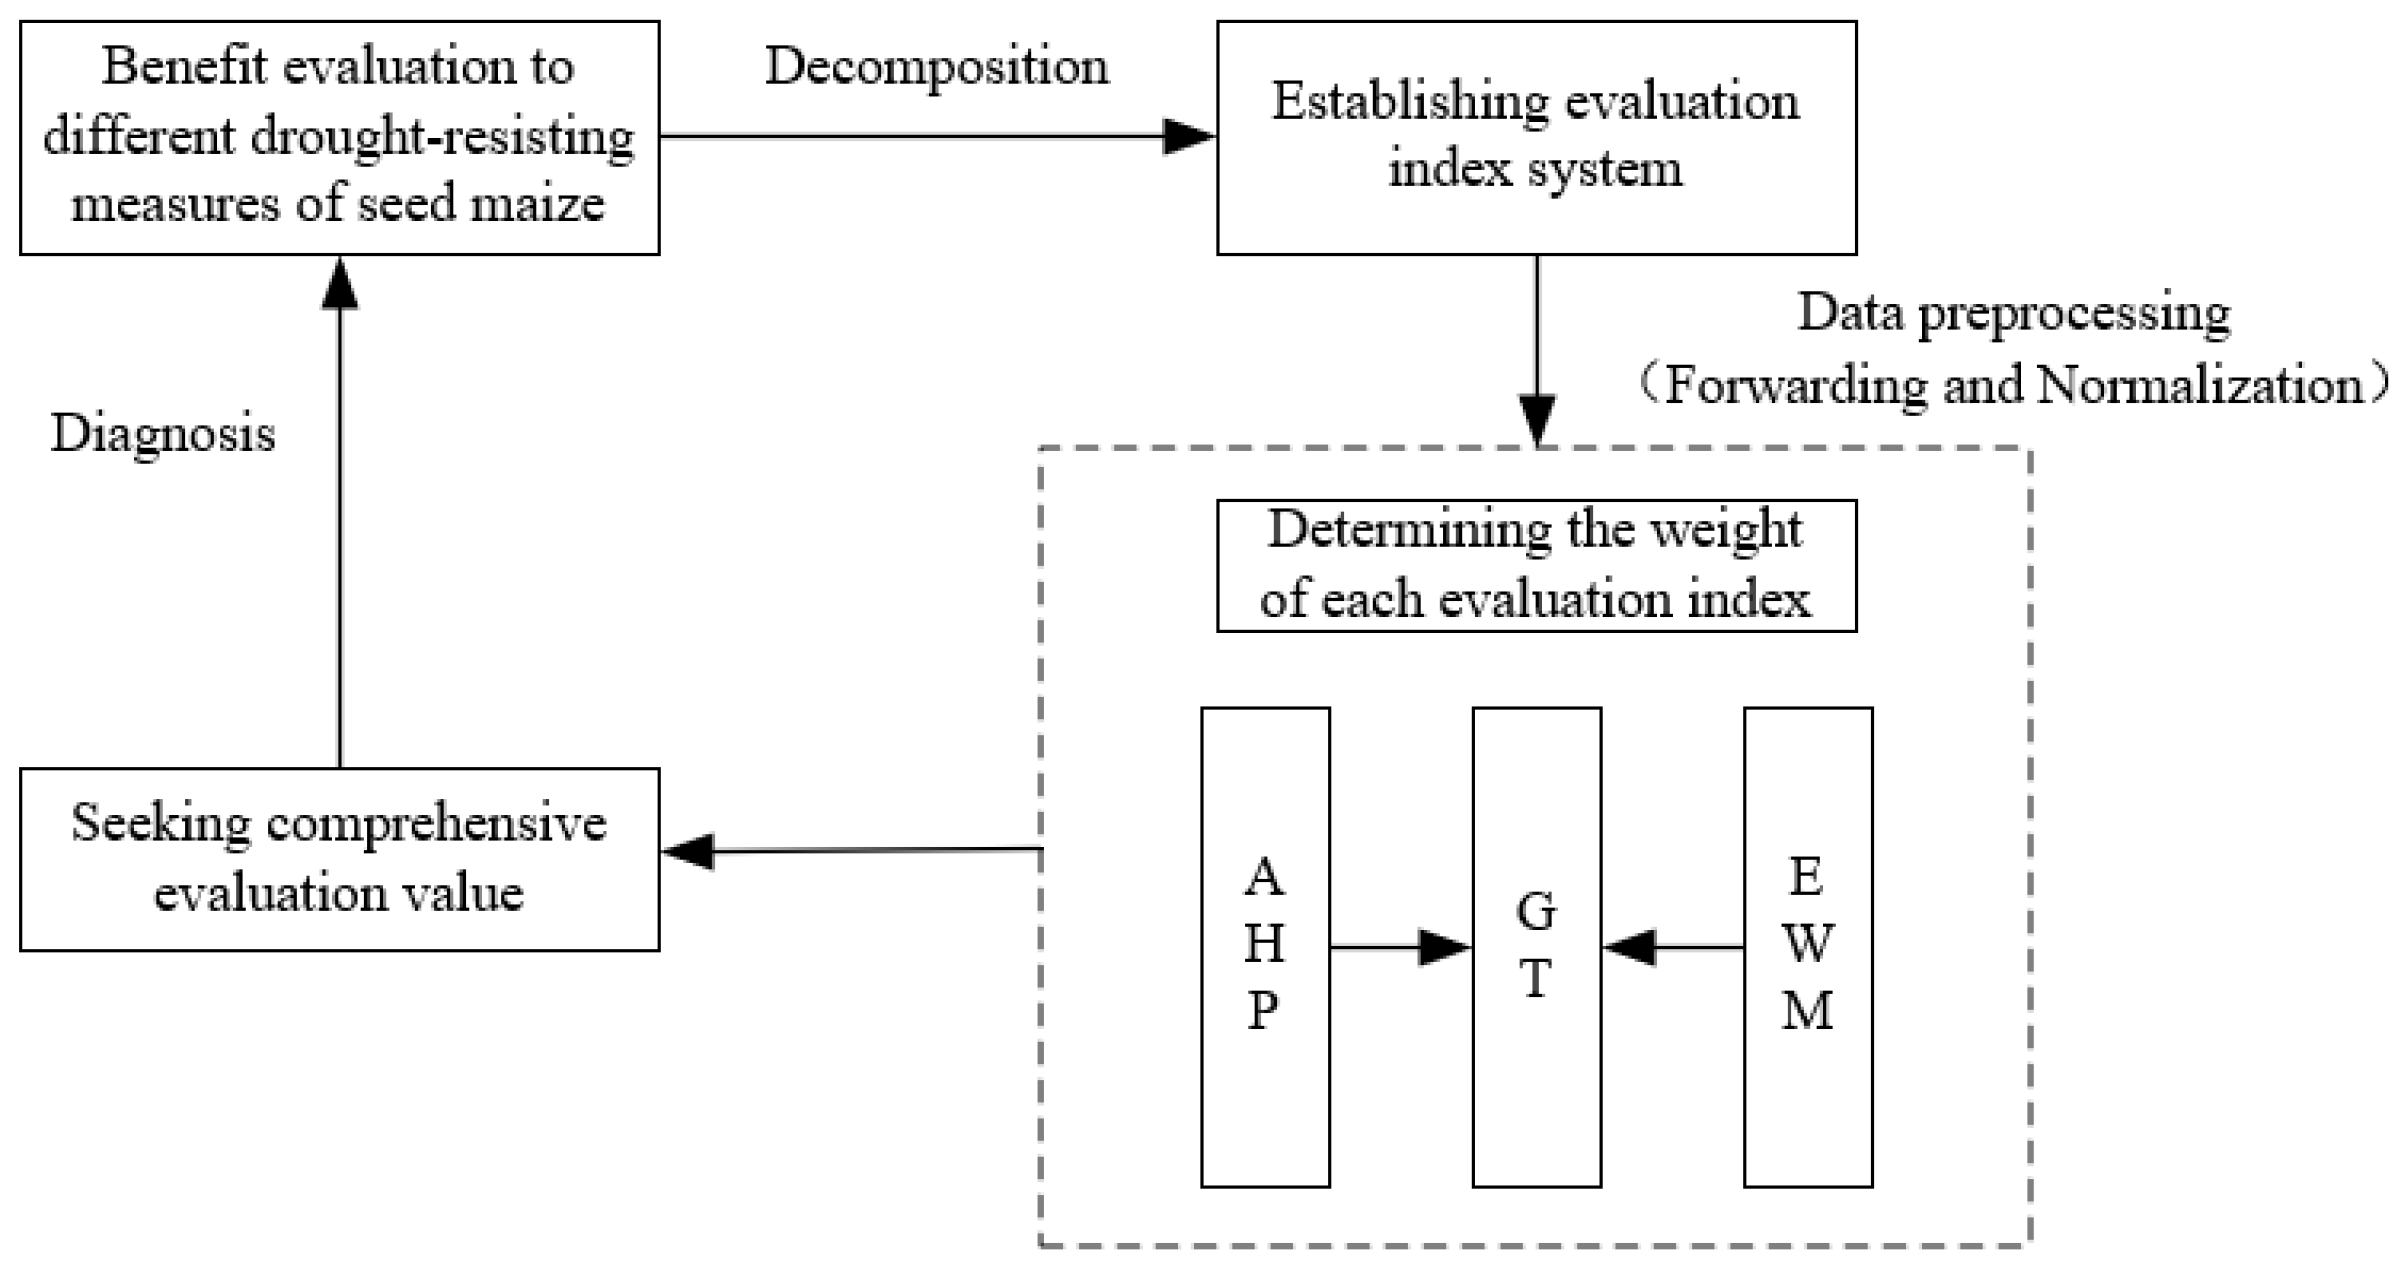
- Establishment of a hierarchy.In order to find suitable drought resistance measures for maize seed production in northwest China, the evaluation index system was constructed considering the concepts of yield, water use efficiency, quality, and economic benefits and the principles of scientific, representativeness, and consistency. In addition, an index decomposition was conducted to the four dimensions that were needed in the study of drought resistance measures. The comprehensive hierarchical evaluation model was constructed by using the principle of the analytic hierarchy process (Figure 1).
- (2)
- Construction of a judgment matrix.The weight was calculated by constructing the judgment matrix according to the 1–9 ratio scale method (Table 5).
- (3)
- Calculation of the subjective weights using the judgment matrix (wsj).In order to ensure the rationality of the results, the arithmetic average method, geometric average method, and feature vector method were adopted in this study to calculate the weights.
3.2.2. Entropy Weight Method
3.2.3. Combination Weights
3.3. Integrated Evaluation Model Based on the Improved TOPSIS Method
3.4. Results Analysis
4. Discussion
4.1. Analysis and Evaluation of Measured Values Based on Indicators
4.2. CW of Evaluation Indicators
4.3. Comprehensive Evaluation Results of Drought Resistance Measures
5. Conclusions
Author Contributions
Funding
Data Availability Statement
Acknowledgments
Conflicts of Interest
References
- Jiang, H. Research on the Pattern and Influencing Factors of China’s Grain International Trade Based on Social Network. Ph.D. Thesis, Jilin University, Changchun, China, 2021. [Google Scholar]
- Liu, C.; Jing, Q. Analysis on the changing trend of the market size of China’s corn seed industry. China Seed Ind. 2020, 12, 4–7. [Google Scholar]
- Fang, H.; Li, Y.; Gu, X.; Yu, M.; Du, Y.; Chen, P.; Li, Y. Evapotranspiration partitioning, water use efficiency, and maize yield under different film mulching and nitrogen application in northwest China. Field Crops Res. 2021, 264, 103–108. [Google Scholar] [CrossRef]
- Li, S.; Li, Y.; Lin, H.; Feng, H.; Dyck, M. Effects of different mulching technologies on evapotranspiration and summer maize growth. Agric. Water Manag. 2018, 201, 309–318. [Google Scholar] [CrossRef]
- Memon, M.; Zhou, J.; Guo, J.; Ullah, F.; Hassan, M.; Ara, S.; Ji, C. Comprehensive review for the effects of ridge furrow plastic mulching on crop yield and water use efficiency under different crops. Int. Agric. Eng. J. 2017, 26, 58–66. [Google Scholar]
- Wu, Y.; Huang, F.; Zhang, C.; Jia, Z. Effects of different mulching patterns on soil moisture, temperature, and maize yield in a semi-arid region of the Loess Plateau, China. Arid Land Res Manag. 2016, 30, 490–504. [Google Scholar] [CrossRef]
- Akhtar, K.; Wang, W.; Ren, G.; Khan, A.; Feng, Y.; Yang, G. Changes in soil enzymes, soil properties, and maize crop productivity under wheat straw mulching in Guanzhong, China. Soil Tillage Res. 2018, 182, 94–102. [Google Scholar] [CrossRef]
- Hu, Y.; Ma, P.; Wu, S.; Sun, B.; Feng, H.; Pan, X.; Zhang, B.; Chen, G.; Duan, C.; Lei, Q.; et al. Spatial-temporal distribution of winter wheat (Triticum aestivum L.) roots and water use efficiency under ridge–furrow dual mulching. Agric. Water Manag. 2020, 240, 106301. [Google Scholar] [CrossRef]
- Lu, H.; Xia, Z.; Fu, Y.; Wang, Q.; Xue, J.; Chu, J. Response of Soil Temperature, Moisture, and Spring Maize (Zea mays L.) Root/Shoot Growth to Different Mulching Materials in Semi-Arid Areas of Northwest China. Agronomy 2020, 10, 453. [Google Scholar] [CrossRef] [Green Version]
- Carvalho, D.F.; Gomes, D.P.; Oliveira Neto, D.H.; Guerra, J.G.; Rouws, J.R.; Oliveira, F.L. Carrot yield and water-use efficiency under different mulching, organic fertilization and irrigation levels. Rev. Bras. Eng. Agric. Ambient. 2018, 22, 445–450. [Google Scholar] [CrossRef] [Green Version]
- Jafari, M.; Haghighi, J.; Zare, H. Mulching impact on plant growth and production of rainfed fig orchards under drought conditions. J. Food. Agric. Environ. 2018, 10, 428–433. [Google Scholar]
- Qin, H.; Zhang, Y.; Zhang, K.; Yang, H.; Qiu, X.; Wang, Y.; Lu, Z.; Zhang, M. Multi-Objective Optimization of Regulated Deficit Irrigation for Winter Wheat Based on TOPSIS in Huang-Huai-Hai Plain Well Irrigation Area. Crops 2021, 37, 202–209. [Google Scholar]
- Du, Y.; Cui, B.; Zhang, Q.; Jun, S.; Zhen, W.; Niu, W. Utilizing comprehensive decision analysis methods to determine an optimal planting pattern and nitrogen application for winter oilseed rape. J. Int. Agric. 2020, 19, 2229–2238. [Google Scholar] [CrossRef]
- Li, Y.; Wang, P.; Liu, J.; Zhang, S.; Li, L. Evaluation of drought monitoring effects in the main growing stages of winter wheat by using the vegetation temperature condition index—II-Improved analytic hierarchy process and variation coefficient method. Agric. Res. Arid Areas. 2014, 32, 218–222. [Google Scholar]
- Xin, G.; Yang, C.; Yang, Q.; Li, C.; Wei, C. Post-evaluation of well-facilitied capital farmland construction based on entropy weight method and improved TOPSIS model. Trans. Chin. Soc. Agric. Eng. 2017, 33, 238–249. [Google Scholar]
- Jian, Y.; Zhen, R.; Zhen, B.; Jing, Y.; Long, Z.; De, H. Well facilitied capital farmland assignment based on land quality evaluation and LISA. Trans. Chin. Soc. Agric. Mach. 2017, 48, 109–115. [Google Scholar]
- Yang, Z.; Chu, T.; Han, L.; Liu, X.; Xiao, W.; Huang, G. Application of GC-TOPSIS on optimizing choice of utilization programs of crop straw. Trans. Chin. Soc. Agric. Eng. 2013, 29, 179–191. [Google Scholar]
- Akpoti, K.; Kabo-bah, A.; Zwart, S. Agricultural land suitability analysis: State-of-the-art and outlooks for integration of climate change analysis. Agric. Syst. 2019, 173, 172–208. [Google Scholar] [CrossRef]
- Sun, G.; Hu, T.; Liu, X.; Peng, Y.; Leng, X.; Li, Y.; Yang, Q. Optimizing irrigation and fertilization at various growth stages to improve mango yield, fruit quality and water-fertilizer use efficiency in xerothermic regions. Agric. Water Manag. 2022, 260, 107296. [Google Scholar] [CrossRef]
- Rasool, G.; Guo, X.; Wang, Z.; Ali, M.; Chen, S.; Zhang, S.; Wu, Q.; Ullah, M. Coupling fertigation and buried straw layer improves fertilizer use efficiency, fruit yield, and quality of greenhouse tomato. Agric. Water Manag. 2020, 239, 106239. [Google Scholar] [CrossRef]
- Li, Y.; Xiao, M.; Zhu, G.; Li, Y. Evaluation of Irrigation-Drainage Scheme under Water Level Regulation Based on TOPSIS in Southern China. Polish J. Environ. Stud. 2021, 30, 1. [Google Scholar] [CrossRef]
- Hassani, Y.; Shahdany, S. Implementing agricultural water pricing policy in irrigation districts without a market mechanism: Comparing the conventional and automatic water distribution systems. Comput. Electron. Agric. 2021, 185, 106–121. [Google Scholar] [CrossRef]
- Suder, A.; Kahraman, C. Multiattribute evaluation of organic and inorganic agricultural food investments using fuzzy TOPSIS. Technol. Econ. Devel. Econ. 2018, 24, 844–858. [Google Scholar] [CrossRef]
- Rathore, V.; Nathawat, N.; Bhardwaj, S.; Yadav, B.; Kumar, M.; Santra, P.; Kumar, P.; Reager, M.; Yadava, N.; Yadav, O. Optimization of deficit irrigation and nitrogen fertilizer management for peanut production in an arid region. Sci. Rep. 2021, 11, 5456. [Google Scholar] [CrossRef] [PubMed]
- Wang, Z.; Zhang, H.; Wang, Y.; Zhou, C. Integrated Evaluation of the Water Deficit Irrigation Scheme of Indigowoad Root under Mulched Drip Irrigation in Arid Regions of Northwest China Based on the Improved TOPSIS Method. Water 2021, 13, 1532–1547. [Google Scholar] [CrossRef]
- Seyedmohammadi, J.; Sarmadian, F.; Jafarzadeh, A.; Ghorbani, M.; Shahbazi, F. Application of SAW, TOPSIS and fuzzy TOPSIS models in cultivation priority planning for maize, rapeseed and soybean crops. Geoderma 2018, 310, 178–190. [Google Scholar] [CrossRef]
- Wei, L. Comprehensive Benefit Evaluation of Rice Cropping Patterns in Fujin. Master’s Thesis, Northeast Agricultural University, Harbin, China, 2020. [Google Scholar]
- Wang, H.; Wang, X.; Bi, L.; Wang, Y.; Fan, J.; Zhang, F.; Cheng, M.; Hu, W.; Wu, L.; Xiang, Y. Multi-objective optimization of water and fertilizer management for potato production in sandy areas of northern China based on TOPSIS. Field Crops Res. 2019, 240, 55–68. [Google Scholar] [CrossRef]
- Buysse, J.; Merckx, R. An improved colorimetric method to quantify sugar content of plant tissue. J. Exp Bot. 1993, 44, 1627–1629. [Google Scholar] [CrossRef]
- Luthria, D.; Noel, K.; Vinjamoori, D. Impact of sample preparation on the determination of crude fat content in corn. J. Am. Oil Chem. Soc. 2004, 81, 999–1004. [Google Scholar] [CrossRef]
- Churkova, B. Content of crude protein, crude fiber and crude ash in dry mass of birdsfoot trefoil varieties and populations. J. Agric. Sci. Technol. 2013, 1, 77–83. [Google Scholar] [CrossRef]
- Wang, F.; Kang, S.; Du, T.; Li, F.; Qiu, R. Determination of comprehensive quality index for tomato and its response to different irrigation treatments. Agric. Water Manag. 2011, 98, 1228–1238. [Google Scholar] [CrossRef]
- Liu, X.; Zhang, Y.; Leng, X.; Yang, Q.; Chen, H.; Wang, X.; Cui, N. Exploring the optimisation of mulching and irrigation management practices for mango production in a dry hot environment based on the entropy weight method. Sci. Hortic. 2022, 291, 110564. [Google Scholar] [CrossRef]
- Liu, D.; Gong, F.H.; Fu, Q.; Faiz, M.; Li, T.; Gui, S. Evaluation Model of Irrigation Water Use Efficiency Based on Game Theory and GRA-TOPSIS. Trans. Chin. Soc. Agric. Mach. 2017, 48, 218–226. [Google Scholar]
- Çelikbilek, Y.; Tüysüz, F. An in-depth review of theory of the TOPSIS method: An experimental analysis. J. Manag. Anal. 2020, 7, 281–300. [Google Scholar] [CrossRef]
- Spiliotis, M.; Iglesias, A.; Garrote, L. A multicriteria fuzzy pattern recognition approach for assessing the vulnerability to drought: Mediterranean region. J. Evol. Syst. 2021, 12, 109–122. [Google Scholar] [CrossRef]
- Zhao, Y.; Mao, X.; Duan, M. Effects of film mulching and irrigation amount on farmland water-heat dynamics and growth of seed-maize. Trans. Chin. Soc. Agric. Mach. 2018, 49, 275–284. [Google Scholar]
- Zhang, L.; Yan, W.; Tan, G.; Zhao, H.; Sun, N.; Meng, X.; Fang, X.; Bian, S. Effects of different depth of water-retaining agent applied on maize yield and water use efficiency of soil moisture. J. Maize Sci. 2016, 24, 110–113. [Google Scholar]
- Jin, Y.; Yang, S.; Zhang, W.; Pan, C.; Liang, Z. Effects of straw and plastic film mulching on water-salt regulation and maize yield in alternate brackish irrigation. Soil Fertil. Sci. Chin. 2020, 2, 198–205. [Google Scholar]
- Sun, S.; Zhu, Z.; Chen, Z.; Yang, D.; Zhang, X. Effects of different colored plastic film mulching and planting density on soil temperature, evapotranspiration and yield of spring maize. Sci. Agric. Sin. 2019, 52, 3323–3336. [Google Scholar]
- Zhou, J.; Cheng, C.; Yan, S.; Zhao, D. Effect of composite mulching patterns on mineral element contents of leaves and fruit quality of apple in dryland. North Hortic. 2020, 5, 46–50. [Google Scholar]
- Li, S.; Fan, T.; Zhao, G.; Dang, Y.; Wang, L.; Zhang, J.; Tang, X.; Cheng, W. Effects of different cultivation patterns on soil moisture, temperature, yield and quality of dryland maize. Acta Pratacult. Sin. 2018, 27, 34–44. [Google Scholar]
- Wang, X.; Kong, X.; Jiang, C.; Zhao, X.; Xing, J.; Zhao, K.; Dang, X.; Yu, H.; Pan, C. Effects of film with different materials on yield and quality of peanut and wind erosion prevention. Agric. Res. Arid Areas 2017, 35, 57–61. [Google Scholar]
- Li, K.; Yun, J.; Chen, K. A Study on the Evaluation Index System of Sustainable Development of Inland Water Transport. In Proceedings of the 2004 International Conference on Innovation & Management, School of Management, Wuhan University of Technology, Wuhan, China, 22 October 2014. [Google Scholar]
- Yi, Y.; Cui, N.; Zhang, Q.; Feng, Y.; Hu, X.; Gong, D. Research on the Comprehensive Evaluation Model of Irrigation Operational Level. China Rural Water Hydropower 2018, 8, 45–54. [Google Scholar]
- Huang, Y.; Xu, S.; Jiang, M.; Li, W. Evaluation for the channel waters navigation safety based on the synthetic weighing of the game theory. J. Saf. Environ. 2021, 21, 2430–2437. [Google Scholar]
- Guo, Q.; Wang, J.; Yin, H.; Zhang, G. A comprehensive evaluation model of regional atmospheric environment carrying capacity: Model development and a case study in China. Ecol. Indic. 2018, 91, 259–267. [Google Scholar] [CrossRef]
- Su, B.; Liu, Z.; Huang, J.; Zhu, Y.; Wei, Y. Assessment on Drought Resistance Cultivation of Cassava Based on Principal Component Analysis. Chin. J. Trop. Crops. 2017, 38, 189–193. [Google Scholar]
- Xiao, R.; Zhang, Y.; Zhao, Y.; Guo, S.; Cui, Z.; Shi, W.; Wu, K.; Yu, H. Effects of Different Drought Resistance Measures Combined with Microbial Fertilizer on Soil Amelioration and Yield of Seed Maize in Hexi Corridor. J. Soil Water. Conserv. 2021, 35, 341–349. [Google Scholar]


| Number | Treatment | Description of Treatments |
|---|---|---|
| SA | water retention agents | Forestry water retention agent (long-term) was selected from Gansu Hai Ruida Ecological Environmental Science and Technology Co., Ltd. Lanzhou, CN. The arable layer soil was turned over 30 cm before sowing and mixed with seed manure of 45.0 kg/ha and depth of 10–15 cm. Then, the drip irrigation belt was paved. Planter dibbling was used to sow female seeds first, and male seeds were sown in different stages. |
| WF | white mulching film | The arable layer soil was turned over 30 cm before sowing. Enough fertilizer was applied, and the drip irrigation belt was paved. A 120 cm wide white mulch film was used to cover, purchased from Shanxi Dongqing Agricultural Film Co., Ltd. Datong City, CN.No space was left between the films, and the films overlapped each other by about 5 cm. Soil was compacted at the interface. Planter dibbling was used to sow female seeds first, and male seeds were sown in different stages. |
| BF | black mulching film | Soil preparation, fertilizing, and drip irrigation belt pavement were the same as the WF treatment before covering the ground. A 120 cm wide black mulch film was used to cover, purchased from Shanxi Dongqing Agricultural Film Co., Ltd. No space was left between the films, and the films overlapped each other by about 5 cm. Soil was compacted at the interface. Planter dibbling was used to sow female seeds first, and male seeds were sown in different stages. |
| SM | straw mulching | Soil preparation, fertilizing, and drip irrigation belt pavement were the same as the WF treatment before covering the ground. The corn straw was crushed into 5–10 cm long sections by machinery, and evenly covered the bare ground between rows totaling 3500 kg/ha after the emergence of seedlings. Planter dibbling was used to sow female seeds first, and male seeds were sown in different stages. |
| CK | open-ground seed | Planter dibbling was used to sow female seeds first, and male seeds were sown in different stages without covering. |
| n | 1 | 2 | 3 | 4 | 5 | 6 | 7 | 8 | 9 | 10 | 11 | 12 | 13 | 14 | 15 |
|---|---|---|---|---|---|---|---|---|---|---|---|---|---|---|---|
| RI | 0 | 0 | 0.52 | 0.89 | 1.12 | 1.24 | 1.36 | 1.41 | 1.46 | 1.49 | 1.52 | 1.54 | 1.56 | 1.58 | 1.59 |
| Year | Treatment | Yield (kg/ha) | Starch (%) | Crude Protein (mg/g) | Crude Fat (%) | Soluble Sugar (%) | Crude Fiber (%) | Water Consumption (m3/ha) | WUE (kg/m3) | Output Value (RMB/ha) | Output Value of One Cubic Meter of Water (RMB/m3) |
|---|---|---|---|---|---|---|---|---|---|---|---|
| 2018 | SA | 8280.75 bc | 67.57 a | 9.08 ab | 1.49 ab | 13.28 ab | 6.75 a | 4211.35 ab | 1.97 b | 31301.24 bc | 9.94 bc |
| WF | 9075.44 ab | 64.96 ab | 9.12 ab | 1.33 bc | 12.04 c | 4.83 c | 4027.18 bc | 2.25 a | 34305.16 ab | 10.89 ab | |
| BF | 9431.62 a | 68.69 a | 9.66 a | 1.55 a | 12.91 bc | 4.53 c | 4111.46 ab | 2.29 a | 35651.52 a | 11.32 a | |
| SM | 7566.39 c | 67.90 a | 9.14 ab | 1.61 a | 14.75 a | 3.87 d | 3985.60 c | 1.90 b | 28600.95 c | 9.08 c | |
| CK | 6229.51 d | 62.78 b | 8.47 b | 1.15 c | 10.37 d | 5.61 b | 4529.03 a | 1.38 c | 23547.55 d | 7.48 d | |
| 2019 | SA | 7915.08 b | 66.98 ab | 8.92 bc | 1.31 cd | 12.76 ab | 6.29 a | 4305.71 bc | 1.84 bc | 28098.53 b | 9.52 b |
| WF | 8845.55 a | 65.11 ab | 8.45 c | 1.42 bc | 11.84 bc | 4.37 b | 4439.24 ab | 1.99 ab | 31401.70 a | 10.64 a | |
| BF | 9317.17 a | 70.18 a | 10.58 a | 1.84 a | 12.15 b | 4.46 b | 4360.85 bc | 2.14 a | 33075.95 a | 11.21 a | |
| SM | 7128.76 c | 68.14 ab | 9.61 ab | 1.51 b | 13.66 a | 5.90 a | 4067.93 c | 1.75 c | 25307.10 c | 8.58 c | |
| CK | 6305.24 d | 63.10 b | 7.79 c | 1.22 d | 11.03 c | 4.51 b | 4843.51 a | 1.30 d | 22383.60 d | 7.59 d |
| O | C1 | C2 | C3 | C4 |
|---|---|---|---|---|
| C1 | 1 | 2 | 3 | 5/3 |
| C2 | 1/2 | 1 | 7/3 | 2 |
| C3 | 1/3 | 3/7 | 1 | 2 |
| C4 | 3/5 | 1/2 | 1/2 | 1 |
| Method | C1 | C2 | C3 | C4 | CI | CR | |
|---|---|---|---|---|---|---|---|
| Average method | 0.4023 | 0.2754 | 0.1731 | 0.1493 | 4.2124 | 0.0708 | 0.0796 |
| Geometric means method | 0.4071 | 0.2830 | 0.1674 | 0.1425 | |||
| Eigenvector method | 0.4070 | 0.2774 | 0.1699 | 0.1456 |
| Target Layer | Criterion Layer (Weights) | Indicator Layer | Comprehensive Weight | ||
|---|---|---|---|---|---|
| Index | Weights | ||||
| Benefit evaluation of different drought resistance measures of maize seed | Yield C1 (0.4070) | Yield | P1 | 1 | 0.4070 |
| Quality C2 (0.2774) | Starch | P2 | 0.1161 | 0.0322 | |
| Crude protein | P3 | 0.2502 | 0.0694 | ||
| Crude fat | P4 | 0.1269 | 0.0352 | ||
| Soluble sugar | P5 | 0.4047 | 0.1123 | ||
| Crude fiber | P6 | 0.1021 | 0.0283 | ||
| Water use status C3 (0.1699) | Water consumption | P7 | 0.2500 | 0.0425 | |
| WUE | P8 | 0.7500 | 0.1274 | ||
| Economic benefits C4 (0.1456) | Output value | P9 | 0.3333 | 0.0485 | |
| Output value of one cubic meter of water | P10 | 0.6667 | 0.0971 | ||
| Year | Yield P1 | Starch P2 | Crude Protein P3 | Crude Fat P4 | Soluble Sugar P5 | Crude Fiber P6 | Water Consumption P7 | WUE P8 | Output Value P9 | Output Value of One Cubic Meter of Water P10 |
|---|---|---|---|---|---|---|---|---|---|---|
| 2018 | 0.10168 | 0.10385 | 0.09884 | 0.10204 | 0.10440 | 0.10151 | 0.09055 | 0.09372 | 0.10168 | 0.10173 |
| 2019 | 0.09960 | 0.09652 | 0.10856 | 0.13416 | 0.09894 | 0.10630 | 0.07871 | 0.07796 | 0.09960 | 0.09963 |
| Indicator | Subjective Weight | Objective Weight | Combined Weights | |||
|---|---|---|---|---|---|---|
| 2018 | 2019 | 2018 | 2019 | |||
| Yield | P1 | 0.4070 | 0.10168 | 0.09960 | 0.4082 | 0.3845 |
| Starch | P2 | 0.0322 | 0.10385 | 0.09652 | 0.0319 | 0.0369 |
| Crude protein | P3 | 0.0694 | 0.09884 | 0.10856 | 0.0693 | 0.0723 |
| Crude fat | P4 | 0.0352 | 0.10204 | 0.13416 | 0.0350 | 0.0425 |
| Soluble sugar | P5 | 0.1123 | 0.1044 | 0.09894 | 0.1123 | 0.1113 |
| Crude fiber | P6 | 0.0283 | 0.10151 | 0.10630 | 0.0280 | 0.0340 |
| Water consumption | P7 | 0.0425 | 0.09055 | 0.07871 | 0.0423 | 0.0452 |
| WUE | P8 | 0.1274 | 0.09372 | 0.07796 | 0.1275 | 0.1238 |
| Output value | P9 | 0.0485 | 0.10168 | 0.09960 | 0.0483 | 0.0523 |
| Output value of one cubic meter of water | P10 | 0.0971 | 0.10173 | 0.09963 | 0.0971 | 0.0973 |
| Year | Treatment Number | Yield | Starch | Crude Protein | Crude Fat | Soluble Sugar | Crude Fiber | Water Consumption | WUE | Output Value | Output Value of One Cubic meter of Water |
|---|---|---|---|---|---|---|---|---|---|---|---|
| 2018 | SA | 0.1844 | 0.0145 | 0.0309 | 0.0162 | 0.0523 | 0.0000 | 0.0148 | 0.0566 | 0.0218 | 0.0439 |
| WF | 0.2021 | 0.0140 | 0.0311 | 0.0145 | 0.0474 | 0.0126 | 0.0234 | 0.0646 | 0.0239 | 0.0481 | |
| BF | 0.2101 | 0.0148 | 0.0329 | 0.0169 | 0.0508 | 0.0146 | 0.0195 | 0.0658 | 0.0249 | 0.0500 | |
| SM | 0.1685 | 0.0146 | 0.0311 | 0.0176 | 0.0581 | 0.0189 | 0.0253 | 0.0546 | 0.0199 | 0.0401 | |
| CK | 0.1387 | 0.0135 | 0.0288 | 0.0125 | 0.0408 | 0.0075 | 0.0000 | 0.0396 | 0.0164 | 0.0330 | |
| Optimal vector | 0.2101 | 0.148 | 0.0329 | 0.0176 | 0.0581 | 0.0000 | 0.0000 | 0.0658 | 0.0249 | 0.0500 | |
| Worst vector | 0.1387 | 0.135 | 0.0288 | 0.0125 | 0.0408 | 0.0189 | 0.0253 | 0.0396 | 0.0164 | 0.0330 | |
| 2019 | SA | 0.1706 | 0.0166 | 0.0316 | 0.0169 | 0.0516 | 0.0000 | 0.0214 | 0.0558 | 0.0232 | 0.0432 |
| WF | 0.1906 | 0.0161 | 0.0300 | 0.0183 | 0.0478 | 0.0203 | 0.0161 | 0.0603 | 0.0259 | 0.0482 | |
| BF | 0.2008 | 0.0174 | 0.0375 | 0.0237 | 0.0491 | 0.0193 | 0.0192 | 0.0649 | 0.0273 | 0.0508 | |
| SM | 0.1536 | 0.0168 | 0.0341 | 0.0194 | 0.0552 | 0.0041 | 0.0309 | 0.0530 | 0.0209 | 0.0389 | |
| CK | 0.1359 | 0.0156 | 0.0276 | 0.0157 | 0.0446 | 0.0188 | 0.0000 | 0.0394 | 0.0185 | 0.0344 | |
| Optimal vector | 0.2008 | 0.0174 | 0.0375 | 0.0237 | 0.0552 | 0.0000 | 0.0000 | 0.0649 | 0.0273 | 0.0508 | |
| Worst vector | 0.1359 | 0.0156 | 0.0276 | 0.0157 | 0.0446 | 0.0203 | 0.0309 | 0.0394 | 0.0185 | 0.0344 |
| Treatment Number | 2018 | 2019 | ||||||||
|---|---|---|---|---|---|---|---|---|---|---|
| Ranking | Ranking | |||||||||
| SA | 0.1365 | 0.1266 | 0.4812 | 0.1632 | 4 | 0.1406 | 0.1318 | 0.4839 | 0.1719 | 4 |
| WF | 0.0555 | 0.1935 | 0.7772 | 0.2636 | 2 | 0.0860 | 0.1804 | 0.6773 | 0.2405 | 2 |
| BF | 0.0443 | 0.2013 | 0.8195 | 0.2779 | 1 | 0.0581 | 0.2068 | 0.7806 | 0.2772 | 1 |
| SM | 0.0822 | 0.1900 | 0.6979 | 0.2367 | 3 | 0.1321 | 0.1619 | 0.5508 | 0.1956 | 3 |
| CK | 0.2139 | 0.0447 | 0.1729 | 0.0586 | 5 | 0.2135 | 0.1020 | 0.3232 | 0.1148 | 5 |
Publisher’s Note: MDPI stays neutral with regard to jurisdictional claims in published maps and institutional affiliations. |
© 2022 by the authors. Licensee MDPI, Basel, Switzerland. This article is an open access article distributed under the terms and conditions of the Creative Commons Attribution (CC BY) license (https://creativecommons.org/licenses/by/4.0/).
Share and Cite
Liang, C.; Yu, S.; Zhang, H.; Wang, Z.; Li, F. Economic Evaluation of Drought Resistance Measures for Maize Seed Production Based on TOPSIS Model and Combination Weighting Optimization. Water 2022, 14, 3262. https://doi.org/10.3390/w14203262
Liang C, Yu S, Zhang H, Wang Z, Li F. Economic Evaluation of Drought Resistance Measures for Maize Seed Production Based on TOPSIS Model and Combination Weighting Optimization. Water. 2022; 14(20):3262. https://doi.org/10.3390/w14203262
Chicago/Turabian StyleLiang, Chao, Shouchao Yu, Hengjia Zhang, Zeyi Wang, and Fuqiang Li. 2022. "Economic Evaluation of Drought Resistance Measures for Maize Seed Production Based on TOPSIS Model and Combination Weighting Optimization" Water 14, no. 20: 3262. https://doi.org/10.3390/w14203262