
Assessment of Zerovalent Iron Nanoparticle (nZVI) Efficiency for Remediation of Arsenic-Contaminated Groundwater: Two Laboratory Experiments


Abstract
:1. Introduction
1.1. Overview of Some Environmental Applications
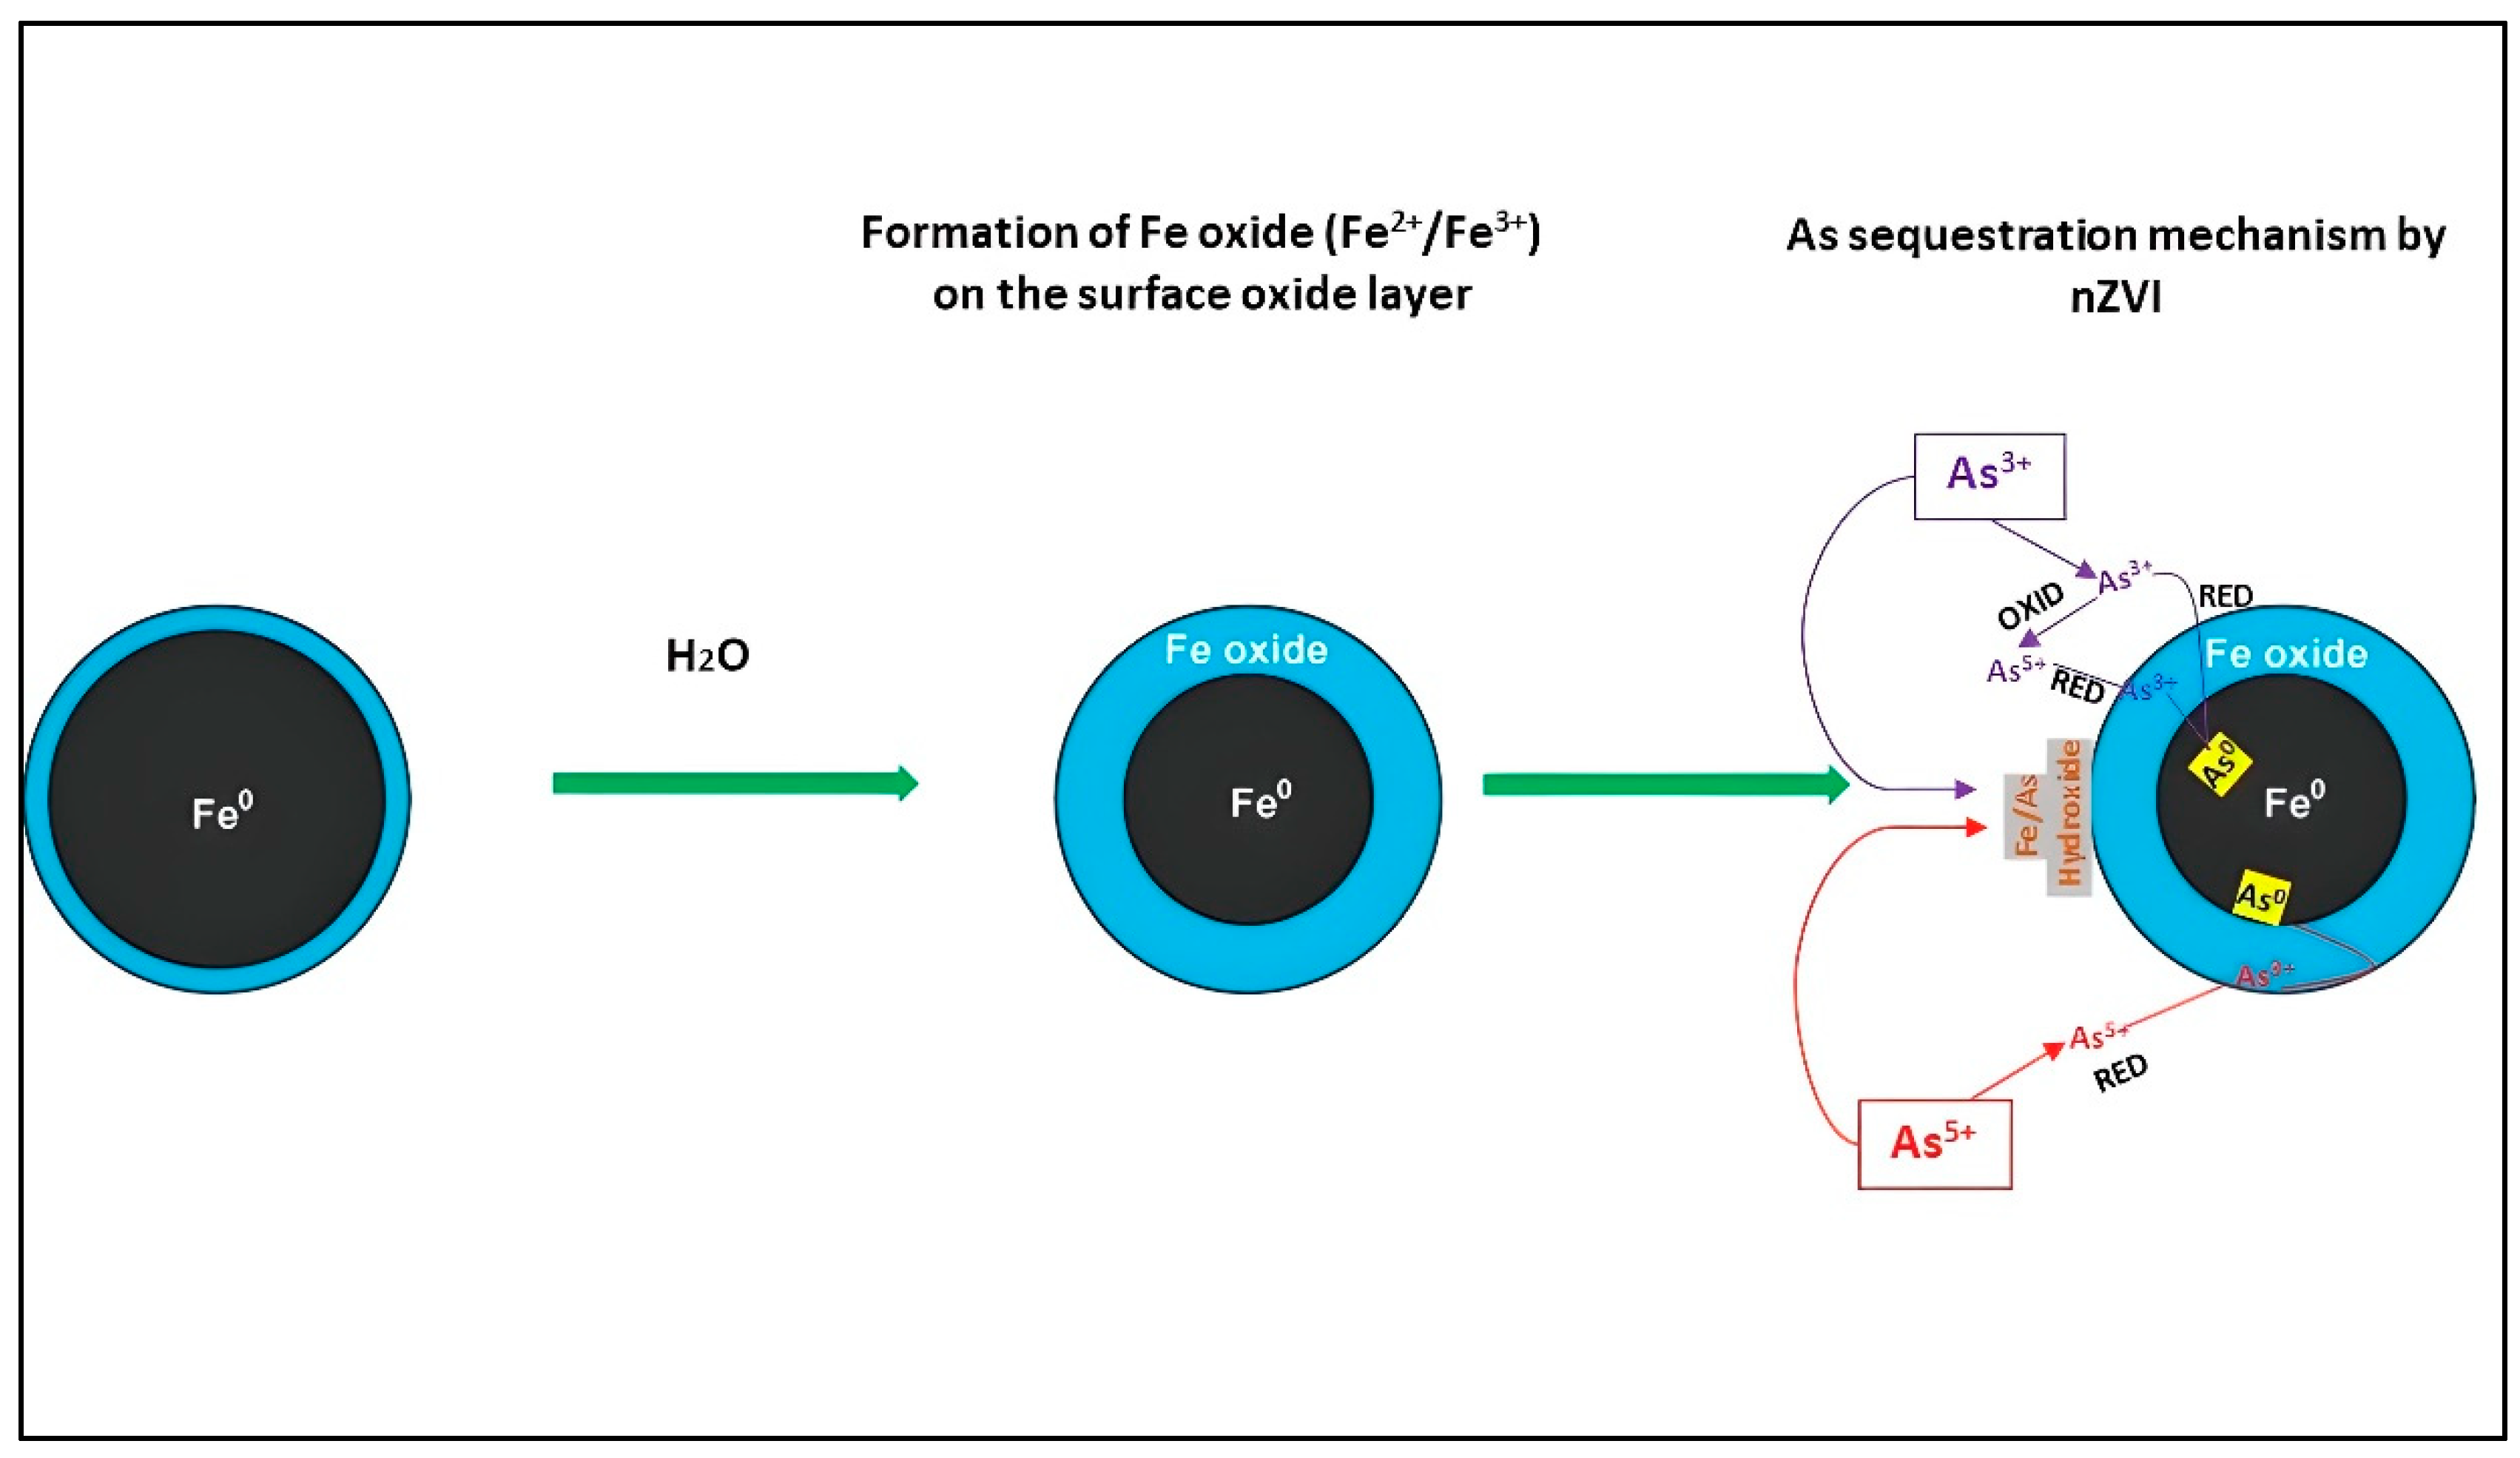
1.2. Interaction Mechanisms between Arsenic (As) and nZVI
2. Materials and Methods
- -
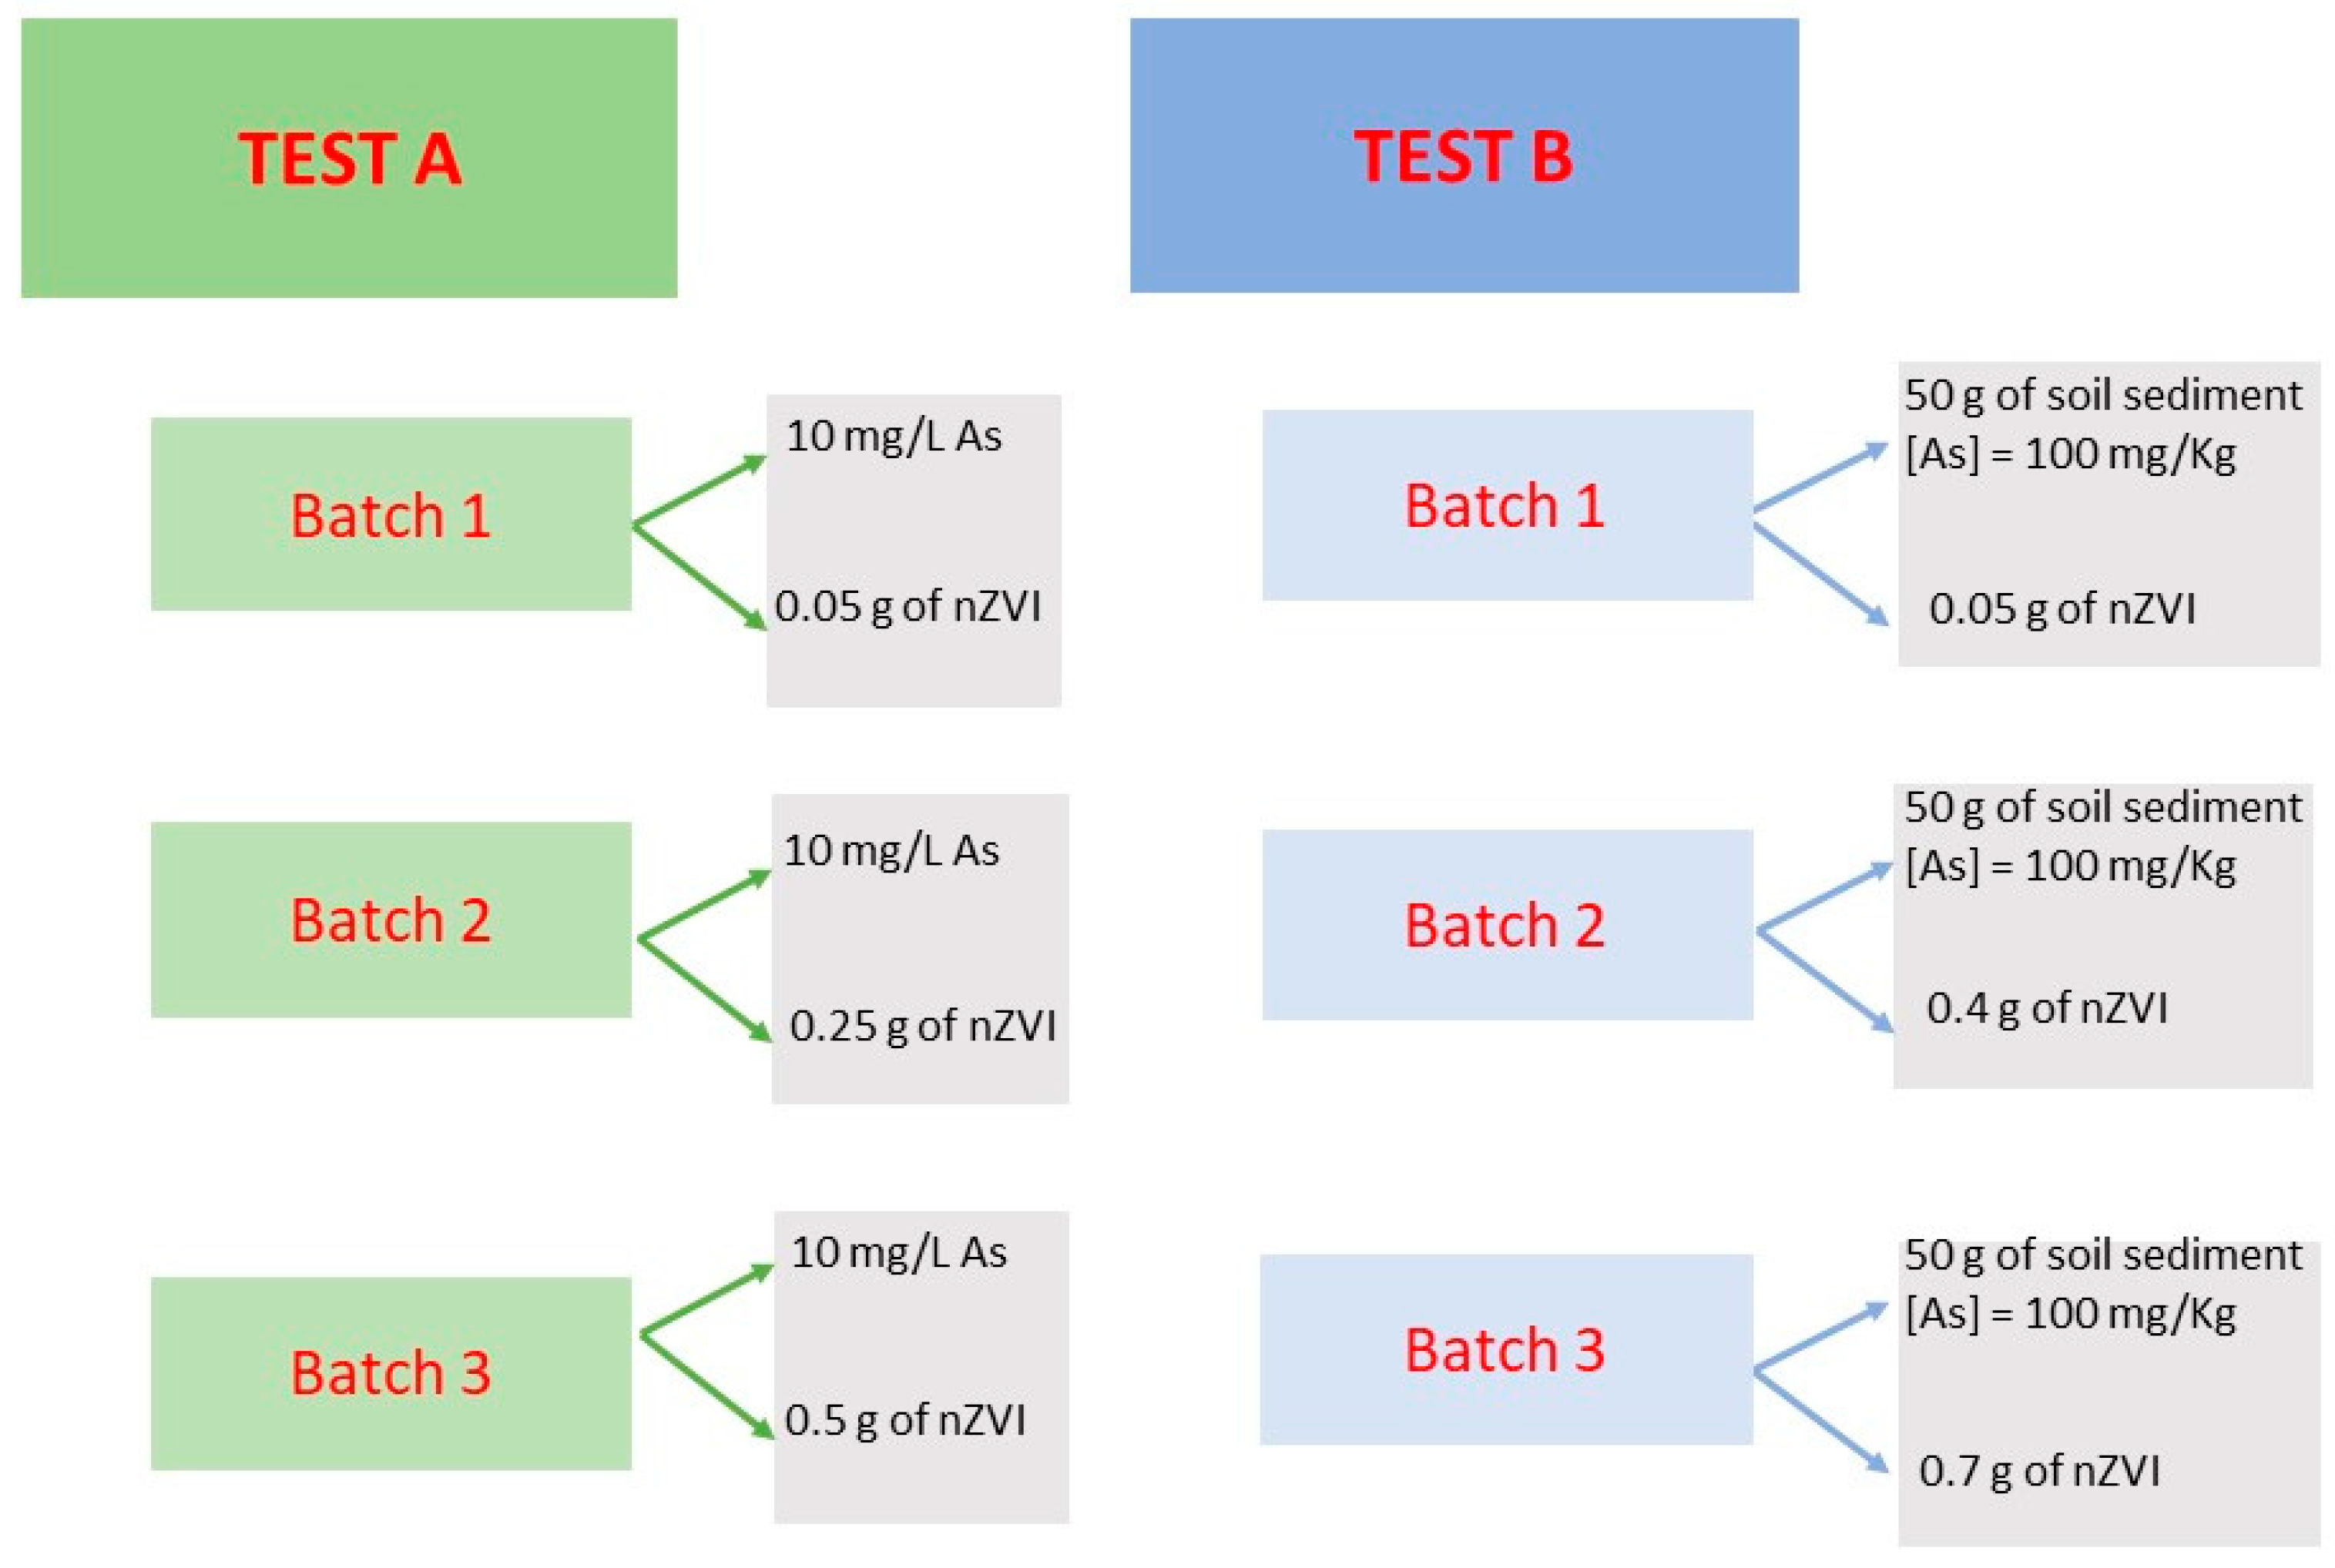
- Test A: experiment carried out on arsenic-contaminated water (HAsNa2O4 ∗ 7H2O) with nZVI injection;
- -
- Test B: experiment carried out on a sample of arsenic-contaminated sediment with nZVI injection.
2.1. Test A
2.2. Test B
3. Results and Discussion
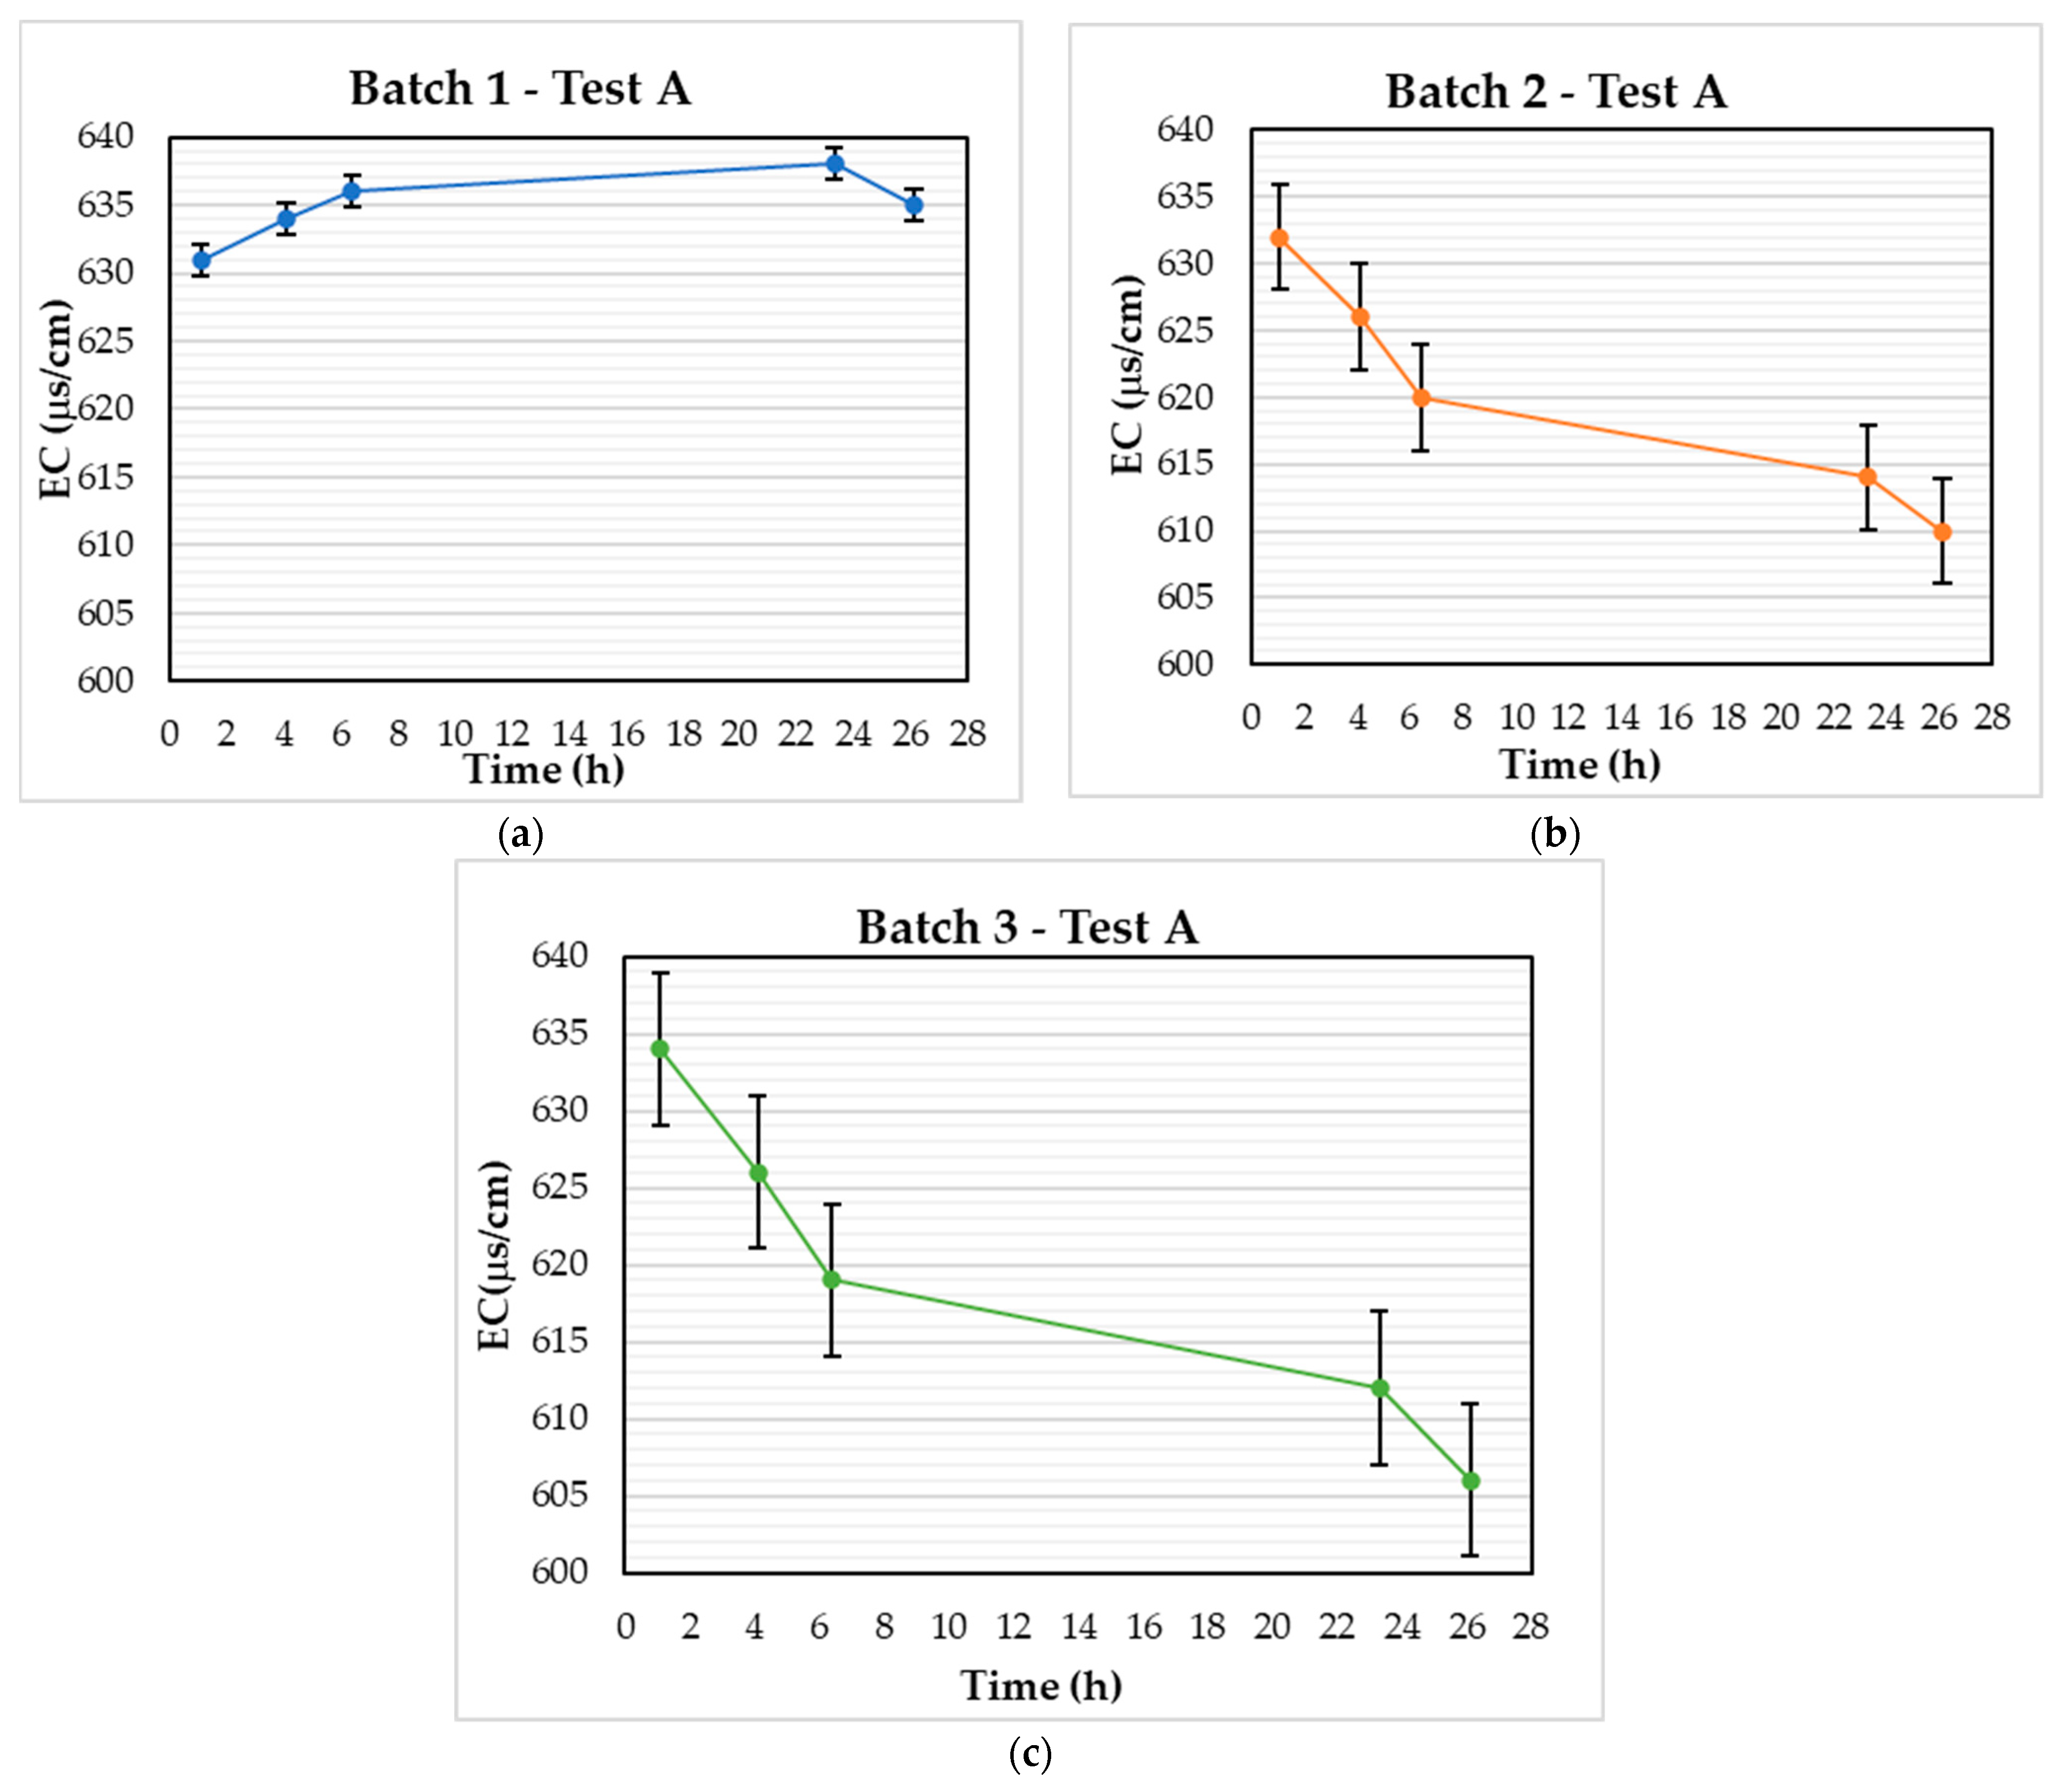
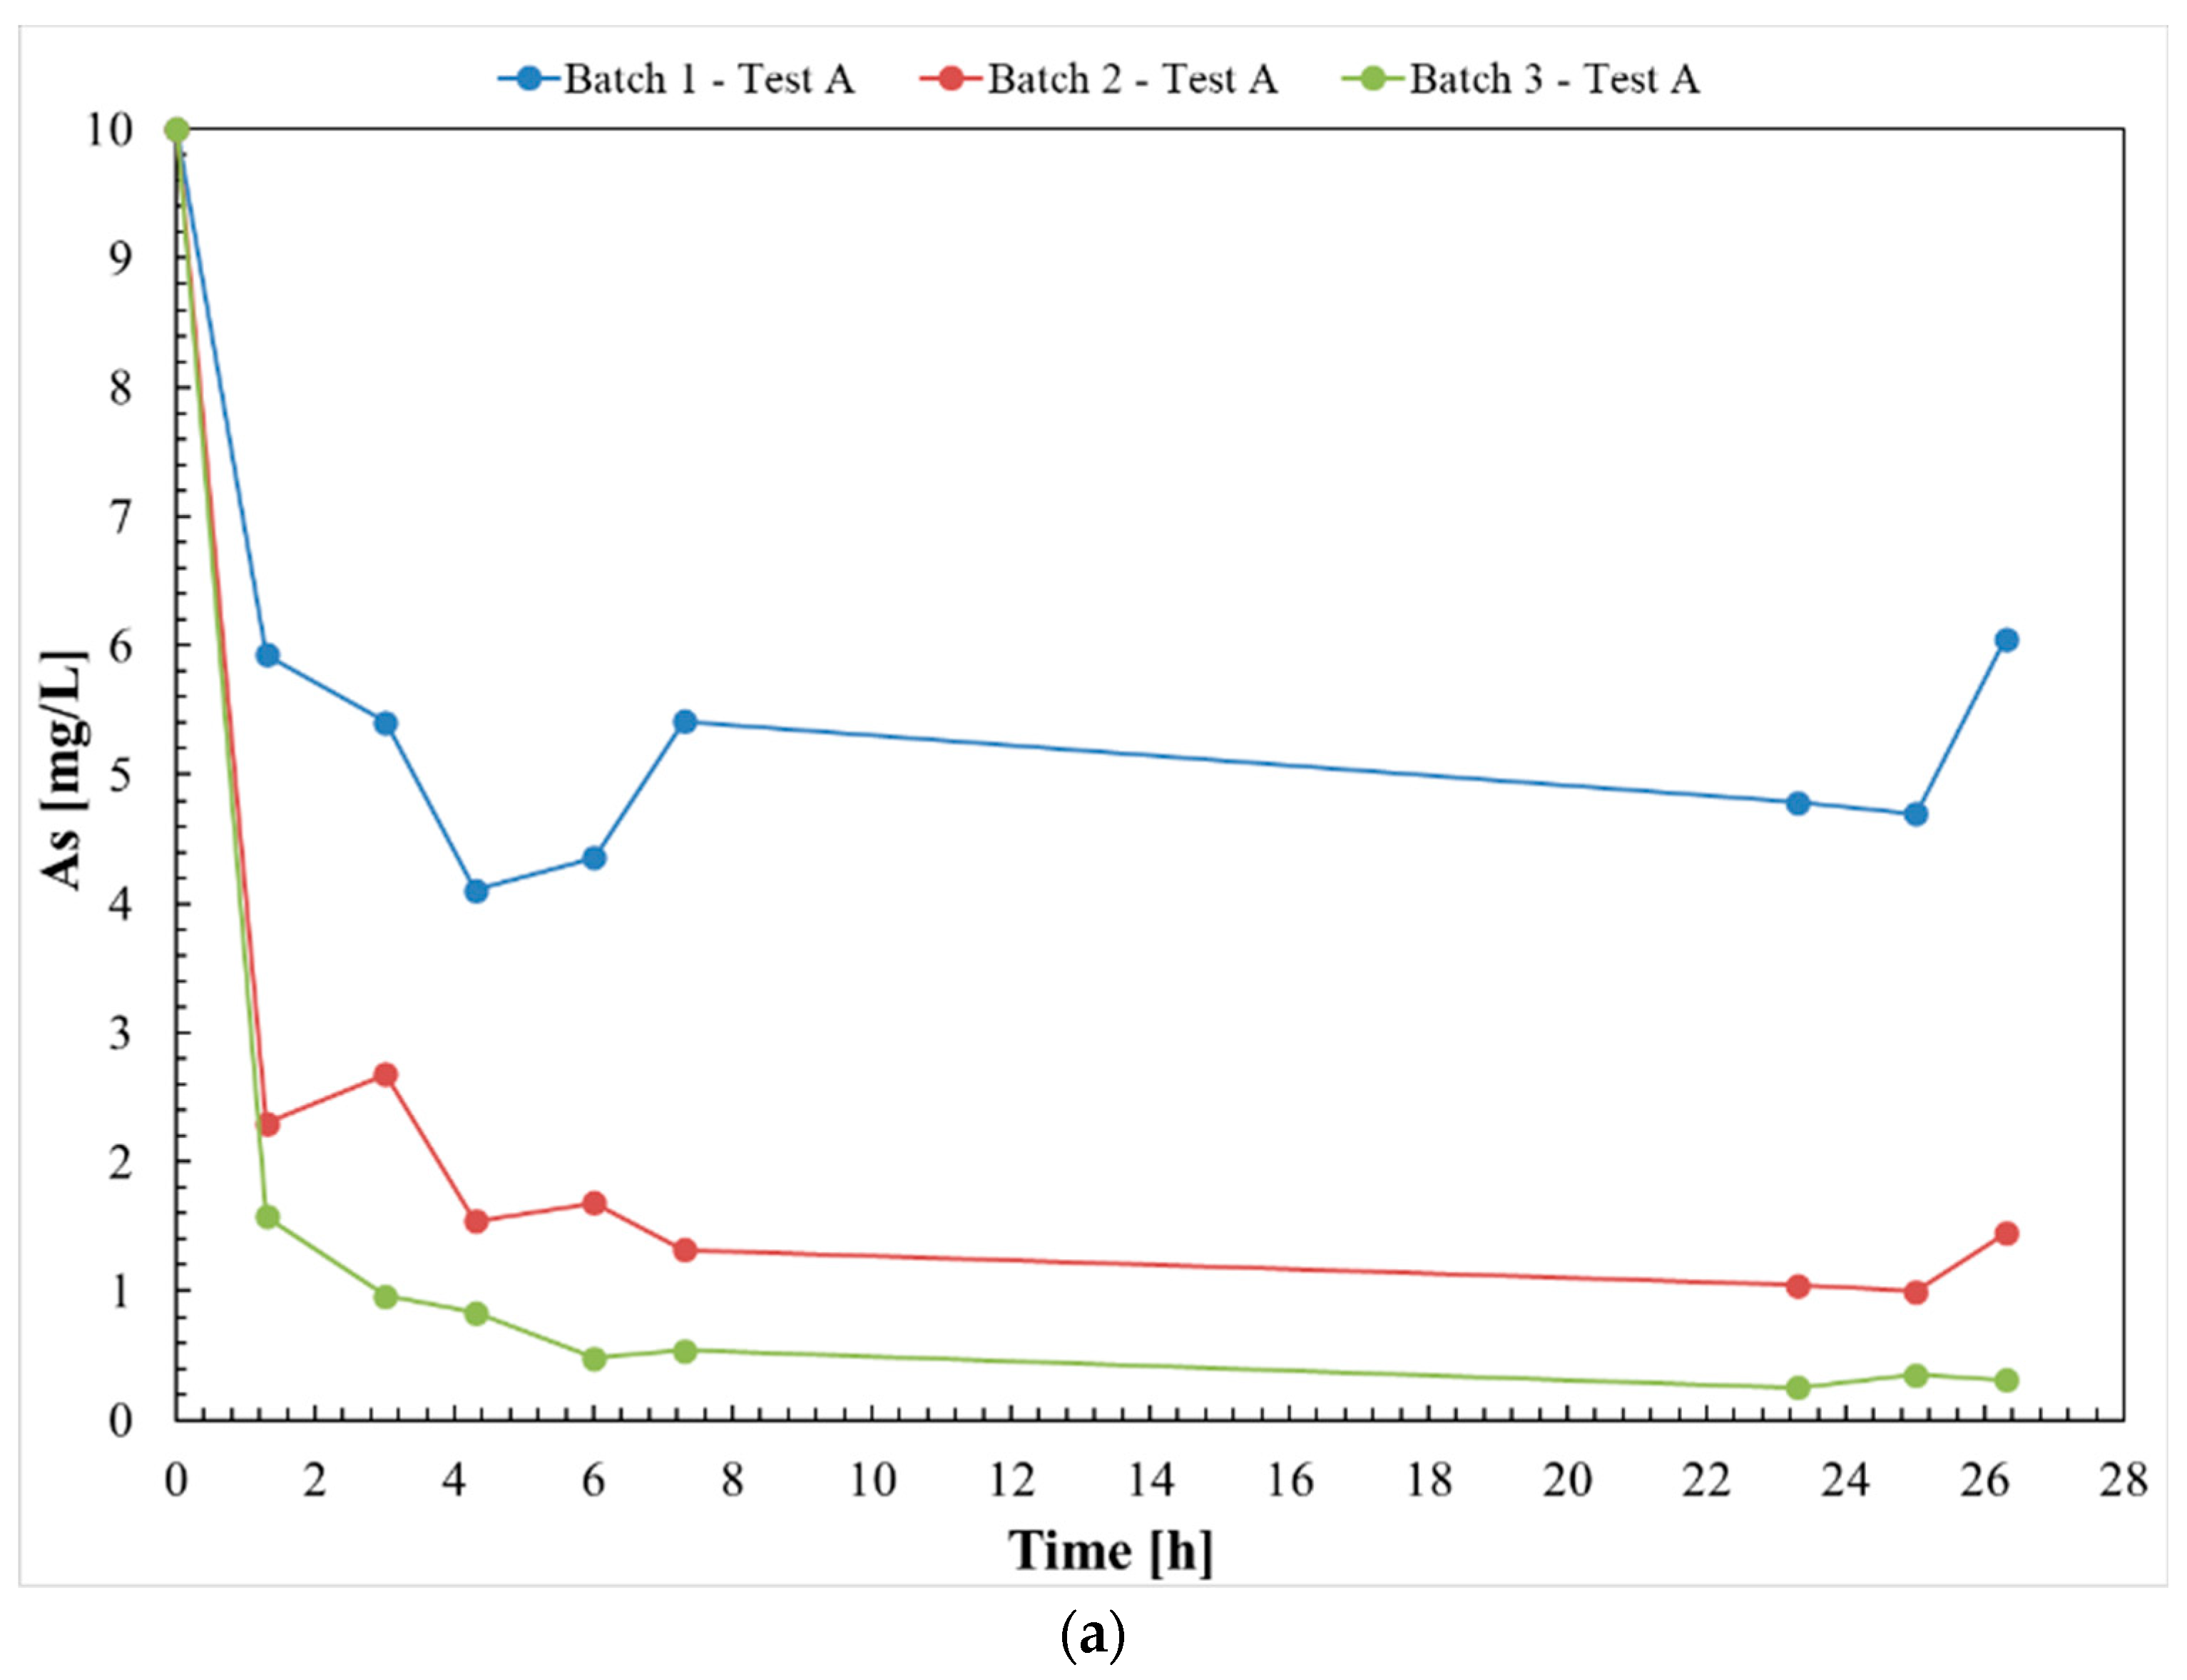
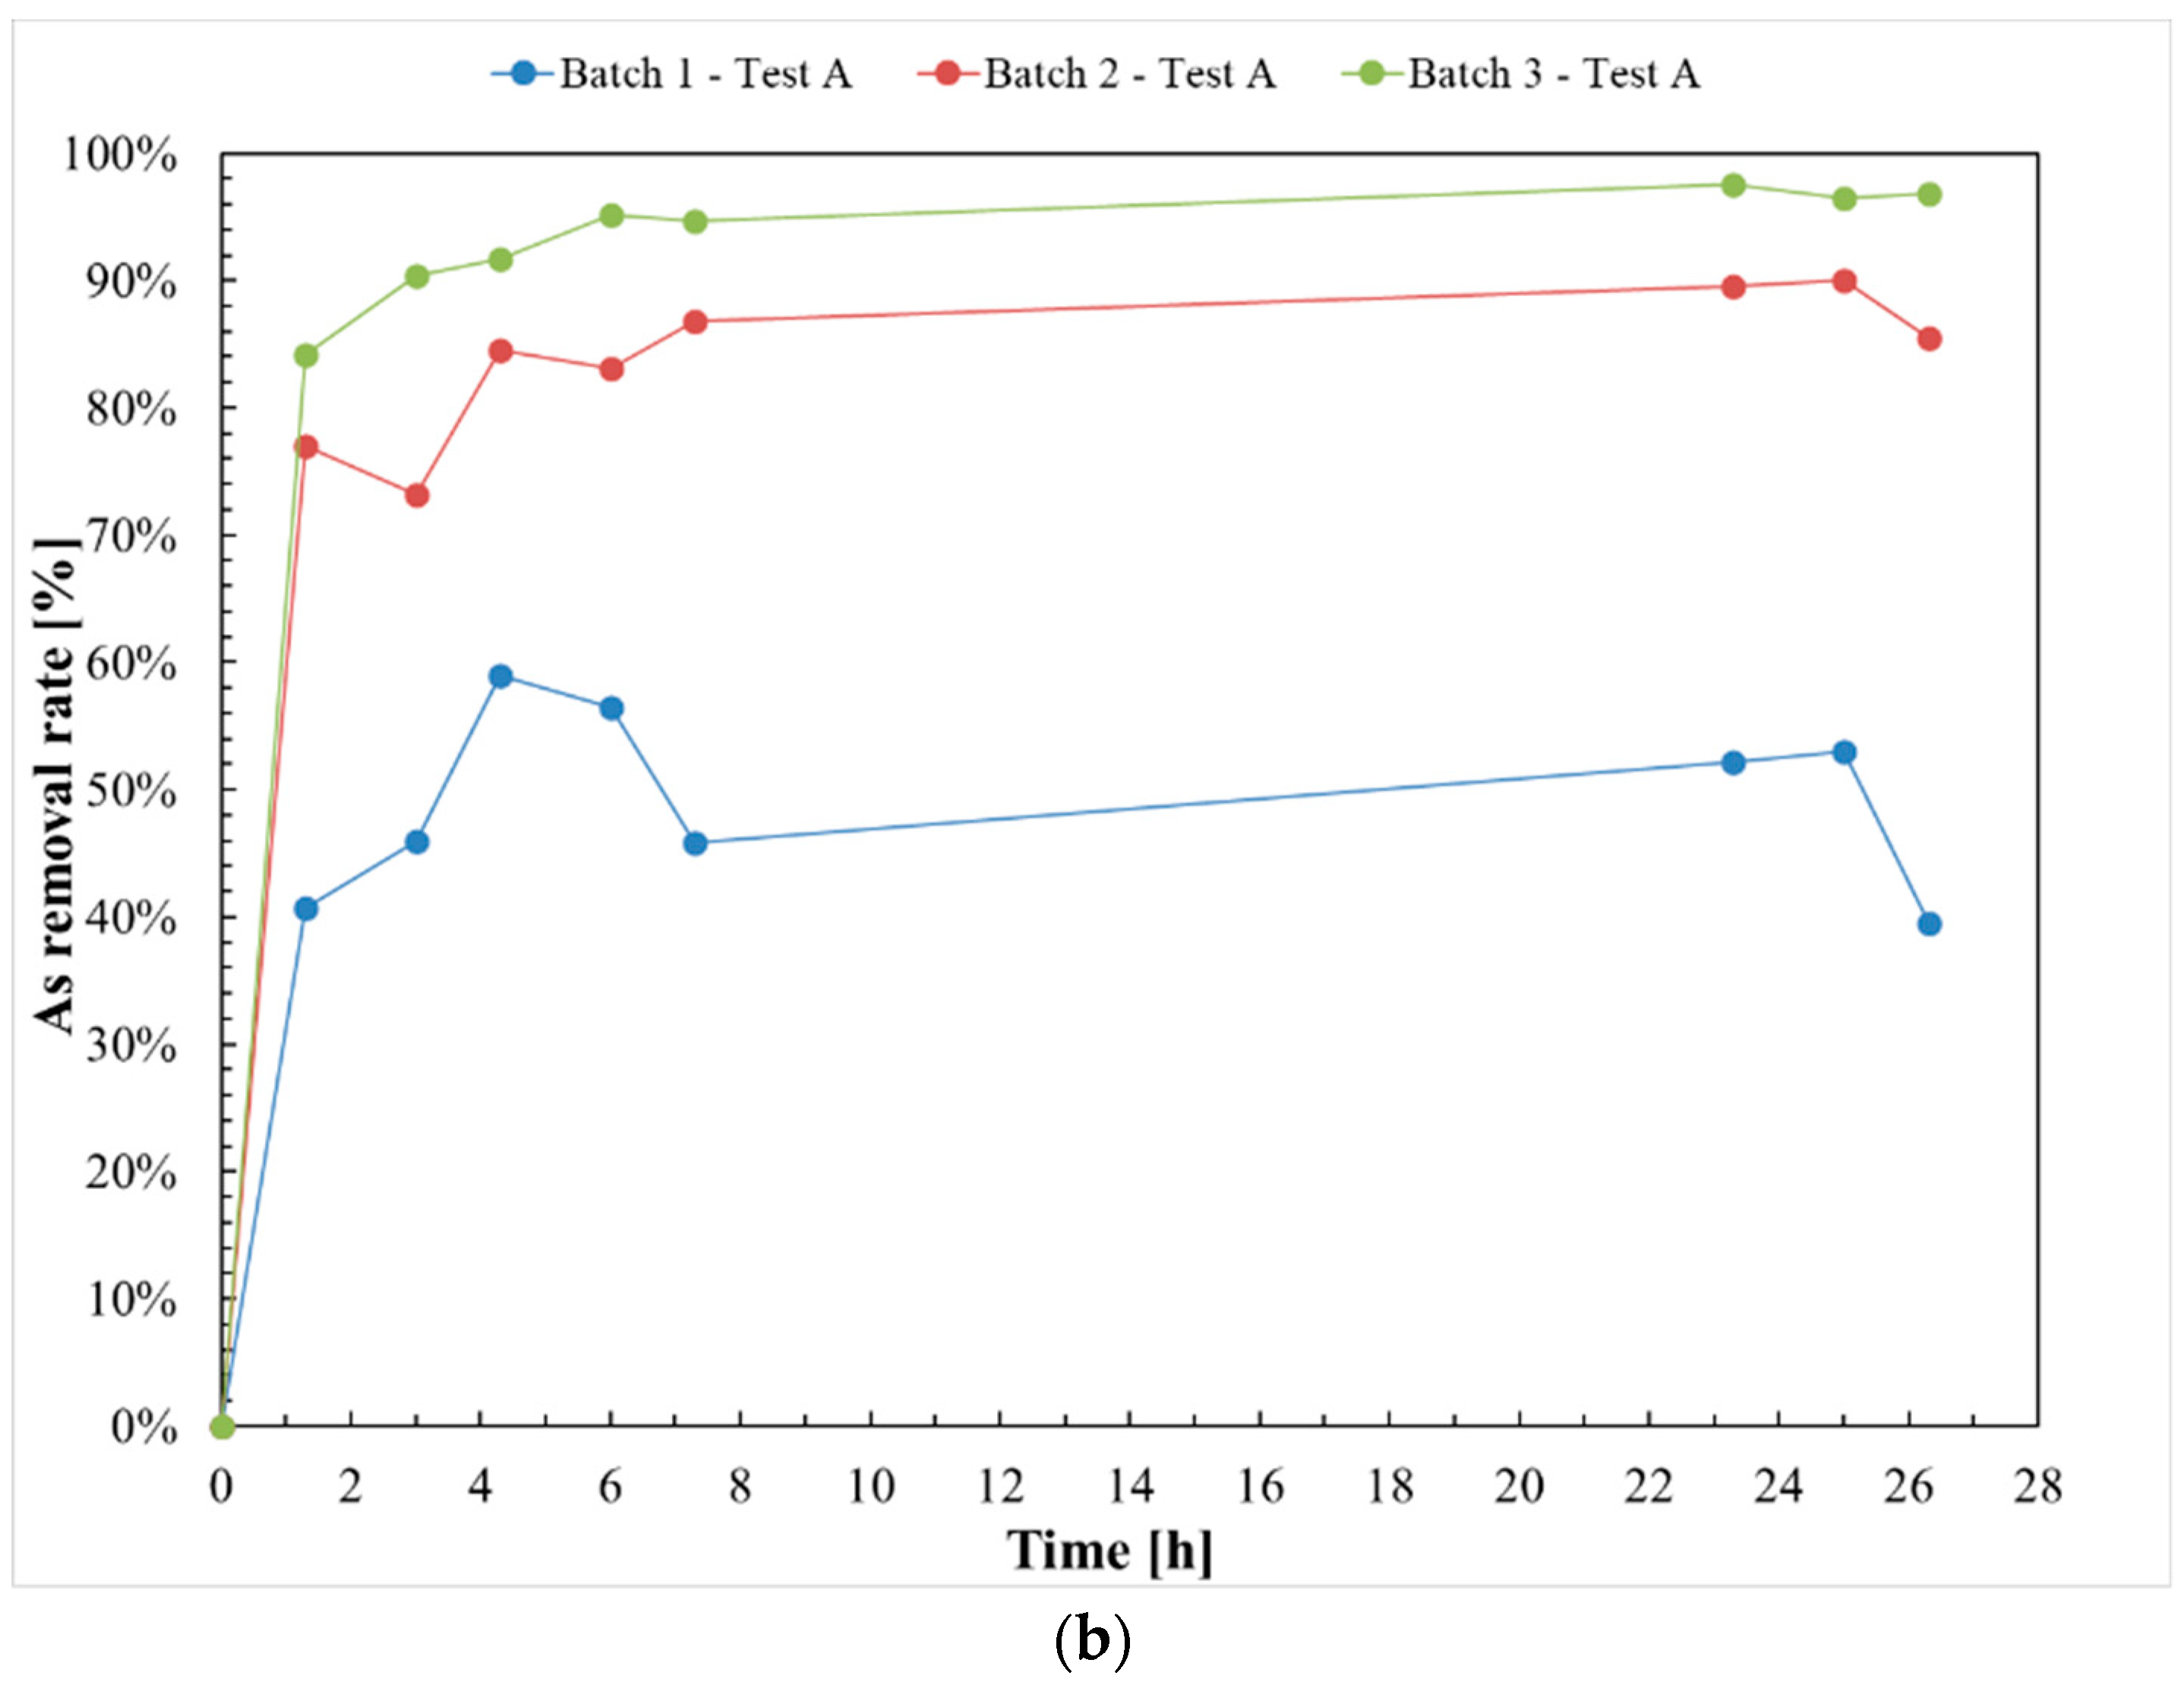
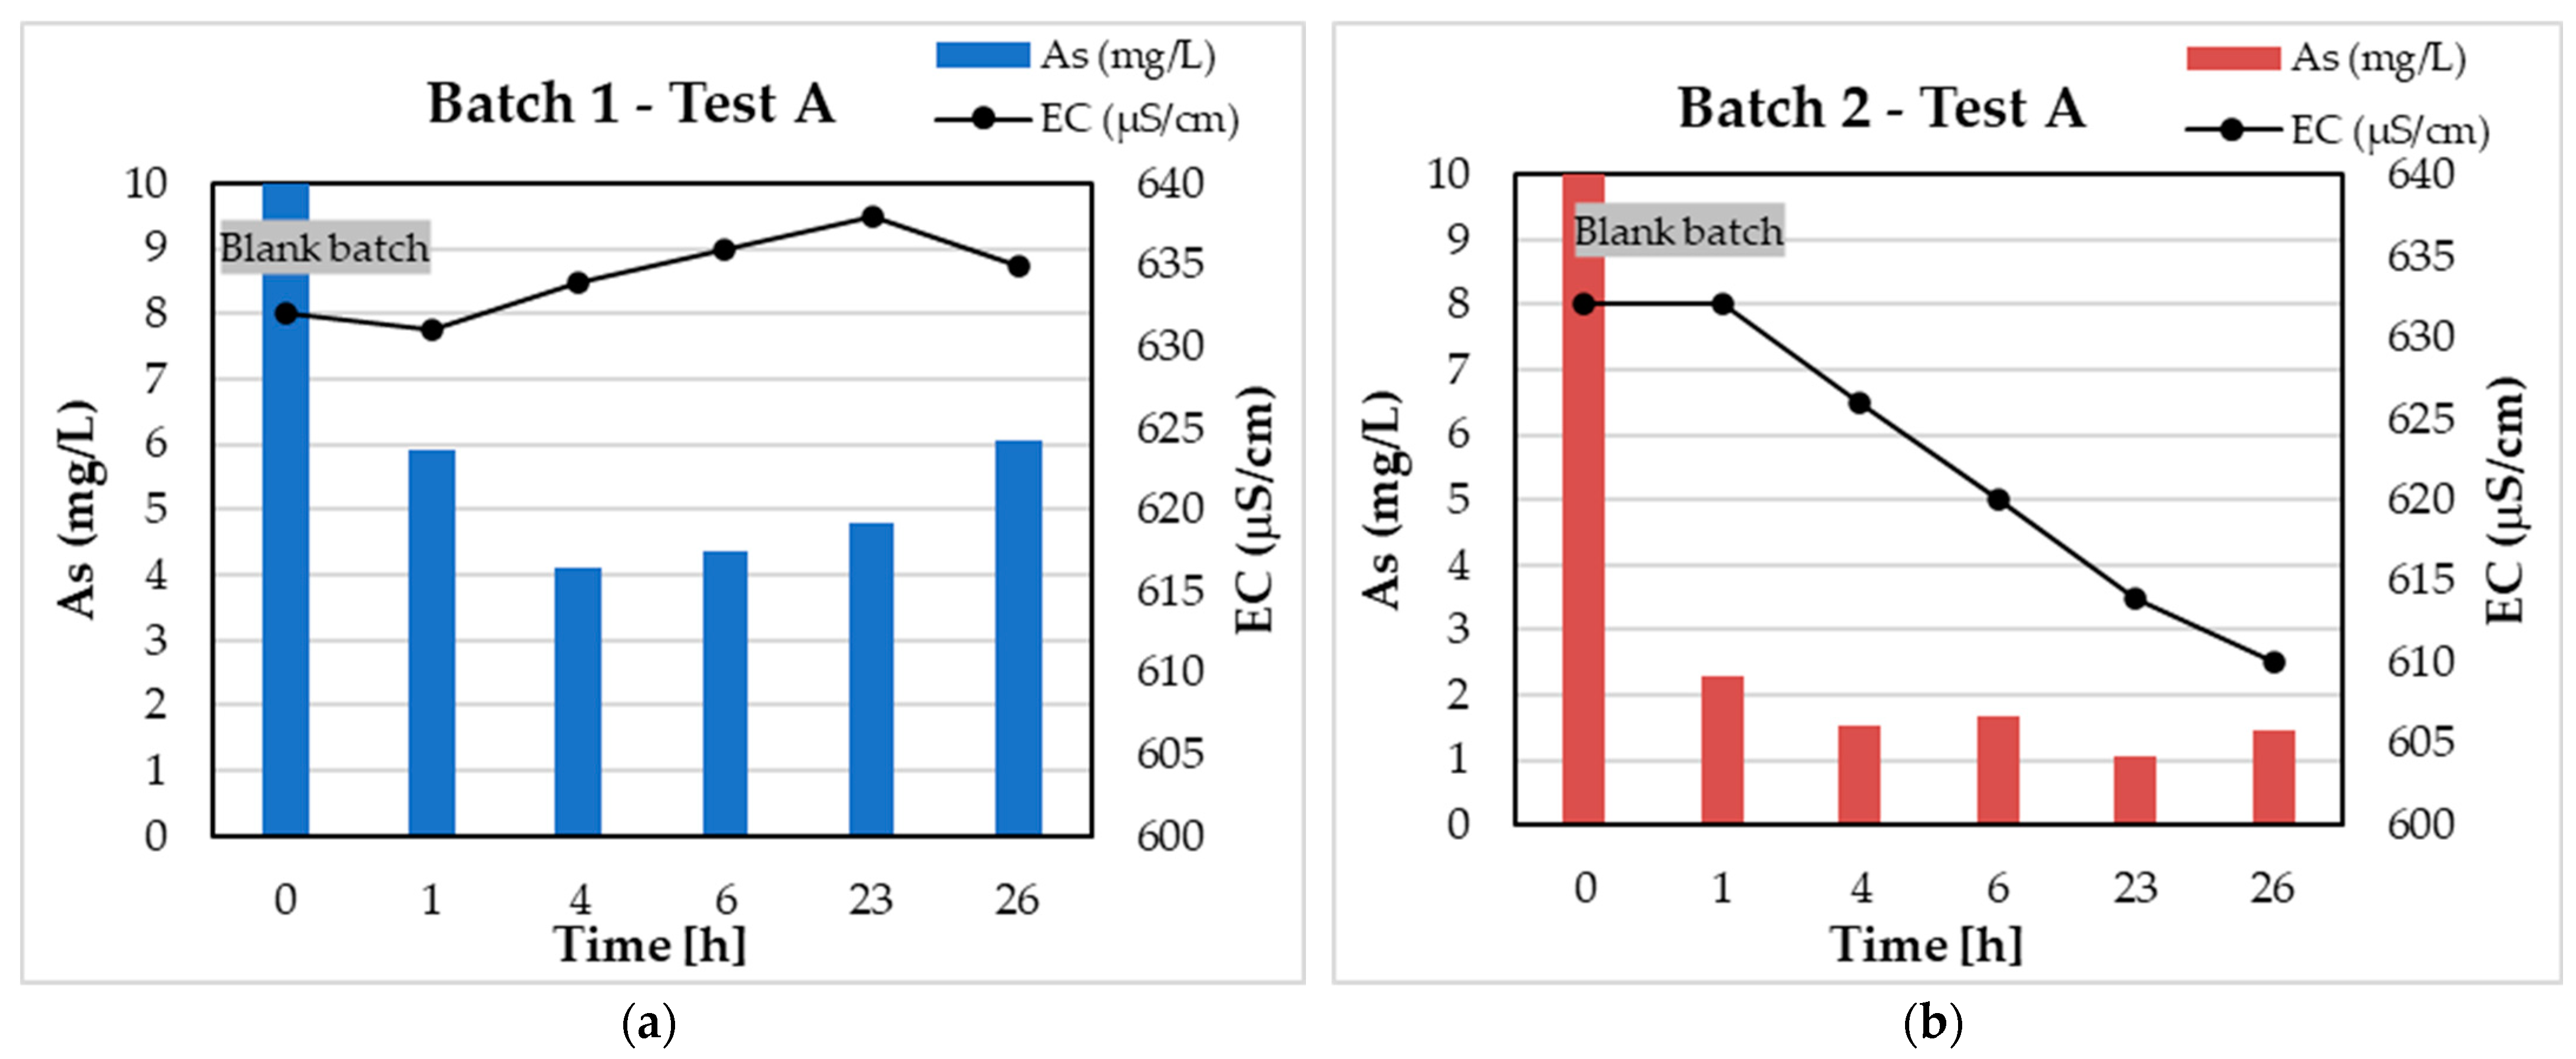
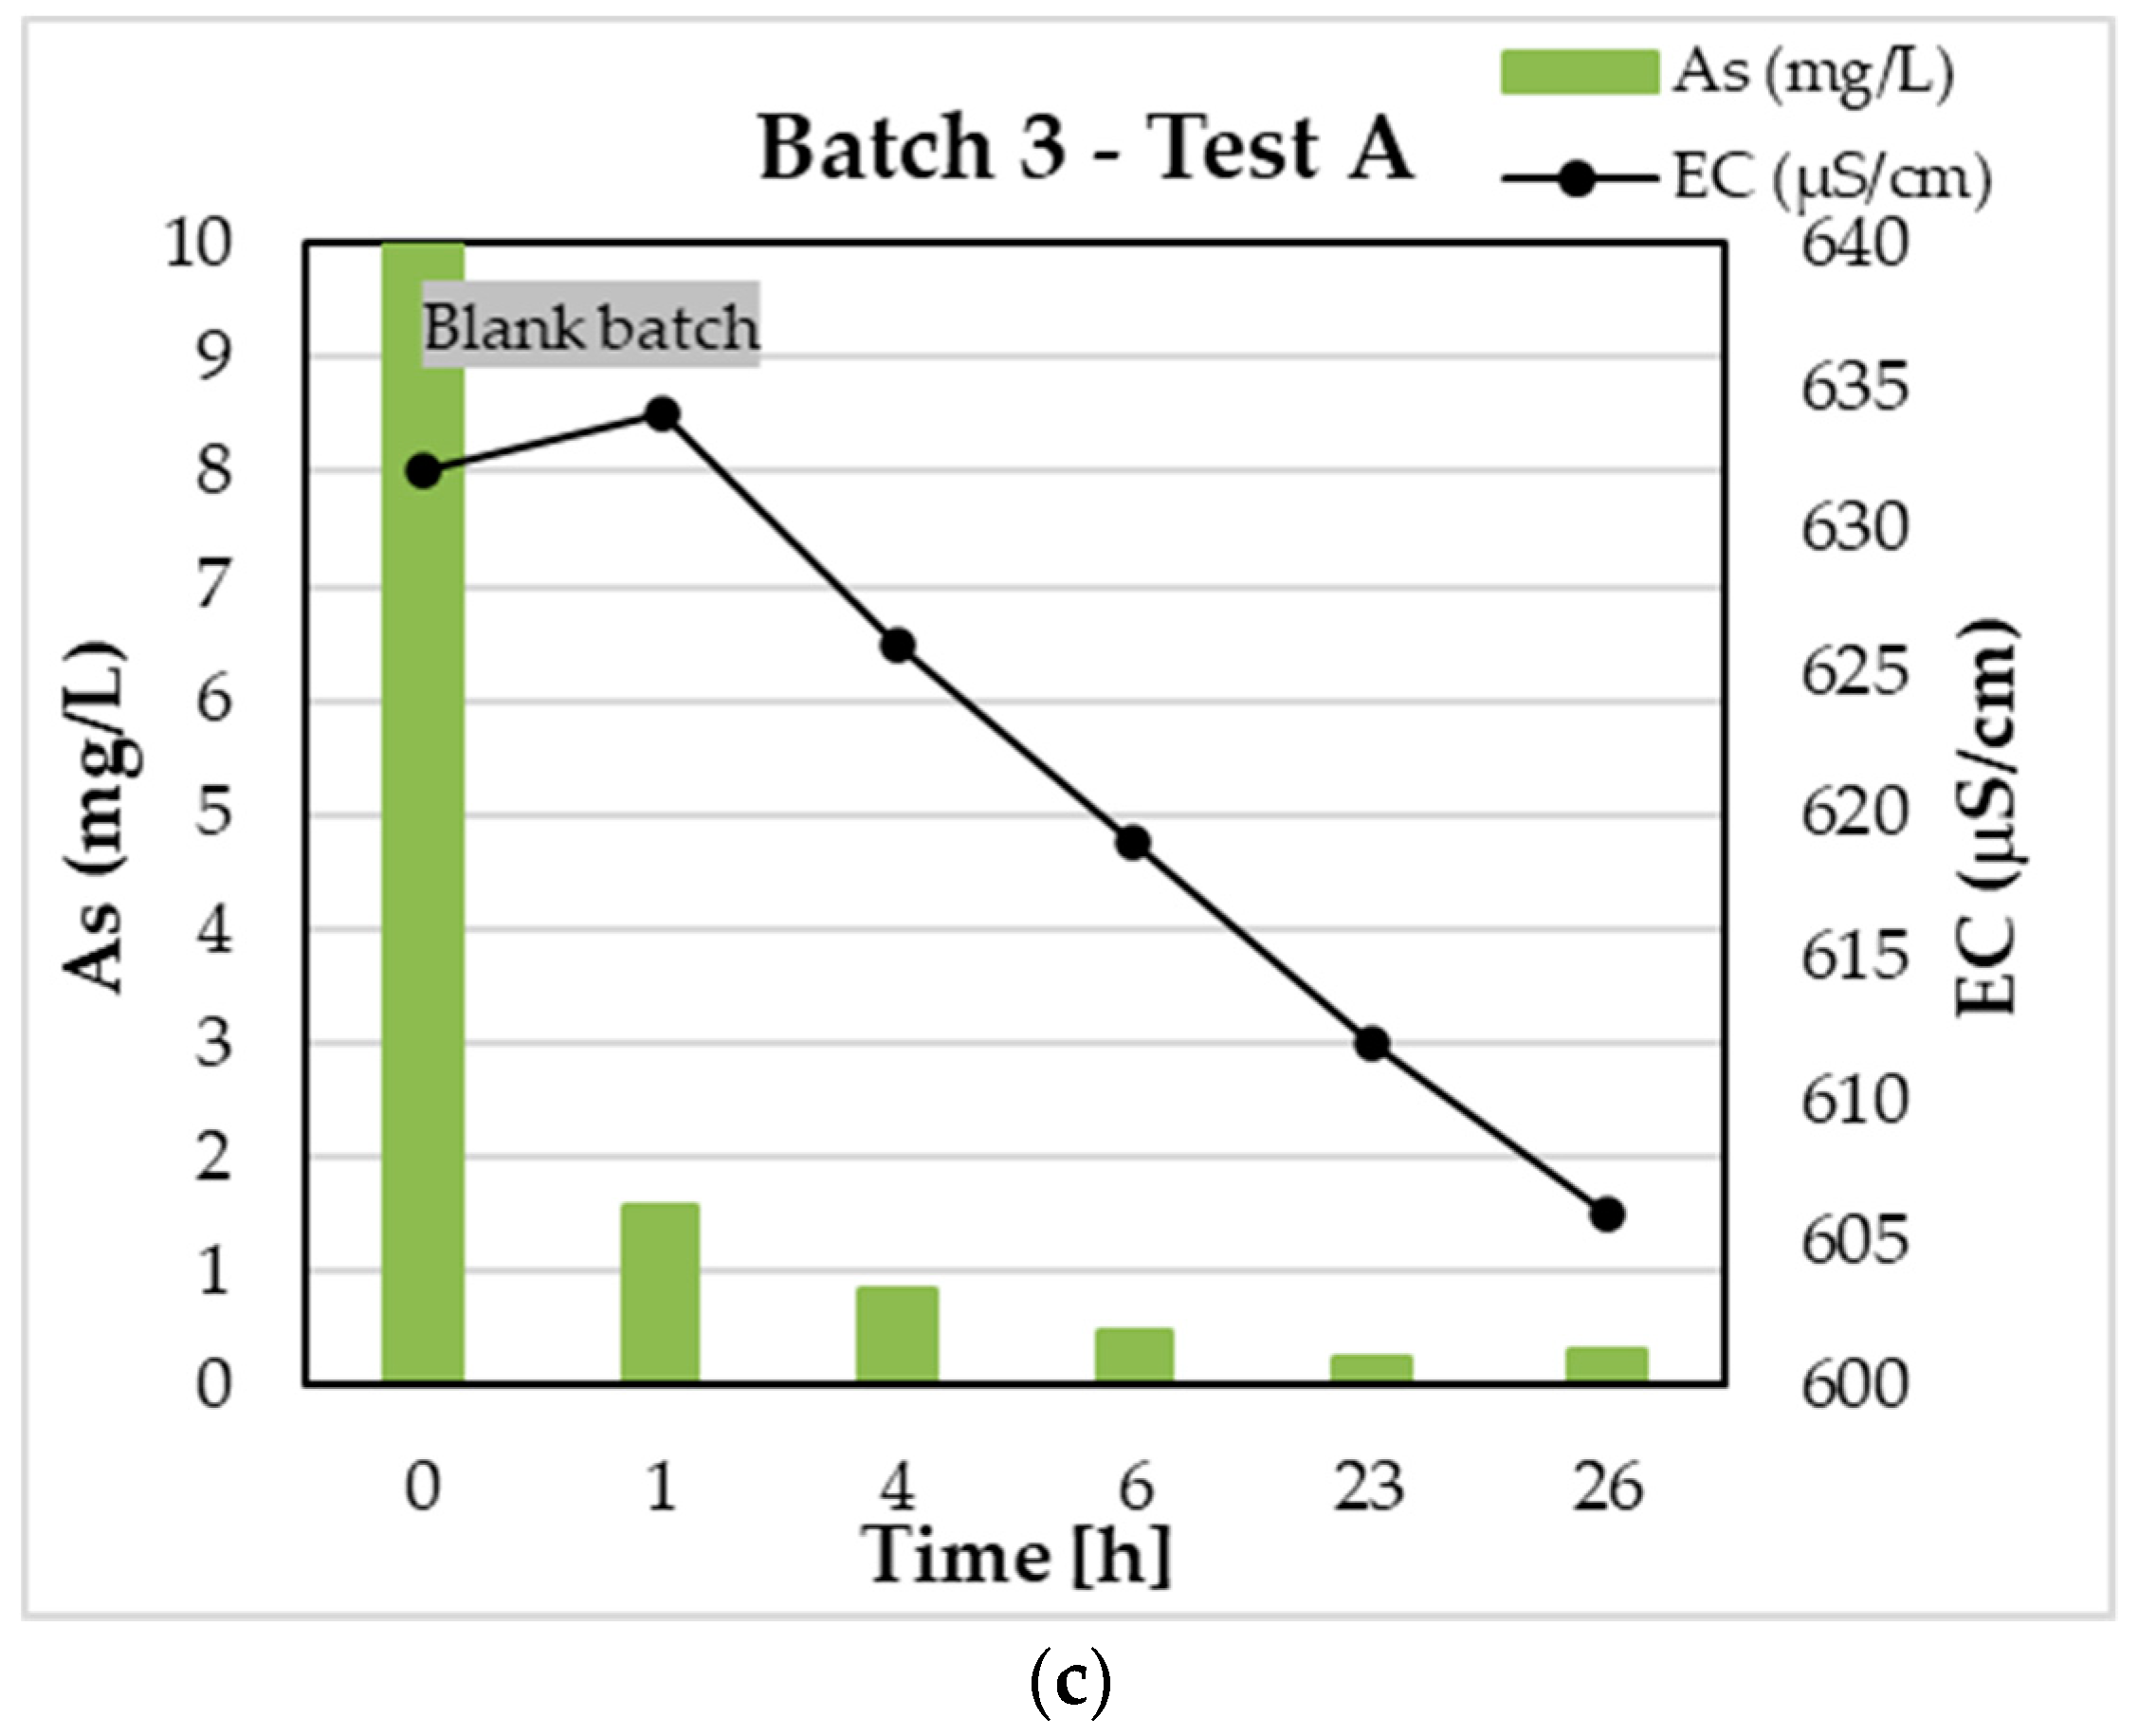
3.1. Test A
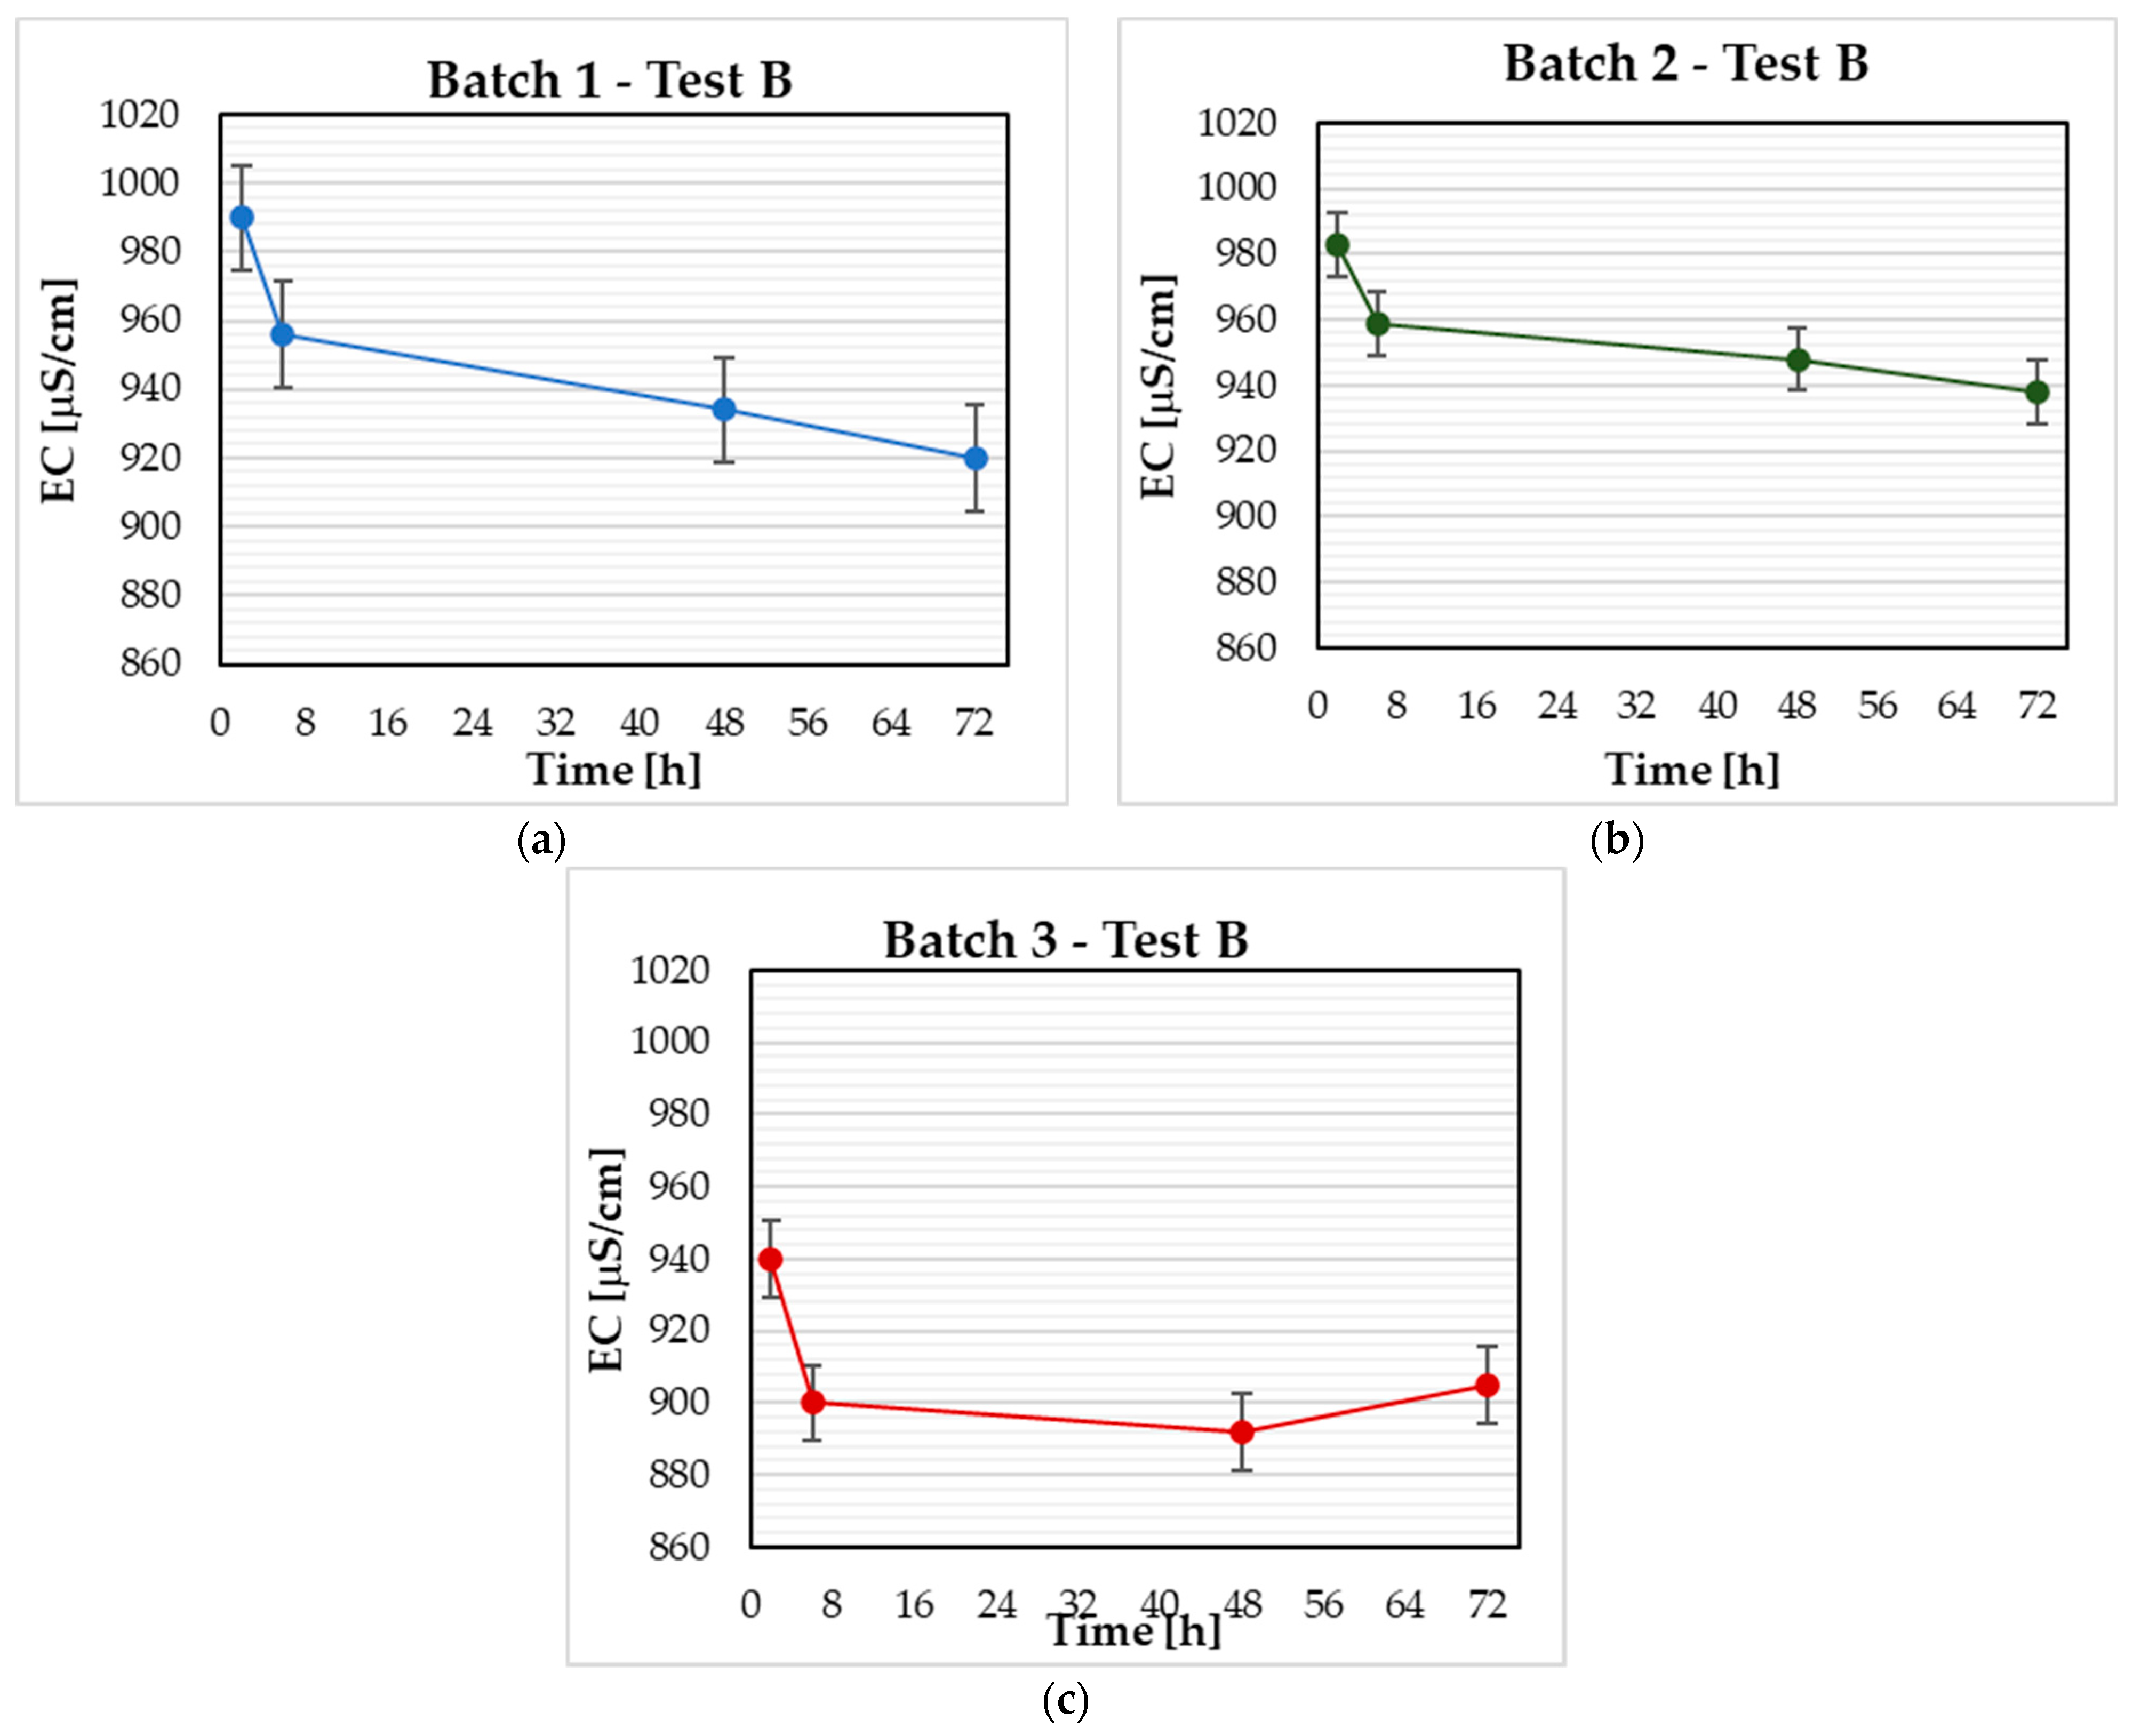
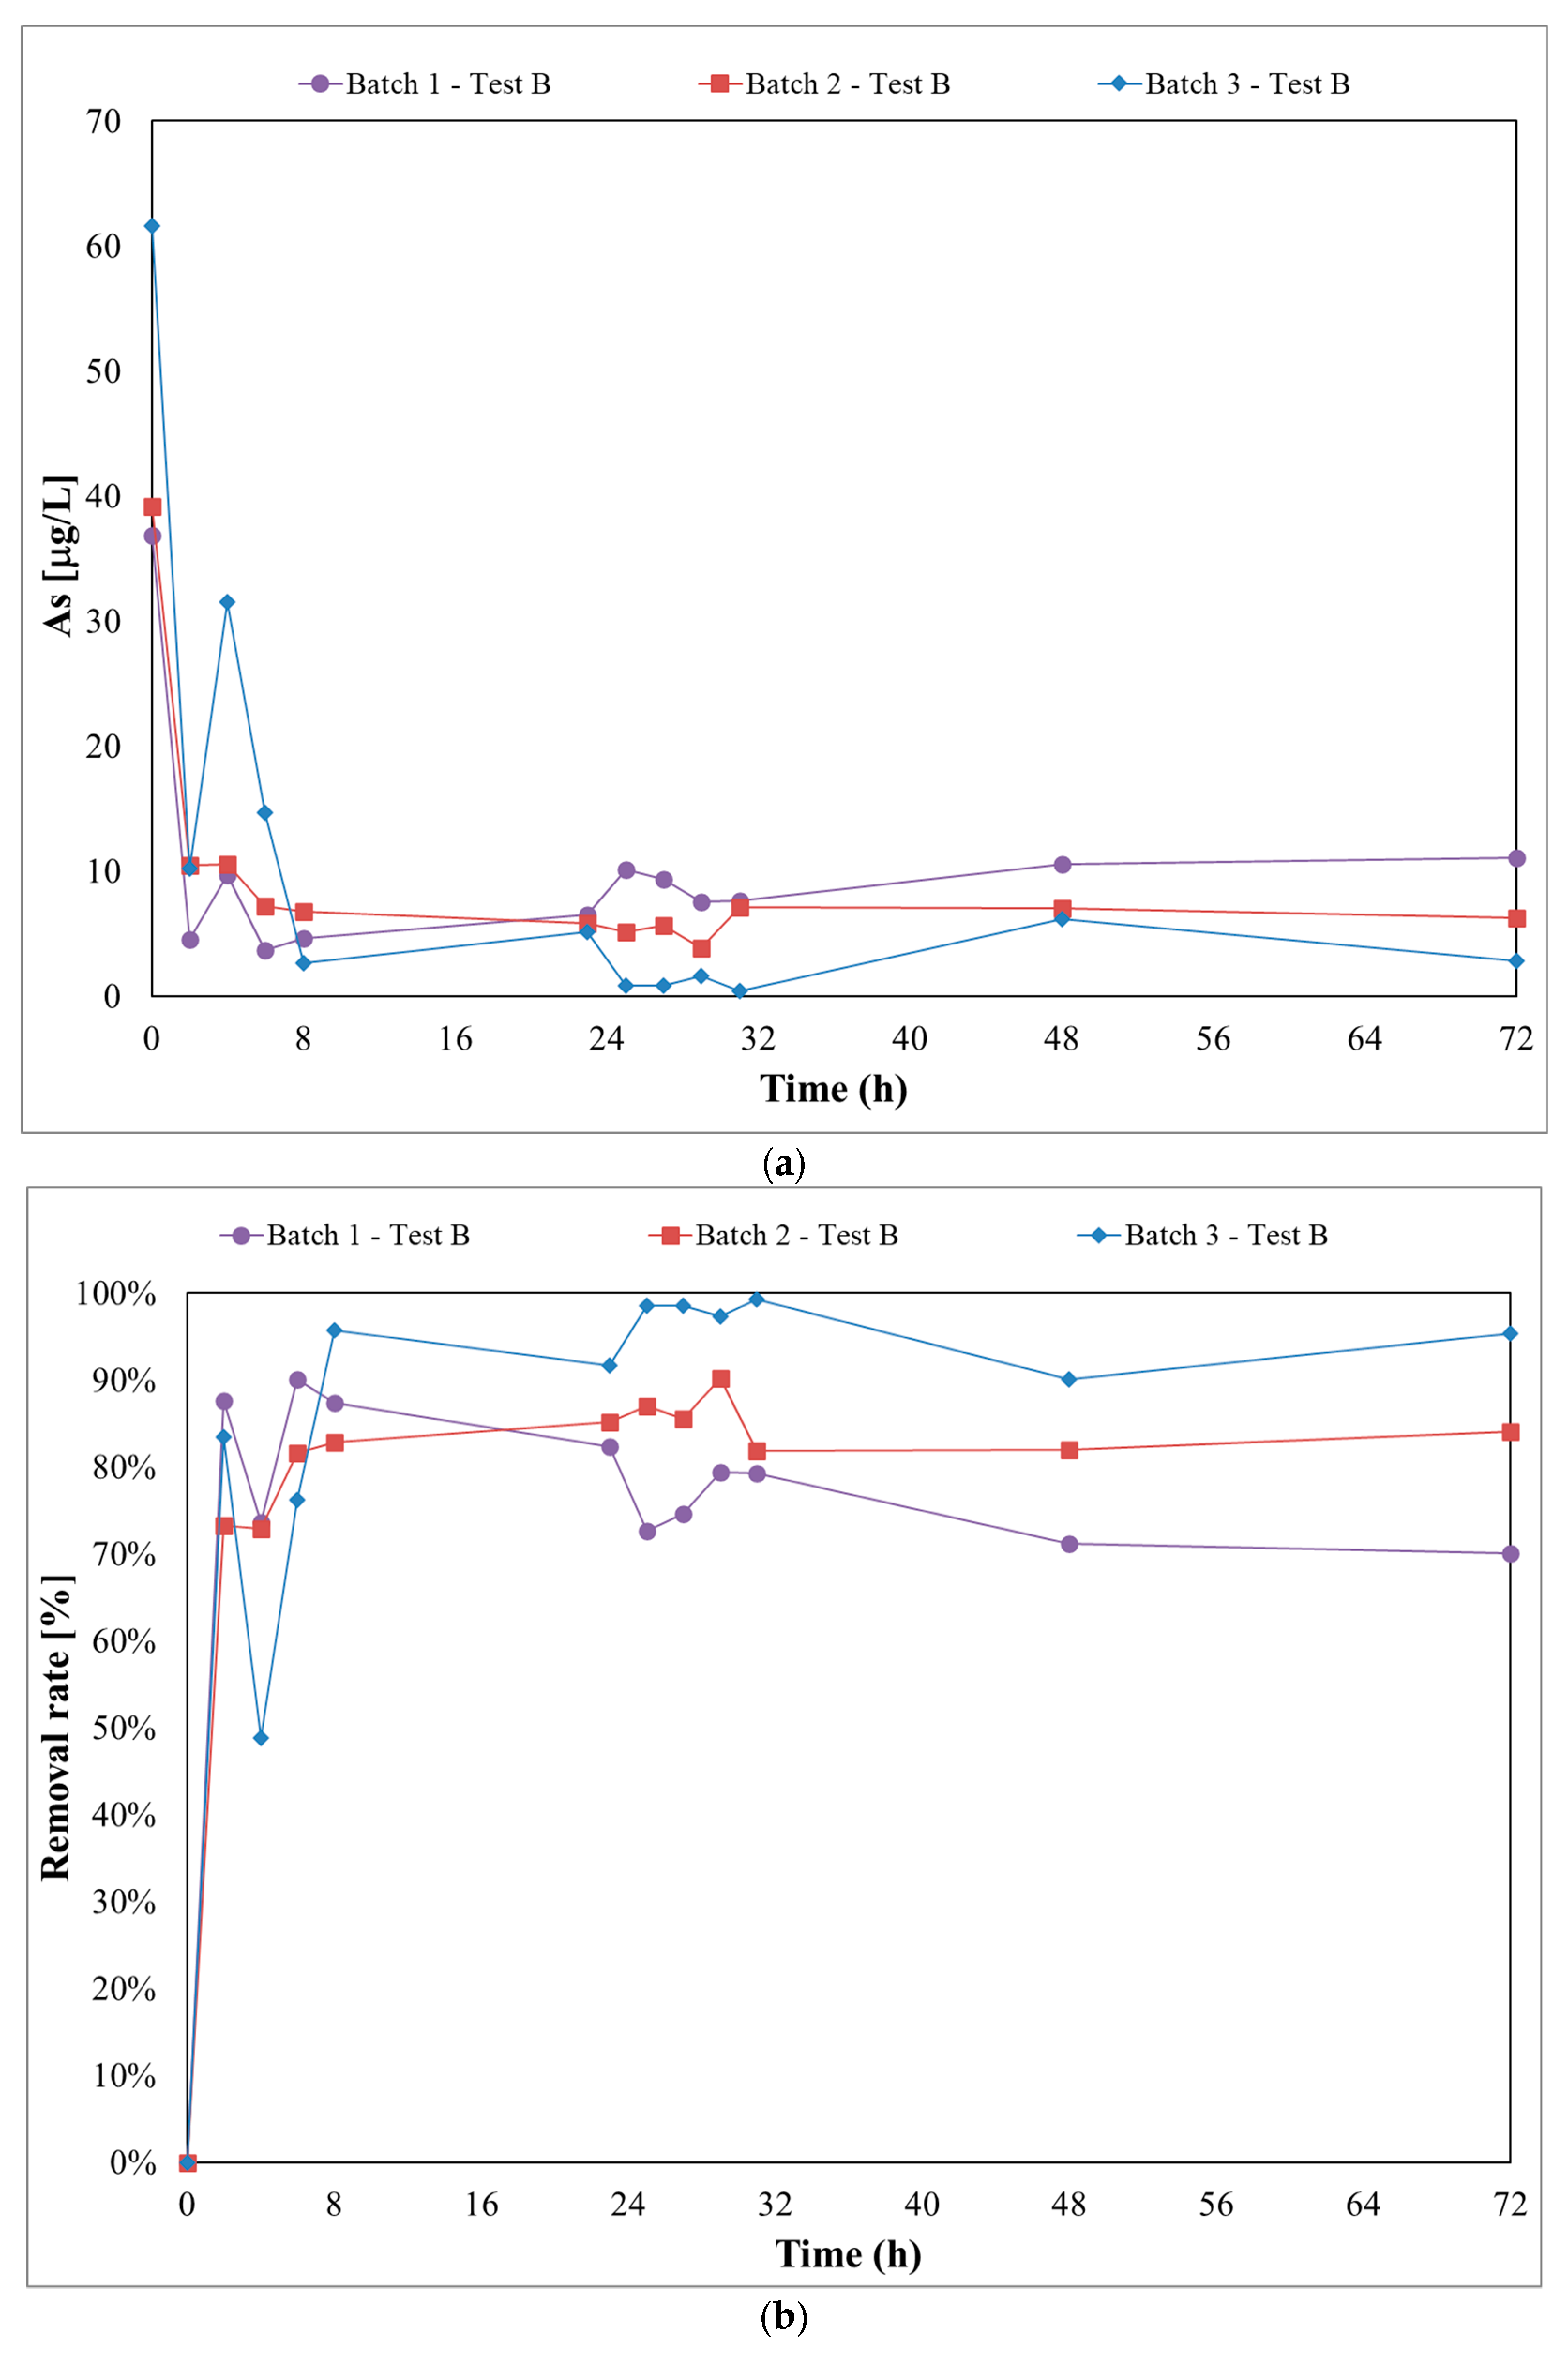
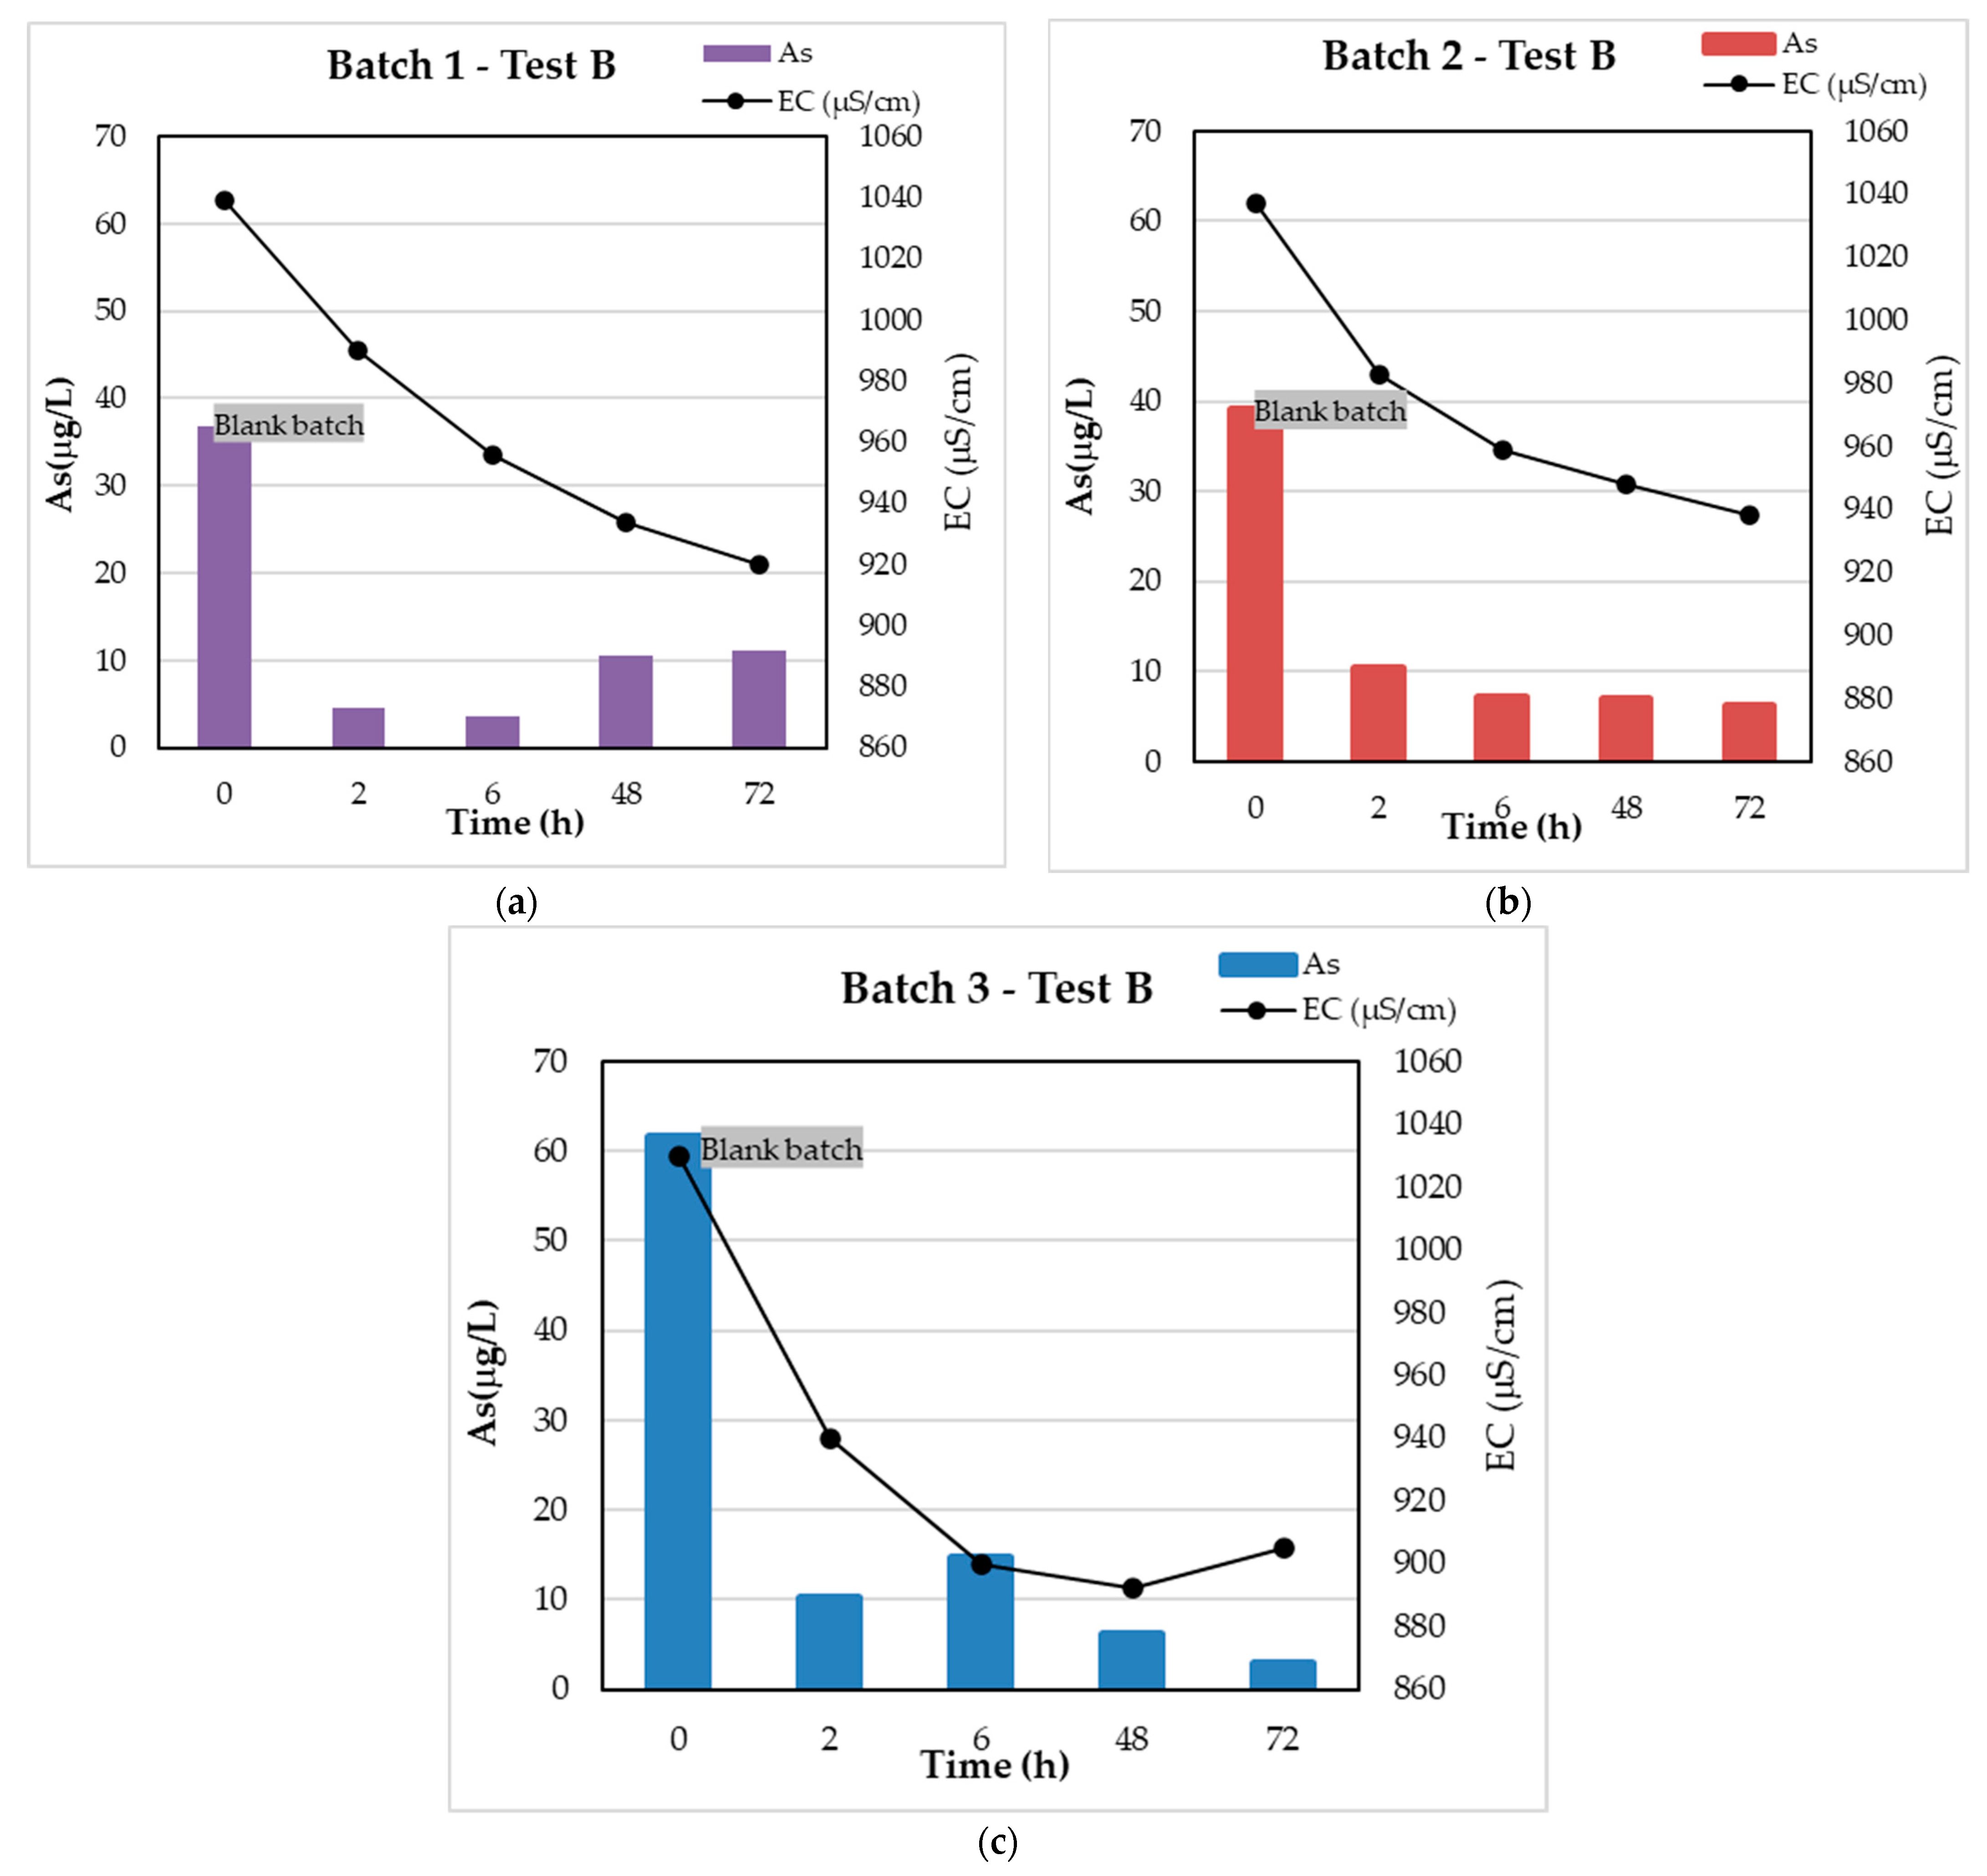
3.2. Test B
4. Conclusions
Author Contributions
Funding
Data Availability Statement
Conflicts of Interest
References
- Martin, J.E.; Herzing, A.A.; Yan, W.; Li, X.Q.; Koel, B.E.; Kiely, C.J.; Zhang, W.X. Determination of the Oxide Layer Thickness in Core-Shell Zerovalent Iron Nanoparticles. Langmuir 2008, 24, 4329–4334. [Google Scholar] [CrossRef] [PubMed]
- Lin, Y.H.; Tseng, H.H.; Wey, M.Y.; Lin, M. Der Characteristics, Morphology, and Stabilization Mechanism of PAA250K-Stabilized Bimetal Nanoparticles. Colloids Surf. A Physicochem. Eng. Asp. 2009, 349, 137–144. [Google Scholar] [CrossRef]
- US EPA. Nanotechnology: Applications for Environmental Remediation; US EPA: Washington, DC, USA, 2014; pp. 1–11.
- Moraci, N.; Calabrò, P.S. Heavy Metals Removal and Hydraulic Performance in Zero-Valent Iron/Pumice Permeable Reactive Barriers. J. Environ. Manag. 2010, 91, 2336–2341. [Google Scholar] [CrossRef] [PubMed]
- Gallo, A.; Bianco, C.; Tosco, T.; Sethi, R. Ferro Zerovalente Nanoscopico per la Bonifica di Acquiferi Contaminari. Geam. Geoing. Ambient. E Min. 2018, 5–16. [Google Scholar]
- Bardos, P.; Merly, C.; Kvapil, P.; Koschitzky, H.P. Status of Nanoremediation and Its Potential for Future Deployment: Risk-Benefit and Benchmarking Appraisals. Remediation 2018, 28, 43–56. [Google Scholar] [CrossRef]
- Tosco, T.; Gastone, F.; Luna, M.; Sethi, R.; Torino, P. Micro E Nanoparticelle di Ferro per la Bonifica di Acquiferi Contaminati: Dal Laboratorio All’ Applicazione in Campo. Ing. dell’Ambiente 2015, 2, 59–68. [Google Scholar]
- Gil-Díaz, M.; Alonso, J.; Rodríguez-Valdés, E.; Gallego, J.R.; Lobo, M.C. Comparing Different Commercial Zero Valent Iron Nanoparticles to Immobilize as and Hg in Brownfield Soil. Sci. Total Environ. 2017, 584–585, 1324–1332. [Google Scholar] [CrossRef]
- Gil-Díaz, M.; Rodríguez-Valdés, E.; Alonso, J.; Baragaño, D.; Gallego, J.R.; Lobo, M.C. Nanoremediation and Long-Term Monitoring of Brownfield Soil Highly Polluted with As and Hg. Sci. Total Environ. 2019, 675, 165–175. [Google Scholar] [CrossRef]
- Zafar, A.M.; Javed, M.A.; Hassan, A.A.; Mohamed, M.M. Groundwater Remediation Using Zero-Valent Iron Nanoparticles (nZVI). Groundw. Sustain. Dev. 2021, 15, 100694. [Google Scholar] [CrossRef]
- Galdames, A.; Ruiz-Rubio, L.; Orueta, M.; Sánchez-Arzalluz, M.; Vilas-Vilela, J.L. Zero-Valent Iron Nanoparticles for Soil and Groundwater Remediation. Int. J. Environ. Res. Public Health 2020, 17, 5817. [Google Scholar] [CrossRef]
- Wang, C.B.; Zhang, W.X. Synthesizing Nanoscale Iron Particles for Rapid and Complete Dechlorination of TCE and PCBs. Environ. Sci. Technol. 1997, 31, 2154–2156. [Google Scholar] [CrossRef]
- Elliott, D.W.; Zhang, W.X. Field Assessment of Nanoscale Bimetallic Particles for Groundwater Treatment. Environ. Sci. Technol. 2001, 35, 4922–4926. [Google Scholar] [CrossRef] [PubMed]
- Jordan, M.; Shetty, N.; Zenker, M.J.; Brownfield, C. Remediation of a Former Dry Cleaner Using Nanoscale Zero Valent Iron. Remediation 2013, 24, 31–48. [Google Scholar] [CrossRef]
- Mueller, N.C.; Braun, J.; Bruns, J.; Černík, M.; Rissing, P.; Rickerby, D.; Nowack, B. Application of Nanoscale Zero Valent Iron (NZVI) for Groundwater Remediation in Europe. Environ. Sci. Pollut. Res. 2012, 19, 550–558. [Google Scholar] [CrossRef] [PubMed] [Green Version]
- Stejskal, V.; Lederer, T.; Kvapil, P.; Slunsky, J.; Skácelová, P. NanoRem Pilot Site-Spolchemie I, Czech Republic.: Nanoscale Zero-Valent Iron Remediation of Chlorinated Hydrocarbons; NanoRem Bulletin: Ústí nad Labem, Czech Republic, 2017; pp. 1–8. [Google Scholar]
- Eglal, M.M.; Ramamurthy, A.S. Nanofer ZVI: Morphology, Particle Characteristics, Kinetics, and Applications. J. Nanomater. 2014, 2014, 29. [Google Scholar] [CrossRef] [Green Version]
- Chekli, L.; Brunetti, G.; Marzouk, E.R.; Maoz-Shen, A.; Smith, E.; Naidu, R.; Shon, H.K.; Lombi, E.; Donner, E. Evaluating the Mobility of Polymer-Stabilised Zero-Valent Iron Nanoparticles and their Potential to Co-Transport Contaminants in Intact Soil Cores. Environ. Pollut. 2016, 216, 636–645. [Google Scholar] [CrossRef]
- Galdames, A.; Mendoza, A.; Orueta, M.; de Soto García, I.S.; Sánchez, M.; Virto, I.; Vilas, J.L. Development of New Remediation Technologies for Contaminated Soils Based on the Application of Zero-Valent Iron Nanoparticles and Bioremediation with Compost. Resour. Technol. 2017, 3, 166–176. [Google Scholar] [CrossRef]
- Pavelková, A.; Stejskal, V.; Pluhař, T.; Nosek, J. Advanced Remediation Using Nanosized Zero-Valent Iron and Electrical Current in Situ—A Comparison with Conventional Remediation Using Nanosized Zero-Valent Iron Alone. J. Environ. Chem. Eng. 2021, 9, 106124. [Google Scholar] [CrossRef]
- O’Carroll, D.; Sleep, B.; Krol, M.; Boparai, H.; Kocur, C. Nanoscale Zero Valent Iron and Bimetallic Particles for Contaminated Site Remediation. Adv. Water Resour. 2013, 51, 104–122. [Google Scholar] [CrossRef]
- Ji, Y. Ions Removal by Iron Nanoparticles: A Study on Solid-Water Interface with Zeta Potential. Colloids Surf. A Physicochem. Eng. Asp. 2014, 444, 1–8. [Google Scholar] [CrossRef]
- Latif, A.; Sheng, D.; Sun, K.; Si, Y.; Azeem, M.; Abbas, A.; Bilal, M. Remediation of Heavy Metals Polluted Environment Using Fe-Based Nanoparticles: Mechanisms, Influencing Factors, and Environmental Implications. Environ. Pollut. 2020, 264, 114728. [Google Scholar] [CrossRef] [PubMed]
- Li, X.Q.; Zhang, W.X. Sequestration of Metal Cations with Zerovalent Iron Nanoparticles—A Study with High Resolution X-Ray Photoelectron Spectroscopy (HR-XPS). J. Phys. Chem. C 2007, 111, 6939–6946. [Google Scholar] [CrossRef]
- Singh, R.; Misra, V.; Singh, R.P. Removal of Cr(VI) by Nanoscale Zero-Valent Iron (nZVI) From Soil Contaminated with Tannery Wastes. Bull. Environ. Contam. Toxicol. 2012, 88, 210–214. [Google Scholar] [CrossRef] [PubMed]
- Li, X.Q.; Elliott, D.W.; Zhang, W.X. Zero-Valent Iron Nanoparticles for Abatement of Environmental Pollutants: Materials and Engineering Aspects. Crit. Rev. Solid State Mater. Sci. 2006, 31, 111–122. [Google Scholar] [CrossRef]
- Mukherjee, R.; Kumar, R.; Sinha, A.; Lama, Y.; Saha, A.K. A Review on Synthesis, Characterization, and Applications of Nano zero Valent Iron (nZVI) for Environmental Remediation. Crit. Rev. Environ. Sci. Technol. 2016, 46, 443–466. [Google Scholar] [CrossRef]
- Sun, J.; Chillrud, S.N.; Mailloux, B.J.; Bostick, B.C. In Situ Magnetite Formation and Long-Term Arsenic Immobilization under Advective Flow Conditions. Environ. Sci. Technol. 2016, 50, 10162–10171. [Google Scholar] [CrossRef] [Green Version]
- Ribas, D.; Černík, M.; Benito, J.A.; Filip, J.; Marti, V. Activation Process of Air Stable Nanoscale Zero-Valent Iron Particles. Chem. Eng. J. 2017, 320, 290–299. [Google Scholar] [CrossRef] [Green Version]
- Visentin, C.; da Silva Trentin, A.W.; Braun, A.B.; Thomé, A. Nano Scale Zero Valent Iron Production Methods Applied to Contaminated Sites Remediation: An Overview of Production and Environmental Aspects. J. Hazard. Mater. 2021, 410. [Google Scholar] [CrossRef]
- Zhang, W.X. Nanoscale Iron Particles for Environmental Remediation: An Overview. J. Nanopart. Res. 2003, 5, 323–332. [Google Scholar] [CrossRef]
- Habuda-Stanić, M.; Nujić, M. Arsenic Removal by Nanoparticles: A Review. Environ. Sci. Pollut. Res. 2015, 22, 8094–8123. [Google Scholar] [CrossRef]
- Rashid, U.S.; Saini-Eidukat, B.; Bezbaruah, A.N. Modeling Arsenic Removal by Nanoscale Zero-Valent Iron. Environ. Monit. Assess. 2020, 192, 110. [Google Scholar] [CrossRef] [PubMed]
- Singh, P.; Pal, P.; Mondal, P.; Saravanan, G.; Nagababu, P.; Majumdar, S.; Labhsetwar, N.; Bhowmick, S. Kinetics and Mechanism of Arsenic Removal Using Sulfide-Modified Nanoscale Zerovalent Iron. Chem. Eng. J. 2021, 412, 128667. [Google Scholar] [CrossRef]
- Ahmed, M.F.; Abbas, M.A.; Mahmood, A.; Ahmad, N.M.; Rasheed, H.; Qadir, M.A.; Khan, A.U.; Qiblawey, H.; Zhu, S.; Sadiq, R.; et al. Hybrid Beads of Zero Valent Iron Oxide Nanoparticles and Chitosan for Removal of Arsenic in Contaminated Water. Water 2021, 13, 2876. [Google Scholar] [CrossRef]
- Yadav, R.; Sharma, A.K.; Babu, J.N. Sorptive Removal of Arsenite [As(III)] and Arsenate [As(V)] by Fuller’s Earth Immobilized Nanoscale Zero-Valent Iron Nanoparticles (F-nZVI): Effect of Fe0 Loading on Adsorption Activity. J. Environ. Chem. Eng. 2016, 4, 681–694. [Google Scholar] [CrossRef]
- Liang, Q.; Zhao, D. Immobilization of Arsenate in a Sandy Loam Soil Using Starch-Stabilized Magnetite Nanoparticles. J. Hazard. Mater. 2014, 271, 16–23. [Google Scholar] [CrossRef]
- Gil-Díaz, M.; Alonso, J.; Rodríguez-Valdés, E.; Pinilla, P.; Lobo, M.C. Reducing the Mobility of Arsenic in Brownfield Soil Using Stabilised Zero-Valent Iron Nanoparticles. J. Environ. Sci. Health Part. A Toxic/Hazard. Subst. Environ. Eng. 2014, 49, 1361–1369. [Google Scholar] [CrossRef] [PubMed]
- Baragaño, D.; Alonso, J.; Gallego, J.R.; Lobo, M.C.; Gil-Díaz, M. Zero Valent Iron and Goethite Nanoparticles as New Promising Remediation Techniques for As-Polluted Soils. Chemosphere 2020, 238, 124624. [Google Scholar] [CrossRef] [PubMed]
- Yan, W.; Lien, H.L.; Koel, B.E.; Zhang, W.X. Iron Nanoparticles for Environmental Clean-up: Recent Developments and Future Outlook. Environ. Sci. Process. Impacts 2013, 15, 63–77. [Google Scholar] [CrossRef]
- Ramos, M.A.V.; Weile, Y.; Li, X.Q.; Koel, B.E.; Zhang, W.X. Simultaneous Oxidation and Reduction of Arsenic by Zero-Valent Iron Nanoparticles: Understanding the Significance of the Core-Shell Structure. J. Phys. Chem. C 2009, 113, 14591–14594. [Google Scholar] [CrossRef]
- Kanel, S.R.; Nepal, D.; Manning, B.; Choi, H. Transport of Surface-Modified Iron Nanoparticle in Porous Media and Application to Arsenic(III) Remediation. J. Nanopart. Res. 2007, 9, 725–735. [Google Scholar] [CrossRef]
- Jegadeesan, G.; Mondal, K.; Lalvani, S.B. Arsenate Remediation Using Nanosized Modified Zerovalent Iron Particles. Environ. Prog. 2005, 24, 289–296. [Google Scholar] [CrossRef]
- Yan, W.; Ramos, M.A.V.; Koel, B.E.; Zhang, W.X. Multi-Tiered Distributions of Arsenic in Iron Nanoparticles: Observation of Dual Redox Functionality Enabled by a Core-Shell Structure. Chem. Commun. 2010, 46, 6995–6997. [Google Scholar] [CrossRef]
- Biterna, M.; Arditsoglou, A.; Tsikouras, E.; Voutsa, D. Arsenate Removal by Zero Valent Iron: Batch and Column Tests. J. Hazard. Mater. 2007, 149, 548–552. [Google Scholar] [CrossRef] [PubMed]
- Bang, S.; Korfiatis, G.P.; Meng, X. Removal of Arsenic from Water by Zero-Valent Iron. J. Hazard. Mater. 2005, 121, 61–67. [Google Scholar] [CrossRef] [PubMed]
- Sun, H.; Wang, L.; Zhang, R.; Sui, J.; Xu, G. Treatment of Groundwater Polluted by Arsenic Compounds by Zero Valent Iron. J. Hazard. Mater. 2006, 129, 297–303. [Google Scholar] [CrossRef]
- Wu, Z.; Su, X.; Lin, Z.; Owens, G.; Chen, Z. Mechanism of As(V) Removal by Green Synthesized Iron Nanoparticles. J. Hazard. Mater. 2019, 379. [Google Scholar] [CrossRef]
- Ainiwaer, M.; Zeng, X.; Yin, X.; Wen, J.; Su, S.; Wang, Y.; Zhang, Y.; Zhang, T.; Zhang, N. Thermodynamics, Kinetics, and Mechanisms of the Co-Removal of Arsenate and Arsenite by Sepiolite-Supported Nanoscale Zero-Valent Iron in Aqueous Solution. Int. J. Environ. Res. Public Health 2022, 19, 11401. [Google Scholar] [CrossRef]
- Zhu, H.; Shi, M.; Zhang, X.; Liu, B.; Yao, D. Adsorption Kinetics of Arsenic (V) on Nanoscale Zero-Valent Iron Supported by Activated Carbon. Nanomaterials 2020, 10, 1791. [Google Scholar] [CrossRef]
- Wu, C.; Tu, J.; Liu, W.; Zhang, J.; Chu, S.; Lu, G.; Lin, Z.; Dang, Z. The Double Influence Mechanism of pH on Arsenic Removal by Nano Zero Valent Iron: Electrostatic Interactions and the Corrosion of Fe0. Environ. Sci. Nano 2017, 4, 1544–1552. [Google Scholar] [CrossRef]
- Bang, S.; Johnson, M.D.; Korfiatis, G.P.; Meng, X. Chemical Reactions Between Arsenic and Zero-Valent Iron in Water. Water Res. 2005, 39, 763–770. [Google Scholar] [CrossRef]
- Andrei, F.; Sappa, G.; Boni, M.R.; Mancini, G.; Viotti, P. Mobility of nZVI in a Reconstructed Porous Media Monitored by an Image Analysis Procedure. Water 2021, 13, 2797. [Google Scholar] [CrossRef]


| Nanofer25S | |
|---|---|
| Composition mixture (weight % content) | 77% Water 14–18% Iron (Fe) 3% Polyacrylic acid (PAA). 2–6% Magnetite (Fe3O4) 0–1% Carbon (C) |
| Granulometry | d50 < 50 nm |
| pH | 11–12 |
| Specific surface | >25 m2/g |
| Specific gravity | 1.15–1.25 g/cm3 (20 °C) |
| Test A | ||||
|---|---|---|---|---|
| Batch 1 | Batch 2 | Batch 3 | ||
| Volume batch (500 mL) | H2O volume | 498.4 mL | 498.4 mL | 498.4 mL |
| HAsNa2O4 ∗ 7H2O volume | 1.6 mL | 1.6 mL | 1.6 mL | |
| As concentration | 10 mg/L | 10 mg/L | 10 mg/L | |
| nZVI mass | 0.05 g | 0.25 g | 0.5 g | |
| nZVI volume | 0.2 mL | 1 mL | 2 mL | |
| [37] | 10 (0.1% m/m) | 50 (0.5% m/m) | 100 (1% m/m) | |
| 0.1 g/L | 0.5 g/L | 1 g/L | ||
| Test A | ||
|---|---|---|
| Electrical Conductivity (μS/cm) | ||
| Blank Sample | Start of experiment | 632 |
| End of experiment | 613 | |
| Test B | ||
|---|---|---|
| Batch 1 | Batch 2 | Batch 3 |
| 50 g of soil sediment | 50 g of soil sediment | 50 g of soil sediment |
| 500 mL of water | 500 mL of water | 500 mL of water |
| [37] | [37] | [37] |
| (0.1% m/m) | (0.8% m/m) | (1.4% m/m) |
| 0.2 mL of nZVI | 1.6 mL of nZVI | 2.8 mL of nZVI |
| 0.05 g of nZVI | 0.4 g of nZVI | 0.7 g of nZVI |
| Test B | |
|---|---|
| Blank Sample | Electrical Conductivity (μS/cm) |
| Batch 1 | 1039 |
| Batch 2 | 1037 |
| Batch 3 | 1030 |

 low increase/decrease,
 moderate increase/decrease,
 high increase/decrease.
low increase/decrease, moderate increase/decrease, high increase/decrease.
high increase/decrease.
low increase/decrease, moderate increase/decrease, high increase/decrease.| Batch 1 | Batch 2 | Batch 3 | |
|---|---|---|---|
| mnZVI [g] | 0.05 | 0.25 | 0.5 |
| cAs0 [mg ∗ L−1] | 10 | 10 | 10 |
| cAse [mg ∗ L−1] | 4.90 | 1.3 | 0.460 |
| cAs0–cAse [mg ∗ L−1] | 5.10 | 8.67 | 9.54 |
| (cAs0–cAse) ∗ V [mg] | 2.55 | 4.33 | 4.77 |
| qe [mg ∗ g−1] | 50.99 | 17.32 | 9.54 |
low increase/decrease, moderate increase/decrease, high increase/decrease.
low increase/decrease, moderate increase/decrease, high increase/decrease.| Batch 1 | Batch 2 | Batch 3 | |
|---|---|---|---|
| mnZVI [g] | 0.05 | 0.4 | 0.7 |
| cAs0 [mg ∗ L−1] | 0.036 | 0.039 | 0.061 |
| cAse [mg ∗ L−1] | 0.0079 | 0.0061 | 0.0040 |
| cAs0–cAse [mg ∗ L−1] | 0.029 | 0.033 | 0.058 |
| (cAs0–cAse) ∗ V [mg] | 0.0144 | 0.016 | 0.028 |
| qe [mg ∗ g−1] | 0.29 | 0.0413 | 0.0412 |
Publisher’s Note: MDPI stays neutral with regard to jurisdictional claims in published maps and institutional affiliations. |
© 2022 by the authors. Licensee MDPI, Basel, Switzerland. This article is an open access article distributed under the terms and conditions of the Creative Commons Attribution (CC BY) license (https://creativecommons.org/licenses/by/4.0/).
Share and Cite
Sappa, G.; Barbieri, M.; Viotti, P.; Tatti, F.; Andrei, F. Assessment of Zerovalent Iron Nanoparticle (nZVI) Efficiency for Remediation of Arsenic-Contaminated Groundwater: Two Laboratory Experiments. Water 2022, 14, 3261. https://doi.org/10.3390/w14203261
Sappa G, Barbieri M, Viotti P, Tatti F, Andrei F. Assessment of Zerovalent Iron Nanoparticle (nZVI) Efficiency for Remediation of Arsenic-Contaminated Groundwater: Two Laboratory Experiments. Water. 2022; 14(20):3261. https://doi.org/10.3390/w14203261
Chicago/Turabian StyleSappa, Giuseppe, Maurizio Barbieri, Paolo Viotti, Fabio Tatti, and Francesca Andrei. 2022. "Assessment of Zerovalent Iron Nanoparticle (nZVI) Efficiency for Remediation of Arsenic-Contaminated Groundwater: Two Laboratory Experiments" Water 14, no. 20: 3261. https://doi.org/10.3390/w14203261