
A Review of Flood Risk in China during 1950–2019: Urbanization, Socioeconomic Impact Trends and Flood Risk Management

1
State Key Laboratory of Earth Surface Processes and Resource Ecology, Beijing Normal University, Beijing 100875, China
2
School of National Safety and Emergency Management, Beijing Normal University, Beijing 100875, China
3
Academy of Plateau Science and Sustainability, Qinghai Normal University, Xining 810008, China
4
Defense Center for Meteorological Disasters of Hebei Province, Shijiazhuang 050021, China
*
Author to whom correspondence should be addressed.
Water 2022, 14(20), 3246; https://doi.org/10.3390/w14203246
Submission received: 18 August 2022
/
Revised: 1 October 2022
/
Accepted: 11 October 2022
/
Published: 14 October 2022
(This article belongs to the Special Issue Urbanization, Climate Change and Flood Risk Management)
Abstract
:China is one of the countries that are most severely affected by floods worldwide. Due to the geographical and climatic environment, floods frequently occur in China. Rapid socioeconomic growth and urban sprawl in the past decades have significantly changed both exposure and vulnerability dimensions of flood risk in China. In response to high risks of flood, the Chinese government has adopted a series of effective measures, such as the “Spongy City” Program and building many large dams and reservoirs, and some measures have achieved significant results. However, there is still a lack of studies with an integrated view on analyzing the causes, socioeconomic impact trends, and disaster risk reduction (DRR) measures of flood risk in China in the past decades. Accordingly, this paper aims to fill in the gap and provides some new insights into China’s contributions in DRR over the period of 1950–2019. Our results show that annual flood-induced fatalities and socioeconomic vulnerability to floods have significantly decreased in China, owing to a range of structural and non-structural measures. Nevertheless, China still faces the complex coupling effects of climate change and urbanization, and thus threats from extreme floods. In addition, China needs to further improve its flood risk management system.
1. Introduction
Flooding is one of the most frequent and most devastating natural disasters worldwide. From 1980 to 2016, global economic losses and fatalities caused by floods respectively accounted for 23% and 14% of that due to all natural disasters [1]. Global flooding caused a total of 56 billion US$ in economic losses in 2016 [2]. According to the global country-level flood risk maps [3], China ranks second in the world for both the expected annual mortality risk of floods and the expected annual economic loss risk of floods. Understanding natural disaster risks, including flood risks, is a priority for disaster risk reduction (DRR), and insights into flood risk in China, its temporal variation, and countermeasures can provide implications for other countries in flood risk management.
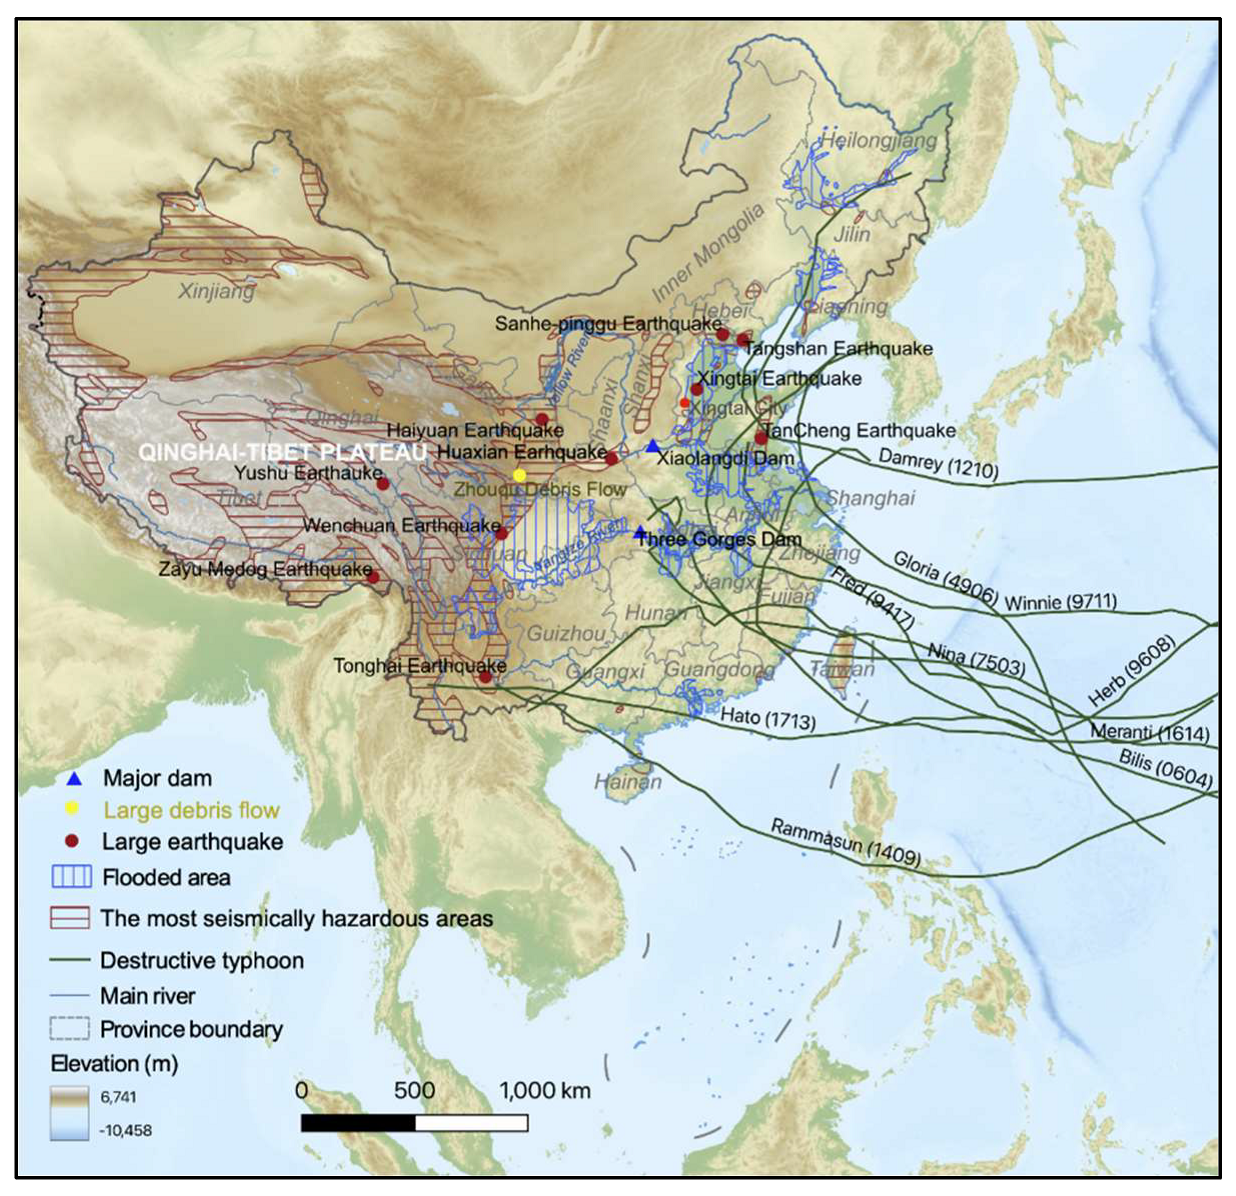
Generally, the occurrence and risk of flood are closely associated with the disaster-formation environment [4]. From the perspective of geographic location (Figure 1), China lies on the west coast of the Pacific Ocean, which is prone to tropical cyclones and sea level rise. On average, seven typhoons landed in China every year, and sea level rose at a rate of 3.4 mm/year, from 1980 to 2019 [5]. With regard to geomorphology, within a 9.6 million square kilometer land area, China’s terrain is high in the west and low in the east, in the shape of three steps. Eastern China is on the third ladder and is composed of a vast alluvial plain and foothills, which are prone to river floods, as many large rivers (like the Pearl, Yangtze and Yellow Rivers) flow through the area [6].
Meanwhile, China’s climate, mainly characterized by the monsoon influence, has a large impact on the occurrence of floods. In summer, influenced by a monsoon climate with abundant precipitation, the rainfall of China mainly concentrates in coastal southeastern China and the mid-lower reaches of the Yangtze River Basin. Precipitation features a distinct three-stage evolution, ranging from early summer (from 1 May to 14 June) to Meiyu season (from 15 June to 15 July), to late summer (from 16 July to 31 August) [7]. In winter, the precipitation is unevenly distributed in time and space due to dry and cold air from the middle and high latitudes of the northern hemisphere. To some extent, the spatiotemporal distribution of precipitation in China is uneven, and floods frequently occur in some parts of China [8,9,10].
![Water 14 03246 g001]()
Figure 1.
China’s geographical location and topography as well as the spatial distribution of major natural disaster events in China from 1950 to 2020 (historical flooded area data is from ref. [11]).
Figure 1.
China’s geographical location and topography as well as the spatial distribution of major natural disaster events in China from 1950 to 2020 (historical flooded area data is from ref. [11]).

Furthermore, rapid socioeconomic growth and urban sprawl have significantly changed both the exposure and vulnerability dimensions of flood risk in China [12,13,14]. From 1978 to 2019, China’s GDP and population increased 39-fold and nearly 50%, respectively. China’s GDP per capita increased from 156.4 US$ in 1978 to 10,216.60 US$ in 2019. From the perspective of spatial distribution, approximately 94.4% of China’s population live in the area east of Hu Line (about 42.9% of China’s land area) [15]. On the other hand, land use/land cover (LULC) changes brought by mass urbanization have caused many people and assets to be exposed to flood risks [16,17,18].
In response to high risks of flood, the Chinese government has adopted a series of measures to reduce risks, and some measures have achieved significant results [19]. For instance, many large dams and reservoirs were built in China in the early 21st century, such as the Three Gorges Dam and the Gezhouba Dam [20,21], serving as the main contributors of flood prevention and control in the early stages of Chinese disaster prevention and mitigation. More recently, green infrastructure (e.g., permeable pavement and green roofs) has been used in China to reduce flood risks [22,23,24].
However, there is still a lack of studies with an integrated approach to analyzing the causes, socioeconomic impact trends, and DRR measures of flood risk in China in the past decades. Accordingly, this paper aims to fill in the gap and provides some new insights into China’s contributions in DRR over the period of 1950–2019. The remainder of this paper is organized as follows: Section 2 describes the main data used in this paper and the methods of analyzing the temporal characteristics of flood damage; Section 3 shows the temporal changes in flood-induced socioeconomic damage, its relation to rising intense precipitation and urbanization, and flood risk management measures in China in the past decades; Section 4 discusses the relationship between flood risk and economic development, the emerging challenges for reducing flood risks in China, and some views on Chinese flood risk management from a global perspective; and Section 5 summarizes the conclusions.
2. Materials and Methods
2.1. Data Sources
This study used direct damage records of floods to analyze the temporal characteristics of flood damage. In this paper, direct damage includes human fatalities and direct economic losses (DELs) of tangible assets [14,25] and flood-covered areas and flood-affected areas of crops. These flood damage data were collected from Bulletin on China Flood and Drought Disaster Prevention (http://www.mwr.gov.cn/sj/, accessed on 20 December 2021). Furthermore, information about China’s policies or measures of flood risk management were retrieved from published statistical bulletins of the government and related administrative departments as well as relevant references in the last 20 years.
2.2. Loss Adjustment and Vulnerability Calculation
To clearly observe temporal trends, original reported nominal DELs were adjusted to the 2019 price level according to the consumer price index (CPI) and were further converted to US dollars (US$) using the exchange rates between China Yuan and US$ in 2019 (i.e., 1 US$ = 6.8985 CNY).
In this paper, socioeconomic vulnerability is defined as the mortality rate and direct economic loss rate [14], which can be computed by the ratio of the reported fatalities to the exposed population (i.e., total population of China) and the percentage of the reported DELs to the exposed GDP (i.e., China’s nominal GDP).
2.3. Trend Analysis
The Mann-Kendall trend test was utilized to determine the existence or not of a statistically significant upward or downward trend for annual direct damage and flood-related investment. For testing the significance of Kendall’s Tau, the X variable is year and the Y variable denotes annual fatalities, deaths per million people, DELs, DELs as a percent of GDP, flood-covered areas of crops and flood-affected areas as a percent of flood-covered areas, as well as the investment in flood risk management. Tau values are considered to be statistically significant at p ≤ 0.01.
3. Results
3.1. Temporal Change in Flood-Induced Socioeconomic Damage
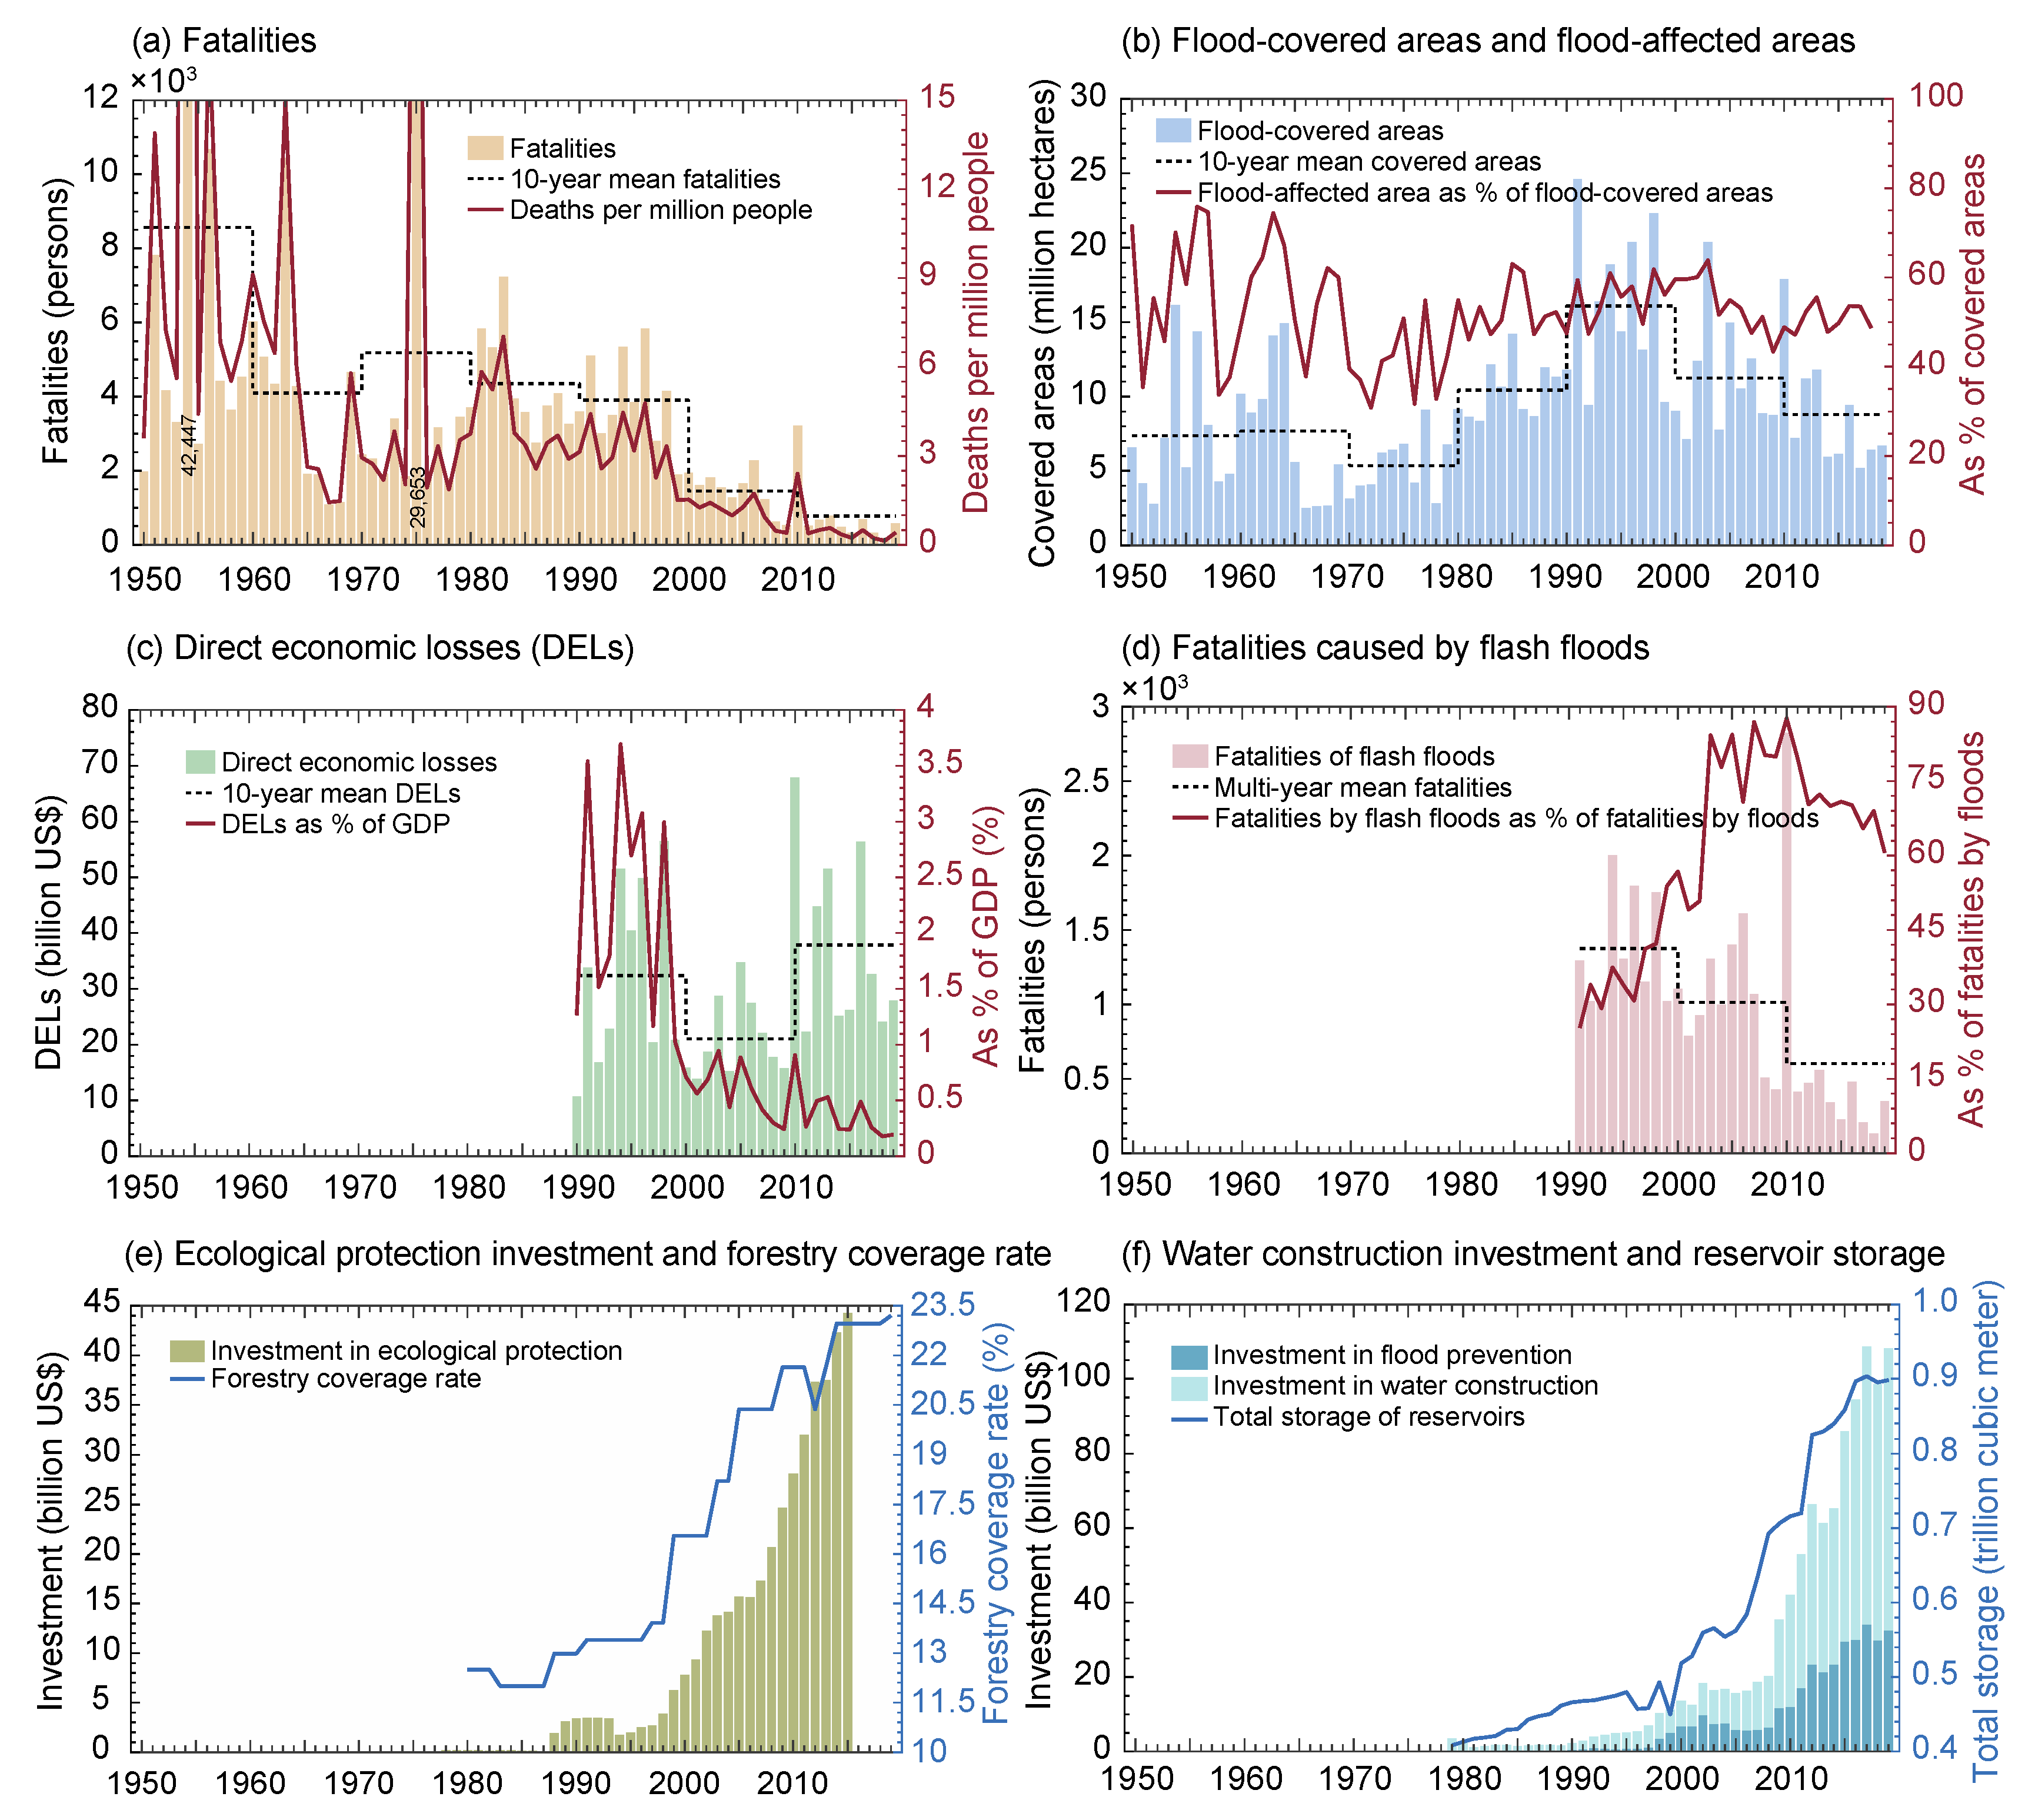
The change trend of flood damage is promising, as shown in Figure 2. In terms of human deaths (Figure 2a), both annual fatalities and the fatality rate (i.e., deaths per million people) declined significantly (p < 0.001) from 1950 to 2019. More specifically, the annual average death toll decreased from 8571 in the 1950s to 776 in the 2010s, and the annual fatality rate declined from 14.14 to 0.57 during the same period. Despite a large number of deaths due to floods, large floods were the top contributors in the first few decades. From 1950 to 1999, total deaths from floods reached 261,018 persons, and the top five catastrophe years were 1954 (42,447 deaths), 1975 (29,653 deaths), 1956 (10,676 deaths), 1963 (10,441 deaths) and 1951 (7819 deaths). In the 21st century, over half of annual fatalities were caused by flash floods, despite the fact that deaths have significantly decreased in recent years (Figure 2d). Meanwhile, the focus of flood risk management in China has shifted from large floods to flash floods caused by small and medium rivers.
Although there was an upward trend (p < 0.005) for cropland area covered by floods from 1950 to 2019 (Figure 2b), it has declined significantly (p < 0.001), and the percentage of flood-affected area also declined (p < 0.05), since 1990. The annual flood-covered areas were highest in 1991 (24.6 million hectares) and 1998 (22.29 million hectares), followed by the years 1996 (20.39 million hectares), 2003 (20.37 million hectares) and 2010 (17.87 million hectares).
Figure 2c depicts great inter-annual changes in DELs from flood and a significant downtrend in the loss rate (DELs as percent of China’s GDP) during 1990–2019. Numerically, there was an ultra-high value of DELs in 2010, more than 67.8 billion US$, followed by 56.5 billion US$ in 1998, 56.4 billion US$ in 2016, and approximately 51.5 billion US$ in the years 2013 and 1994. The total DELs from flood during the recent 30 years were very high, nearly 913.2 billion US$, with an average annual DEL of 30.4 billion US$. Nevertheless, 10-year mean annual DELs experienced a significant decrease (i.e., more than a one-third decrease) from the 1990s to 2000s, and the annual loss rate also declined remarkably (p < 0.001), from 2.3% in 1990s to 0.4% in 2010s.
From the long time-series, flood damage is closely associated with flood hazard intensity. During 1950–2019, there were four large floods, with a death toll in excess of 10,000 people each. Five large floods with annual DELs larger than 50 billion US$ (in 2019 values) occurred in 1990–2019. Notably, three extraordinarily heavy floods occurred on the Yangtze River and its tributaries in 1954, 1998 and 2010, leading to numerous deaths and substantial economic and crop losses. According to Kundzewicz et al. [27], the Yangtze flood in 1954, regarded as the most disastrous flood disaster in modern Chinese history, killed over 30,000 people and inundated 3.17 million hectares of land. The 1998 flood on the Yangtze and Songhua Rivers caused 31 billion US$ (with 1998 price level) in DELs, and it was estimated that about 5500 people died as a result of the 1998 flood, 21 million people became homeless, and over 23 million hectares of cropland were affected. In 2010, disastrous floods across China occurred and lasted from May until late October, with large areal coverage. Thirty provinces (municipalities and autonomous regions) in China were affected by the 2010 flood. In addition, the water level at many hydrometric stations along the Yangtze River was above warning levels [28], and this flood season resulted in 3222 deaths and 67.8 billion US$ in DELs, and making it the costliest year in the last 30 years (Figure 2c).
3.2. Increasing Intense Precipitation and Increasing Proportion of Deaths Due to Flash Floods
With global warming, the annual average temperature in China increased by 0.24 °C every 10 years from 1951 to 2019, extreme heavy rainfall events presented an increasing trend during 1961–2019, the annual cumulative rainstorm (daily rainfall ≥ 50 mm) days increased with an average growth rate of 3.8% every 10 years, and the precipitation in the Qinghai-Tibet area exhibited a significant increasing trend, with an average increase of 10 mm every 10 years [5].
Although the flood-induced death toll shows a significant decreasing trend (Figure 2a), the proportion of deaths due to flash floods have remained high and have risen to 60~88% since 2003 (Figure 2d). The average annual death toll due to flash floods decreased from 1374 in the 1990s to 807 during 2000–2019, and the average annual proportion of total flood deaths reached 71.8% in the last two decades. Extraordinarily, the Zhouqu debris flow triggered by a rainstorm in August 2010 killed 1501 people, left 264 people missing and destroyed approximately 5500 houses. A 77.3 mm/h record-breaking rainfall was the significant triggering factor in this disaster event [29,30,31,32]. Similarly, the 2012 flash flood event occurring on 21 July in Beijing claimed 79 lives and caused approximate 1.86 billion US$ in DELs [33].
Flash floods are still the main cause of death in flood-related disasters [34]. Moreover, He et al. [32] found that the most extreme flash floods originate from small catchments (e.g., the Shalan River in Heilongjiang Province) over complex terrains, amounting to 782 documented flash flood events in China between 2011 and 2015. Medium-size flash floods (i.e., death toll between 3 and 10) are the most common and widespread, while extra-large size flash floods (i.e., over 30 fatalities) cause the most fatalities. To a large extent, local short-duration heavy rainfall is the main cause of flash flooding [27].
3.3. Negative Impacts of Urbanization on Flood Risk
China has experienced rapid urban expansion due to population growth and rural-to-urban migration [35], and the country’s urbanization level (as measured by the percentage of the population living in urban areas) increased from 18.0% in 1978 to 60.6% in 2019 [36]. Correspondingly, a wide range of negative impacts on flood risk have been generated by increased urbanization in China, as listed in Table 1.
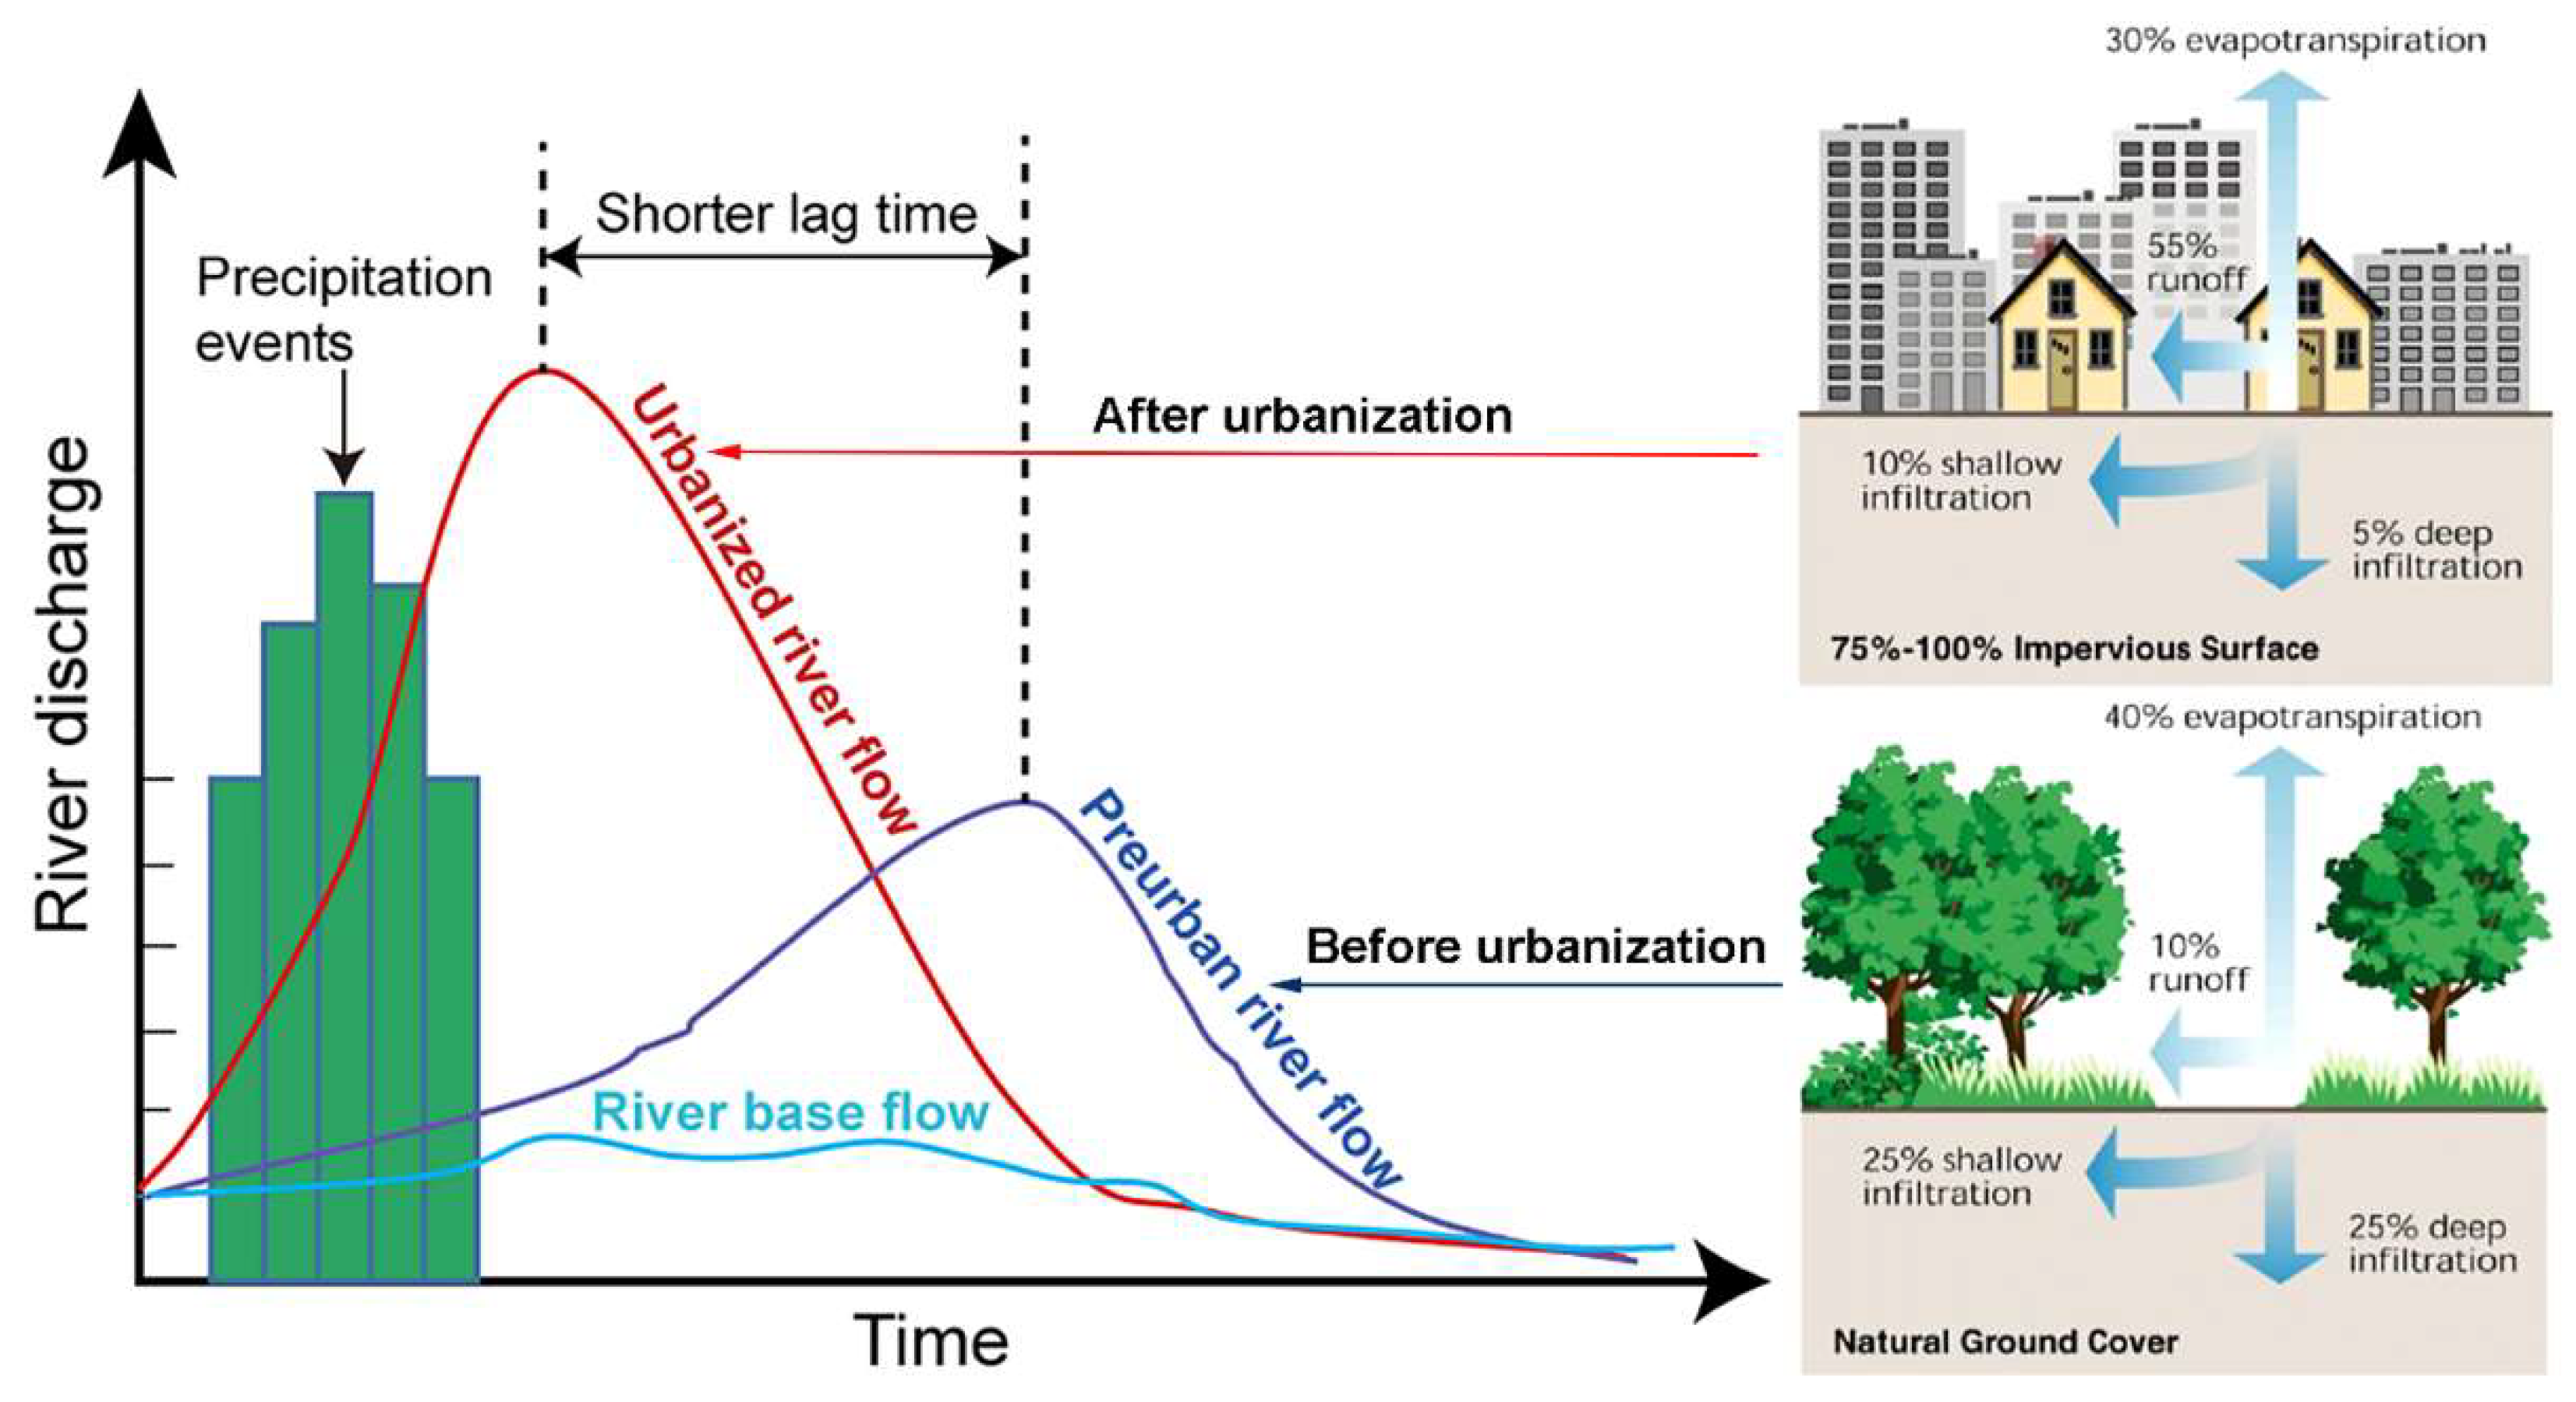
Firstly, increasing impervious surfaces caused more annual surface runoff because of less evapotranspiration and less water lost to soil infiltration [37] and enlarged daily peak flow and flood volume by interfering with the hydrologic cycle and hydrological process (see Figure 3). For example, 17% of non-urban areas in the Qinhuai River watershed were converted to urban areas (i.e., impervious surface areas) from 1988 to 2009, leading to a 4.4% and 0.6% increase in annual runoff in the dry years and wet years, respectively, while daily peak flow increased within a range of 1.4% to 7.9% and flood volume increased within a range of 2.6% to 15.0% for eight selected flood scenarios [38]. In addition, urbanization not only accelerates runoff flow velocity and causes peak flow [39,40] but also significantly increases the annual runoff depth and the runoff coefficient when accelerated and large-scale urban sprawl occurs [27,41].

Table 1.
Main driving factors and key aspects of flood risk affected by urbanization.
| Urbanization or Related Factors | Main Driving Factors | Key Aspects |
|---|---|---|
| Urbanization | Increase in impervious surfaces | Hazards: surface runoff [37], peak flow and flood volume [39,40], flood frequency [17] |
| Occupation of floodplains | Exposure: socioeconomic exposure to flood hazards in urban areas [42] | |
| LULC changes | Changes in river network | Hazards: precipitation [37,39,41,43], capacity of available water storage in river basins [27], surface runoff [44,45] |
Secondly, the urban rain island effect and LULC changes associated with rapid urbanization both amplify the adverse effects of floods through increasing precipitation (i.e., annual precipitation and flood season precipitation), significantly changing the geomorphologic complexity of river networks in many cities and destroying low-grade rivers [37,39,41,43]. For example, the devastating flash flood that hit Beijing on 21 July 2012 due to violent rainstorm was mainly caused by urbanization [46]. Similar flood events resulting from the urban rain island effect and LULC changes have been reported in megacities such as Shanghai [18], Shenzhen [47] and Wuhan [48]. Some human activities, such as deforestation, building roads and infrastructure, and reclamation of wetlands and lakes, have also reduced the capacity of available water storage in river basins, have increased the runoff coefficient, and have aggravated flood hazards [27]. Consequently, the increasing precipitation and surface runoff could overburden the drainage systems in cities, leading to severe urban flooding [44,45].
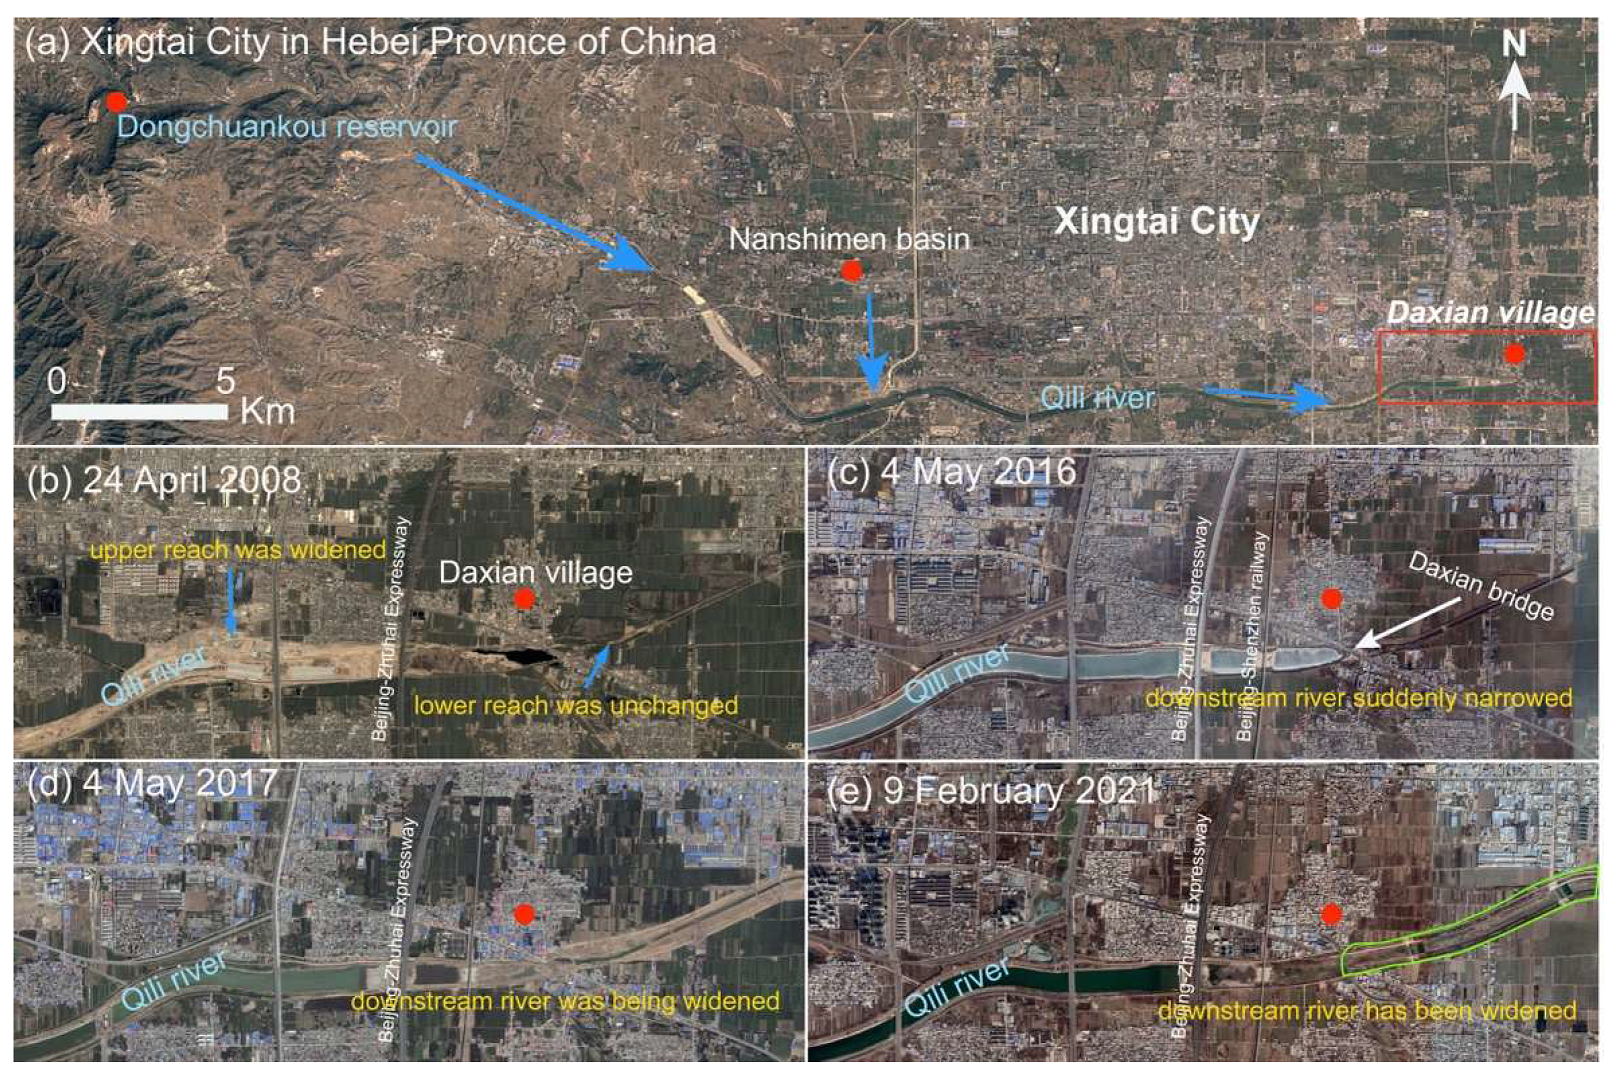
Notably, changes in river networks due to urbanization, such as suddenly narrowing downstream rivers, could cause serious floods in the surrounding areas when rainstorms occur. A typical example is the event of 19 July 2016, when the Dongchuankou Reservoir in the upper reach of the Qili River overflowed due to two consecutive days of heavy rain (Figure 4), and the peak discharge of the Qili River reached 580 m3/s after the downstream flood and thus a flash flood in the Nanshimen Basin took place [49]. However, the Qili River suddenly narrowed at Daxian bridge in Daxian village (Figure 4), with the maximum flood peak passing a capacity of about 40 m3/s. This flood event was mainly attributed to the underestimation of flood risk in Daxian village, because the flood peak generally failed to reach Daxian village, with a low flood passing capacity for the Qili River. However, starting in 2006, the riverway in the upper reach of Qili River was widened for the purpose of comprehensive improvement of river reaches of the Qili River in Xingtai City, and the lower reach of the Qili River remained unchanged [49].
Furthermore, accelerated urban sprawl enlarges the exposure of the risk receptors in urban areas through the occupation of floodplains [42]. For example, Du et al. [50] found that urban lands in the floodplain increased by 26,430 km2, i.e., 542%, from 1992 to 2015. In addition, the sudden influx of people into upper catchments to relieve the population pressure in urban areas, often associated with mineral extraction, can cause serious land degradation and increase the speed of rainfall runoff [37], thereby leading to devastating flash floods. The 2016 flash floods in big cities such as Guangzhou [51] and Wuhan [52] are typical examples. Moreover, it is worth noting that urban sprawl modes, namely the small-patch built-up land in floodplains (BLF) and the leapfrogging BLF, have much stronger correlations with flood frequency than that of the large-patch BLF growth and the edge-expanding BLF [17].
3.4. Flood Risk Management
3.4.1. Flood-Related Disaster Risk Management System
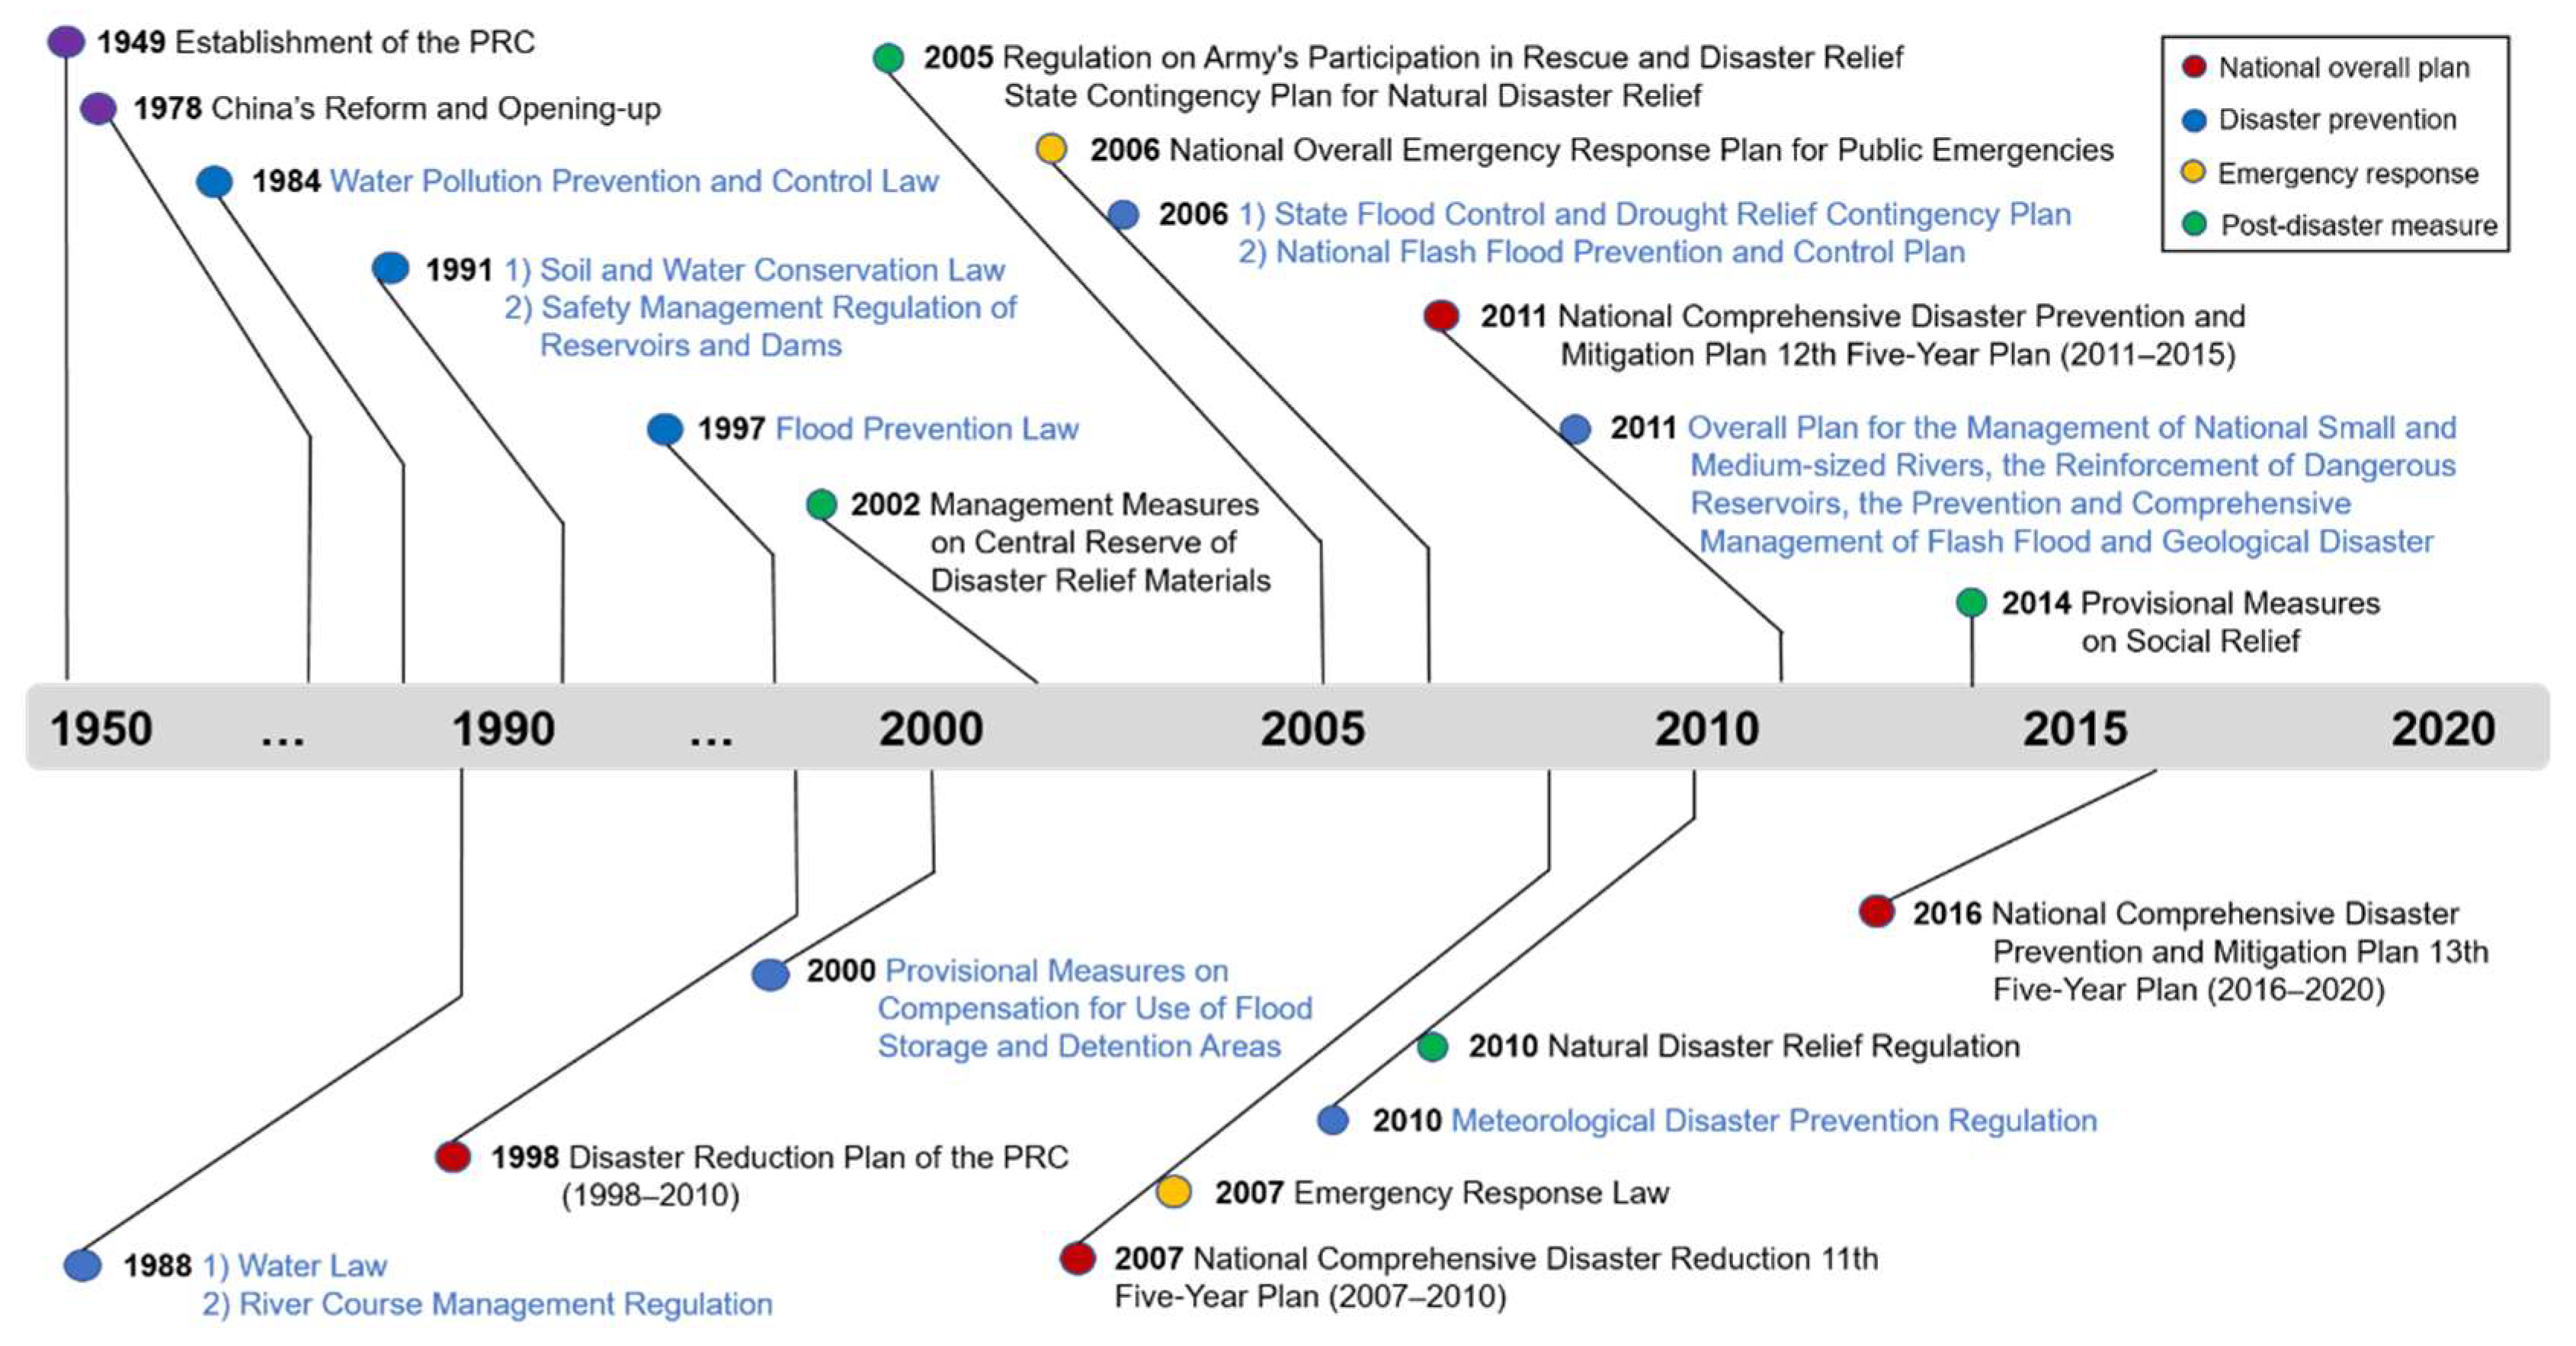
Since 1949, China has made many efforts to reduce flood risk and other natural disaster risks. First, the China National Commission for Disaster Reduction (CNCDR) was established to guide various departments and institutions, and National Comprehensive Disaster Prevention and Mitigation Five-year Plans (Figure 5) were promulgated to guarantee appropriate planning. These five-year plans are in line with the Hyogo Framework for Action (2005–2015) and the Sendai Framework for Disaster Risk Reduction (2015–2030), showing China’s commitment to integrating DRR into its sustainable development agenda. Moreover, China’s disaster reduction work has shifted from reactive to proactive disaster reduction since 1998 and focused on reducing disaster mortality and DELs as evidenced by the 11th Five-Year Plan to the 13th Five-Year Plan [53].
Second, China has established an integrated disaster risk management system featuring unified leadership, graded response and functional division [20]. The basic principles of the integrated disaster risk management system are as follows: (1) prevention first and giving equal weight to prevention and mitigation; (2) government-led, multilevel management and public participation; (3) people-centered and scientific disaster mitigation [20]. In addition, the Chinese government attaches great importance to the working mechanisms of disaster risk management and related capacity building. For working mechanisms, the different stages of flood-related disaster risk management as well as administrative departments and their representative projects or works are detailed in Table 2. Capacity building mainly includes the construction of monitoring, early warning and forecasting systems, disaster relief and emergency response systems, disaster reduction science and technology support systems, personal training systems, and community disaster-reduction capacity building [21].
Third, the Chinese government invested substantial money in engineering fortification of flood-related disasters, especially water project construction and ecological protection programs. For example, annual investment per capita in ecological protection increased more than 165-fold, from 0.2 to 32.2 US$ (in 2019 values) during 1978–2015 (Figure 2e). The annual investment in water construction and flood prevention saw a significant upward trend between 1979 and 2019, increasing from about 3.5 billion US$ to 108.2 billion US$ and from nearly 0.4 billion US$ to 32.6 billion US$, respectively (Figure 2f). Correspondingly, the number of meteorological stations and hydrological stations in China respectively increased from 2664 in 1982 to 64,790 in 2018 and from 419 in 1950 to 7253 in 2018.
Furthermore, many policies, laws and regulations on flood risk management have been enacted and implemented since the 1980s (see Figure 5). For instance, the Flood Prevention Law was first promulgated in 1997. The great progress of Chinese flood risk management has been closely associated with “focusing events”. For example, China’s water projects boomed after the 1998 flood, as evidenced by a more than 8.6-fold increase in investment in water construction from 1999 to 2019 (Figure 2f).
3.4.2. Structural Measures
Engineering measures of flood risk in China mainly comprise numerous reservoirs, dikes and flood detention areas. By 2019, a total of 98,112 reservoirs and 98 large flood detention areas had been constructed in the seven major river basins, with the total storage increasing continuously from 408.1 billion cubic meters in 1979 to 898.3 billion cubic meters in 2019 (Figure 2f). Based on large reservoirs like the Three Gorges Dam, flood control scheduling was used to control flood peaks in less populated mountainous areas, thus reducing flood control pressure in the middle and lower plain areas. This strategy also played an important role in reducing flood discharges in the lower reaches of the Yangtze River Basin in 2020, with a 34.4% reduction in the flood peak [57]. Moreover, the length of river dikes and embankments of grade 5 or higher in China reached 320,000 km [58], which directly modified the spatial extent of flooded areas.
Meanwhile, the flood protection level (FPL) of ‘hard’ defenses such as dikes and floodwalls in China have significantly improved. For example, the Three Gorges Dam enhanced the FPL in the lower reservoir from a 10-year return period to a 100-year return period [20]. Similarly, the FPL in lower reaches of the Yellow River has increased from a 60-year return period to a 1000-year return period [20], and the FPL below the Huayuankou station on the Yellow River has increased from a 100-year return period to a 1000-year return period [59,60], both thanks to the Xiaolangdi Dam. Currently, the FPL of the mainstem of the Huangpu River in the urban area of Shanghai is a 1000-year return period [57]. Moreover, the defense levels for floods in small and medium-sized cities are 20~50-year and 50~100-year return periods, the FPL in large cities is a 100~200-year return period, and the FPL is even higher than a 200-year return period in mega cities (available online: https://www.mohurd.gov.cn/gongkai/fdzdgknr/tzgg/201409/20140902_224218.html, (accessed on 18 January 2022).
Furthermore, China has implemented 16 major ecological environment construction projects [26] since 1978, and total investment reached 412.1 billion US$ (in 2019 values) between 1978 and 2015. Increasing investment in ecological protection programs not only helps to increase the forestry coverage rate from 12.5% in 1980 to 23.2% in 2019 (Figure 2e) but also exerts a positive impact on the conservation of water and soil, e.g., the soil erosion area dropped from 3.56 million square kilometers in 2000 to 2.71 million square kilometers in 2019 [61], which reduced the flood depth and flood flow velocity.
After 70 years of effort, the main sections of major rivers in China are basically equipped to defend against the largest flood that has occurred since 1949. During the rainy season (June–July) of 2020, the middle and lower reaches of the Yangtze River in China suffered the strongest precipitation and most severe floods since 1960, causing DELs of 25.9 billion US$ and the loss of 219 people [62]; flood damage was largely reduced compared with that caused by the 1998 Yangtze flood.
3.4.3. Non-Structural and Hybrid Measures
Recently, many effective and constructive non-structural and hybrid measures have been proposed and implemented for flash flood prevention, urban planning and urban water management [63], especially after the 1998 flood on the Yangtze River.
For flash flood prevention, non-structural measures range from compiling the National Flash Flood Prevention and Control Plan (NFFPCP, see Figure 5) to establishing a nationwide flash flood prevention platform [64,65]. The NFFPCP was initially launched in 2006 and has been fully carried out since 2013, with more than 35.2 billion CNY invested from 2010 to 2020 to implement non-structural measures and reinforce structural measures to reduce flash flood risks [34], covering a total area of 3.86 million km2 distributed over 2076 counties in 30 provinces of China [65,66]. For the investment, 76% of the money was invested in non-structural measures, including a national flash flood disaster survey, automatic monitoring networks of flash flood disasters, and flash flood disaster monitoring and early warning platforms at county to national management levels; 24% was invested in the construction of key flash flood ditch management [64]. By 2019, the number of automatic monitoring stations for flash flood disasters had reached 132,000, 22 times of that in 2006, with 831 key flash flood gullies being treated [67] and a nationwide flash flood prevention platform established [64]. As a result, average annual deaths due to flash floods reduced from 1179 persons in 2000–2010 to 333 persons in 2011–2020.
Appropriate urban planning programs, such as changing urban areas to forests or lakes, also play a great role in both mitigating flood hazards and reducing flood exposure [48,68]. For example, there was a significant increase in the flood exposure of Wuhan during 1954–2000 and a substantial and continuous reduction during 2000–2020, because appropriate urban planning started to be implemented at the end of the 1990s [48]. In addition, welfare rules (i.e., providing money and materials for flood victims), moving people out of flood vulnerable areas, and policies considering the environment and climate change impacts have been useful in flood prevention and mitigation [68].
The “Spongy City” Program (SCP) was formally proposed in 2014 and started to be implemented in 2015. It aims to alleviate the problems of surface-water flooding and related urban water management due to the unprecedented urbanization in China and global climate change [22,69]. Three technical measures are adopted by the SCP to control the flood water in cities, namely green infrastructure (GI), best management practices (BMPs) and low-impact development (LID) [23,24,52]. For example, permeable pavement, green roofs and rain gardens are used to reduce peak runoff and control water pollution [22,69]. For the SCP investment, the central government provided special funding for 30 selected pilot cities (e.g., Xiamen and Wuhan) over three years, and the remaining funding for each pilot city was offered by local governments and other channels. For instance, the planned total investment of the SCP in Wuhan of Hubei Province during 2015–2017 reached 16.3 billion CNY, of which the central and local government respectively invested 500 and 600 million CNY each year, and the investment from public–private partnerships (PPPs) and bank loans was 13 billion CNY [70]. Moreover, the top-down supervision mechanism, strict deadlines, and horizontal and vertical cooperation between departments made the enforcement of the SCP more effective [40,70].
4. Discussion
4.1. The Relationship between Flood Risk and Economic Development
The flood risk of a country or region is closely associated with its economic development level. In general, the disaster risk consists of the probability and the direct consequence (i.e., direct damage) of a disaster. On the one hand, rapid economic growth significantly increases the economic exposure due to the increasing economic assets and economic density. As inevitable consequences of economic development, economic activities (e.g., building houses and roads) potentially change the pattern of LULC and cause an increase in flood hazards. On the other hand, the biggest advantage of economic development may be the improved capacity of coping with flood risks, e.g., the capacity of flood prevention and mitigation, as more funds are likely to be invested in engineering fortification and non-structural measures against floods. Possibly, flood hazards and its physical vulnerability get mitigated, e.g., the FPL increases from a 100-year return period to a 1000-year return period.
Overall, flood damage is likely to increase due to the combined effects of hazards, exposure and vulnerability, while the possibility of floods may change or remain unchanged, depending on the changes in flood hazards. To a large extent, economic development may contribute to an increase in flood risk.
4.2. Emerging Challenges for Flood Risk Reduction and Possible Outlets
There are some emerging challenges for flood risk reduction. First, extreme flood events still occur, though many structural and non-structural measures have been taken to prevent and mitigate flood risks. Global climate change and socioeconomic development inevitably increase flood risks. For example, the annual average flood damage in China is projected to be, respectively, 4 and 17 times greater than at present under global warming of 1.5 °C and 4.0 °C [71]. Due to the limited understanding of the mechanism of floods, there may be difficulty in preventing and predicting extreme floods and mitigating flood damage. Second, accelerated urbanization largely exacerbates flood hazards. Increasing impervious surfaces increases annual surface runoff due to less evapotranspiration and less water lost to soil infiltration [37] and enlarges daily peak flow and flood volume by interfering with the hydrologic cycle and hydrological process [39]. The annual runoff depth and the runoff coefficient also significantly increase when accelerated and large-scale urban sprawl occur [27,41]. To a certain extent, a high flood hazard in China is associated with the national urbanization level increasing from 18.0% in 1978 to 60.6% in 2019 [36].
Some possible outlets are provided based on insights from China’s progress in flood risk management. First, improving the FPL and the capacity of flood disaster monitoring and early warning is the key to reducing flood damage in the face of extreme flood risks. Second, appropriate urban planning programs and ecological protection programs are necessary to curb the increase of flood hazards. Third, long-term stable investment in flood-related DRR can guarantee sustainable development. Since the 1980s, China has increased investment in flood prevention and mitigation. Many water projects, such as the Three Gorges Project and Xiaolangdi Project, were completed by the end of the 2000s, which laid the foundation for preventing and controlling large floods. Fourth, non-structural and hybrid measures will play a more important role in the future. For example, the SCP aims to alleviate the problems of surface-water flooding and related urban water management, considering the unprecedented urbanization in China and global climate change. Moreover, China’s flood risk reduction work has shifted from a reactive to a proactive pattern since 1998 and has focused on reducing mortality and the DELs of floods. Finally, the complete establishment of the Chinese integrated disaster risk management system in the 2010s further guaranteed the safety of people and economic assets and promoted the sustainable development of social economy.
4.3. Viewing Chinese Flood Risk Management from a Global Perspective
Since 1950, China has made great efforts in flood risk reduction, from sole reliance on large-scale structural flood control measures prior to the 1990s to a combination of structural and non-structural measures after suffering a suite of destructive floods [27]. Recently, an integrated disaster risk management system was established in China to cope with various natural disaster risks, including flood risks. However, there exist some gaps in flood risk management in China compared to developed countries.
First, flood prevention and mitigation through a variety of structural and non-structural measures is still the focus of Chinese flood risk management. However, complete flood control is impossible, even with massive flood protection efforts [27], which is evidenced by unprecedented flood events occurring in flood-protected areas in recent years, possibly due to global climate change [72]. Although resistance-based strategies [73,74] are often adopted by developed nations, more and more countries have acknowledged the importance of adaptive approaches that embrace and seek to accommodate rather than control environmental systems and thus offer a complementary response to resistance-based approaches [75]. For instance, European Union member states take a more adaptive view of flood risk management, in accordance with the EU Flood Risk Management Directive (2007/EC/60), which identifies the need for not only flood defense and preparedness, but also the capacity to cope with and adapt to flood events [75,76].
Second, the Chinese government has attached great importance to structural measures like the construction of embankments and dams, while the effectiveness and sustainability of structural measures vary greatly according to the local context and planning processes. For example, structural flood control measures were successfully implemented in small river basins like the Rhine River in Europe, but these have proven not to be sustainable in large river basins like the Yangtze River in China [77]. The dynamic nature of large river basins generates huge uncertainties in flood prediction and thus leads to inappropriate design of flood defenses [78]. On the other hand, the floodplain ecosystem is likely to be largely destroyed, and the ecosystem-dependent livelihoods and economy are also impacted, due to the implementation of structural measures [77]. To some extent, ‘hard’ defenses play an important role in flood control in the short term, but in the long term, some structural measures are likely to be inefficient during catastrophic flood events, due to unplanned development, population growth and LULC changes inside the flood-protected areas.
Third, the disaster management legal system in China continues to experience certain challenges. In the US and Japan, there are both general disaster management regulations and “single-style” disaster-related laws. However, China still lacks a basic law to guarantee national disaster prevention and mitigation, and “single-style” disaster-related laws are scattered among different administrative departments. In addition, each province, city and county has their own emergency response plan, although a national emergency response plan was enacted in 2006. The implementation of disaster emergency response plans below the provincial level lacks efficacy [20].
Furthermore, the Chinese flood risk management system needs improvement in certain areas, such as flood risk and uncertainty analysis, spatial planning, and insurance. Due to the unprecedented urbanization and LULC changes in China during 1950–2019, there is great uncertainty in terms of flood risk, with future variability. For flood risk analysis, it is necessary to integrate all possible states of the intervening pathways and the performance of non-structural measures. Uncertainty analysis needs to consider natural variability, knowledge uncertainty and decision uncertainty [79]. Meanwhile, spatial planning provides perhaps the most direct and effective means of reducing flood risks [79]. Moreover, flood insurance is a major and legitimate activity in managing flood risks, as it provides a mechanism for those insured to transfer part of their risks and reduce their vulnerability to floods [79]. However, China’s disaster insurance system is still in the start-up stage, with the exception of agricultural insurance; it will take some time for single-disaster insurance to develop [53].
5. Conclusions
For the last 70 years, socioeconomic vulnerability to floods and annual flood fatalities have both significantly decreased in China, although absolute DELs showed a great fluctuation from the 1990s to the 2010s, largely due to rapid economic growth in China. For example, the annual fatality rate reduced by nearly 96%, declining from 14.14 in the 1950s to 0.57 in the 2010s, while the annual loss rate declined from 2.3% in the 1990s to 0.4% in the 2010s. From a long time-series, the cumulative direct damage of large floods (e.g., the 1998 flood and 2010 flood) accounted for a large part of total flood damage. Nevertheless, annual average fatalities from flash floods as percent of flood deaths remains at 71.8% in the last two decades, reflecting a shift in flood risk from large floods to flash floods.
Chinese flood risk management experience over the past seven decades is summarized as follows: First, the national overall plan on comprehensive disaster prevention and mitigation was promulgated every five years to guarantee appropriate planning for reducing risks of natural disasters as a whole, and an integrated disaster risk management system was established to distinguish functions and works of different departments and facilitate better coordination and cooperation among related departments. Second, increasing investment in water project construction and ecological protection programs provides a strong support for reducing flood risks, and laws and regulations on flood-related disaster risk management were enacted and implemented, providing a basis for the implementation of DRR measures. Third, Chinese flood risk management mainly relied on structural measures (e.g., reservoirs and dikes), which played a huge role in reducing direct damage from large floods, due to the limitations of China’s economic development level and technological level before the 1990s. Since then, many non-structural measures and hybrid measures (e.g., the SCP) have been proposed and implemented, considering the importance of sustainable development. In addition, China’s disaster reduction work has shifted from ex-post response to ex-ante risk management since 1998 and focused on reducing disaster mortality and DELs.
Nevertheless, flood risk management in China still has some limitations. For example, the Chinese government has paid too much attention to flood prevention and mitigation and structural flood control measures. China’s disaster management legislation is incomplete, and parts of the flood risk management system (such as flood insurance) in China should be improved.
Author Contributions
Conceptualization, J.W. and W.D.; methodology, J.W. and W.D.; software, W.D.; validation, W.D.; formal analysis, W.D.; resources, W.D.; data curation, W.D.; writing—original draft preparation, W.D.; writing—review and editing, W.D., J.W., R.T., X.C. and Y.X.; visualization, W.D.; supervision, J.W.; funding acquisition, J.W. All authors have read and agreed to the published version of the manuscript.
Funding
This research was funded by the Second Tibetan Plateau Scientific Expedition and Research Program, grant number 2019QZKK0606, the National Key Research and Development Program of China, grant number 2016YFA0602403, and the National Natural Science Foundation of China, grant number 42077437.
Institutional Review Board Statement
Not applicable.
Informed Consent Statement
Not applicable.
Data Availability Statement
Data are available upon request from the corresponding author.
Conflicts of Interest
The authors declare no conflict of interest.
References
- Löw, P. Hurricanes Cause Record Losses in 2017—The Year in Figures; Re NatCatSERVICE: Munich, Germany, 2018. [Google Scholar]
- Aerts, J.P.M.; Uhlemann-Elmer, S.; Eilander, D.; Ward, P.J. Comparison of Estimates of Global Flood Models for Flood Hazard and Exposed Gross Domestic Product: A China Case Study. Nat. Hazards Earth Syst. Sci. 2020, 20, 3245–3260. [Google Scholar] [CrossRef]
- Fang, J.; Li, M.; Shi, P. Mapping Flood Risk of the World. In World Atlas of Natural Disaster Risk; Springer: Berlin, Germany, 2015; pp. 69–102. [Google Scholar]
- Shi, P.; Ye, T.; Wang, Y.; Zhou, T.; Xu, W.; Du, J.; Wang, J.; Li, N.; Huang, C.; Liu, L.; et al. Disaster Risk Science: A Geographical Perspective and a Research Framework. Int. J. Disaster Risk Sci. 2020, 11, 426–440. [Google Scholar] [CrossRef]
- National Climate Center. Blue Book on Climate Change in China 2020; Science Press: Beijing, China, 2020. [Google Scholar]
- Ni, J.; Sun, L.; Li, T.; Huang, Z.; Borthwick, A.G.L. Assessment of Flooding Impacts in Terms of Sustainability in Mainland China. J. Environ. Manag. 2010, 91, 1930–1942. [Google Scholar] [CrossRef] [PubMed] [Green Version]
- Liu, F.; Ouyang, Y.; Wang, B.; Yang, J.; Ling, J.; Hsu, P.-C. Seasonal Evolution of the Intraseasonal Variability of China Summer Precipitation. Clim. Dyn. 2020, 54, 4641–4655. [Google Scholar] [CrossRef]
- Cai, G.; Chen, S.; Liu, Y.; Sun, H.; Chen, C.; Gui, D.; Yan, D. Using Multiple Indexes to Analyze Temporal and Spatial Patterns of Precipitation and Drought in Xinjiang, China. Theor. Appl. Climatol. 2020, 142, 177–190. [Google Scholar] [CrossRef]
- Li, X.; Zhang, Q.; Xu, C.; Ye, X. The Changing Patterns of Floods in Poyang Lake, China: Characteristics and Explanations. Nat. Hazards 2015, 76, 651–666. [Google Scholar] [CrossRef]
- Zhang, Q.; Gu, X.; Singh, V.P.; Shi, P.; Luo, M. Timing of Floods in Southeastern China: Seasonal Properties and Potential Causes. J. Hydrol. 2017, 552, 732–744. [Google Scholar] [CrossRef]
- Shi, P. Atlas of Natural Disaster System of China; Science Press: Beijing, China, 2003. [Google Scholar]
- Guo, Y.; Huang, S.; Huang, Q.; Wang, H.; Wang, L.; Fang, W. Copulas-Based Bivariate Socioeconomic Drought Dynamic Risk Assessment in a Changing Environment. J. Hydrol. 2019, 575, 1052–1064. [Google Scholar] [CrossRef]
- Peng, L.; Xia, J.; Li, Z.; Fang, C.; Deng, X. Spatio-Temporal Dynamics of Water-Related Disaster Risk in the Yangtze River Economic Belt from 2000 to 2015. Resour. Conserv. Recycl. 2020, 161, 104851. [Google Scholar] [CrossRef]
- Wu, J.; Han, G.; Zhou, H.; Li, N. Economic Development and Declining Vulnerability to Climate-Related Disasters in China. Environ. Res. Lett. 2018, 13, 034013. [Google Scholar] [CrossRef]
- Liu, C.; Xu, Y.; Wang, F.; Liu, C.; Xu, Y. Analyzing Population Density Disparity in China with GIS-automated Regionalization: The Hu Line Revisited. Chin. Geogr. Sci. 2019, 29, 541–542. [Google Scholar]
- Fang, Y.; Du, S.; Wen, J.; Zhang, M.; Fang, J.; Liu, M. Chinese Built-up Land in Floodplains Moving Closer to Freshwaters. Int. J. Disaster Risk Sci. 2021, 12, 355–366. [Google Scholar] [CrossRef]
- Han, Y.; Huang, Q.; He, C.; Fang, Y.; Wen, J.; Gao, J.; Du, S. The Growth Mode of Built-up Land in Floodplains and Its Impacts on Flood Vulnerability. Sci. Total Environ. 2020, 700, 134462. [Google Scholar] [CrossRef] [PubMed]
- Yin, J.; Yu, D.; Yin, Z.; Wang, J.; Xu, S. Modelling the Anthropogenic Impacts on Fluvial Flood Risks in a Coastal Mega-City: A Scenario-Based Case Study in Shanghai, China. Landsc. Urban Plan. 2015, 136, 144–155. [Google Scholar] [CrossRef]
- Jia, H.; Chen, F.; Pan, D.; Du, E.; Wang, L.; Wang, N.; Yang, A. Flood Risk Management in the Yangtze River Basin—Comparison of 1998 and 2020 Events. Int. J. Disaster Risk Reduct. 2022, 68, 102724. [Google Scholar] [CrossRef]
- Yi, L.; Ge, L.; Zhao, D.; Zhou, J.; Gao, Z. An analysis on disasters management system in China. Nat. Hazards 2012, 60, 295–309. [Google Scholar]
- Zou, M.; Yuan, Y. China’s Comprehensive Disaster Reduction. Int. J. Disaster Risk Sci. 2010, 1, 24–32. [Google Scholar]
- Chan, F.K.S.; Griffiths, J.A.; Higgitt, D.; Xu, S.; Zhu, F.; Tang, Y.-T.; Xu, Y.; Thorne, C.R. “Sponge City” in China—A Breakthrough of Planning and Flood Risk Management in the Urban Context. Land Use Policy 2018, 76, 772–778. [Google Scholar]
- Li, L.; Collins, A.M.; Cheshmehzangi, A.; Chan, F.K.S. Identifying Enablers and Barriers to the Implementation of the Green Infrastructure for Urban Flood Management: A Comparative Analysis of the UK and China. Urban For. Urban Green. 2020, 54, 126770. [Google Scholar] [CrossRef]
- Lyu, H.; Xu, Y.; Cheng, W.; Arulrajah, A. Flooding Hazards across Southern China and Prospective Sustainability Measures. Sustainability 2018, 10, 1682. [Google Scholar] [CrossRef] [Green Version]
- Wu, J.; Wang, C.; He, X.; Wang, X.; Li, N. Spatiotemporal Changes in Both Asset Value and GDP Associated with Seismic Exposure in China in the Context of Rapid Economic Growth from 1990 to 2010. Environ. Res. Lett. 2017, 12, 034002. [Google Scholar] [CrossRef] [Green Version]
- Bryan, B.A.; Gao, L.; Ye, Y.; Sun, X.; Connor, J.D.; Crossman, N.D.; Stafford-Smith, M.; Wu, J.; He, C.; Yu, D.; et al. China’s Response to a National Land-System Sustainability Emergency. Nature 2018, 559, 193–204. [Google Scholar] [CrossRef]
- Kundzewicz, Z.; Su, B.; Wang, Y.; Xia, J.; Huang, J.; Jiang, T. Flood Risk and Its Reduction in China. Adv. Water Resour. 2019, 130, 37–45. [Google Scholar] [CrossRef]
- Ministry of Water Resources. Bulletin of Flood and Drought Disasters in China 2010; China Water Power Press: Beijing, China, 2010. [Google Scholar]
- Tang, C.; Rengers, N.; van Asch, T.W.J.; Yang, Y.H.; Wang, G.F. Triggering Conditions and Depositional Characteristics of a Disastrous Debris Flow Event in Zhouqu City, Gansu Province, Northwestern China. Nat. Hazards Earth Syst. Sci. 2011, 11, 2903–2912. [Google Scholar] [CrossRef]
- Tang, C.; van Asch, T.W.J.; Chang, M.; Chen, G.Q.; Zhao, X.H.; Huang, X.C. Catastrophic Debris Flows on 13 August 2010 in the Qingping Area, Southwestern China: The Combined Effects of a Strong Earthquake and Subsequent Rainstorms. Geomorphology 2012, 139, 559–576. [Google Scholar] [CrossRef]
- Wang, G.L. Lessons Learned from Protective Measures Associated with the 2010 Zhouqu Debris Flow Disaster in China. Nat. Hazards 2013, 69, 1835–1847. [Google Scholar] [CrossRef]
- He, B.; Huang, X.; Ma, M.; Chang, Q.; Tu, Y.; Li, Q.; Zhang, K.; Hong, Y. Analysis of Flash Flood Disaster Characteristics in China from 2011 to 2015. Nat. Hazards 2018, 90, 407–420. [Google Scholar] [CrossRef]
- Su, Y.; Zhao, F.; Tan, L. Whether a Large Disaster Could Change Public Concern and Risk Perception: A Case Study of the 7/21 Extraordinary Rainstorm Disaster in Beijing in 2012. Nat. Hazards 2015, 78, 555–567. [Google Scholar] [CrossRef]
- Sun, D.; Zhang, D.; Cheng, X. Framework of National Non-Structural Measures for Flash Flood Disaster Prevention in China. Water 2012, 4, 272–282. [Google Scholar] [CrossRef]
- Gong, P.; Liang, S.; Carlton, E.J.; Jiang, Q.; Wu, J.; Wang, L.; Remais, J. V Urbanisation and Health in China. Lancet 2012, 379, 843–852. [Google Scholar] [CrossRef]
- National Bureau of Statistics of China. China Statistical Yearbook 2020; China Statistics Press: Beijing, China, 2020. [Google Scholar]
- Jha, A.; Lamond, J.; Bloch, R.; Bhattacharya, N.; Lopez, A.; Papchristodoulou, N.; Bird, A.; Poverbs, D.; Davies, J.; Barker, R. Five Feet High and Rising: Cities and Flooding in the 21st Century; World Bank: Washington, DC, USA, 2011. [Google Scholar]
- Du, J.; Qian, L.; Rui, H.; Zuo, T.; Zheng, D.; Xu, Y.; Xu, C.-Y. Assessing the Effects of Urbanization on Annual Runoff and Flood Events Using an Integrated Hydrological Modeling System for Qinhuai River Basin, China. J. Hydrol. 2012, 464–465, 127–139. [Google Scholar] [CrossRef]
- Duan, W.; He, B.; Nover, D.; Fan, J.; Yang, G.; Chen, W.; Meng, H.; Liu, C. Floods and Associated Socioeconomic Damages in China over the Last Century. Nat. Hazards 2016, 82, 401–413. [Google Scholar] [CrossRef]
- Jiang, Y.; Zevenbergen, C.; Ma, Y. Urban pluvial flooding and stormwater management: A contemporary review of China’s challenges and “sponge cities” strategy. Environ. Sci. Policy 2018, 80, 132–143. [Google Scholar] [CrossRef]
- Xu, Y.; Xu, J.; Ding, J.; Chen, Y.; Yin, Y.; Zhang, X. Impacts of Urbanization on Hydrology in the Yangtze River Delta, China. Water Sci. Technol. 2010, 62, 1221–1229. [Google Scholar]
- Yin, J.; Ye, M.; Yin, Z.; Xu, S. A Review of Advances in Urban Flood Risk Analysis over China. Stoch. Environ. Res. Risk Assess. 2015, 29, 1063–1070. [Google Scholar] [CrossRef]
- Zhang, S.; Guo, Y.; Wang, Z. Correlation between Flood Frequency and Geomorphologic Complexity of Rivers Network—A Case Study of Hangzhou China. J. Hydrol. 2015, 527, 113–118. [Google Scholar] [CrossRef] [Green Version]
- Zhang, H.; Ma, W.; Wang, X. Rapid Urbanization and Implications for Flood Risk Management in Hinterland of the Pearl River Delta, China: The Foshan Study. Sensors 2008, 8, 2223–2239. [Google Scholar] [CrossRef] [Green Version]
- Zhou, Q.; Leng, G.; Su, J.; Ren, Y. Comparison of Urbanization and Climate Change Impacts on Urban Flood Volumes: Importance of Urban Planning and Drainage Adaptation. Sci. Total Environ. 2019, 658, 24–33. [Google Scholar] [CrossRef]
- Qiu, J. Urbanization Contributed to Beijing Storms. Nat. News 2012, 10. [Google Scholar] [CrossRef]
- Shi, P.; Yuan, Y.; Zheng, J.; Wang, J.; Ge, Y.; Qiu, G. The Effect of Land Use/Cover Change on Surface Runoff in Shenzhen Region, China. CATENA 2007, 69, 31–35. [Google Scholar] [CrossRef]
- Liu, J.; Wang, S.; Li, D. The Analysis of the Impact of Land-Use Changes on Flood Exposure of Wuhan in Yangtze River Basin, China. Water Resour. Manag. 2014, 28, 2507–2522. [Google Scholar] [CrossRef]
- Cheng, X.; Tian, Y. Urgent Issues in Flood Management: Demonstrated by Typical Flood Disasters Case Study. China Flood Drought Manag. 2017, 27, 67–71. [Google Scholar]
- Du, S.; He, C.; Huang, Q.; Shi, P. How Did the Urban Land in Floodplains Distribute and Expand in China from 1992–2015? Environ. Res. Lett. 2018, 13, 034018. [Google Scholar] [CrossRef]
- Lyu, H.; Wang, G.-F.; Shen, J.; Lu, L.; Wang, G. Analysis and GIS Mapping of Flooding Hazards on 10 May 2016, Guangzhou, China. Water 2016, 8, 447. [Google Scholar] [CrossRef] [Green Version]
- Wu, H.; Cheng, W.; Shen, S.; Lin, M.; Arulrajah, A. Variation of Hydro-Environment during Past Four Decades with Underground Sponge City Planning to Control Flash Floods in Wuhan, China: An Overview. Undergr. Sp. 2020, 5, 184–198. [Google Scholar] [CrossRef]
- World Bank. Learning from Experience Insights from China’s Progress in Disaster Risk Management; World Bank: Washington, DC, USA, 2020. [Google Scholar]
- Rubinato, M.; Nichols, A.; Peng, Y.; Zhang, J.; Lashford, C.; Cai, Y.; Lin, P.; Tait, S. Urban and River Flooding: Comparison of Flood Risk Management Approaches in the UK and China and an Assessment of Future Knowledge Needs. Water Sci. Eng. 2019, 12, 274–283. [Google Scholar] [CrossRef]
- National Development and Reform Commission; Ministry of Water Resources. National Sea Dikes Construction Plan; 2017. Available online: https://www.ndrc.gov.cn/xxgk/zcfb/tz/201708/t20170821_962542.html?code=&state=123 (accessed on 28 December 2021).
- Chen, H.; Wang, J.; Huang, J. Policy Support, Social Capital, and Farmers’ Adaptation to Drought in China. Glob. Environ. Change 2014, 24, 193–202. [Google Scholar] [CrossRef]
- Xia, J.; Chen, J. A New Era of Flood Control Strategies from the Perspective of Managing the 2020 Yangtze River Flood. Sci. China Earth Sci. 2021, 64, 1–9. [Google Scholar] [CrossRef]
- Ministry of Water Resources. China Water Resources Bulletin 2019; China Water Power Press: Beijing, China, 2020. [Google Scholar]
- Mei, J. Flood Control Planning and Construction in China. China Water Resour. 2010, 20, 17–20. [Google Scholar]
- Liu, J.; Zang, C.; Tian, S.; Liu, J.; Yang, H.; Jia, S.; You, L.; Liu, B.; Zhang, M. Water Conservancy Projects in China: Achievements, Challenges and Way Forward. Glob. Environ. Change 2013, 23, 633–643. [Google Scholar] [CrossRef] [Green Version]
- Ministry of Water Resources. Statistic Bulletin on China Water Activities 2019; China Water Power Press: Beijing, China, 2020. [Google Scholar]
- Ye, Y.; Qian, C. Conditional Attribution of Climate Change and Atmospheric Circulation Contributing to the Record-Breaking Precipitation and Temperature Event of Summer 2020 in Southern China. Environ. Res. Lett. 2021, 16, 044058. [Google Scholar] [CrossRef]
- Zhang, B.; Xie, G.; Zhang, C.; Zhang, J. The Economic Benefits of Rainwater-Runoff Reduction by Urban Green Spaces: A Case Study in Beijing, China. J. Environ. Manag. 2012, 100, 65–71. [Google Scholar] [CrossRef]
- Guo, L.; He, B.; Ma, M.; Chang, Q.; Li, Q.; Zhang, K.; Hong, Y. A Comprehensive Flash Flood Defense System in China: Overview, Achievements, and Outlook. Nat. Hazards 2018, 92, 727–740. [Google Scholar] [CrossRef]
- Liu, C.; Guo, L.; Ye, L.; Zhang, S.; Zhao, Y.; Song, T. A Review of Advances in China’s Flash Flood Early-Warning System. Nat. Hazards 2018, 92, 619–634. [Google Scholar] [CrossRef] [Green Version]
- Ministry of Water Resources. Implementation Plan of the National Flash Flood Disaster Prevention and Control Project (2021–2023); China Water Power Press: Beijing, China, 2021. [Google Scholar]
- Ministry of Water Resources. China Soil and Water Conservation Bulletin 2019; China Water Power Press: Beijing, China, 2020. [Google Scholar]
- Luo, P.; He, B.; Takara, K.; Xiong, Y.E.; Nover, D.; Duan, W.; Fukushi, K. Historical Assessment of Chinese and Japanese Flood Management Policies and Implications for Managing Future Floods. Environ. Sci. Policy 2015, 48, 265–277. [Google Scholar] [CrossRef] [Green Version]
- Wang, H.; Mei, C.; Liu, J.; Shao, W. A New Strategy for Integrated Urban Water Management in China: Sponge City. Sci. China Technol. Sci. 2018, 61, 317–329. [Google Scholar] [CrossRef]
- Dai, L.; van Rijswick, H.F.M.W.; Driessen, P.P.J.; Keessen, A.M. Governance of the Sponge City Programme in China with Wuhan as a Case Study. Int. J. Water Resour. Dev. 2018, 34, 578–596. [Google Scholar] [CrossRef]
- Jiang, T.; Su, B.; Huang, J.; Zhai, J.; Xia, J.; Tao, H.; Wang, Y.; Sun, H.; Luo, Y.; Zhang, L.; et al. Each 0.5 °C of Warming Increases Annual Flood Losses in China by More than US $60 Billion. Bull. Am. Meteorol. Soc. 2020, 101, E1464. [Google Scholar] [CrossRef] [Green Version]
- Melillo, J.M.; Richmond, T.; Yohe, G.W. Climate Change Impacts in the United States: The Third National Climate Assessment; Global Change Research Program: Washington, DC, USA, 2014. [Google Scholar]
- Zevenbergen, C.; Gersonius, B. Advances in Urban Flood Management; Ashley, R., Garvin, S., Pasche, E., Vassilopoulos, A., Zevenbergen, C., Eds.; Taylor and Francis: New York, NY, USA, 2007; Volume 1, Chapter 1; pp. 1–11. [Google Scholar]
- Shrubsole, D. Climate Change and Flood Risk Management: Adaptation and Extreme Events at the Local Level; Edward Elgar Publishing: Cheltenham, UK, 2013. [Google Scholar]
- Morrison, A.; Westbrook, C.J.; Noble, B.F. A Review of the Flood Risk Management Governance and Resilience Literature. J. Flood Risk Manag. 2018, 11, 291–304. [Google Scholar] [CrossRef] [Green Version]
- Schelfaut, K.; Pannemans, B.; van der Craats, I.; Krywkow, J.; Mysiak, J.; Cools, J. Bringing Flood Resilience into Practice: The FREEMAN Project. Environ. Sci. Policy 2011, 14, 825–833. [Google Scholar] [CrossRef]
- Shah, M.A.R.; Rahman, A.; Chowdhury, S.H. Challenges for Achieving Sustainable Flood Risk Management. J. Flood Risk Manag. 2018, 11, S352–S358. [Google Scholar] [CrossRef] [Green Version]
- Plate, E.J. Flood Risk and Flood Management. J. Hydrol. 2002, 267, 2–11. [Google Scholar] [CrossRef]
- Sayers, P.; Li, Y.; Galloway, G.; Penning-Rowsell, E.; Shen, F.; Wen, K.; Chen, Y.; Le Quesne, T. Flood Risk Management: A Strategic Approach; UNESCO: Paris, France, 2013. [Google Scholar]
Figure 2.
Changes in direct damages (a–d) caused by flood and flood-related DRR investment ((e,f), adapted from refs. [14,26]) in China during 1950–2019 (missing numbers in some years represent lacking source data). All economic numbers are adjusted at the 2019 price level.

Figure 3.
Impacts of urbanization on surface runoff, peak flow and flood volume (lag time represents lag time between storm peak and river discharge peak) (adapted from [37,39]).

Figure 4.
The position (a) of Daxian village in Xingtai City, Hebei Province and its time-series satellite images in 2008 (b), 2016 (c), 2017 (d), and 2021 (e). The lower reach of the Qili River was widened in 2017 after the 2016 flood disaster.
Figure 4.
The position (a) of Daxian village in Xingtai City, Hebei Province and its time-series satellite images in 2008 (b), 2016 (c), 2017 (d), and 2021 (e). The lower reach of the Qili River was widened in 2017 after the 2016 flood disaster.

Figure 5.
Important policies, laws and regulations on flood-related disaster risk management in China during 1949–2020.
Figure 5.
Important policies, laws and regulations on flood-related disaster risk management in China during 1949–2020.

Table 2.
Working mechanisms of flood-related disaster risk management.
| Stage of Disaster Risk Management | Administrative Department and Main Responsibility | Representative Project/Work |
|---|---|---|
| Disaster prevention and mitigation | Ministry of Water Resources (MWR): Flood prevention and mitigation |
|
| China Meteorological Administration (CMA): Prevention and mitigation of meteorological disasters | ||
| Disaster preparation and emergency response | Ministry of Civil Affairs (before 2018) and Ministry of Emergency Management (currently): Guiding local emergency response and relief |
|
| Recovery and reconstruction | Ministry of Civil Affairs, Ministry of Housing and Urban-Rural Development and etc.: Post-disaster recovery and reconstruction activities |
Publisher’s Note: MDPI stays neutral with regard to jurisdictional claims in published maps and institutional affiliations. |
© 2022 by the authors. Licensee MDPI, Basel, Switzerland. This article is an open access article distributed under the terms and conditions of the Creative Commons Attribution (CC BY) license (https://creativecommons.org/licenses/by/4.0/).
Share and Cite
MDPI and ACS Style
Ding, W.; Wu, J.; Tang, R.; Chen, X.; Xu, Y. A Review of Flood Risk in China during 1950–2019: Urbanization, Socioeconomic Impact Trends and Flood Risk Management. Water 2022, 14, 3246. https://doi.org/10.3390/w14203246
AMA Style
Ding W, Wu J, Tang R, Chen X, Xu Y. A Review of Flood Risk in China during 1950–2019: Urbanization, Socioeconomic Impact Trends and Flood Risk Management. Water. 2022; 14(20):3246. https://doi.org/10.3390/w14203246
Chicago/Turabian StyleDing, Wei, Jidong Wu, Rumei Tang, Xiaojuan Chen, and Yingjun Xu. 2022. "A Review of Flood Risk in China during 1950–2019: Urbanization, Socioeconomic Impact Trends and Flood Risk Management" Water 14, no. 20: 3246. https://doi.org/10.3390/w14203246
Note that from the first issue of 2016, this journal uses article numbers instead of page numbers. See further details here.