
Assessment of Activating Reservoir Emergency Storage in Climate-Change-Fueled Extreme Drought
by
 , and
, and
Heechan Chae
1,
Jungwon Ji
2,
Eunkyung Lee
2,
Seonmi Lee
2, 
Youngje Choi
3,
Sooyeon Yi
4 and
Jaeeung Yi
2,* 1
Korea Hydro & Nuclear Power Co., Ltd., Hangang Hydro Power Site, 3741, Yeongseo-ro, Sinbuk-eup, Chuncheon 24202, Korea
2
Department of Civil Systems Engineering, Ajou University, 206 Worldcup-ro Yeongtong-gu, Suwon 16499, Korea
3
Department of Hydro Science and Engineering Research, Korea Institute of Civil Engineering and Building Technology, 283 Goyang-daero Ilsanseo-gu, Goyang 10223, Korea
4
Landscape Architecture & Environmental Planning, University of California, Berkeley, CA 94720, USA
*
Author to whom correspondence should be addressed.
Water 2022, 14(20), 3242; https://doi.org/10.3390/w14203242
Submission received: 13 September 2022
/
Revised: 11 October 2022
/
Accepted: 12 October 2022
/
Published: 14 October 2022
(This article belongs to the Section Water and Climate Change)
Abstract
:With exacerbating climate change, the current reservoir storage capacity in South Korea is insufficient to meet the future scheduled water demand. No study has yet evaluated the effects of applying the water supply adjustment standard (Standard) and activating the reservoir emergency storage in response to extreme drought. The main objective is to assess the effects of applying Standard and activating emergency storage in meeting the water demand under extreme drought at six multipurpose reservoirs (Andong, Gimcheon-Buhang, Gunwi, Hapcheon, Imha, and Milyang) in the Nakdong River Basin, South Korea. We built a reservoir simulation model (HEC-ResSim), determined the extreme drought scenarios, and emergency storage capacity. We evaluated three reservoir operation cases (general operation, regular Standard, and revised Standard) from 2011 to 2100. The results show that applying the Standard and activating the emergency storage are effective in meeting the future water demand during extreme drought. In conclusion, we need to secure 110 million cubic meters (MCM) (Hapcheon reservoir) and 8 MCM (Gunwi reservoir) of water to reduce the number of days in the emergency stage. This research serves as a fundamental study that can help establish Standard and emergency storage activation criteria for other multipurpose reservoirs in preparation for extreme drought.
1. Introduction
Climate change is increasing the frequency of extreme drought and worsening the drought in the regions of East Asia [1,2]. South Korea is no exception for experiencing more frequent and extreme drought due to climate change [3]. The historic severe drought in South Korea was in 1988 and 1994 with the return period of 30 to 50 years [4]. The recent climate change-fueled drought in South Korea lasted more than three years (2013 to 2015) [5]. In normal years, South Korea receives 1320 mm of annual rainfall, and 70% of its rainfall occurs during the summer. However, from 2013 to 2015, the annual precipitation was 35% to 50% less than the precipitation in normal years. This was the most recent severe drought with a return period of over 100 years [6]. The exacerbating climate change can lead to more frequent and severe drought that pose challenges and risks in operating and managing the existing reservoir to meet the scheduled water demand in South Korea [7,8,9].
South Korea has 20 multipurpose reservoirs that impound water during high flows and gradually release the water during low flows. Multipurpose reservoirs provide resiliency against changing meteorological and hydrological variables by providing services such as water supply, drought management, prevention of salinity intrusion, and recreational activities [10,11]. In 2015, the total storage of multipurpose reservoirs in South Korea was 4.88 billion cubic meters (BCM), which was approximately 2.83 BCM lower than the total storage in a normal year (7.71 BCM). Building a new reservoir is a promising approach to increasing water storage and mitigating water shortages [12]. However, constructing a new reservoir comes with a huge cost, limited location, conflicts between the upstream and downstream communities, and inevitable environmental and ecological impacts [13]. Some alternatives to building a new reservoir are transferring water from a water-abundant river basin to a water-scarce river basin [14], connecting tunnels between two existing reservoirs [15], or developing coordinated reservoirs and weirs operation systems to meet water supply [16]. Likewise, reservoir operation is crucial in the river basin as it has direct impact on meeting the water demand of a region. Past literature attempt to improve the reservoir operation criteria [17,18], develop rule curve, deficit-supply operation [19], or threshold levels [20] in response to climate-change-fueled drought. In response to the recent drought, the Korean Ministry of Environment established the Water Supply Adjustment Standard (Standard) to reduce the reservoir water supply when the reservoir storage drops below a specified water level. This Standard is set in four stages (concern, caution, alert, and emergency). Several studies have already tested the performance of Standard [21]. Other studies simulate the water supply capacity [22], forecast reservoir inflow [23], and calculate the ranges of supplement-reduction amount of water supply [24] for multi-purpose reservoirs. The common method of assessing the severity of the drought is using the indices like the drought index [25,26,27], drought vulnerability index [28], hotspot drought risk index [29], standard flow in-dex [30] and water supply capacity index [31]. Other studies assess a potential drought hazard areas in this basin [32].
As climate change exacerbates, the current reservoir storage in South Korea is insufficient to meet the scheduled water demand [33]. To our knowledge, no study has yet evaluated the potential application of Standard and the use of the reservoir emergency storage in a multipurpose reservoir. The novelty of this work is evaluating the effects of applying the Standard and activating the emergency storage in meeting the scheduled water demand under extreme drought. The main objective is to determine the capacity of emergency storage required to meet the scheduled water demand during the extreme drought. The study site is the Nakdong River Basin (Basin) with six multipurpose reservoirs: Andong, Gimcheon-Buhang, Gunwi, Hapcheon, Imha, and Milyang. We build and simulate a reservoir simulation model (Hydrologic Engineering Center-Reservoir System Simulation (HEC-ResSim)). We select three extreme drought scenarios out of 25 climate change scenarios. We evaluate three reservoir operation cases, which are the general operation (Case 1), regular Standard (Case 2), and revised Standard (Case 3). The three model performance indices are volumetric reliability, resiliency, and vulnerability. The rest of the sections are in sequential order: Materials and Methods; Results; Discussion; Conclusions.
2. Materials and Methods
2.1. Study Site
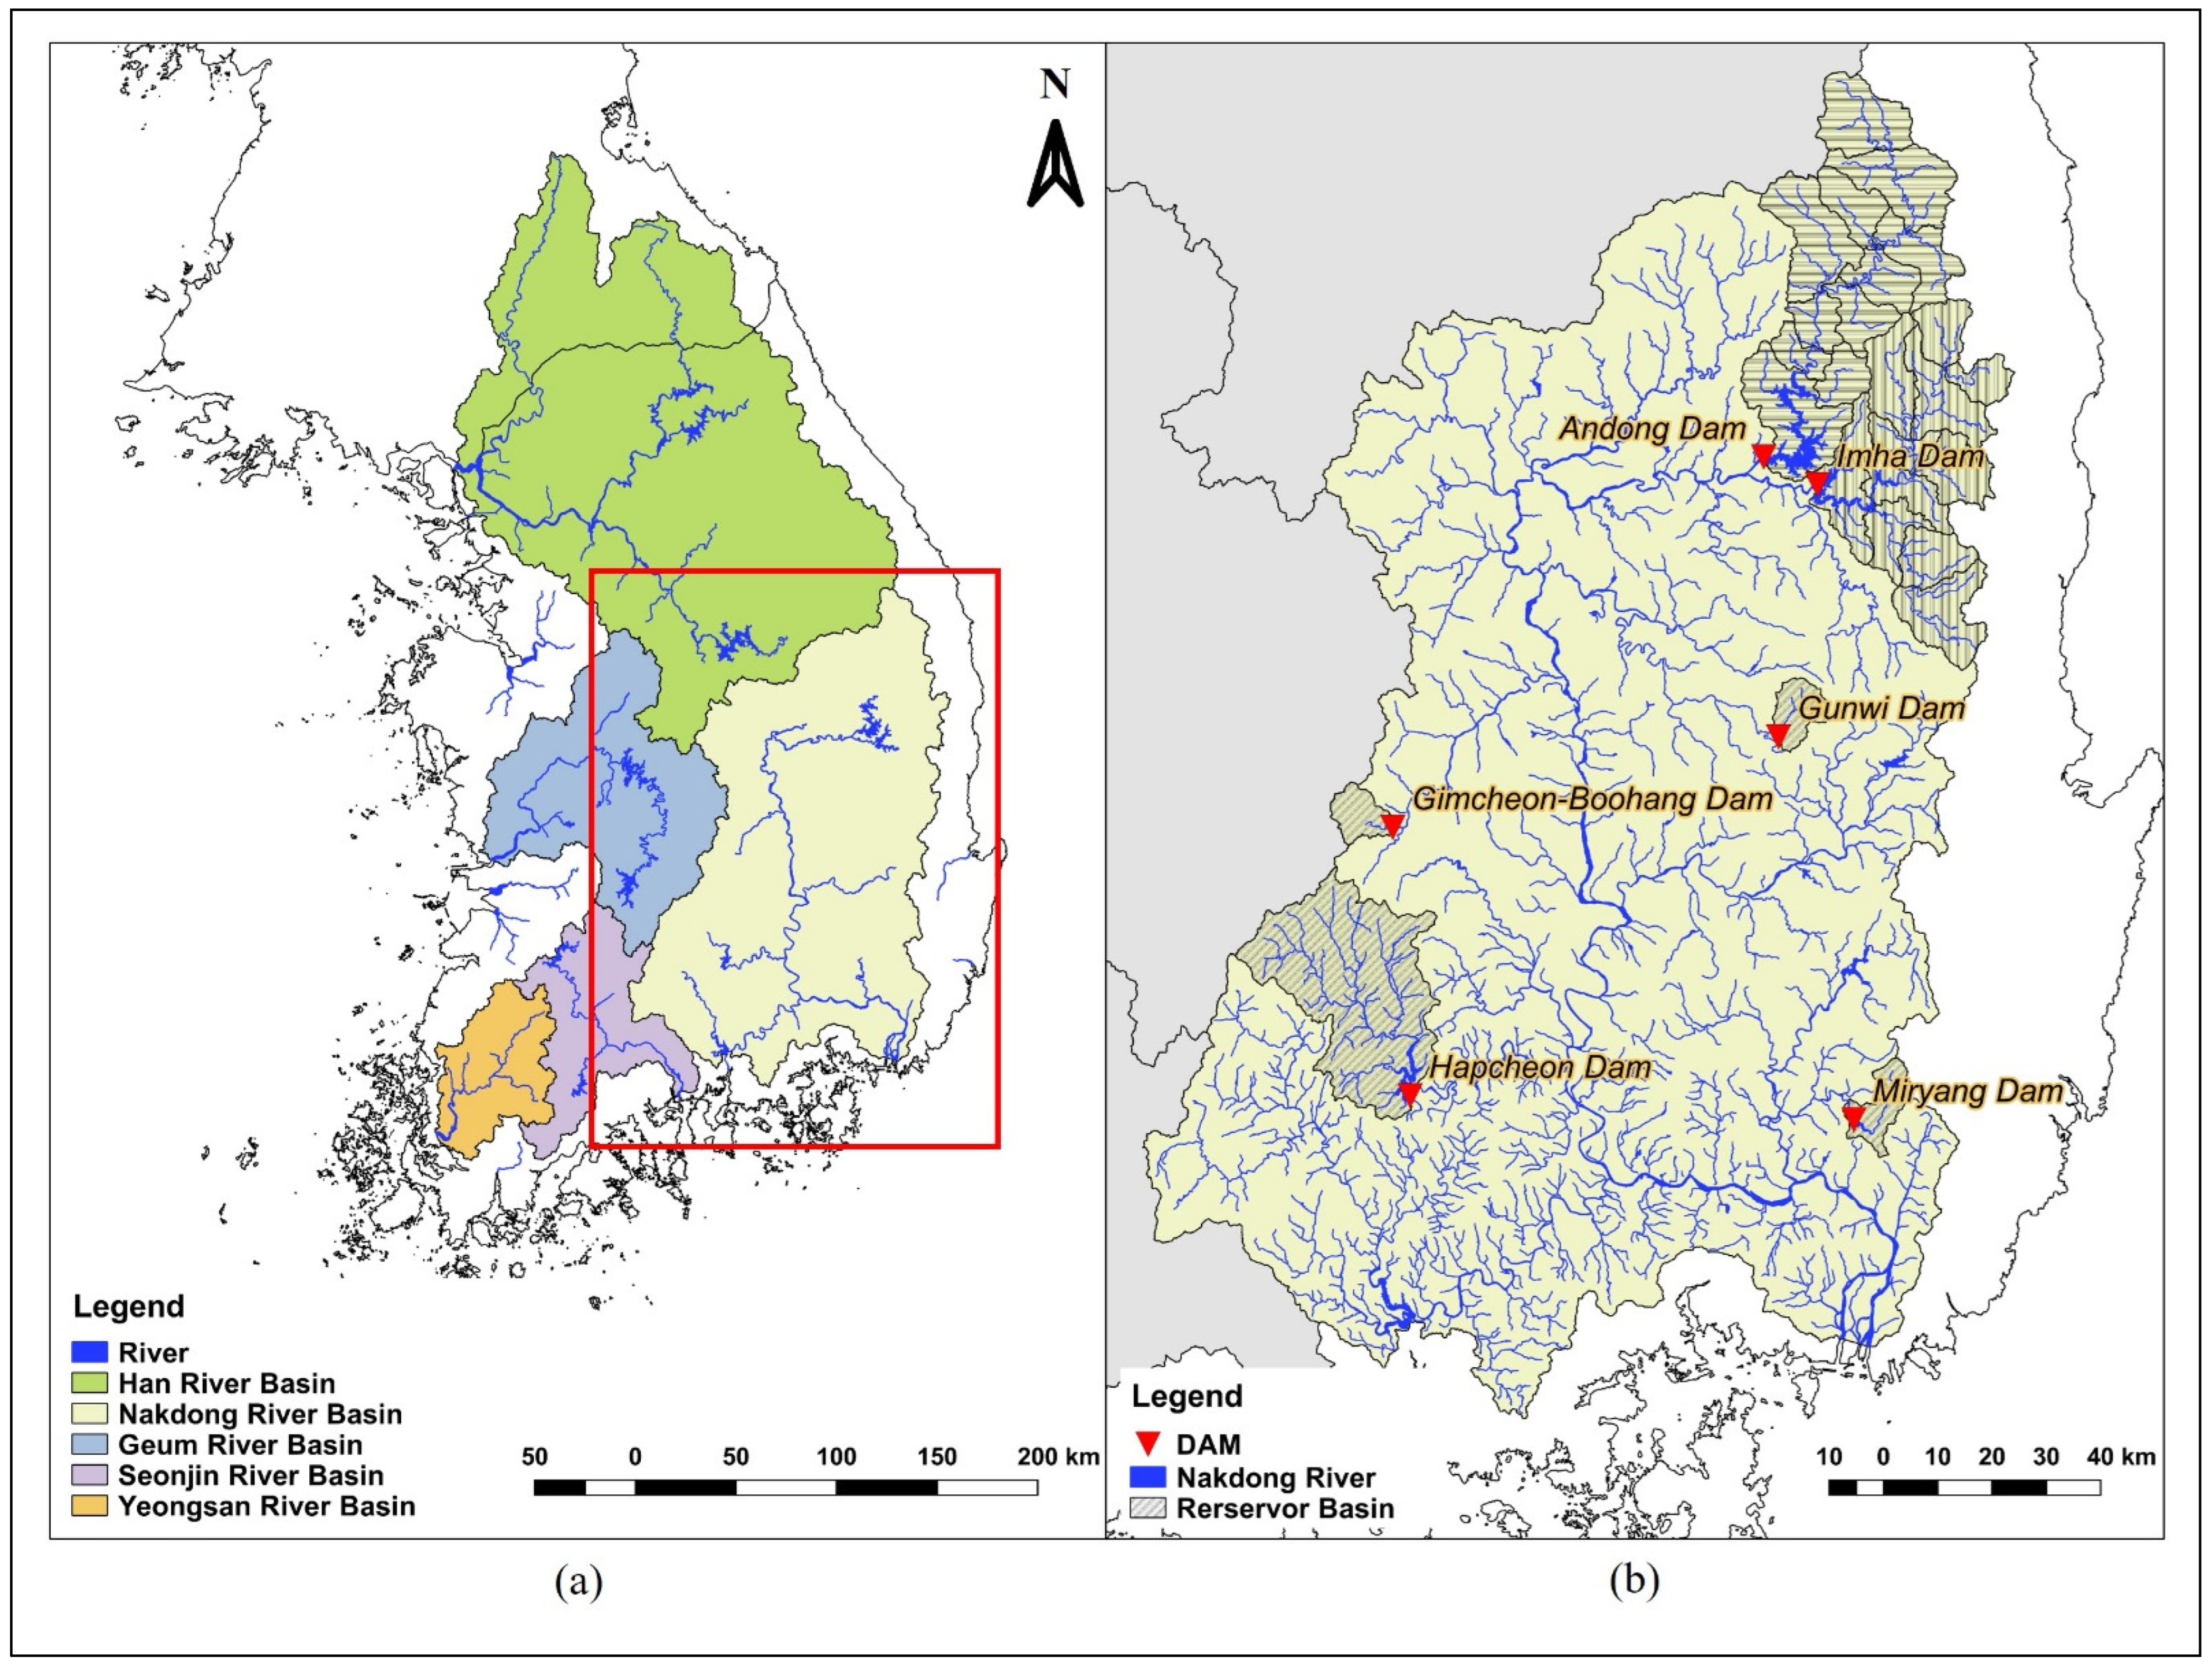
South Korea’s four major rivers are Han, Nakdong, Geum, and Yeongsan. This study investigates the Nakdong River, which is the longest river (522 km) and the second largest basin (23,717 km2) in South Korea (Figure 1a). We choose this Basin as it receives the least amount of precipitation (average annual precipitation of 1320 mm) than other major river basins (Table 1). The rainy season in South Korea typically lasts from July to September, when two-thirds of the annual rainfall occurs, and the rest (one-third) of precipitation occurs from October to June. Thus, the concentrated rainfall during the rainy season leads to flooding, and insufficient rainfall during the dry season leads to drought. Therefore, South Korea is prone to both flood and drought. This Basin has nine multipurpose reservoirs that supply water for domestic, industrial, agricultural, and instream flow. We analyze six multipurpose reservoirs that already have Standard (Figure 1b). Andong and Hapcheon are the largest reservoirs, while Hapcheon and Imha reservoirs have the largest emergency storage (Table 2). We consider Andong and Imha reservoirs as a single reservoir as they are connected through a channel and operated together.
2.2. Emergency Storage
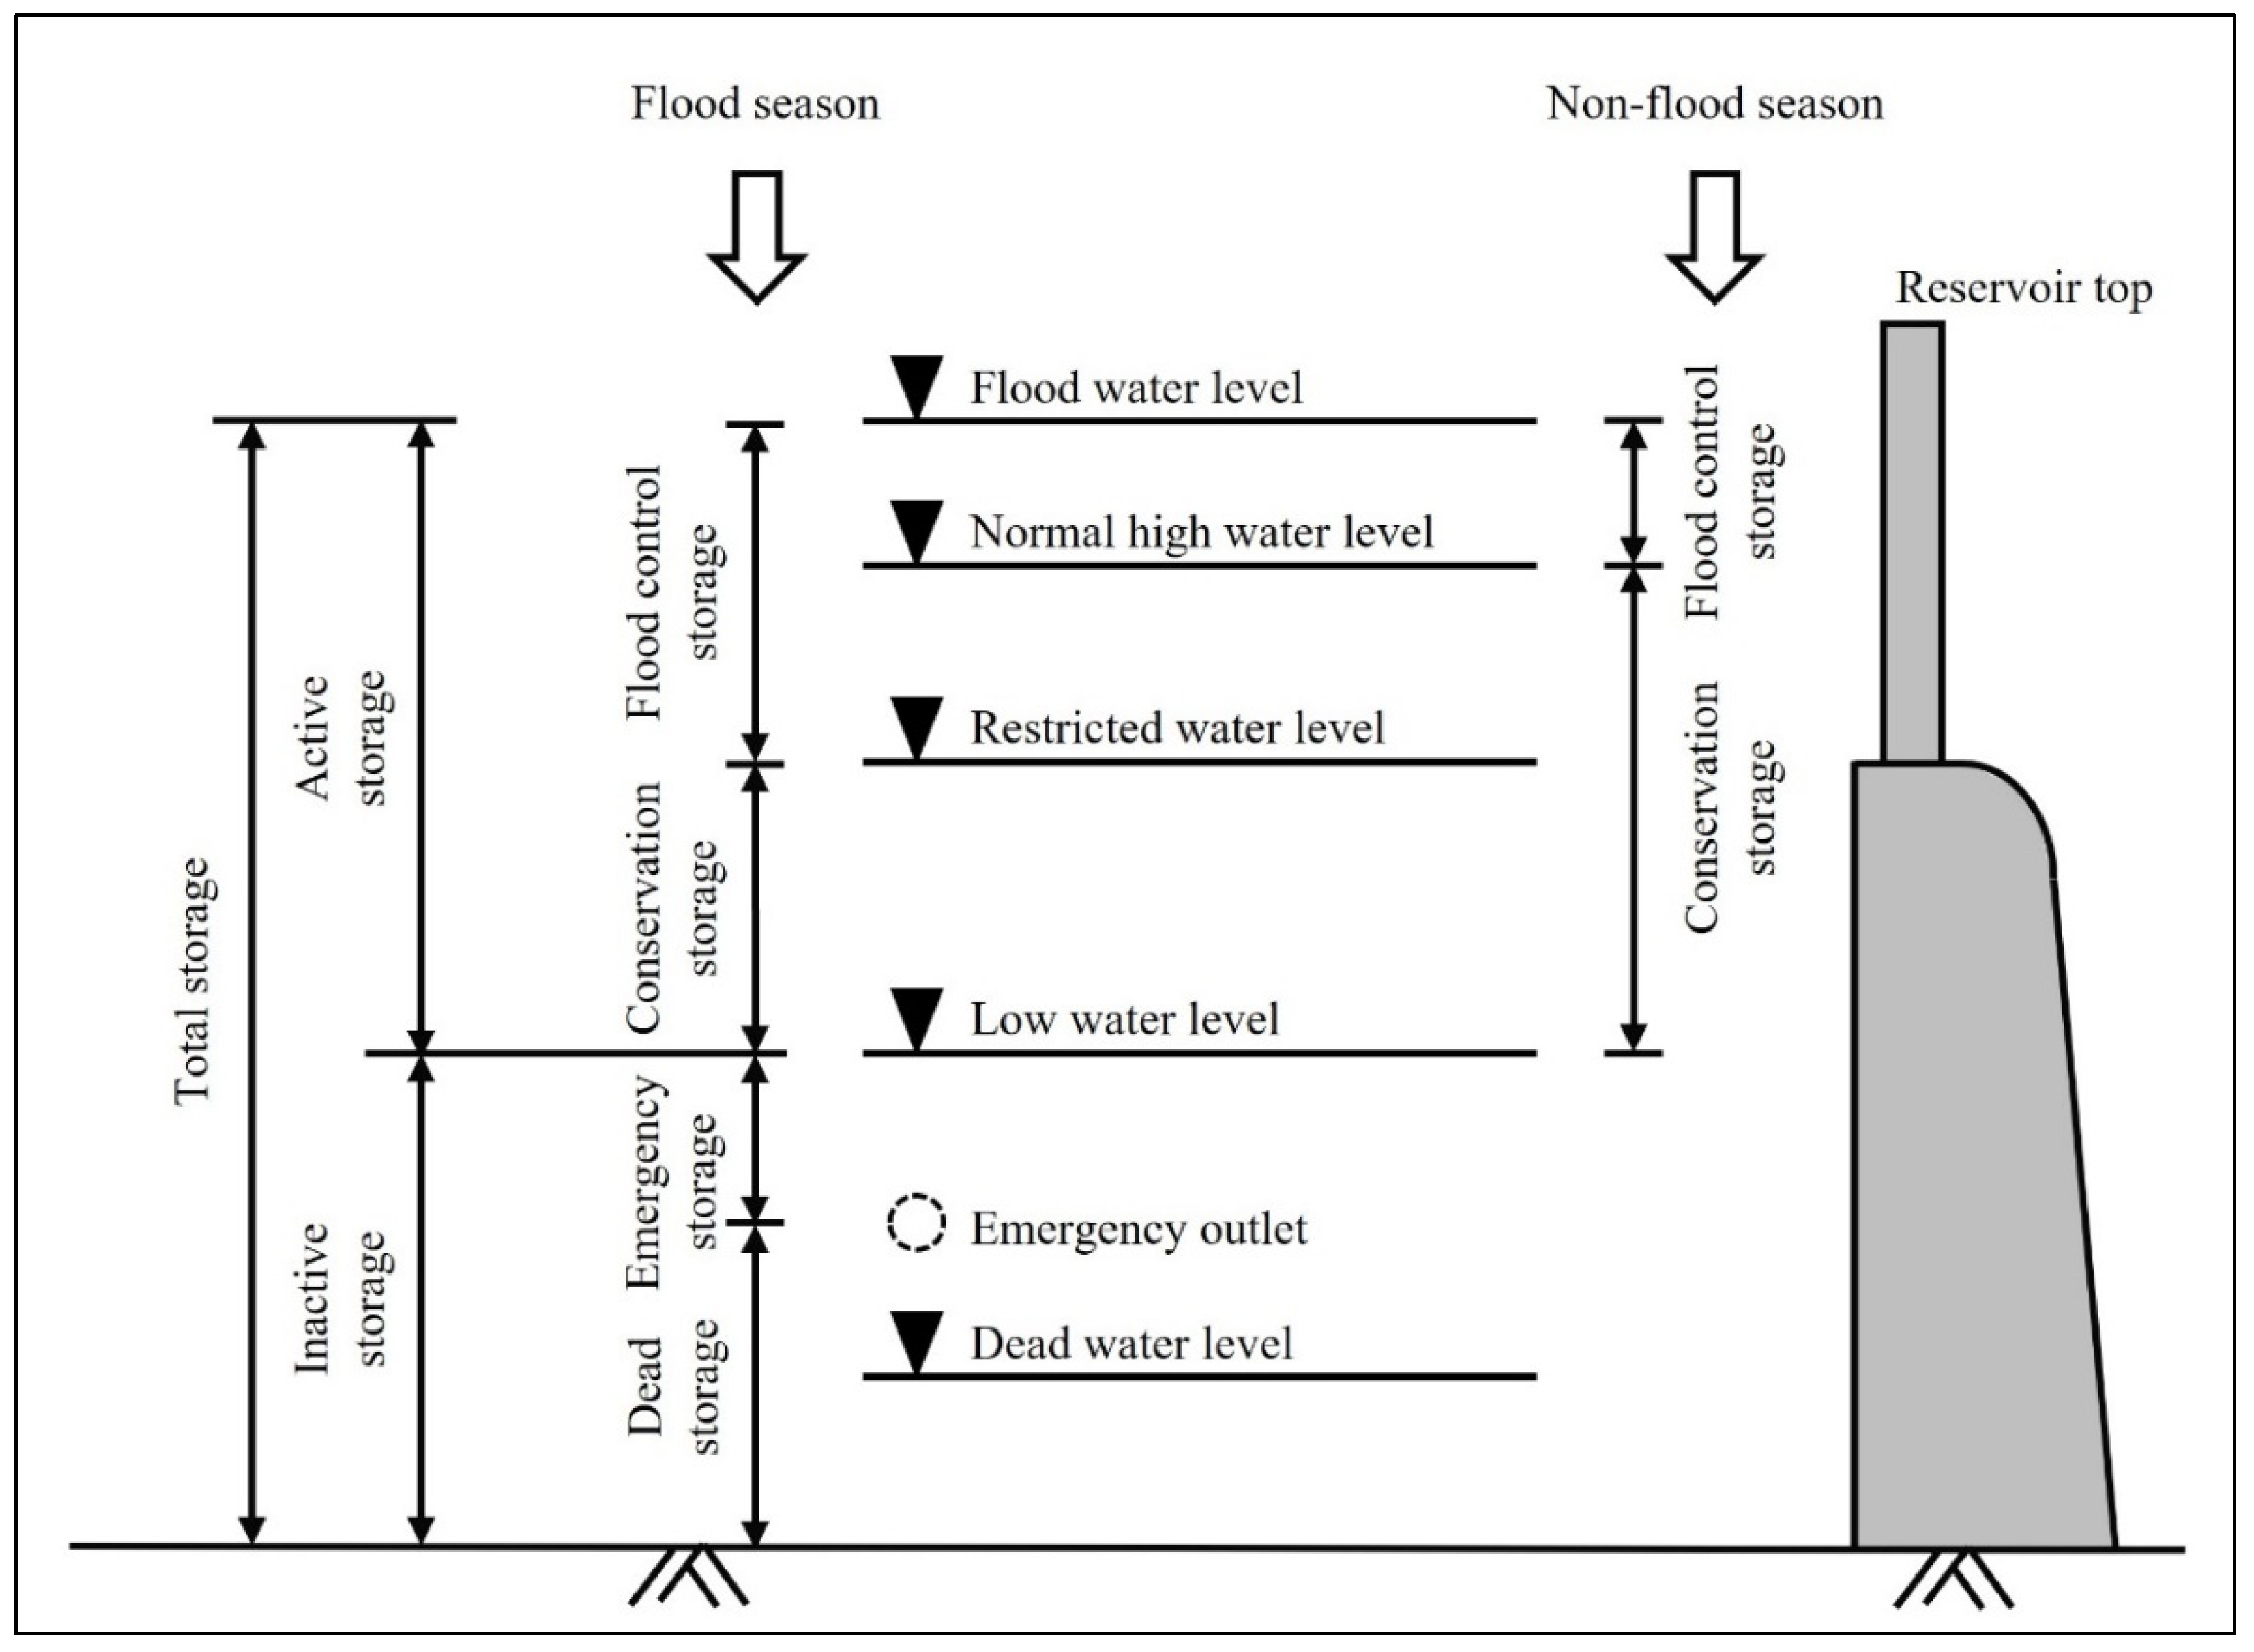
The multipurpose reservoirs in South Korea have emergency storage between the low and energy outlet levels (Figure 2). The purpose of emergency storage is to supply water during unusual or emergency conditions. The storage of a multipurpose reservoir is categorized into active and inactive storage. The active storage is categorized into conservation storage (for water supply) and flood control storage (for flood control). Conservation storage is storing water in the rainy season and using it for downstream water demand. Flood control storage is storage between the flood water level and the normal high water level in the non-flood season and between the flood water level and restricted water level in the flood season. Inactive storage refers to a reservoir water capacity below the low water level. Inactive storage divides into emergency storage and dead storage based on the emergency outlet level. The water in emergency storage is unavailable for water supply during the normal seasons. However, the water in the emergency storage (above the emergency outlet) becomes available for emergency water use and supplies water only during emergency events (e.g., extreme drought). The dead storage is storage in a reservoir that cannot be drained by gravity through the reservoir’s outlet works. Withdrawing water from the dead storage requires separate facilities to pump out the water. The water in the dead storage is unavailable for use under normal circumstances.
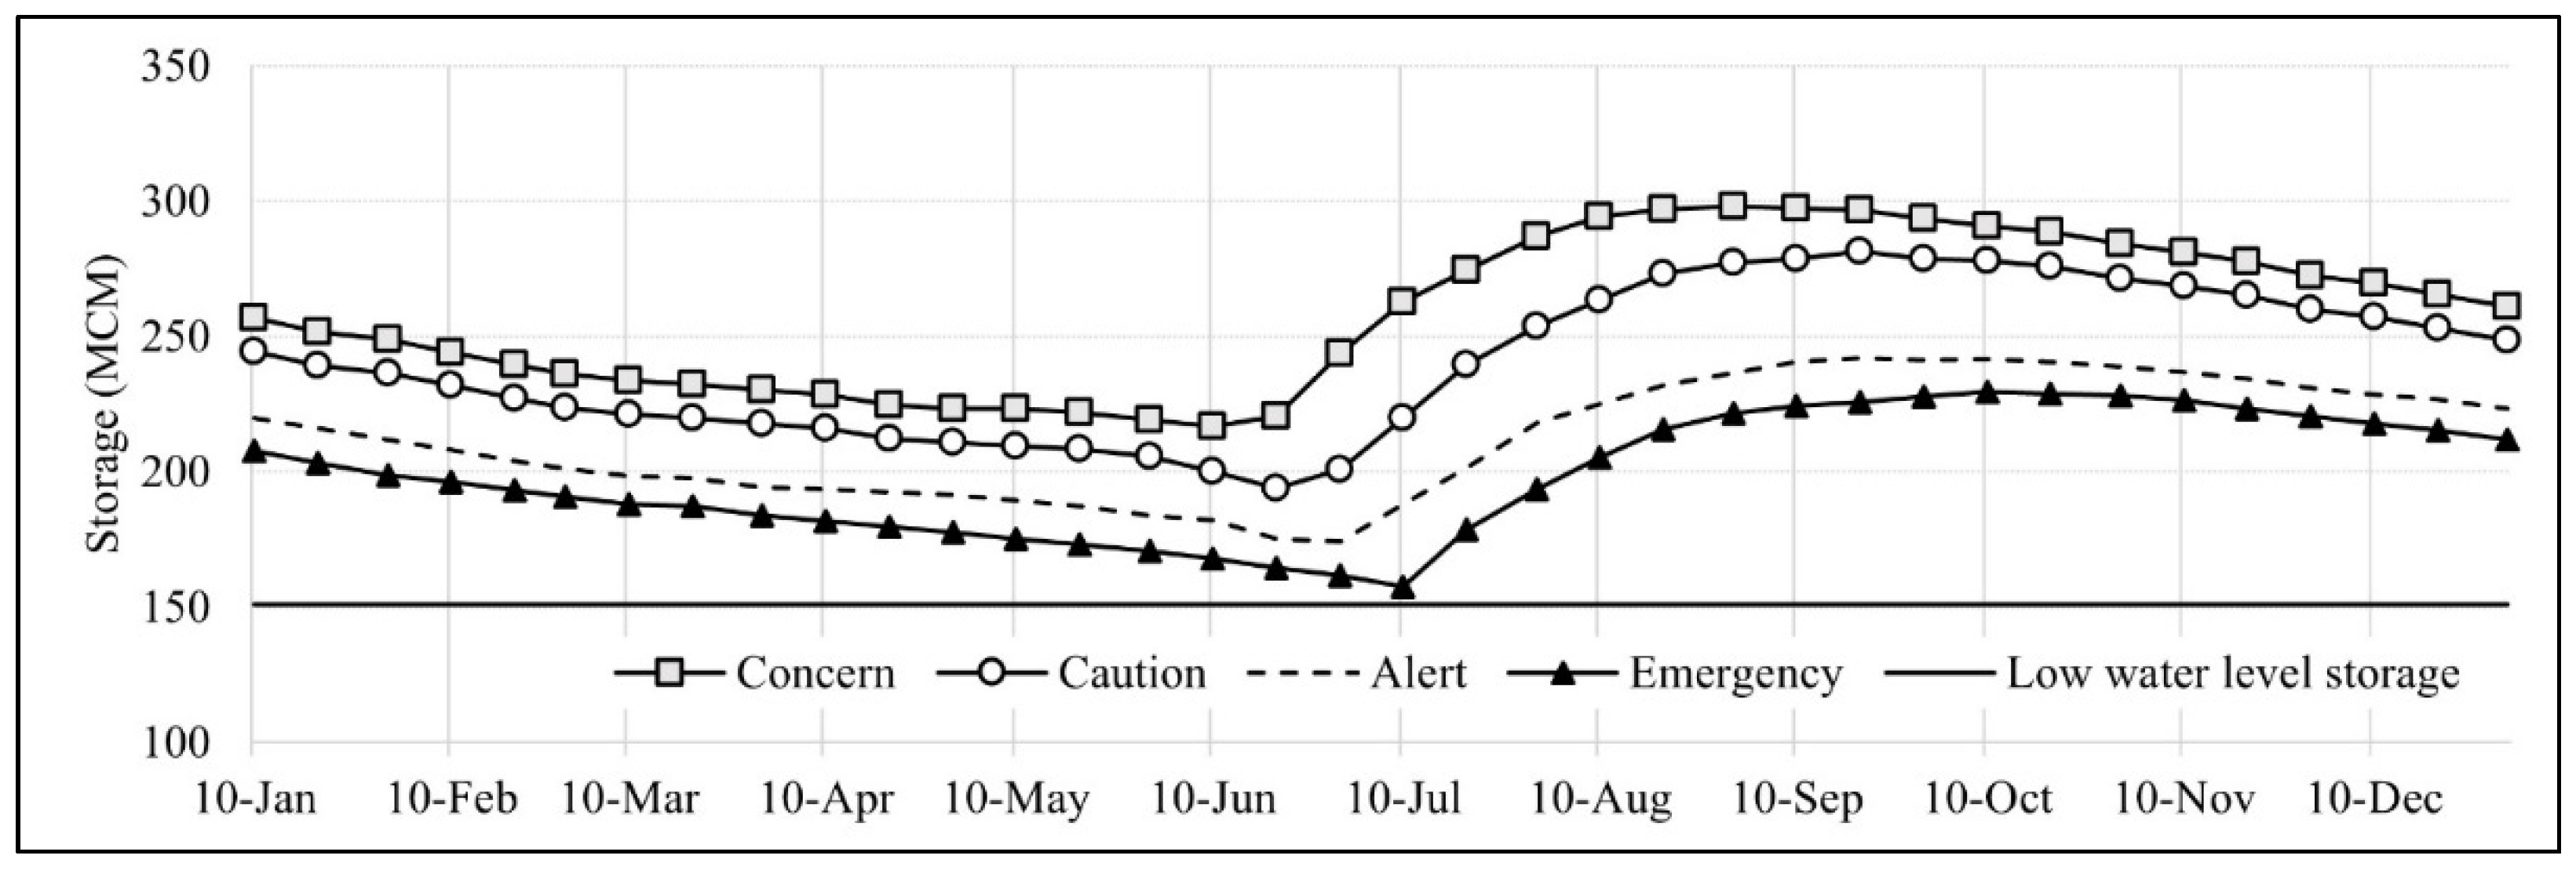
The Standard categorized reservoir storage into four stages: Concern, caution, alert, and emergency (Table 3 and Figure 3). The Concern stage is reducing the uncontracted domestic and industrial water supplies. The Caution stage is reducing the same amount of water supply from the concern stage and instream flow. The Alert stage is reducing the same amount from the caution stage and water supply from the agricultural sectors. The irrigation water supply is reduced 20% from April to June, 30% from July to September. The emergency stage is reducing the same amount as the alert stage and an additional 20% reduction from the domestic and industrial water use sectors. This Standard is like the hedging rule in controlling the reservoir water supply and securing the water resources for the upcoming extreme drought. The Standard reduces the water supply ahead of the drought to secure the water and mitigate water shortages during drought.
2.3. Model Framework
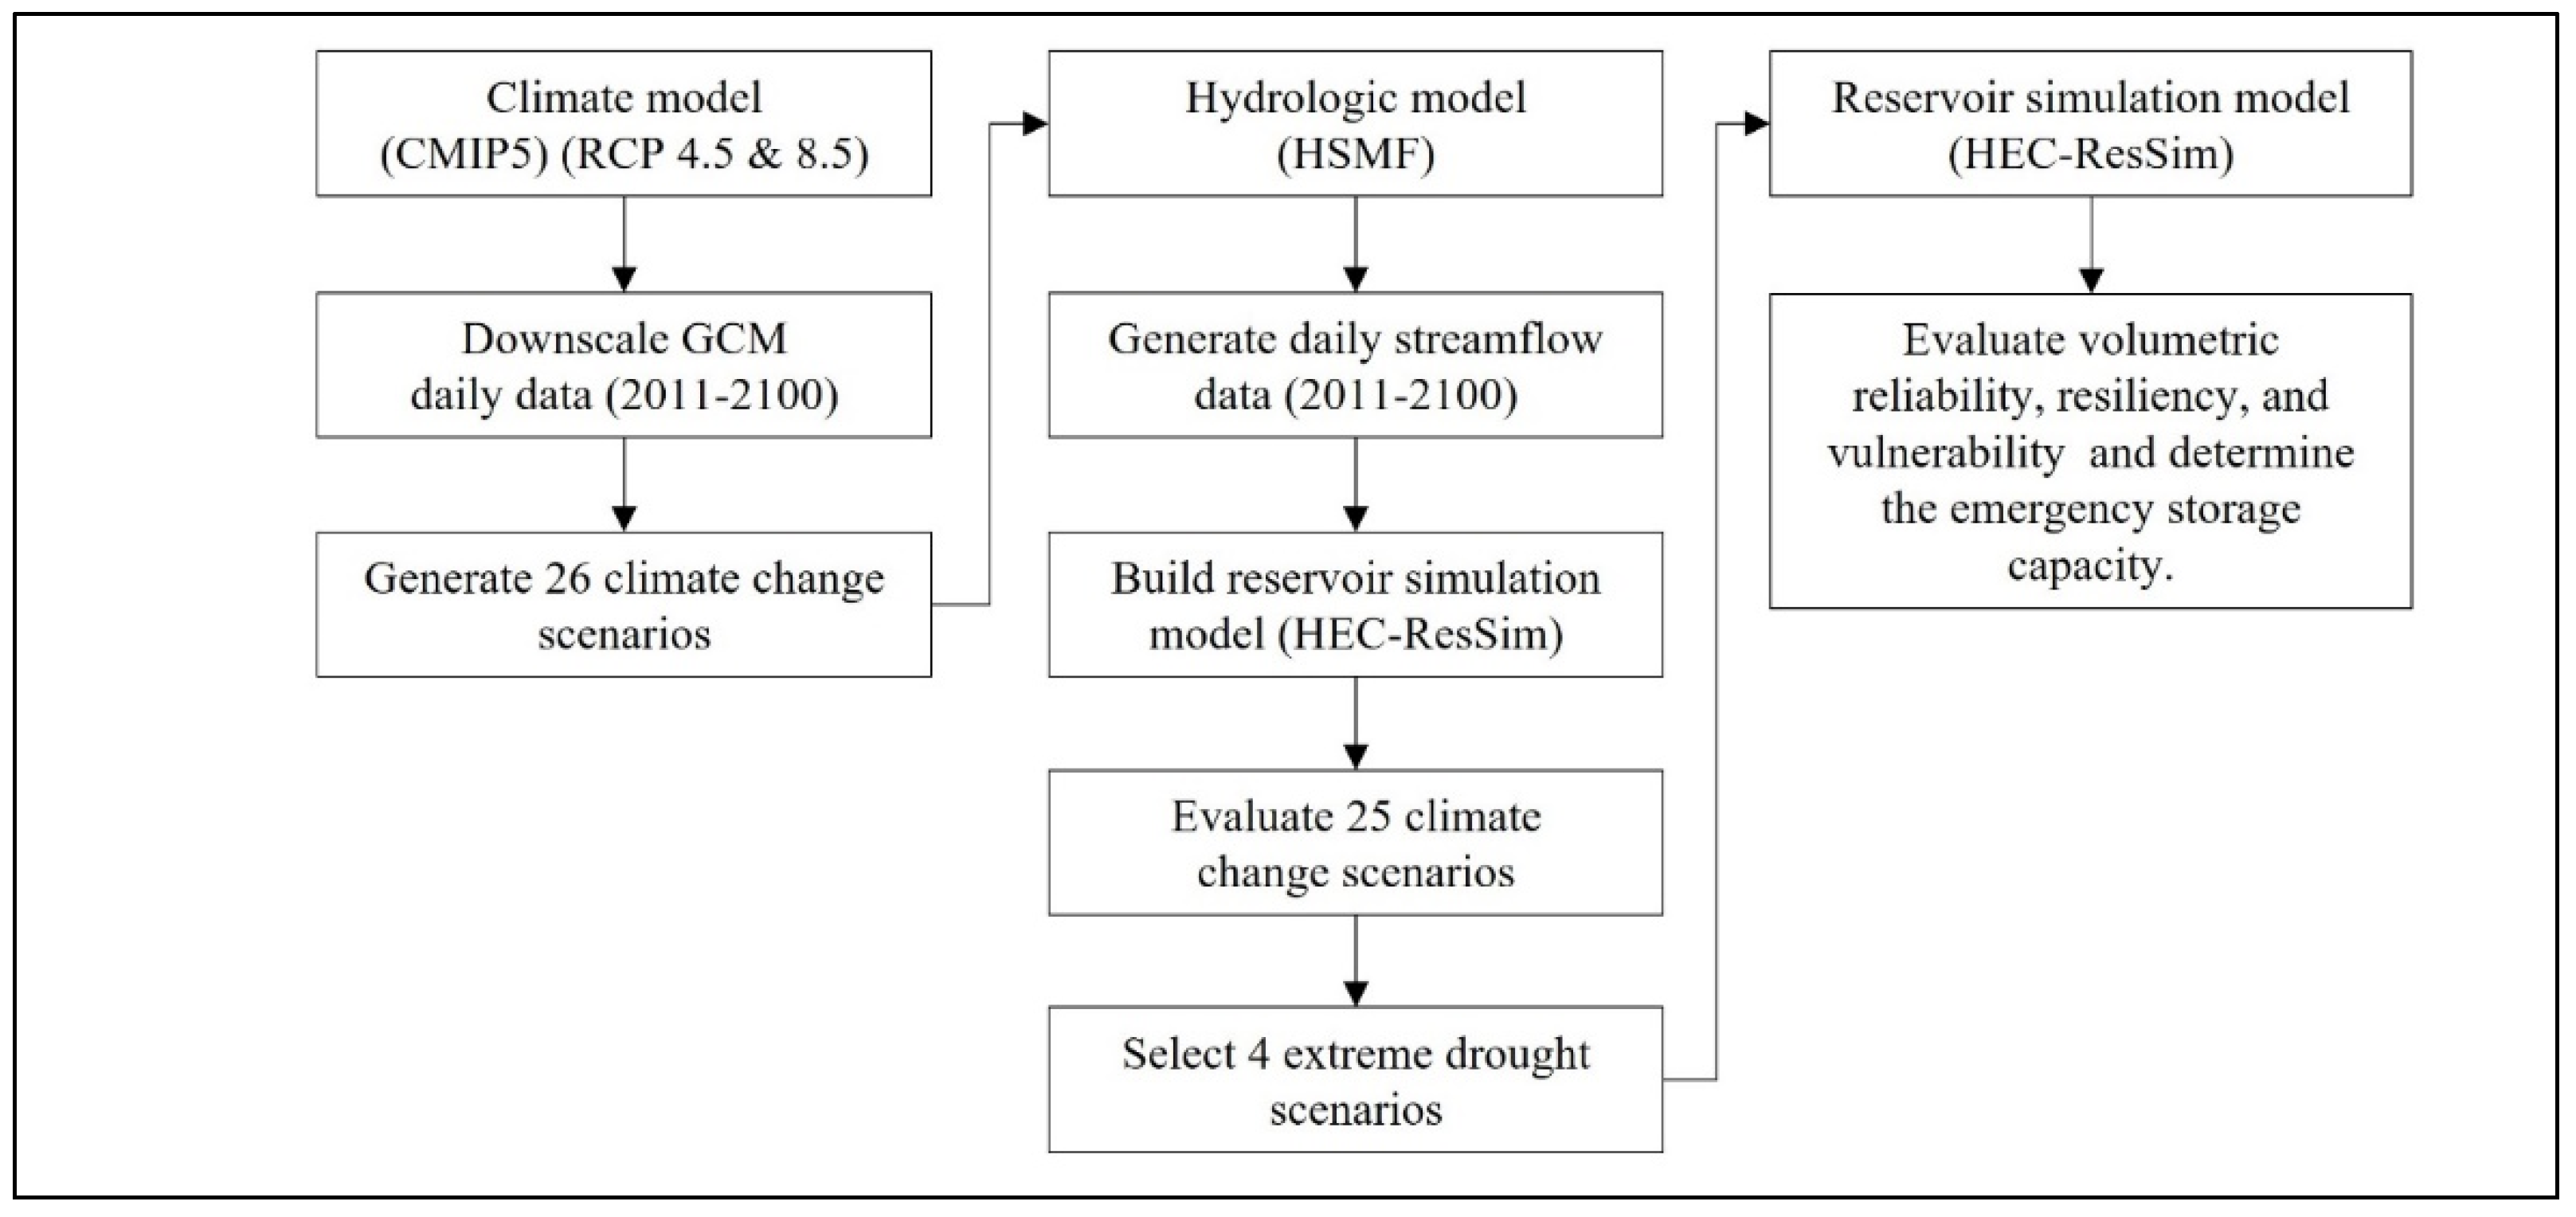
The main workflow of this study is from the reservoir simulation model step (Figure 4). Prior steps include building a climate model, downscaling the climate change scenarios, generating the final climate change scenarios, building hydrologic model, and generating streamflow data. The Coupled Model Intercomparison Project Phase 5 (CMIP5) is an ensemble model from the United Nations Intergovernmental Panel on Climate Change (IPCC) Fifth assessment report that reflects the Asian–Australian monsoon climate [35]. IPCC provides Representative Concentration Pathway (RCP) 2.6, 4.5, 6.0, and 8.5. We select and apply RCP 4.5 (decreases the temperature and increases precipitation) and RCP 8.5 (reduces the precipitation and increases temperature) [36]. The input dataset for climate change scenarios is 60 Automated Synoptic Observation System observation points. Output from CMIP5 requires a downscaling process to improve the low spatial resolution [37]. Korea’s Asia-Pacific Economic Cooperation Climate Center (APECC) uses Spatial Disaggregation and Quantile Delta Mapping for downscaling the data [38]. These downscaled climate change results become input data for the Hydro-logic Simulation Program-Fortran (HSPF) model [39]. HSPF model is a rainfall-runoff model that produces the daily reservoir inflow data from 2011 to 2100 (90 years). We divided the reservoir inflow data into Period (P)1 (2011 to 2040), P2 (2041 to 2070), and P3 (2071 to 2100). We use these generated reservoir inflow data from HSPF model as input data for the reservoir simulation model.
We build and run the reservoir operation simulation model to select the extreme drought scenarios from 25 climate change scenarios. Some o well-known reservoir simulation models are HEC-ResSim [40], River and Reservoir Operations [41], Modified SIMYLD [42], Corps Water Management System [43] and Water Evaluation and Planning system [44]. These reservoir simulation models are fundamentally similar, but they are different in computing algorithms, organizing structure, applying user interface, and managing data mechanism [45]. We choose HEC-ResSim 3.3 software as it is specifically designed for simulating reservoir operation that resembles the actual reservoir operation. The US Army Corps of Engineers developed this software, which has been widely used for simulating the reservoir operation worldwide [46] and in South Korea. Studies used this software to simulate reservoir operation in dry [47] and flood seasons [48]. The main input data are aerial map, channel data, evaporation data, gage data, hydraulic structure outflow data, reservoir storage, and inflow data [49]. The time-step of reservoir simulation period is set to be five days as the South Korea Water Plan uses five day period to analyze the national water budget [50].
We select the Hapcheon reservoir, which has the largest ratio of emergency storage to water conservation storage, to simulate and select the extreme drought scenarios. Here, we define an extreme drought as when a single drought lasts for long periods without recovering to the water supply level. A less extreme drought event is when the water level drops below the water supply level, but it recovers to the water supply level quickly. The criteria for selecting the extreme drought scenarios include the number of days when the water supply failed, the total water supply shortage, the number of water supply failures, the maximum duration, and the maximum shortage of water supply failure. We consider the maximum duration and the maximum shortage of water supply failure as two crucial criteria that indicate the severity of drought.
2.4. Cases for Reservoir Operation
We design three reservoir operation cases that either considers or ignores the Standard and emergency storage utilization conditions.
Case 1 is the default (no action) that does not consider Standard and emergency storage. In Case 1, when the reservoir water level falls between the low and high-water level, the reservoir can supply the scheduled domestic, industrial, irrigation, and instream flow. We consider a failure when the reservoir water level reaches a low water level and cannot meet the scheduled water demand.
Case 2 considers both Standard and emergency storage. Cases 2 and 3 curtail the water supply for the current demand to alleviate the potential water shortage in the future, even though sufficient water is available to meet the current water demand. Both cases increase water stored in the reservoir by accepting small current deficits to save water against unacceptable large deficits that are likely to occur in the future. Both cases distribute deficits in water supply across time to minimize the impact of drought. We can supply more water in Case 2 than in Case 1 as we use emergency storage when the reservoir water level reaches the low water level. In Case 2, we define a failure as when the level drops below the emergency outlet level, equivalent to the emergency outlet level.
Case 3 also considers Standard and emergency storage. According to the Standard, we are supposed to reduce 20% of water supply for the domestic and industrial sectors when the reservoir water storage reaches the emergency stage during extreme drought. However, reducing domestic and industrial water supply can be problematic for the end-users. Therefore, unlike Case 2, Case 3 does not reduce the domestic and industrial water supply even in emergency stages.
2.5. Model Performance Indices
The volumetric reliability, resiliency, and vulnerability are the common indices for evaluating the water supply capability of a reservoir [51,52]. Reliability is the probability that a water supply system is in a satisfactory state. Volumetric reliability is the ratio of the water supply to the design supply of the reservoir. The volumetric reliability equation is expressed as follows (Equation (1)).
where QD is the scheduled water supply and QS denotes the water supply shortage.
Resiliency is the water supply system’s recovery rate from a failure state to a satisfactory state. The equation for resiliency is shown below (Equation (2)).
where TF is the water supply failure duration, E[TF] is the expected value of TF, Prob {Xt∈S and Xt+1∈F} is the probability of succeeding in ensuring water supply at present and failing to ensure the water supply at the next time, and Prob {Xt∈F} is the probability of failing in water supply at present.
Vulnerability is an indicator of the severity of the water shortage when water supply fails. The vulnerability is stated as follows (Equation (3)).
where M is the number of water supply failure events, and v(j) indicates the shortage.
3. Results
We simulated and selected the scenarios that required emergency storage during extreme drought (Table 4). In Table 4, the worst climate change scenarios were RCP 8.5 INM-CM4, RCP 8.5 IPSL-CM5A-LR, and RCP 4.5 CMCC-CMS. We assumed that evaluating the effects of the emergency storage under the three most extreme drought scenarios could cover the other less extreme drought scenarios. For example, RCP 8.5 INM-CM4 scenario had a maximum duration of water supply failure days (307 days) and water shortage (456 MCM) (Table 5). Among the three scenarios, the RCP4.5 CMCC-CMS scenario had a minimum duration of water supply failure days (267 days) and water shortage (404 MCM).
Table 6 shows results for only five reservoirs because we consider Andong and Imha reservoirs as a single reservoir. For Andong-Imha, Milyang, and Gimcheon-Boohang reservoirs, the reservoir water level did not drop below the average low water level when we applied the Standard (Table 6). The average low water levels for Cases 2 and 3 were the same in these three reservoirs. For example, in the Andong-Imha reservoir, in RCP 8.5 INM-CM4 scenario, P1 values for Cases 2 and 3 were both 154.56 m. There was no need to activate emergency storage in Andong-Imha, Gimcheon-Boohang, and Milyang reservoirs. Thus, we only analyzed the effects of activating the emergency storage in Hapcheon and Gunwi reservoirs (Figure 5 and Figure 6). For Hapcheon and Gunwi reservoirs, the volumetric reliability, and the amount of water supply for Case 1 was higher than for Cases 2 and 3 (Table 7 and Table 8). Further analysis is available in the Discussion section.
The emergency stage is the worst scenario when we reduce the same amount of water in alert stage and an additional 20% reduction from the domestic and industrial water use sectors. In Case 1, both reservoirs had the largest number of days that reached in emergency stage than the number of days that reached in concern, caution, and alert stages (Table 9 and Table 10). In Cases 2 and 3, Hapcheon and Gunwi reservoirs had larger number of days that reached the concern and caution stages, while the number of days that reached the alert stage was similar. In Cases 2 and 3, the number of days that reached the emergency stage greatly decreased compared to Case 1.
The current capacity of emergency storage in the Hapcheon reservoir is 130 MCM. The largest volume of water secured in the emergency storage for the Hapcheon reservoir was 105.92 MCM in RCP 8.5 INM-CM4 scenario during P3 (Table 11). The current capacity of emergency storage in the Gunwi reservoir is 2.4 MCM. The largest volume of water secured in the emergency storage for the Gunwi reservoir was 7.91 MCM in RCP 4.5 CMCC-CMS scenario during P1 (Table 12).
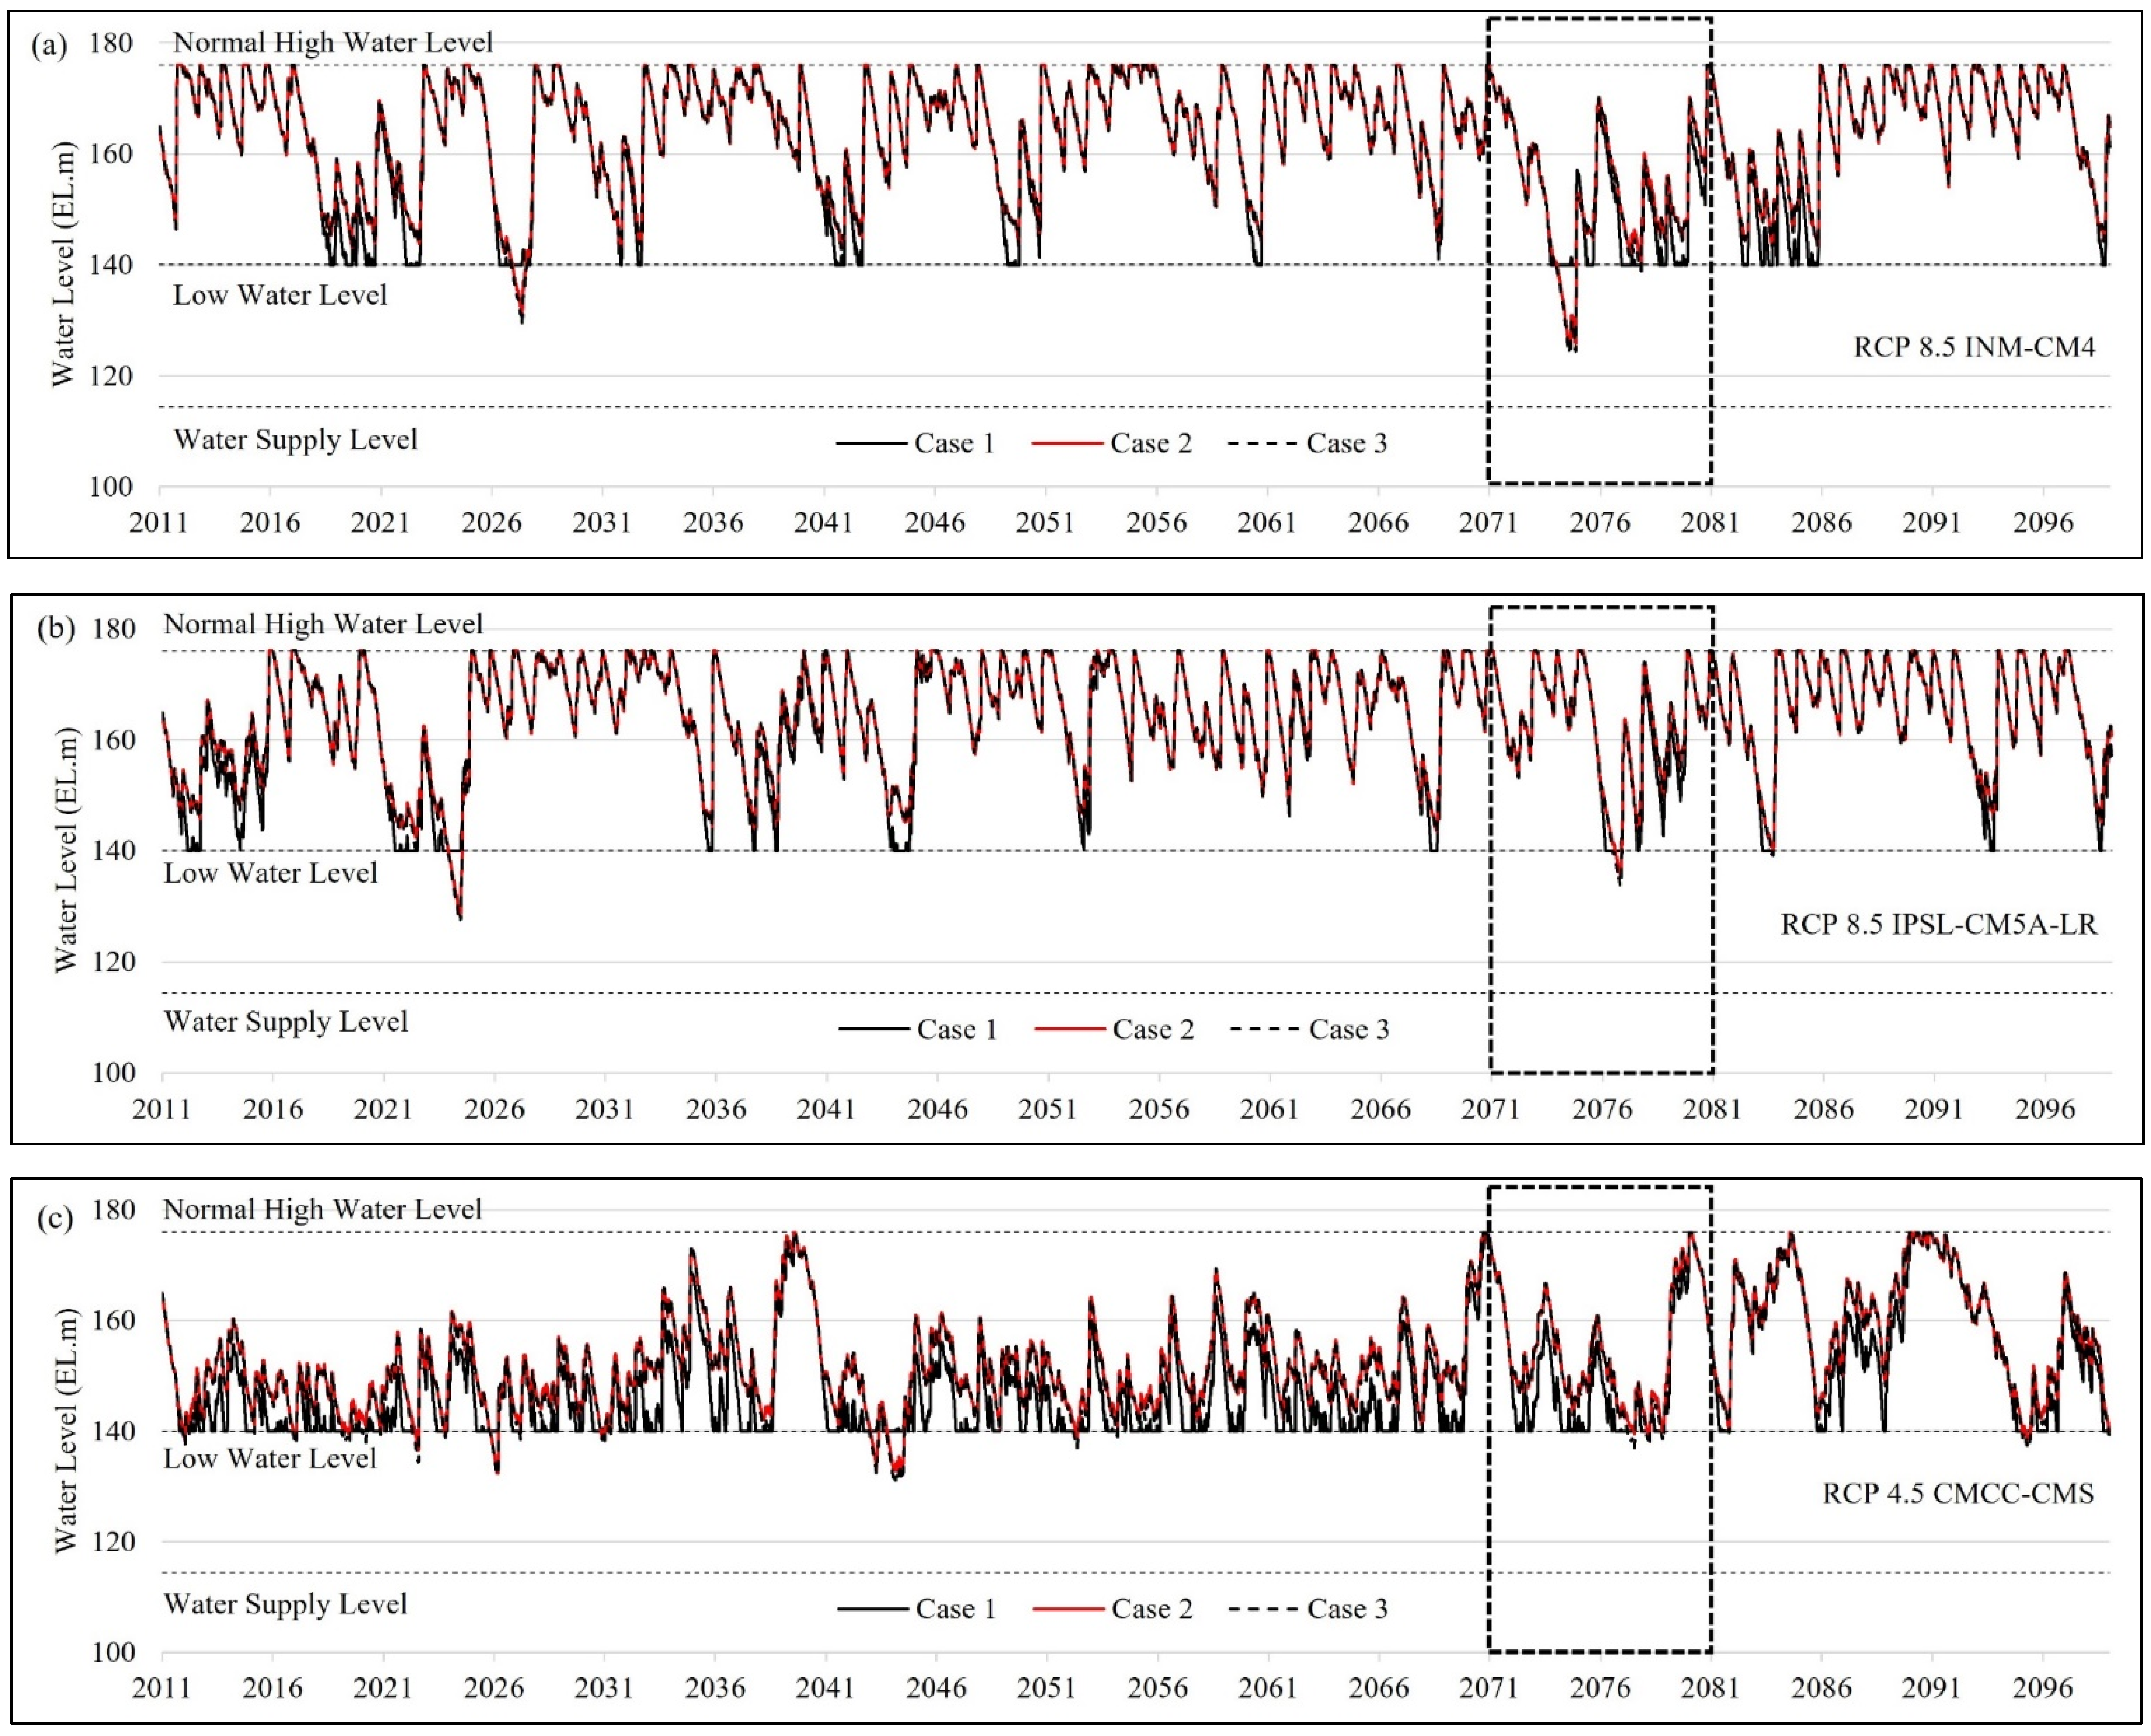
Figure 5 and Figure 6 compare Hapcehon and Gunwi reservoirs’ water levels for Cases 1, 2, and 3 in three climate change scenarios from 2011 to 2100 (90 years). These three climate change scenarios are RCP 8.5 INM-CM4 (a), RCP 8.5 IPSL-CM5A-LR (b), and RCP 4.5 CMCC-CMS (c). In Hapcheon and Gunwi reservoirs, the average low water level in Case 1 was always lower than the average low water levels in Cases 2 and 3 because Case 1 always released more water than Cases 2 and 3 (Table 6). Case 1 neglected the Standard and supplied the scheduled release requirements. Cases 2 and 3 considered the Standard that reduces the scheduled water supply depending on the current reservoir water level and utilizes emergency storage. For these two reservoirs, the average low water level in Case 3 was either the same or lower than in Case 2 because it reduced 20% of the water supply for the domestic and industrial sectors. In comparison, Case 3 provided 100% water supply for these two sectors. We found no particular pattern of changes from 2011 to 2100.
4. Discussion
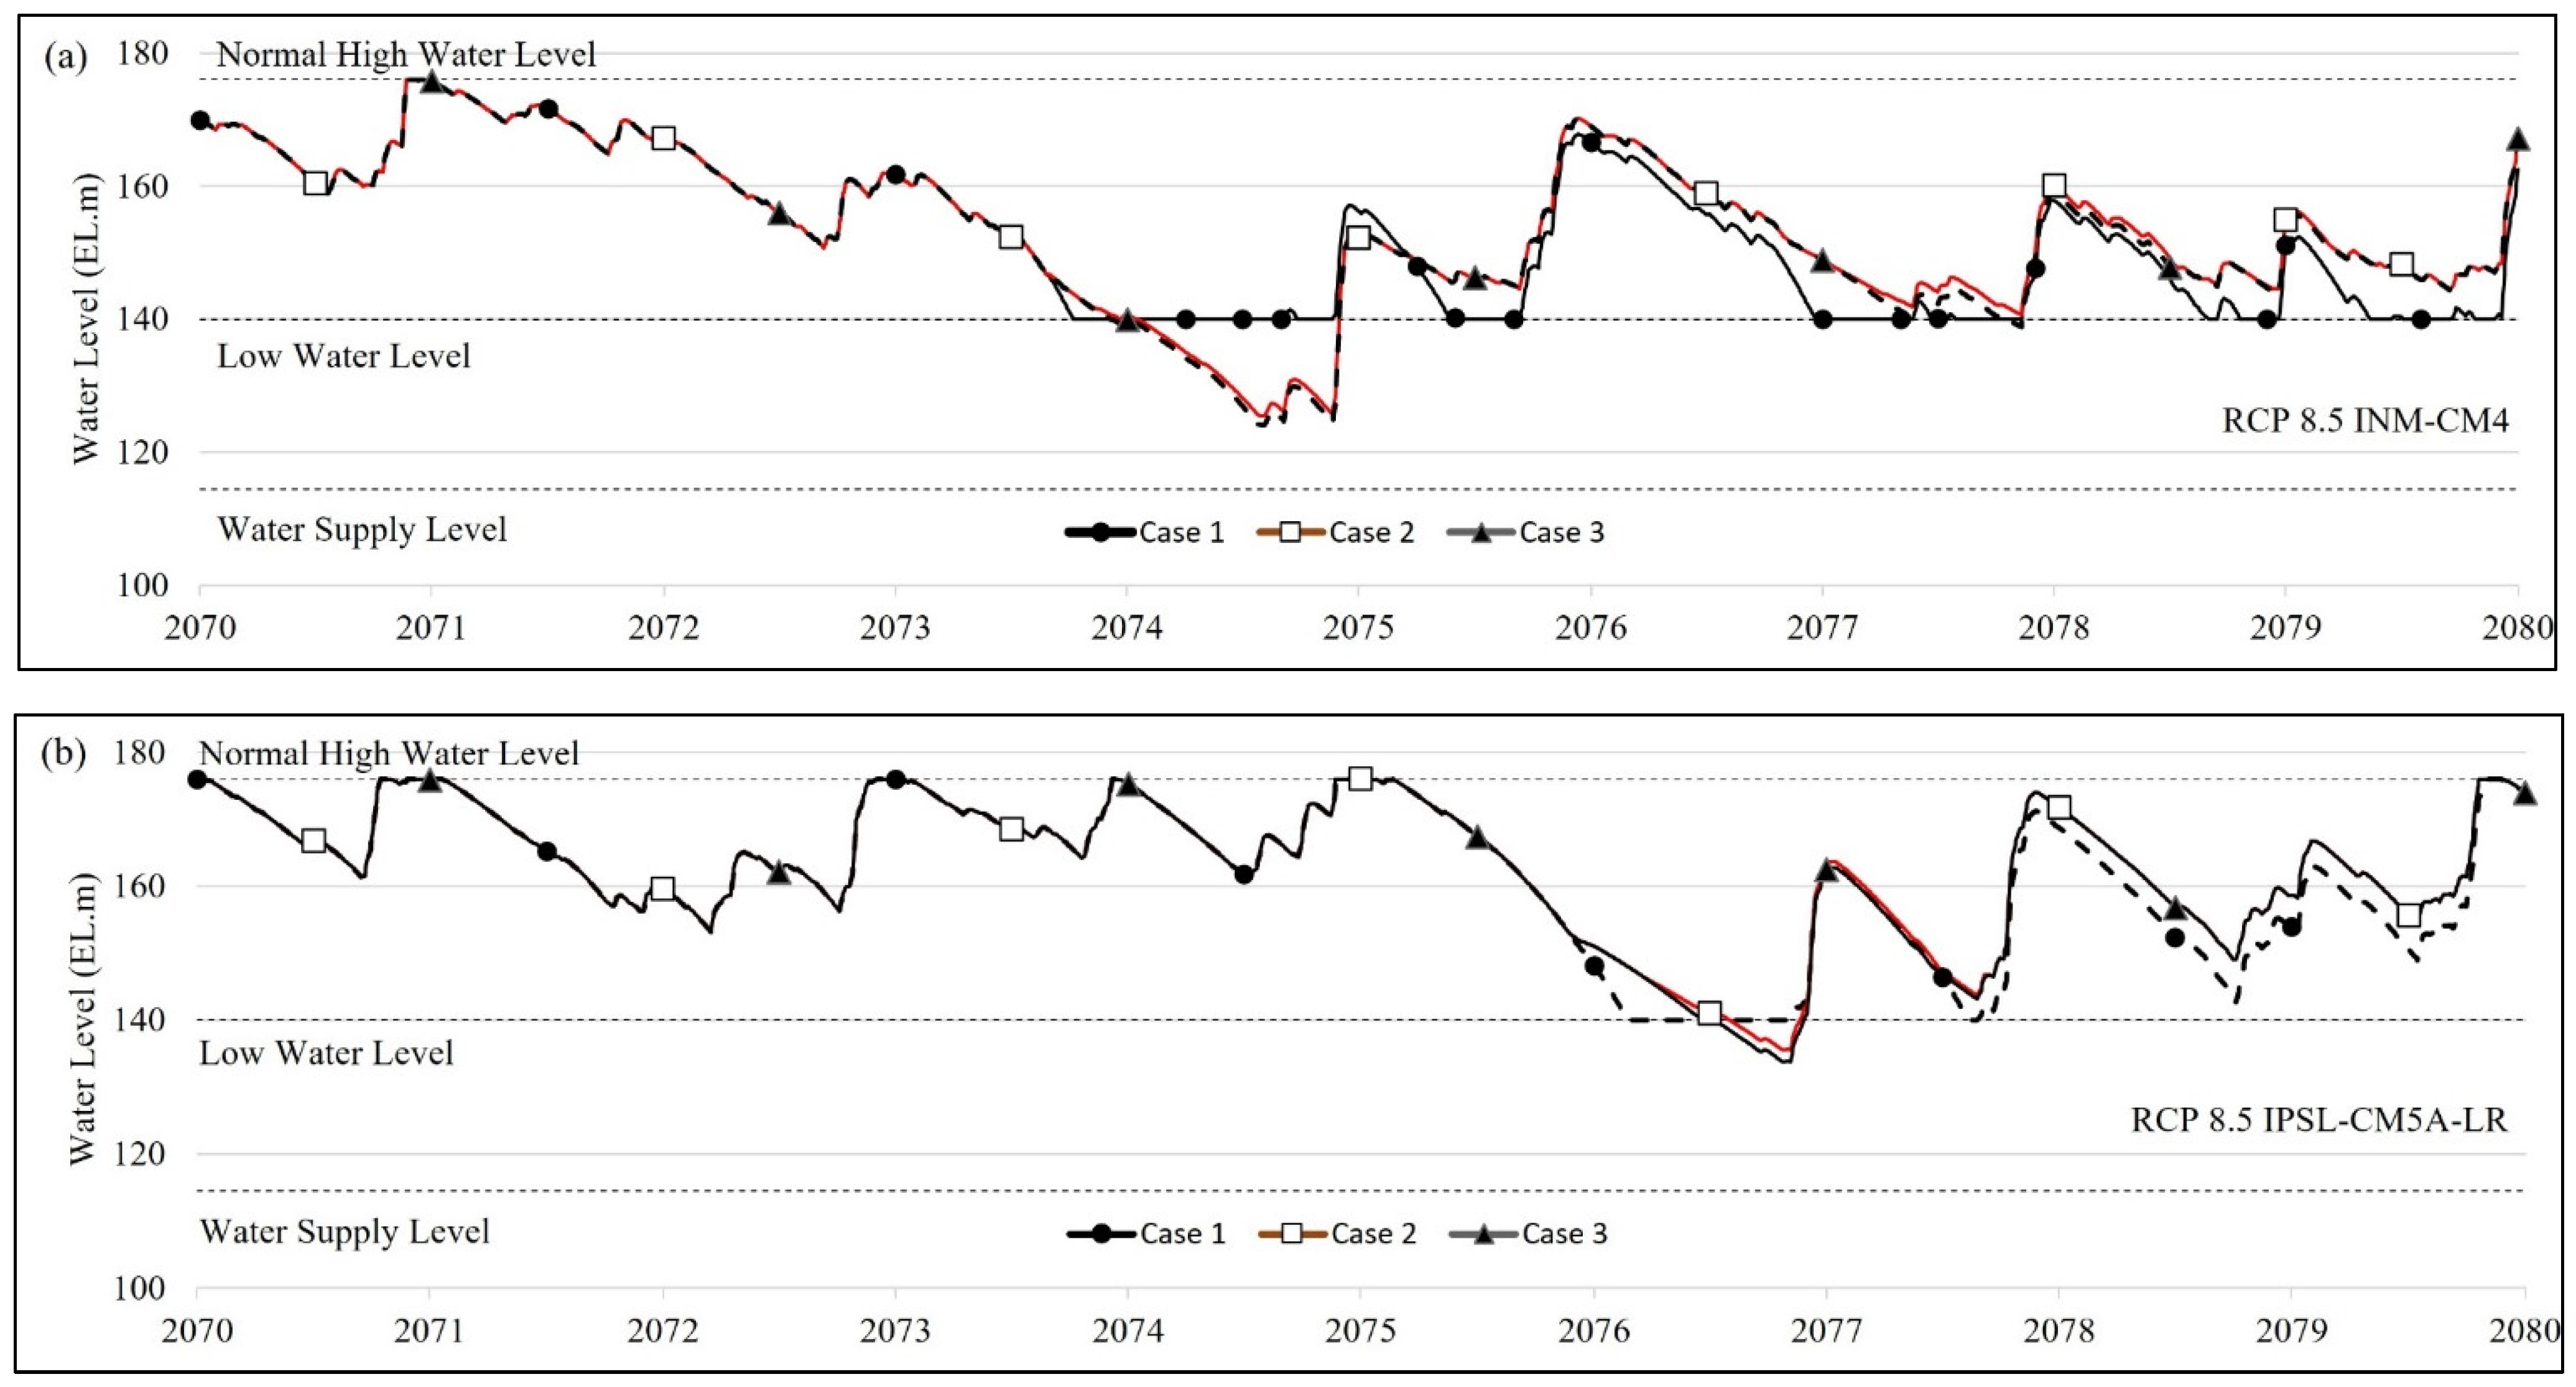
As Figure 5 and Figure 6 cover 90 years of water level fluctuation for all three cases, it is challenging to distinguish the characteristics of these three cases. Thus, we determined and extracted the extreme drought period (from 2070 to 2080) and graphed them separately in Figure 7a–c and Figure 8a–c. In Figure 7a the water level does not drop below low water level in Case 1 because Case 1 does not use the emergency storage, which is below the low water level. The water level in Cases 2 and 3 goes below the low water level because these two scenarios activate emergency storage during the severe drought. Except for this severe drought period, the water level in Case 2 was either the same or higher than in Case 3. The water level in Case 3 was the same or higher than the water level in Case 1 because Case 2 applied Standard and activated the emergency storage, and on top of these two, Case 3 did not reduce the domestic and industrial water supply.
For Hapcheon and Gunwi reservoirs, the volumetric reliability and the amount of water supply for Case 1 were higher than for Cases 2 and 3 because Case 1 attempted to meet the scheduled water demand as much as possible (Table 7 and Table 8). Cases 2 and 3 reduced the amount of water supply and saved the rest for the upcoming water shortage event, resulting in lower volumetric reliability. The downside of Case 1 was that we might not supply water at all in the future after fully supplying the scheduled amount of water. Cases 2 and 3 applied Standard and reduced the amount of water supply without fully meeting the scheduled water demand below the concern level. Therefore, we did not have a case of failure in Cases 2 and 3, which resulted in 0 values in resiliency and vulnerability. The climate-change-fueled extreme drought could cause damage economically and socially, especially during the emergency stage. Therefore, Cases 2 and 3 were better than Case 1 as the number of days reaching the emergency stage decreased in Cases 2 and 3.
The current emergency storage capacity of the Hapcheon reservoir (130 MCM) was more than enough to meet the scheduled water demand under extreme drought scenarios. Thus, we concluded that 110 MCM, 85% of the current emergency storage capacity in Hapchoen reservoir, meets the scheduled water demand during extreme drought. This amount of water in the emergency storage is equivalent to supplying 67 days of scheduled water supply. We could use an extra 20 MCM of water reserved for emergency storage for the active storage. However, the current emergency storage of the Gunwi reservoir (2.4 MCM) was insufficient. Thus, we concluded that 8 MCM, 350% of the current emergency storage capacity in Gunwi reservoir, can meet the scheduled water demand under extreme drought. This amount of water in the emergency storage is equivalent to supplying 76 days of scheduled water supply.
5. Conclusions
As climate change exacerbates, the current reservoir storage in South Korea is insufficient to meet the water demand. No study has yet evaluated the effects of activating the reservoir emergency storage in response to upcoming extreme drought. The scientific value of this study is assessing the effects of emergency storage and determining the capacity of the emergency storage to meet the water demand under extreme drought. We built a reservoir simulation model and determined the extreme drought scenarios and emergency storage capacity to meet the scheduled water demand.
We concluded that Andong-Imha, Milyang, and Gimcheon-Buhang reservoirs could meet the water demand without applying the Standard and activating the emergency storage. However, Hapcheon and Gunwi reservoirs can benefit from applying the Standard and activating emergency storage during extreme drought. The current emergency storage capacity of the Hapcheon reservoir (130 MCM) was more than enough to meet the scheduled water demand under extreme drought scenarios. Thus, we concluded that 110 MCM, 85% of the current emergency storage capacity in Hapcheon reservoir, meets the scheduled water demand during extreme drought. However, the current emergency storage of the Gunwi reservoir (2.4 MCM) was insufficient. Thus, we concluded that 8 MCM, 350% of the current emergency storage capacity in Gunwi reservoir, can meet the scheduled water demand under extreme drought.
The number of days in the emergency stage has significantly reduced in Cases 2 and 3 in comparison to Case 1. Case 1 is designed to fully provide the scheduled amount of water, while Cases 2 and 3 reduced the water supply in preparation for the drought season to reduce the days remaining in the emergency stage. In other words, we determined that reducing the number of days in the emergency storage is beneficial by increasing the number of days in the other stages, such as concern, caution, and alert. This result indicated that applying Standard and activating the emergency storage is beneficial in securing additional water for domestic and industrial use.
There are some limitations to this study. One way to verify the results is to compare them to other studies with a similar research topic. A limitation of this study was not having similar research available to compare and verify the results. We should not exclude the possibility of experiencing more extreme drought than the scenarios we evaluated in this study. In that case, our estimated energy storage capacity is insufficient to meet the scheduled water demand. We should consider conserving or recycling water as alternatives to meet the scheduled water demand during more extreme drought.
A future study includes revising the Standard incorporating drought frequency when estimating emergency storage. The current Standard by the Korean Ministry of Environment (revised in 2022) does not consider emergency storage. Another futures study is assessing emergency storage with the revised Standard that counts in the emergency storage. This study is helpful for reservoirs in the Nakdong River Basin and reservoirs in the other basins vulnerable to climate-change-fueled extreme drought. Thus, our findings can assist the reservoir managers and operators in understanding the implication of applying Standard and activating emergency storage to better meet the water demand in extreme drought. This research is a fundamental study that can help establish Standard and emergency storage activation criteria for multipurpose reservoirs in preparation for extreme drought.
Author Contributions
Conceptualization, H.C. and J.Y.; Data curation, H.C.; Formal analysis, H.C. and J.Y.; Funding acquisition, H.C. and J.Y.; Investigation, H.C. and J.Y.; Methodology, H.C. and J.Y.; Project administration, H.C. and J.Y.; Resources, H.C., J.J., E.L., S.L., Y.C., S.Y. and J.Y.; Software, H.C.; Supervision, J.Y.; Validation, H.C.; Visualization, H.C. and S.Y.; Writing—original draft, H.C., E.L., S.Y. and J.Y.; Writing—review and editing, E.L., S.Y. and J.Y. All authors have read and agreed to the published version of the manuscript.
Funding
This work was supported by Korea Environment Industry & Technology Institute (KEITI) through the Water Management Project for Drought, funded by Korea Ministry of Environment (MOE) (2022003610004).
Data Availability Statement
Not applicable.
Conflicts of Interest
The authors declare no conflict of interest.
References
- Dai, A. Drought under global warming: A review. WIREs Clim. Change 2011, 2, 45–65. [Google Scholar] [CrossRef] [Green Version]
- Intergovernmental Panel on Climate Change (IPCC). Climate Change 2021: The Physical Science Basis; Intergovernmental Panel on Climate Change (IPCC): Geneva, Switzerland, 2021. [Google Scholar]
- Boo, K.; Kwon, W.; Baek, H. Change of extreme events of temperature and precipitation over Korea using regional projection of future climate change. Geophys. Res. Lett. 2006, 33, 1–4. [Google Scholar] [CrossRef]
- Ministry of Environment. Korean Climate Change Assessment Report 2020. 2020. Available online: http://www.climate.go.kr/home/cc_data/2020/Korean_Climate_Change_Assessment_Report_2020_2_eng_summary.pdf (accessed on 20 September 2022).
- Kwon, H.; Lall, U.; Kim, S. The unusual 2013–2015 drought in South Korea in the context of a multicentury precipitation record: Inferences from a nonstationary, multivariate, Bayesian copula model. Geophys. Res. Lett. 2016, 43, 8534–8544. [Google Scholar] [CrossRef]
- Hong, I.; Lee, J.; Cho, H. National drought management framework for drought preparedness in Korea (lessons from the 2014–2015 drought). Water Policy 2016, 18, 89–106. [Google Scholar] [CrossRef]
- Ngo, L.A.; Masih, I.; Jiang, Y.; Douven, W. Impact of reservoir operation and climate change on the hydrological regime of the Sesan and Srepok Rivers in the Lower Mekong Basin. Clim. Change 2018, 149, 107–119. [Google Scholar] [CrossRef]
- Xu, W.; Zhao, J.; Zhao, T.; Wang, Z. Adaptive reservoir operation model incorporating nonstationary inflow prediction. J. Water Resour. Plan Manag. 2015, 141, 04014099. [Google Scholar] [CrossRef]
- Zhang, J.; Cai, X.; Lei, X.; Liu, P.; Wang, H. Real-time reservoir flood control operation enhanced by data assimilation. J. Hydrol. 2021, 598, 126426. [Google Scholar] [CrossRef]
- Biemans, H.; Haddeland, I.; Kabat, P.; Ludwig, F.; Hutjes, R.W.A.; Heinke, J.; Von Bloh, W.; Gerten, D. Impact of reservoirs on river discharge and irrigation water supply during the 20th century. Water Resour. Res. 2011, 47, 1–15. [Google Scholar] [CrossRef] [Green Version]
- Jamali, A.A.; Montazeri Naeeni, M.A.; Zarei, G. Assessing the expansion of saline lands through vegetation and wetland loss using remote sensing and GIS. Remote Sens. Appl. Soc. Environ. 2020, 20, 100428. [Google Scholar] [CrossRef]
- Di Baldassarre, G.; Wanders, N.; AghaKouchak, A.; Kuil, L.; Rangecroft, S.; Veldkamp, T.I.E.; Garcia, M.; van Oel, P.; Breinl, K.; Van Loon, A.F. Water shortages worsened by reservoir effects. Nat. Sustain. 2018, 1, 617–622. [Google Scholar] [CrossRef]
- Jamali, A.A.; Tabatabaee, R.; Randhir, T.O. Ecotourism and socioeconomic strategies for Khansar River watershed of Iran. Environ. Dev. Sustain. 2021, 23, 17077–17093. [Google Scholar] [CrossRef]
- Yi, S.; Kondolf, G.M.; Sandoval-Solis, S.; Dale, L. Application of Machine Learning-based Energy Use Forecasting for Inter-basin Water Transfer Project. Water Resour. Manag. 2022. [Google Scholar] [CrossRef]
- Jeong, J.; Kim, Y.; Seo, S. Evaluating joint operation rules for connecting tunnels between two multipurpose dams. Hydrol. Res. 2020, 51, 392–405. [Google Scholar] [CrossRef]
- Jang, C.; Kim, Y. Improvement of water supply capability of the Nakdong river basin dams with weirs. J. Korean Soc. Civ. Eng. 2016, 36, 637–644. [Google Scholar]
- Kim, K.; Kim, J.-S. Economic assessment of flood control facilities under climate uncertainty: A Case of Nakdong River, South Korea. Sustainability 2018, 10, 308. [Google Scholar] [CrossRef] [Green Version]
- Kim, J.; Park, J.; Jang, S.; Kim, H.; Kang, H. Improving reservoir operation criteria to stabilize water supplies in a multipurpose dam: Focused on Nakdong River Basin in Korea. Water 2018, 10, 1236. [Google Scholar] [CrossRef] [Green Version]
- Eum, H.; Simonovic, S.P. Integrated reservoir management system for adaptation to climate change: The Nakdong River Basin in Korea. Water Resour. Manag. 2010, 24, 3397–3417. [Google Scholar] [CrossRef]
- Lee, D.; Moon, J.; Choi, S. Performance evaluation of water supply for a multi-purpose dam by deficit-supply operation. J. Korea Water Resour. Assoc. 2014, 47, 195–206. [Google Scholar] [CrossRef] [Green Version]
- Ahn, J.; Lee, Y.; Yi, J. Improving the water yield capabilities using reservoir emergency storage and water supply adjustment standard. J. Korea Water Resour. Assoc. 2016, 49, 1027–1034. [Google Scholar] [CrossRef]
- Cha, S.; Park, G. A study on estimate of evaluation indices of water supply capacity for multipurpose dam. J. Environ. Sci. 2004, 13, 197–204. [Google Scholar]
- Kim, K.; Lee, S.; Jin, Y. Forecasting quarterly inflow to reservoirs combining a copula-based bayesian network method with drought forecasting. Water 2018, 10, 233. [Google Scholar] [CrossRef] [Green Version]
- Jin, Y.; Lee, S.; Jeong, T.; Kang, S. Estimation of supplement-reduction amounts of water supply in a reservoir system operation using a monte carlo simulation. J. Korean Soc. Hazard. Mitig. 2019, 19, 87–94. [Google Scholar] [CrossRef]
- Abbas, A.; Baek, S.; Kim, M.; Ligaray, M.; Ribolzi, O.; Silvera, N.; Min, J.-H.; Boithias, L.; Cho, K.H. Surface and sub-surface flow estimation at high temporal resolution using deep neural networks. J. Hydrol. 2020, 590, 125370. [Google Scholar] [CrossRef]
- Kim, J.; Jain, S.; Lee, J.; Chen, H.; Park, S. Quantitative vulnerability assessment of water quality to extreme drought in a changing climate. Ecol. Indic. 2019, 103, 688–697. Available online: https://linkinghub.elsevier.com/retrieve/pii/S1470160X19302997 (accessed on 20 September 2022). [CrossRef]
- Jeong, S.; Yu, I.; Felix, M.L.A.; Kim, S.; Oh, K. Drought assessment for real-time hydrologic drought index of the Nakdong River Basin in Korea. Desalin Water Treat. 2014, 52, 2826–2832. [Google Scholar] [CrossRef]
- Yang, J. Development of drought vulnerability index using delphi method considering climate change and trend analysis in Nakdong River basin. J. Korean Soc. Civ. Eng. 2013, 33, 2245. [Google Scholar] [CrossRef] [Green Version]
- Lee, J.; Park, S.; Kim, J.; Sur, C.; Chen, J. Extreme drought hotspot analysis for adaptation to a changing climate: Assessment of applicability to the five major river basins of the Korean Peninsula. Int. J. Climatol. 2018, 38, 4025–4032. [Google Scholar] [CrossRef]
- Kim, J.; Park, J.; Jang, S.; Kang, H.; Kim, S. Applicability evaluation of real-time standard flow index to develop termination criteria at each drought response stage on multi-purpose dams. Korean Soc. Hazard. Mitig. 2017, 17, 411–420. [Google Scholar] [CrossRef]
- Lee, D.; Moon, J.; Lee, D. Development of water supply capacity index to monitor drought in a reservoir. J. Korea Water Resour. Assoc. 2006, 39, 199–214. [Google Scholar]
- Kim, C.; Park, M.; Lee, J. Analysis of climate change impacts on the spatial and frequency patterns of drought using a potential drought hazard mapping approach. Int. J. Climatol. 2014, 34, 61–80. [Google Scholar] [CrossRef]
- Di Baldassarre, G.; Martinez, F.; Kalantari, Z.; Viglione, A. Drought and flood in the Anthropocene: Feedback mechanisms in reservoir operation. Earth Syst. Dyn. 2017, 8, 225–233. [Google Scholar] [CrossRef] [Green Version]
- Han River Flood Control Office. Water Resources Status and Prospect. 2022. Available online: http://www.hrfco.go.kr/web/riverPage/riverInfo.do (accessed on 22 September 2022).
- Sperber, K.R.; Annamalai, H.; Kang, I.-S.; Kitoh, A.; Moise, A.; Turner, A.; Wang, B.; Zhou, T. The Asian summer monsoon: An intercomparison of CMIP5 vs. CMIP3 simulations of the late 20th century. Clim. Dyn. 2013, 41, 2711–2744. [Google Scholar] [CrossRef]
- Moss, R.H.; Edmonds, J.A.; Hibbard, K.A.; Manning, M.R.; Rose, S.K.; van Vuuren, D.P.; Carter, T.R.; Emori, S.; Kainuma, M.; Kram, T. The next generation of scenarios for climate change research and assessment. Nature 2010, 463, 747–756. [Google Scholar] [CrossRef]
- Wood, A.W.; Leung, L.R.; Sridhar, V.; Lettenmaier, D.P. Hydrologic implications of dynamical and statistical approaches to downscaling climate model outputs. Clim. Change 2004, 62, 189–216. [Google Scholar] [CrossRef]
- Eum, H.; Cannon, A.J. Intercomparison of projected changes in climate extremes for South Korea: Application of trend preserving statistical downscaling methods to the CMIP5 ensemble. Int. J. Climatol. 2017, 37, 3381–3397. [Google Scholar] [CrossRef]
- Park, J.; Hwang, S.; Song, J.-H.; Kang, M.-S. An Alternative for Estimating the Design Flood Interval of Agricultural Reservoirs under Climate Change Using a Non-Parametric Resampling Technique. Water 2020, 12, 1894. [Google Scholar] [CrossRef]
- Ahn, J.M.; Im, T.H.; Lee, I.J.; Lee, K.-L.; Jung, K.Y.; Lee, J.W.; Cheon, S.U.; Park, I.H. A study on efficiency of water supply through conjunctive operation of reservoirs and multi-function weirs in the Nakdong River. J. Korean Soc. Water Environ. 2014, 30, 138–147. [Google Scholar] [CrossRef]
- Zagona, E.A.; Fulp, T.J.; Shane, R.; Magee, T.; Goranflo, H.M. RiverWare: A generalized tool for complex reservoir system modeling. J. Am. Water Resour. Assoc. 2001, 37, 913–929. [Google Scholar] [CrossRef]
- Fredericks, J.W.; Labadie, J.W.; Altenhofen, J.M. Decision support system for conjunctive stream-aquifer management. J. Water Resour. Plan Manag. 1998, 124, 69–78. [Google Scholar] [CrossRef] [Green Version]
- Che, D.; Mays, L.W. Development of an optimization/simulation model for real-time flood-control operation of river-reservoirs systems. Water Resour. Manag. 2015, 29, 3987–4005. [Google Scholar] [CrossRef]
- Yang, L.; Bai, X.; Khanna, N.Z.; Yi, S.; Hu, Y.; Deng, J.; Gao, H.; Tuo, L.; Xiang, S.; Zhou, N. Water evaluation and planning (Weap) model application for exploring the water deficit at catchment level in beijing. Desalin Water Treat. 2018, 118, 12–25. [Google Scholar] [CrossRef]
- Chandel, A.; Shankar, V.; Jaswal, S. Employing HEC-ResSim 3.1 for Reservoir Operation and Decision Making. In Bound Layer Flows—Model Comput Appl Laminar, Turbul Incompressible Compressible Flows; IntechOpen: London, UK, 2022. [Google Scholar]
- Choi, Y.; Ahn, J.; Ji, J.; Lee, E.; Yi, J. Effects of inter-basin water transfer project operation for emergency water supply. Water Resour. Manag. 2020, 34, 2535–2548. [Google Scholar] [CrossRef]
- Lee, D.; Choi, C.; Yu, M.; Yi, J. Reevaluation of multi-purpose reservoir yield. J. Korea Water Resour. Assoc. 2012, 45, 361–371. [Google Scholar] [CrossRef]
- Yang, W.; Ahn, J.; Yi, J. A study on the measures to use Gunnam flood control reservoir through a reservoir simulation model. J. Korea Water Resour. Assoc. 2017, 50, 407–418. [Google Scholar]
- US Army Corps of Engineers. HEC-ResSim Reservoir System Simulation User’s Manual Version 3.3; US Army Corps of Engineers: Washington, DC, USA, 2021. [Google Scholar]
- Ministry of Land Transport and Maritime Affairs. South Korea Water Plan; Ministry of Land Transport and Maritime Affairs: Sejong City, Korea, 2011. [Google Scholar]
- Hashimoto, T.; Stedinger, J.R.; Loucks, D.P. Reliability, resiliency, and vulnerability criteria for water resource system performance evaluation. Water Resour. Res. 1982, 18, 14–20. [Google Scholar] [CrossRef] [Green Version]
- Sung, J.; Chung, E.-S.; Shahid, S. Reliability–Resiliency–Vulnerability Approach for Drought Analysis in South Korea Using 28 GCMs. Sustainability 2018, 10, 3043. [Google Scholar] [CrossRef]
Figure 1.
Study area and six reservoirs: (a) locations of four major River basins (Han, Nakdong, Geum, and Yeongsan) in South Korea. The red box highlights the Nakdong River Basin; (b) locations of six reservoirs and watersheds (indicated by diagonal lines). In this study, we consider Andong reservoir and Imha reservoir as a single reservoir as they are connected through a channel and operated together.

Figure 2.
Description of multipurpose reservoir storage zones and water levels. The water in emergency storage is unavailable for water supply during the normal seasons. However, the water in the emergency storage (above the emergency outlet) becomes available for emergency water use and supplies water only during emergency events (e.g., extreme drought).

Figure 3.
An example of Standard for the Hapcheon reservoir. This Standard is set in four stages (concern, caution, alert, and emergency).
Figure 3.
An example of Standard for the Hapcheon reservoir. This Standard is set in four stages (concern, caution, alert, and emergency).

Figure 4.
Workflow for building, calibrating, and validating the climate model, hydrologic model, and reservoir model. We build and simulate five reservoirs using HECResSim.
Figure 4.
Workflow for building, calibrating, and validating the climate model, hydrologic model, and reservoir model. We build and simulate five reservoirs using HECResSim.

Figure 5.
Comparison of the Hapcehon reservoir’s water level for Case 1, 2, and 3 in three climate change scenarios from 2011 to 2100. These three climate change scenarios are RCP 8.5 INM-CM4 (a), RCP 8.5 IPSL-CM5A-LR (b), and RCP 4.5 CMCC-CMS (c). The dotted black box highlights the extreme drought period (from 2070 to 2080).

Figure 6.
Comparison of the Gunwi reservoir’s water level for Case 1, 2, and 3 in three climate change scenarios from 2011 to 2100. These three climate change scenarios are RCP 8.5 INM-CM4 (a), RCP 8.5 IPSL-CM5A-LR (b), and RCP 4.5 CMCC-CMS (c). The dotted black box highlights the extreme drought period (from 2070 to 2080).

Figure 7.
Changing water level in Hapcheon reservoir for Case 1, Case 2, and Case 3 in Scenario RCP 8.5 INM-CM4 (a), RCP 8.5 IPSL-CM5A-LR (b), and RCP 4.5 CMCC-CMS (c) from 2070 to 2080.
Figure 7.
Changing water level in Hapcheon reservoir for Case 1, Case 2, and Case 3 in Scenario RCP 8.5 INM-CM4 (a), RCP 8.5 IPSL-CM5A-LR (b), and RCP 4.5 CMCC-CMS (c) from 2070 to 2080.


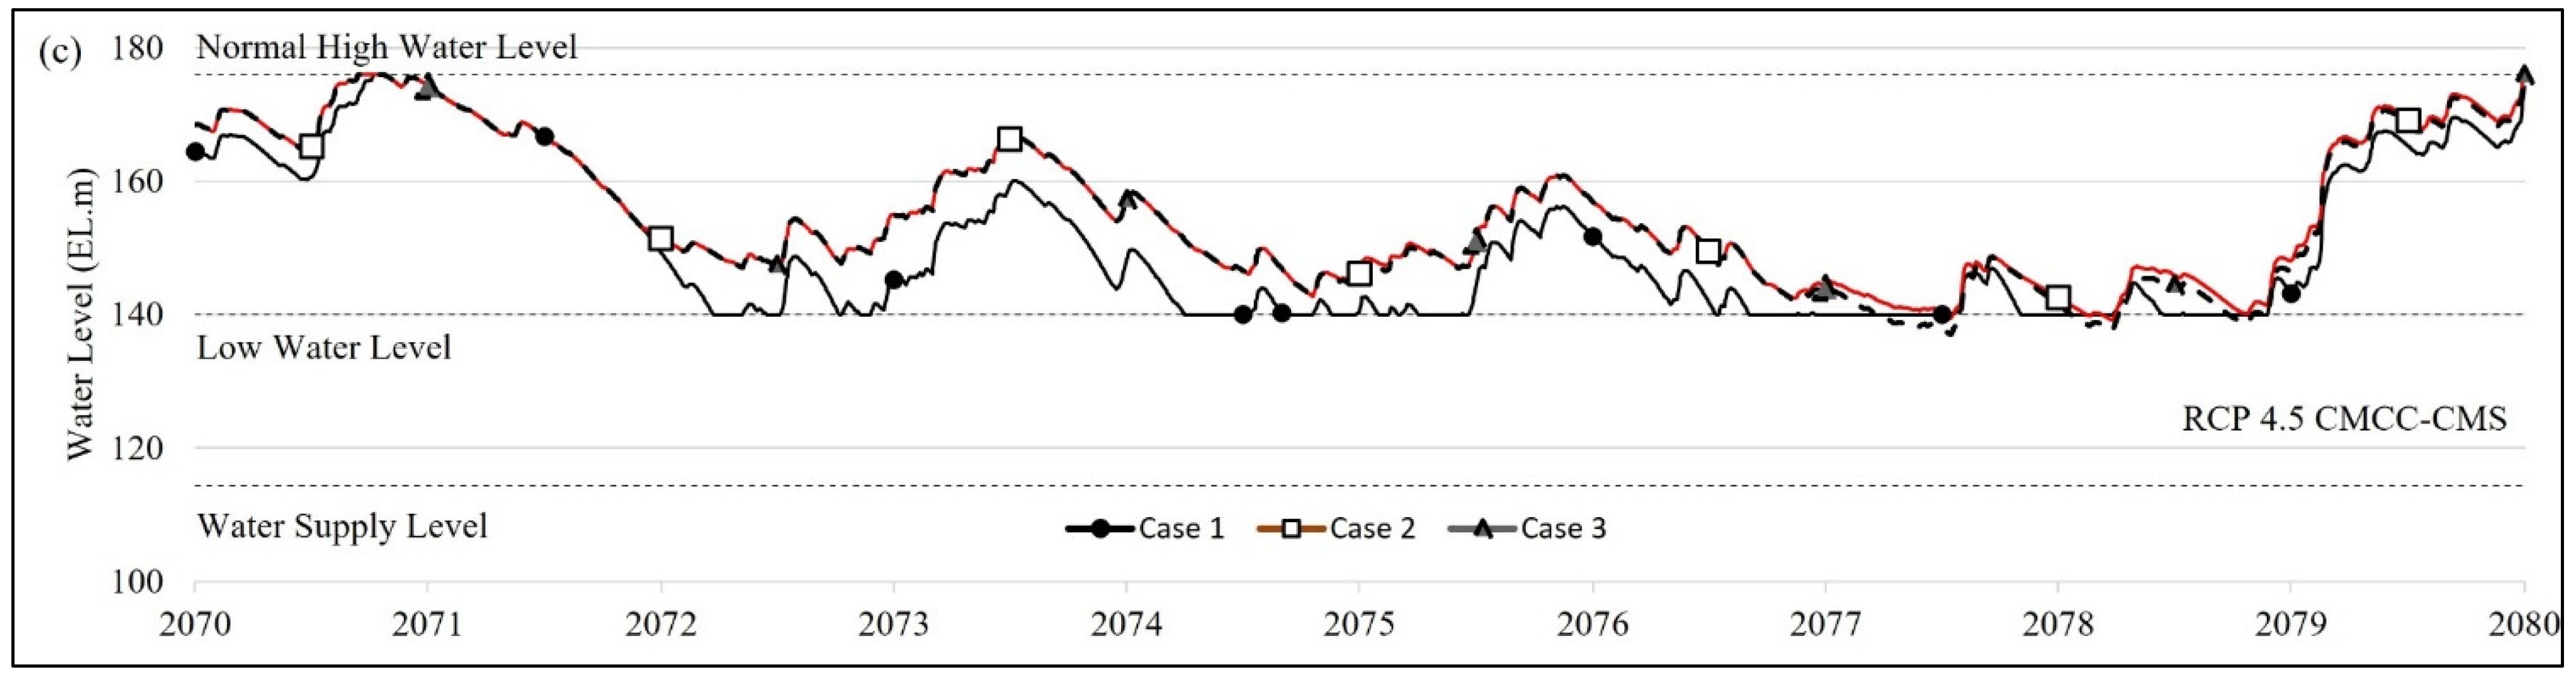
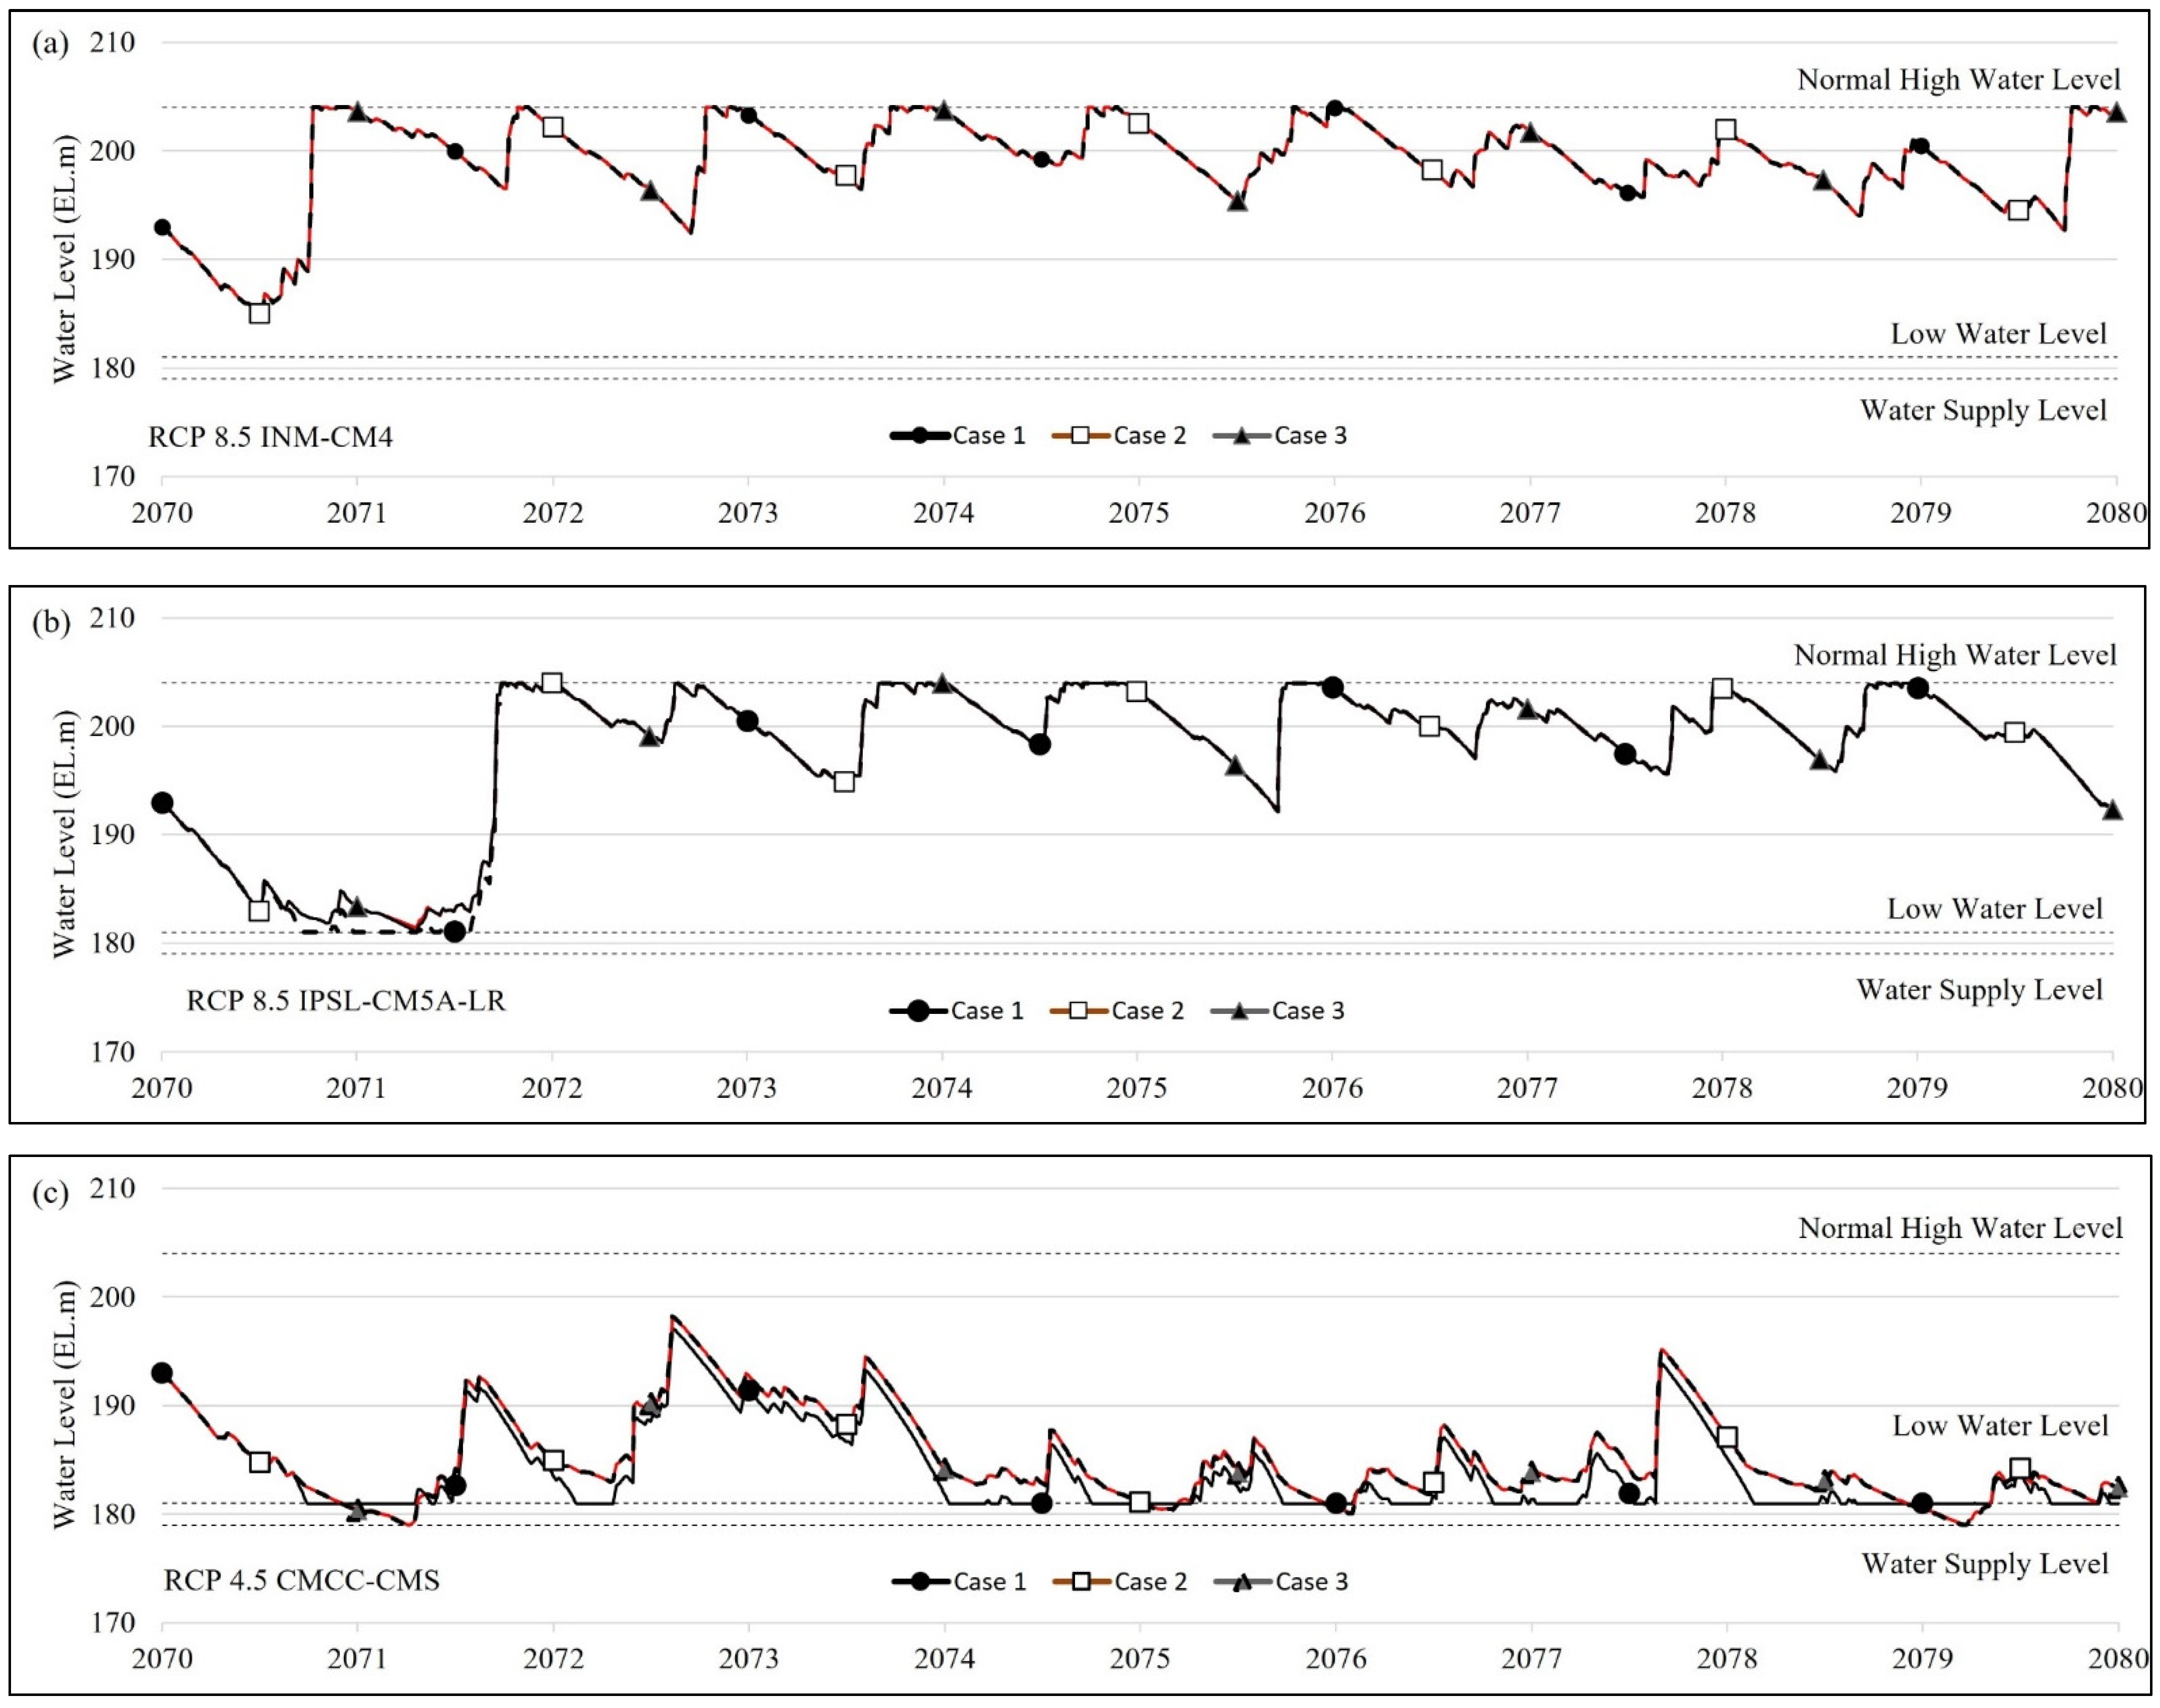
Figure 8.
Changing water level in Gunwi reservoir for Case 1, Case 2, and Case 3 in Scenario RCP 8.5 INM-CM4 (a), RCP 8.5 IPSL-CM5A-LR (b), and RCP 4.5 CMCC-CMS (c) from 2070 to 2080.
Figure 8.
Changing water level in Gunwi reservoir for Case 1, Case 2, and Case 3 in Scenario RCP 8.5 INM-CM4 (a), RCP 8.5 IPSL-CM5A-LR (b), and RCP 4.5 CMCC-CMS (c) from 2070 to 2080.


Table 1.
Average annual precipitation of four major river basins in South Korea [34]. The Nakdong River Basin has the least amount of annual precipitation among four major river basins.
Table 1.
Average annual precipitation of four major river basins in South Korea [34]. The Nakdong River Basin has the least amount of annual precipitation among four major river basins.
| River Basin | Han | Nakdong | Geum | Yeongsan |
|---|---|---|---|---|
| Precipitation (mm) | 1366.3 | 1192.3 | 1299.0 | 1437.7 |
Table 2.
Characteristics of six multipurpose reservoirs in the Nakdong River Basin.
| Reservoirs | Andong | Gimcheon-Buhang | Gunwi | Hapcheon | Imha | Milyang |
|---|---|---|---|---|---|---|
| Total storage (MCM) | 1248 | 54.3 | 48.7 | 790 | 595 | 73.6 |
| Conservation storage (MCM) | 1000 | 42.6 | 40.1 | 560 | 424 | 69.8 |
| Emergency storage (MCM) | 130 | 1.6 | 1.3 | 130 | 84 | 3.6 |
| Daily planned supply (MCM) | 2.5 | 0.1 | 0.1 | 1.6 | 1.6 | 0.2 |
| Emergency storage/ | 13 | 3.8 | 3.2 | 23.2 | 19.8 | 5.2 |
| Conservation storage (%) | ||||||
| Emergency storage/ | 52 | 16 | 13 | 81 | 53 | 18 |
| Daily planned supply (days) |
Table 3.
Description of four stages (concern, caution, alert, and emergency) and reductions scales for multipurpose reservoir.
Table 3.
Description of four stages (concern, caution, alert, and emergency) and reductions scales for multipurpose reservoir.
| Stage | Reduction Scale |
|---|---|
| Concern | Uncontracted domestic and industrial water |
| Caution | Concern reduction + instream flow |
| Alert | Caution reduction + Irrigation water (April~June: 20%, July~September: 30%) |
| Emergency | Alert reduction + 20% of domestic and industrial water |
Table 4.
A list of 25 future climate change scenarios and quantitative water supply capacity evaluation results for the Hapcheon reservoir. The maximum duration and the maximum shortage of water supply failure are the two crucial criteria that indicate the severity of drought.
Table 4.
A list of 25 future climate change scenarios and quantitative water supply capacity evaluation results for the Hapcheon reservoir. The maximum duration and the maximum shortage of water supply failure are the two crucial criteria that indicate the severity of drought.
| No | Scenario | Water Shortage (Days) | Water Shortage (MCM) | Number of Failure Events | Max Shortage Duration (Days) | Max Shortage (MCM) |
|---|---|---|---|---|---|---|
| 1 | RCP 8.5 Canadian Earth System Model 2 (RCP 8.5 CanESM2) | 0 | 0 | 0 | 0 | 0 |
| 2 | RCP 8.5 Community Earth System Model Biogeochemistry (RCP 8.5 CESM1-BGC) | 225 | 310 | 6 | 63 | 96.1 |
| 3 | RCP 8.5 Meteorological Research Institute Coupled Global Climate Model 3 (RCP 8.5 MRI-CGCM3) | 110 | 153.1 | 3 | 67 | 99.3 |
| 4 | RCP 4.5 Hadley Center Global Environmental Model version 2 Anomaly (RCP 4.5 HadGEM2-AO) | 244 | 366.9 | 5 | 70 | 111.2 |
| 5 | RCP 4.5 MRI-CGCM3 | 186 | 249.4 | 7 | 74 | 103 |
| 6 | RCP 4.5 CanESM2 | 256 | 379.6 | 8 | 81 | 123.1 |
| 7 | RCP 4.5 Institut Pierre-Simon Laplace Climate Model 5A Low Resolution (RCP 4.5 IPSL-CM5A-LR) | 1351 | 1946.8 | 33 | 128 | 191.5 |
| 8 | RCP 4.5 Institute for Numerical Mathematics Climate Model 5 (RCP 4.5 INM-CM4) | 1843 | 2420.6 | 54 | 129 | 171.7 |
| 9 | RCP 4.5 Centro Euro-Mediterraneo sui Cambiamenti Climatici Climate Model (RCP 4.5 CMCC-CM) | 420 | 597.3 | 10 | 130 | 197.3 |
| 10 | RCP 8.5 HadGEM2- Earth System (RCP 8.5 HadGEM2-ES) | 1147 | 1653.4 | 24 | 131 | 192.2 |
| 11 | RCP 4.5 Geophysical Fluid Dynamics Laboratory Earth System Models 2G (RCP 4.5 GFDL-ESM2G) | 727 | 1015.8 | 17 | 134 | 190 |
| 12 | RCP 8.5 GFDL-ESM2G | 977 | 1421.6 | 16 | 136 | 194.6 |
| 13 | RCP 8.5 CMCC-CM | 774 | 1110.0 | 21 | 137 | 193.6 |
| 14 | RCP 8.5 HadGEM2-AO | 521 | 748.1 | 8 | 141 | 185.5 |
| 15 | RCP 4.5 Community Earth System Model BGC (RCP 4.5 CESM1-BGC) | 353 | 519.8 | 6 | 150 | 238.5 |
| 16 | RCP 4.5 Norwegian Earth System Model (RCP 4.5 NorESM1-M) | 552 | 772.3 | 20 | 159 | 229.1 |
| 17 | RCP 4.5 Centre National de Recherches Météorologiques Circulation Model 5 (RCP 4.5 CNRM-CM5) | 684 | 905.8 | 11 | 171 | 236.6 |
| 18 | RCP 4.5 HadGEM2-ES | 2049 | 2882.0 | 33 | 184 | 277.5 |
| 19 | RCP 8.5 CMCC- Climate Model System (CMS) | 647 | 936.8 | 9 | 190 | 292.9 |
| 20 | RCP 8.5 CNRM-CM5 | 402 | 539.7 | 7 | 196 | 270.1 |
| 21 | RCP 4.5 IPSL-Climate Model 5A—Medium Resolution (RCP 4.5 IPSL-CM5A-MR) | 2417 | 3498.9 | 46 | 201 | 298.6 |
| 22 | RCP 8.5 IPSL-CM5A-MR | 3377 | 4854.8 | 52 | 251 | 370.5 |
| 23 | RCP 4.5 CMCC-CMS | 8882 | 12,831.9 | 181 | 267 | 404.3 |
| 24 | RCP 8.5 IPSL-CM5A-LR | 1598 | 2308.2 | 29 | 296 | 455.2 |
| 25 | RCP 8.5 INM-CM4 | 2527 | 3605.6 | 64 | 307 | 456.1 |
Table 5.
A summary table for the final three climate change scenarios with maximum shortage duration (days) and maximum shortage (MCM).
Table 5.
A summary table for the final three climate change scenarios with maximum shortage duration (days) and maximum shortage (MCM).
| Scenarios | Max Shortage Duration (Days) | Max Shortage (MCM) |
|---|---|---|
| RCP 8.5 INM-CM4 | 307 | 456 |
| RCP 8.5 IPSL-CM5A-LR | 296 | 455 |
| RCP 4.5 CMCC-CMS | 267 | 404 |
Table 6.
Comparison of average low water level (m) for Case 1, 2, and 3 for five reservoirs.
| Scenario | Case | Andong-Imha | Gimcheon-Boohang | Gunwi | Hapcheon | Milyang | ||||||||||
|---|---|---|---|---|---|---|---|---|---|---|---|---|---|---|---|---|
| P1 | P2 | P3 | P1 | P2 | P3 | P1 | P2 | P3 | P1 | P2 | P3 | P1 | P2 | P3 | ||
| RCP 8.5 INM-CM4 | 1 | 153.87 | 152.78 | 149.40 | 182.19 | 187.47 | 189.85 | 198.35 | 197.42 | 195.41 | 162.70 | 164.63 | 159.28 | 181.11 | 188.50 | 179.71 |
| 2 | 154.56 | 153.90 | 152.22 | 182.67 | 187.47 | 189.85 | 198.36 | 197.57 | 195.69 | 163.68 | 165.36 | 160.81 | 190.70 | 193.16 | 190.42 | |
| 3 | 154.56 | 153.90 | 152.22 | 182.67 | 187.47 | 189.85 | 198.36 | 197.57 | 195.69 | 163.63 | 165.35 | 160.70 | 190.70 | 193.16 | 190.42 | |
| RCP 8.5 IPSL-CM5A-LR | 1 | 153.03 | 154.34 | 154.69 | 187.97 | 189.20 | 188.03 | 197.66 | 198.81 | 198.33 | 161.30 | 165.08 | 164.04 | 183.32 | 189.45 | 193.16 |
| 2 | 154.46 | 154.96 | 155.79 | 188.02 | 189.20 | 188.12 | 197.79 | 198.85 | 198.44 | 162.62 | 165.72 | 164.81 | 192.53 | 194.45 | 195.98 | |
| 3 | 154.46 | 154.96 | 155.79 | 188.02 | 189.20 | 188.12 | 197.78 | 198.85 | 198.44 | 162.53 | 165.72 | 164.74 | 192.53 | 194.45 | 195.98 | |
| RCP4.5 CMCC-CMS | 1 | 140.51 | 137.60 | 144.87 | 189.08 | 188.77 | 185.93 | 188.03 | 187.78 | 192.84 | 146.45 | 145.44 | 154.92 | 159.42 | 154.89 | 163.60 |
| 2 | 146.86 | 146.67 | 151.25 | 189.11 | 188.77 | 186.09 | 188.80 | 188.80 | 193.42 | 151.00 | 151.00 | 158.16 | 183.71 | 181.10 | 185.85 | |
| 3 | 146.86 | 146.67 | 151.25 | 189.11 | 188.77 | 186.09 | 188.78 | 188.77 | 193.41 | 150.50 | 150.63 | 157.88 | 183.71 | 181.10 | 185.85 | |
Table 7.
Results of the three model performance evaluation indices for Case 1, 2, and 3 in the Hapcheon reservoir.
Table 7.
Results of the three model performance evaluation indices for Case 1, 2, and 3 in the Hapcheon reservoir.
| Scenario | Case | Volumetric Reliability (%) | Average Resiliency | Average Vulnerability (MCM) | ||||||
|---|---|---|---|---|---|---|---|---|---|---|
| P1 | P2 | P3 | P1 | P2 | P3 | P1 | P2 | P3 | ||
| RCP 8.5 INM-CM4 | 1 | 93.3 | 97.3 | 88.6 | 0.023 | 0.040 | 0.023 | 60.2 | 34.7 | 63.9 |
| 2 | 92.1 | 96.3 | 87.4 | - | - | - | - | - | - | |
| 3 | 92.2 | 96.3 | 87.5 | - | - | - | - | - | - | |
| RCP 8.5 IPSL-CM5A-LR | 1 | 93.2 | 97.9 | 95.6 | 0.019 | 0.022 | 0.014 | 76.1 | 62.2 | 104.4 |
| 2 | 92.5 | 96.6 | 94.4 | - | - | - | - | - | - | |
| 3 | 92.5 | 96.6 | 94.5 | - | - | - | - | - | - | |
| RCP4.5 CMCC-CMS | 1 | 70.2 | 71.8 | 85.4 | 0.018 | 0.021 | 0.024 | 78.9 | 68.7 | 59.9 |
| 2 | 69.5 | 71.7 | 84.3 | - | - | - | - | - | - | |
| 3 | 69.6 | 71.7 | 84.4 | - | - | - | - | - | - | |
Table 8.
Results of the three model performance evaluation indices for Case 1, 2, and 3 in reservoir.
Table 8.
Results of the three model performance evaluation indices for Case 1, 2, and 3 in reservoir.
| Scenario | Case | Volumetric Reliability (%) | Average Resiliency | Average vulnerability (MCM) | ||||||
|---|---|---|---|---|---|---|---|---|---|---|
| P1 | P2 | P3 | P1 | P2 | P3 | P1 | P2 | P3 | ||
| RCP 8.5 INM-CM4 | 1 | 97.1 | 98.7 | 93.8 | 0.012 | 0.047 | 0.024 | 8.2 | 1.9 | 3.9 |
| 2 | 97.0 | 98.0 | 93.4 | 0.069 | - | - | 1.4 | - | - | |
| 3 | 97.0 | 98.0 | 93.4 | 0.059 | - | - | 1.6 | - | - | |
| RCP 8.5 IPSL-CM5A-LR | 1 | 94.5 | 99.2 | 96.9 | 0.016 | 0.020 | 0.019 | 5.7 | 4.5 | 4.7 |
| 2 | 94.3 | 99.1 | 96.7 | 0.333 | - | - | 0.3 | - | - | |
| 3 | 94.3 | 99.1 | 96.7 | 0.125 | - | - | 0.7 | - | - | |
| RCP 4.5 CMCC-CMS | 1 | 77.1 | 79.9 | 92.1 | 0.016 | 0.020 | 0.021 | 5.8 | 4.4 | 4.2 |
| 2 | 76.7 | 79.4 | 91.1 | 0.032 | 0.091 | 0 | 3.0 | 1.0 | 0 | |
| 3 | 76.7 | 79.5 | 91.1 | 0.039 | 0.097 | 0.250 | 2.4 | 1.0 | 0.4 | |
Table 9.
Total number of days at each stage for Case 1, 2, and 3 in the Hapcheon reservoir.
| Scenario | Case | P1 | P2 | P3 | ||||||||||||
|---|---|---|---|---|---|---|---|---|---|---|---|---|---|---|---|---|
| Normal | Concern | Caution | Alert | Emergency | Normal | Concern | Caution | Alert | Emergency | Normal | Concern | Caution | Alert | Emergency | ||
| RCP 8.5 INM-CM4 | 1 | 8847 | 116 | 350 | 163 | 1482 | 9677 | 128 | 212 | 149 | 791 | 7432 | 172 | 320 | 207 | 2096 |
| 2 | 9432 | 421 | 639 | 90 | 376 | 10,127 | 561 | 206 | 37 | 26 | 7965 | 704 | 784 | 140 | 634 | |
| 3 | 9429 | 407 | 643 | 68 | 411 | 10,123 | 565 | 206 | 36 | 27 | 7927 | 716 | 716 | 158 | 710 | |
| RCP 8.5 IPSL-CM5A-LR | 1 | 8821 | 188 | 340 | 198 | 1411 | 10,036 | 128 | 174 | 64 | 555 | 8870 | 173 | 292 | 93 | 799 |
| 2 | 9473 | 546 | 361 | 130 | 448 | 10,232 | 319 | 337 | 67 | 2 | 9205 | 280 | 276 | 74 | 392 | |
| 3 | 9442 | 549 | 386 | 48 | 533 | 10,232 | 318 | 338 | 67 | 2 | 9187 | 283 | 275 | 83 | 399 | |
| RCP 4.5 CMCC-CMS | 1 | 2994 | 521 | 886 | 414 | 6143 | 2351 | 430 | 938 | 711 | 6527 | 6244 | 304 | 486 | 285 | 2908 |
| 2 | 5311 | 1279 | 1392 | 470 | 2506 | 5561 | 1434 | 1737 | 512 | 1713 | 7524 | 522 | 750 | 252 | 1179 | |
| 3 | 5080 | 1226 | 1381 | 559 | 2712 | 5382 | 1483 | 1642 | 483 | 1967 | 7424 | 587 | 672 | 216 | 1328 | |
Table 10.
Total number of days at each stage for Case 1, 2, and 3 in the Gunwi reservoir.
| Scenario | Case | P1 | P2 | P3 | ||||||||||||
|---|---|---|---|---|---|---|---|---|---|---|---|---|---|---|---|---|
| Normal | Concern | Caution | Alert | Emergency | Normal | Concern | Caution | Alert | Emergency | Normal | Concern | Caution | Alert | Emergency | ||
| RCP 8.5 INM-CM4 | 1 | 10,521 | 8 | 18 | 31 | 380 | 10,558 | 54 | 30 | 57 | 258 | 8864 | 180 | 149 | 168 | 866 |
| 2 | 10,524 | 60 | 77 | 51 | 246 | 10,614 | 272 | 50 | 21 | - | 9234 | 480 | 225 | 105 | 183 | |
| 3 | 10,522 | 61 | 77 | 51 | 247 | 10,614 | 272 | 50 | 21 | - | 9231 | 479 | 227 | 106 | 184 | |
| RCP 8.5 IPSL-CM5A-LR | 1 | 9872 | 61 | 89 | 101 | 835 | 10,803 | 9 | 12 | 18 | 115 | 9655 | 39 | 35 | 53 | 445 |
| 2 | 10,077 | 198 | 194 | 107 | 382 | 10,807 | 63 | 41 | 46 | - | 9735 | 182 | 201 | 77 | 32 | |
| 3 | 10,065 | 200 | 188 | 100 | 405 | 10,807 | 63 | 41 | 46 | - | 9735 | 179 | 194 | 86 | 33 | |
| RCP 4.5 CMCC-CMS | 1 | 6602 | 283 | 259 | 238 | 3576 | 6715 | 382 | 245 | 243 | 3372 | 8389 | 172 | 201 | 149 | 1316 |
| 2 | 7423 | 891 | 899 | 522 | 1223 | 7756 | 941 | 899 | 369 | 992 | 8898 | 553 | 388 | 105 | 283 | |
| 3 | 7397 | 894 | 882 | 506 | 1279 | 7728 | 952 | 856 | 374 | 1047 | 8890 | 560 | 389 | 104 | 284 | |
Table 11.
Volume of water secured in the emergency storage (MCM) for Case 1, 2, and 3 in the Hapcheon Reservoir.
Table 11.
Volume of water secured in the emergency storage (MCM) for Case 1, 2, and 3 in the Hapcheon Reservoir.
| Period/Scenario | RCP 8.5 INM-CM4 | RCP 8.5 IPSL-CM5A-LR | RCP 4.5 CMCC-CMS |
|---|---|---|---|
| P1 | 79.73 | 89.15 | 62.15 |
| P2 | - | - | 68.33 |
| P3 | 105.92 | 50.68 | 26.12 |
Table 12.
Volume of water secured in the emergency storage (MCM) for Case 1, 2, and 3 in the Gunwi reservoir.
Table 12.
Volume of water secured in the emergency storage (MCM) for Case 1, 2, and 3 in the Gunwi reservoir.
| Period/Scenario | RCP 8.5 INM-CM4 | RCP 8.5 IPSL-CM5A-LR | RCP 4.5 CMCC-CMS |
|---|---|---|---|
| P1 | 3.73 | 2.52 | 7.91 |
| P2 | - | - | 3.34 |
| P3 | 1.49 | 0.23 | 2.17 |
Publisher’s Note: MDPI stays neutral with regard to jurisdictional claims in published maps and institutional affiliations. |
© 2022 by the authors. Licensee MDPI, Basel, Switzerland. This article is an open access article distributed under the terms and conditions of the Creative Commons Attribution (CC BY) license (https://creativecommons.org/licenses/by/4.0/).
Share and Cite
MDPI and ACS Style
Chae, H.; Ji, J.; Lee, E.; Lee, S.; Choi, Y.; Yi, S.; Yi, J. Assessment of Activating Reservoir Emergency Storage in Climate-Change-Fueled Extreme Drought. Water 2022, 14, 3242. https://doi.org/10.3390/w14203242
AMA Style
Chae H, Ji J, Lee E, Lee S, Choi Y, Yi S, Yi J. Assessment of Activating Reservoir Emergency Storage in Climate-Change-Fueled Extreme Drought. Water. 2022; 14(20):3242. https://doi.org/10.3390/w14203242
Chicago/Turabian StyleChae, Heechan, Jungwon Ji, Eunkyung Lee, Seonmi Lee, Youngje Choi, Sooyeon Yi, and Jaeeung Yi. 2022. "Assessment of Activating Reservoir Emergency Storage in Climate-Change-Fueled Extreme Drought" Water 14, no. 20: 3242. https://doi.org/10.3390/w14203242
Note that from the first issue of 2016, this journal uses article numbers instead of page numbers. See further details here.