
Effect of Water Content on Strength of Alluvial Silt in The Lower Yellow River
by

Yang-Yang Cheng
1,
Xu-Guang Gao
1,
Tai-Heng Liu
1,
Lian-Xiang Li
1,*,
Wei Du
2,
Abu Hamad
1 and
Ji-Peng Wang
1,* 1
School of Civil Engineering, Shandong University, Jinan 250061, China
2
China Railway 17th Bureau Group Corporation Limited, Taiyuan 030006, China
*
Authors to whom correspondence should be addressed.
Water 2022, 14(20), 3231; https://doi.org/10.3390/w14203231
Submission received: 9 August 2022
/
Revised: 5 October 2022
/
Accepted: 9 October 2022
/
Published: 13 October 2022
(This article belongs to the Section Soil and Water)
Abstract
:In order to study the strength characteristics of alluvial silt in the lower Yellow River Channel at Luokou, Jinan, by varying the moisture content five times, direct shear tests were conducted and soil–water characteristics curves were obtained to explore the relationships between moisture content and matric suction as well as the bishop coefficient and shear strength. The soil–water characteristics curve test shows that the water retention curve of silt samples in the lower Yellow River can be fitted by the VG (Van Genuchten) model with the appropriate fitting coefficients. The direct shear test reveals that the relationship between shear stress and shear displacement alters from the shear softening type to the hardening type with the increase in moisture content and normal stress. The cohesion has a nonlinear inverse relationship with moisture content while a small variation is reported in the internal friction angle. Finally, a simple shear strength equation for silt in the lower Yellow River is proposed in relation to moisture content, to define the relationship between the effective stress parameter and the matric suction for future engineering purposes.
1. Introduction
The Yellow River carries a large amount of sediment when it migrates to the sea, thus forming a wide range of alluvial silt on the riverbank of the lower Yellow River, and soil moisture content increases under the conditions of rainfall infiltration, groundwater level change, and capillary water rise [1]. This phenomenon results in significant humidification of foundation soil. A decrease in soil strength may lead to the settlement of roadbeds, slope instability, and foundation pit overturning, as well as other environmental geological disasters and engineering accidents [2,3]. Therefore, it is crucial to investigate the impact of moisture content on the strength characteristics of alluvial silty soil in the lower Yellow River pertaining to the infrastructure construction, the ecological environment and geological disaster prevention and control in the lower Yellow River region, so that ecological protection [4] and high-quality development of the Yellow River basin could be promoted [5].
The silt of the Yellow River delta in the Shandong area of China is characterized by uniform grain size, high sphericity, poor graded, high porosity, and intensive capillarity [6] due to the long-distance transport of the Yellow River water. Consequently, when this kind of soil sample is used for foundation pit excavation and roadbed filling, the change of water content will lead to a great change in roadbed strength, resulting in the damage of pavement structure, pathological changes in the pavement, the reduction of the pavement service life, and safety problems.
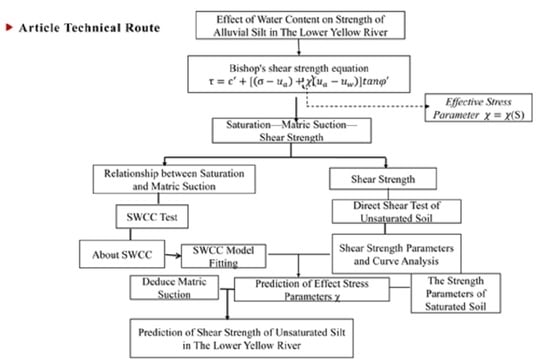
Recent studies on unsaturated soils are based on Bishop’s shear strength equation [7]:
where τ is shear stress, c′ is the effective cohesion of saturated soil, σ − ua is net normal stress, χ is the effective stress parameter, ua − uw is matric suction, and φ′ is the effective internal friction angle of saturated soil. Due to the limitation of experimental methods and measurement means, it is difficult to measure the matric suction and determine the effective stress parameters [8]. It is difficult to use matric suction and effective stress parameters to directly express the strength of unsaturated soil under different water contents [9]. Therefore, it is of great significance for engineering practice to explore the corresponding matric suction under different moisture contents (degree of saturation), determine the effective stress parameters under the corresponding moisture contents [10], and then predict the strength of unsaturated Yellow River silt.
Currently, many scholars have provided ideas on the strength characteristics of unsaturated soil. For instance, the SWCC(soil–water characteristics curve) and shear strength parameters of saturated soil were utilized to predict the shear strength of unsaturated silt soil [11,12,13,14]; the hydrodynamic properties of unsaturated silt in the eastern Henan Province were studied by the SWCC test and direct shear test [15,16]; the equations of strength and moisture content were established to predict the strength of unsaturated remolded residual soil based on the SWCC tests [17,18,19]. Previous studies have shown that the SWCC is related to the shear strength of unsaturated soil. At present, there are few studies on silty soil in the LuDong Plain section of the lower Yellow River. In order to find a more general and accurate applicable equation, the investigation of alluvial silty soil of the lower Yellow River channel at Luokou Jinan was carried out to clarify its hydro-mechanical properties. The alluvial silt was investigated by producing soil samples with different moisture contents, by measuring the SWCC with a pressure plate instrument, and by conducting direct shear tests with a direct shear instrument. Combined with the SWCC test, the corresponding matric suction for different moisture contents is obtained. Furthermore, the expression of an effective stress parameter is predicted. Finally, a shear strength equation of unsaturated soil based on the moisture content or degree of saturation expression is proposed for the alluvial silty soil in the lower Yellow River channel.
2. Test Equipment and Method
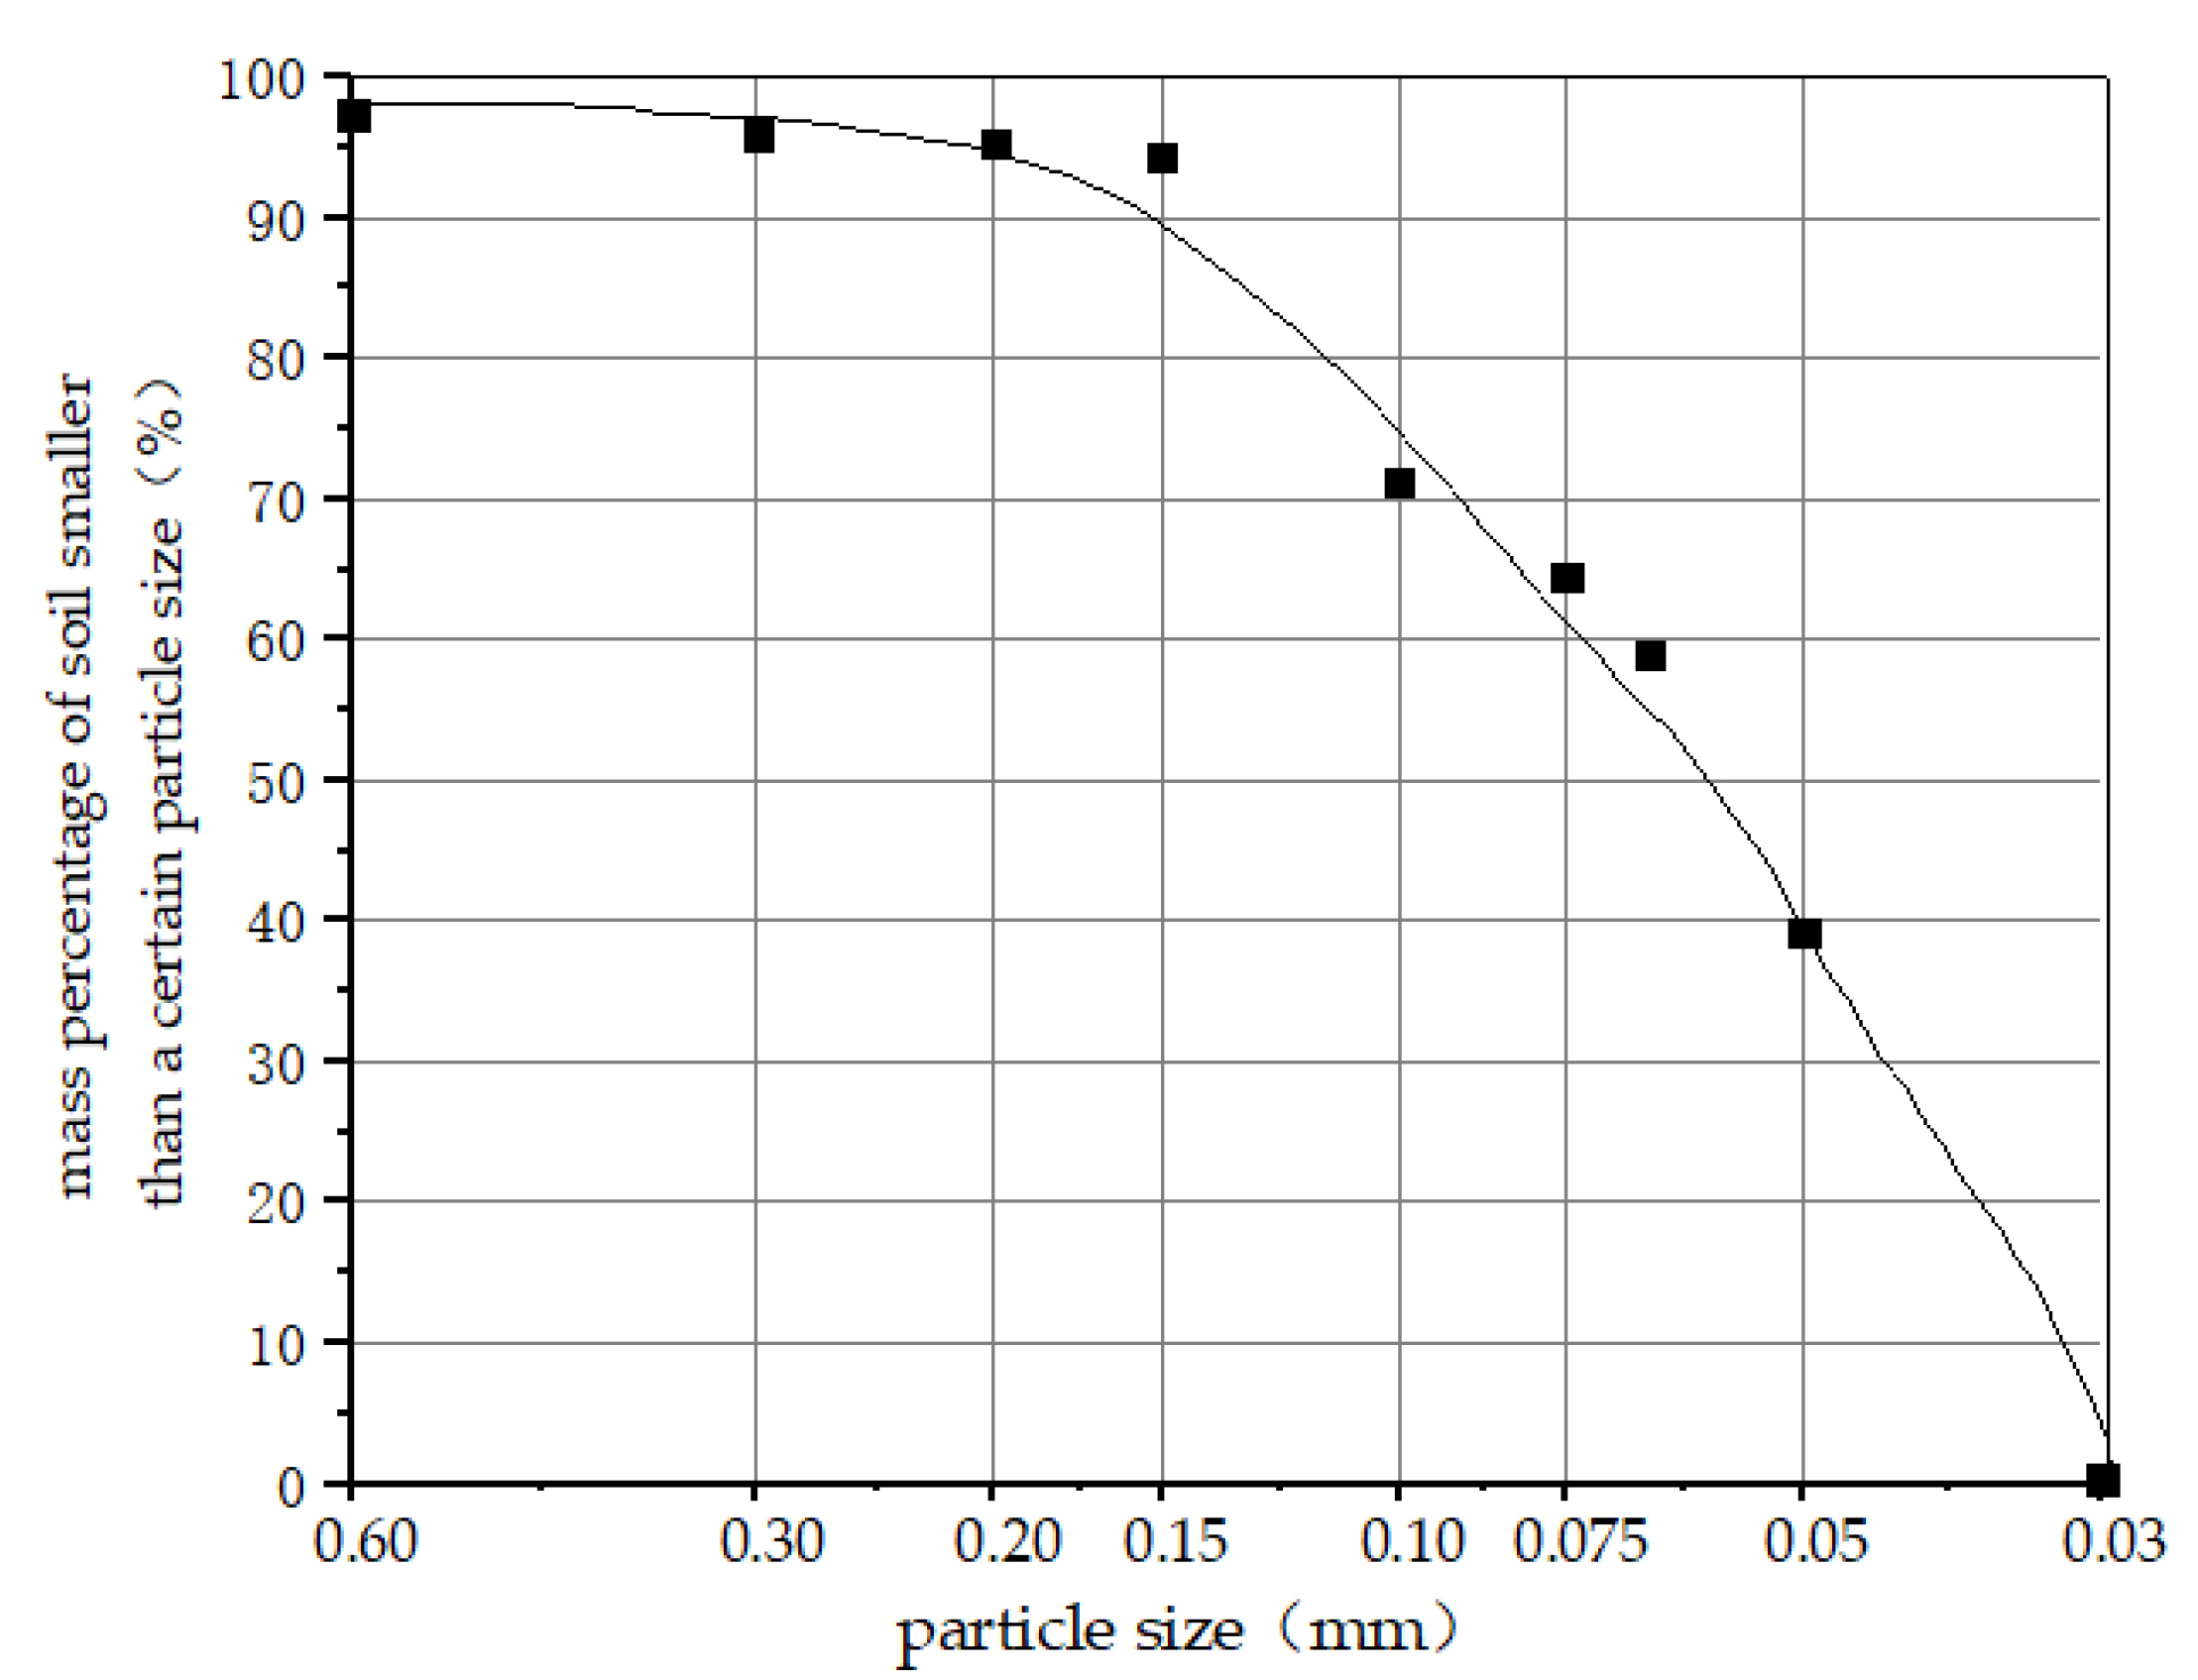
The soil studied in this paper is the alluvial silty soil collected from the Yellow River channel at Luokou, Jinan (Figure 1) in October. The basic physical indexes of the soils measured by laboratory geotechnical tests are shown in Table 1, and the particle grading curve of the tested soil determined by the sieving method is shown in Figure 2.
2.1. SWCC Test
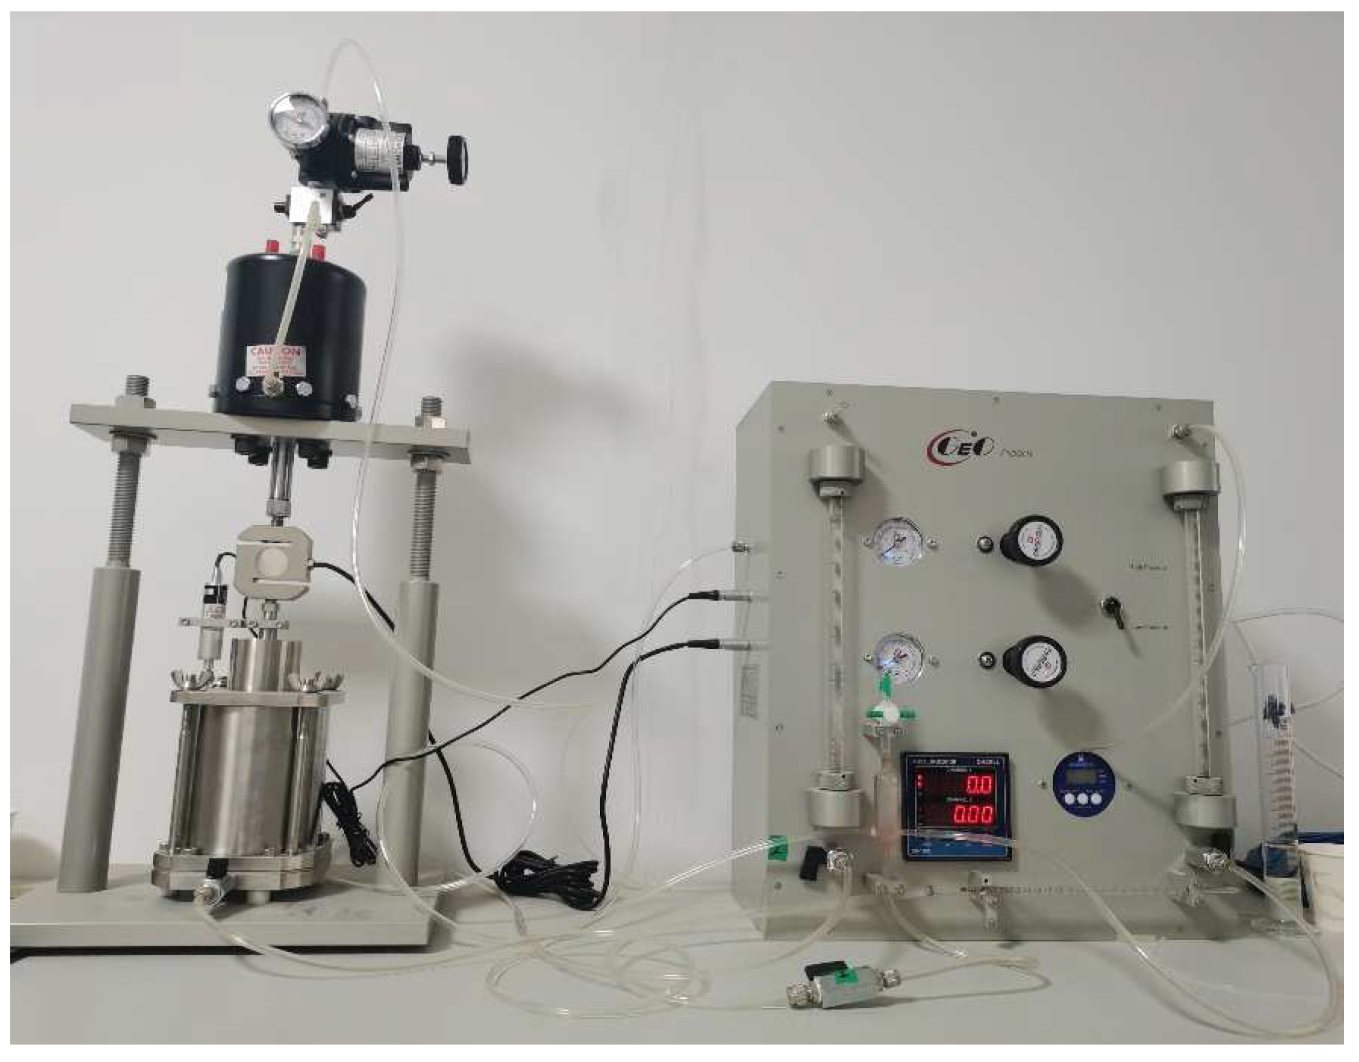
The SWCC test was conducted by utilizing a geo-expert one-dimensional vertical stress SD-SWCC pressure plate instrument as shown in Figure 3 [20,21]. The matric suction was adjusted by the axis translation method, and the pore water pressure was shifted to zero. The matric suction value was controlled by the change of air-entry pressure, and the relationship between matric suction and soil–water content was obtained, and the SWCC was drawn. The ring cover was used to vertically press the ring knife according to the Test Methods of Soil for Highway Engineering (JTG3430-2020). The soil sample in the ring cutter was compacted and cut, and both sides of the soil sample were covered with pervious stone and placed in airless water for 120 min until there were no obvious bubbles, and the degree of saturation was complete. Then a layer of filter paper was placed on the saturated clay plate, and the saturated sample was placed on the top, with the drainpipe connected to the bottom. The top cover of the pressure chamber was installed, and the screw was tightened to gradually increase the air-entry pressure value [22]. During the experiment, matric suction was defined by air-entry pressure value, and the displacement under the corresponding applied matric suction (1 kPa, 2 kPa, 4 kPa, 10 kPa, 20 kPa, 30 kPa, 50 kPa, 100 kPa and 200 kPa) was measured by the pressure plate instrument. The suction equilibrium was determined when the left, right, and horizontal gauges (the horizontal gauges were closed and the reading changed due to evaporation) reached stability after 24 h. As the original soil sample was saturated, dry mass of the sample was evaluated after drying, and the mass of the total saturated soil sample was obtained by conversion. Following this, the volumetric moisture content and degree of saturation after the balance of the applied suction could be obtained by further conversion. The SWCC could be plotted based on the applied suction value and the corresponding degree of saturation.
2.2. Direct Shear Test of Unsaturated Soil
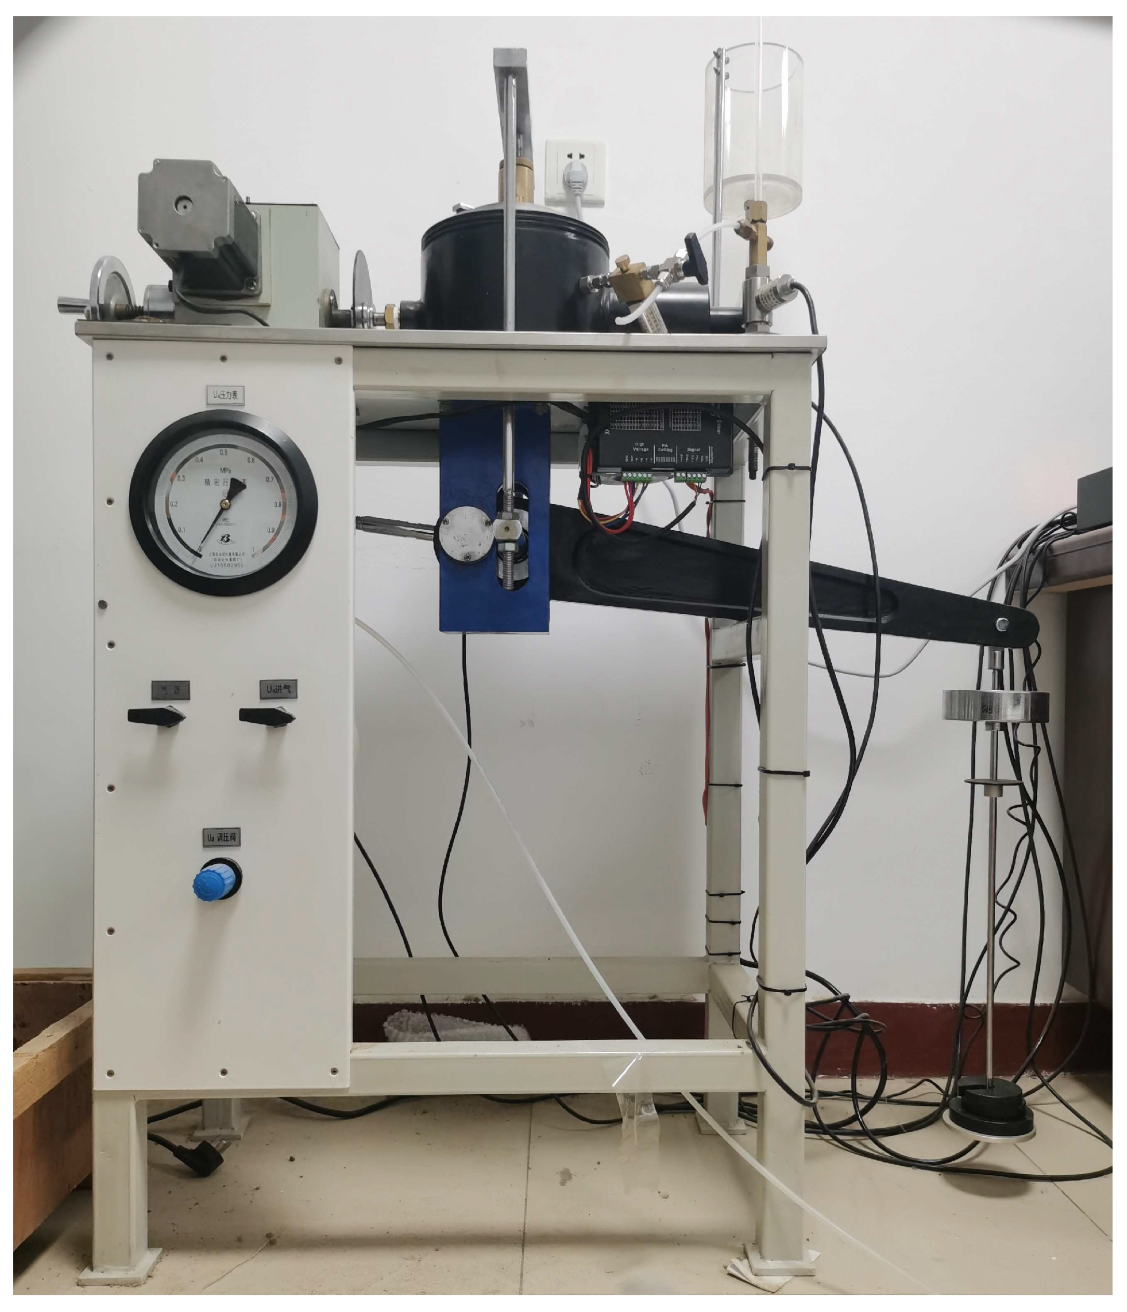
For the direct shear testing, a FDJ-20 apparatus as shown in Figure 4 was utilized. Firstly, the sample soil was dried completely, and the soil samples with different degrees of saturation (20%, 40%, 60%, 80%, and 100%) were prepared with the corresponding mass moisture content. In order to ensure the uniform density of soil samples, the ring cover was used to vertically press the ring knife according to the Test Methods of Soil for Highway Engineering (JTG3430-2020), and then the soil samples in the ring knife were compacted and cut. The soil samples were all uniform cylinders with D = 6.175 cm, H = 2 cm, and V = 60 cm3. For unsaturated and saturated soil samples, quick shear was imposed without controlling the pore water and pore air pressures [23]. In the shear testing, samples were divided into five groups based on the moisture content (20%, 40%, 60%, 80%, and 100%), while four samples of each group were tested under different normal stress conditions (25 kPa, 50 kPa, 75 kPa, and 100 kPa) with a standard strain rate of 0.8 mm/min.
3. Test Result and Analysis
3.1. SWCC Test
3.1.1. SWCC Test Results
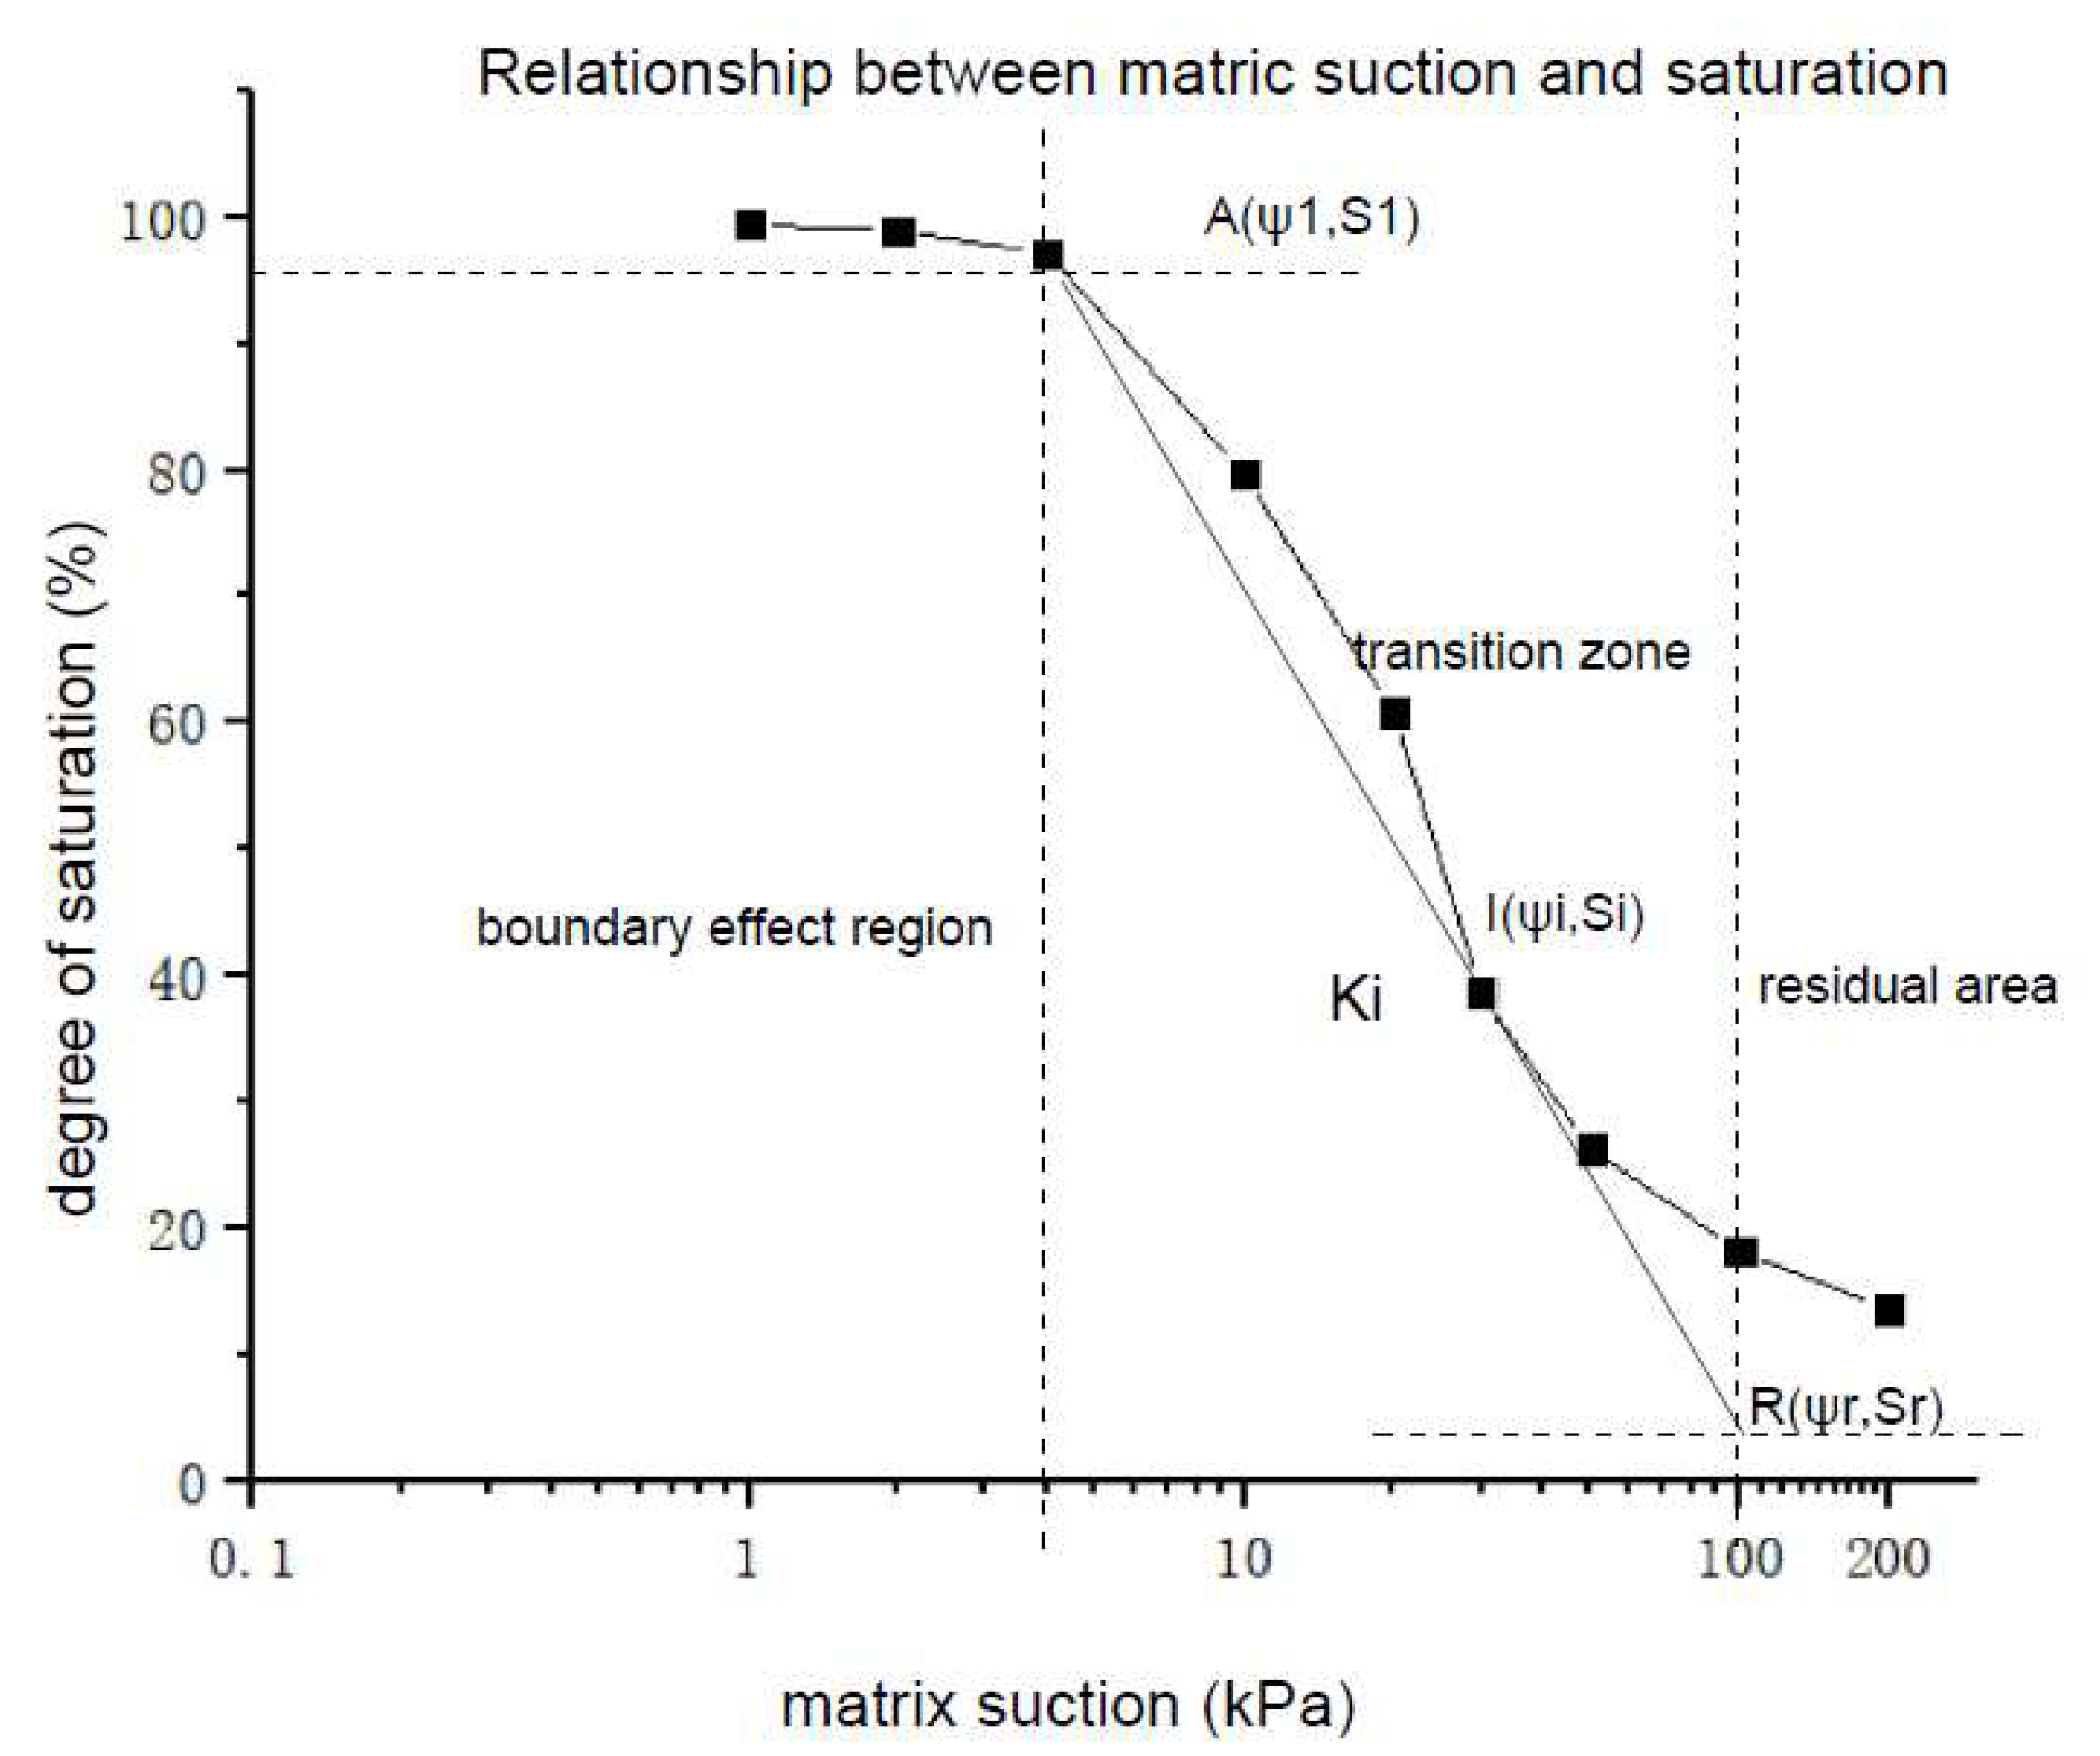
In the process of sample desaturation, the corresponding drying path soil–water characteristics curve can be obtained as shown in Figure 5 according to the corresponding degree of saturation and matric suction.
Figure 5 indicates that when the matric suction is less than the air-entry pressure when φ1 = 4 kPa, the soil is in the boundary effect zone. In this region, the increase in matric suction barely impacts the corresponding degree of the soil saturation [24,25]. As the matric suction increased, the moisture content of soil samples decreased drastically and eventually reached the reverse bending point at where matric suction was 25 kPa. The reverse bending point can reflect the soil moisture state under the corresponding water content, which changes from capillary gravity water to capillary-suspended turbidity water. Later, as the matric suction increased, the degree of saturation decreased to less than 13.68%, with the dispersing of pore water and pore gas in the pore interior. According to the curve analysis, the slope of the soil sample at the reverse bending point is Ki = 9.375 × 10⁴, and the specific water density of the soil sample represented the change in water content due to a change in until matric potential which is about 1.067 × 10⁻³ (mL/bar g). Furthermore, an increase in matric suction resulted in the soil until it approached the residual degree of saturation at Sr = 10%. Due to the equipment limitations, the maximum matric suction was set to 200 kPa, and the curve parameters were briefly determined by the method of brief drawing. In order to reduce the error caused by the traditional drawing method, the basic parameters of the curve are represented by the SWCC fitting parameters.
3.1.2. SWCC Model Fitting
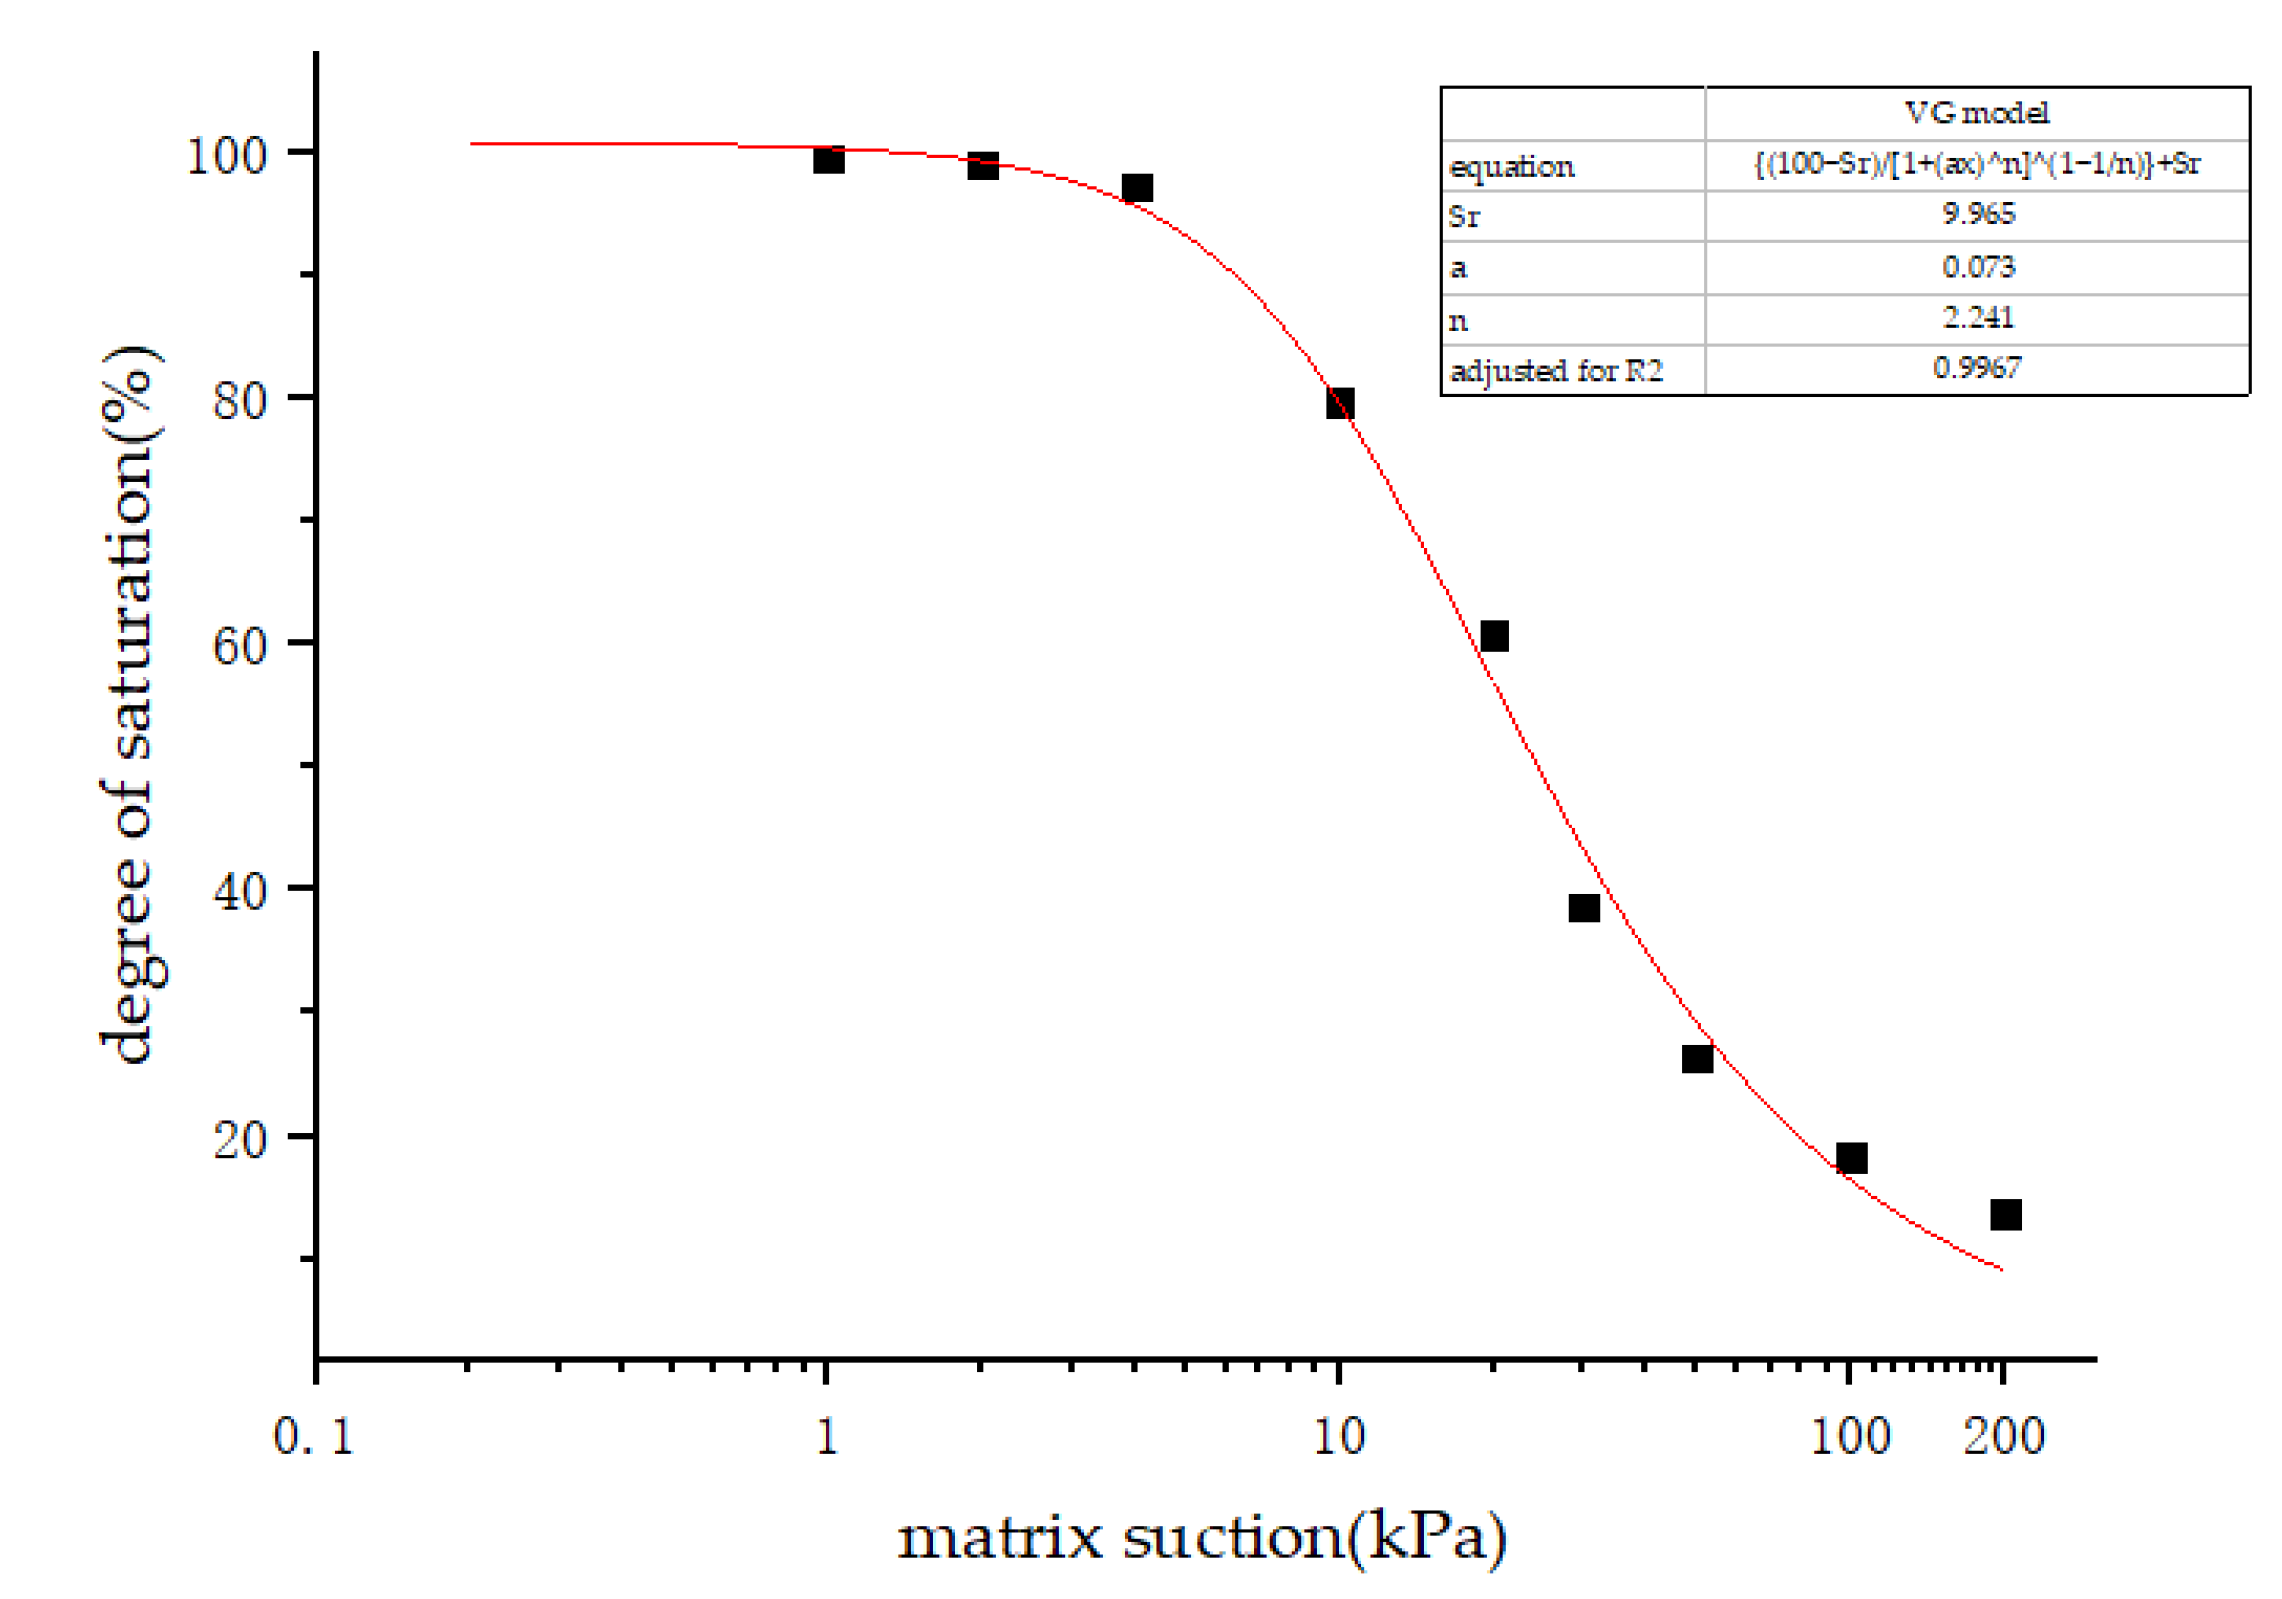
Van Genuchten proposed a mathematical model based on four fitting parameters, which can be expressed as:
where θs and θr are the saturated volumetric and residual volumetric water content, respectively; Sr and Se are the residual and effective degree of saturation, respectively; ψ is the suction pressure or matric suction; and a, m, n are the fitting parameters. The physical meaning of a, m, and n are the inverse of the air-entry pressure, the overall symmetry of the characteristics curve, and the pore size distribution of the soil, respectively, and it can be shown as m = 1 − 1/n [26,27,28,29].
Fitting is carried out through the 1 Stopt software based on the VG model which is shown in Figure 6 and the fitting parameters are listed in Table 2 [30].
Where, the fitting parameter a is slightly less than the reciprocal of the air-entry pressure, but within the error range; and the fitting parameter Sr is approximately equal to the value of the residual degree of saturation in the sample dehumidification curve.
In the drying process, the soil–water characteristics curve of silty soil in the lower Yellow River could then be expressed as:
3.2. Direct Shear Test
3.2.1. Direct Shear Test Results
According to the experimental data set, the relationship between shear displacement and shear stress with five moisture contents and four normal stress levels are shown in Figure 7.
Under the same moisture content, the shear stress increased with the increase in normal stress [31]. The shear strength of unsaturated silt in the lower Yellow River gradually decreased with the increase in moisture content.
When the moisture content was in the range of 5.30~21.10%, the shear strength decreased rapidly with the increase in moisture content. When the moisture content was higher than 21.10%, the shear strength decreased slowly with the increase and decrease in moisture content. When the moisture content reached 37.86%, the soil reached the degree of saturation state and the shear strength reached the lowest level.
When the moisture content was in the range of 5.30~21.10%, the shear stress increased gradually with the increase in shear displacement, and decreased rapidly after reaching the peak value, then finally tended to be stable. When the moisture content was higher than 21.10%, the shear stress increased gradually with the increase in shear displacement and tended to be stable after reaching the peak value.
With the increase in moisture content, the matric suction decreased gradually, resulting in the decrease in the structural force of the soil. In addition, when resistance to the external force or shear failure occurred, the strength of the soil continued to decline and the softening phenomenon disappeared gradually [32].
According to Mohr-Coulomb’s equation:
where τf is shear stress; σ is normal stress (here is the net normal stress σ − ua, where ua = 0); ctotal is the generalized cohesion; and φtotal is the generalized friction angle.
According to Equation (5), two strength parameters—generalized cohesion and generalized friction— and the angle of soil under the corresponding degree of saturation, are obtained, and these are shown in Table 3.
3.2.2. Effect of Moisture Content on Shear Strength Parameters
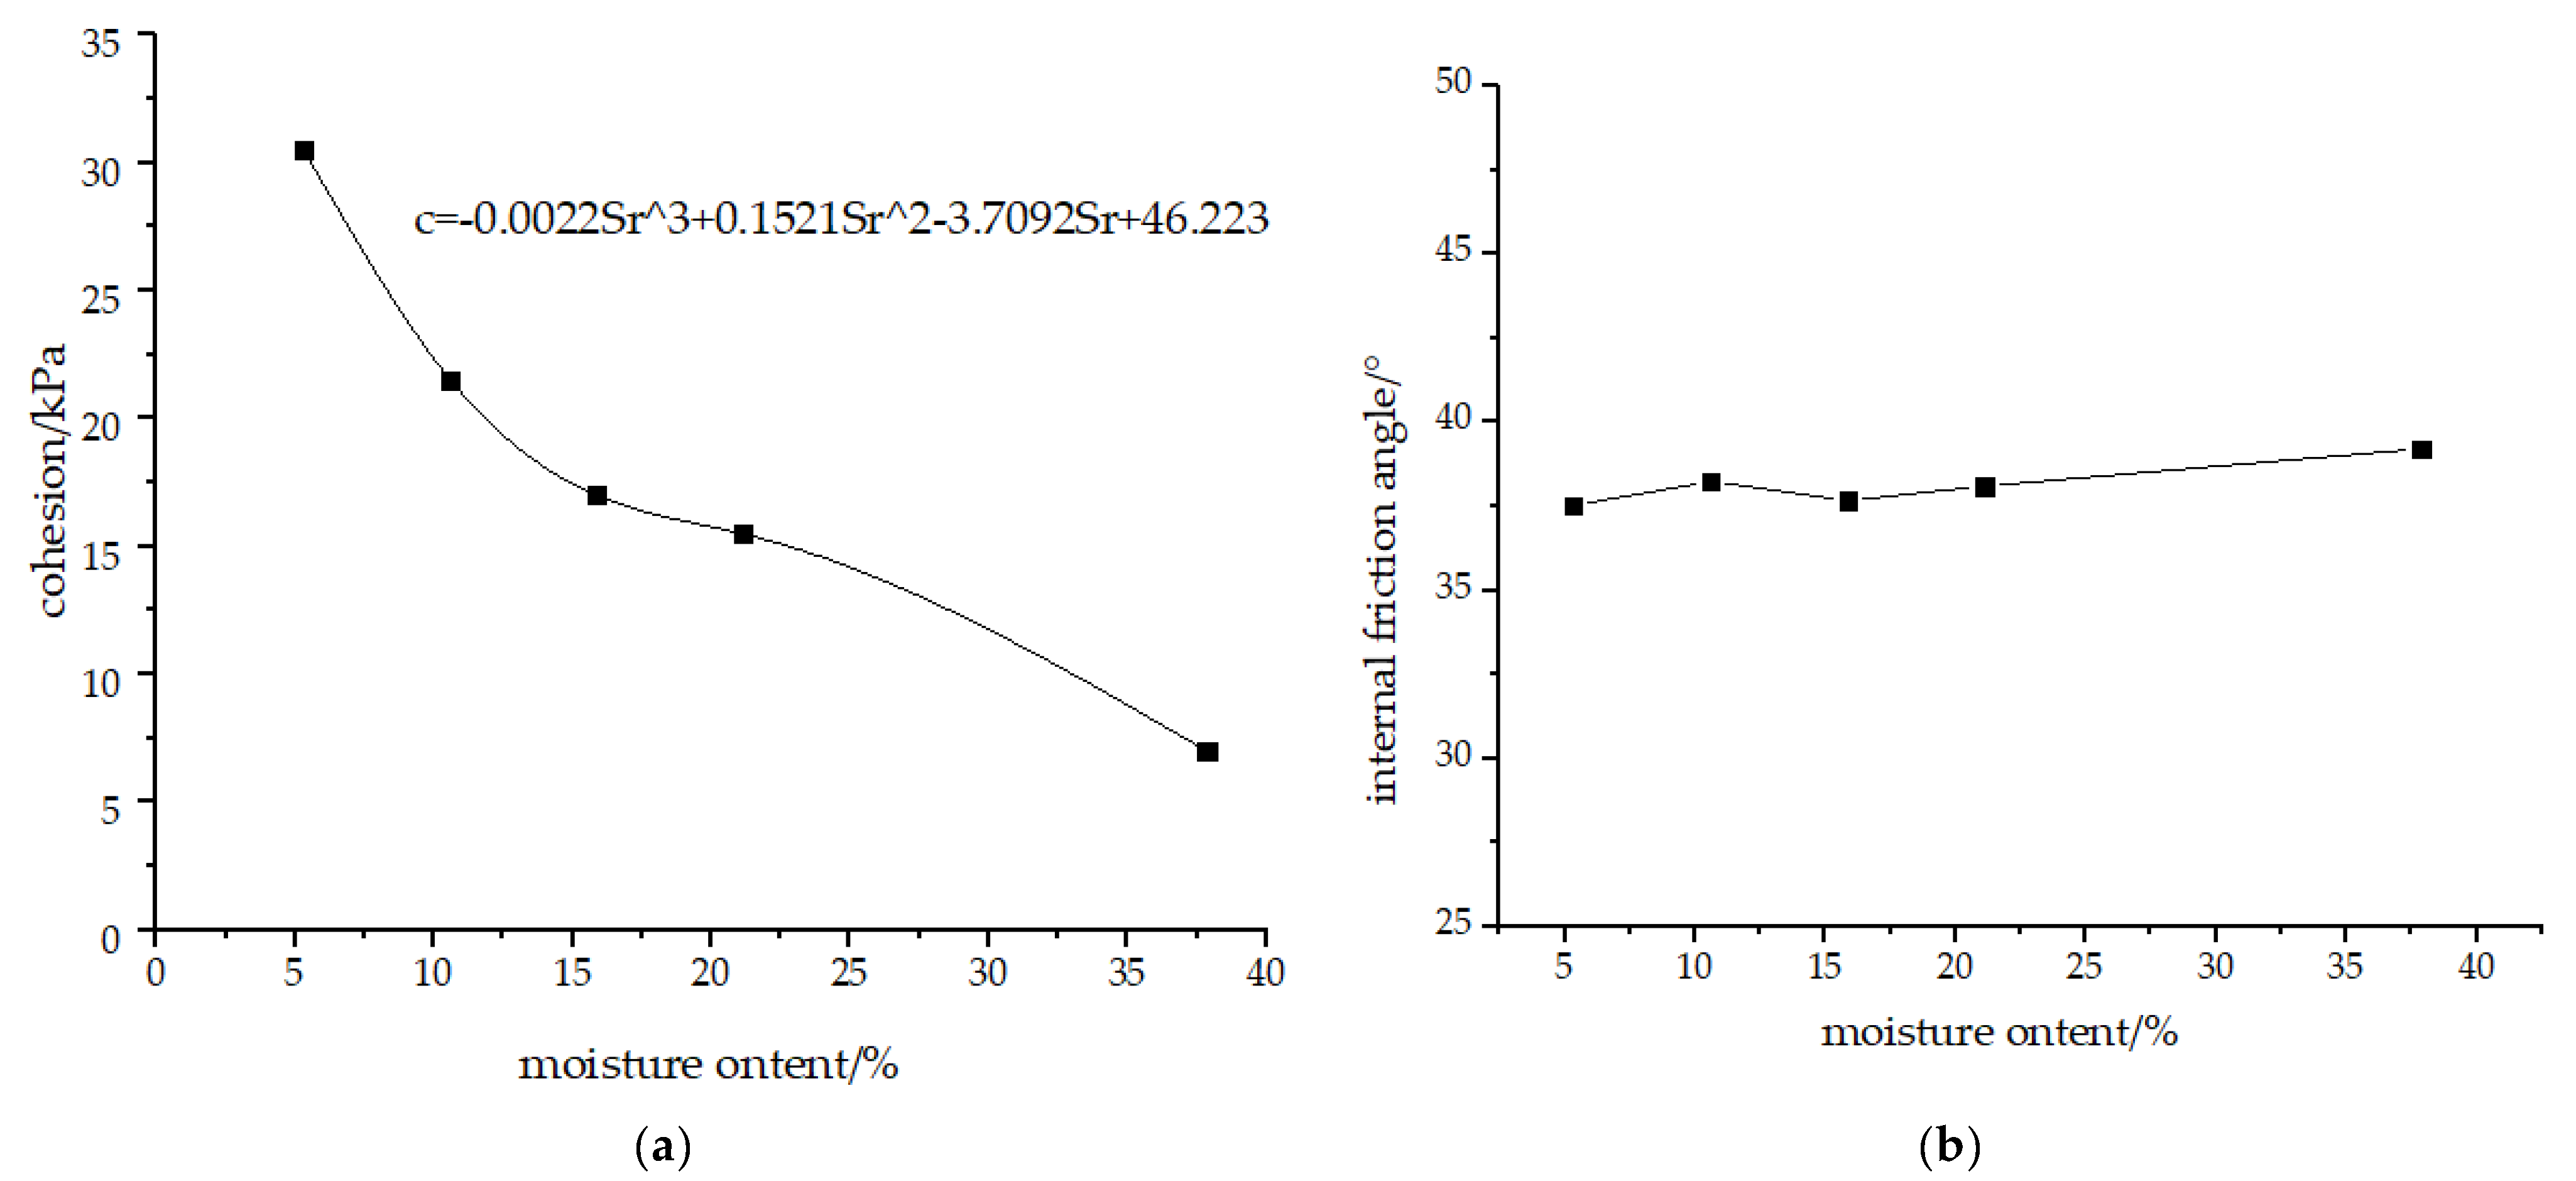
The relationship between the shear strength parameters and moisture content is shown in Figure 8:
With the increase in moisture content, the rate of cohesion decreased from fast to slow and then increased to fast, presenting an S-shaped curve (Figure 8a) which was possibly due to the variability of the experimental data. Through regression analysis of cohesion and moisture content, the quantitative relationship in Equation (6) can be obtained:
Generally, the increase in moisture content will result in the fluctuation of the internal friction angle by a small range and there is no obvious rule for this phenomenon.
3.3. Prediction of Shear Strength Parameters of Unsaturated Silt in the Lower Yellow River
The uncertainty of the effective stress parameter χ and the difficulty in measuring matric suction make it challenging to evaluate the strength of the unsaturated soil based on Bishop’s shear strength equation. However, a certain relationship between moisture content and matric suction can be disclosed through investigation, as shown by the soil–water characteristics curve. Therefore, the shear strength of unsaturated soil should be related to its SWCC. The underlying assumption of this methodology is that the same SWCC applies at Ko and failure conditions, irrespective of the fabric state, due to the influence of moisture content on the soil strength test. The determination of the strength parameters of saturated soil is much easier than that of unsaturated soil. Based on the soil–water characteristics curve and the shear strength parameters measured by the direct shear test, an effective stress parameter expression of unsaturated soil samples can be determined. The strength of unsaturated silty soil under different degrees of saturation can be predicted by combining the expression of effective stress parameters, the expression of matric suction predicted by SWCC, and the expression of the soil strength parameters of saturated soil.
3.3.1. Study on the Effective Stress Parameters χ
To date, the commonly used unsaturated soil strength equation and the effective stress parameters in the corresponding equation can be summarized (Table 4).
3.3.2. Prediction of Effective Stress Parameters χ of Unsaturated Silt in The Lower Yellow River
Based on the soil–water characteristics curve and Equation (4), the matric suction of this kind of soil under the corresponding degree of saturation can be calculated. Following this, the effective stress parameter χ under the corresponding degree of saturation can be calculated (Table 5) by Bishop’s shear strength Equation (1) of unsaturated soil, according to the known matric suction and the cohesion and internal friction angle of saturated soil obtained by direct shear test (Table 3).
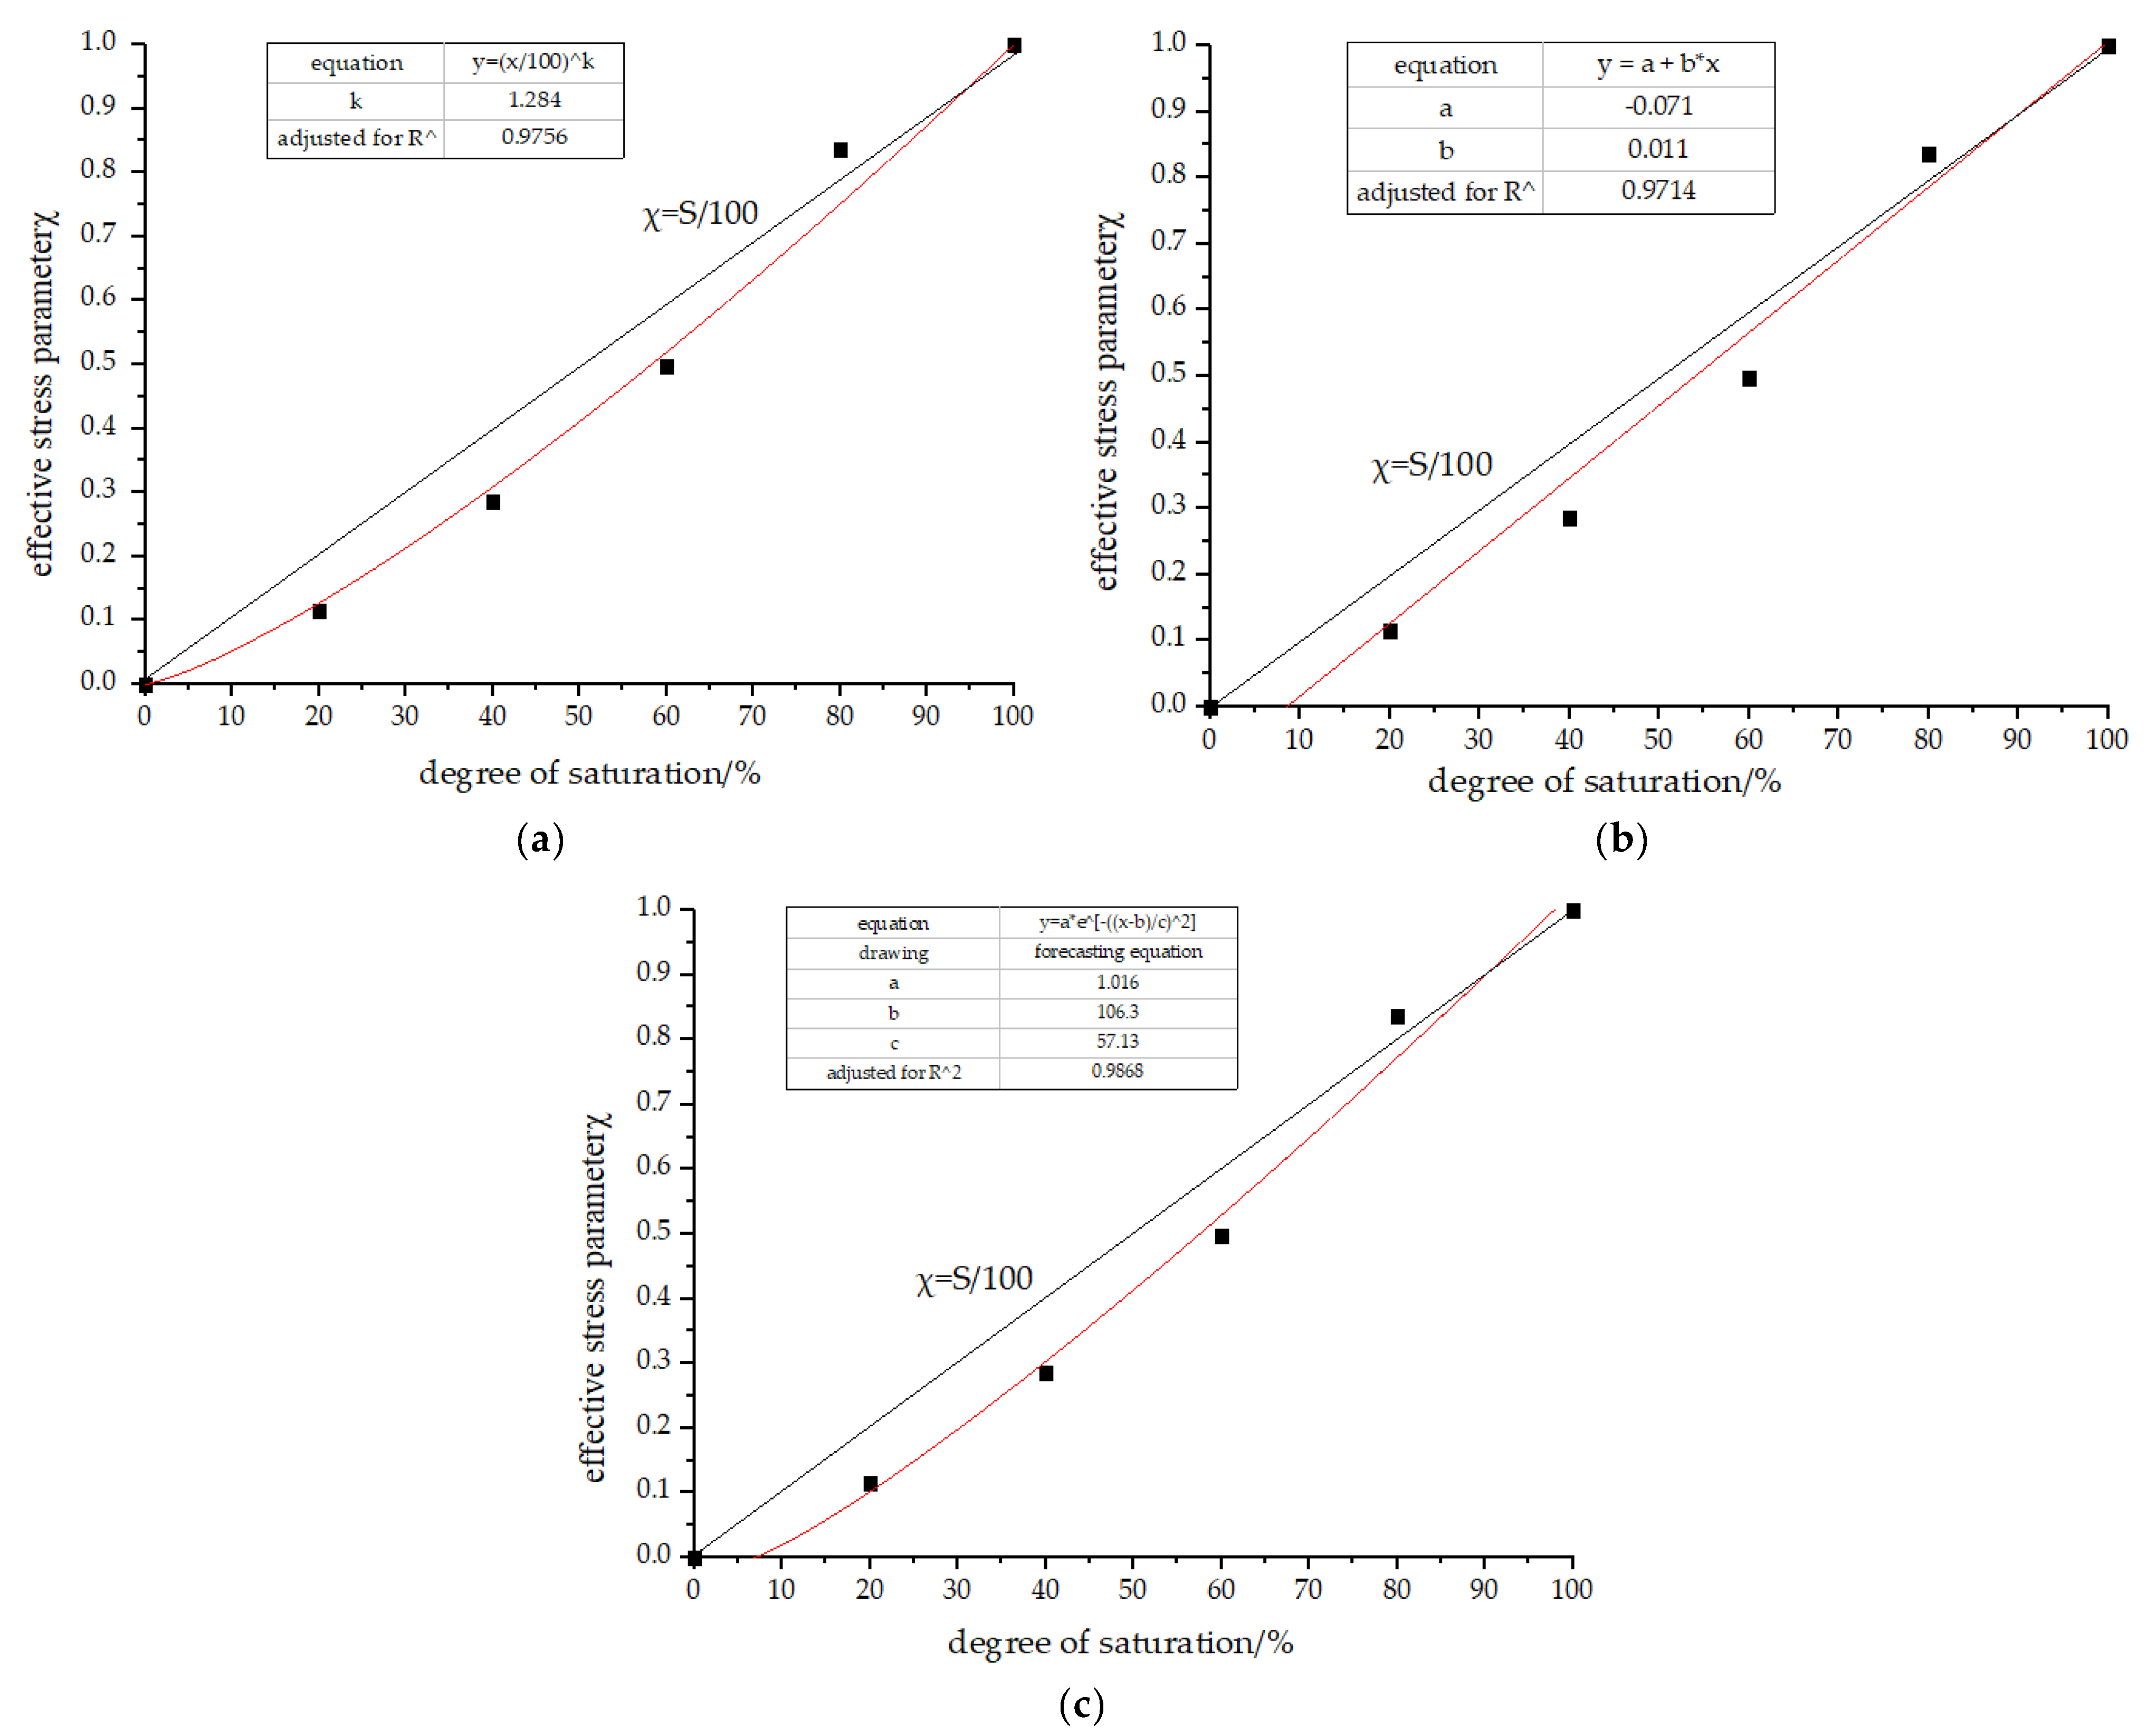
Using experimental data, the conjecture of Khalili’s equation for predicting additional suction strength from the soil–water characteristics curves [33] can be fitted, as shown in Figure 9a:
Meanwhile, the conjecture of Vanapalli and Fredlund’s equation for unsaturated soil strength at different moisture contents [34] can also be established based on the experimental data, as shown in Figure 9b:
Since the effective stress parameters increase with the increase in the degree of saturation, a three-parameter model is proposed to determine the effective stress parameter χ.
where χ is the effective stress parameter, S is degree of saturation, 0 ≤ χ ≤ 1. When the degree of saturation is S = 100%, χ = 1.When the degree of saturation is S = 0, χ = 0. a, b and c are the fitting parameters, where a is the regulating coefficient while b and c are the influencing coefficients of saturation degree on the effective stress parameters.
The obtained fitting image is shown in Figure 9c, and the fitting parameters are as follows: a = 1.016, b = 106.3, c = 57.13, .
As for the forecasting equation, when S = 0, χ is not equal to 0; when S = 100%, χ is slightly greater than 1. It can be seen from the curve that the forecasting equation is more suitable for wet silt with a high degree of saturation within a reasonable range rather than dry silt with low degree of saturation. Since , the prediction equation with the advantage of easy use, can produce a better fitting effect for the 20 groups of normal stress data compared with the former. Additional effective stress parameters can be predicted through empirical equations by using moisture content (degree of saturation) as follows:
3.3.3. Prediction of Shear Strength of Unsaturated Silt in The Lower Yellow River
When fitting the VG model Equation (4), matric suction ua − uw can be expressed in the function of saturation degree as shown below:
According to Equations (10) and (11), Bishop’s shear strength Equation (1) for the shear strength of silt in the lower Yellow River can be written as follows:
where, S is the degree of saturation, c′ is the effective cohesion of saturated condition, φ′ is the internal friction angle of saturated condition.
4. Conclusions
Through the soil–water characteristics curve test, the VG model fitting, the direct shear test analysis, and the shear strength prediction, the following conclusions can be drawn:
- The drying curve of silt samples from the lower Yellow River can be fitted by using the VG model, and the fitting parameters are as follows: a = 13.699 (kPa−1), m = 0.554, n = 2.241, and Sr = 9.965 (%);
- As moisture content changes from a lower state to a higher state, the shear displacement and shear stress curves show shear softening and shear hardening behavior, respectively;
- Moisture content has a nonlinear inverse relationship with cohesion. The increase in moisture content results in a variation of friction angle and no clear law for this variation is defined. Furthermore, compared with the internal friction angle, moisture content has a greater influence on cohesion;
- The relationship between effective stress parameters and the degree of saturation of the silt in the lower Yellow River is proposed and validated by tests on the specific sample material in this study, which can be expressed as follows:
- 5.
- Based on the Bishop’s shear strength equation, this study suggests an empirical equation of shear strength for silt in the lower Yellow River channel, which includes the function of cohesion, friction angle and suction. The shear strength can be evaluated at the corresponding suction with a certain cohesion and friction angle, by using the equation below.
Author Contributions
Conceptualization, Y.-Y.C., L.-X.L. and J.-P.W.; Data curation, X.-G.G.; Formal analysis, Y.-Y.C.; Funding acquisition, L.-X.L. and J.-P.W.; Investigation, Y.-Y.C. and T.-H.L.; Methodology, Y.-Y.C. and J.-P.W.; Resources, W.D.; Software, Y.-Y.C. and A.H.; Supervision, W.D. and J.-P.W.; Validation, A.H.; Visualization, T.-H.L.; Writing—original draft, Y.-Y.C. and X.-G.G.; Writing—review & editing, L.-X.L. and J.-P.W. All authors have read and agreed to the published version of the manuscript.
Funding
This work was supported by the National Key Research and Development Program of China (No.2021YFE0194300), and the National Natural Science Foundation of China (Grant nos.51909139 and 52011530458).
Data Availability Statement
All data used and analyzed during the present study will be available from the corresponding author if deemed necessary.
Acknowledgments
The corresponding author Ji-peng Wang acknowledge the Taishan Scholar Program of Shandong Province, China and Qilu Young Scholar Program of Shandong University.
Conflicts of Interest
The authors declare that there is no conflict of interest regarding the publication of this paper.
References
- Shang, Q.; Yao, Z.; Liu, S. Research on the characteristics of soils for road engineering in the Yellow River Delta Region. J. Highw. Transp. Res. Dev. 1996, 13, 10–15. [Google Scholar]
- Xie, D. Thinking of soil mechanics in the 21st century. CJGE 1997, 4, 111–114. [Google Scholar]
- Xie, D.; Feng, Z. On some basic views in the study of effective stress in unsaturated soils. CJGE 2006, 2, 170–173. [Google Scholar]
- Wang, H.; Meng, X.; Lin, C. Research on the main issues and key work of ecological protection and high-quality development in the Yellow River Basin. China Water Resour. 2021, 18, 6–8. [Google Scholar]
- Zheng, M.; Li, Z.; Liu, L.; Zhang, Q. Discussion on ecological protection measures in Yellow River Basin. Water Resour. Dev. Res. 2012, 12, 65–69. [Google Scholar]
- Scholtès, L.; Hicher, P.Y.; Nicot, F.; Chareyre, B.; Darve, F. On the capillary stress tensor in wet granular materials. Int. J. Numer. Anal. Met. 2009, 33, 1289–1313. [Google Scholar] [CrossRef] [Green Version]
- Bishop, A.W.; Alpan, I.; Blight, G.E. Factors controlling the shear strenth of partly saturated cohesive soil. ASCE Conf. Shear Strength Cohesive Soils 1960, 503, 503–532. [Google Scholar]
- Khalili, N.; Geiser, F.; Blight, G.E. Effective stress in unsaturated soils: Review with new evidence. Int. J. Geomech. 2004, 4, 115–126. [Google Scholar] [CrossRef]
- Lin, H.; Li, H.; Yu, Y.; Lu, H. Effect of matric suction on shear strength of unsaturated soils. Rock Soil Mech. 2007, 9, 1931–1936. [Google Scholar]
- Sheng, D.; Zhou, A.; Fredlund, D.G. Shear strength criteria for unsaturated soils. Geotech. Geol. Eng. 2011, 29, 145–159. [Google Scholar] [CrossRef]
- Fredlund, D.G.; Morgenstern, N.R.; Widger, R.A. Shear strength of unsaturated soils. Can. Geotech. J. 1978, 15, 313–321. [Google Scholar] [CrossRef]
- Al-Aqtash, U.; Bandini, P. Prediction of unsaturated shear strength of an adobe soil from the soil–water characteristic curve. Constr. Build. Mater. 2015, 98, 892–899. [Google Scholar] [CrossRef]
- Huang, Y.; Zhang, Y. Soil-water characteristic curves and structural strength theory for unsaturated soils. Rock Soil Mech. 2002, 3, 268–271, 277. [Google Scholar]
- Guo, L.; Hu, B.; Song, Y.; Zhang, G. Comparative study on shear strength prediction of unsaturated soils by soil-water characteristic curves. J. Eng. Geol. 2013, 21, 849–856. [Google Scholar]
- Zhang, T.; Le, J.; Zhang, J. Influence of dry-wet cycle on silt roadbed strength in eastern Henan and its prediction. Highway 2016, 61, 200–206. [Google Scholar]
- Zhang, J.; Liu, Z.; Zhang, J.R. Experimental study on hydraulic and mechanical properties of unsaturated silt in eastern Henan Province. Highway 2021, 66, 292–296. [Google Scholar]
- Huang, K.; Wan, J.; Chen, G.; Zeng, Y. Testing study of relationship between moisture content and shear strength of unsaturated soils. Rock Soil Mech. 2012, 33, 2600–2604. [Google Scholar]
- Ding, X.; Ma, L.; Lin, W.; Jin, Y.; Li, Y.; Wang, Z. Experimental study on pore structure and soil-water characteristic curve of unsaturated remolded weakly expanding soil. J. Rock. Mech. Eng. 2022, 41, 3081–3090. [Google Scholar]
- Shen, C.; Fang, X.; Wang, H.; Sun, S.; Guo, J. Effects of suction, moisture content and dry density on shear strength of remolded unsaturated soils. Rock Soil Mech. 2009, 30, 1347–1351. [Google Scholar]
- Bishop, A.W.; Donald, I.B. Experimental study of partly saturated soil in triaxial apparatus. In Proceedings of the 15th International Conference on Soil Mechanics and Foundation Engineering, Mexico City, Mexico, 29 August 1969; Volume 7, pp. 13–21. [Google Scholar]
- Perez-Garcia, N.; Houston, S.L.; Houston, W.N.; Padilla, J.M. An oedometer-type pressure plate SWCC apparatus. Geotech. Test. J. 2008, 31, 115–123. [Google Scholar]
- Ye, Y.; Zhou, L.; Liu, X. Influence of pervious stone on drainage of Geo-experts soil-water characteristic curve pressure plate instrument. Coal. Geol. Explor. 2015, 43, 74–78. [Google Scholar]
- Sun, S.; Xu, H. Determining the Shear Strength of Unsaturated Silt. Exp. Unsatur. Soil. Mech. 2007, 112, 195–206. [Google Scholar]
- Zhang, J.; Yang, S.; Tan, Z.; Li, X. Probabilistic prediction model of soil-water characteristic curve for unsaturated sand based on particle size distribution curve. J. Eng. Geol. 2022, 30, 301–308. [Google Scholar]
- Miguel, M.G.; Bonder, B.H. Soil–water characteristic curves obtained for a colluvial and lateritic soil profile considering the macro and micro porosity. Geotech. Geol. Eng. 2012, 30, 1405–1420. [Google Scholar] [CrossRef]
- Fang, W.; Li, W.; Zeng, X. Nonlinear shear strength of unsaturated soils based on Van Genuchten model. CJAM 2019, 36, 1220–1226+1266. [Google Scholar]
- Li, S.; Xie, Y.; Xin, Y.; Liu, G.; Wang, W.T.; Gao, X.F.; Zhai, J.R.; Li, J. Validation and Modification of the Van Genuchten Model for Eroded Black Soil in Northeastern China. Water 2020, 12, 2078. [Google Scholar] [CrossRef]
- Russo, D. Determining soil hydraulic properties by parameter estimation: On the selection of a model for the hydraulic properties. Water Resour. Res. 1988, 24, 453–459. [Google Scholar] [CrossRef]
- Kosugi, K. Three-parameter lognormal distribution model for soil water retention. Water Resour. Res. 1994, 30, 891–901. [Google Scholar] [CrossRef]
- Zhen, X.; Wang, H.; Li, Y.; Zhu, J. A method for drawing soil-water characteristic curves using Origin 8.0. Ningxia Eng. Technol. 2016, 15, 262–265, 269. [Google Scholar]
- Gan, J.K.M.; Fredlund, D.G.; Rahardjo, H. Determination of the shear strength parameters of an unsaturated soil using the direct shear test. Can. Geotech. J. 1988, 25, 500–510. [Google Scholar] [CrossRef]
- Li, X.S. Effective stress in unsaturated soil: A microstructural analysis. Geotechnique 2003, 2, 273–277. [Google Scholar] [CrossRef]
- Khalili, N.; Khabbaz, M.H. A unique relationship for the determination of the shear strength of unsaturated soils. Geotechnique 1998, 48, 681–687. [Google Scholar] [CrossRef]
- Vanapalli, S.K.; Fredlund, D.G.; Pufahl, D.E.; Clifton, A.W. Model for the Prediction of Shear Strength with respect to Soil Suction. Can. Geotech. J. 1996, 33, 379–392. [Google Scholar] [CrossRef]
Figure 1.
The map of the sampling area.

Figure 2.
Particle gradation curve.

Figure 3.
SD-SWCC pressure plate tester test drawing.

Figure 4.
FDJ-20 unsaturated direct shear instrument.

Figure 5.
Sample dehumidification curve.

Figure 6.
Fitting diagram of SWCC.

Figure 7.
The relationship between shear stress and shear displacement under different moisture contents. (a) Moisture content 5.30% (degree of saturation 20%); (b) Moisture content 10.60% (degree of saturation 40%); (c) Moisture content 15.85% (degree of saturation 60%); (d) Moisture content 21.10% (degree of saturation 80%); and (e) Moisture content 37.86% (degree of saturation 100%).

Figure 8.
The Relationship Between Shear Strength Parameters and Moisture Content. (a) Cohesion of Yellow River silt under different moisture contents; and (b) Internal friction angle of Yellow River silt under different moisture contents.
Figure 8.
The Relationship Between Shear Strength Parameters and Moisture Content. (a) Cohesion of Yellow River silt under different moisture contents; and (b) Internal friction angle of Yellow River silt under different moisture contents.

Figure 9.
Simulation diagram of the relationship curve between saturation and the effective stress parameter. (a) Khalili N’s conjectures curve fitting diagram [33]; (b) Van apalli and Fred lund’s conjectures curve fitting diagram [34]; and (c) the forecasting equation curve fitting diagram.


Table 1.
The physical parameters of the soil samples.
| Yellow River Silt | Natural Moisture Content ω/% | Natural Gravity Gs/kN/m3 | Void Ratio e | Natural Saturation S′/% |
| 15.38 | 25.10 | 0.663 | 58.23 |
Note: natural moisture content, ω = mw/ms, natural gravity, GS = ρg, void ratio, e = VV/VS, natural saturation, S′ = VW/VV.
Table 2.
Fitting parameter value statistics.
| Fitting Parameters | a/kPa−1 | m | n | Sr/% |
|---|---|---|---|---|
| VG model fitting values | 0.0730 | 0.554 | 2.241 | 9.965 |
Table 3.
Shear strength index of Yellow River silt.
| Moisture Content ω (%) | Degree of Saturation S (%) | Normal Stress σ (kPa) | τmax (kPa) | ctotal (kPa) | φtotal (°) |
|---|---|---|---|---|---|
| 5.30% | 20% | 25 | 48 | 30.5 | 37.52 |
| 50 | 73 | ||||
| 75 | 85 | ||||
| 100 | 108 | ||||
| 10.60% | 40% | 25 | 42 | 21.5 | 38.24 |
| 50 | 58 | ||||
| 75 | 84 | ||||
| 100 | 99 | ||||
| 15.85% | 60% | 25 | 37 | 17 | 37.67 |
| 50 | 53 | ||||
| 75 | 78 | ||||
| 100 | 93 | ||||
| 21.10% | 80% | 25 | 33 | 15.5 | 38.10 |
| 50 | 57 | ||||
| 75 | 76 | ||||
| 100 | 92 | ||||
| 37.86% | 100% | 25 | 24 | 7 | 39.21 |
| 50 | 52 | ||||
| 75 | 70 | ||||
| 100 | 86 |
Table 4.
Commonly used unsaturated soil strength equation.
| Name | Unsaturated Soil Strength Equation is Commonly Used Currently | Meaning of Physical Quantity |
|---|---|---|
| The Effective Stress Parameters in the Shear Strength Equation Are Summarized | ||
| Bishop’s shear strength equation [7] | τf is shear stress at failure; c′ is effective cohesion of saturated soil; σ is net normal stress; ua is the pore water pressure; uw is the pore gas pressure; χ is effective stress parameters; φ′ is effective angle of internal friction of saturated soil. | |
| Khalili’s equation for predicting additional suction strength from soil–water characteristics curves [29] | θ(ψ) is volumetric water content under different suction forces which is represented by the soil–water characteristics curve equation; θs is saturated volumetric water content; K is a fitting parameter for effective stress. | |
| Vanapalli and Fredlund’s equation for unsaturated soil strength at different moisture content [30] | θ is volumetric water content; θr is residual volumetric water content; Se is the effective degree of saturation; Sr is the residual degree of saturation. | |
Table 5.
Effective stress parameters χ deduced from SWCC.
| Degree of Saturation S/% | Matric Suction/kPa | Normal Stress /kPa | Shear Strength/kPa | Angle of Internal Friction/° | Cohesion/kPa | Effective Stress Parameters χ | Average Value of χ |
|---|---|---|---|---|---|---|---|
| 0 | / | / | / | / | / | / | 0.000 |
| 20 | 79.52 | 25 | 48 | 37.52 | 30.5 | 0.087 | 0.115 |
| 50 | 73 | 0.182 | |||||
| 75 | 85 | 0.064 | |||||
| 100 | 108 | 0.126 | |||||
| 40 | 31.04 | 25 | 42 | 38.24 | 21.5 | 0.319 | 0.286 |
| 50 | 58 | 0.168 | |||||
| 75 | 84 | 0.425 | |||||
| 100 | 99 | 0.233 | |||||
| 60 | 18.19 | 25 | 37 | 37.67 | 17 | 0.548 | 0.498 |
| 50 | 53 | 0.313 | |||||
| 75 | 78 | 0.719 | |||||
| 100 | 93 | 0.413 | |||||
| 80 | 10.69 | 25 | 33 | 38.10 | 15.5 | 0.585 | 0.836 |
| 50 | 57 | 1.110 | |||||
| 75 | 76 | 1.038 | |||||
| 100 | 92 | 0.609 | |||||
| 100 | 0 | / | / | 39.21 | 7 | / | 1.000 |
Publisher’s Note: MDPI stays neutral with regard to jurisdictional claims in published maps and institutional affiliations. |
© 2022 by the authors. Licensee MDPI, Basel, Switzerland. This article is an open access article distributed under the terms and conditions of the Creative Commons Attribution (CC BY) license (https://creativecommons.org/licenses/by/4.0/).
Share and Cite
MDPI and ACS Style
Cheng, Y.-Y.; Gao, X.-G.; Liu, T.-H.; Li, L.-X.; Du, W.; Hamad, A.; Wang, J.-P. Effect of Water Content on Strength of Alluvial Silt in The Lower Yellow River. Water 2022, 14, 3231. https://doi.org/10.3390/w14203231
AMA Style
Cheng Y-Y, Gao X-G, Liu T-H, Li L-X, Du W, Hamad A, Wang J-P. Effect of Water Content on Strength of Alluvial Silt in The Lower Yellow River. Water. 2022; 14(20):3231. https://doi.org/10.3390/w14203231
Chicago/Turabian StyleCheng, Yang-Yang, Xu-Guang Gao, Tai-Heng Liu, Lian-Xiang Li, Wei Du, Abu Hamad, and Ji-Peng Wang. 2022. "Effect of Water Content on Strength of Alluvial Silt in The Lower Yellow River" Water 14, no. 20: 3231. https://doi.org/10.3390/w14203231
Note that from the first issue of 2016, this journal uses article numbers instead of page numbers. See further details here.