Article

Research and Application of the Mutual Feedback Mechanism of a Regional Natural-Social Dualistic Water Cycle: A Case Study in Beijing–Tianjin–Hebei, China

1
Department of Hydraulic Engineering, Tsinghua University, Beijing 100084, China
2
State Key Laboratory of Simulation and Regulation of Water Cycle in River Basin, China Institute of Water Resources and Hydropower Research (IWHR), Beijing 100038, China
*
Author to whom correspondence should be addressed.
Water 2022, 14(20), 3227; https://doi.org/10.3390/w14203227
Submission received: 23 September 2022 / Revised: 9 October 2022 / Accepted: 10 October 2022 / Published: 13 October 2022
(This article belongs to the Section Hydrology)

Abstract

:
With the intensification of human activities, the natural water cycle has a significant nature-society dual feature, and identifying the mutual feedback mechanism between natural and social water cycles is an important basis for a more accurate simulation of the dualistic water cycle. In this study, two indexes of cumulative runoff change rate and social water cycle feedback rate are put forward, representing the degree of change in socio-hydrological unit runoff under the mutual feedback of the natural social water cycle in all upstream regions, and the degree influence of the water intake, consumption, and discharge process of the social water cycle on the natural water cycle in the socio-hydrological unit, respectively. Taking the Beijing–Tianjin–Hebei region, which is marked by strong human activities, as the study area, the 2035 natural-social dualistic water cycles were simulated by a water allocation and simulation (WAS) model. Different water supply types and use structures cause the social water cycle to increase or decrease local runoff in different areas. The social water cycle feedback rate is greater than 1 in Beijing and Tianjin, and less than 0.25 in the mountainous areas and the Hebei plain, indicating that the social water cycle of each unit in the Beijing–Tianjin–Hebei region increases or decreases local runoff due to different water supply types and use structures. The cumulative runoff change rate in this region was 0.66, indicating that the overall runoff was attenuated due to the social water cycle, and runoff attenuation was greater in the south than the north.

1. Introduction

With economic and societal development, human activities have gradually increased in intensity, and the impact on the natural water cycle is more significant. Meanwhile, large-scale development and utilization of water resources alters the temporal and spatial distribution of the natural water cycle, which begins to show a significant natural–social dualistic characteristic [1]. In traditional hydrology, the influence of human activities and water resource management are often regarded as external factors of the natural water cycle, and it is difficult to identify the dynamic mutual feedback mechanism between the natural water cycle and human society. Therefore, how to comprehensively evaluate the natural society dualistic water cycles and quantitatively analyze the mutual feedback relationship between the natural water cycle and human society is important to achieve the sustainable utilization of water resources.
Research on the dynamic mutual feedback between human society and the natural water cycle has attracted significant worldwide attention. In early studies, some scholars proposed the interaction between human activities and the natural water cycle, while research on the dynamic mutual feedback between human activities and the natural water cycle requires further study [2,3,4,5]. In the past decade, with an increased understanding of human activities and natural water cycle processes, concepts such as the coupled human and natural systems (CHANS) relationship [6], socio-hydrology [7], and natural society dualistic water cycles [8] have been proposed. Although there are differences in their expression, the core content reflects the temporal and spatial relationship between the natural water cycle and the process of social water intake, consumption, and discharge under the influence of human activities.
Sivapalan (2012) [7] proposed that socio-hydrology is a new science relating to people and water, focusing mainly on the evolution of the human–water coupling system and the mutual feedback mechanism, which has been widely used in many countries. For example, Roobavannan et al. (2020) [9] links the dynamics of basin economy to a community sensitivity state variable to construct a social-hydrological model based on system dynamics, and studies the future sustainable development status of the watershed under climatic and economic changes. Liu et al. (2015) [10] constructed a social-hydrological model that includes hydrological, ecological, economic, and social subsystems based on the characteristics of the Tarim River Basin in China, and analyzed the co-evolution characteristics of the hydrological system, as well as the complex interaction and feedback relationship between humans and water. Emmerik et al. (2014) [11] constructed a two-way coupling social-hydrological model between human and hydrological systems in the Murrumbidgee River Basin in Australia based on nonlinear ordinary differential equations. This reveals that the pendulum swing phenomenon is due to the competition between the productive forces of humans and the restorative forces of the environment. Enteshari et al. (2020) [12] investigated the interaction between the water and socioeconomic systems in Zayandehrud, Iran, based on a system dynamics model. They found that a water resource management policy based on social hydrology is more conducive to the sustainable development of regional water and socio-economic systems. In the Saskatchewan River Basin, Canada, the adoption of a social-hydrology framework has become an important approach to solve the water security of the local dynamic and complex water system, owing to the competition for water across economic sectors and among provinces, between upstream and downstream users, and in other situations [13]. In addition, the social-hydrology framework has been used in different research fields, such as hydropower development [14], groundwater resource management [15], flood management [16,17], and channel flow management in complex river basins [18].
Wang et al. (2016) [19] proposed the theory of natural society dualistic water cycles, and realized the coupling simulation of natural and social water cycle processes through measurement, separation, coupling, modeling, and regulation. Numerous scholars have studied water resource management based on this theory: for example, Liang et al. (2022) [20] researched multi-scenario water resource regulation based on this framework. Liu et al. (2019) [21] evaluated regional water security in China, and Zhang et al. (2017) [22] proposed a regional water cycle health evaluation method based on the theory of natural society dualistic water cycles. Studies have mainly focused on comprehensive simulations of natural and social water cycles and their evolutionary relationship, which has been applied to many areas of China, such as the Haihe River Basin [23,24], Yellow River Basin [25,26], Liaohe River Basin [27], Xinjiang province [28], and other basins or regions with high human influence. In addition, “Panta Rhei—Everything Flows: Change in hydrology and society” was proposed as a research theme in the 10-year Scientific Plan (2013–2022) of the International Hydrological Association [29].
To quantitatively analyze the interaction between the natural water cycle and society, many scholars have developed corresponding models based on the hydrological model, such as the natural society dualistic water cycles simulation, carried out by coupling human activities. For example, Zhao et al. (2021) [30] constructed the Système Hydrologique Europeen (SHE) model of the Han River in China from the perspective of social hydrology, simulating the potential evolutionary path of the social-hydrological system. Elshafei et al. (2015) [31] constructed a social-hydrodynamics model in the Toolibin watershed, Australia, by adding social modules to the LASCAM model, capturing positive and negative feedback interactions between human and natural systems in the region. Tesfatsion et al. (2017) [32] developed an open source WACCShed software, which can be used to study the interaction among hydrology, climate, and decision making in a watershed. Essenfelder et al. (2018) [33] coupled the Soil and Water Assessment Tool (SWAT) model with the PMAUP (Positive Multi-Attribute Utility Programming) model and the ecologic model by adopting the hydrological economy representative unit (HERUs) to realize a collaborative simulation of socioeconomic and eco-hydrological systems. In addition to hydrological models, many studies have adopted system dynamics [12], the agent-based model (ABM) [34], the water economy model [35], and other models and methods to study the impact of social activities on the natural water cycle. For example, Li et al. (2019) [36] constructed a social-hydrological model based on the system dynamics of the relationship among different state variables such as population, water for living and production, groundwater levels, and community sensitivity, and studied the future water resource sustainability of Beijing under dynamic changes. Pouladi et al. (2019) [37] investigated local farmers in Urmia Lake in Iran through interviews and questionnaires, and built a social-hydrological framework based on the ABM model and planned behavior theory, effectively simulating the behavior of local farmers in agricultural decision making.
Although these studies adopted different methods or models to study the dualistic characteristics of natural and societal water cycles in different regions, they mainly consider the influence of human activities in the natural water cycle process, or water resource conditions in the economic and social model, and lack quantitative analysis of the mutual feedback relationship between natural society dualistic water cycles. The social water cycle, through water supply and consumption, will affect the natural water cycle process, as well as restrict the social water cycle water withdrawal. Thus, the natural society dualistic water cycle has linkage, real-time feedback, and complexity characteristics: with the increase in human activities, the interaction between the social and natural water cycles will become more significant. Therefore, identifying the coupling mechanism of multiple processes of natural and social water cycles is an important scientific question. Focusing on the characteristics of the regional natural society dualistic water cycles, this paper further studies the mutual feedback mechanism that exists in natural and social water cycles, establishing a set of indexes that can quantitatively describe the mutual feedback relationship between the upstream and downstream units and within the natural and social water cycle in the region. Taking the Beijing–Tianjin–Hebei region, which includes strong water competition and intense human activities, as the study area, the mutual feedback relationship of natural society dualistic water cycles is studied.

2. Natural Society Dualistic Water Cycles Model and Mutual Feed Mechanism Index

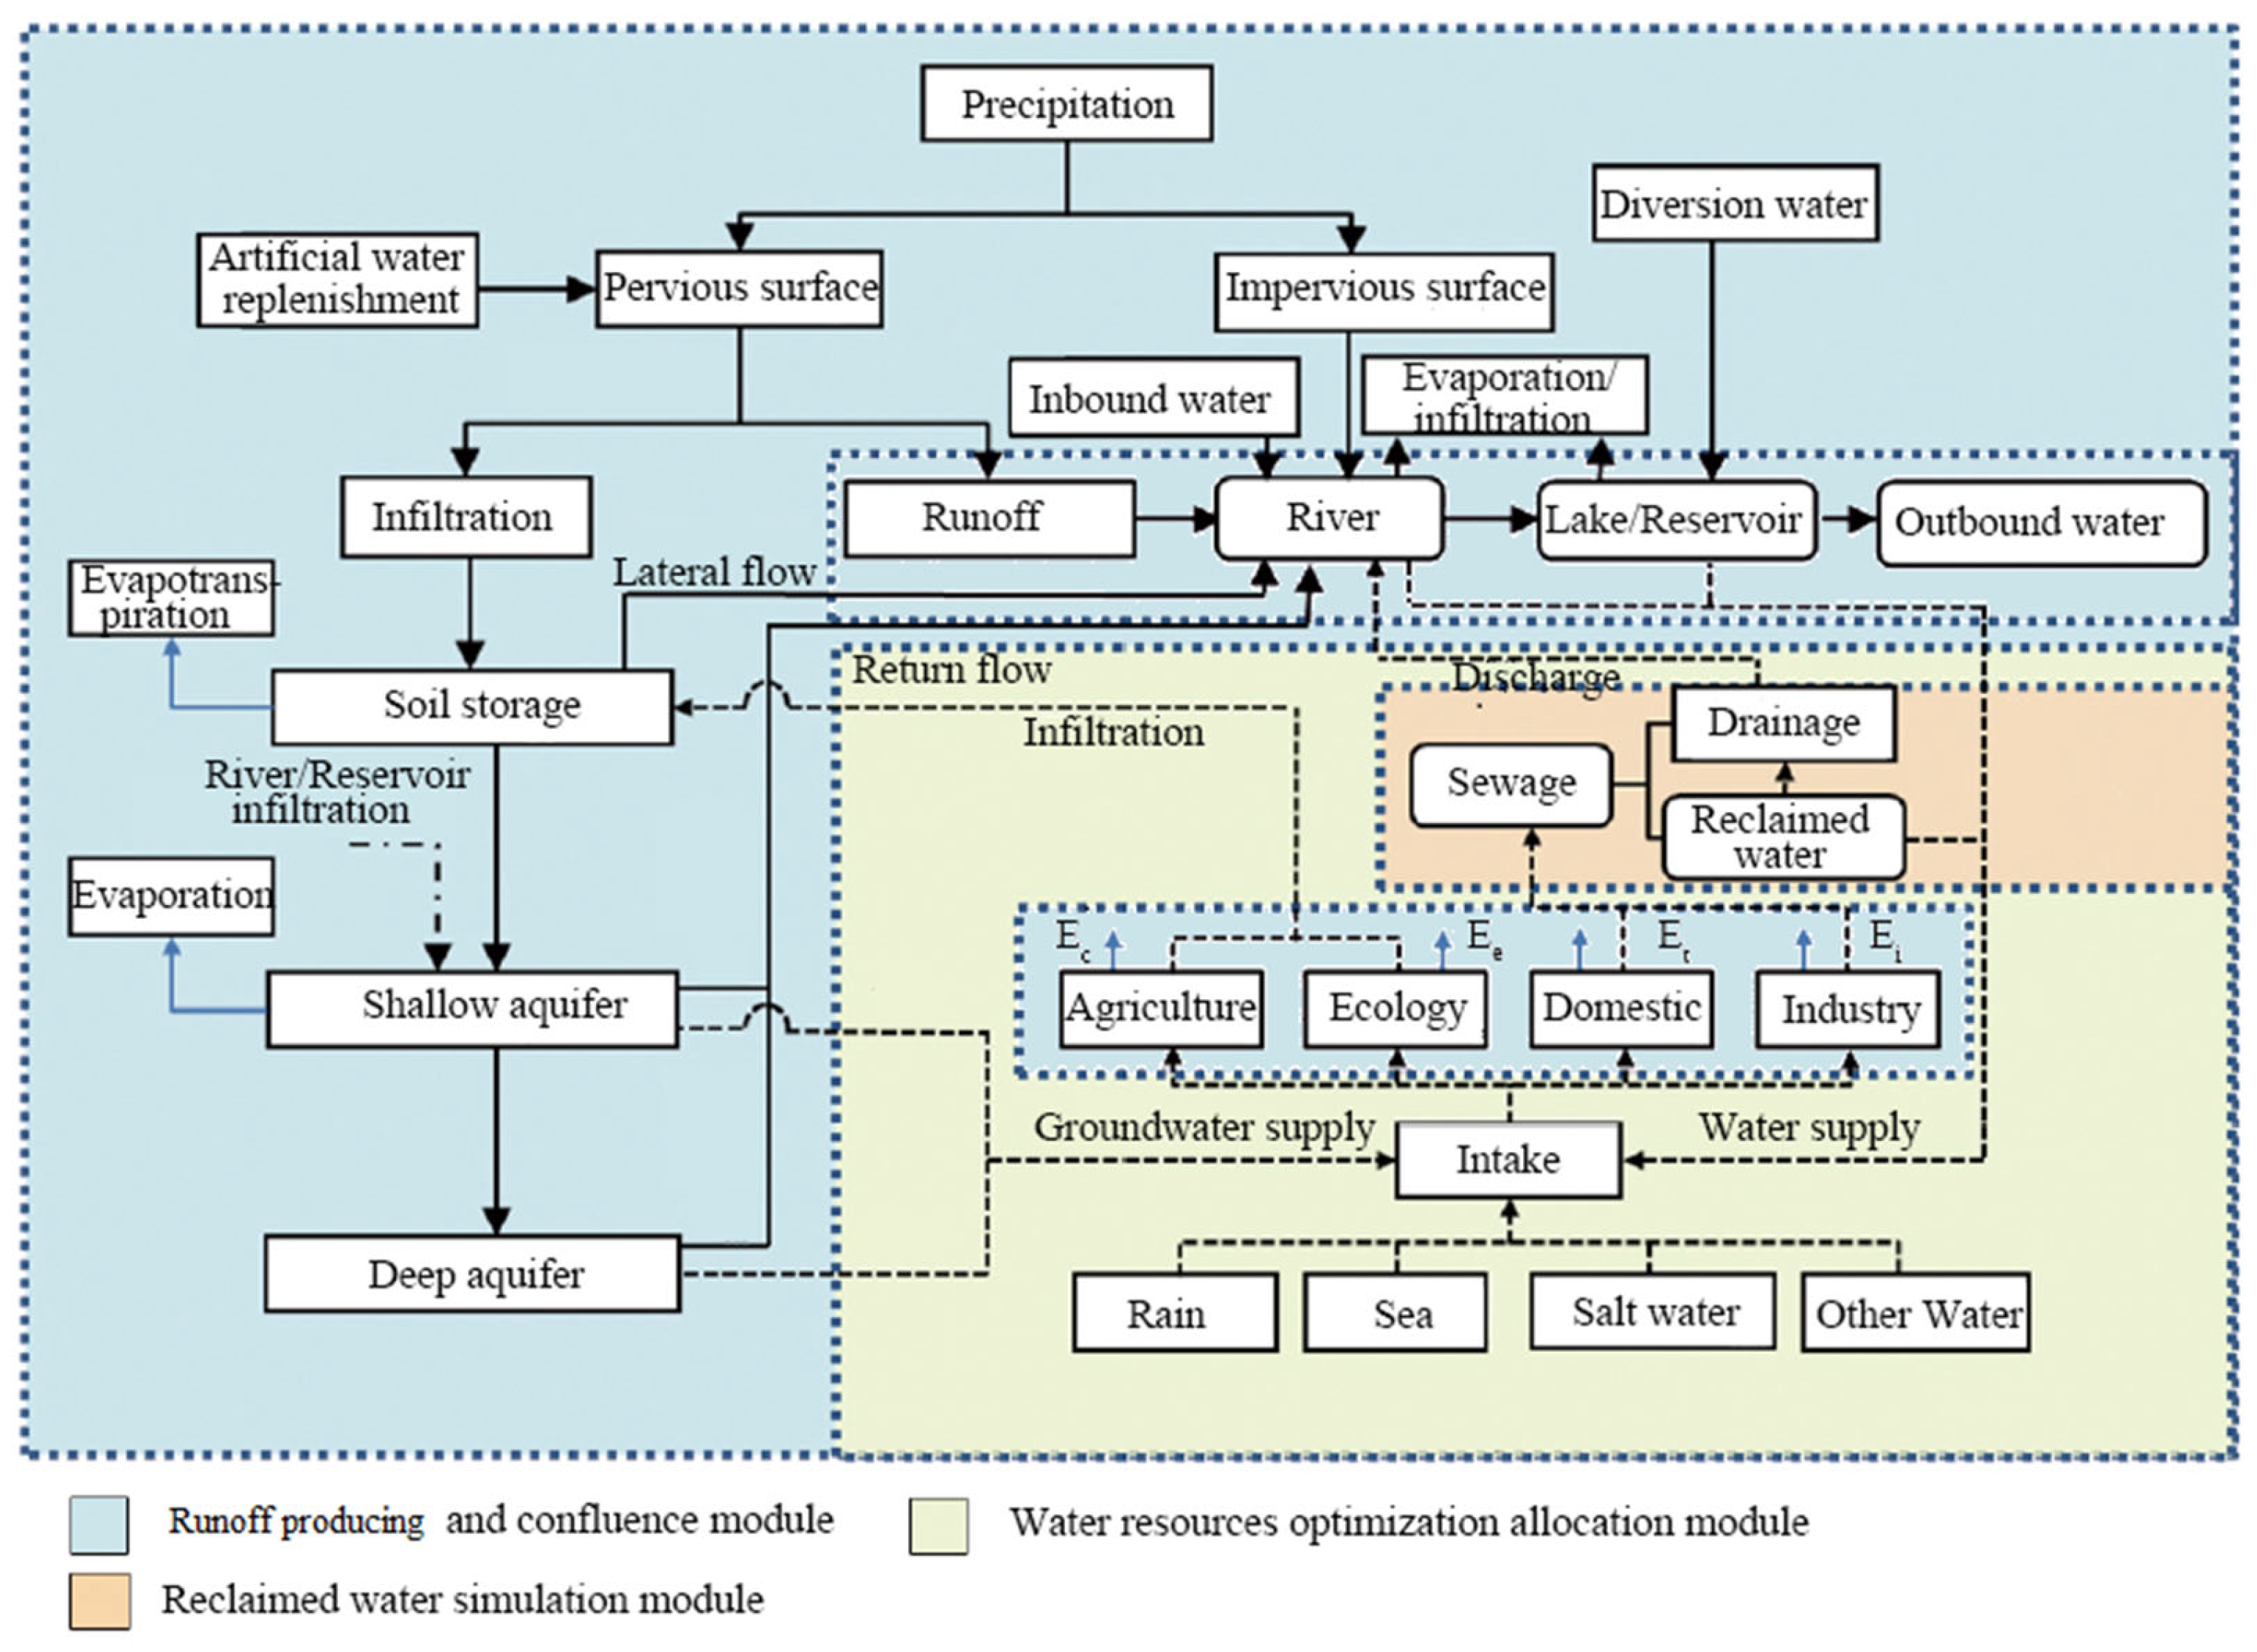
2.1. Natural Society Dualistic Water Cycles Model

The water allocation and simulation model (WAS) is used to calculate the natural society dualistic water cycles [38]. The WAS model is composed of two parts: water cycle and water resource allocation. The water cycle includes a runoff producing simulation module (the infiltration-excess and saturation-excess runoff producing method is used to calculate the runoff), a river confluence module, and a reclaimed water simulation module, which can calculate the regional and watershed surface water and groundwater resources; water resource allocation calculates the regional and watershed water supply and demand balance, and feeds the water supply and return to the water cycles in real time. The WAS model adopts the dynamic feedback simulation method of water cycle measurement, separation, aggregation, modeling, and regulation. It can simulate the water supply process, water consumption, and drainage in the social water cycle, as well as realize the combined effect of the natural and social water cycles and the dynamic response of upstream and downstream water intake and water use to achieve comprehensive dynamic water resource changes. The model framework is shown in Figure 1, Ec, Ee, Et, Ei are agriculture, ecology, domestic and industry water consumption, respectively. Based on this model, the quantitative simulation of the mutual feedback relationship between the natural and social water cycles can be realized.

2.2. Natural Society Water Cycle Mutual Feed Mechanism

The socio-hydrological unit is the basic feature of the natural society dualistic water cycles, and it was generated by superimposing social administrative districts on the basis of water resource zones with the characteristics of natural watersheds [39]. The water intake, consumption, and discharge of the social water cycle; the rainfall, evaporation, runoff, and confluence of the natural water cycle; and the mutual feedback of the natural society dualistic water cycles are all contained within the socio-hydrological unit. For a basin, the social water intake, consumption, and discharge directly affect the change of natural runoff within the socio-hydrological unit.
Social discharge in the upper stream will change the river runoff in the middle of the stream, and this altered runoff affects water availability and drainage, eventually having an impact downstream. Therefore, the mutual feedback of the natural and social water cycles is reflected, not only within socio-hydrological units, but also among different socio-hydrological units.

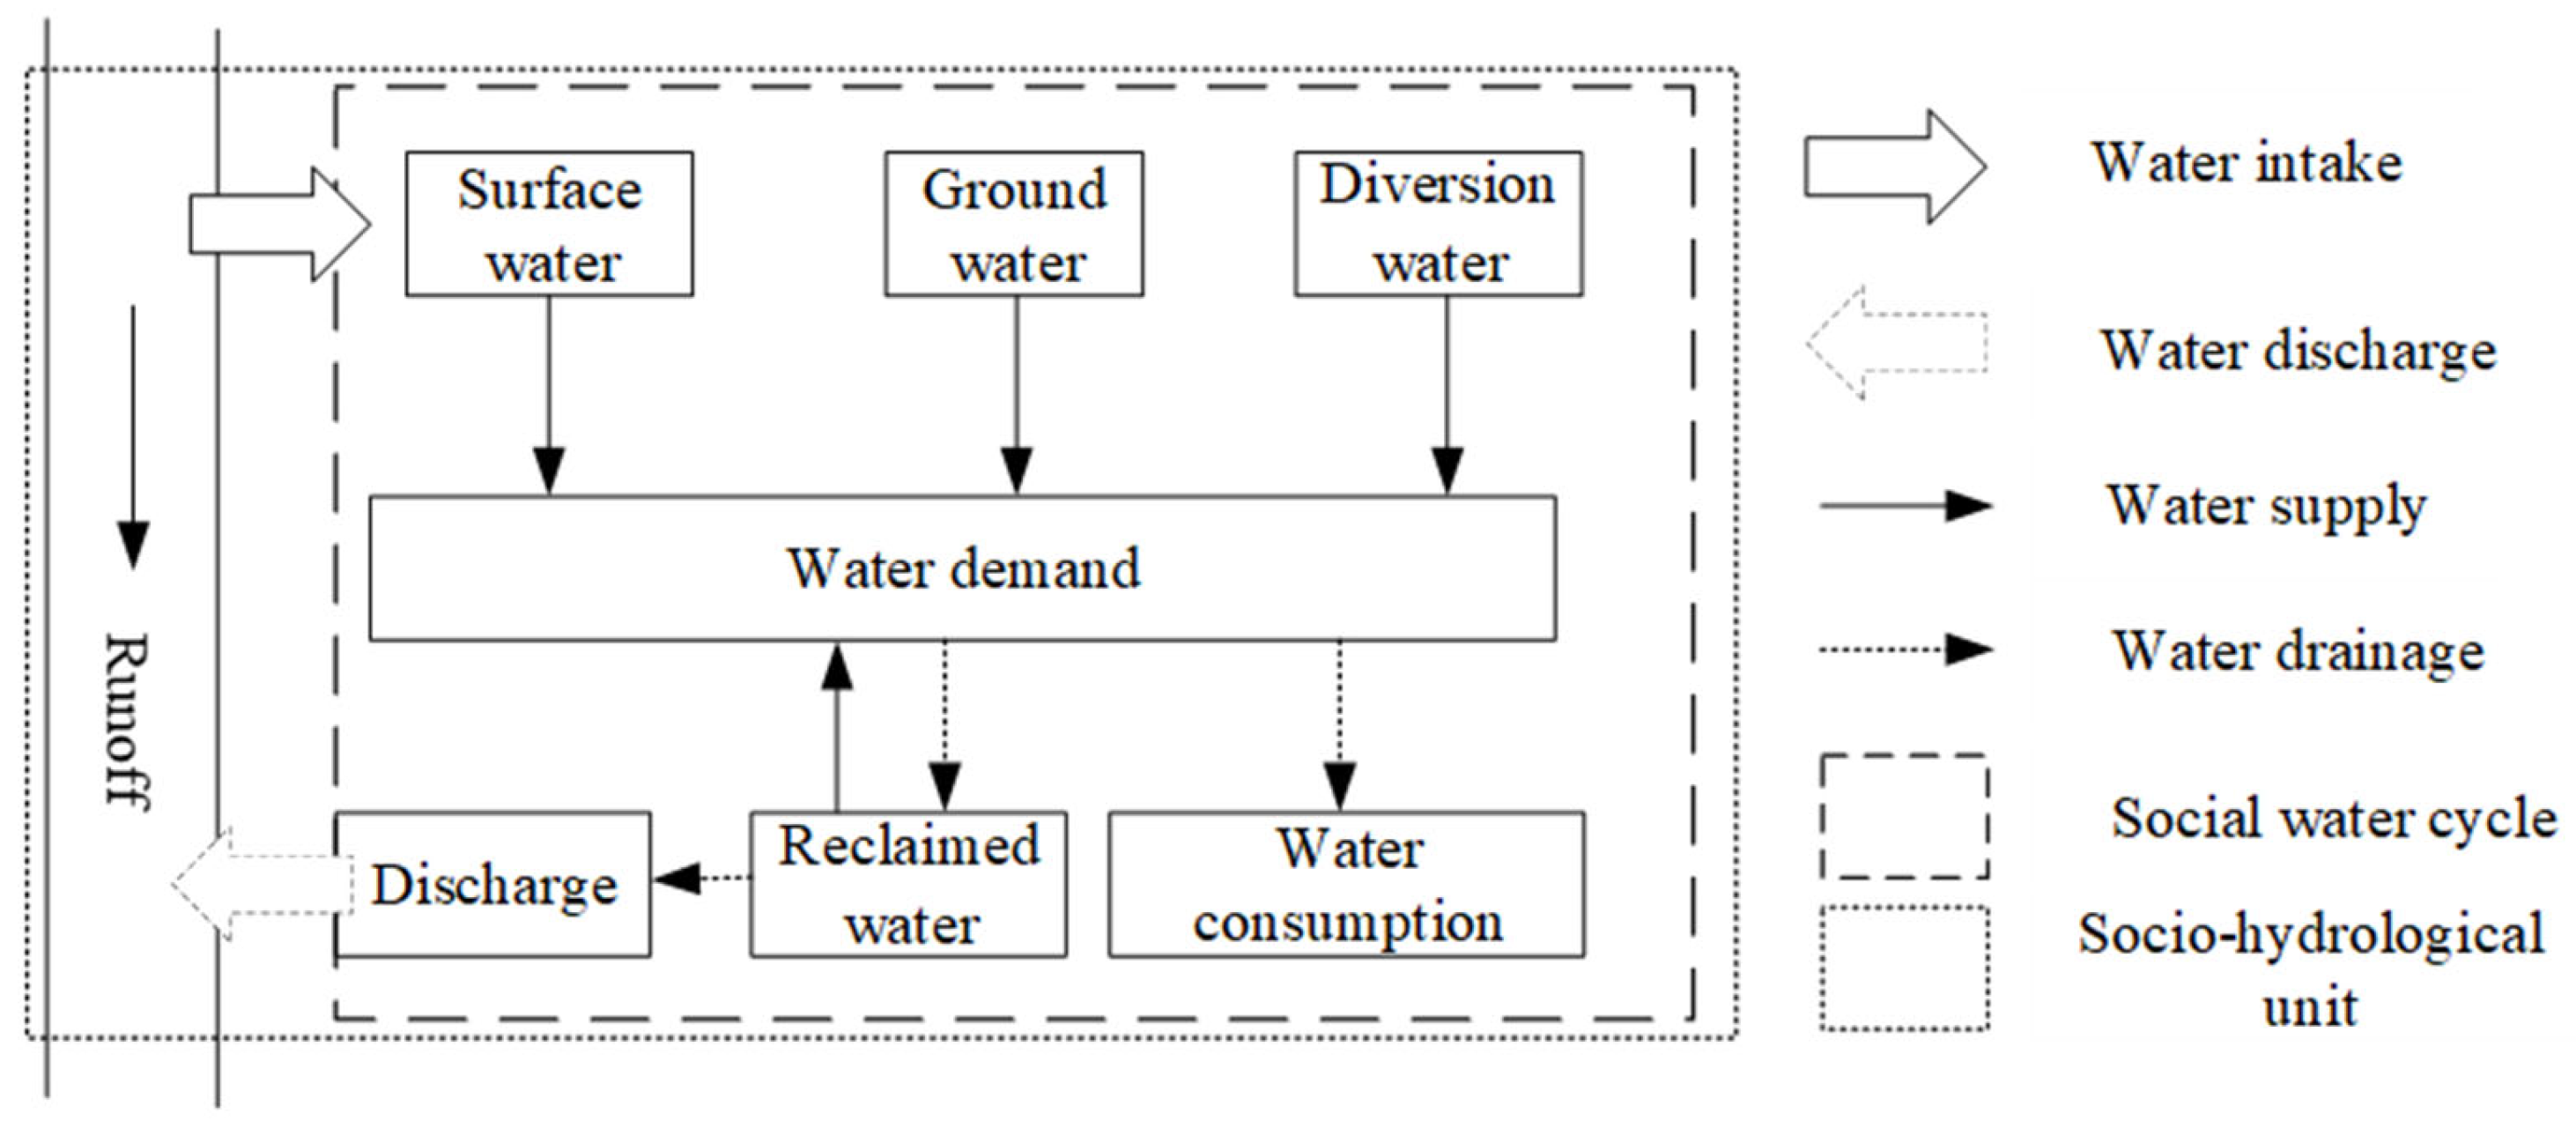
2.2.1. Mutual Feeding Mechanism between Socio-Hydrological Units

A watershed is divided into four socio-hydrological units: R1, R2, R3, and R4. The confluence relationship of each unit is shown in Figure 2.
Within each calculation unit, Δ W r is the runoff in the unit caused by natural runoff and confluence; Δ W F is the feedback amount of the social water cycle, which is the change of runoff in the unit caused by social water intake and drainage. The water volume at the outlet of the unit is W r when only the natural water cycle is considered, and the water volume at the outlet of the unit is W F when the mutual feedback mechanism of the natural society dualistic water cycles is considered. For example, for a unit, if the amount of the runoff produced within the unit is 10 million m3, then Δ W r is 10 million m3; if the water intake is 4 million m3, and water drainage is 2 million m3, then the change in runoff in the unit caused by social water intake and drainage is –2 million m3; thus Δ W F is –2 million m3; the W r is 10 million m3, and the W F is 8 million m3. Thus, the water balance of each unit can be determined from:
{ W r 1 = Δ W r 1 W r 2 = Δ W r 2 W r 3 = W r 1 + Δ W r 3 W r 4 = W r 2 + W r 3 + Δ W r 4
{ W F 1 = W r 1 + Δ W F 1 W F 2 = W r 2 + Δ W F 2 W F 3 = W F 1 + Δ W r 3 + Δ W F 3 W F 4 = W F 3 + W F 2 + Δ W r 4 + Δ W F 4
The water balance of the nth unit can be obtained as follows:
{ W r n = i = 1 m Δ W r i   W F n = i = 1 m ( Δ W r i + Δ W F i )  
where m is the set of all upstream units belonging to the nth unit (including the nth unit).
The cumulative runoff change rate ( α ) is shown in Formula (4). This can reflect the variation in runoff at the outlet of the unit, under the natural and social water cycle interactions of the upstream unit.
α = W F W r
Based on Formulas (3) and (4), the cumulative runoff change rate of different units (Figure 2) can be obtained:
{ α 1 = W F 1 W r 1 = Δ W r 1 + Δ W F 1 Δ W r 1 = 1 + Δ W F 1 W r 1 α 2 = W F 2 W r 2 = Δ W r 2 + Δ W F 2 Δ W r 2 = 1 + Δ W F 2 W r 2 α 3 = W F 3 W r 3 = Δ W r 1 + Δ W r 3 + Δ W F 1 + Δ W F 3 Δ W r 1 + Δ W r 3 = 1 + Δ W F 1 + Δ W F 3 W r 3 α 4 = W F 4 W r 4 = Δ W r 1 + Δ W r 3 + Δ W r 2 + Δ W r 4 + Δ W F 1 + Δ W F 3 + Δ W F 2 + Δ W F 4 Δ W r 1 + Δ W r 3 + Δ W r 2 + Δ W r 4 = 1 + Δ W F 1 + Δ W F 3 + Δ W F 2 + Δ W F 4 W r 4
Thus, the cumulative runoff change rate in the nth unit can be obtained by Formula (6). The mutual feedback water amount in each upstream unit affects the cumulative runoff change rate in the downstream unit. The cumulative runoff change rate α   [ 0 , + ] ; when α is equal to 1, it means W F = W r , and indicates that there is no natural society dualistic water cycles mutual feedback in the whole basin, or the social water intake and discharge of the whole basin, are equal. When the α is less than 1, it means that W F < W r and indicates the degree of reduction of runoff at the outlet of the unit under the influence of the social water cycle, and when W F = 0, it means that there is no runoff at the outlet of the unit. When the α is greater than 1, it means that W F > W r and indicates an increase in the degree of runoff at the outlet of the unit under the influence of the social water cycle.
α n = W F n W r n = i = 1 m ( Δ W r i + Δ W F i )   i = 1 m Δ W r i   = 1 + i = 1 m Δ W F i W r n

2.2.2. Mutual Feedback Mechanism within Socio-Hydrological Units

In each unit, the influence of the water intake, consumption, and discharge of the social water cycle on the natural water cycle is shown in Figure 3.
Figure 3 generalizes the water supply sources into surface water, groundwater, diversion water, and reclaimed water. Surface water includes local rivers and reservoirs. The amount of available reclaimed water is determined by social water consumption. It is assumed that all reclaimed water is utilized after treatment. Diversion water includes external basin diversion water and the trans-basin reservoir water supply. Water demand can be generally divided into domestic, industrial, agricultural, and ecological, all of which are represented by social water demand.
After social water use, part of the water is directly consumed and becomes the social water consumption, while the remained becomes sewage. Some sewage is discharged into the river after treatment, while other waste water becomes recycled water after deep treatment. Thus, the formula for calculating the water balance of the social water cycle in the unit is as follows:
W i n t a k e + W g r o u n d + W T r a n s + W r e c = W E T + W s e w
W s e w = W d r a i n a g e + W r e c
where W i n t a k e is surface water supply; W g r o u n d is groundwater supply; W T r a n s is division water supply; W s e w is sewage discharge; W r e c is reclaimed water supply; W E T is social water consumption; W d r a i n a g e is the discharge water from the social water cycle to the river. It can be seen that the amount of reclaimed water used has no effect on the water balance in the unit.
The calculation formula of social water cycle feedback Δ W F is as follows:
Δ W F = W d r a i n a g e W i n t a k e
To quantitatively reflect the degree of influence of the water intake, consumption, and discharge of the social water cycle in the unit on the natural water cycle, the ratio of discharge water to surface water supply is set as the social water cycle feedback rate, r F , with the following calculation formula:
r F = W d r a i n a g e W i n t a k e
Formula (7) can be divided by W i n t a k e to get Formula (11):
r F + W E T W i n t a k e = 1 + W g r o u n d + W T r a n s W i n t a k e
According to Formula (11), if there is only a surface water supply inside the unit, then r F + W E T / W i n t a k e = 1 . When r F = 1 , the social water cycle has not changed the natural water cycle, and W E T = 0 ; when r F = 0 , the social water cycle has consumed all the water intake, and there is no feedback linkage with the natural water cycle, W E T = W i n t a k e .
When multiple water supplies are considered in the unit; r F [ 0 , + ] . When r F < 1, it has a decreasing effect on river runoff, or a negative feedback effect; when r F > 1, it has an increasing effect on river runoff, or a positive feedback effect.

3. Study Area and Model Construction
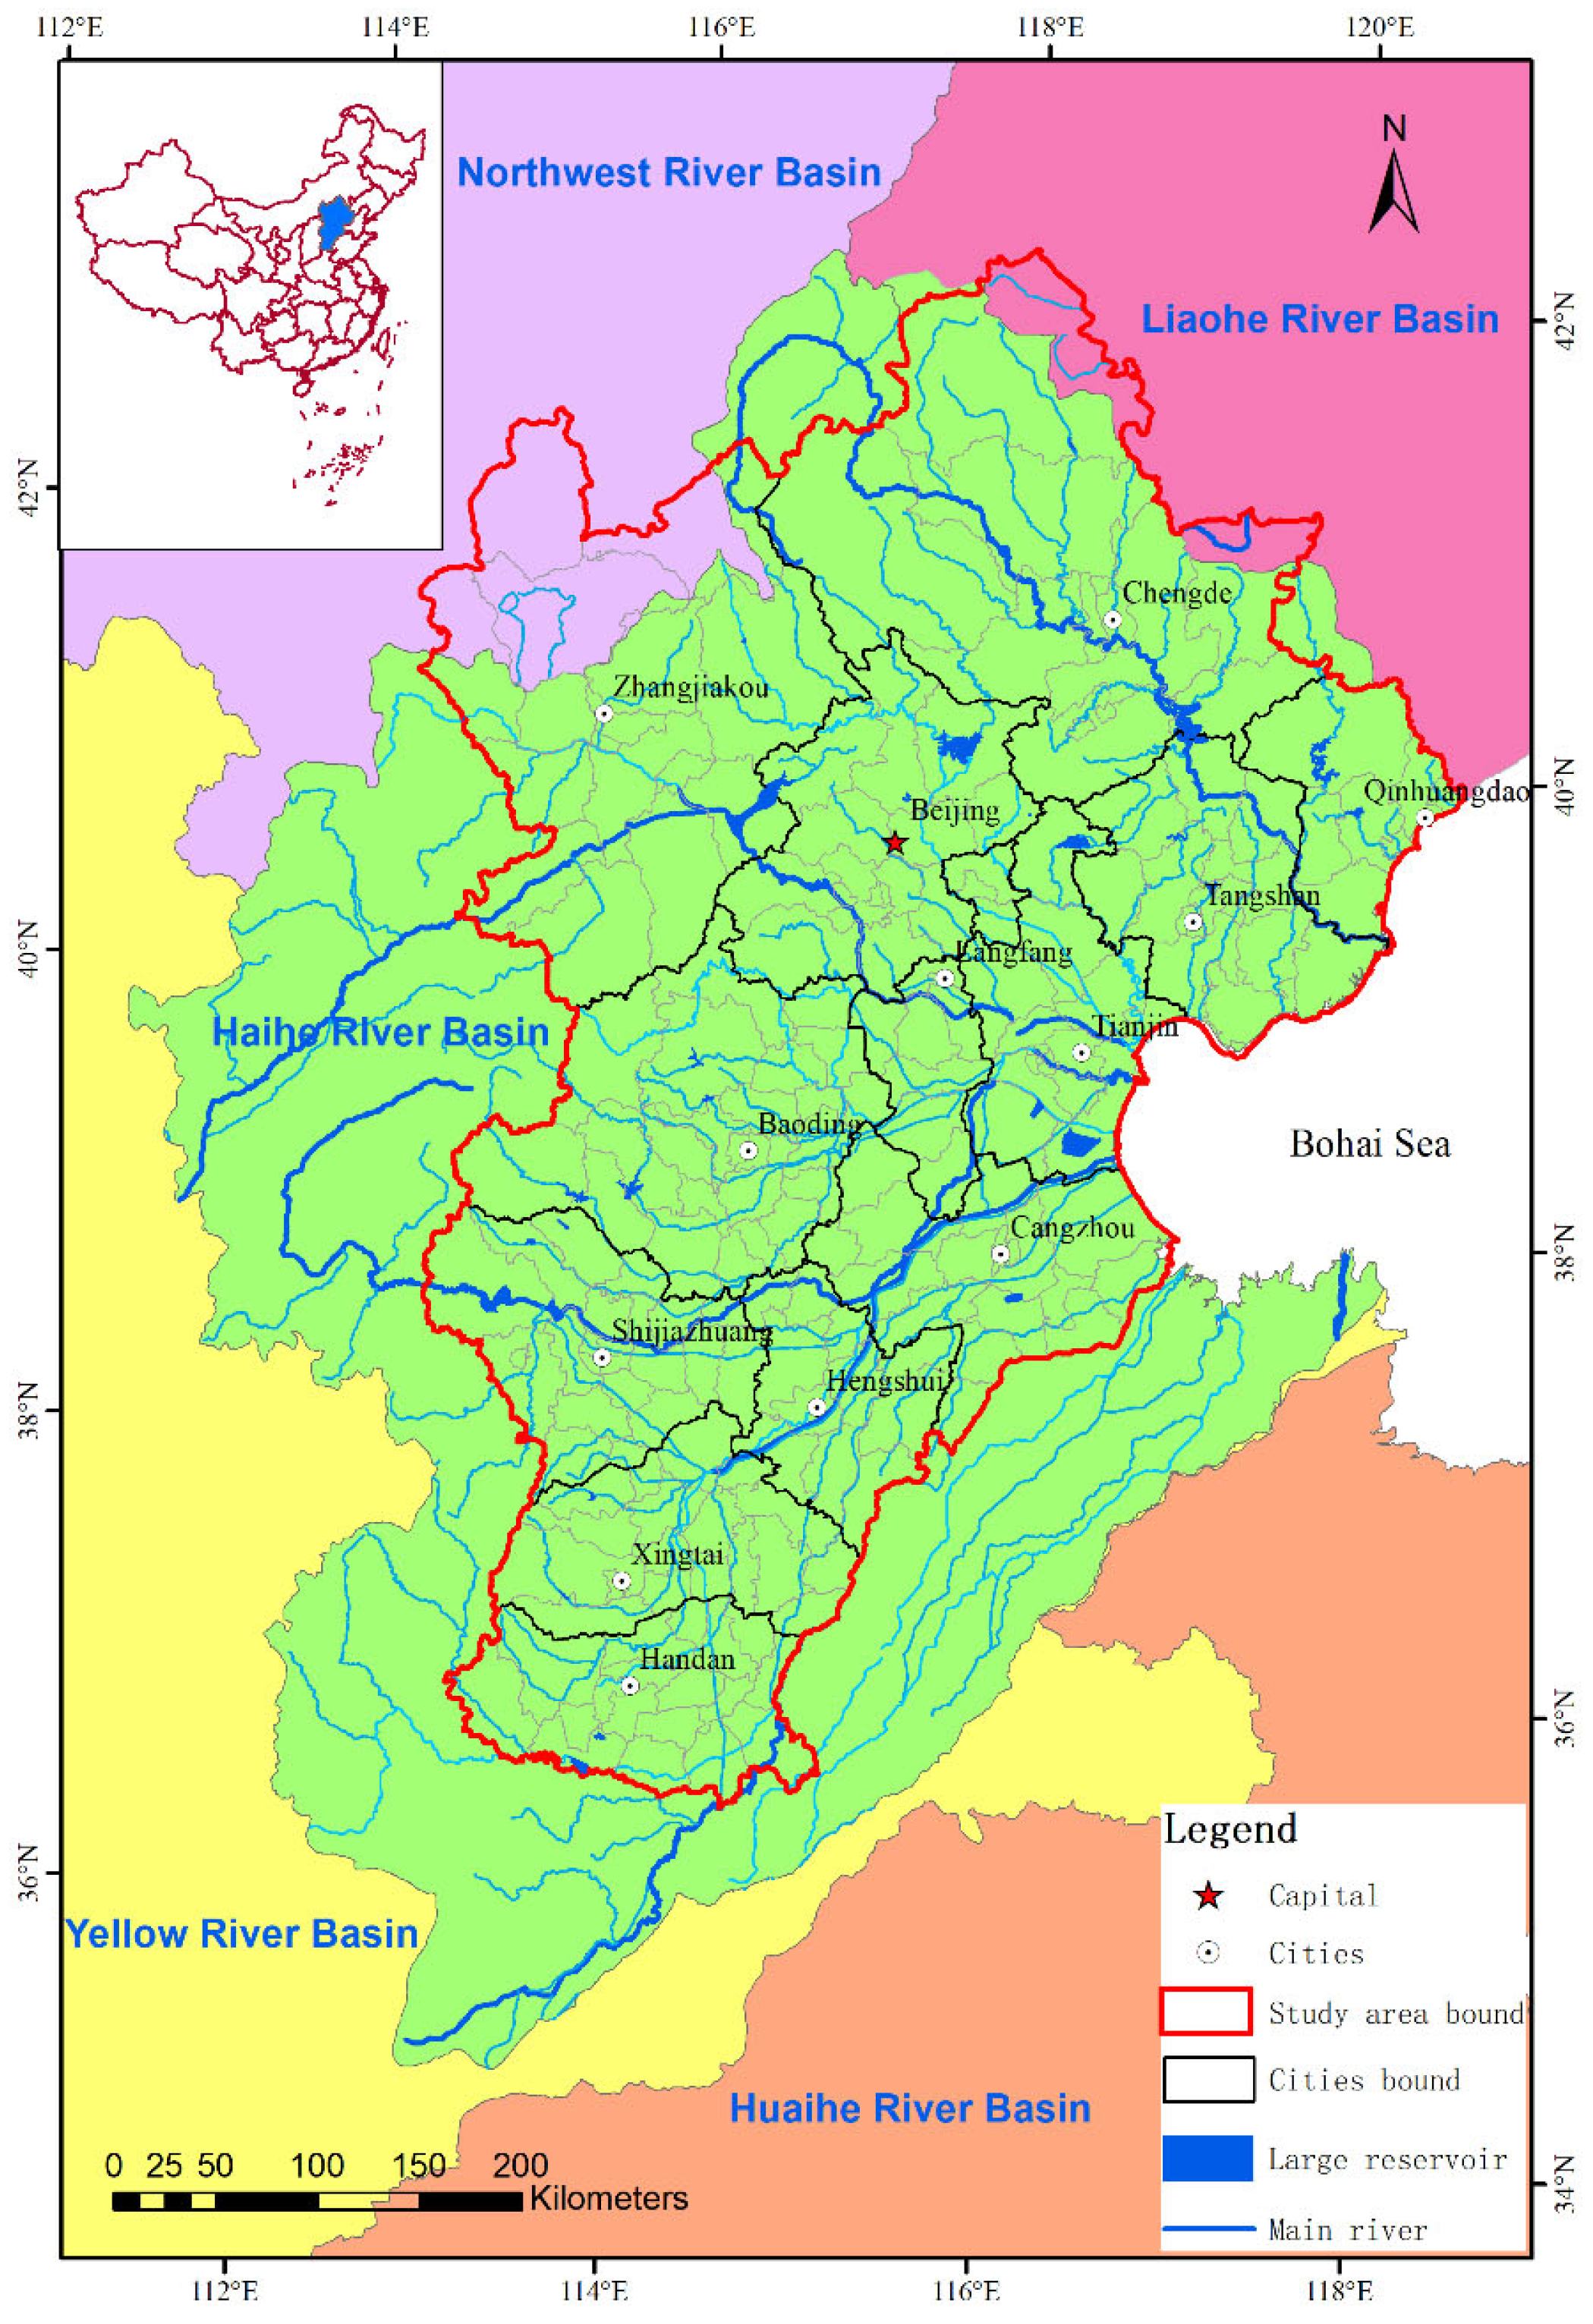
The runoff data and natural water resources of the hydrological stations in the Beijing–Tianjin–Hebei region from 1961 to 2000 were used as the calibration and validation data of the natural water cycle model, the current water supply and usage data from 2016 were used as the calibration data of the social water cycle, 2035 was used as the future research year, and the relationship between the water balance and mutual feedback was studied, using monthly time intervals.

3.1. Study Area

The Beijing–Tianjin–Hebei region, including the Beijing, Tianjin, and Hebei provinces, is located in the North China Plain (Figure 4). It spans three level-one water resource divisions of the Northwest River Basin, the Liaohe River Basin, and the Haihe River Basin. Since most of the Beijing–Tianjin–Hebei region is located in the Haihe River Basin, the influence of the upper reaches of the Haihe River Basin on the Beijing–Tianjin–Hebei region is also taken into account in the subsequent study. The terrain of this region is high in the south and low in the north, with a total area of 218,000 km2, of which the mountainous region accounts for 58% of the total area.

3.2. Data Source

3.2.1. Hydrological and Meteorological Data

The meteorological data used in the model were obtained from the data information center of the National Meteorological Administration (https://data.cma.cn, accessed on 10 June 2021). The daily meteorological data of 49 representative stations in the research area from 1961 to 2017 were selected. The hydrological data was from the Haihe Water Conservancy Commission. According to the study area, seven representative hydrological stations in the Beijing–Tianjin–Hebei region from 1961 to 2000 were selected. The above data were collated on a monthly scale and input into the model; meteorological and hydrological station distributions are shown in Figure 5a.

3.2.2. Water Resources and Water Supply Data

The water resources and water supply and demand data were obtained from the Second Haihe River Basin Water Resources Evaluation (1961–2000) and the Beijing–Tianjin–Hebei water resources bulletin (2000–2016).

3.2.3. Water Demand Data of the Future Research Year

According to relevant regional planning and reports, combined with relevant national policies, the water demand of the Beijing–Tianjin–Hebei region in 2035 is predicted to be 25.82 billion m3 [40]. Table 1 presents the water demand analysis for Beijing, Tianjin, and Hebei in 2035.

3.2.4. Water Supply Data of the Future Research Year

The surface water in the study area is generated by the natural water cycle module, and rainfall at 50% frequency in the study area is used as the driving data of the model. In 2035, the available groundwater supply in the Beijing–Tianjin–Hebei region will be 10.76 billion m3. The total external diversion water volume will be 5.79 billion m3. Combined with the water demand predictions for 2035, the treatment capacity of reclaimed water is predicted to be 3.44 billion m3.

3.2.5. Socio-Hydrological Units of the Study Area

By superimposing the administrative divisions (county level, a total of 177) on the water resources zones (level three, a total of 18), 285 socio-hydrological units were determined. According to the digital elevation model (DEM) data and the river network in the study area, the convergence relationship between the socio-hydrological units is determined, as shown in Figure 5b. The specific socio-hydrological unit division and confluence relationship determination method can be accessed in reference [39].

4. Parameter Calibration and Validation of the WAS Model

To achieve a whole process simulation of the natural-social dualistic water cycles, model parameters with high sensitivity [41] are calibrated and verified. The calibration is carried out from three aspects: cross-section runoff, regional water resources, and regional water allocation, which reflect the accuracy of the natural water cycle process, the practicability of water resource evaluation, and the rationality of water resource allocation, respectively.

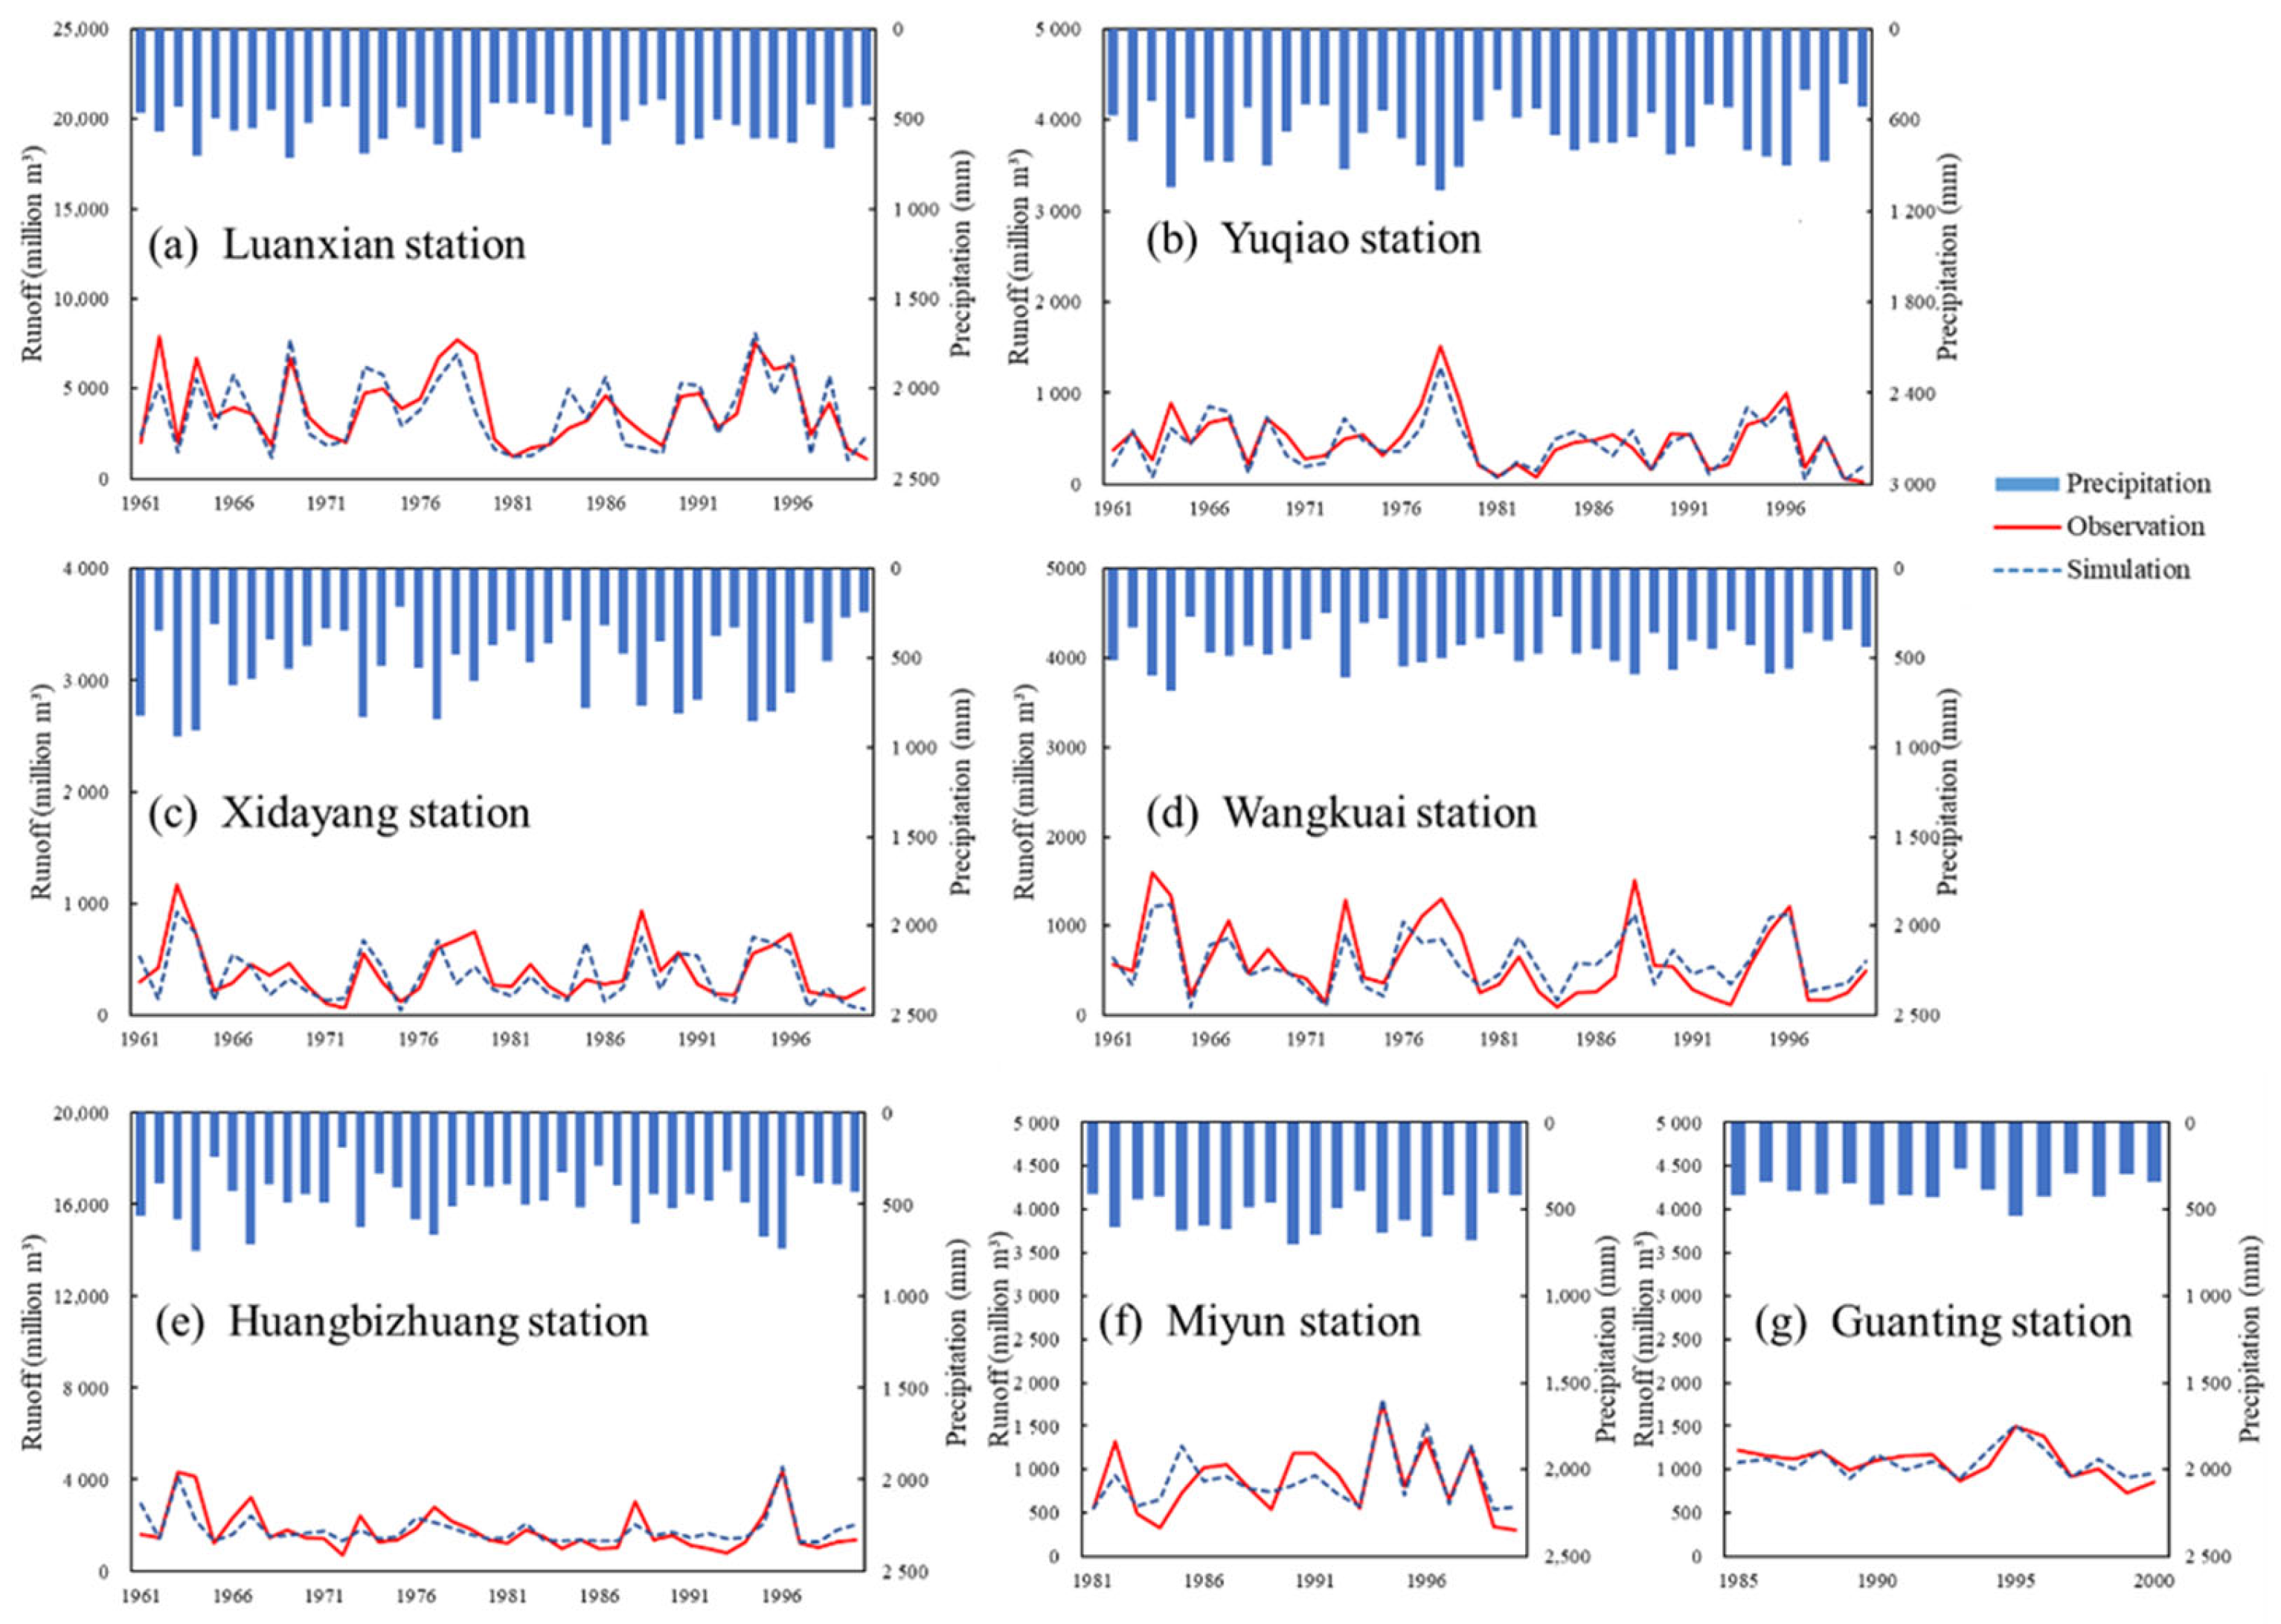
4.1. Cross-Section Runoff

A comparison between the simulated and observed runoff in the hydrological station is shown in Figure 6. Performance indicators for the calibration and validation periods are presented in Table 2. In the calibration period (1961–1980), the NSE (Nash–Sutcliffe Efficiency coefficient) is above 0.53, and the R2 is above 0.74. In the validation period (1981–2000), except for the Xidayang, the NSEs of other stations are above 0.65; R2 is above 0.8. Therefore, the model exhibits satisfactory accuracy for simulating the runoff process.

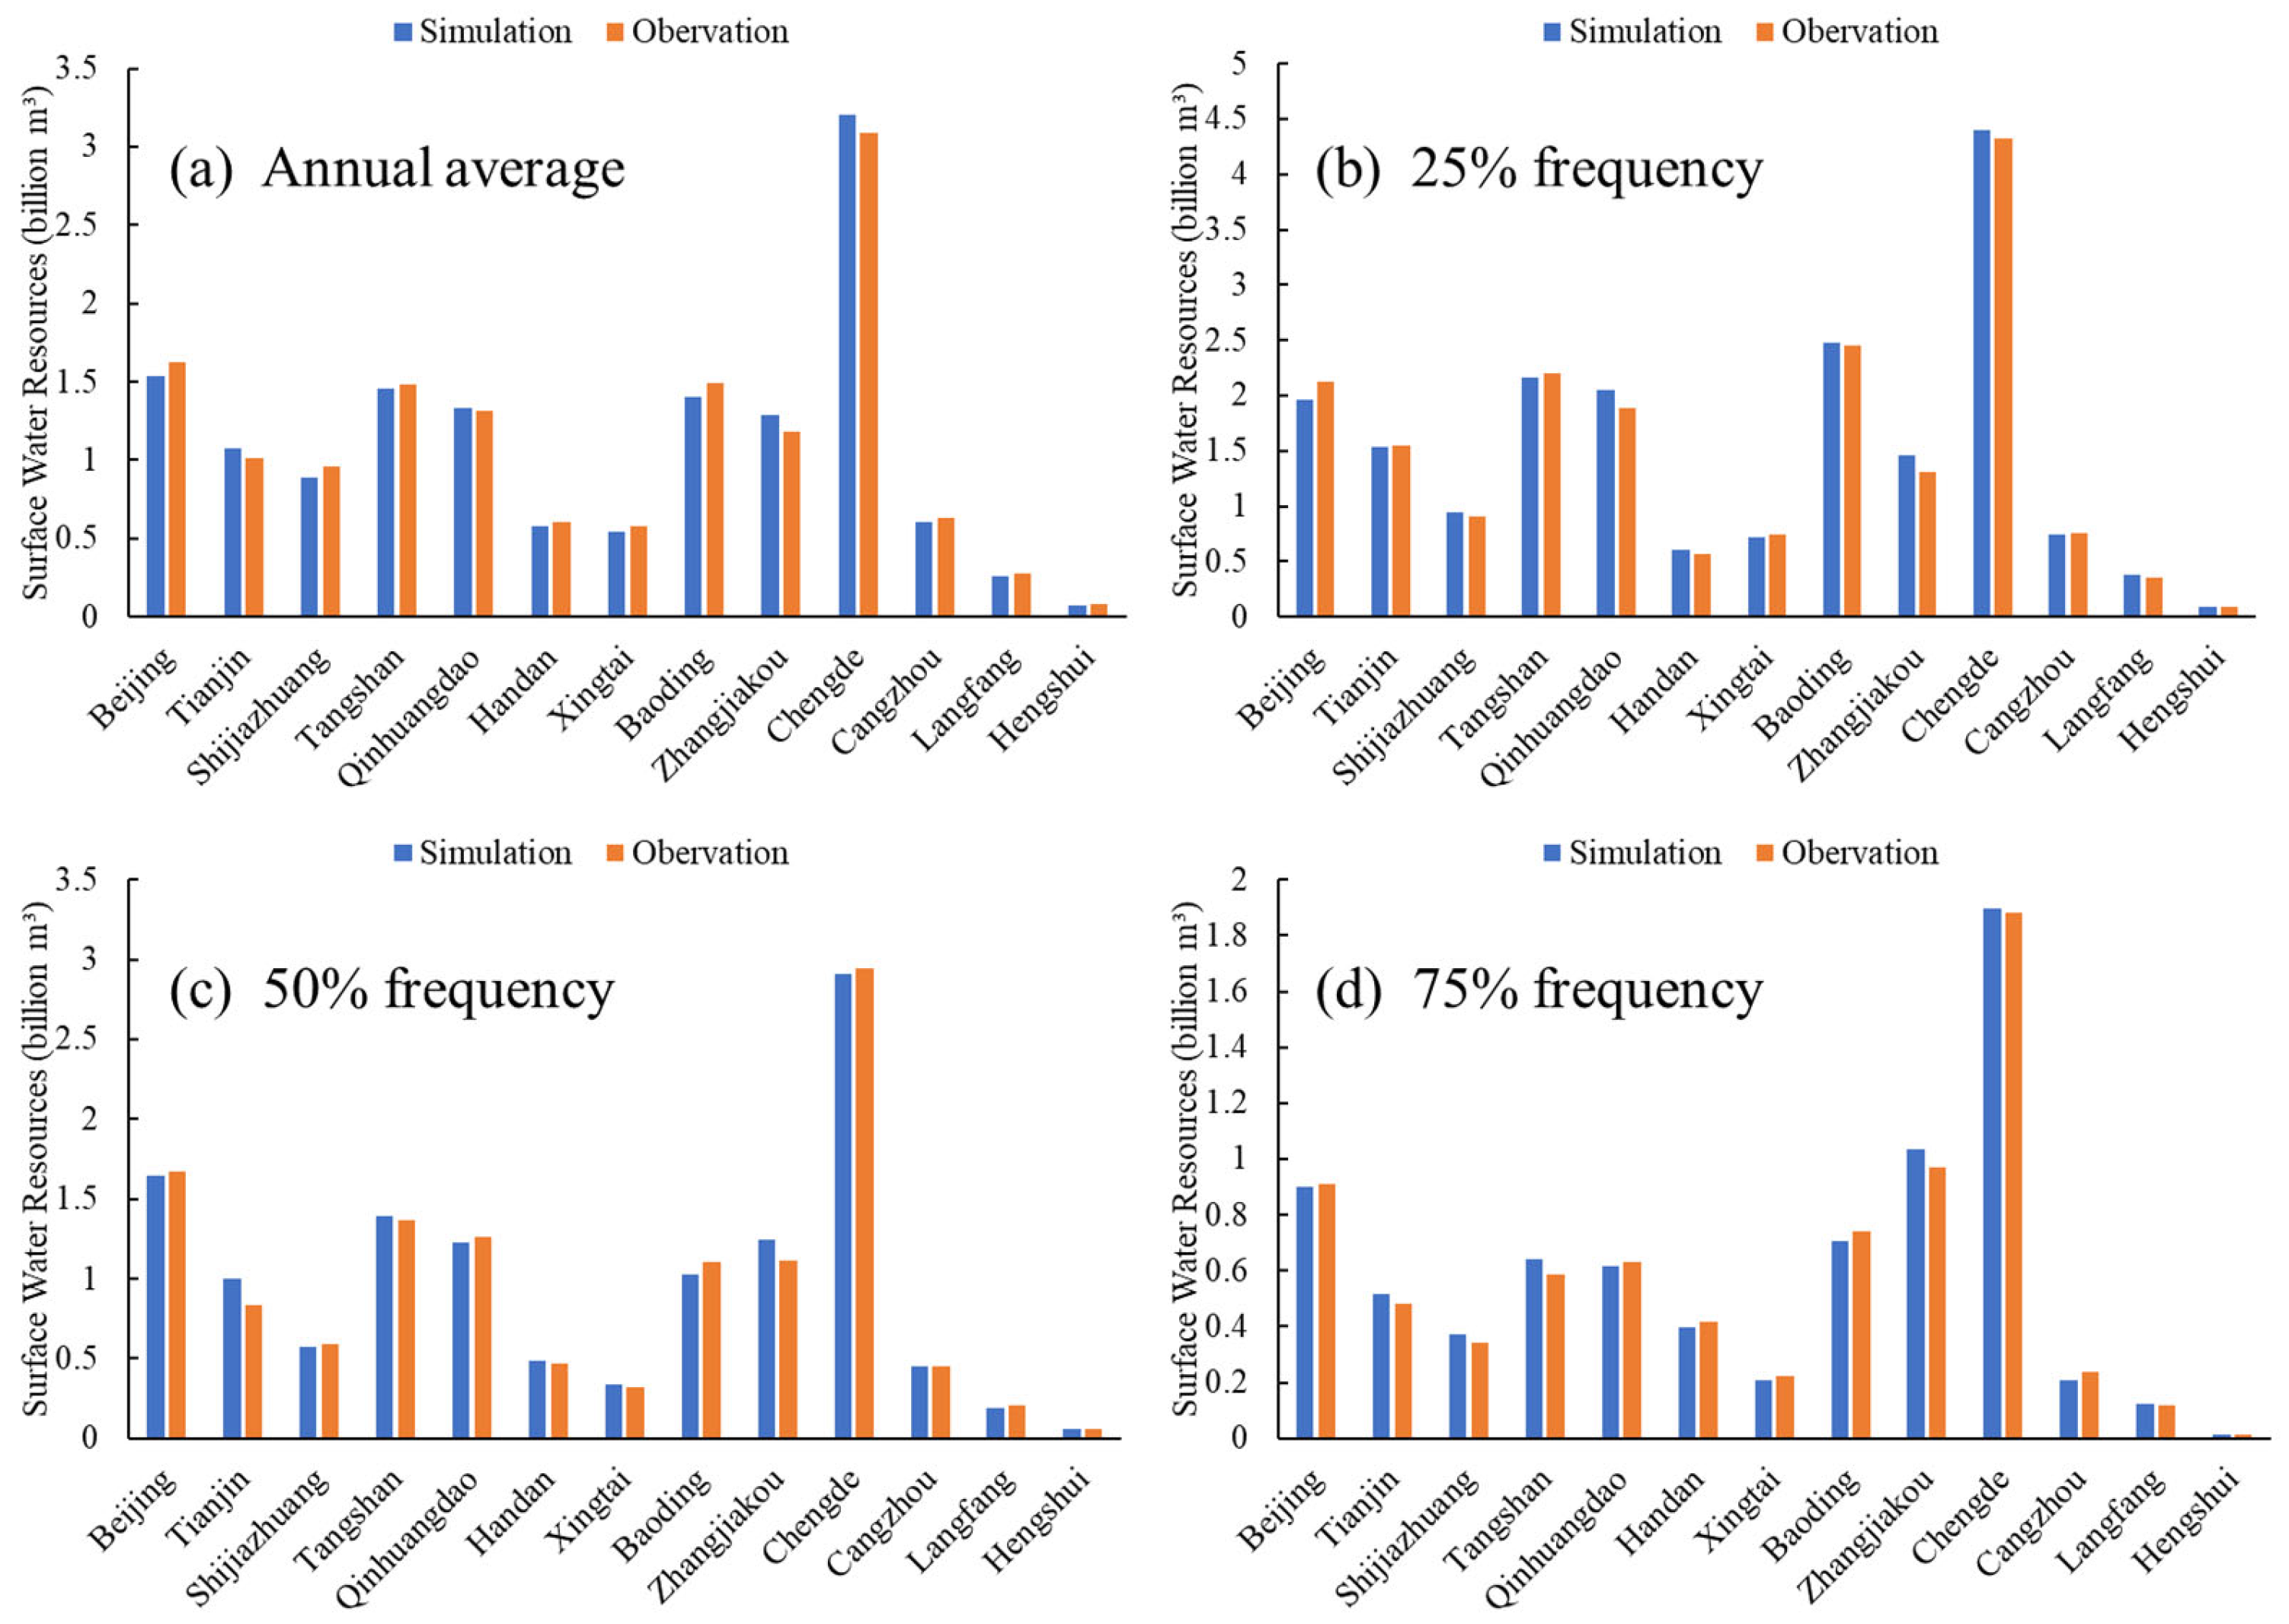
4.2. Regional Water Resources

The comparison between the simulated and observed at annual averages, 25%, 50%, and 75% of the typical frequency for the years 1961–2000 regarding surface water resources in different cities is shown in Figure 7. Among these comparisons, the relative error rate of the simulated and observed surface water resources of the annual average model is 6.2%; 25%, 50%, and 75%, and for the typical frequency for the years, the relative error rate is 4.4%, 5.2%, and 5.9%, respectively. This shows that the model can accurately simulate surface water resources and meet the water resource evaluation requirements.

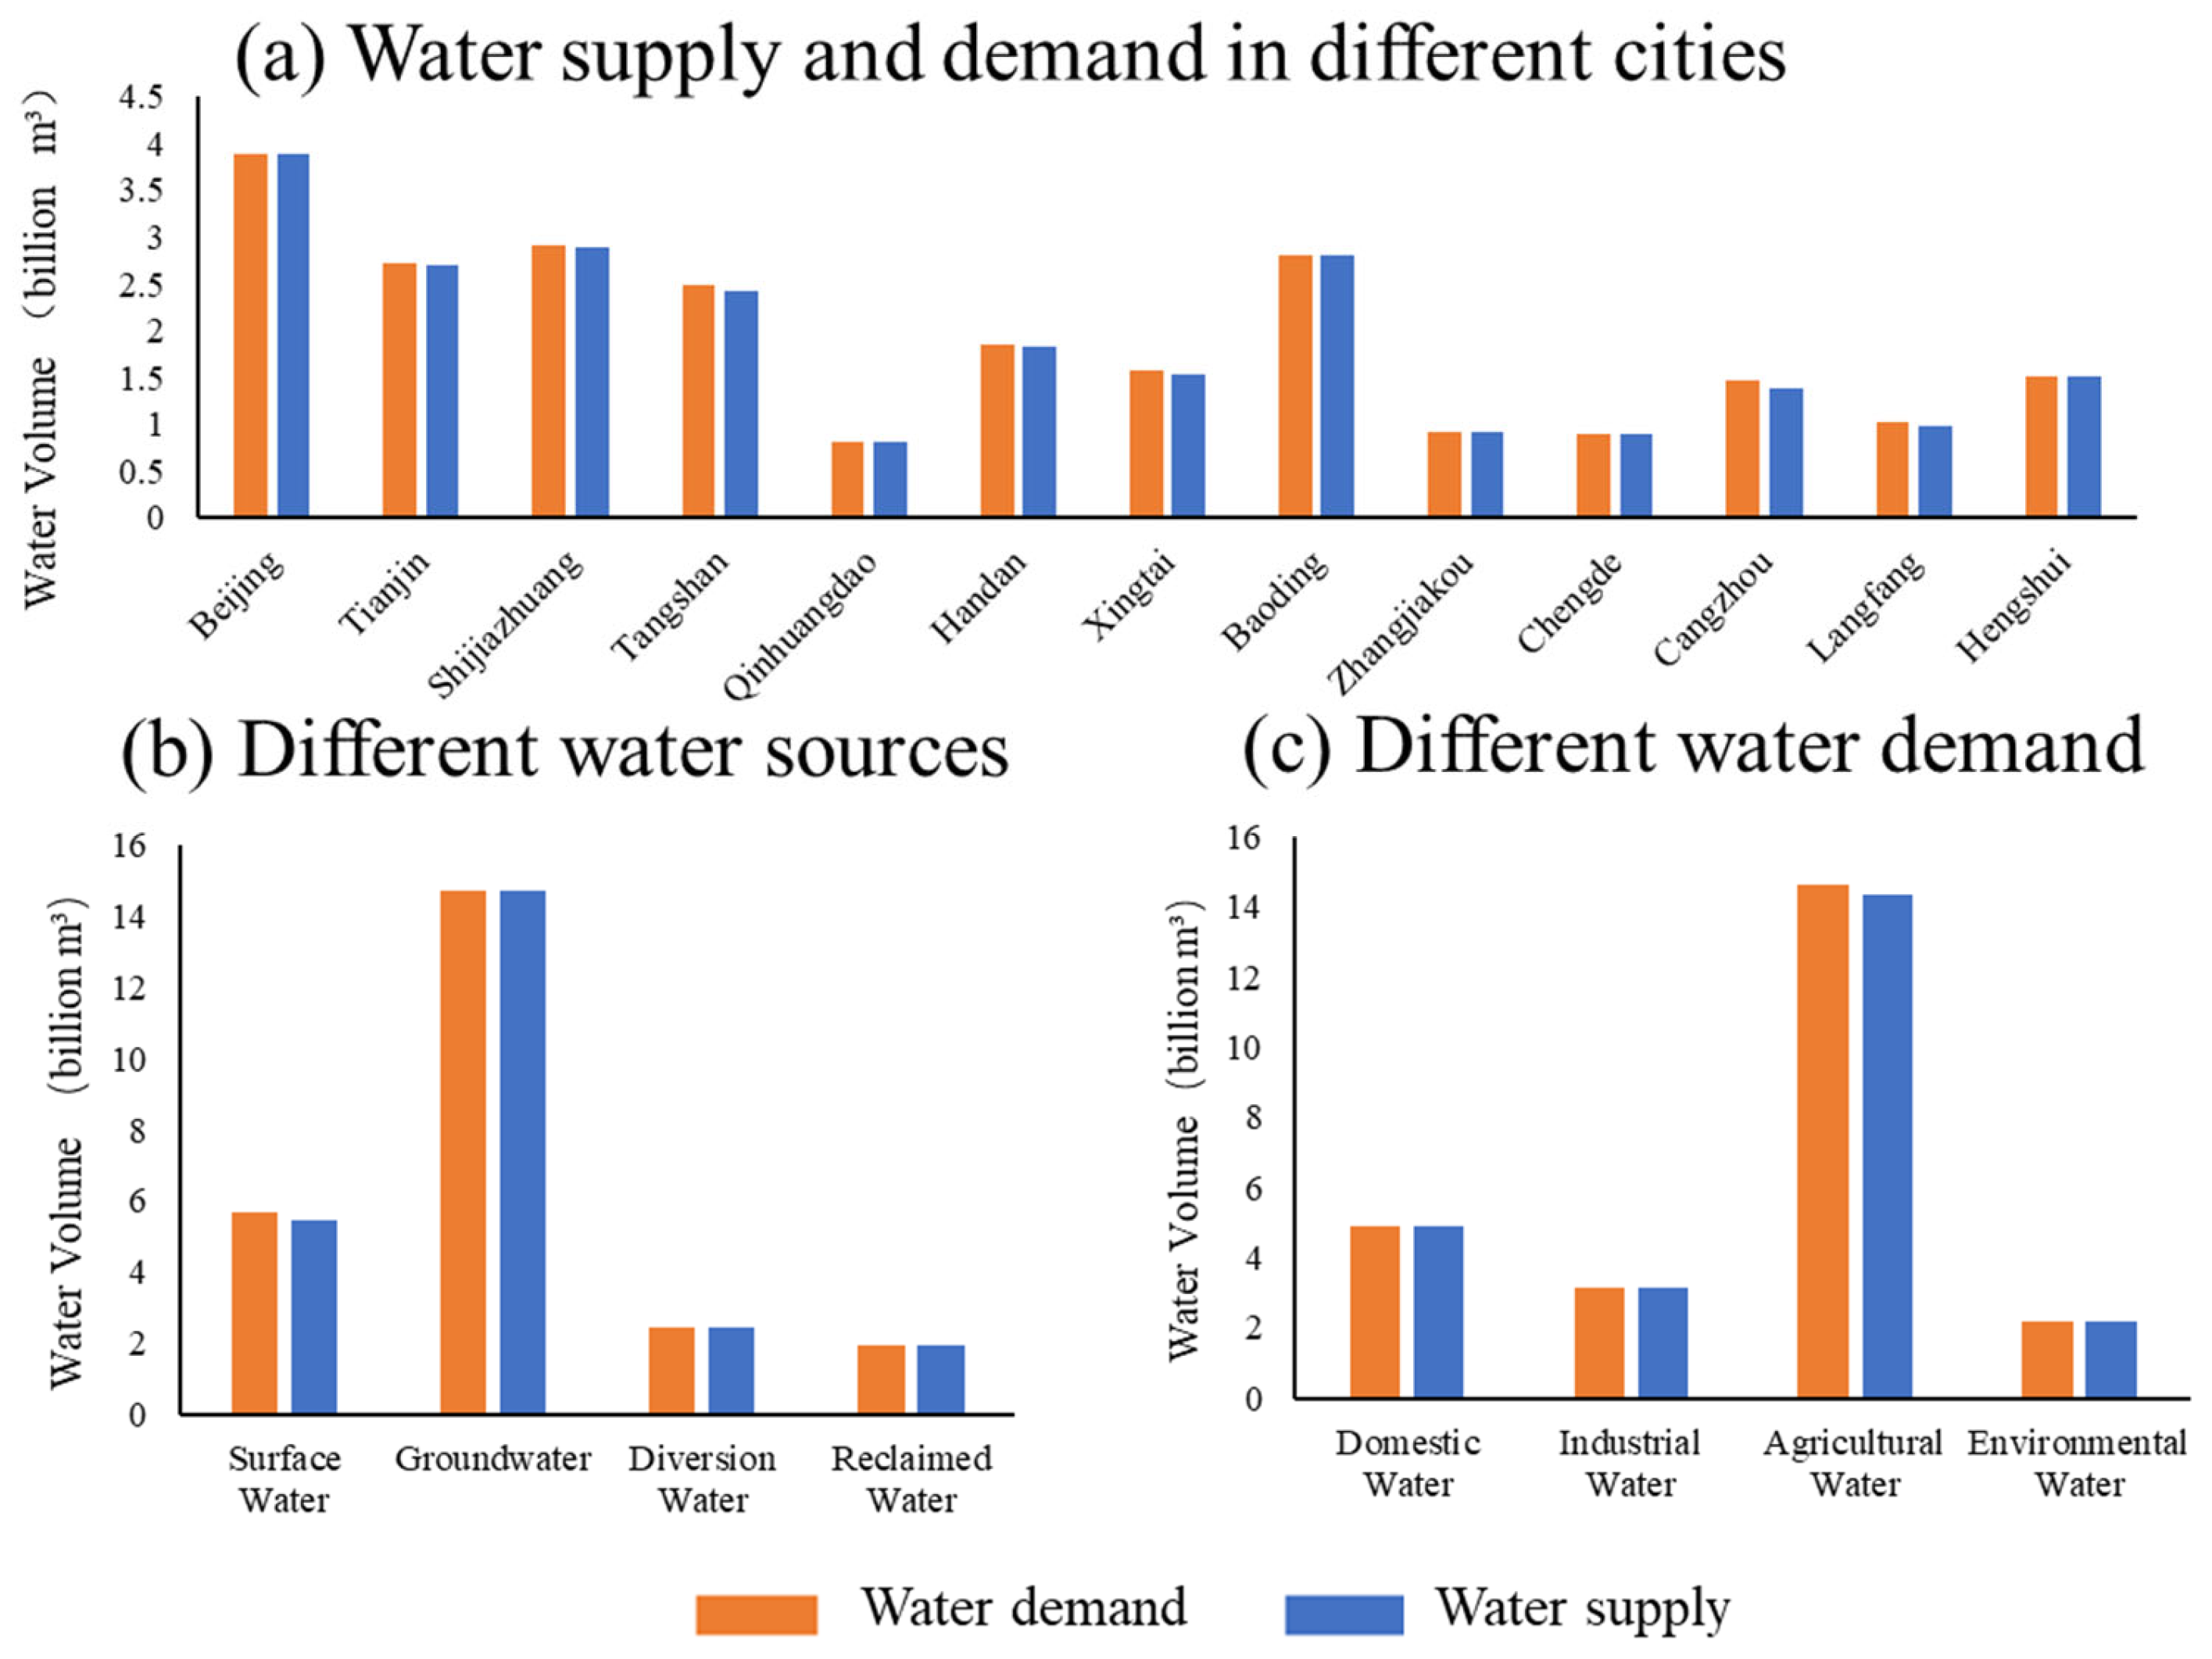
4.3. Regional Water Allocation

Model simulation results of water resource allocation in the Beijing–Tianjin–Hebei region in 2016 are shown in Figure 8. In 2016, the actual water supply was 24.86 billion m3, the simulated water supply was 24.56 billion m3, and the total error of water resource allocation in Beijing–Tianjin–Hebei was 1.2%. From a city perspective, Cangzhou had the largest error at 6.7%, while the error for other cities was less than 5%; from a water source perspective, the surface water error is the largest at 4.5%, and other errors are less than 1%; from a water demand type perspective, all errors are less than 2%. The correlation coefficient between the simulated water allocation and the real water supply in the Beijing–Tianjin–Hebei region was 0.999. This shows that the simulation effect of water resource allocation of the model is good and can meet the requirements of water resource management.

5. Results and Discussion

5.1. Unmet Water

Using the validated WAS model, the water resource allocation results from the Beijing–Tianjin–Hebei region in 2035 are presented in Table 3. In 2035, the total regional water supply will be 24.89 billion m3, the water shortage will be 920 million m3, and the overall water shortage rate will be 3.6%. There will be no water shortage in the domestic and industrial sectors of Beijing and Tianjin. The water shortage in Hebei will be mainly concentrated in the environmental and agricultural areas.

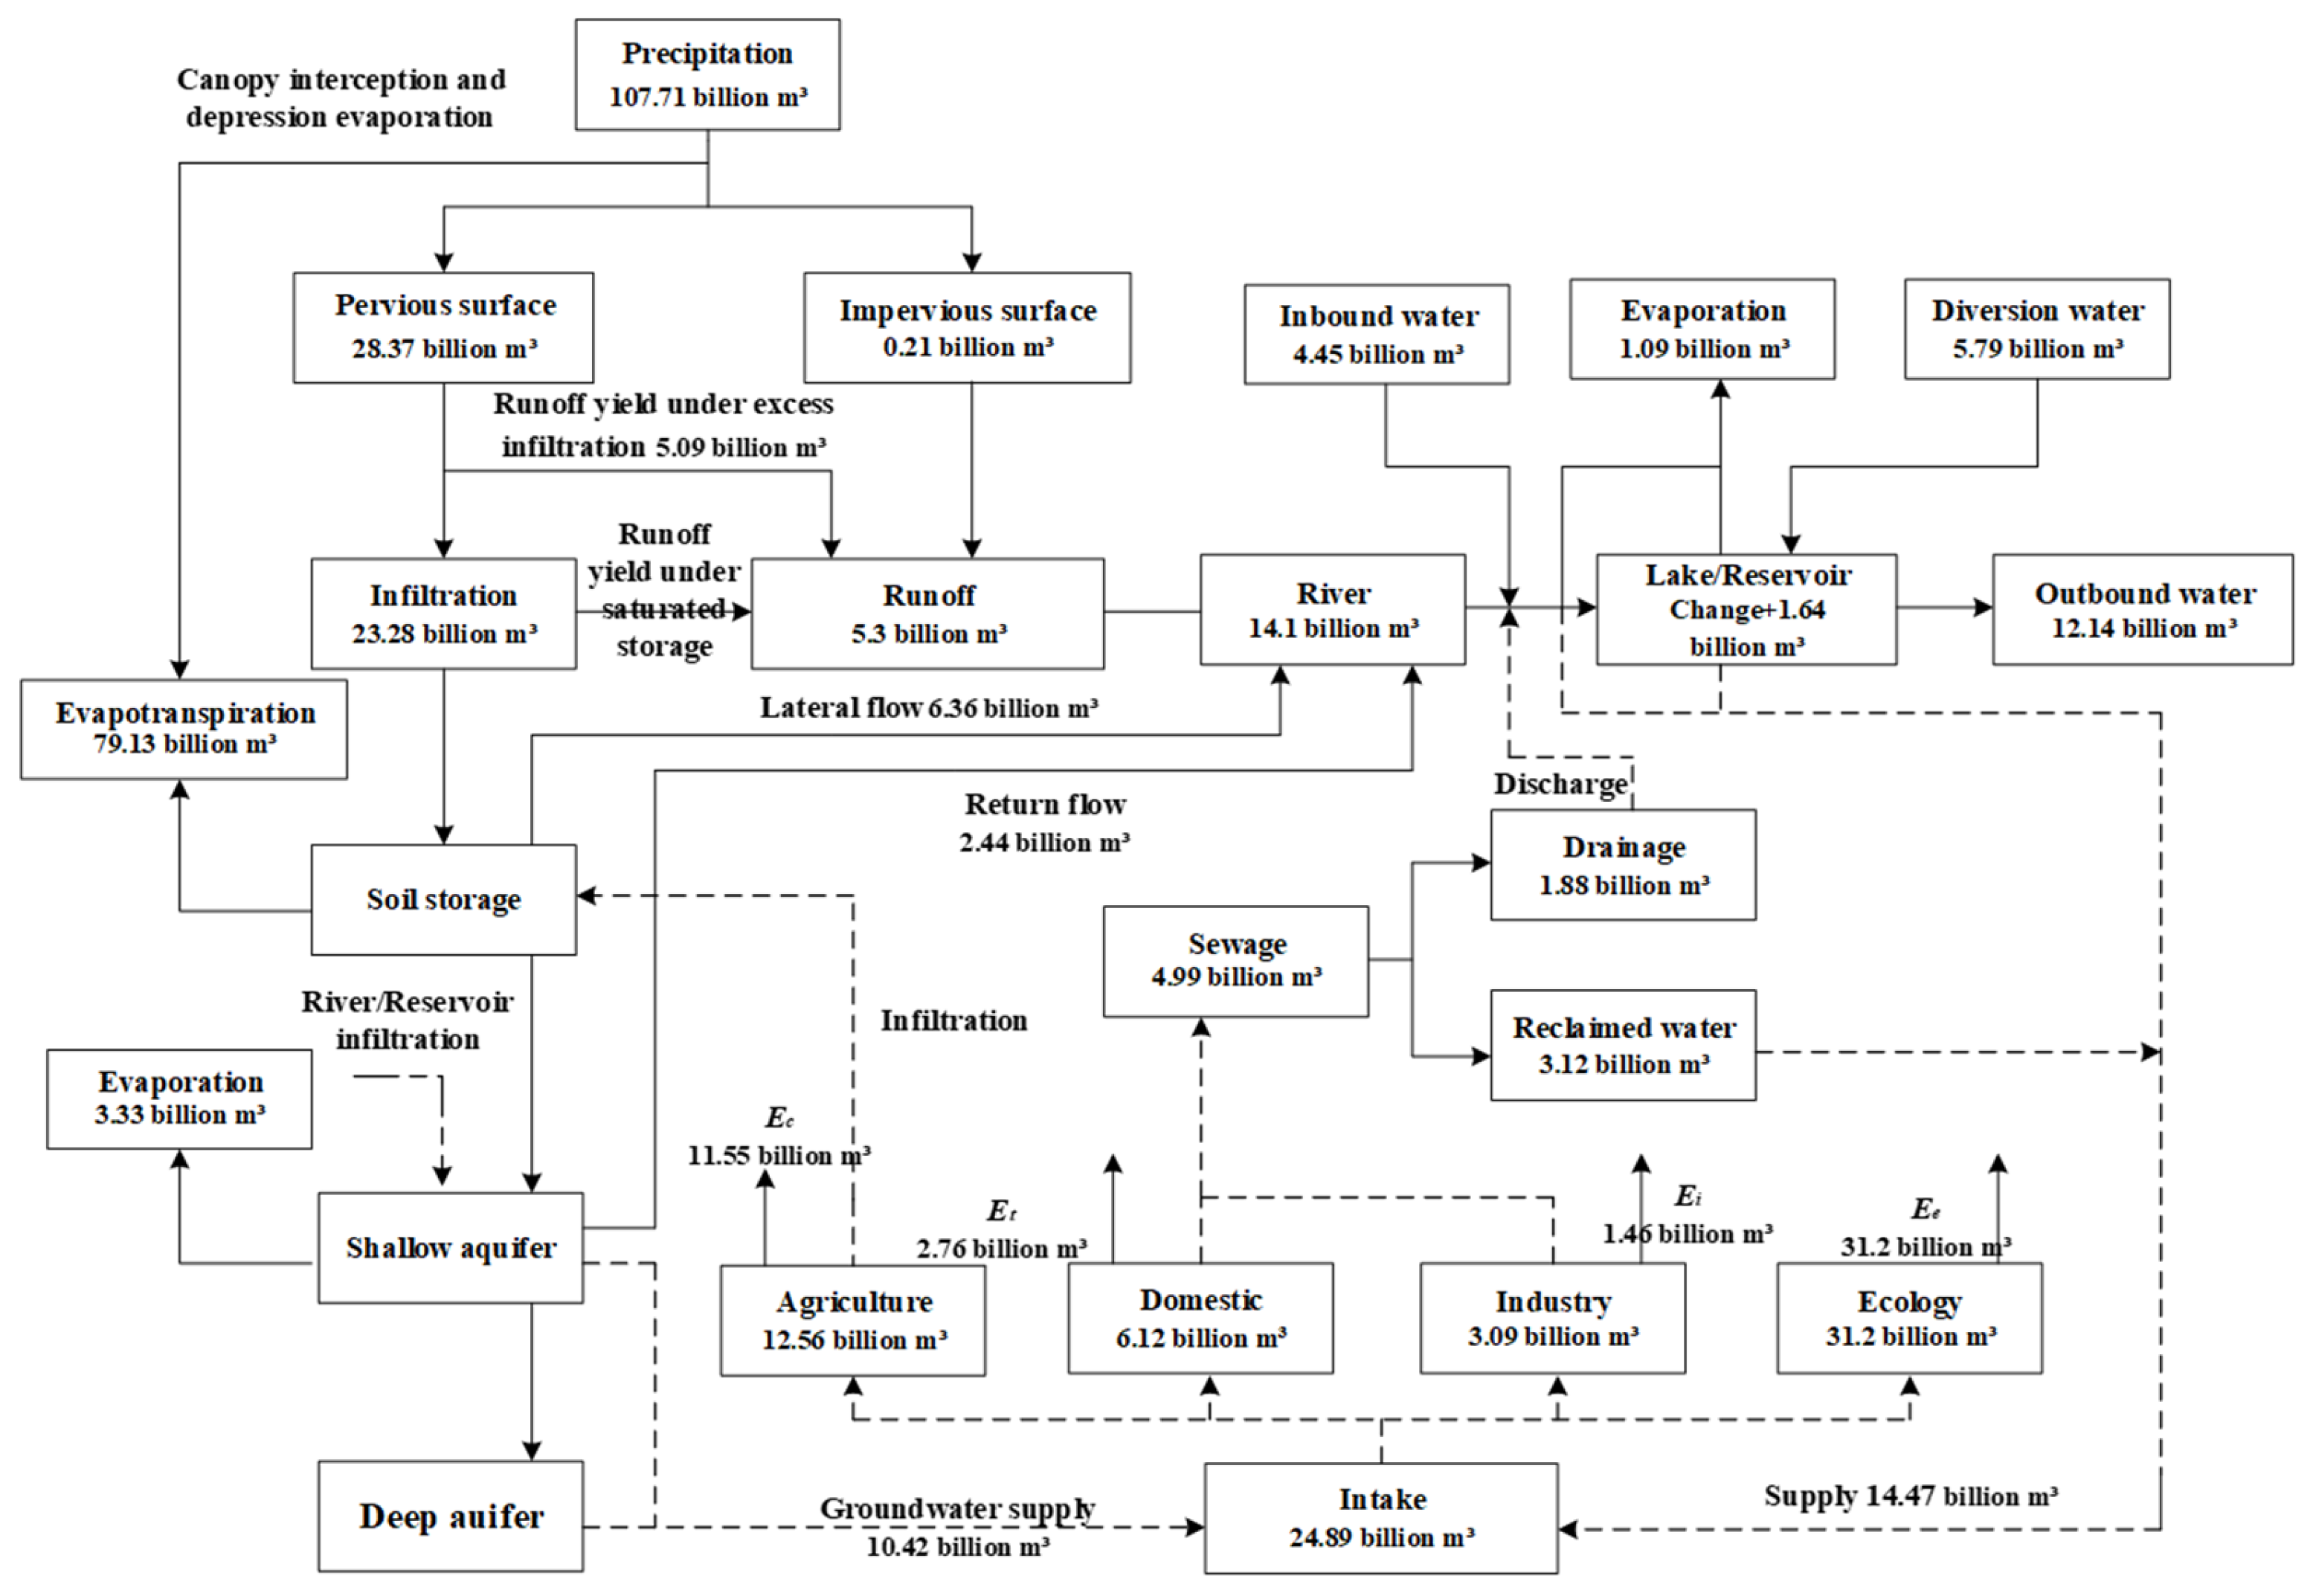
5.2. Transformation Process of Natural and Social Water Cycles

The transformation of natural and social water resources in the Beijing–Tianjin–Hebei region in 2035 is shown in Figure 9. In terms of the social water cycle, the total water supply in the Beijing–Tianjin–Hebei region will be 24.89 billion m3, including 11.36 billion m3 of surface water and external diversion water, 10.42 billion m3 of groundwater, and 3.12 billion m3 of reclaimed water. Total water usage will be 24.89 billion m3; domestic water will be 6.12 billion m3, of which water consumption will be 2.76 billion m3; industrial water will be 3.09 billion m3, of which water consumption will be 1.46 billion m3; agricultural water will be 12.56 billion m3, of which water consumption will be 11.55 billion m3; ecological water will be 3.12 billion m3, of which water consumption will be 3.12 billion m3.
In terms of the nature water cycle, the inbound water volume will be 4.45 billion m3; diversion water volume will be 5.79 billion m3; precipitation will be 107.71 billion m3; the evaporation of soil, canopy, and interception will be 79.13 billion m3; and the evaporation of phreatic water will be 3.33 billion m3, resulting in 14.1 billion m3 of surface water resources, including 5.3 billion m3 formed by runoff, 6.36 billion m3 formed by lateral flow, and 2.44 billion m3 formed by return flow. Considering the total inflow of 10.24 billion m3, evaporation leakage of 1.09 billion m3, storage variability of 1.64 billion m3, total social water supply of 24.89 billion m3, total water consumption of 18.9 billion m3, and drainage of 1.88 billion m3, the reclaimed water will be 3.12 billion m3, irrigation infiltration will be 1.02 billion m3, and total outbound water volume will be 12.14 billion m3.

5.3. Mutual Feedback Relationship within Units

According to Formula 10, surface water intake and discharge directly affect the social water cycle feedback rate, and are related to the type of water supply and water usage in the unit. Under similar conditions, the lower the proportion of surface water supply in one unit, the higher the discharge generated by other water sources, and the greater the social water cycle feedback rate. The higher the domestic and industrial water usage, the greater its discharge is and the higher its social water cycle feedback rate.
Figure 10 shows the social feedback rate of each unit in the Beijing–Tianjin–Hebei region. Surface water of the Zhangjiakou and Chengde provinces accounted for more than 35%, and agricultural water usage in the downstream plain area in Hebei Province accounted for more than 60%. Therefore, the social water cycle feedback rate of these two areas is relatively small, less than 0.25, suggesting that the water intake, consumption, and discharge of the social water cycle has a high attenuation effect on local runoff, and the discharge into the river is much lower than the surface water intake. In the central Beijing–Tianjin–Hebei region, the social feedback rate is relatively high, greater than 0.5 in most areas. However, in Beijing and the area where the city government is located, the proportion of domestic and industrial water usage is higher, and the social feedback rate is greater than 1, indicating that the water intake, consumption, and discharge of the social water cycle has an increasing effect on local runoff, and the surface water intake is lower than the discharge. Although the proportion of agricultural water in total water usage is high in Hengshui, the proportion of surface water supply is less than 5%, so the social feedback rate is relatively high, at about 0.5.

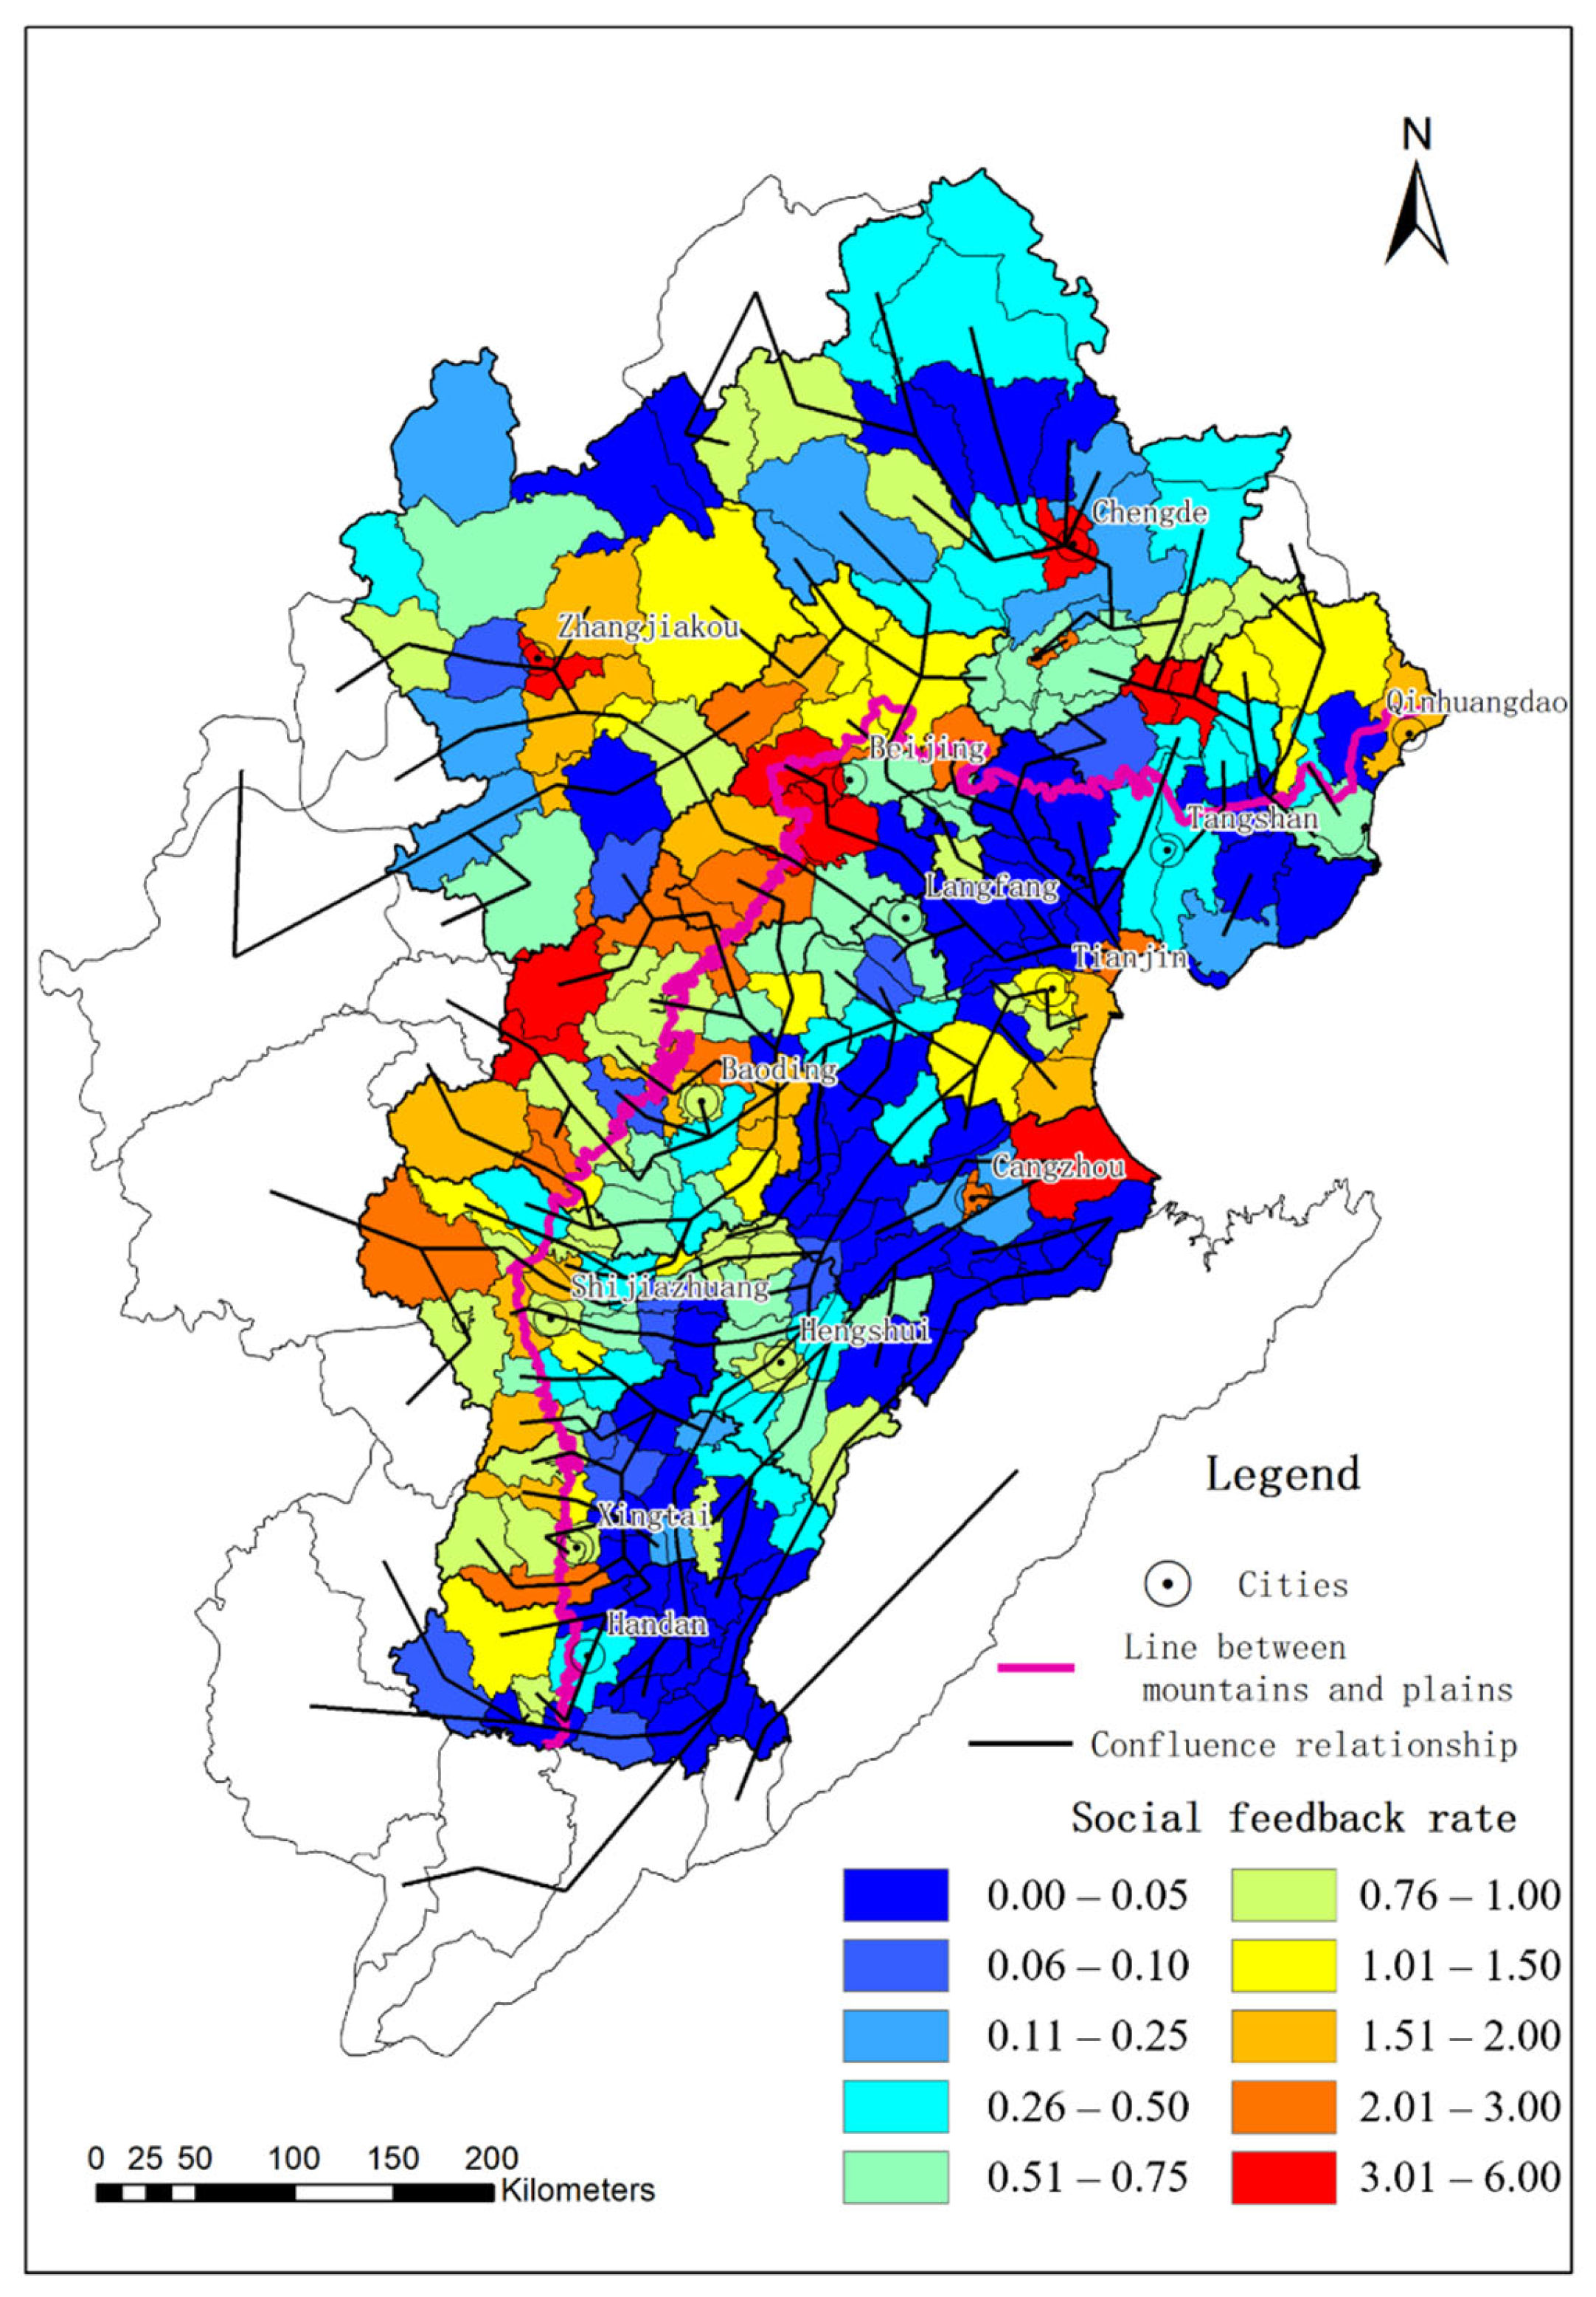
5.4. Mutual Feedback Relationship among Units

Based on local surface runoff in the Beijing–Tianjin–Hebei region, the runoff of each socio-hydrological unit under the natural water cycle in the whole region was obtained through the confluence relationship between the upstream and downstream units. The actual runoff of each socio-hydrological unit in the whole region under the natural and social water cycle was then obtained after taking into account the water intake, consumption, and discharge of the social water cycle and the storage and water supply of the reservoirs, as shown in Figure 11a. Combined with the cumulative runoff change rate of each unit in Figure 11b, this shows that most of the actual runoff of each unit attenuates to different degrees. On the one hand, this is the result of the mutual feedback of natural and social water cycles within the socio-hydrological unit. Due to the water intake, consumption, and discharge processes of the social water cycle, a high volume of water resources is directly consumed, while a portion of the water resources is returned to the river through water treatment. On the other hand, this is the result of mutual feedback between the upstream and downstream units. After water intake, consumption, and discharge in the upstream unit, the actual runoff changes, affecting the inflow of the downstream unit. In addition, some large reservoirs supply water to surrounding units, which can equalize runoff between units to varying degrees. Therefore, the Beijing–Tianjin–Hebei region has a close relationship between the natural and social water cycle mutual feedback, which is not only reflected within the unit, but also in the mutual feedback of the upstream and downstream units of the entire regional water resources system.
Figure 11b shows that the cumulative runoff change rate in most areas of the Beijing–Tianjin–Hebei region is less than 1, and the overall change rate is 0.66. Although Figure 10 shows that the social water cycle feedback rate of some units is greater than 1, under the effect of the confluence from upstream to downstream, the overall runoff still shows a decreasing trend due to the water intake, consumption, and discharge of the social water cycle. The cumulative runoff change rate in the northern Beijing–Tianjin–Hebei region is higher than that in the southern region, which is related to the higher water usage of agricultural irrigation in the south. Meanwhile, due to differences in the changes in the social water cycle feedback rate in the upper, middle, and downstream, the cumulative runoff change rate does not have a one-way increasing or decreasing trend with the river direction. It can be seen from Figure 11b that, in areas with more large and medium-sized reservoirs, the cumulative runoff change rate is very low, indicating strong runoff attenuation, which is related to the local water stored in the reservoir to supply water to the external units. For example, the water stored in Miyun is used by the main urban area of Beijing, which will directly lead to a decrease in runoff in the unit where the Miyun Reservoir is located.

6. Conclusions

(1)
This paper establishes a set of indexes that can quantitatively describe the mutual feedback relationship of the natural-social dualistic water cycles among upstream and downstream units and within units. The cumulative runoff change rate was used to characterize the change degree of runoff in units under the mutual feedback effect of the natural-social dualistic water cycles in all upstream regions. The social water cycle feedback rate was used to characterize the degree of influence of the water intake, consumption, and discharge of the social water cycle process on the natural water cycle system. This provides a new method to identify the multi-process mutual feedback mechanism of the natural and social water cycles.
(2)
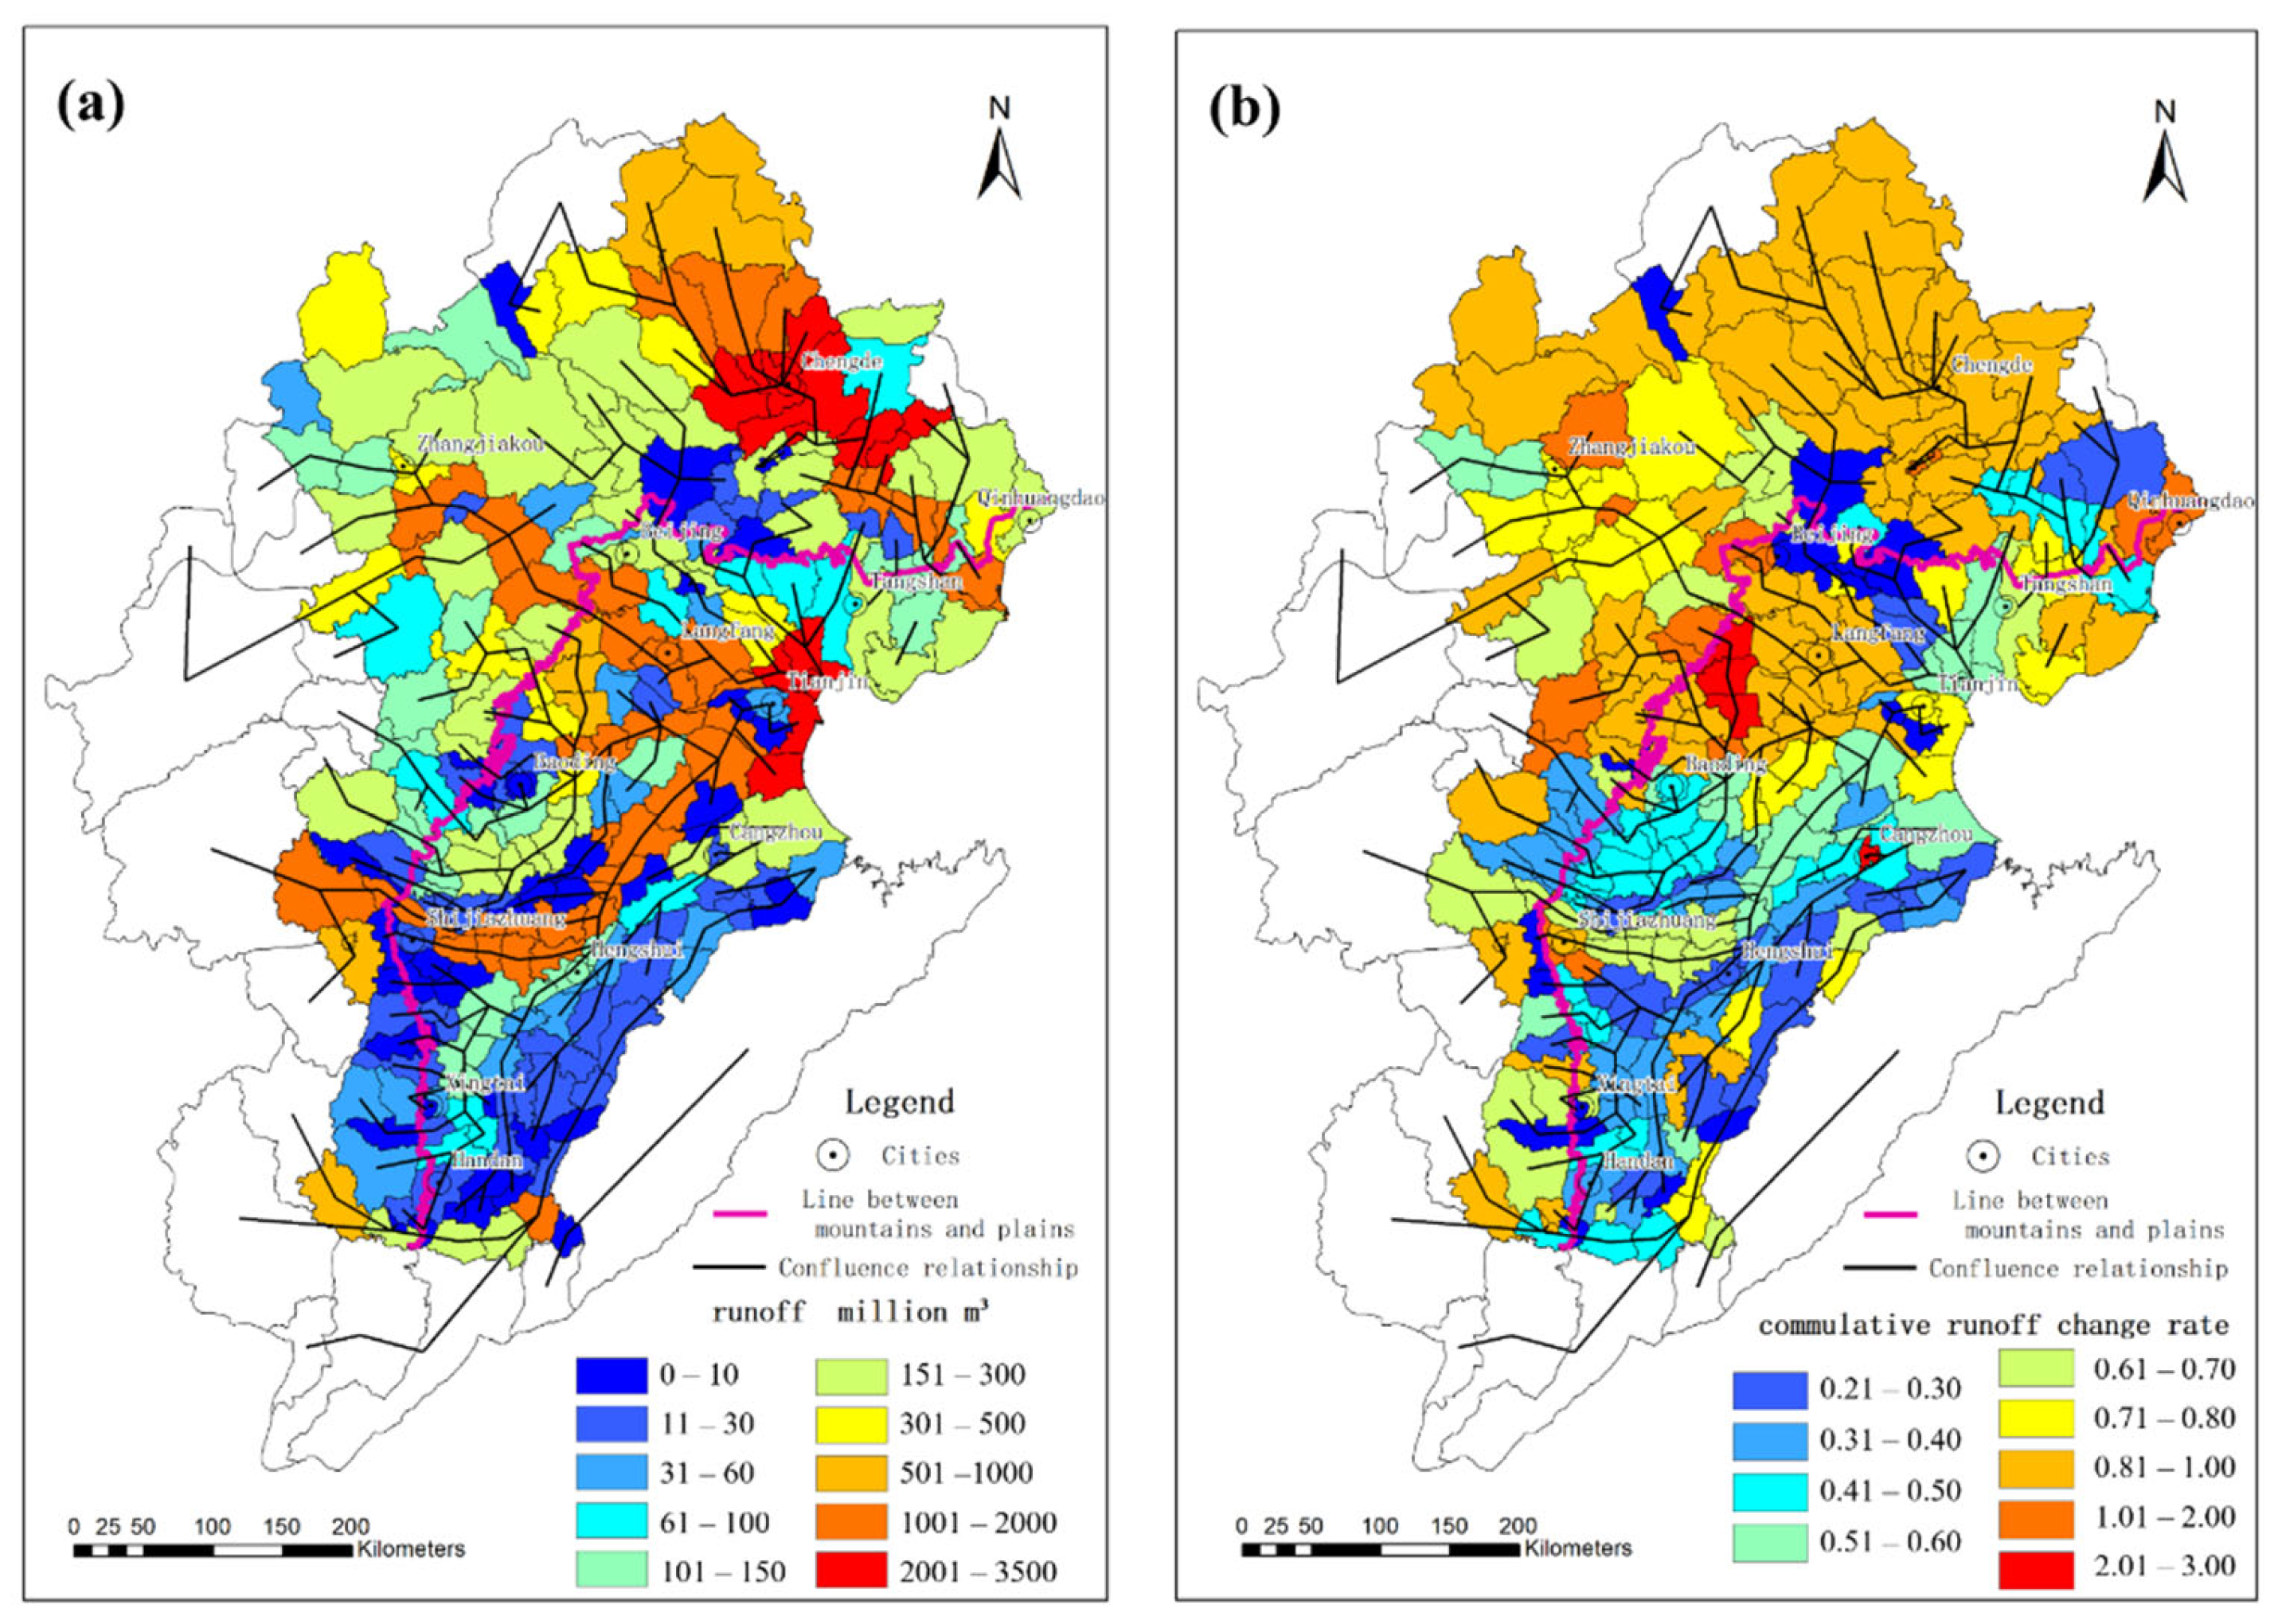
The year 2035 was used as the future research year to obtain results regarding the natural-social dualistic water cycle transformation and mutual feedback in the Beijing–Tianjin–Hebei region. The social water cycle feedback rate is greater than 1 in Beijing and Tianjin, and less than 0.25 in the mountainous areas and the Hebei plain, indicating that the social water cycle of each unit in the Beijing–Tianjin–Hebei region increases or decreases local runoff due to different water supply types and use structures. The cumulative runoff change rate is 0.66, indicating that the overall runoff is attenuating due to the social water cycle, and the attenuation of runoff in the south is greater than in the north.
(3)
Based on the WAS model, an integrated model of the natural-social dualistic water cycle was constructed for the Beijing–Tianjin–Hebei region, which exhibits high human activity, and the model was calibrated from three aspects: cross-sectional runoff, regional water resources, and regional water allocation. The model has a good effect for simulating regional runoff and water resource allocation, and can better simulate the interaction between the natural and social water cycles.
It is worth noting that due to the linkage, real-time feedback, and complexity of the natural-social dualistic water cycles, the indexes proposed in this study may have some limitations in practical application. For example, in areas where water is supplied by multiple water sources, it is difficult to distinguish the influence of specific water sources on local runoff, and when social water intake and discharge are equal, it is difficult to distinguish the difference between these areas and areas without the social water cycle affect. Although the above situations can be determined by additional results of the WAS model, in future research, the indexes can be further improved according to the characteristics of the natural-social dualistic water cycles, so that the practicability and representativeness could be enhanced.

Author Contributions

Writing—original manuscript, H.C. and X.S.; data collection, G.H., Q.W., S.J. and F.H.; case analysis, H.L. and Y.Z.; project management, H.C., X.S. and Y.Z.; funding, X.S. All authors have read and agreed to the published version of the manuscript.

Funding

This research is supported by the National Key Research and Development Program of China (Grant No. 2021YFC3200204), the National Science Fund for Distinguished Young Scholars (Grant No. 52025093), the National Natural Science Foundation of China for Young Scholars (52109042), the NSFC Projects of International Cooperation and Exchanges (52061125101), and the China Institute of Water Resources and Hydropower Research (WR0145B032021).

Institutional Review Board Statement

Not applicable.

Informed Consent Statement

Not applicable.

Data Availability Statement

The data used to support the findings of this study are available from the corresponding author upon request.

Conflicts of Interest

The authors declare no conflict of interest.

References

  1. Wang, H.; Yan, D.; Jia, Y.; Hu, D.; Wang, L. Subject system of modern hydrology and water resources and research frontiers and hot issues. Adv. Water Sci. 2010, 21, 479–489. (In Chinese) [Google Scholar]
  2. Wagener, T.; Sivapalan, M.; Troch, P.A.; McGlynn, B.L.; Harman, C.J.; Gupta, H.V.; Kumar, P.; Rao, P.S.C.; Basu, N.B.; Wilson, J.S. The future of hydrology: An evolving science for a changing world. Water Resour. Res. 2010, 46, 1–10. [Google Scholar] [CrossRef]
  3. Falkenm, R.K.M. Water and mankind: A complex system of mutual interaction. Organ. Behav. Hum. Decis. Process. 1992, 52, 64–95. [Google Scholar]
  4. Smakhtin, V.U.; Shilpakar, R.L.; Hughes, D.A. Hydrology-based assessment of environmental flows: An example from Nepal. Hydrol. Sci. J. 2006, 51, 207–222. [Google Scholar] [CrossRef] [Green Version]
  5. Mohorjy, A.M. Multidisciplinary planning and managing of water reuse. JAWRA J. Am. Water Resour. Assoc. 1989, 25, 433–442. [Google Scholar] [CrossRef]
  6. Liu, J.; Dietz, T.; Carpenter, S.R.; Folke, C.; Alberti, M.; Redman, C.L.; Schneider, S.H.; Ostrom, E.; Pell, A.N.; Lubchenco, J.; et al. Coupled human and natural systems. AMBIO 2007, 36, 639–649. [Google Scholar] [CrossRef]
  7. Sivapalan, M.; Savenije, H.; Bloeschl, G. Sociohydrology: A new science of people and water. Hydrol. Process. 2012, 26, 1270–1276. [Google Scholar] [CrossRef]
  8. Wang, H.; Chen, M.; Qin, D. Research on Rational Allocation and Carrying Capacity of Water Resources in Northwest China; The Yellow River Water Conservancy Press: Zhengzhou, China, 2003. (In Chinese) [Google Scholar]
  9. Roobavannan, M.; Kandasamy, J.; Pande, S.; Vigneswaran, S.; Sivapalan, M. Sustainability of agricultural basin development under uncertain future climate and economic conditions: A socio-hydrological analysis. Ecol. Econ. 2020, 174, 106665. [Google Scholar] [CrossRef]
  10. Liu, D.; Tian, F.; Lin, M.; Sivapalan, M. A conceptual socio-hydrological model of the co-evolution of humans and water: Case study of the Tarim River basin, western China. Hydrol. Earth Syst. Sci. 2015, 19, 1035–1054. [Google Scholar] [CrossRef] [Green Version]
  11. Van Emmerik, T.H.M.; Li, Z.; Sivapalan, M.; Pande, S.; Kandasamy, J.; Savenije, H.H.G.; Chanan, A.; Vigneswaran, S. Socio-hydrologic modeling to understand and mediate the competition for water between agriculture development and environmental health: Murrumbidgee River basin, Australia. Hydrol. Earth Syst. Sci. 2014, 18, 4239–4259. [Google Scholar] [CrossRef] [Green Version]
  12. Enteshari, S.; Safavi, H.R.; Zaag, P.V.D. Simulating the interactions between the water and the socio-economic system in a stressed endorheic basin. Hydrol. Sci. J. 2020, 65, 2159–2174. [Google Scholar] [CrossRef]
  13. Gober, P.; Wheater, H.S. Socio-hydrology and the science–policy interface: A case study of the saskatchewan river basin. Hydrol. Earth Syst. Sci. 2018, 18, 1413–1422. [Google Scholar] [CrossRef]
  14. Jaramillo, L.; Stone, M.; Morrison, R. An indicator-based approach to assessing resilience of socio-hydrologic systems in Nepal to hydropower development. J. Hydrol. 2018, 563, 1111–1118. [Google Scholar] [CrossRef]
  15. Shams, A.; Berglund, E.; Mahinthakumar, G.; Larson, K. Assessing the effects of water restrictions on socio-hydrologic resilience for shared groundwater systems. J. Hydrol. 2018, 566, 872–885. [Google Scholar]
  16. Yu, D.; Sangwan, N.; Sung, K.; Chen, X.; Merwade, V. Incorporating institutions and collective action into a sociohydrological model of flood resilience. Water Resour. Res. 2017, 53, 1336–1353. [Google Scholar] [CrossRef]
  17. Chen, X.; Wang, D.; Tian, F.; Sivapalan, M. From channelization to restoration: Sociohydrologic modeling with changing community preferences in the Kissimmee River Basin, Florida. Water Resour. Res. 2016, 52, 1227–1244. [Google Scholar] [CrossRef] [Green Version]
  18. Wescoat, J.; Siddiqi, A.; Muhammad, A. Socio-Hydrology of Channel Flows in Complex River Basins: Rivers, Canals, and Distributaries in Punjab, Pakistan. Water Resour. Res. 2018, 54, 464–479. [Google Scholar] [CrossRef] [Green Version]
  19. Wang, H.; Jia, Y. Theory and study methodology of dualistic water cycle in river basins under changing conditions. J. Hydraul. Eng. 2016, 47, 1219–1226. (In Chinese) [Google Scholar]
  20. Liang, J.; Xie, J.; Wang, X.; Wang, S.; Yu, M. Visualization of Multi Scenario Water Resources Regulation Based on a Dualistic Water Cycle Framework. Water 2022, 14, 1128. [Google Scholar] [CrossRef]
  21. Liu, H.; Jia, Y.; Niu, C.; Gan, Y.; Xu, F. Evaluation of regional water security in China based on dualistic water cycle theory. Water Policy 2019, 20, 510–529. [Google Scholar] [CrossRef]
  22. Zhang, S.; Fan, W.; Yi, Y.; Zhao, Y.; Liu, J. Evaluation method for regional water cycle health based on nature-society water cycle theory. J. Hydrol. 2017, 551, 352–364. [Google Scholar] [CrossRef]
  23. Qin, D.; Lu, C.; Liu, J.; Wang, H.; Wang, J.; Li, H.; Chu, J.; Chen, G. Theoretical framework of dualistic nature–social water cycle. Chin. Sci. Bull. 2014, 59, 810–820. [Google Scholar] [CrossRef]
  24. Liu, J.; Qin, D.; Wang, H.; Wang, M.; Yang, Z. Dualistic water cycle pattern and its evolution in Haihe river basin. Chin. Sci. Bull. 2010, 55, 1688–1697. [Google Scholar] [CrossRef]
  25. Wei, N.; You, J.; Jia, Y.; Gan, Y.; Niu, C.; Zhang, S. Dualistic water cycle based-study on control of total water use and water use efficiency—A case study on Weihe River Basin. Water Resour. Hydropower Eng. 2015, 46, 22–26. (In Chinese) [Google Scholar]
  26. Gu, L. Diagnosis and Management of Drought Pressure Based on Dualistic Water Cycle Simulation Model in Jing River Basin. Master’s Thesis, Chang’an University, Xi’an, China, 2016. (In Chinese). [Google Scholar]
  27. Wang, X.; Liu, C.; Zhang, Y. Water Quantity/Quality Combined Evaluation Method for Rivers’ Water Requirements of the Instream Environmental Flow in Dualistic Water Cycle: A Case Study of Liaohe River Basin. Acta Geogr. Sinica. 2006, 61, 1132–1140. (In Chinese) [Google Scholar]
  28. Zhang, J. Studies on the ecologic result of hydrology two dimension division in arid area: Case studies of Manas River basin in Xingjiang. J. Econ. Water Resour. 2006, 24, 1–2. (In Chinese) [Google Scholar]
  29. Montanari, A.; Young, G.; Savenije, H.H.G.; Hughes, D.; Wagener, T.; Ren, L.L.; Koutsoyiannis, D.; Cudennec, C.; Toth, E.; Grimaldi, S.; et al. “Panta Rhei—Everything Flows”: Change in hydrology and society—The IAHS Scientific Decade 2013–2022. Int. Assoc. Sci. Hydrol. Bull. 2013, 58, 1256–1275. [Google Scholar] [CrossRef]
  30. Zhao, X.; Liu, D.; Wei, X.; Ma, L.; Lin, M.; Meng, X.; Huang, Q. Analysis of Socio-Hydrological Evolution Processes Based on a Modeling Approach in the Upper Reaches of the Han River in China. Water 2021, 13, 2458. [Google Scholar] [CrossRef]
  31. Elshafei, Y.; Coletti, J.Z.; Sivapalan, M.; Hispsey, M.R. A model of the socio-hydrologic dynamics in a semiarid catchment: Isolating feedbacks in the coupled human-hydrology system. Water Resour. Res. 2015, 51, 6442–6471. [Google Scholar] [CrossRef]
  32. Tesfatsion, L.; Rehmann, C.R.; Cardoso, D.S.; Jie, Y.; Gutowski, W.J. An agent-based platform for the study of watersheds as coupled natural and human systems. Environ. Model. Softw. 2017, 89, 40–60. [Google Scholar] [CrossRef] [Green Version]
  33. Essenfelder, A.H.; Perez-Blanco, C.D.; Mayer, A.S. Rationalizing Systems Analysis for the Evaluation of Adaptation Strategies in Complex Human-Water Systems. Earth Future 2018, 6, 1181–1206. [Google Scholar] [CrossRef] [Green Version]
  34. Ma, Y.; Shen, Z.; Kawakami, M.; Suzuki, K.; Long, Y. An Agent-Based Approach to Support Decision-Making of Total Amount Control for Household Water Consumption. In Geospatial Techniques in Urban Planning; Springer: Berlin/Heidelberg, Germany, 2012. [Google Scholar]
  35. Bekchanov, M.; Sood, A.; Pinto, A.; Jeuland, M. Systematic Review of Water-Economy Modeling Applications. J. Water Resour. Plan. Manag. 2017, 143, 4017037. [Google Scholar] [CrossRef]
  36. Li, B.; Sivapalan, M.; Xu, X. An Urban Sociohydrologic Model for Exploration of Beijing’s Water Sustainability Challenges and Solution Spaces. Water Resour. Res. 2019, 55, 5918–5940. [Google Scholar] [CrossRef]
  37. Pouladi, P.; Afshara, A.; Afshar, M.H.; Molajou, A.; Farahmand, H. Agent-based socio-hydrological modeling for restoration of Urmia Lake: Application of theory of planned behavior. J. Hydrol. 2019, 576, 736–748. [Google Scholar] [CrossRef]
  38. Sang, X.; Wang, H.; Wang, J.; Zhao, Y.; Zhou, Z. Water Resources Comprehensive Allocation and Simulation Model (WAS), part I. Theory and development. J. Hydraul. Eng. 2018, 49, 1451–1459. (In Chinese) [Google Scholar]
  39. Chang, H.; Sang, X.; He, G.; Wang, Q.; Chang, J.; Liu, R.; Li, H.; Zhao, Y. A Socio-Hydrological Unit Division and Confluence Relationship Generation Method for Human–Water Systems. Water 2022, 14, 2074. [Google Scholar] [CrossRef]
  40. Chang, H. Development and Improvement of WAS Model and Application of Water Resources Allocation in Beijing-Tianjin-Hebei Region. Master’s Thesis, China Institute of Water Resources and Hydropower Research, Beijing, China, 2019. (In Chinese). [Google Scholar]
  41. Sang, X.; Zhao, Y.; Zhai, Z.; Chang, H. Water Resources Comprehensive Allocation and Simulation Model (WAS), part II. Application. J. Hydraul. Eng. 2019, 50, 201–208. (In Chinese) [Google Scholar]
Figure 1. Water allocation and simulation (WAS) model framework.
Water 14 03227 g001
Figure 2. Mutual feedback mechanism of upstream and downstream socio-hydrological units; the blue line represents the confluence relationship.
Water 14 03227 g002
Figure 3. Mutual feedback mechanism of natural and social water cycles in each unit.
Water 14 03227 g003
Figure 4. Study area.
Water 14 03227 g004
Figure 5. (a) Distribution of the meteorological and runoff stations in the study area; (b) socio-hydrological units and corresponding convergence relationship in the study area.
Water 14 03227 g005
Figure 6. Comparison of annual precipitation and simulated and observed runoff during the calibration and validation periods at seven runoff stations.
Water 14 03227 g006
Figure 7. Comparison of simulated and observed surface water resources under different characteristic frequencies for different cities.
Water 14 03227 g007
Figure 8. Comparison of water supply and water demand.
Water 14 03227 g008
Figure 9. Natural and social water cycle transformation process.
Water 14 03227 g009
Figure 10. Social water cycle feedback rate of each unit in the Beijing–Tianjin–Hebei region under the 2035 scenario.
Water 14 03227 g010
Figure 11. Mutual feedback relationships among units in the Beijing–Tianjin–Hebei region for (a) actual runoff and (b) cumulative runoff change rate.
Water 14 03227 g011
Table 1. Beijing–Tianjin–Hebei water demand in 2035 (the future research year) (billion m3).
Province2035
Domestic
Water
Industrial
Water
Agricultural
Water
Environmental
Water
Total
Water
Beijing1.850.380.491.464.18
Tianjin0.680.551.200.623.05
Hebei3.762.1911.421.2018.59
Total6.293.1313.123.2925.82
Table 2. Calibration and validation results of cross-section runoff in the study area.
Runoff
Station
Calibration Period
(1961–1980)
Validation Period
(1981–2000)
R 2 N S E R 2 N S E
Luanxian0.820.600.890.69
Yuqiao0.890.720.900.81
Xidayang0.760.540.790.50
Wangkuai0.890.700.880.65
Huangbizhuang0.740.530.900.75
Miyun *Calibration Period
(1981–2000)
0.820.67
Guanting *Calibration Period
(1985–2000)
0.830.68
* Due to the short period of observed runoff data, only calibration is carried out.
Table 3. Beijing–Tianjin–Hebei water resource allocation (billion m3).
ProvinceWater
Demand
Water Supply
RiverReservoirsGroundWaterReclaimed
Water
Beijing4.181.040.261.611.21
Tianjin3.051.710.280.430.55
Hebei18.595.792.278.381.36
Total25.828.552.810.423.12
ProvinceUnmet
Water
Water Usage
Domestic
Water
Industrial
Water
Agricultural
Water
Environmental
Water
Beijing0.071.850.380.491.4
Tianjin0.080.680.551.130.61
Hebei0.783.62.1610.941.11
Total0.926.123.0912.563.12
Publisher’s Note: MDPI stays neutral with regard to jurisdictional claims in published maps and institutional affiliations.

