


Relationship between Water Use and Energy Generation from Different Power Generation Types in a Megacity Facing Water Shortages: A Case Study in Shenzhen

Abstract
:1. Introduction
2. Materials and Methods
2.1. Study Area
2.2. Data Collecting
3. Results
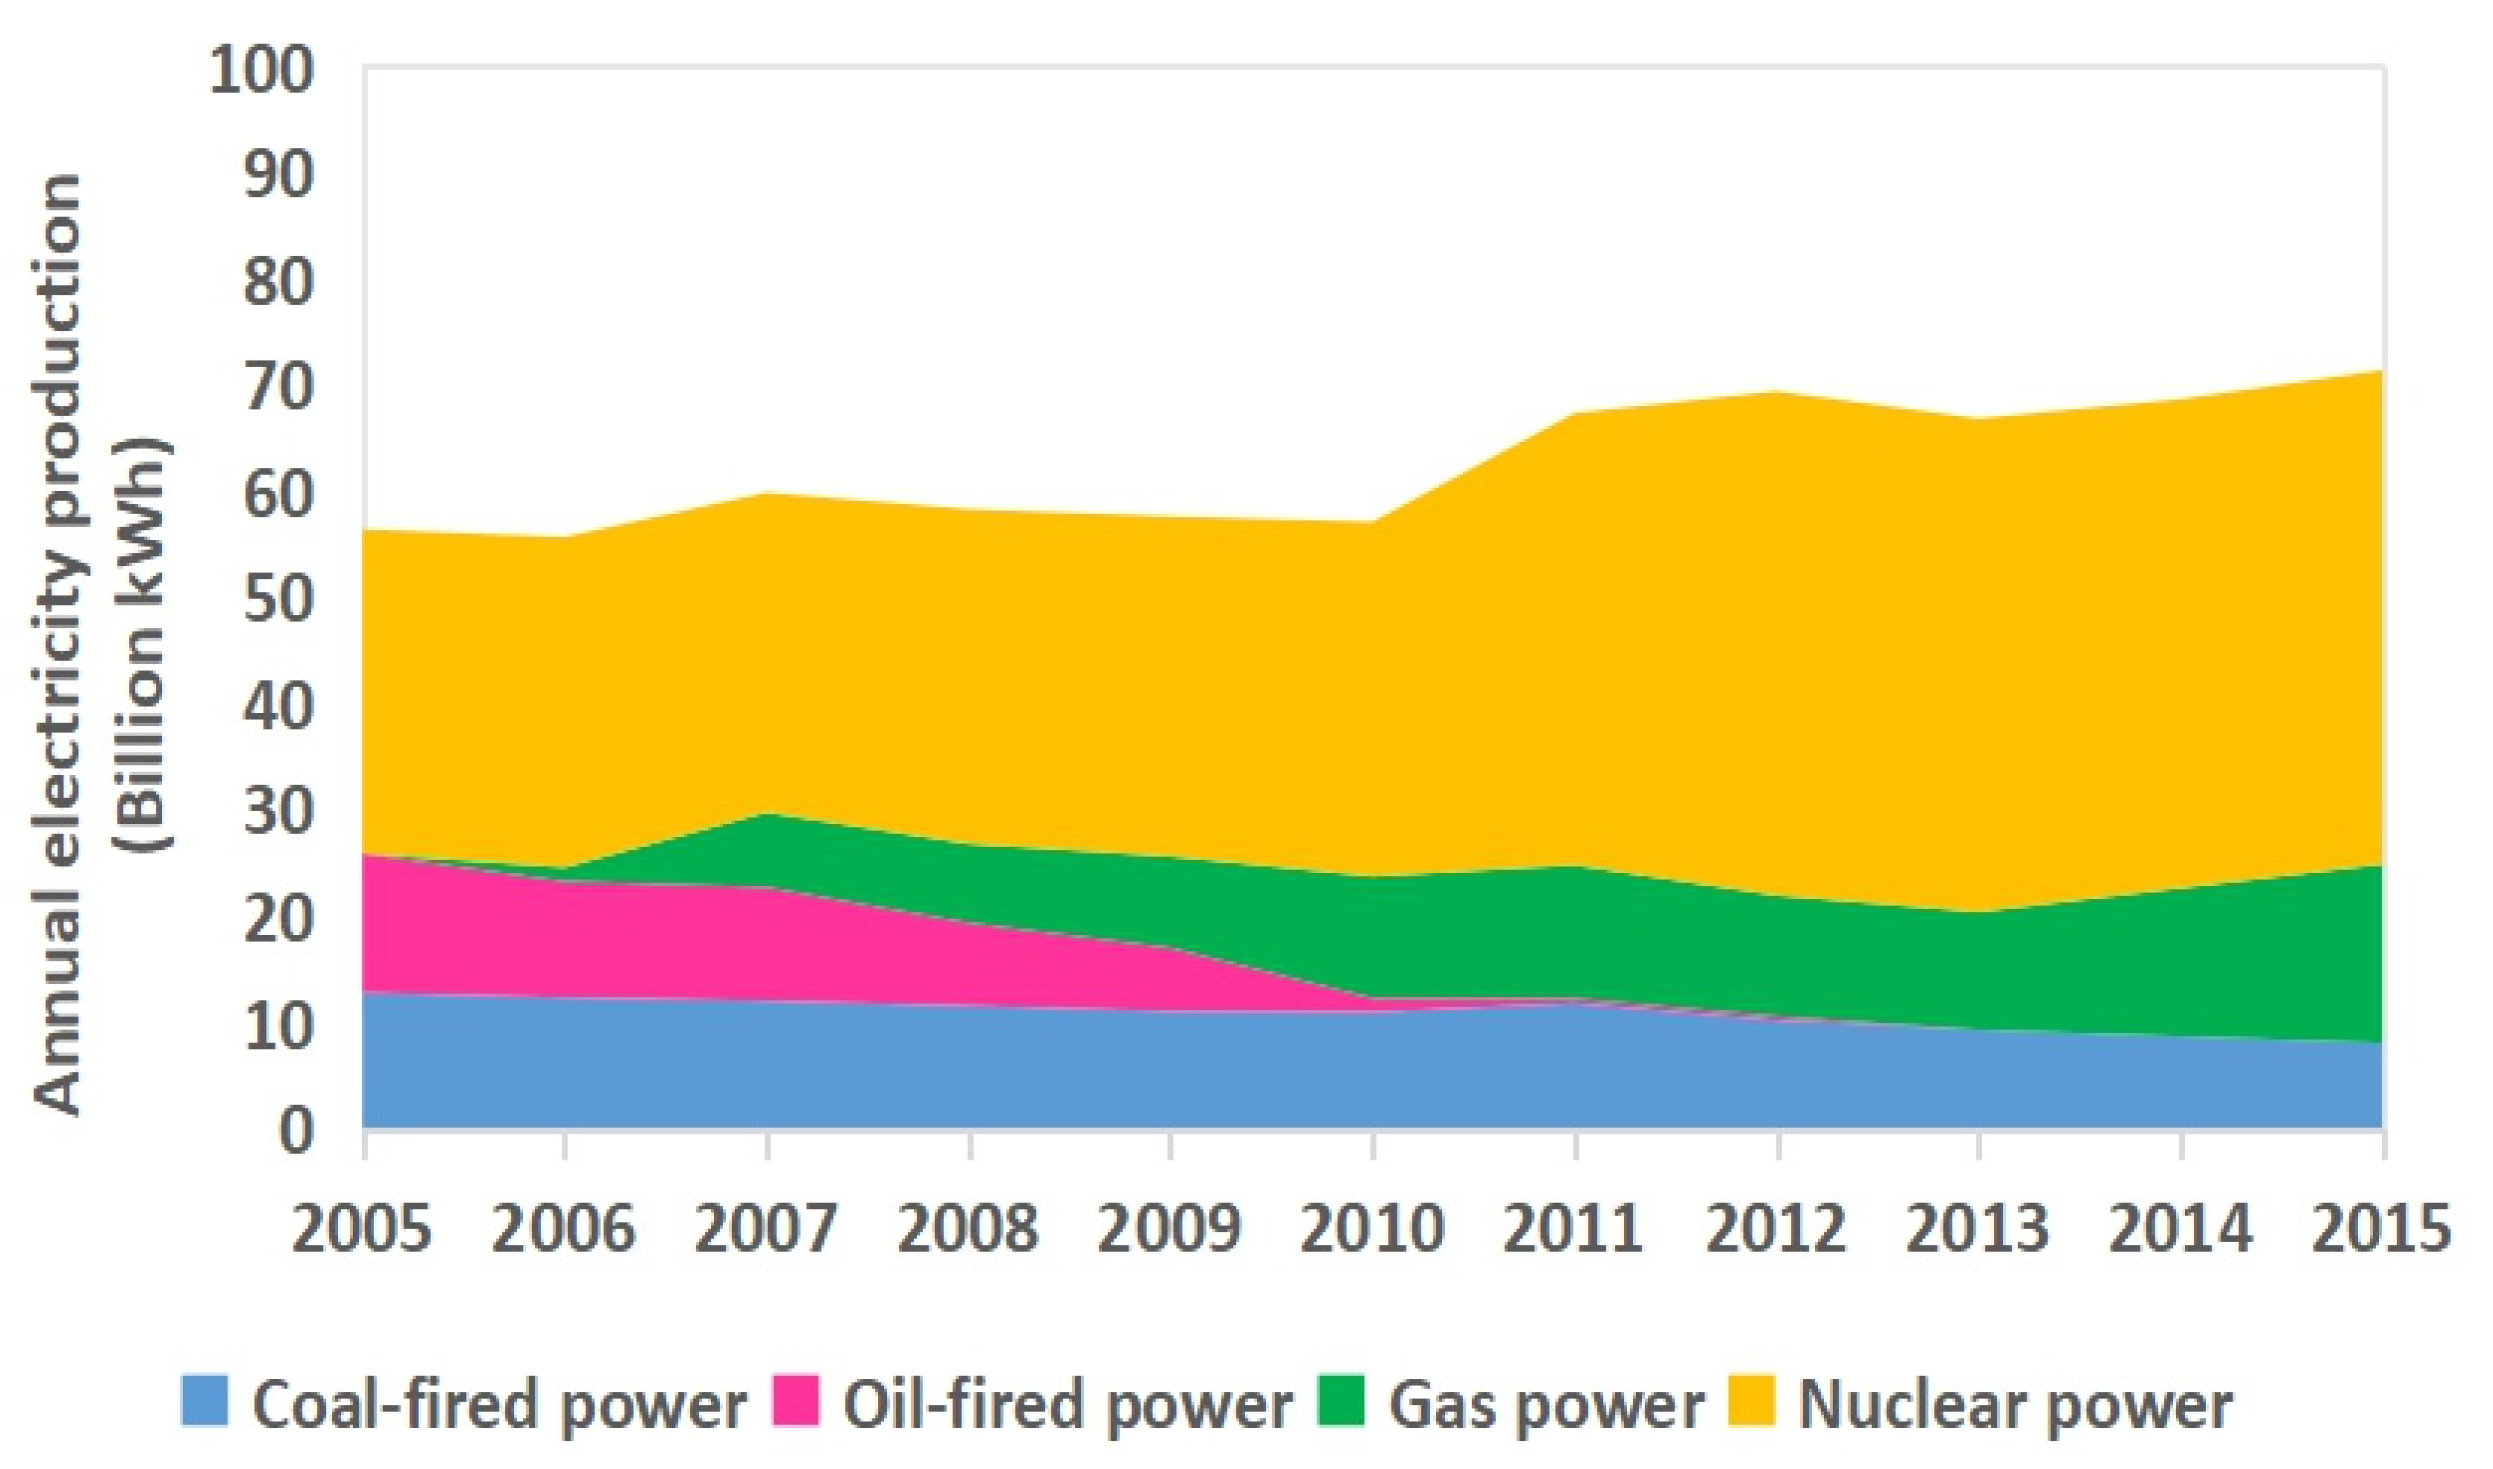
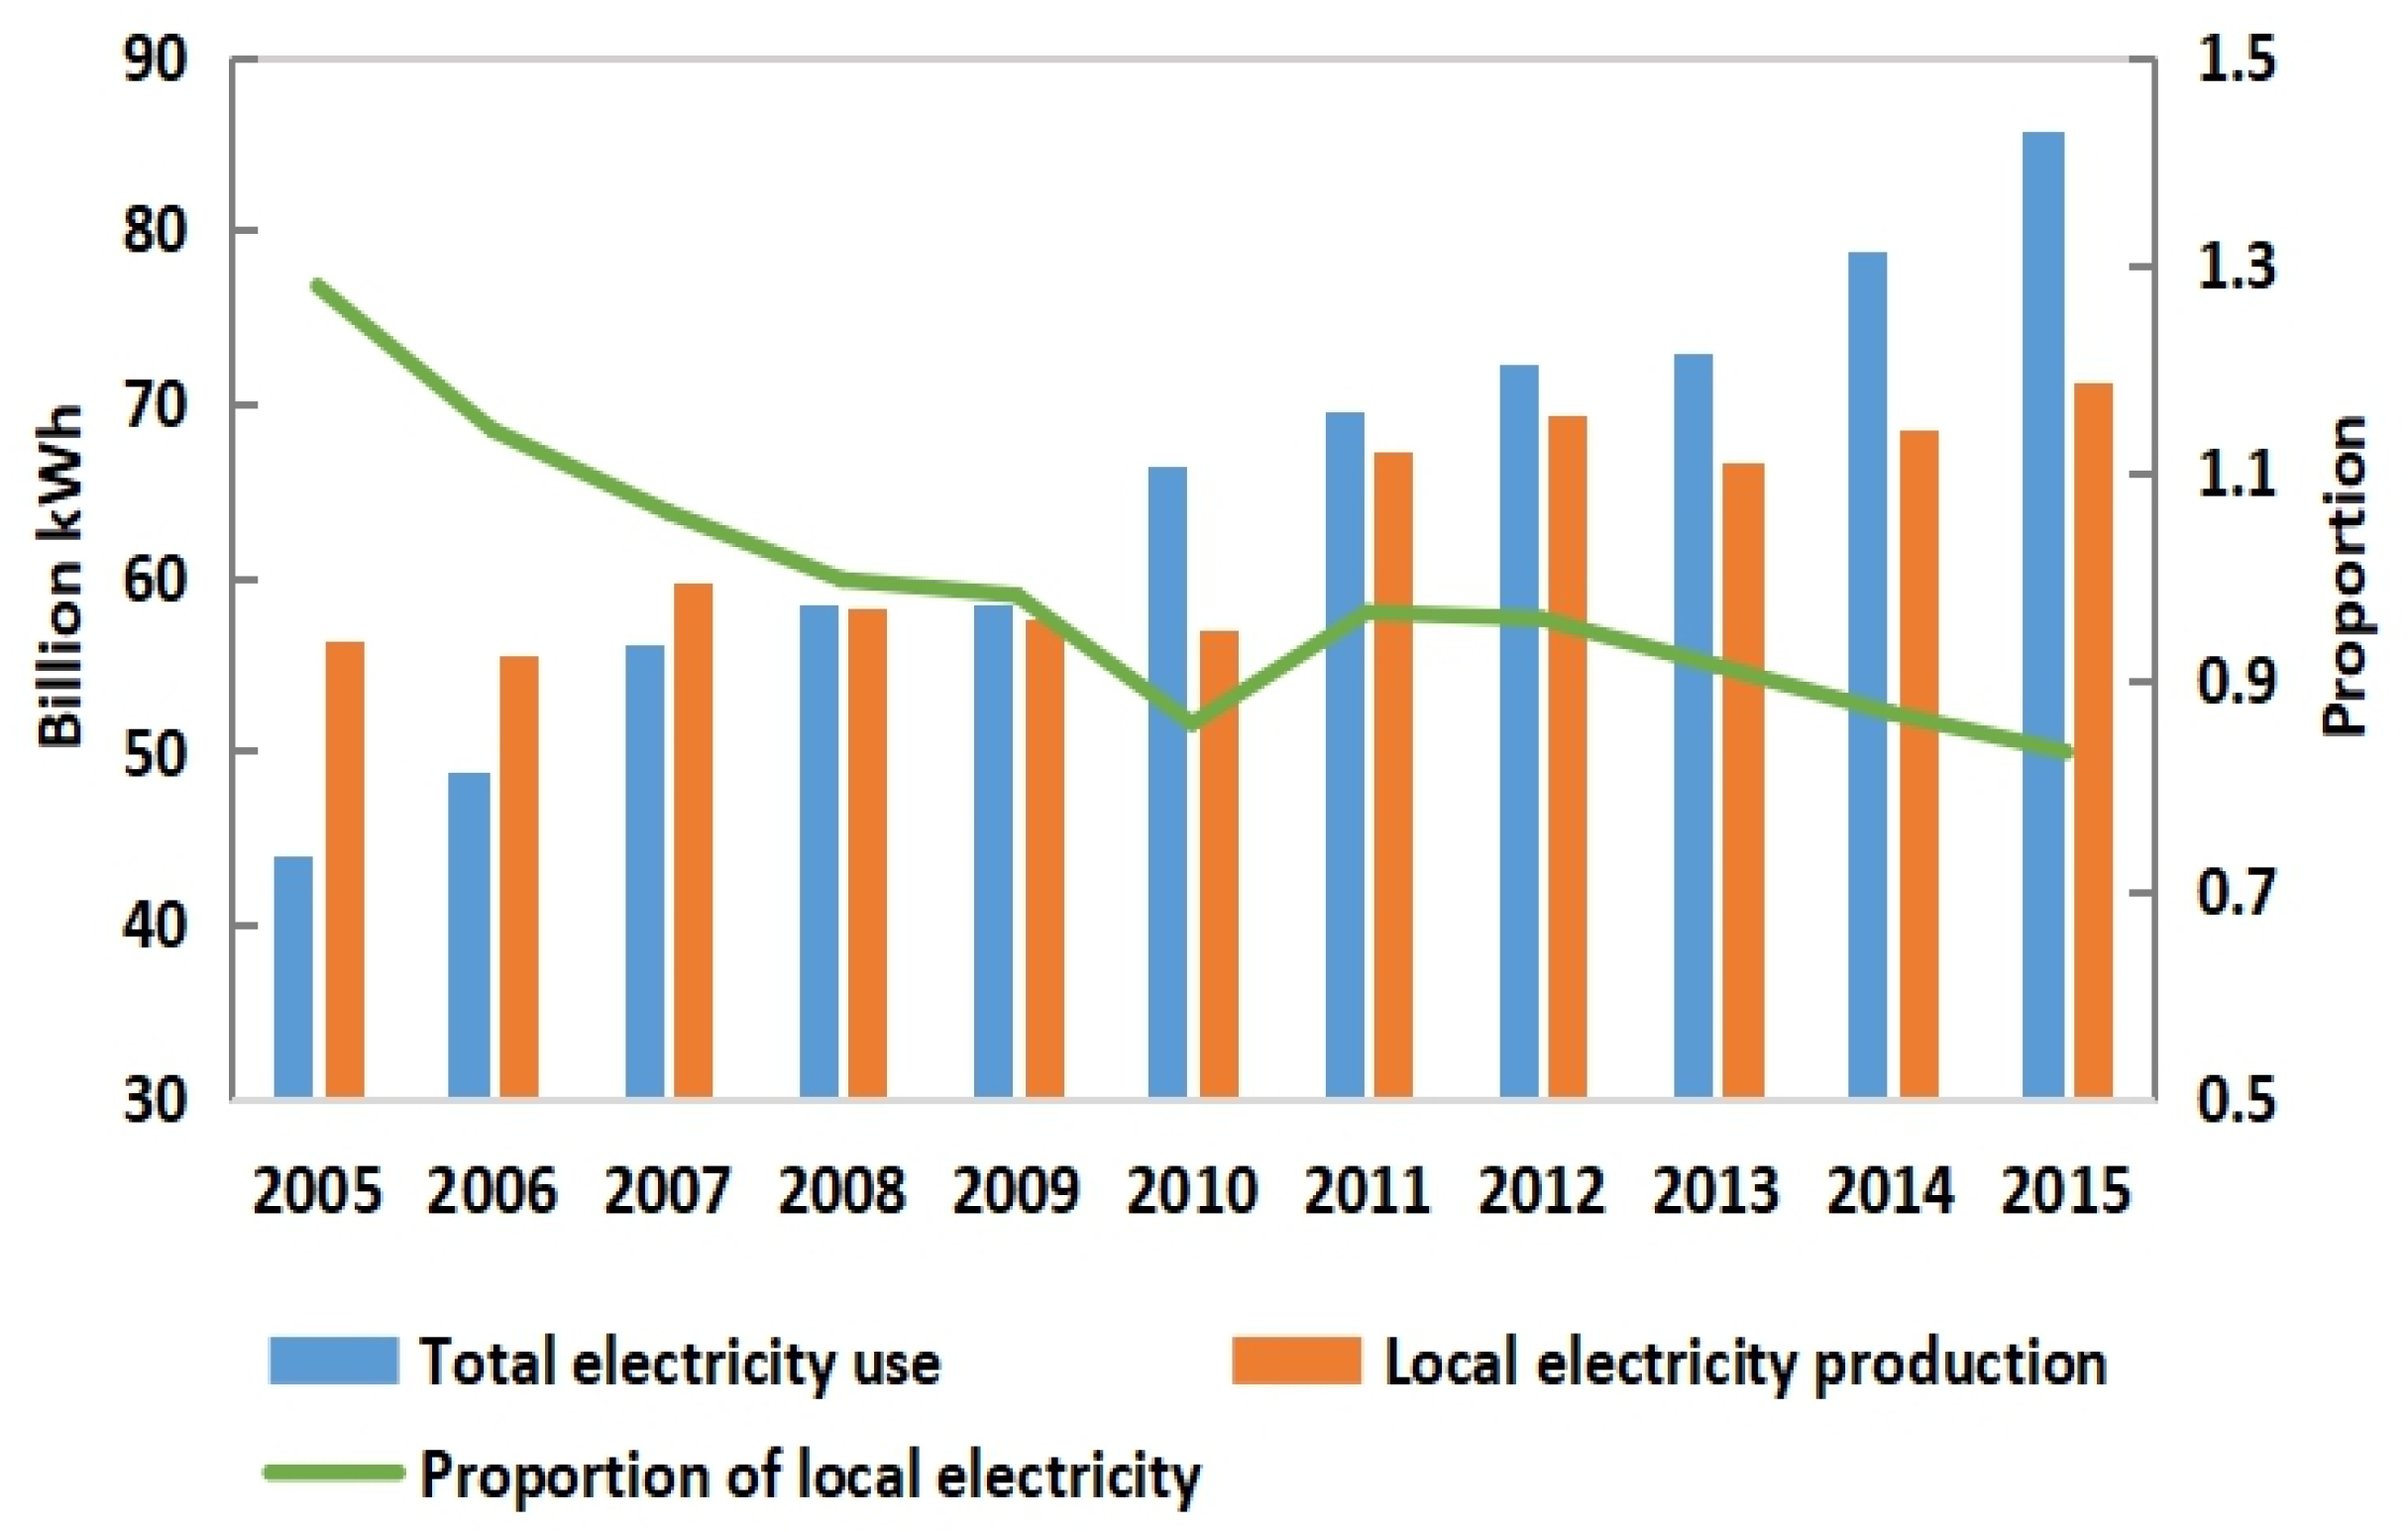
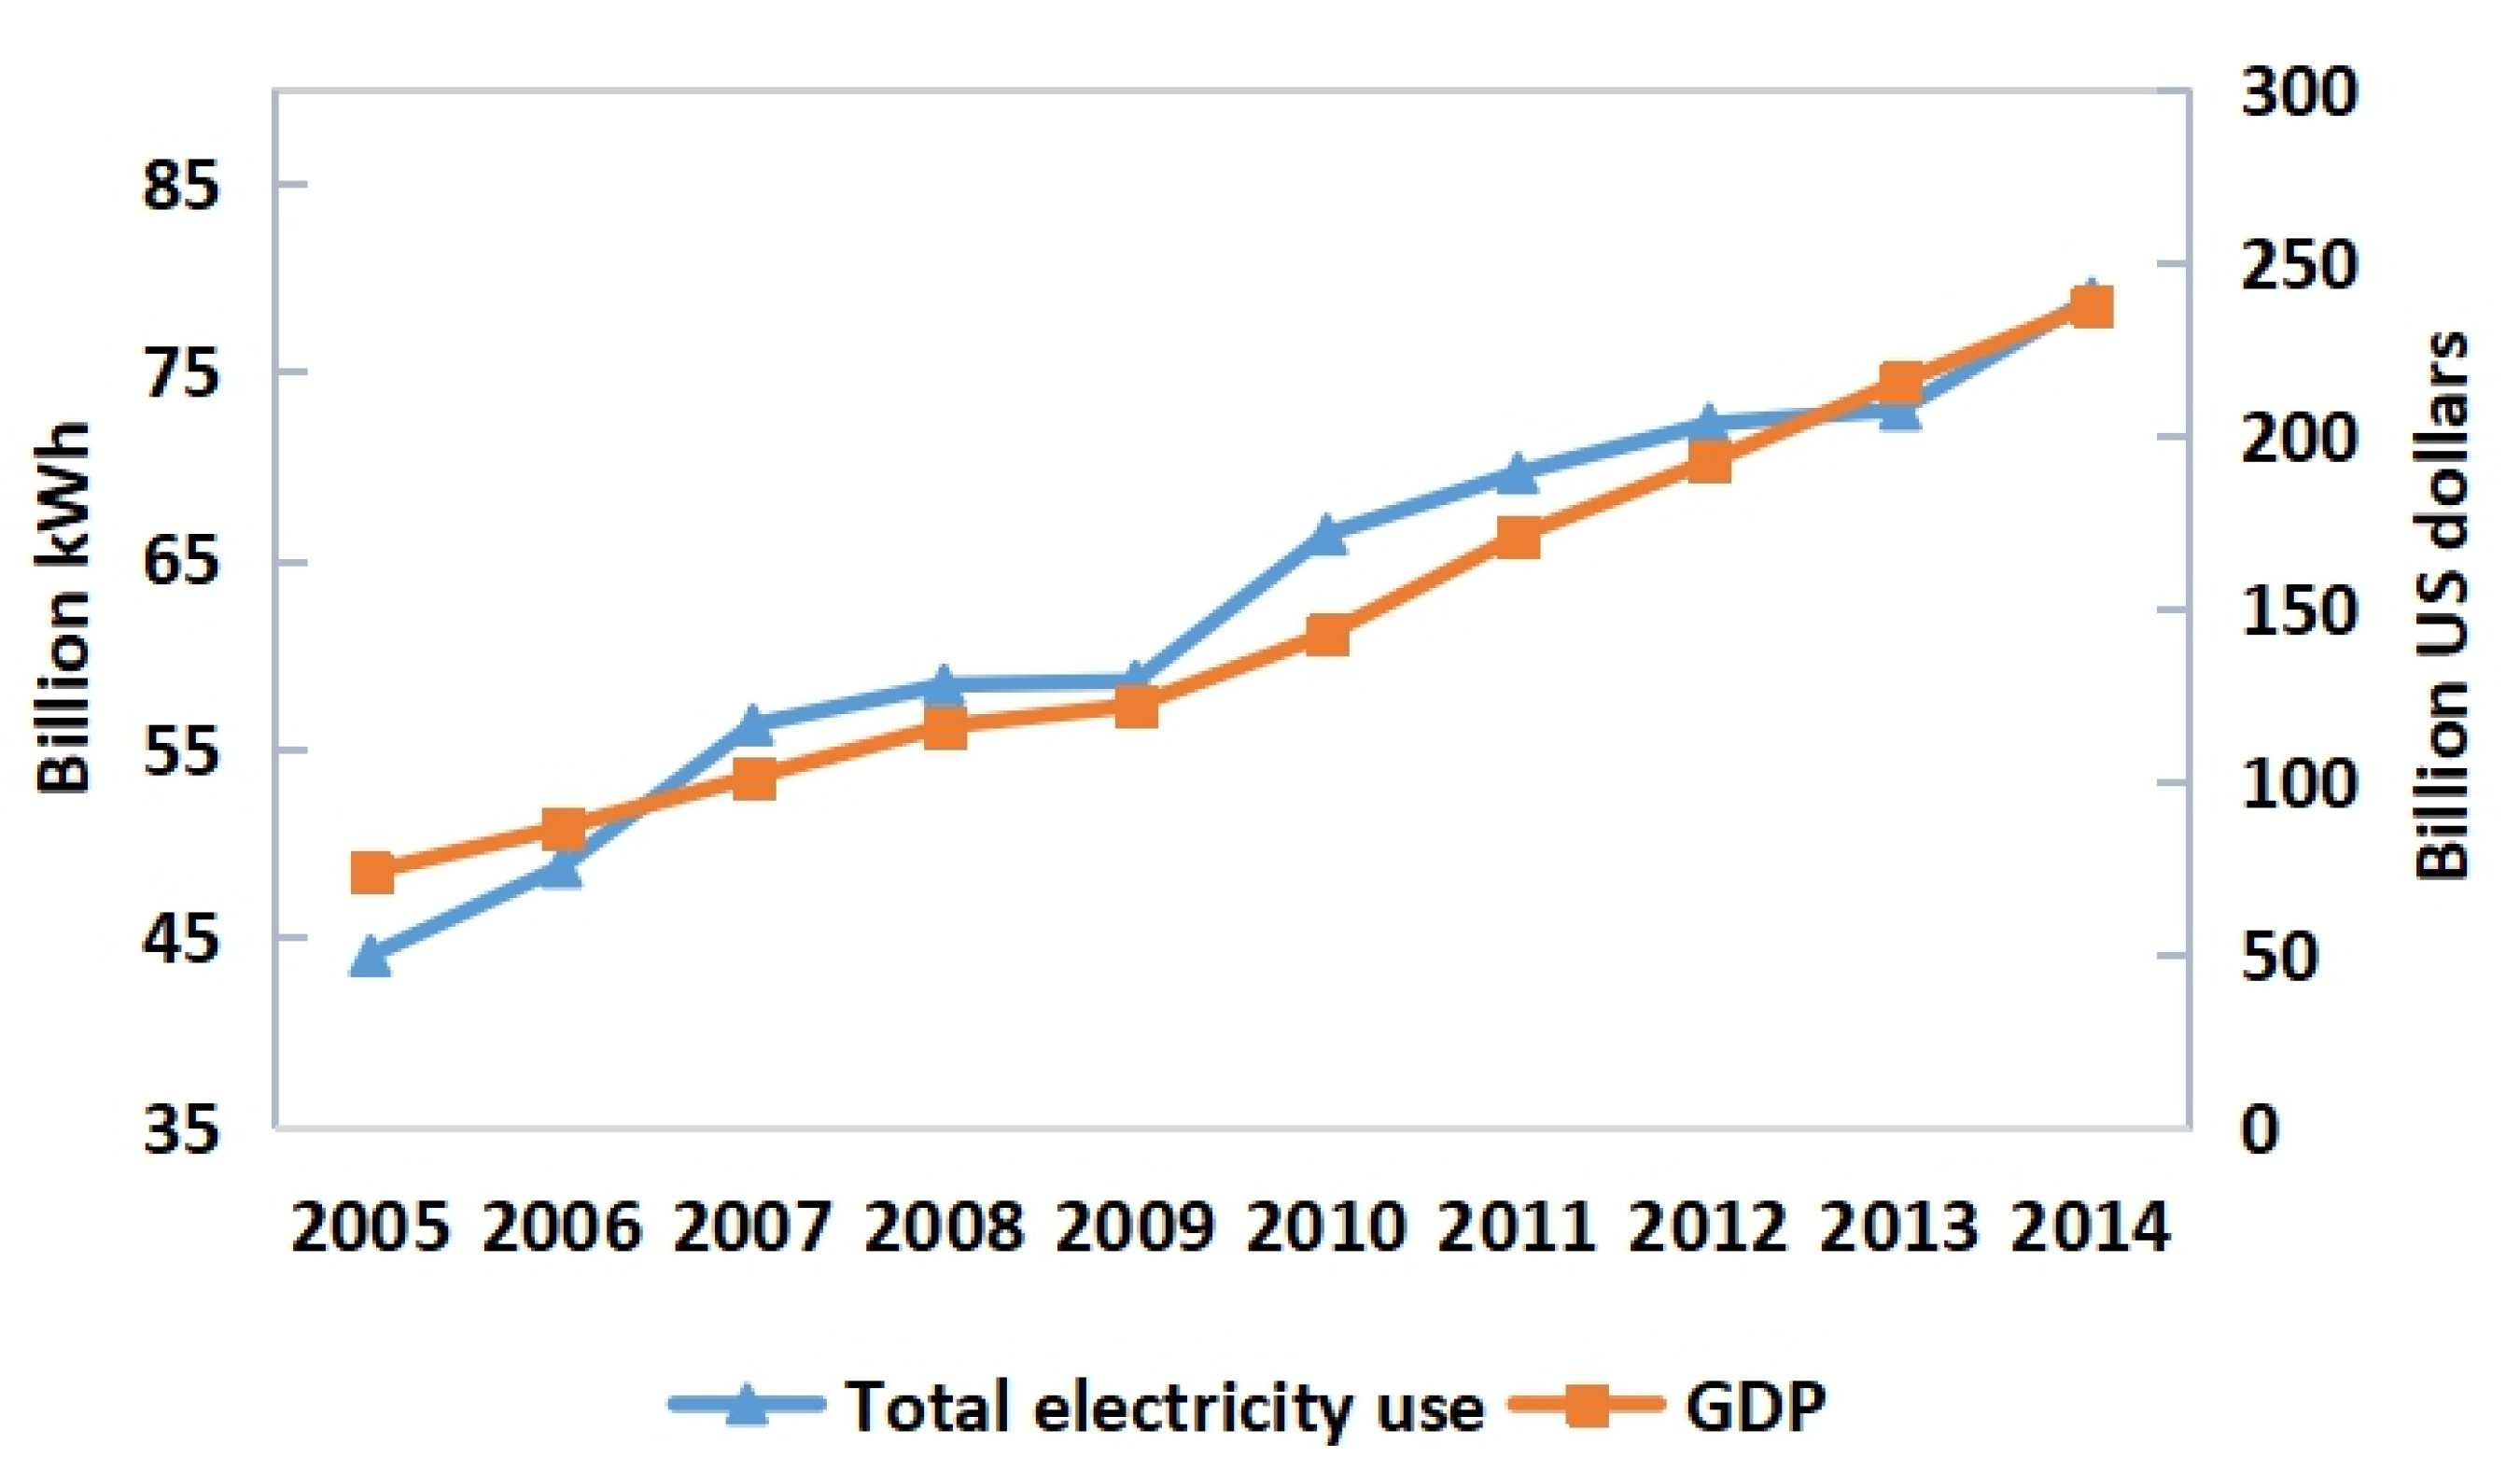
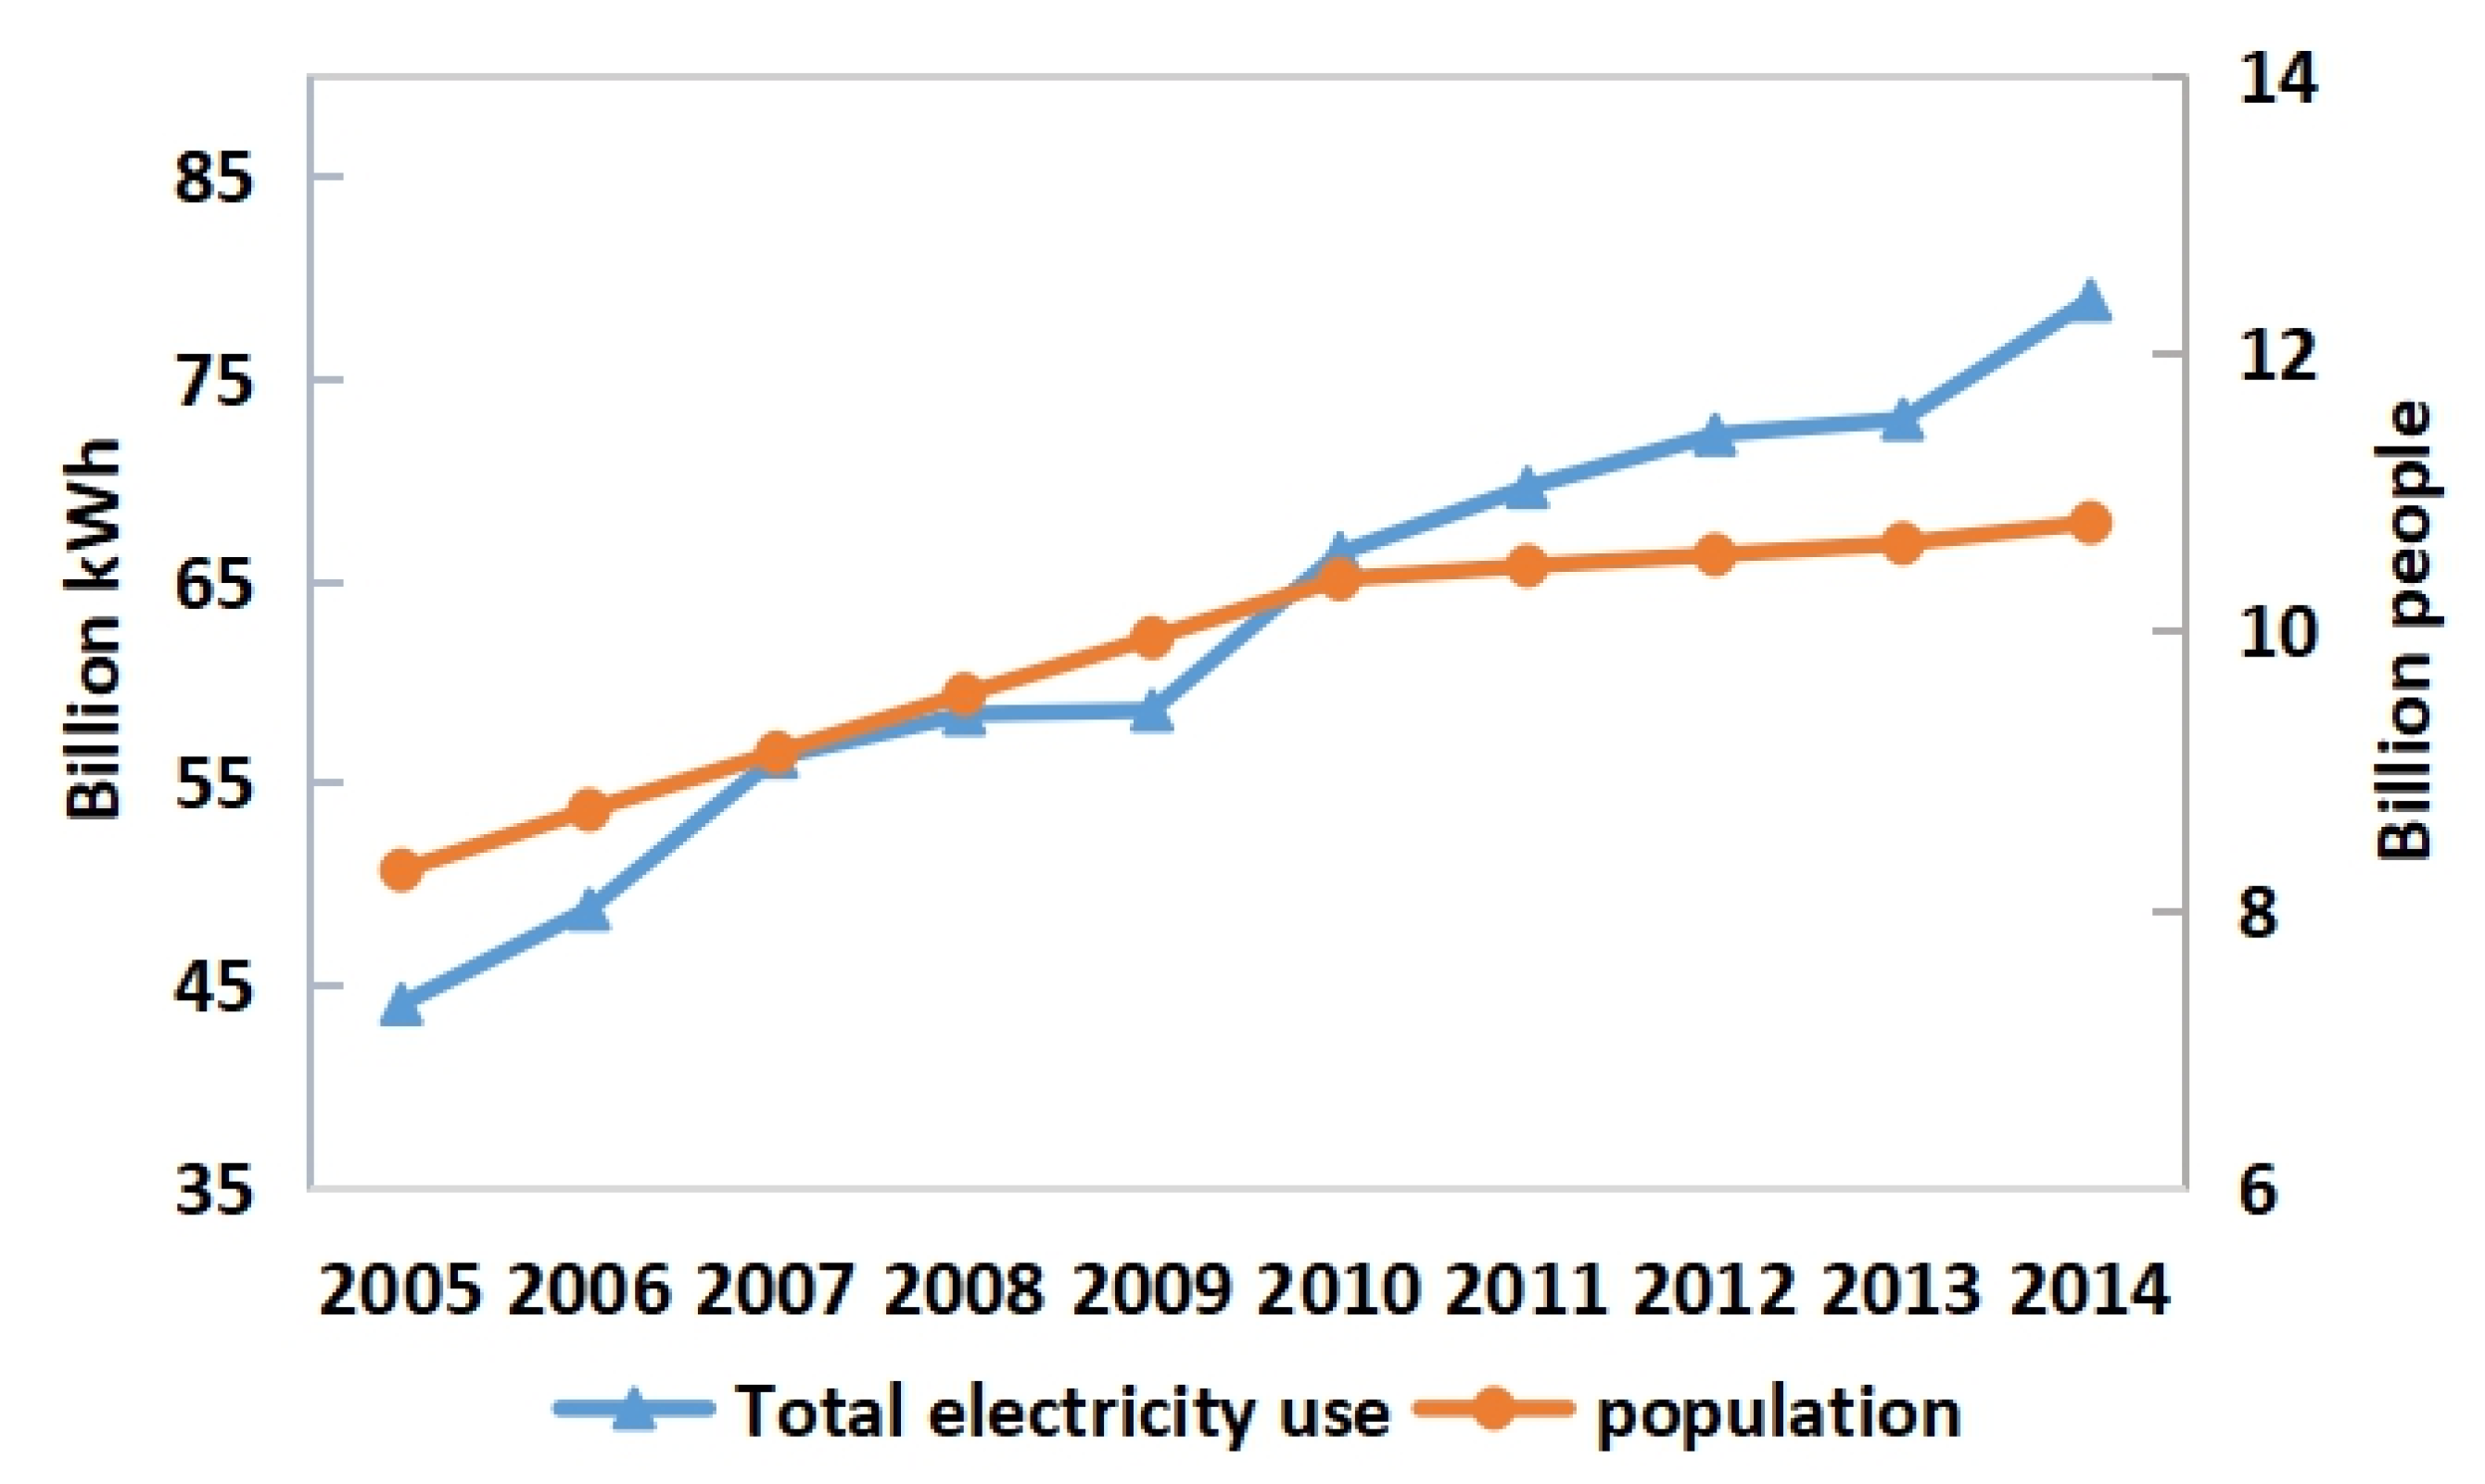
3.1. Electricity Supply and Use in Shenzhen
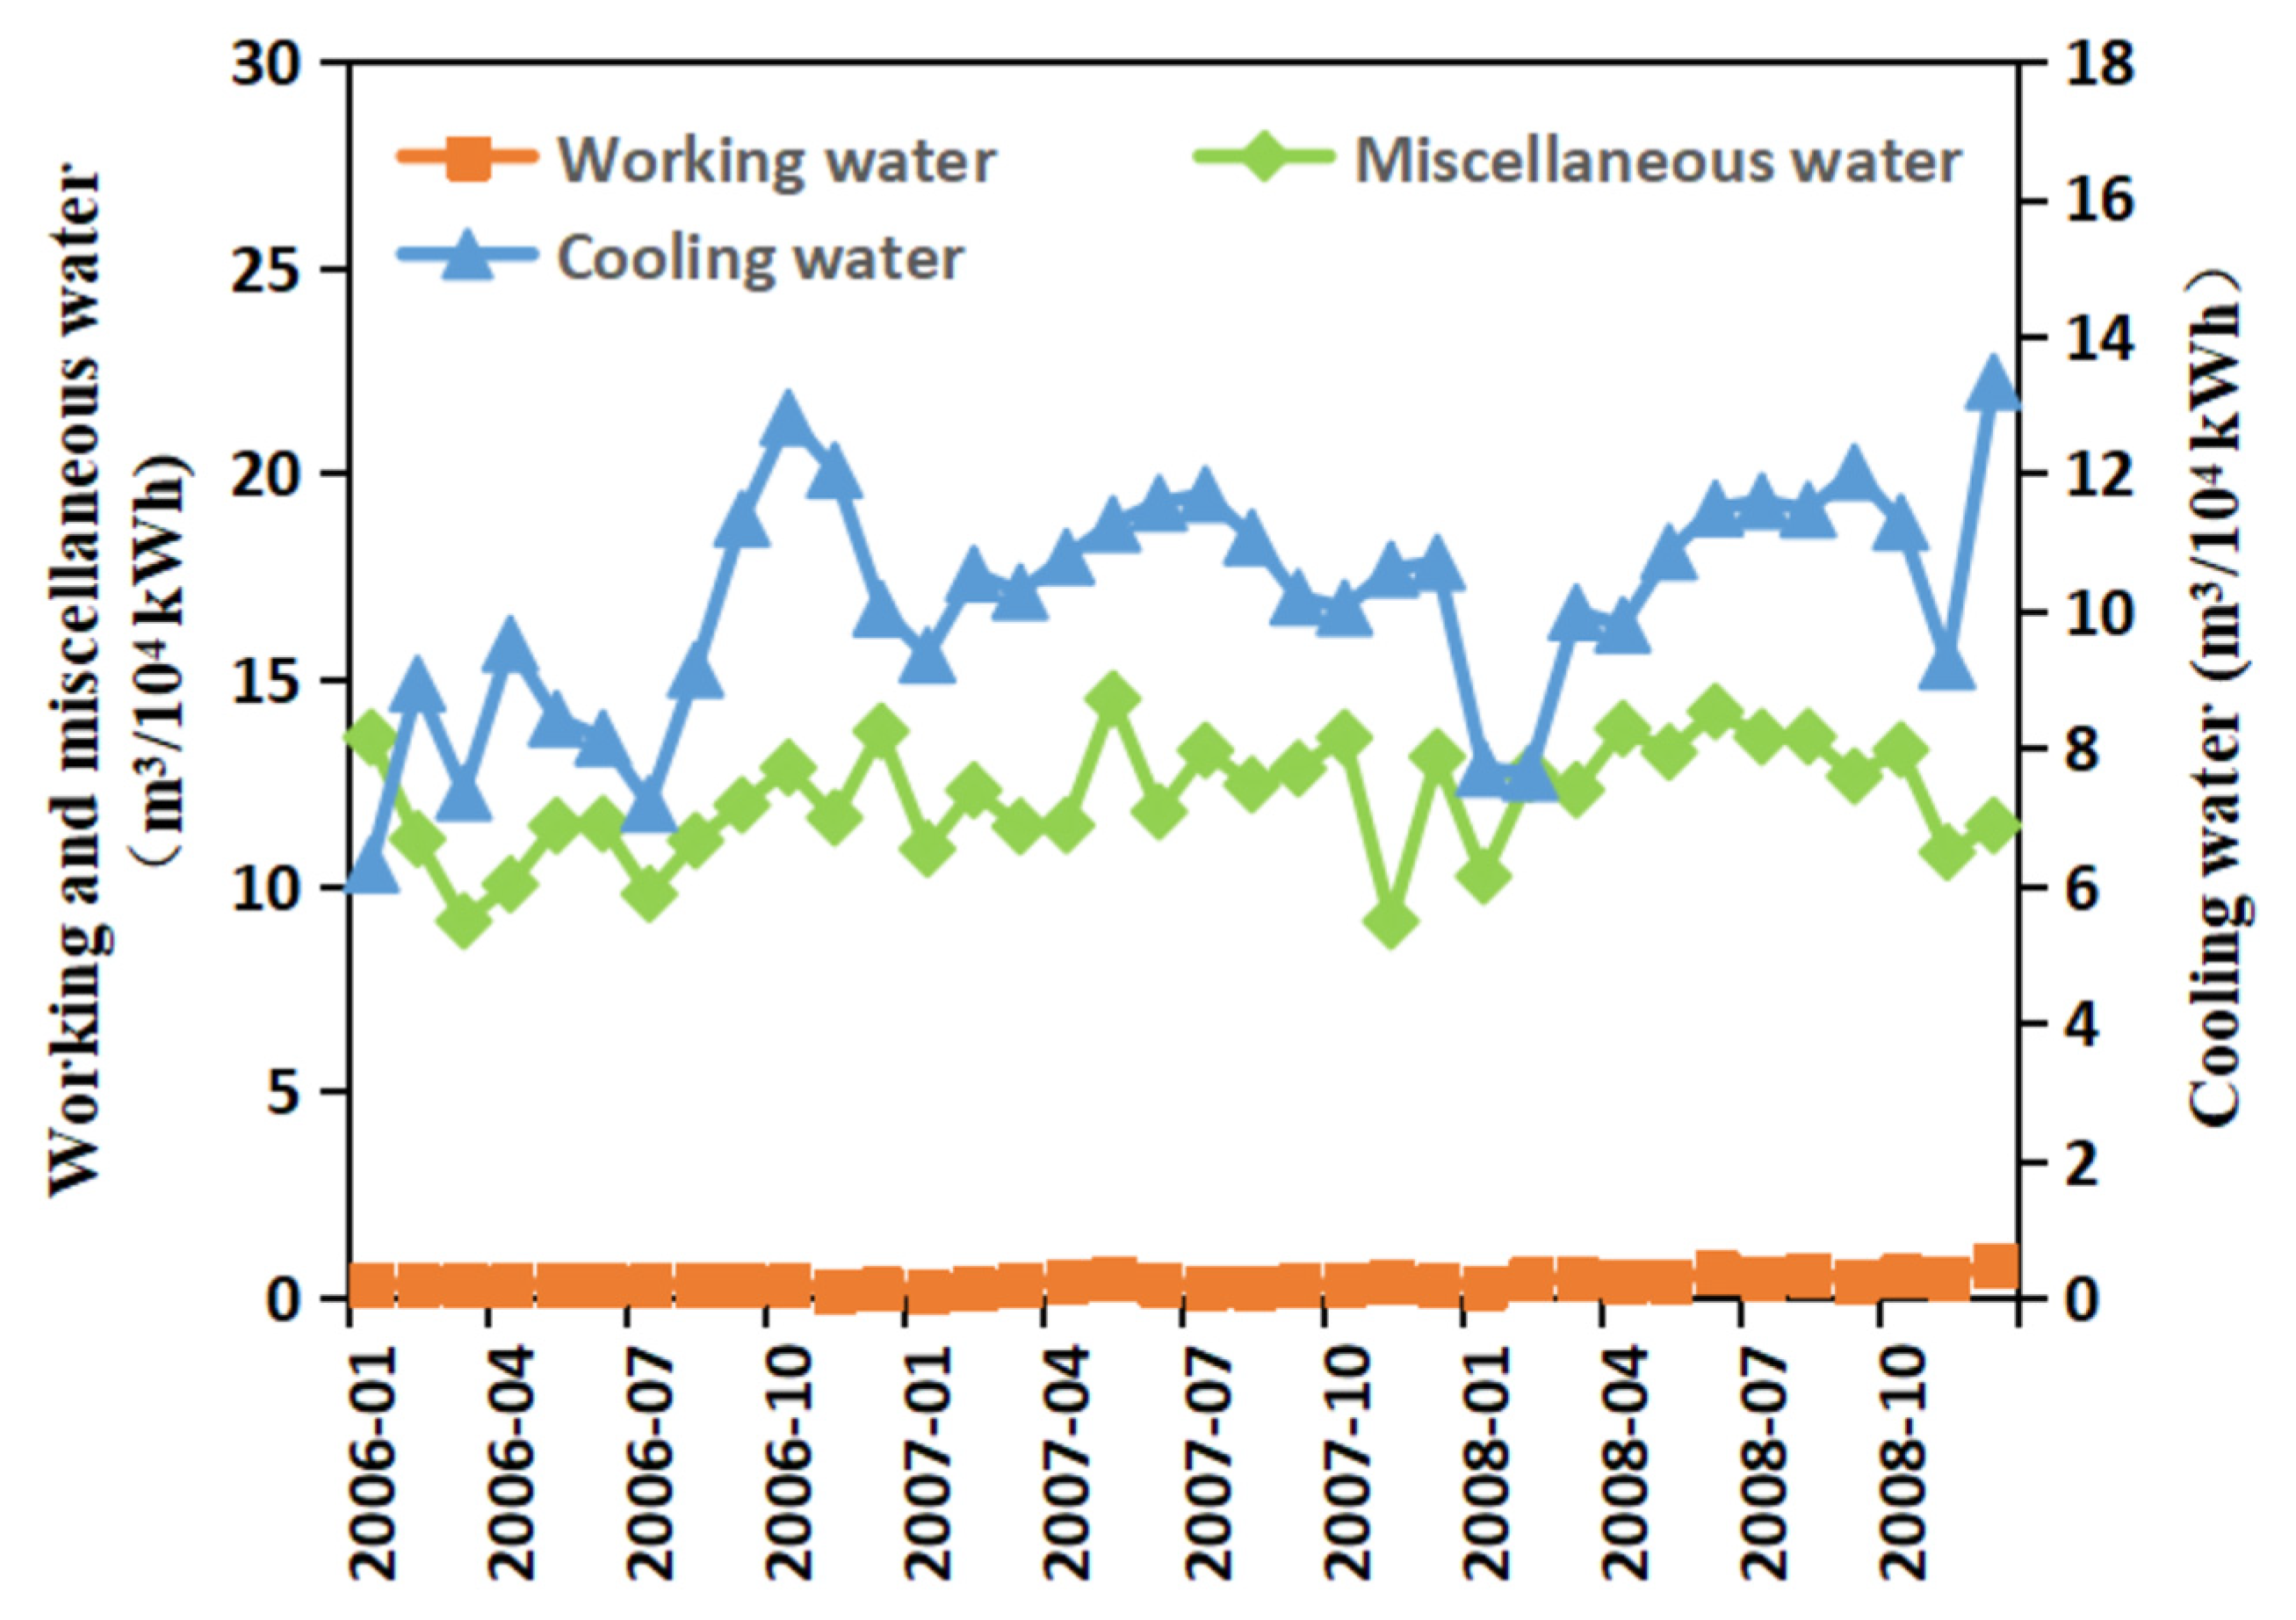
3.2. Water Consumption of an Oil-Fired Power Plant
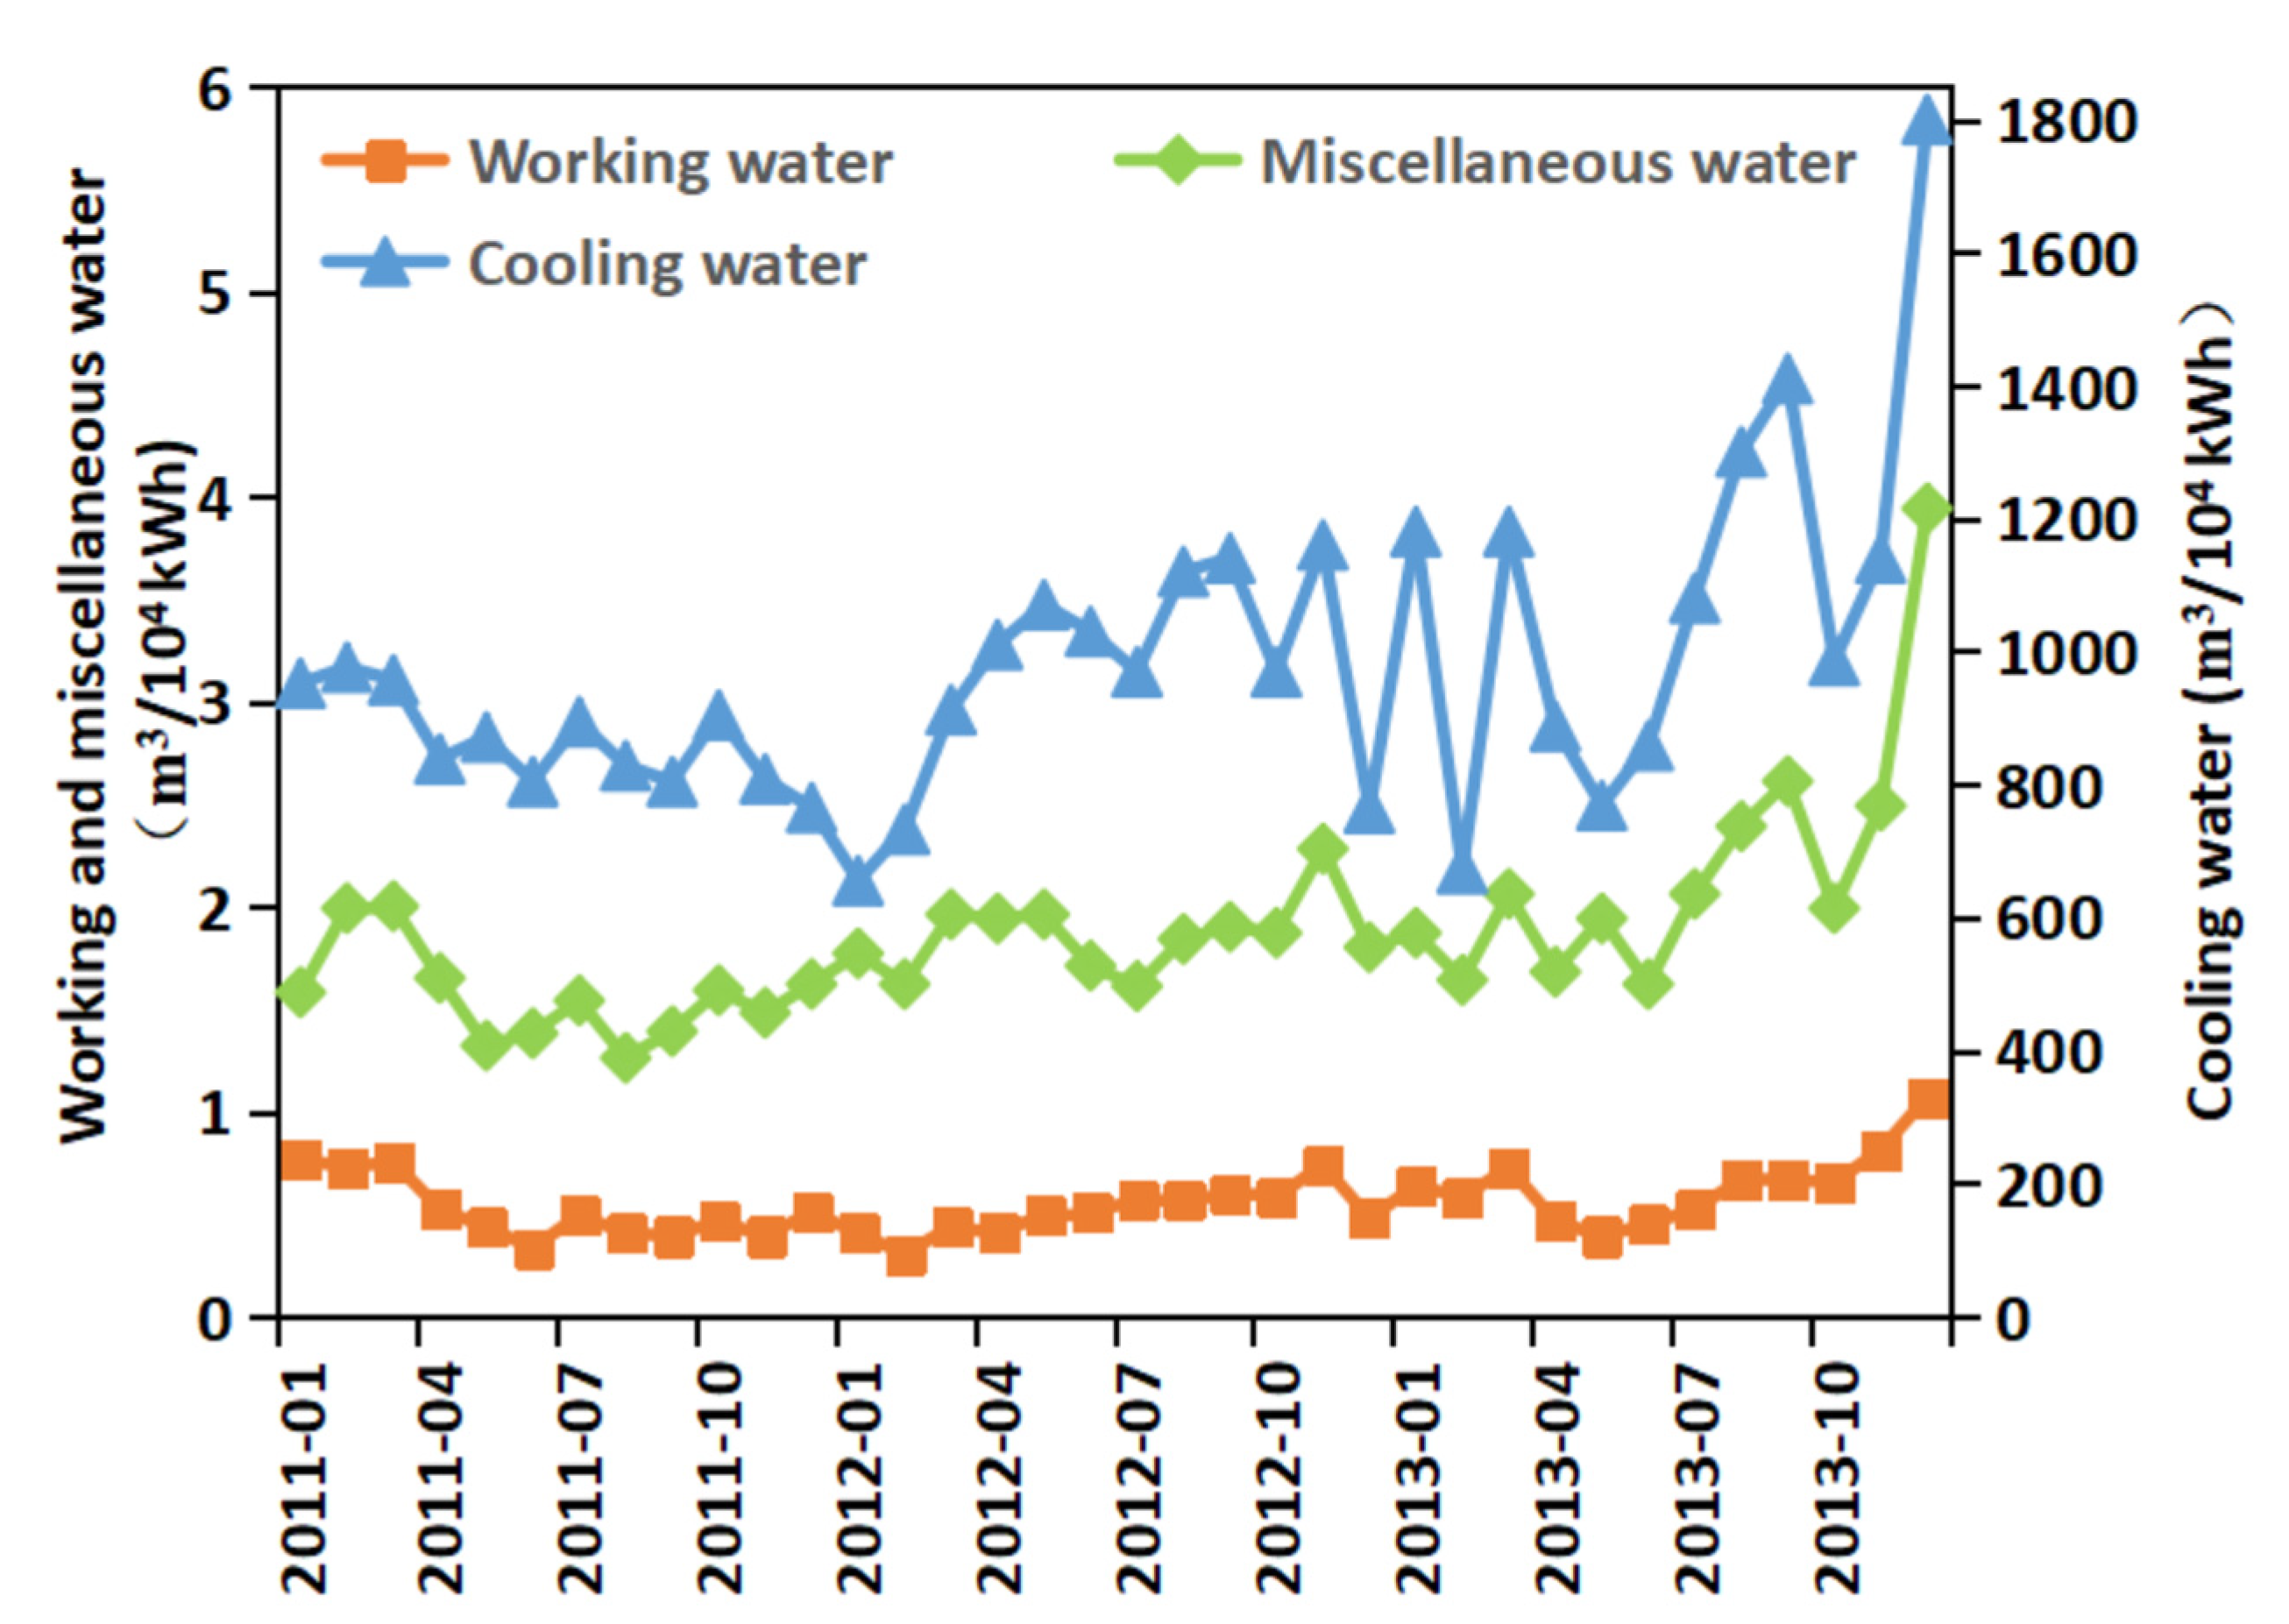
3.3. Water Consumption of a Coal-Fired Power Plant
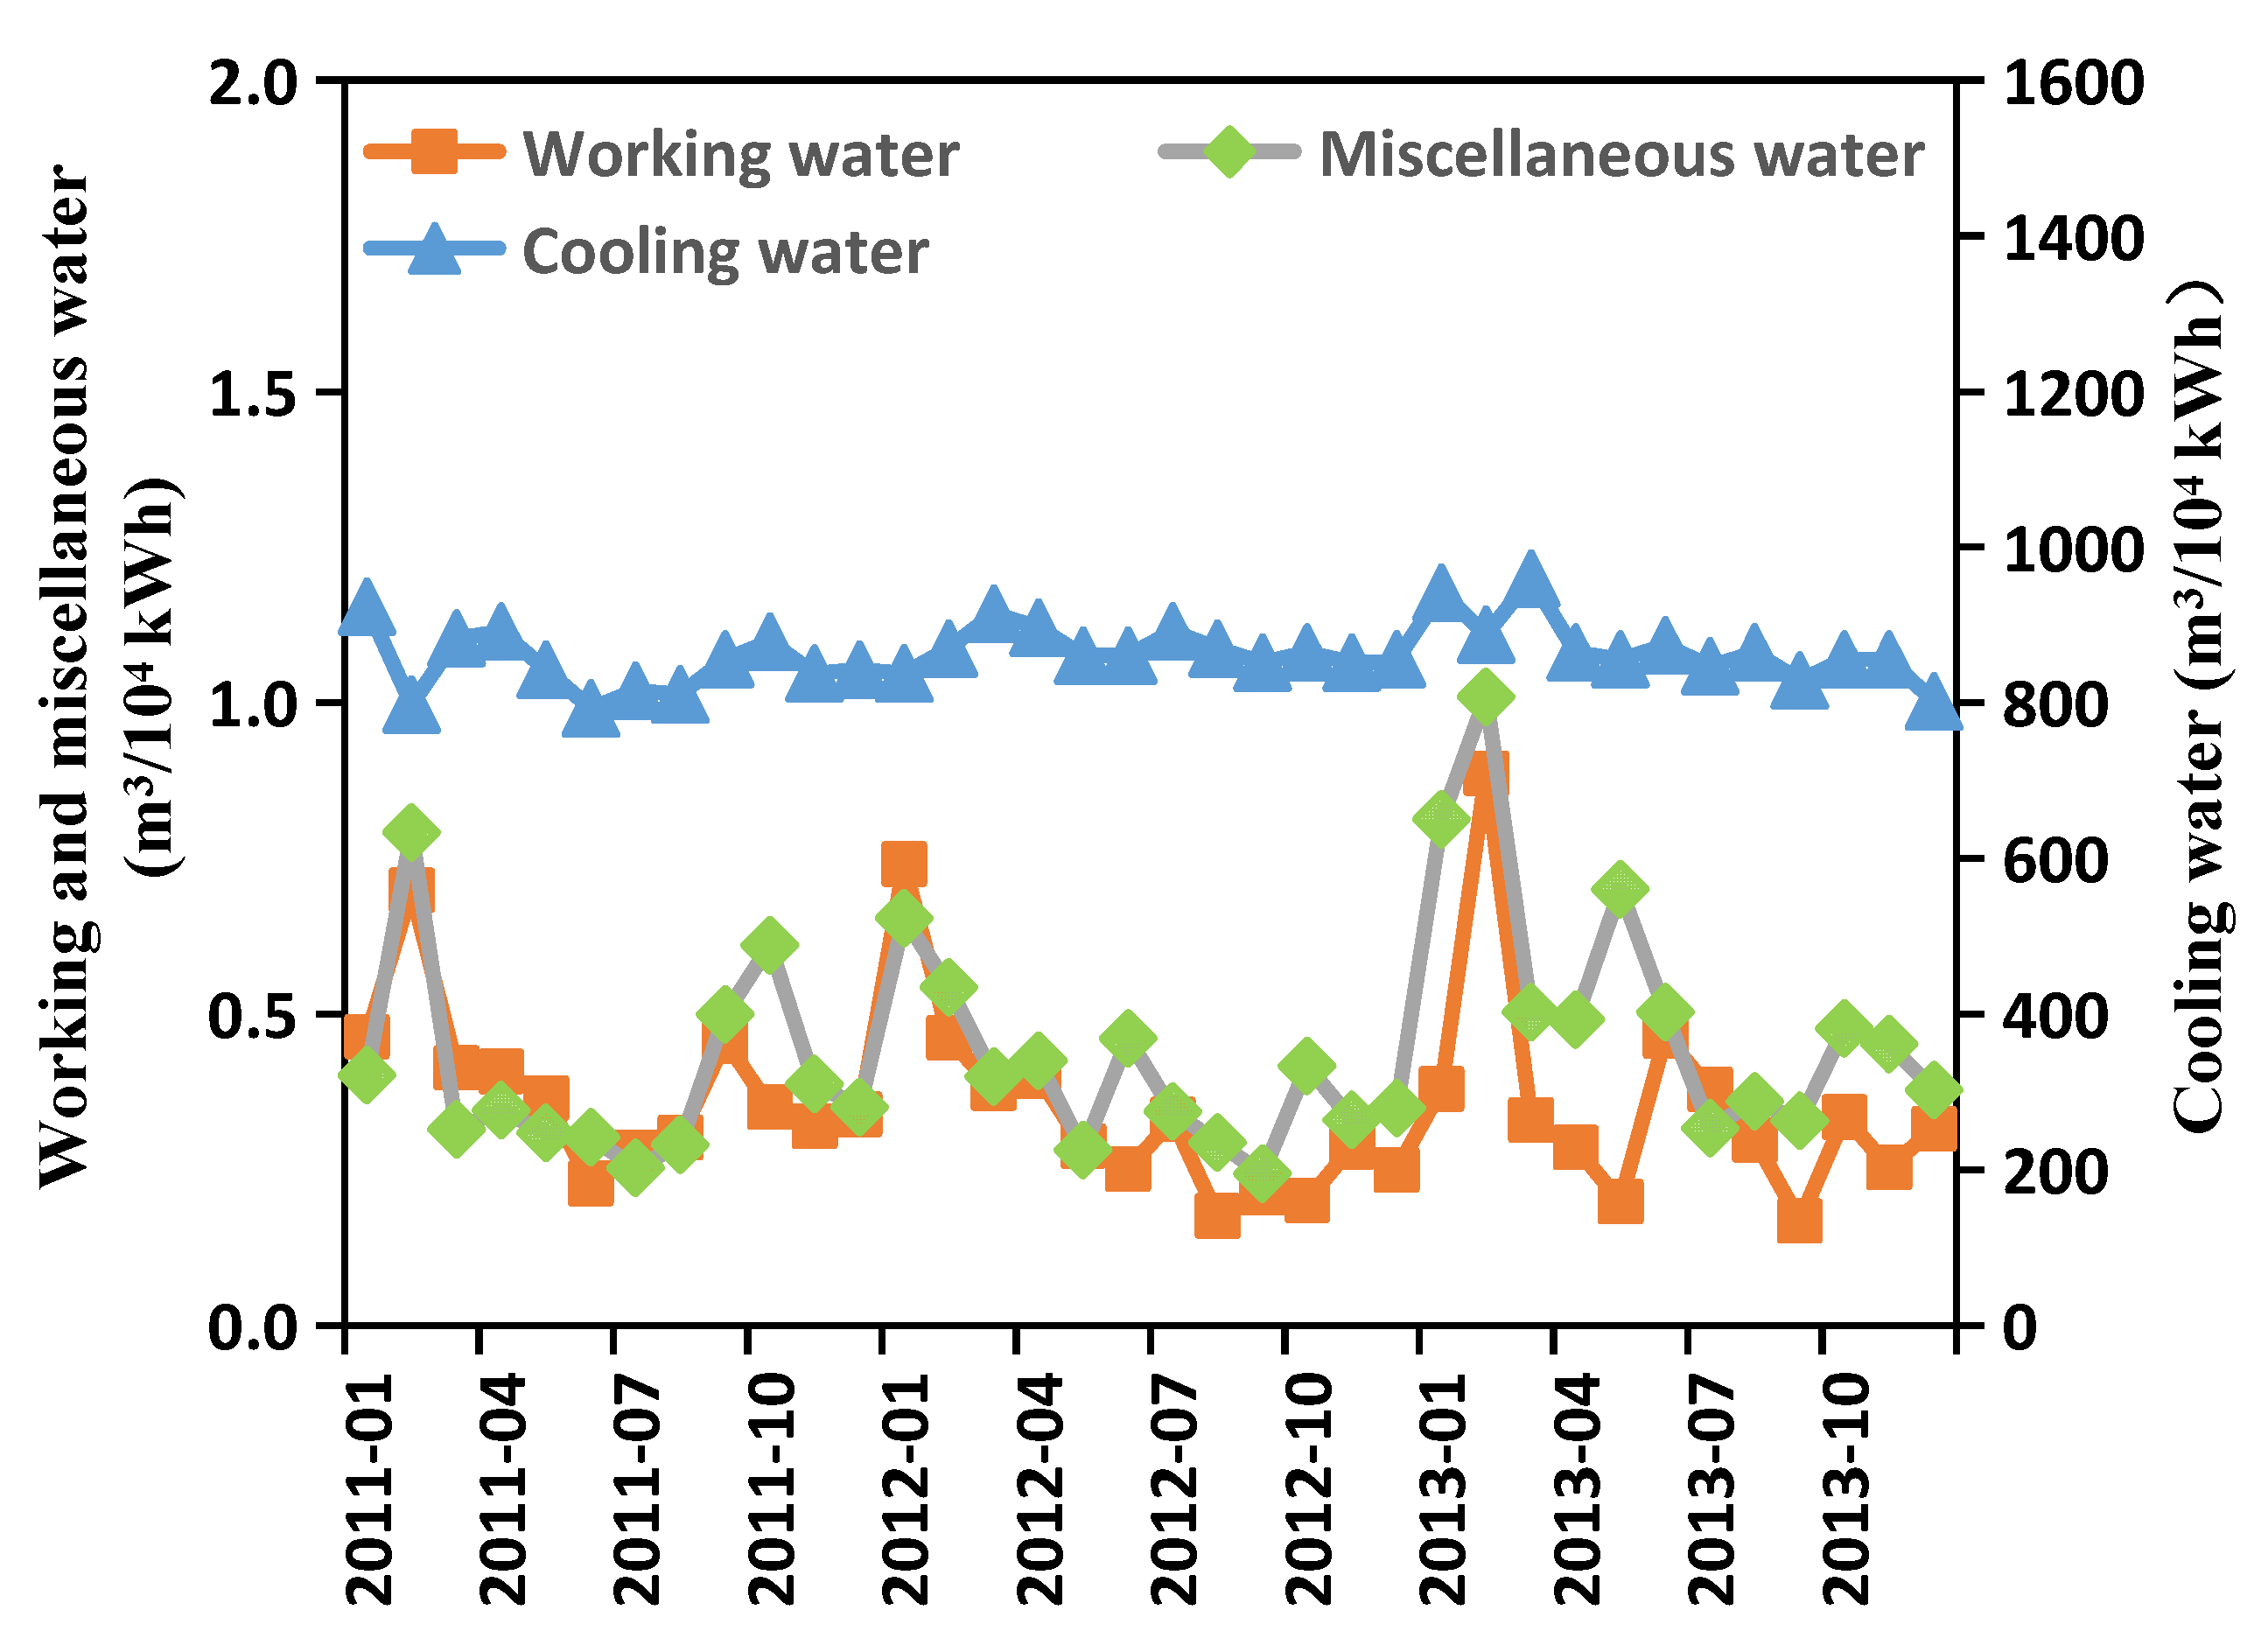
3.4. Water Consumption of a Gas Power Plant
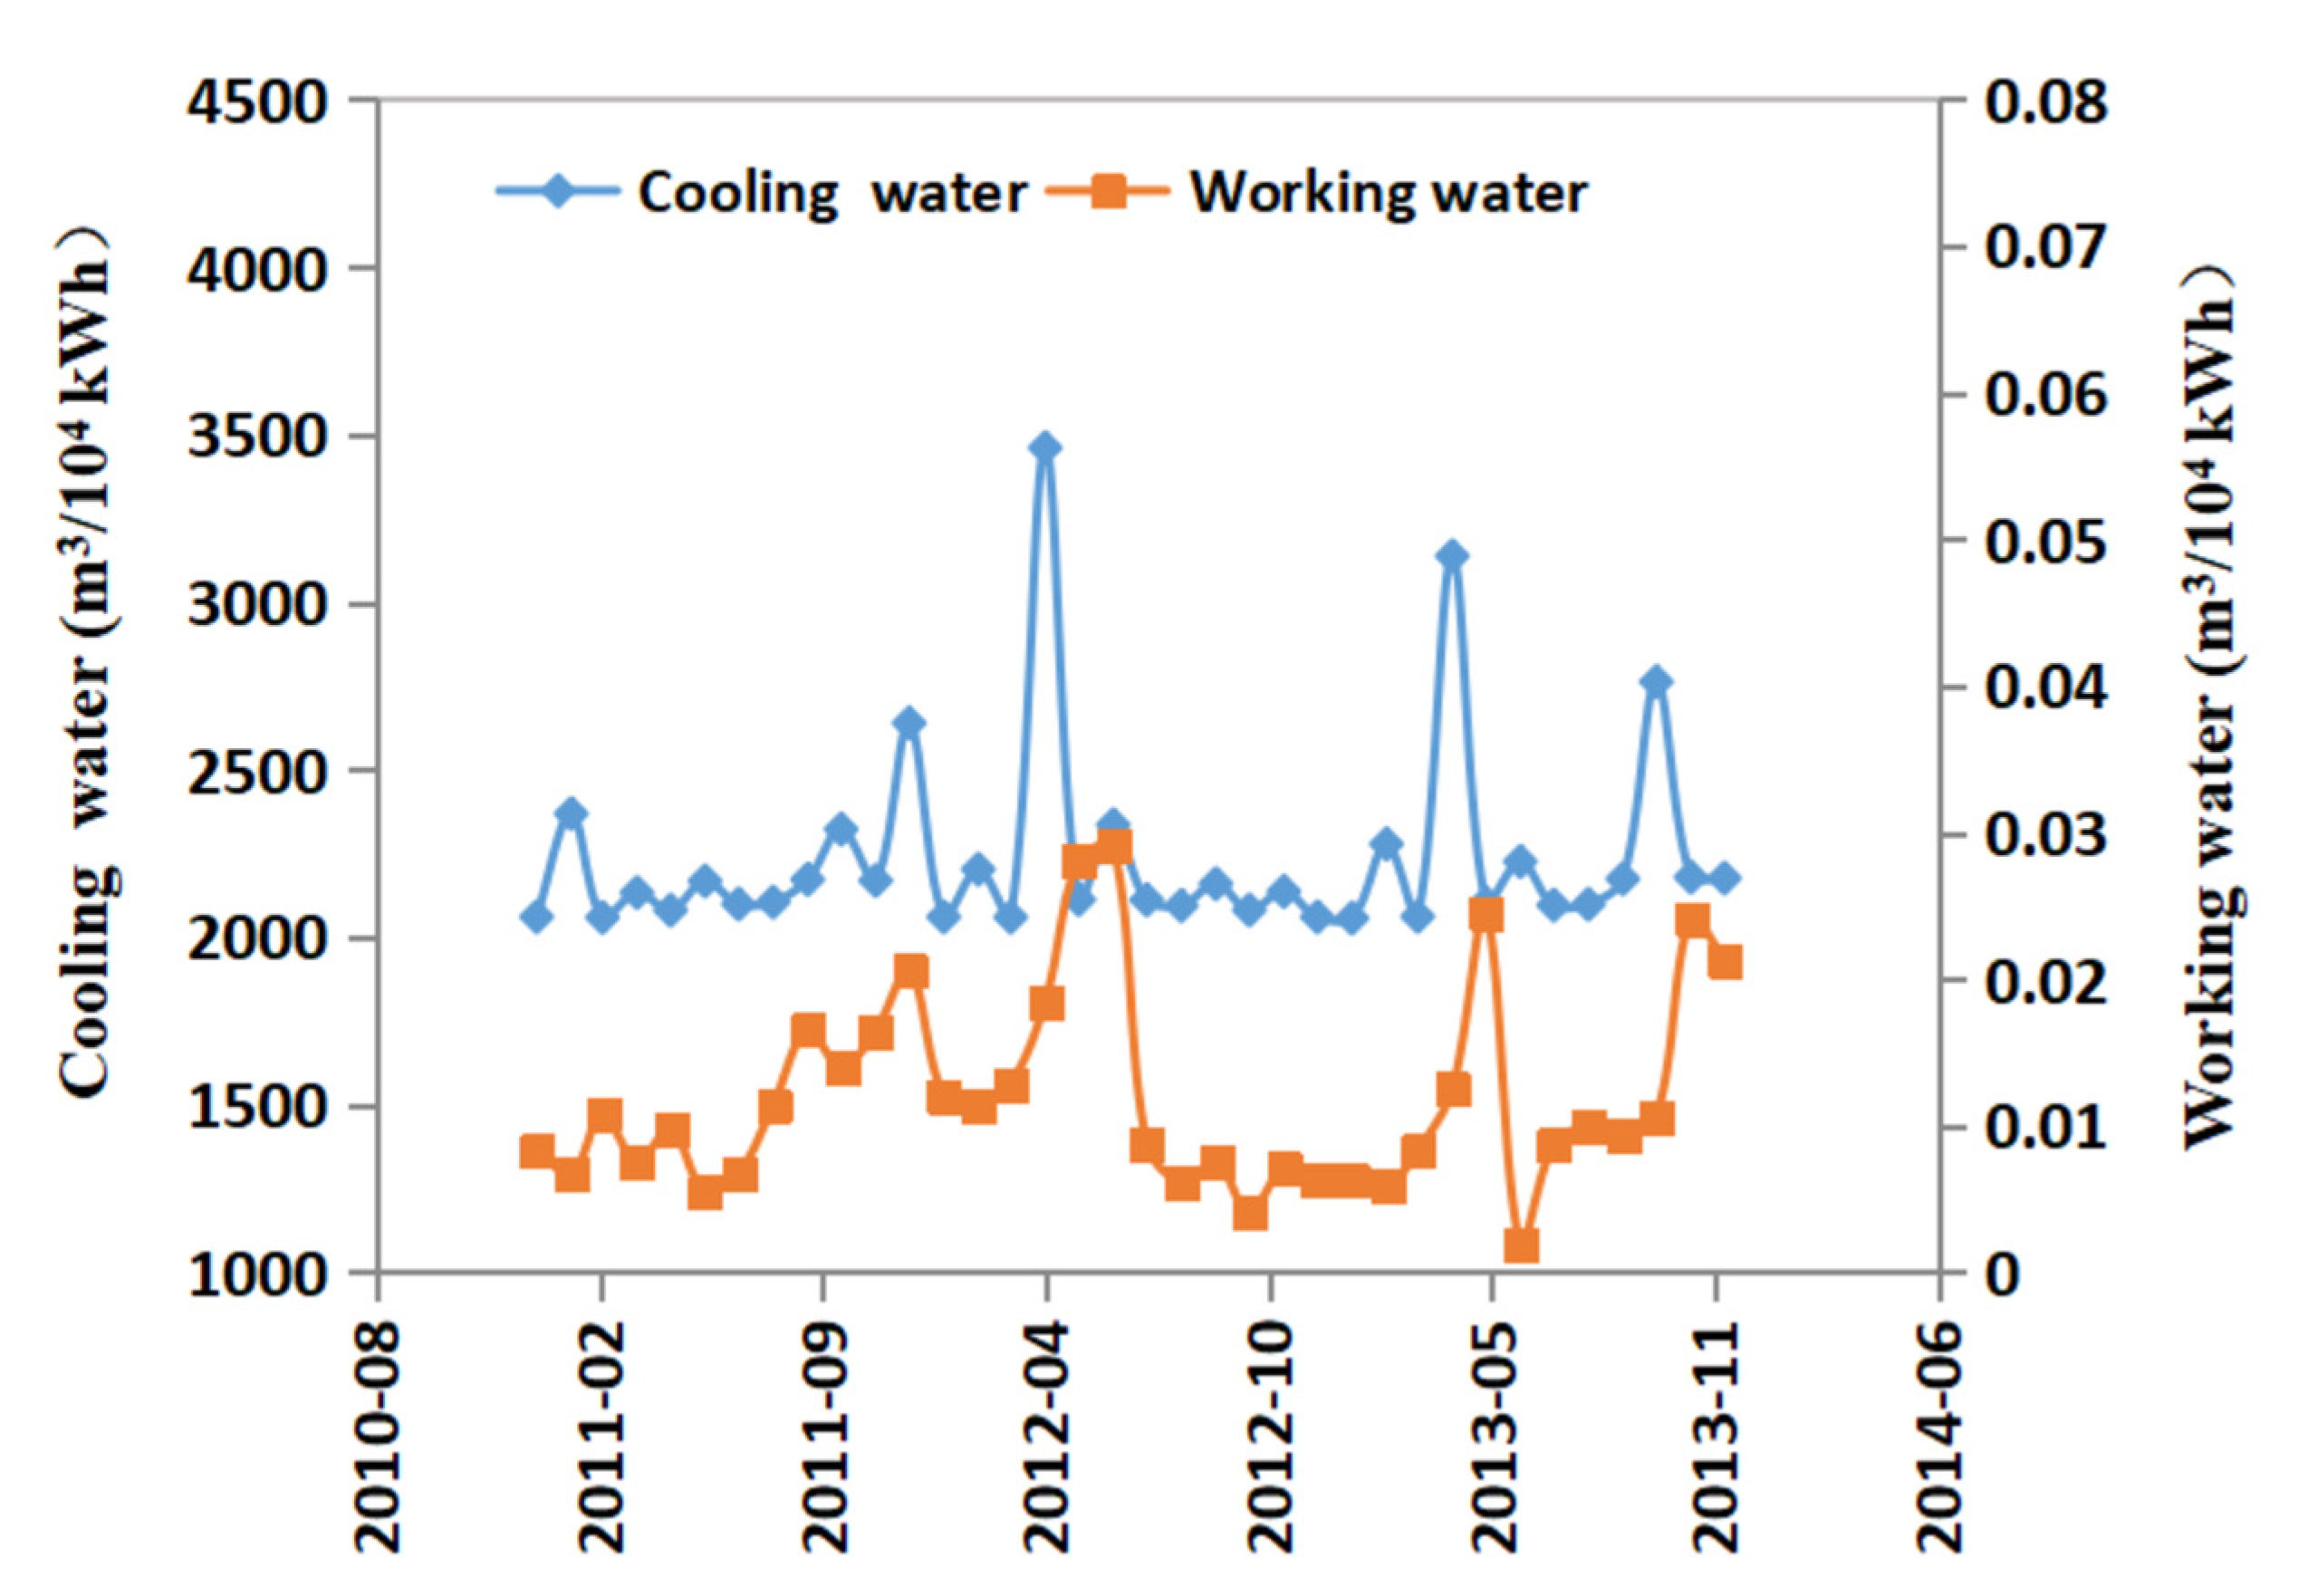
3.5. Water Consumption of a Nuclear Power Plant
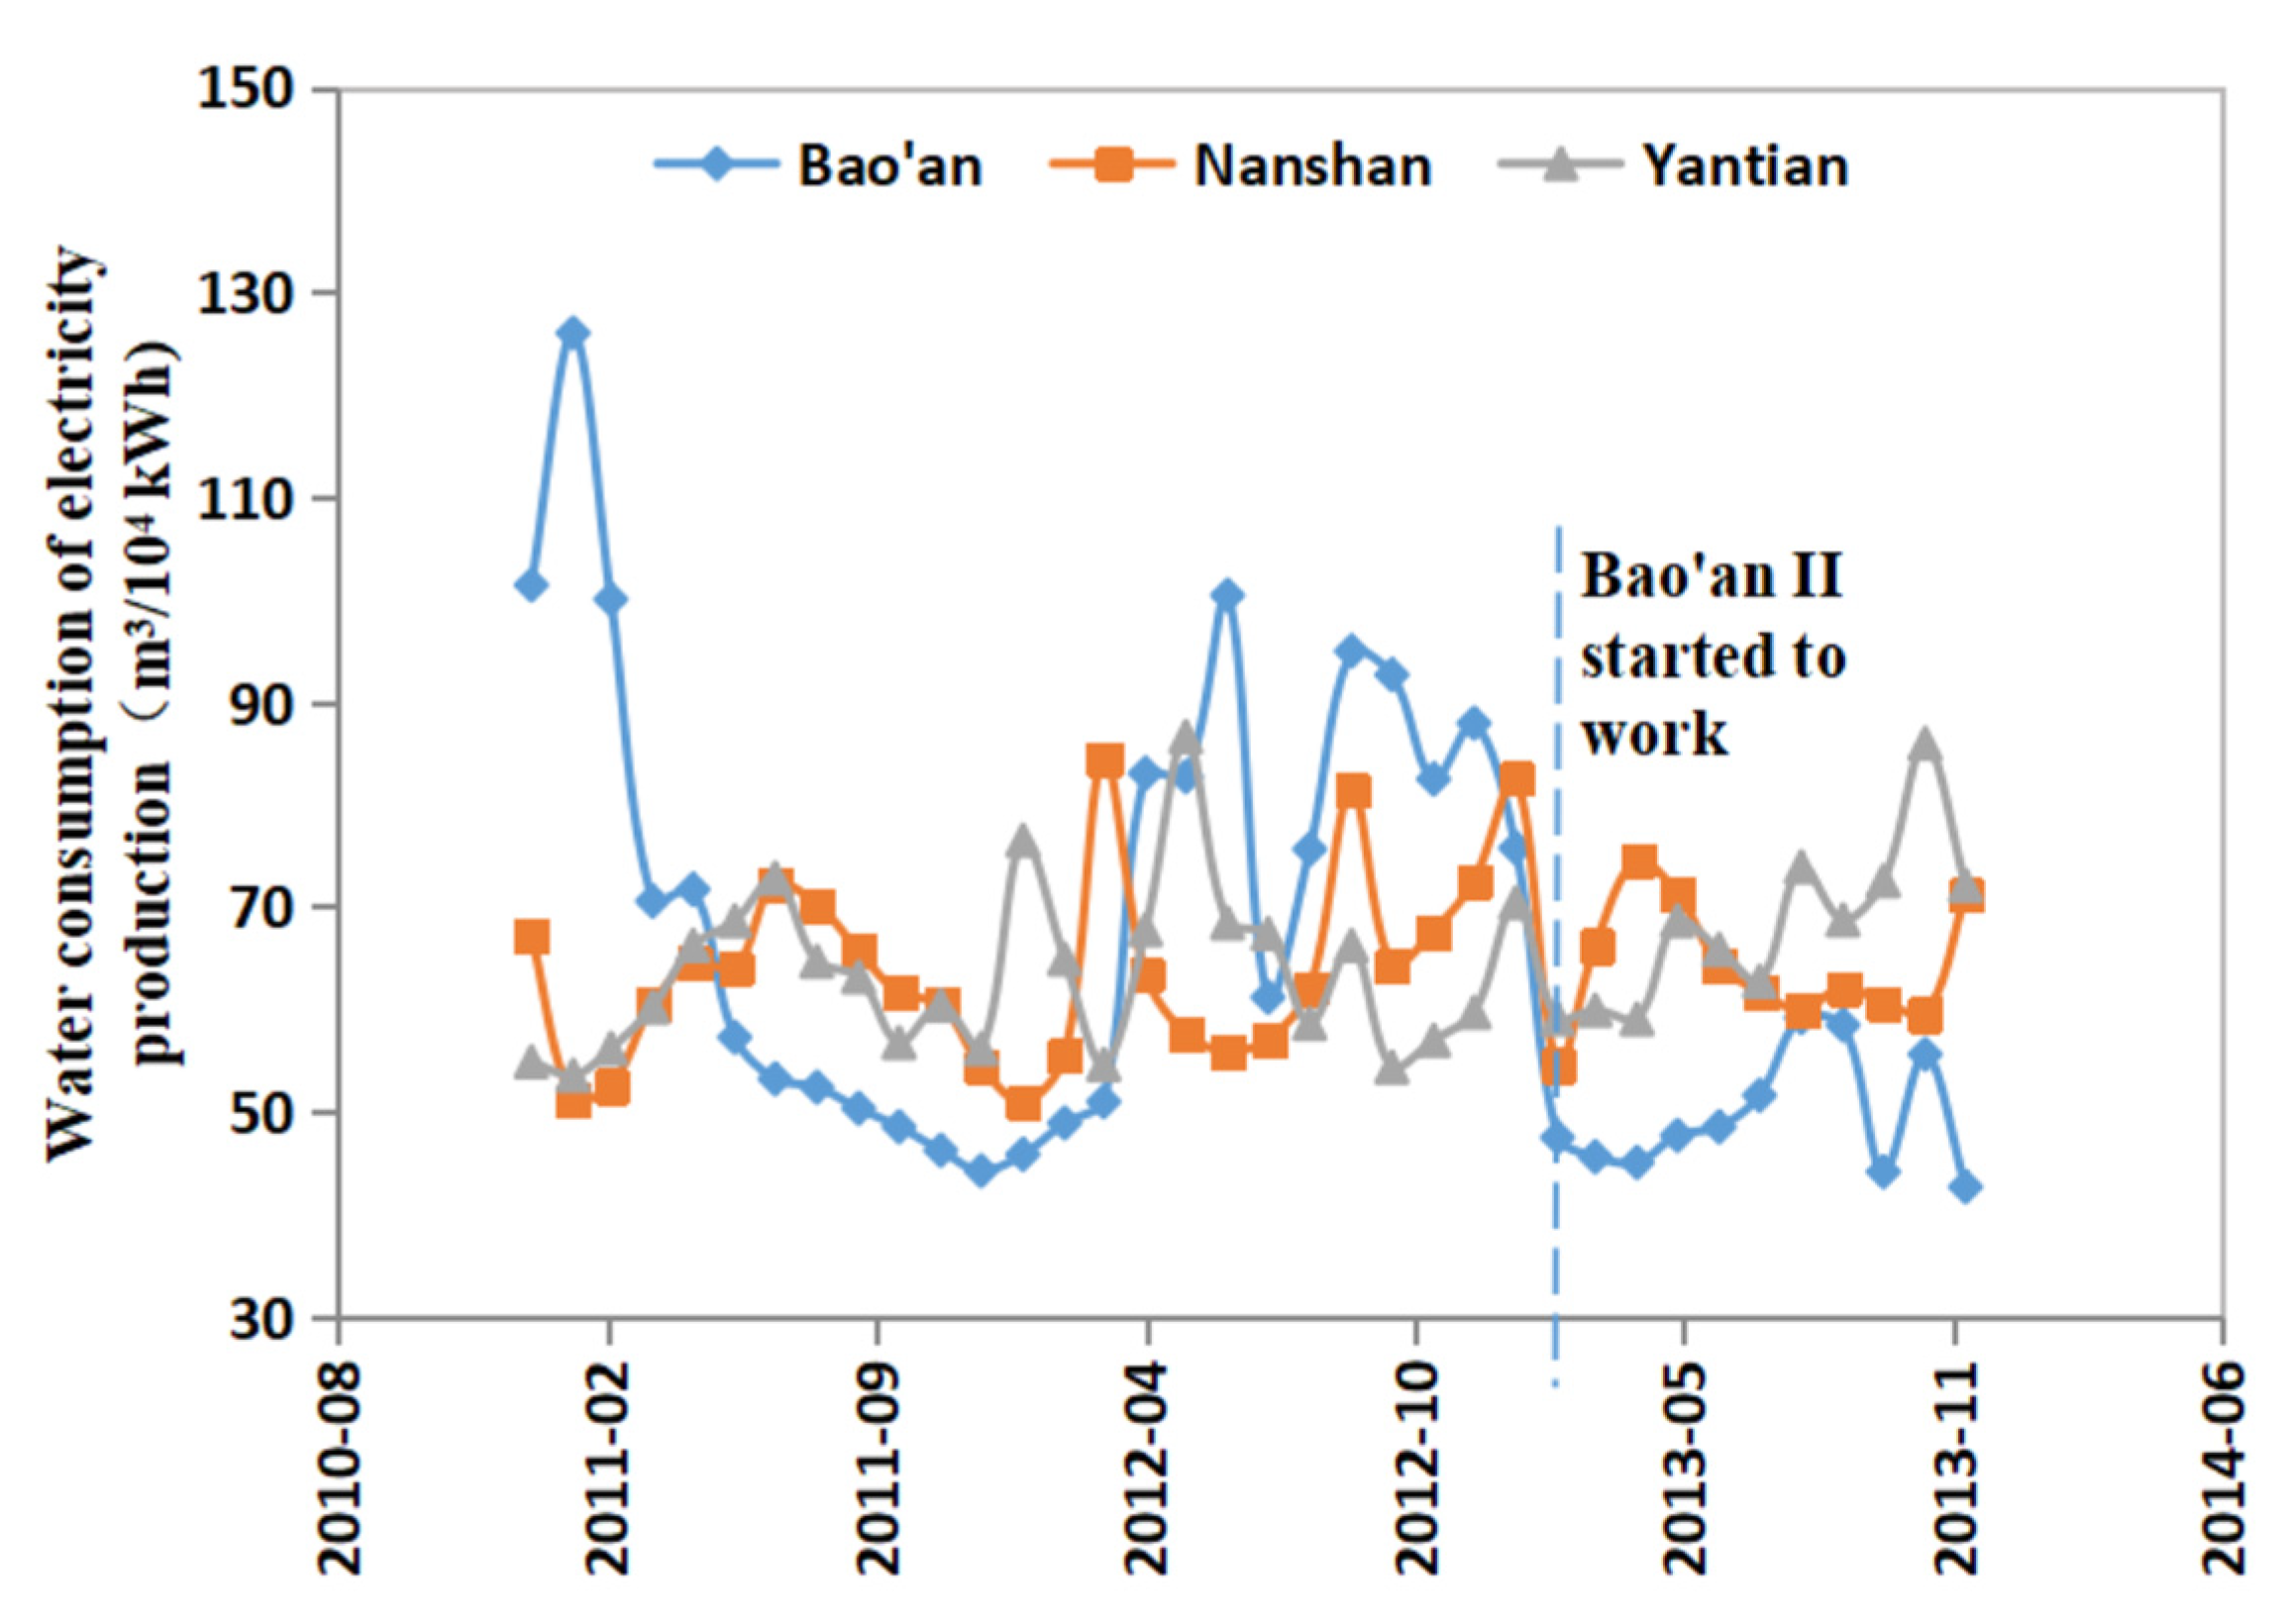
3.6. Water Consumption of a Biomass Power Plant
4. Discussion
4.1. Water Consumption of Power Plants
4.2. Effect of Fuel Types on Water Consumption
4.3. Effect of Cooling Methods on Water Consumption
5. Conclusions
Author Contributions
Funding
Institutional Review Board Statement
Informed Consent Statement
Data Availability Statement
Acknowledgments
Conflicts of Interest
References
- Chang, N.B.; Hossain, U.; Valencia, A.; Qiu, J.; Kapucu, N. The role of food-energy-water nexus analyses in urban growth models for urban sustainability: A review of synergistic framework. Sustain. Cities Soc. 2020, 63, 102486. [Google Scholar] [CrossRef]
- Qiu, G.Y.; Zou, Z.D.; Li, W.J.; Li, L.J.; Yan, C.H. A quantitative study on the water-related energy use in the urban water system of Shenzhen. Sustain. Cities Soc. 2022, 80, 103786. [Google Scholar] [CrossRef]
- Fontenelle, A.L.; Nilsson, E.; Hidalgo, I.G.; Uvo, C.B.; Peyerl, D. Temporal understanding of the water–energy nexus: A literature review. Energies 2022, 15, 2851. [Google Scholar] [CrossRef]
- Engström, R.E.; Howells, M.; Destouni, G.; Bhatt, V.; Bazilian, M.; Rogner, H. Connecting the resource nexus to basic urban service provision-with a focus on water-energy interactions in New York City. Sustain. Cities Soc. 2017, 31, 83–94. [Google Scholar] [CrossRef]
- Fang, D.; Chen, B. Linkage analysis for the water–energy nexus of city. Appl. Energy 2017, 189, 770–779. [Google Scholar] [CrossRef]
- Li, W.J.; Li, L.J.; Qiu, G.Y. Energy consumption and economic cost of typical wastewater treatment systems in Shenzhen, China. J. Clean. Prod. 2017, 163, S374–S378. [Google Scholar] [CrossRef]
- Spang, E.S.; Moomaw, W.R.; Gallagher, K.S.; Kirshen, P.H.; Marks, D.H. The water consumption of energy production: An international comparison. Environ. Res. Lett. 2014, 9, 105002. [Google Scholar] [CrossRef]
- Qiu, G.Y.; Li, W.J.; Li, L.J.; Zhang, Q.; Yang, Y. Water and energy nexus in China: Current situation and future perspective in energy industry, water industry and agriculture. J. Fundam. Renew. Energy Appl. 2014, 4, 138. [Google Scholar] [CrossRef]
- Li, W.J.; Li, L.J.; Qiu, G.Y. General nexus between water and electricity use and its implication for urban agricultural sustainability: A case study of Shenzhen, South China. J. Integr. Agric. 2013, 12, 1341–1349. [Google Scholar] [CrossRef]
- Gleick, P.H. Water and energy. Annu. Rev. Energy Environ. 1994, 19, 267–299. [Google Scholar] [CrossRef]
- Stillwell, A.S.; King, C.W.; Webber, M.E.; Duncan, I.J.; Hardberger, A. The energy-water nexus in Texas. Ecol. Soc. 2011, 16, 2. [Google Scholar] [CrossRef] [Green Version]
- Spang, E.S. A Thirst for Power: A Global Analysis of Water Consumption for Energy Production; ProQuest Dissertations Publishing; University of California: Davis, CA, USA, 2012. [Google Scholar]
- Wald, M. Heat Shuts Down a Coastal Reactor. New York Times Green Blog, 13 August 2012. Available online: http://green.blogs.nytimes.com/2012/08/13/heat-shuts-down-a-coastal-reactor/ (accessed on 13 August 2012).
- Copeland, C. Energy-water nexus: The water sector’s energy use. In Congressional Research Service 7-5700; CRS: Washington, DC, USA, 2014. [Google Scholar]
- Gao, J.J. Correlation Analysis of Water Resources Utilization and Electric Power Production in China; Tianjin University: Tianjin, China, 2012. [Google Scholar]
- Wang, F. Water consumption analysis and water-saving measures of thermal power generation in China. Hebei Electr. Power Technol. 2001, 2, 6–8. [Google Scholar]
- Li, Y.H.; Xu, P.B.; Chen, M.J. Water consumption forecast of thermal power plants in central Yunnan province. Power Constr. 2006, 27, 14–17. [Google Scholar]
- Zuo, J.B.; Liu, C.M.; Zheng, H.X. Water consumption analysis and water-saving measures of thermal power generation industry in Beijing. Water Supply Drain. 2008, 34, 56–60. [Google Scholar]
- Han, M.L. Water use analysis and countermeasures of thermal power generation industry. Ind. Water Treat. 2010, 30, 9–13. [Google Scholar]
- Shenzhen Municipal Development and Reform Commission. The 12th Five-Year Plan of Shenzhen Energy Development; Shenzhen Municipal Development and Reform Commission Publishing: Shenzhen, China, 2012.
- Shenzhen Statistics Bureau. Shenzhen Statistics Yearbook 2012. Available online: http://tjj.sz.gov.cn/zwgk/zfxxgkml/tjsj/tjnj/content/post_3085990.html (accessed on 24 April 2013).


| Power Plant | Electricity Generation (Billion kWh) | Fuel Types | Cooling Method |
|---|---|---|---|
| Mawan coal-fired power plant | 11 | Coal | Open cooling |
| Yueliangwan oil-fired power plant | 0.86 | Heavy oil | Closed cooling |
| Shenzhen Eastern gas power plant | 4.2 | Natural gas | Open cooling |
| Dayawan nuclear power plant | 45.1 | Nuclear energy | Open cooling |
| Waste incineration power plants (namely Nanshan, Yantian, and Bao’an plants) | 0.05 | Household garbage | Closed cooling |
| Power Plants | Water Consumption per Unit of Power Generation (m3/104 kWh) | Total Electricity Production (108 kWh) | Total Water Use (104 m3) |
|---|---|---|---|
| Yueliangwan plant | 23 | 10.24 | 235.6 |
| Waste incineration plant | 63.2 | 11.6 | 733.1 |
| Mawan plant | 990 | 92.5 | 91,575 |
| Eastern plant | 869 | 12.5 | 10,862 |
| Dayawan plant | 2238 | 153 | 342,414 |
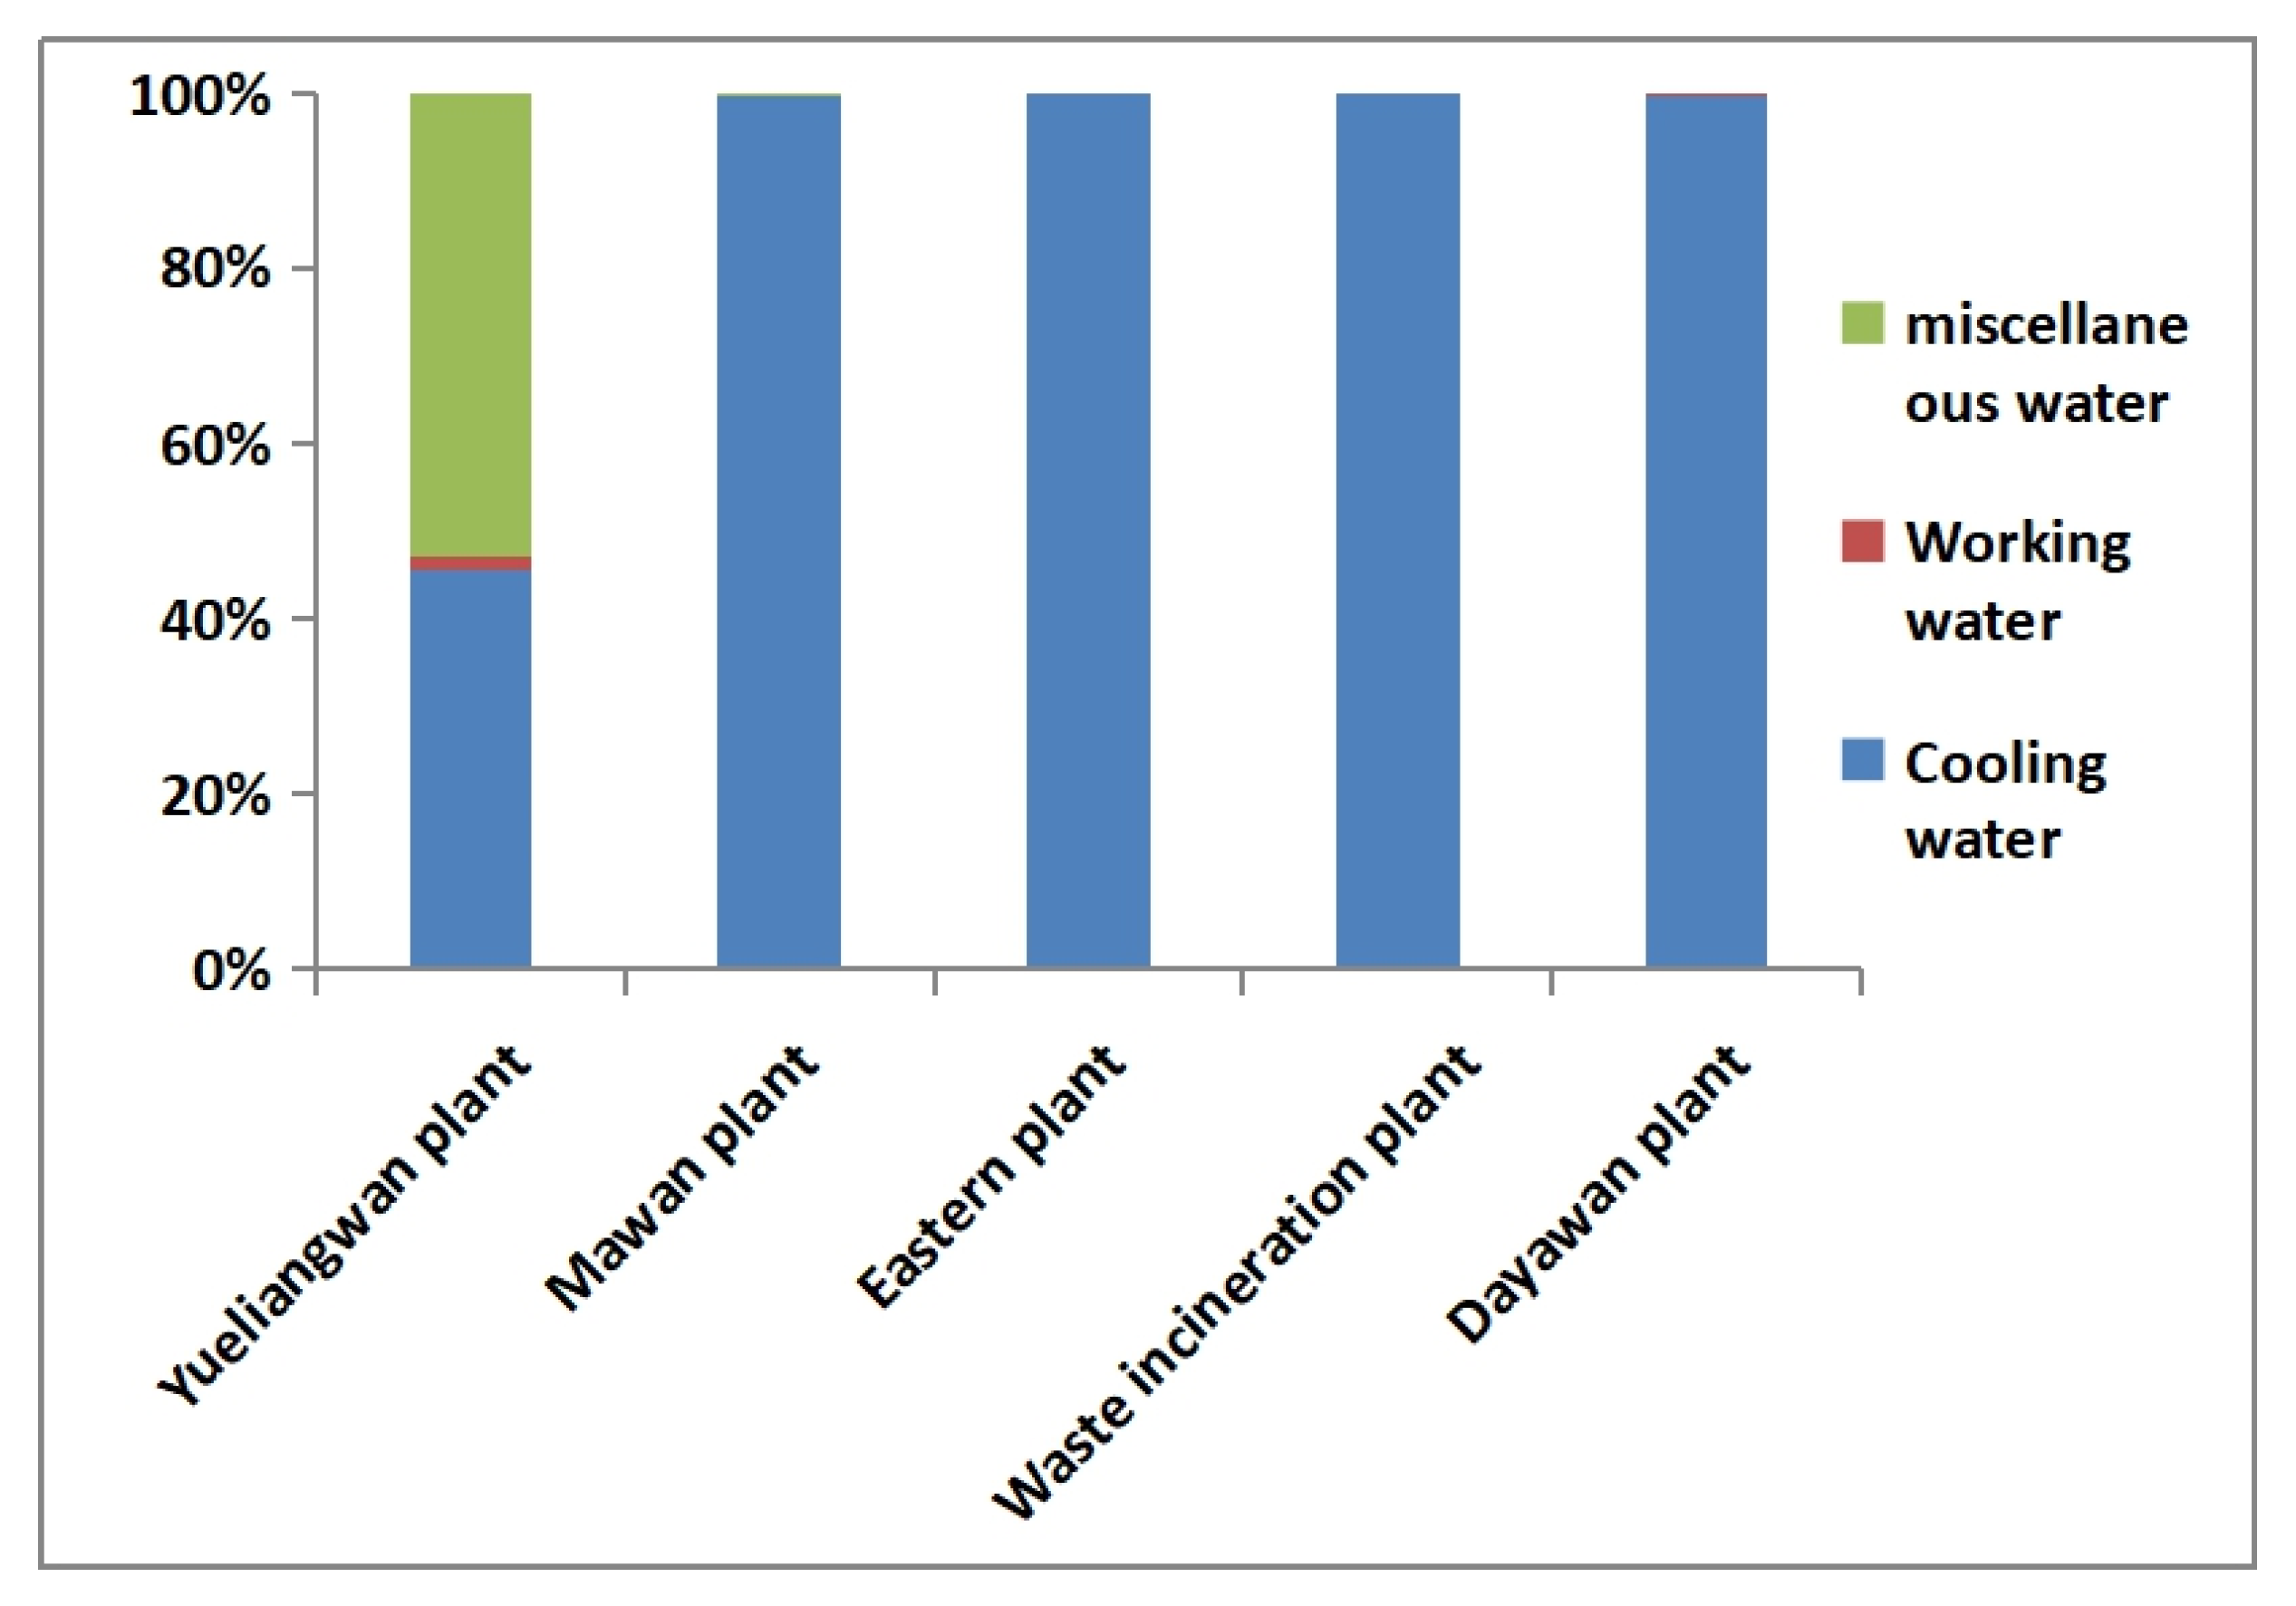
| Power Plants | Fuel Types | Cooling Method | Cooling Water (m3/104 kWh) | Working Water (m3/104 kWh) | Miscellaneous Water (m3/104 kWh) |
|---|---|---|---|---|---|
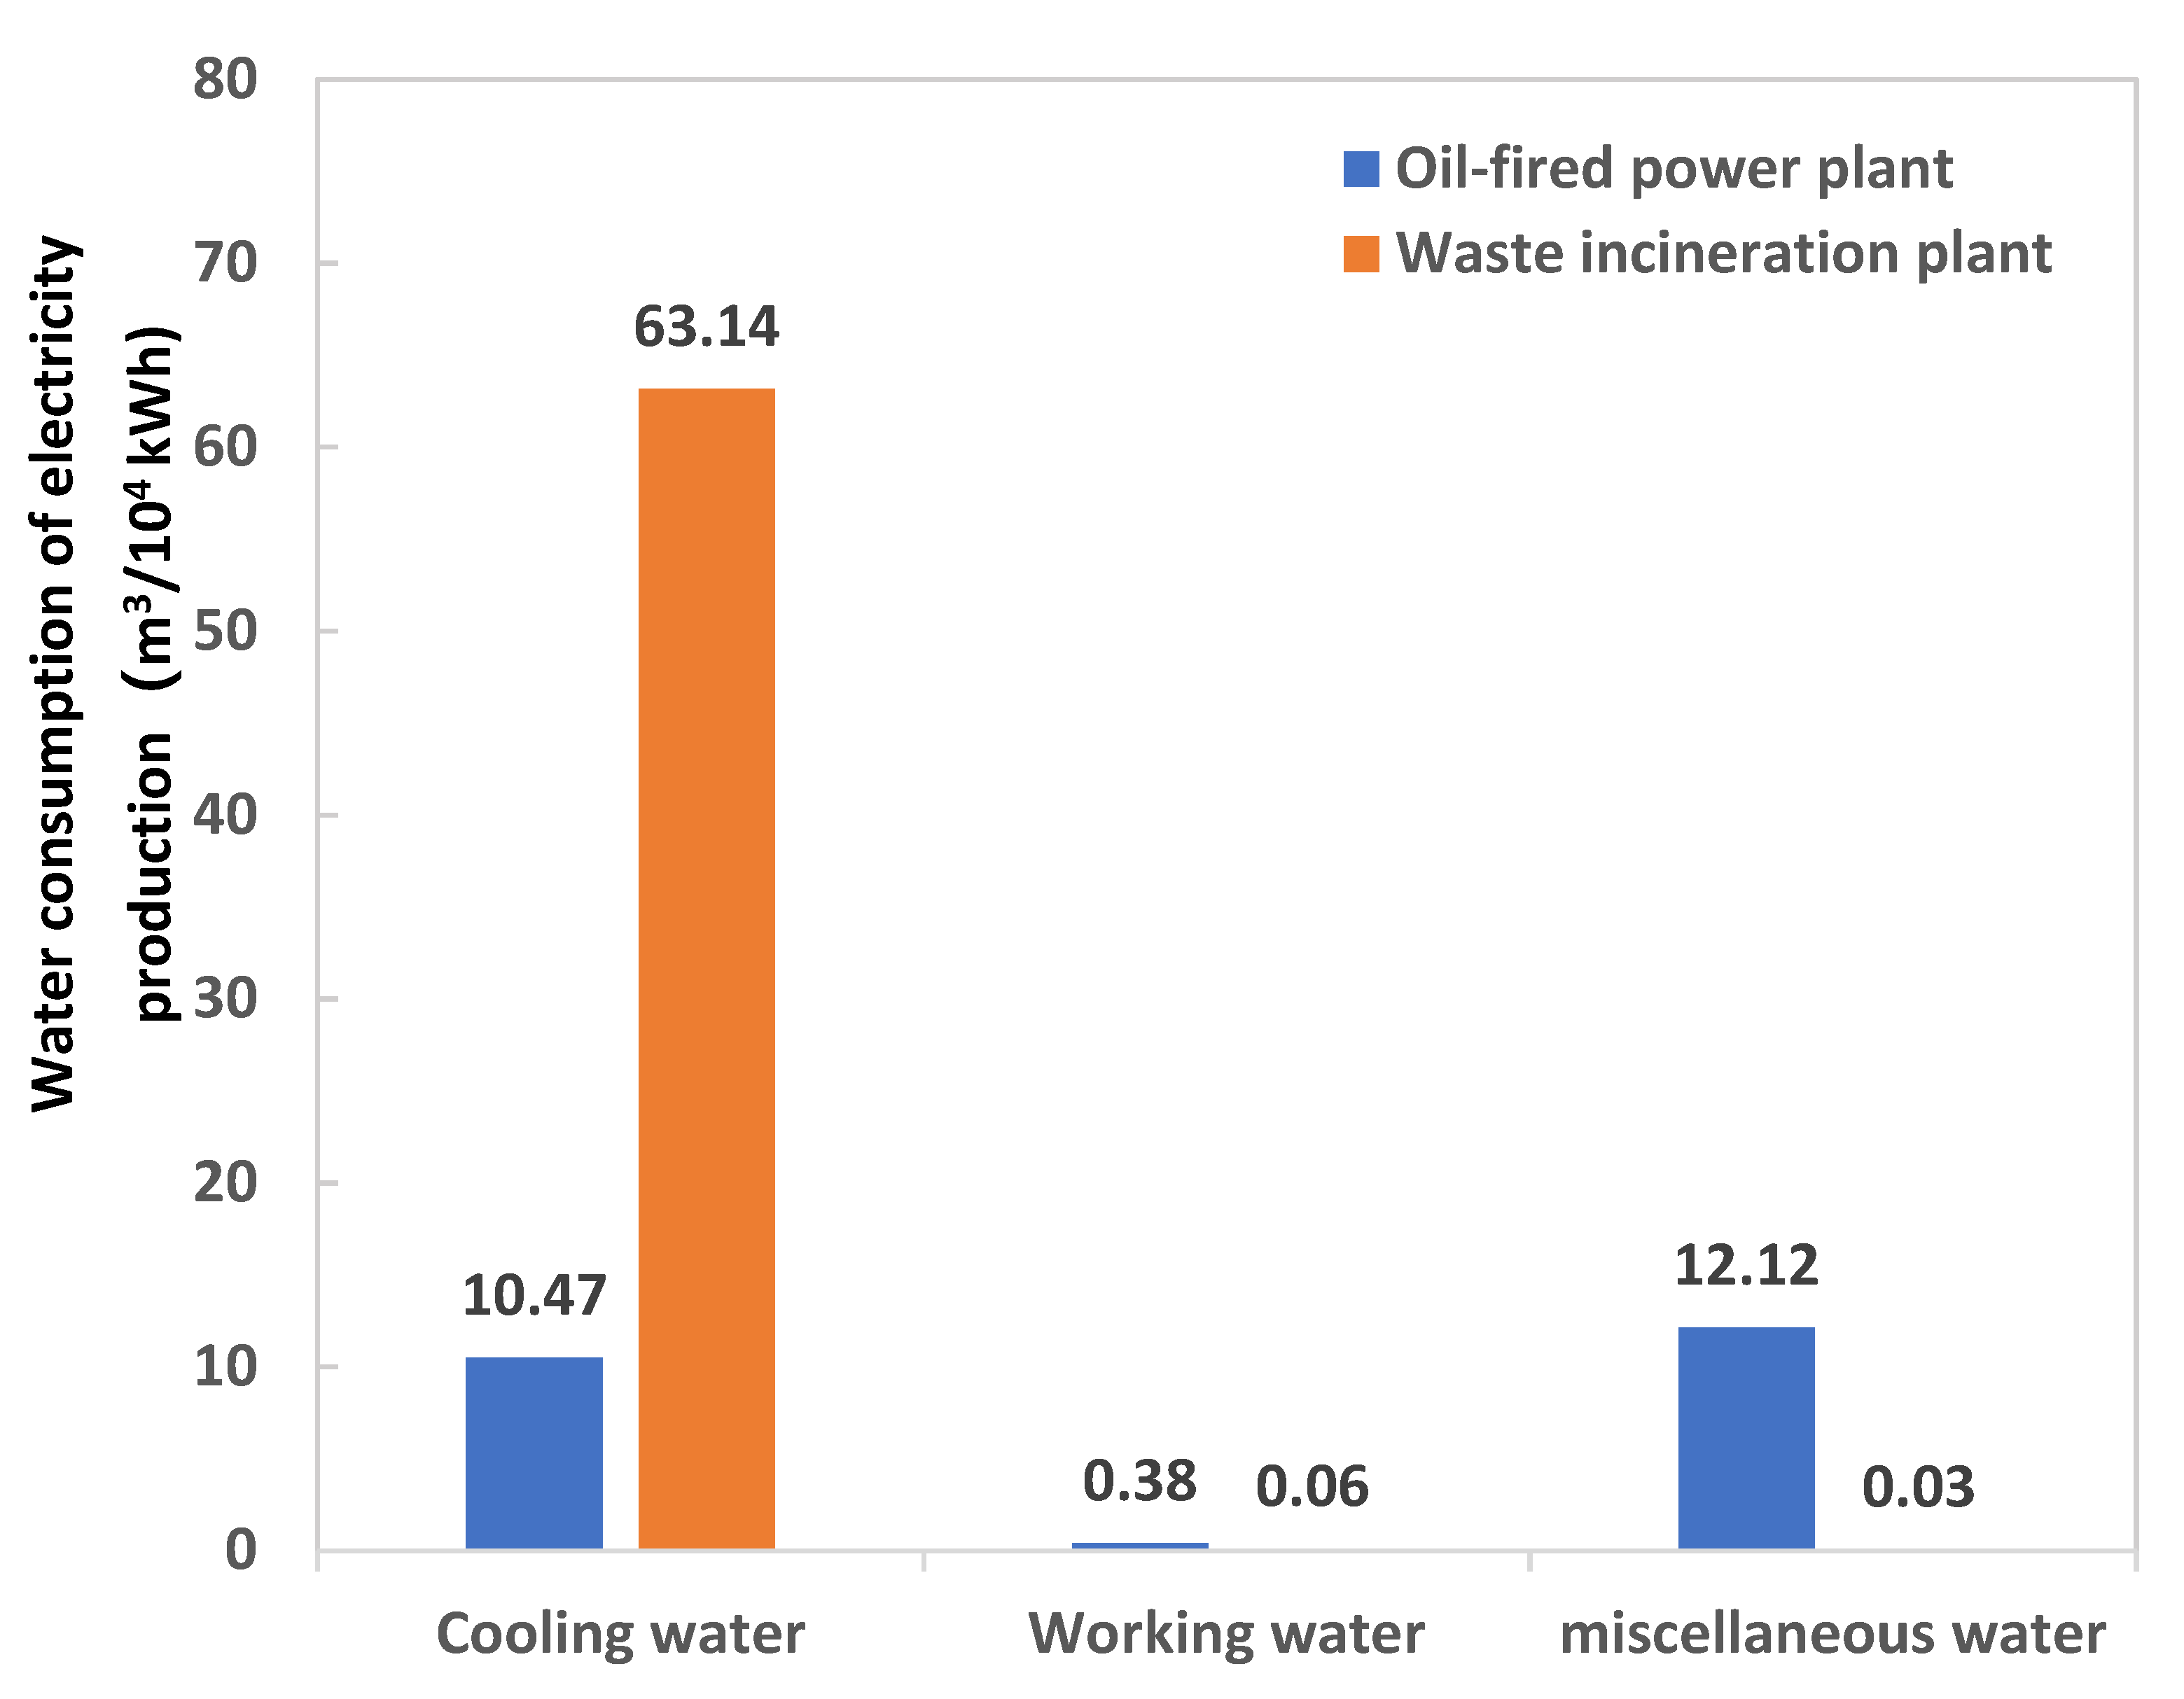
| Yueliangwan plant | Heavy oil | Closed cooling | 10.5 ± 1.2 | 0.38 ± 0.11 | 12.12 ± 1.25 |
| Waste incineration plant | Biomass energy | Closed cooling | 63.1 ± 8.3 | 0.06 ± 0.02 | 0.03 ± 0.012 |
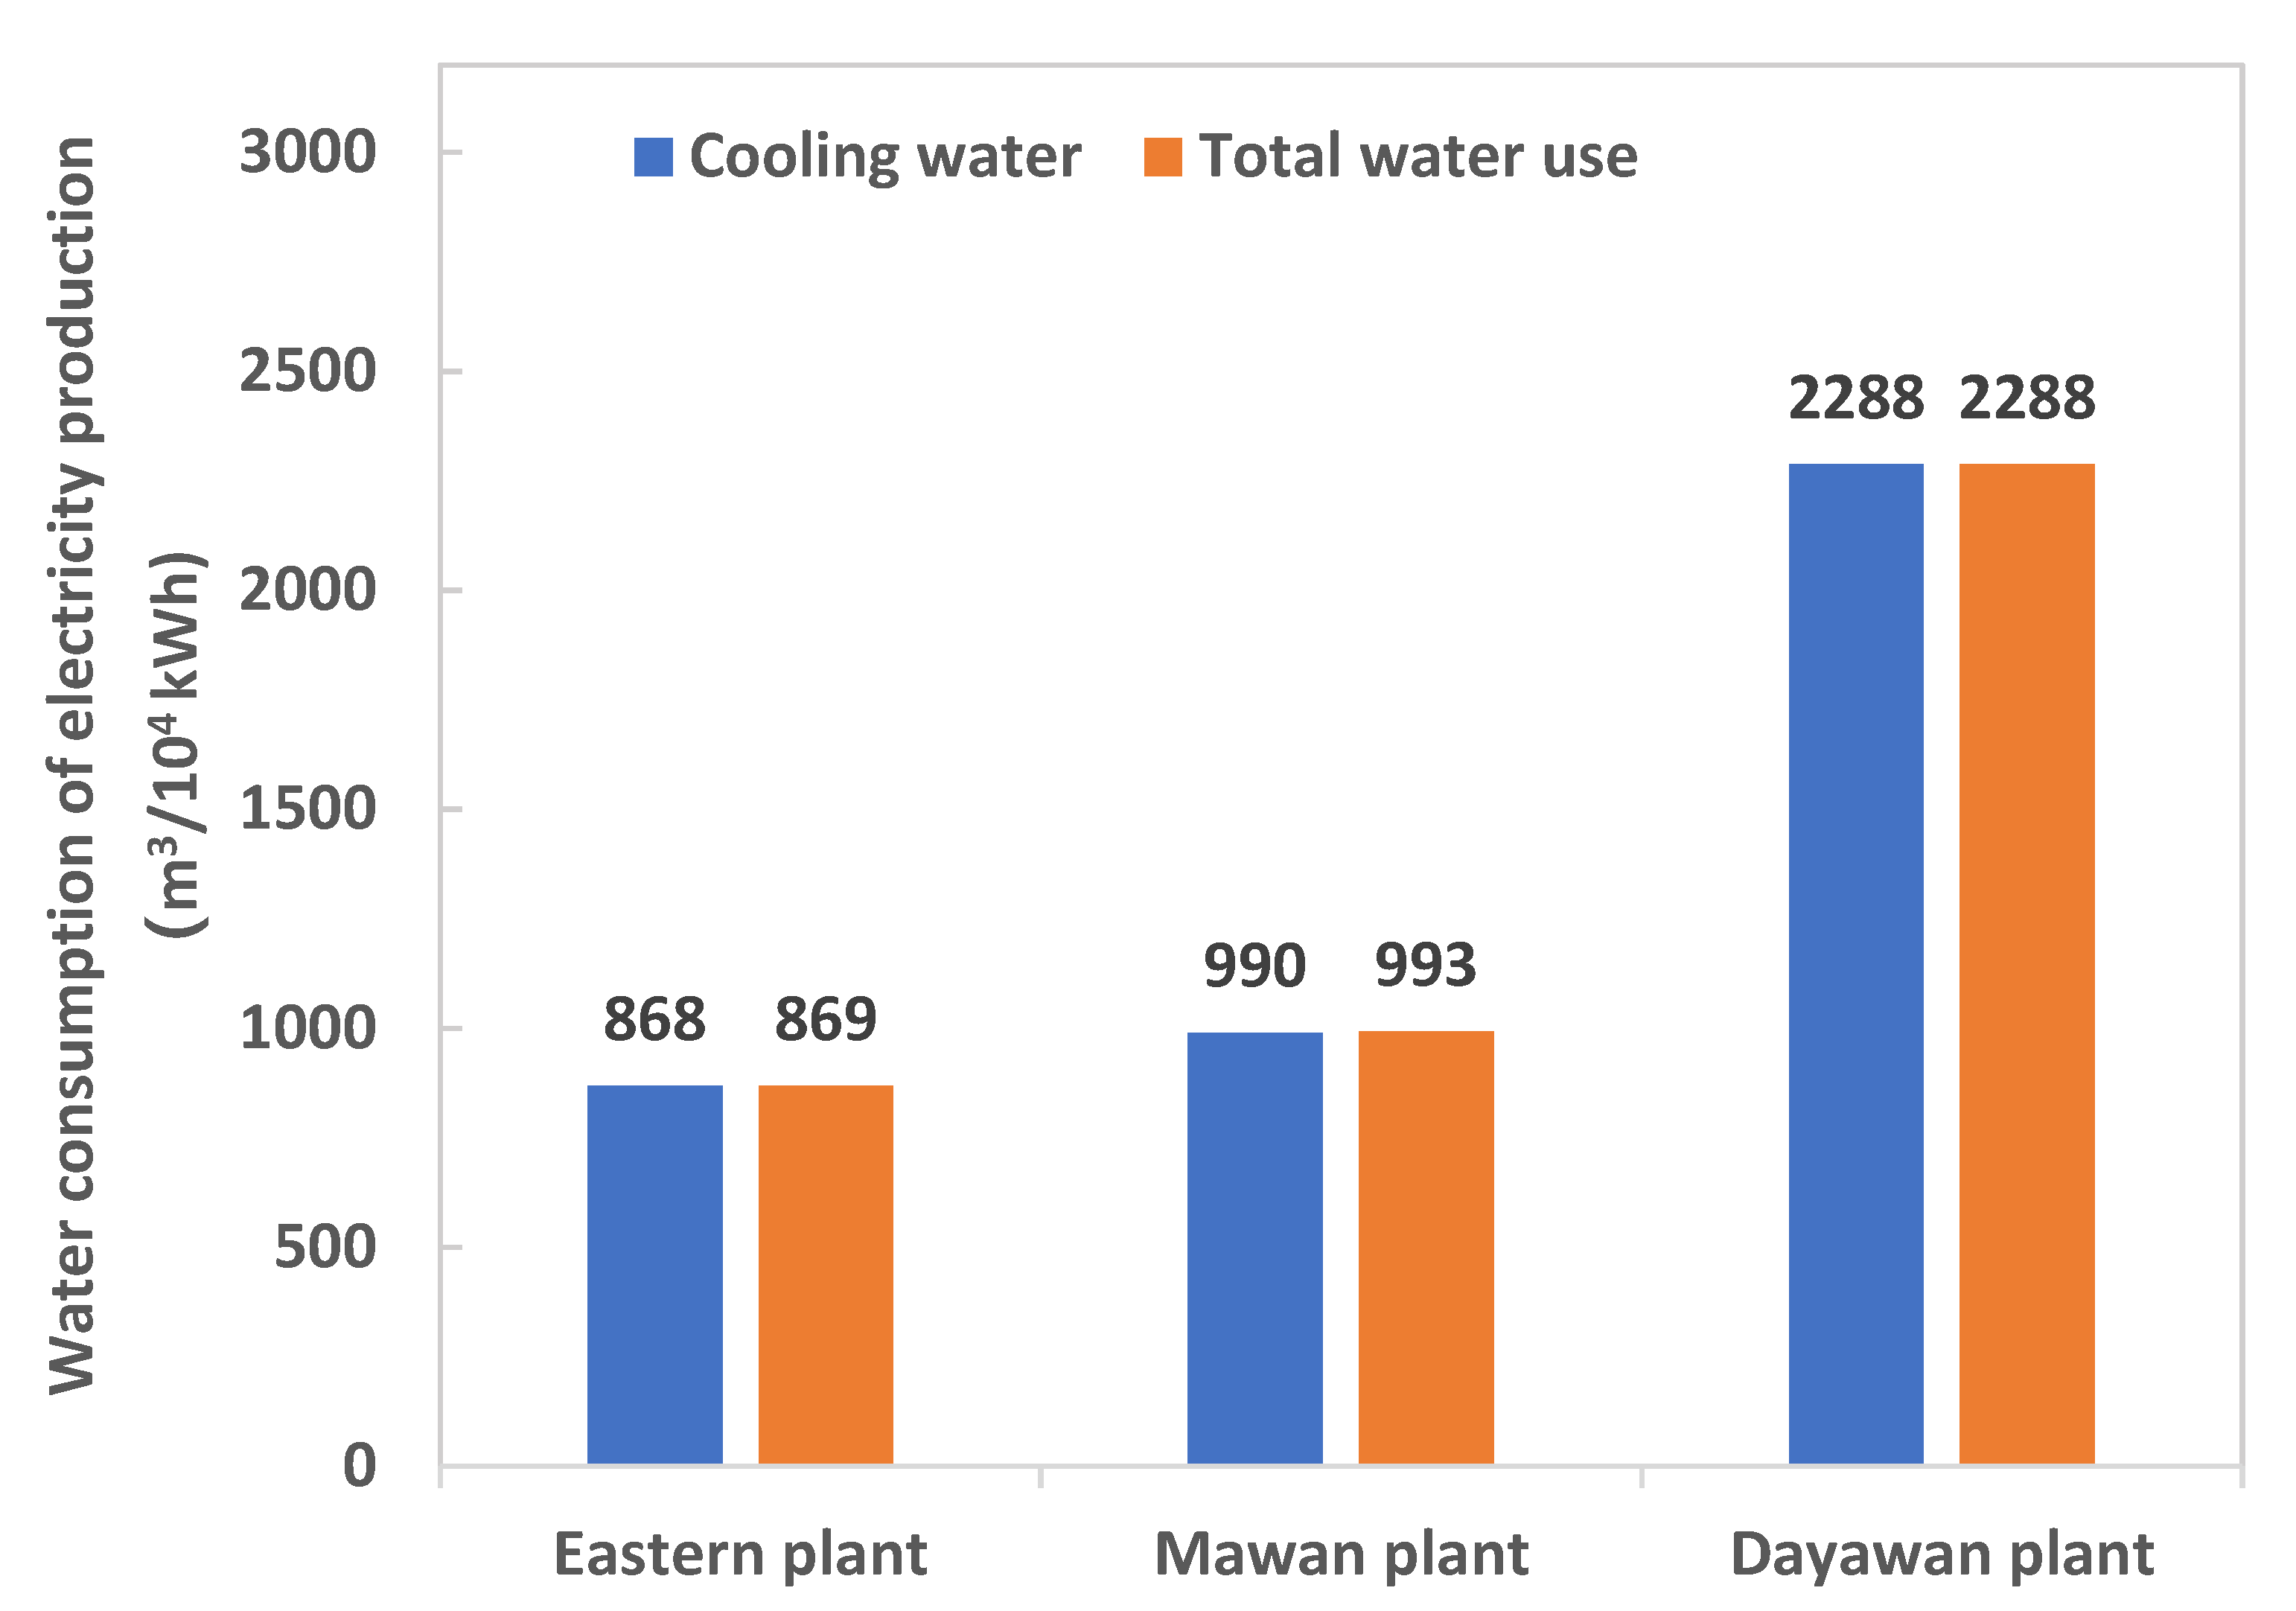
| Mawan plant | Coal | Open cooling | 990.1 ± 185.9 | 0.54 ± 0.15 | 1.89 ± 0.35 |
| Eastern plant | Natural gas | Open cooling | 867.9 ± 34.8 | 0.36 ± 0.16 | 0.46 ± 0.16 |
| Dayawan plant | Nuclear energy | Open cooling | 2237.9 ± 304.6 | 0.012 ± 0.007 | |
Publisher’s Note: MDPI stays neutral with regard to jurisdictional claims in published maps and institutional affiliations. |
© 2022 by the authors. Licensee MDPI, Basel, Switzerland. This article is an open access article distributed under the terms and conditions of the Creative Commons Attribution (CC BY) license (https://creativecommons.org/licenses/by/4.0/).
Share and Cite
Li, L.-J.; Qiu, G.-Y.; Yan, C.-H. Relationship between Water Use and Energy Generation from Different Power Generation Types in a Megacity Facing Water Shortages: A Case Study in Shenzhen. Water 2022, 14, 3226. https://doi.org/10.3390/w14203226
Li L-J, Qiu G-Y, Yan C-H. Relationship between Water Use and Energy Generation from Different Power Generation Types in a Megacity Facing Water Shortages: A Case Study in Shenzhen. Water. 2022; 14(20):3226. https://doi.org/10.3390/w14203226
Chicago/Turabian StyleLi, Lin-Jun, Guo-Yu Qiu, and Chun-Hua Yan. 2022. "Relationship between Water Use and Energy Generation from Different Power Generation Types in a Megacity Facing Water Shortages: A Case Study in Shenzhen" Water 14, no. 20: 3226. https://doi.org/10.3390/w14203226