
Long-Term Performance of Liners Subjected to Freeze-Thaw Cycles

Bugshan Research Chair in Expansive Soils, Department of Civil Engineering, College of Engineering, King Saud University, Riyadh 11421, Saudi Arabia
*
Author to whom correspondence should be addressed.
Water 2022, 14(20), 3218; https://doi.org/10.3390/w14203218
Submission received: 12 September 2022
/
Accepted: 10 October 2022
/
Published: 13 October 2022
(This article belongs to the Section Water and Climate Change)
Abstract
:The technique of using clay-sand mixtures as liners has been widely used in several geotechnical projects where hydraulic barriers or waste-buffer layers are required. During weather fluctuations and below-zero temperature conditions, these layers can be subjected to successive freeze-thaw cycles. The serviceability of such liners needs to be examined during their lifetime for efficiency and function under such suspected weather conditions. The hydraulic conductivity over the long run needs to remain within the acceptable design ranges. In this study, the efficiency of two different clay-sand liners were examined under the effect of freeze-thaw cycles for extended serviceability. The hydraulic conductivity under a continuous discharge rate of these layers was measured before and after applying 15 successive freeze-thaw cycles for more than half a year. The results indicate dramatic changes in the hydraulic conductivity parameter for the specimens subjected to freeze-thaw cycles depending on their mineralogical composition and applied stress. These changes were found to be related to the sealed material composition and placement conditions. The data obtained were found of interest and can be utilized for evaluating the efficiency of the liners in areas subjected to extreme environmental exposures including freeze conditions over extended periods.
1. Introduction
Sand-clay liner systems are introduced as barriers to control the flow of leachates and liquids in order to protect the subsurface groundwater, soils, and the environment in general against hazardous contaminants. Usually, the liner system is near subsurface compacted layers and mostly these layers are exposed to different climatic fluctuations of drying-wetting, freeze-thaw, and stress state history. Numerous research studies have investigated the hydraulic conductivity as the main parameter to assess the efficiency of different sand-clay and sand-bentonite liners [1,2,3,4,5,6,7,8]. The design criteria required by most of the official environmental control agencies is a hydraulic conductivity of not more than 10−7 cm/s. In order to maintain this level of flow during the lifetime of the landfill facilities, field evaluation changes in hydraulic conductivity need to be traced and monitored. Variations in the hydraulic conductivity can occur due to different exposure conditions. The authors carried out detailed studies on the common sand-clay mixtures and clays in a semi-arid area to assess the possible changes to the hydraulic conductivity as related to selected exposure conditions [8,9]. The literature regarding long-term performance of liner layers under susceptible exposed conditions is very rare [10], as well as in the laboratory [9,10]. Abdolahzadeh et al. [10] conducted fieldwork on a cover seepage-control layer and reached a conclusion that the hydraulic conductivity decreases with time, based on 4 years of observation data. This is attributed to consolidation and settlements caused by repeated wetting and drying. The fines content also claimed to have a role in reducing the hydraulic conductivity to four times lower [11]. The fines content affects the large-pores size and quantity and thus influences the ease of fluid flow [12]. Al-Mahbashi and Dafalla [9] presented a study indicating the rate at which the mass loss takes place when a hydraulic gradient is applied to a sand-clay mixture for a long period.
Studies on freeze-thaw effects on the behavior of clay-sand mixtures are few. This type of investigation can assess the strength, durability, and function when unfavorable weather conditions are likely to take place (i.e., [13,14]). The freeze-thaw cycles and stress state have been proven to have a significant effect on the hydraulic conductivity of clays [15,16,17]. Mostly, the reported increase in hydraulic conductivity due to exposure to freeze-thaw cycles varies depending on the type of soil and initial hydraulic conductivity; the clays with high initial hydraulic conductivity show marginal changes due to freeze-thaw action [15]. Korshunov et al. [18] stated that for low plasticity clay (20.7% clay) and fine sand (1.02% clay) the hydraulic conductivity measured in two days showed an increase by 3 and 1.5 orders of magnitude more than the unfrozen state, respectively. The increase in hydraulic conductivity is due to the generation of layered cryogenic texture during repeated freezing and movement of water between micro and macro pores and the formation of ice lenses which destroys soil pores. Large orders of increase in hydraulic conductivity due to freeze-thaw actions have been reported and summarized for different clays by other researchers [19,20].
Othman and Benson [15] traced the changes in morphology during hydraulic conductivity of clay specimens exposed to FT cycles by photographing thin sections less than 0.5 mm. Extensive numbers of ice lenses have formed and developed during FT cycles up to a certain level, then cracks start propagating elsewhere causing a notable increase in the hydraulic conductivity. Expansion of formed ice lenses during the freezing phase and vice versa during thawing are mechanisms that affect the internal structure and develop these internal cracks. These cracks vary in size and intensity following the mineralogical composition of the clay. The hydraulic conductivity increases when cracks start to develop within the soil. The studies showed that even a single freeze-thaw induced significant network cracks on specimen structure as detected from photographs [21]. Analysis of soil structure and their pores for loamy sand and silty clay loam revealed that pores larger than 0.3 mm tend to shift towards smaller macropores and well-connected pore systems [22,23].
Earlier research conducted by Kraus et al., 1997 [24] showed that the hydraulic conductivity of different types of geosynthetic clay-sand liners and sand-bentonite mixture (12% by dry weight) liners are not affected by FT cycles. This is likely due to tests being carried out in the laboratory and field immediately after applying several FT cycles. Fouli et al. [17] studied the effect of freeze-thaw cycles (0, 1, 5, 10) on the infiltration rate of different soils including clay, loam, and loamy sand.
It is worth noting that, besides the lack of literature regarding the influence of freeze-thaw cycles on the hydraulic conductivity of liner layers, there are no data available examining the long-term performance of liner layers under the effect of successive freeze-thaw cycles. All previous studies focus on the instantaneous measurements of hydraulic conductivity. This study is aimed at investigating the effect of freeze-thaw cycles on the hydraulic conductivity of sand-clay mixtures during the long period of their lifetime. The profile of changes in hydraulic conductivity for a material subjected to freezing temperatures is compared to other mixtures not subjected to freezing conditions.
2. Materials and Methods
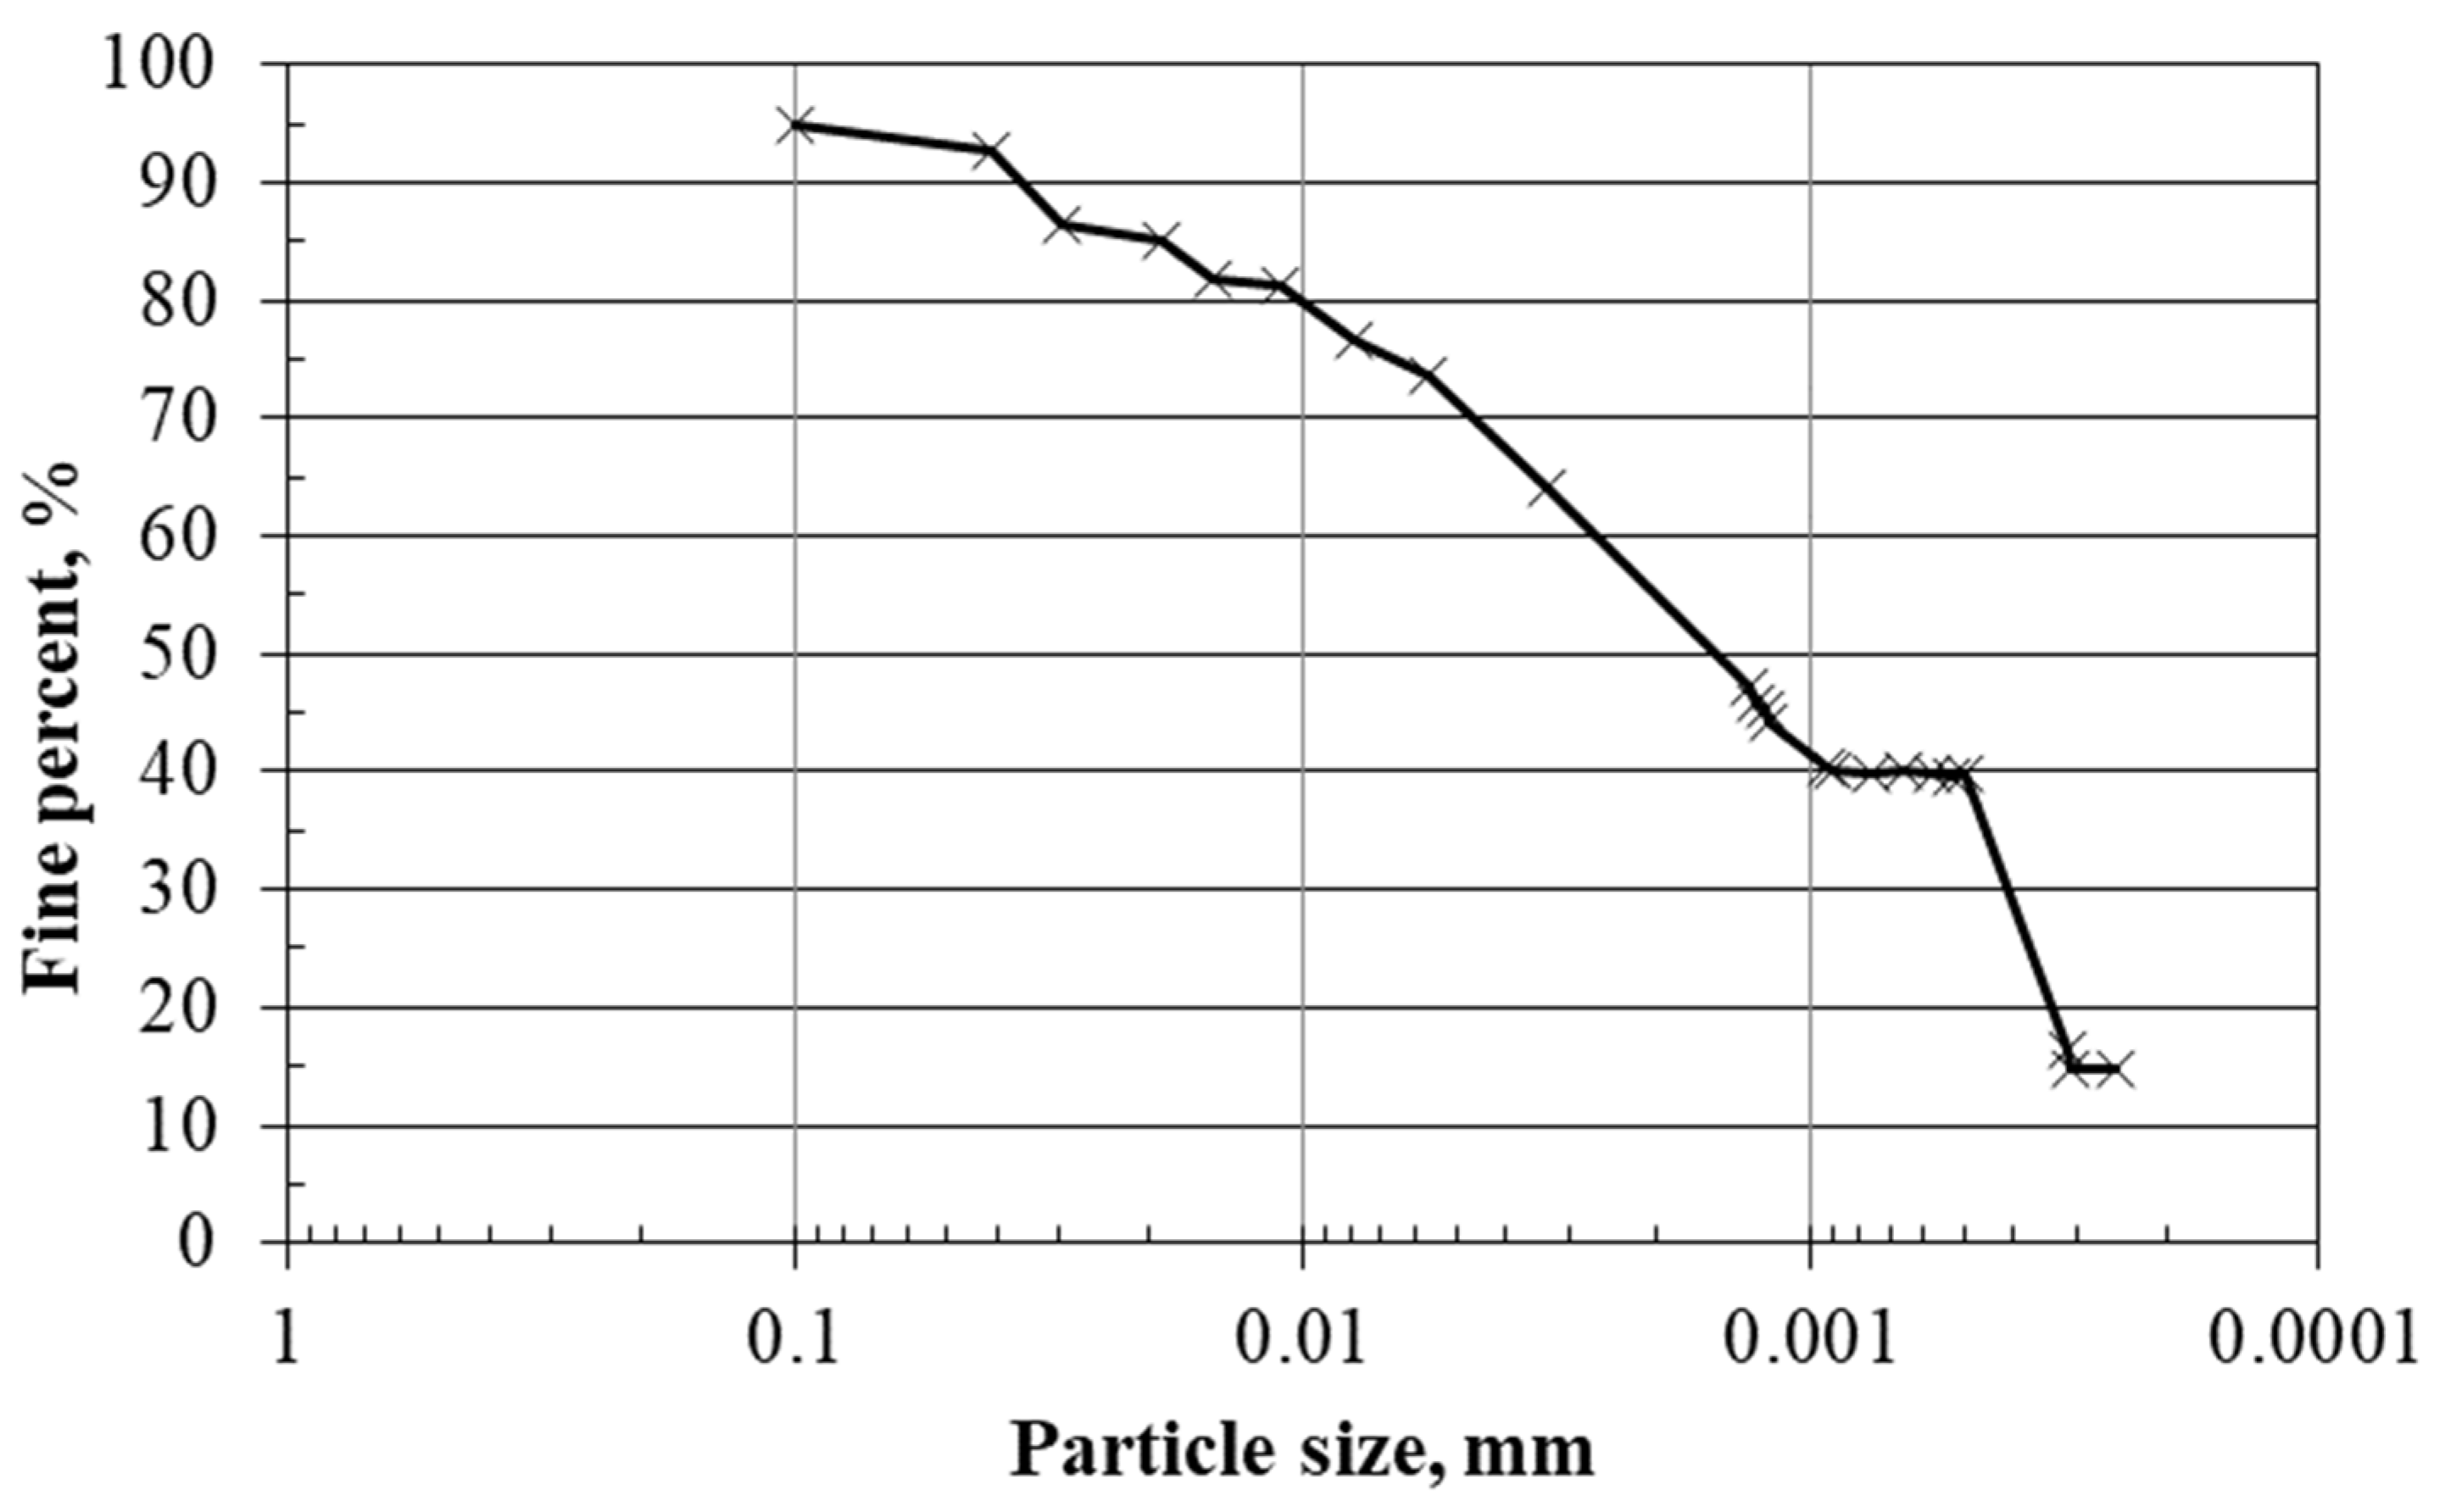
The first mixture considered in this study is a mixture of Al-Qatif clay and fine to medium poorly graded sand. Al-Qatif clay is a local expansive clay known for its high plasticity. Normally two parameters are used to describe the sand with respect to gradation. These are the coefficient of concavity and the uniformity coefficient. The two parameters were computed as 0.945 and 1.745, respectively. The sand is classified as SP (poorly graded sand) according to ASTM D2487 [25]. The montmorillonite content is in the range of 3% to 23% and the palygorskite is in the range of 5% to 33%, according to the study conducted by Rafi [26]. This clay is classified as highly plastic, indicating a high expansion potential [27,28,29]. The pH and cation exchange capacity for this expansive clay were measured at 7.6 and 55.80 meq/100 gm, respectively [28,30]. The particle size distribution for this clay as obtained from hydrometer analysis [31] is presented in Figure 1. Chittoori et al. [32] examined similar clay for the macro and micro pores using the volumetric particle size analysis. The second mixture consists of commercial bentonite mixed with the same sand as the first mixture.
The clay content recommended for the design of liners depends on the type of clay and its index properties. Dafalla [7] stated that 15% clay content from Al-Qatif clay when added to sand can achieve the normally required hydraulic conductivity, k, of (10−7 cm/s) generally specified for sand-clay liners. Hydraulic conductivity lower than this value can be adopted based on the intended type of barrier. The porosity of the sand used plays a significant role in achieving specific values. The use of 20% Al-Qatif clay is suggested for this study. The 15% commercial bentonite was tested for comparison purposes.
Two clay-sand mixtures were tested in this research: 20% Al-Qatif clay and 15% bentonite clay. Al-Qatif clay is highly plastic natural clay abundant in the eastern province of Saudi Arabia. The geotechnical characteristics of Al-Qatif clay are presented in Table 1. The main geotechnical properties of commercial bentonite include specific gravity, liquid limit, and plastic limit of 2.65, 480%, and 50%, respectively.
3. Experimental Program
3.1. Samples Preparation
The clay content used in this study was 20% highly plastic natural clay obtained from the Al-Qatif region in Saudi Arabia. This is referred to as Qatif clay. Another mixture was prepared using a 15% commercial bentonite dry weight of sand. The mixture was mellowed by a predetermined amount of water corresponding to optimum moisture content as per standard compaction curves ASTM D698 [33]. The identical specimens were compacted to the corresponding maximum dry density (as per compaction curve) in 80 mm diameter and 40 mm height using a hand-operated jack.
Part of these specimens was subjected to successive freeze-thaw cycles before commencing the hydraulic conductivity tests.
3.2. Freeze-Thaw Cycles
The first groups of the compacted specimens were tightly sealed using plastic wrap and then exposed to freeze-thaw cycles under closed system conditions. The specimens were firstly transferred to the freezing cabinet and put under a freeze for about 24 h. The controlled cabinet maintained the temperature at −25 °C ± 2 °C. This level of temperature has been advised by ASTM D560 [34] and had been used in previous studies (i.e., [35,36]). After the first freezing process, the specimens were placed in a humidity room for thawing at a temperature of +23 °C ± 1 °C. The humidity box was tightly sealed and provided with a hundred percent humidity. The whole process of freeze and thaw represents one freeze-thaw cycle; this procedure of freeze-thaw was repeated for successive cycles up to 15 freeze-thaw cycles.
At the end of the freeze-thaw cycles, the weight and water content for each sample were recorded. The variation in sample volume changes was determined by measuring their heights and diameters using a digital caliper. The reported changes in water content and volume were 1.89%, −1.16% and −0.31%, 2.52% for expansive clay and bentonite mixtures, respectively.
3.3. Hydraulic Conductivity Test
The routine classification tests were conducted on the clay-sand mixtures composed of Al-Qatif clay and bentonite. Applicable ASTM testing methods were used ASTM D 2487 [25] and ASTM D7928 [31]. The fine material (finer than 75 μm) in the mixtures was measured before conducting the hydraulic conductivity test and found to be 15.71% and 12.31% for mixtures with 20% expansive clay and 15% bentonite content. The values reported here represent the weight of fine material after wet sieving through sieve # 200 and oven drying.
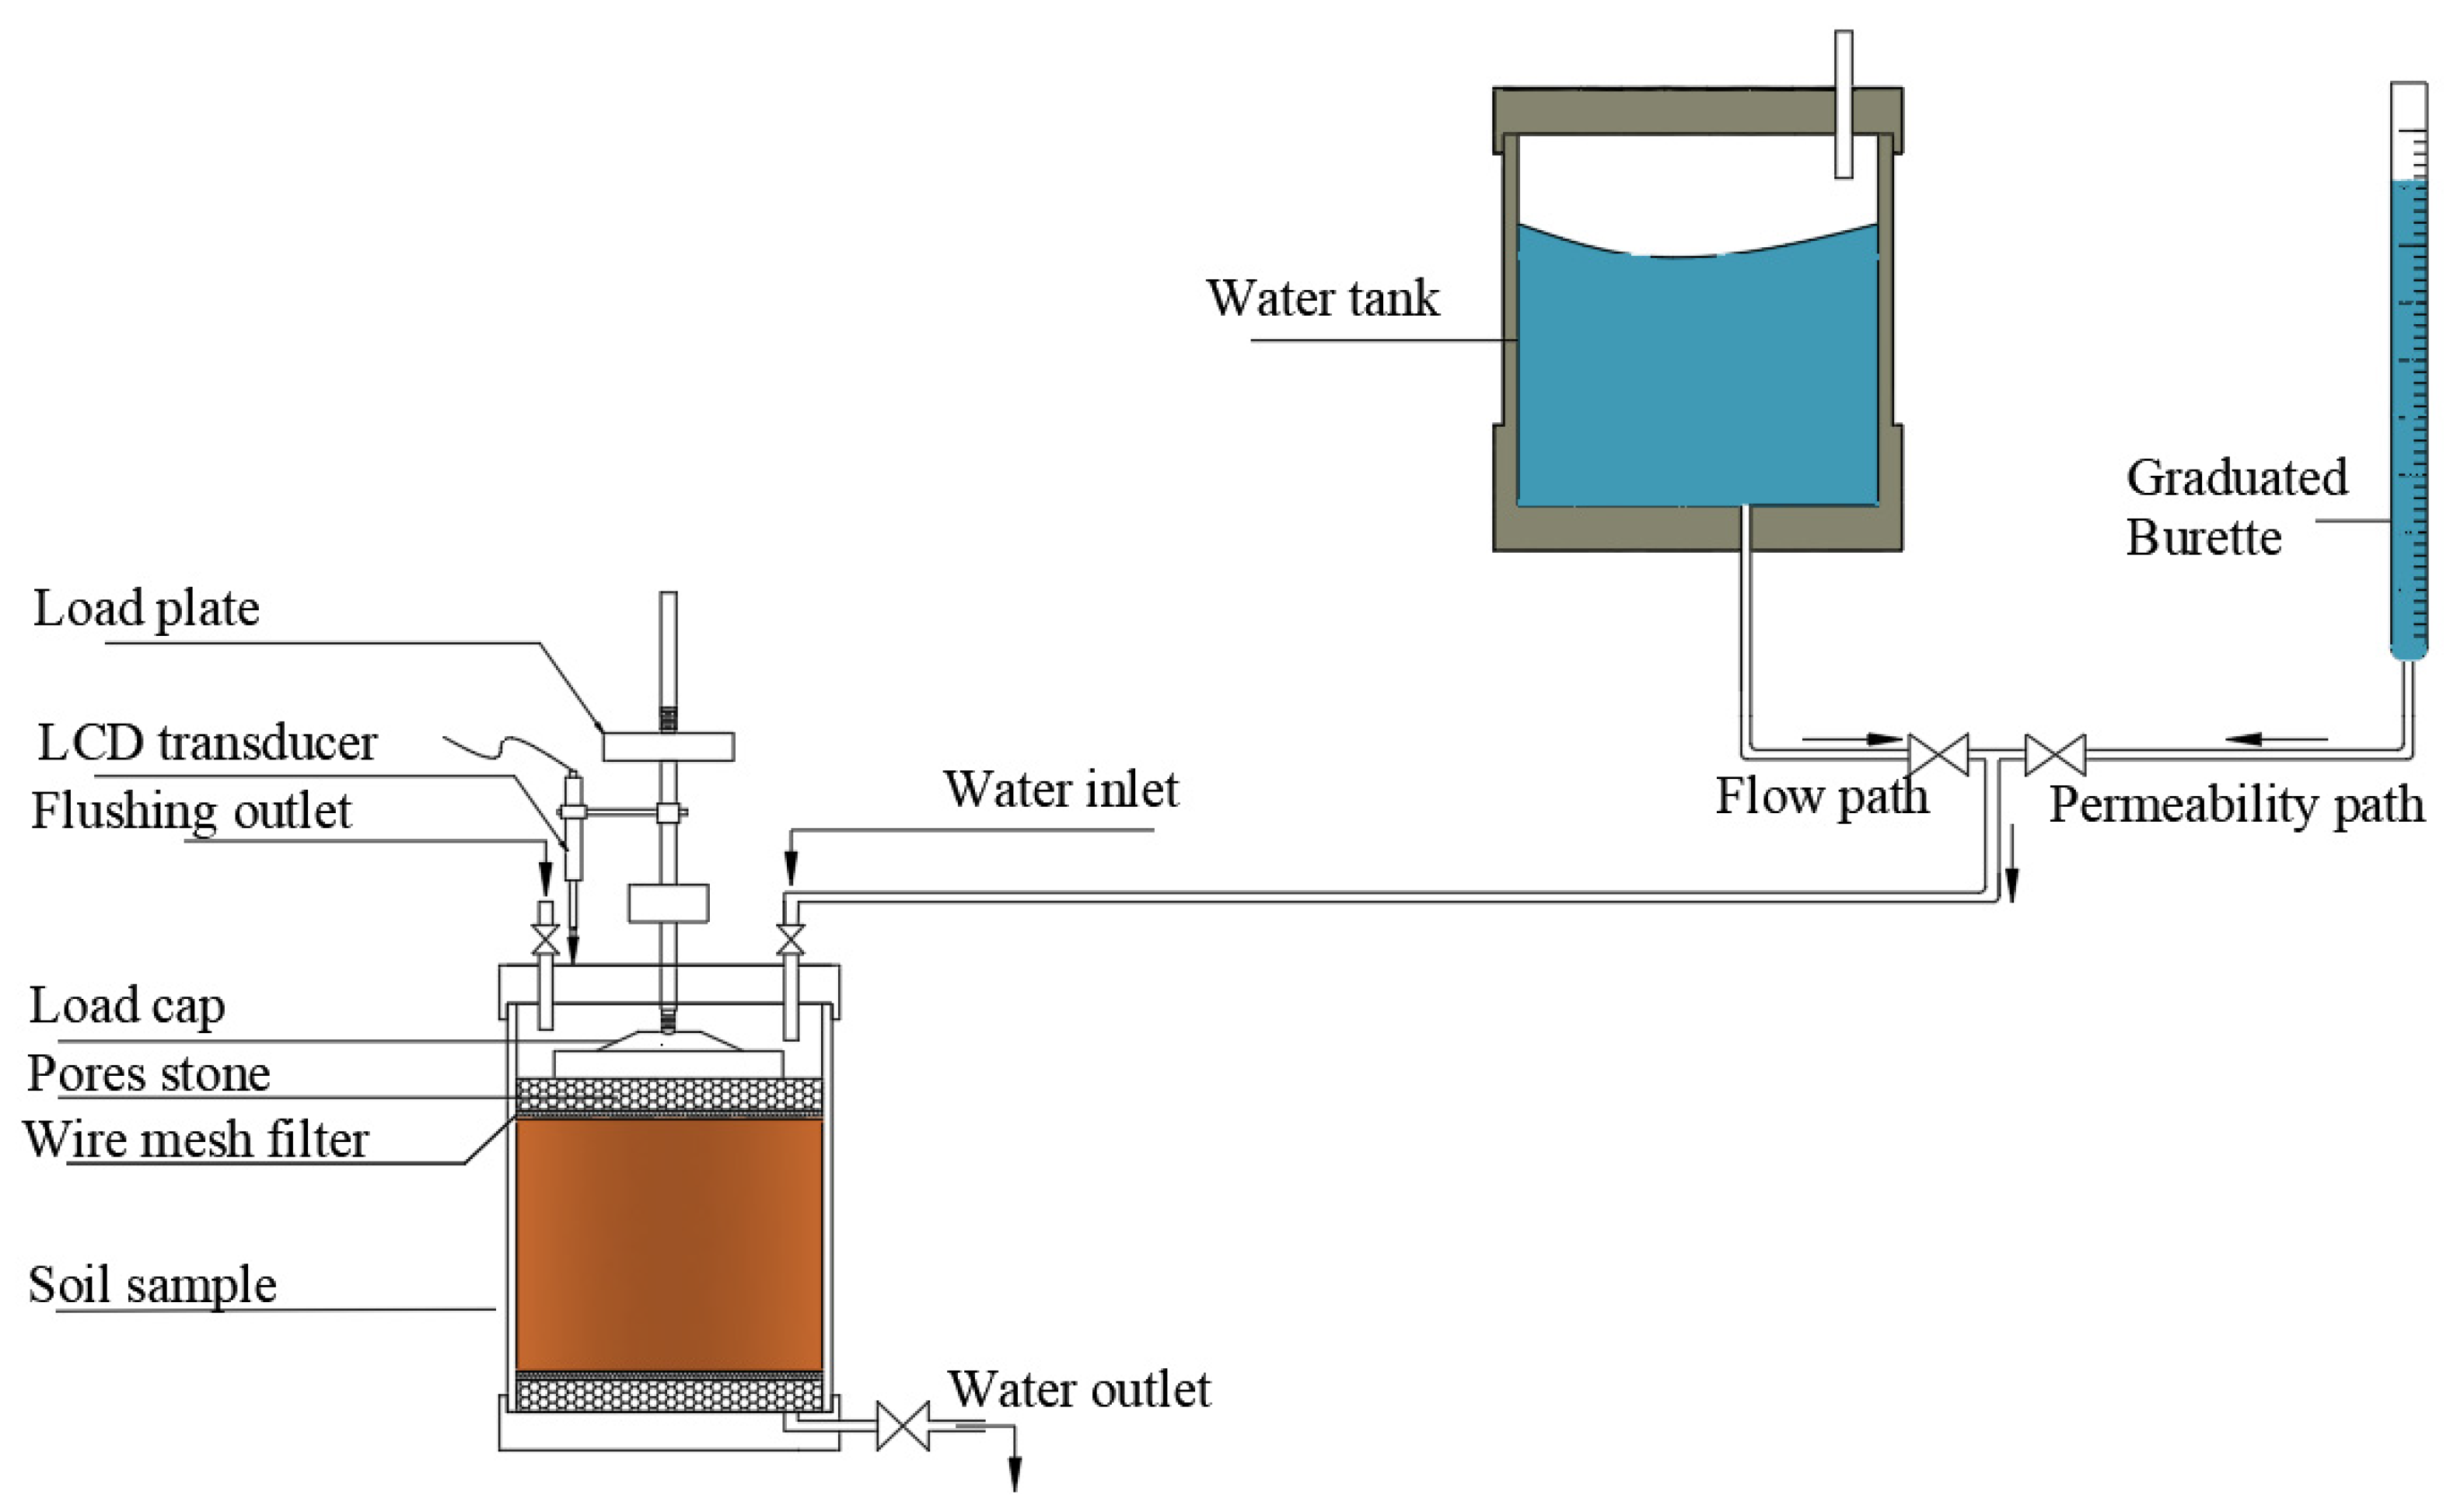
The falling head permeability tests were conducted at two stages for the compacted specimens; the first stage was for specimens before freeze-thaw cycles (No F-T) and the second stage of testing was for specimens subjected to freeze-thaw cycles (F-T cycles). The specimens are identical as mentioned before; all are of 80 mm diameter and 30 mm height (according to molding condition from compaction tests). Porous stones fitted with wire mesh were attached to the top and bottom of the specimens. The setup of the hydraulic conductivity test unit used is presented in Figure 3. The specimen inside the cell was attached to the setup of the hydraulic conductivity and flow paths. The load cap on the top of the soil specimen was connected to the LVDT transducer via the load arm. Inundation was carried out for a period of 5 to 7 days under a selected surcharge. For the natural clay, a 7 kPa and 30 kPa surcharge were considered while for the bentonite, a 7 kPa surcharge was applied. This is assumed to reduce the effect of the primary expansion. Distilled water was used in the inundation. The vertical displacement is measured using an LVDT transducer attached to a data logger. The stability of the reading in the transducer recording vertical displacement over a full day (24 h) is observed before the test is started. The falling-head test procedure was performed in accordance with the ASTM D5856 [37] standard. The cell was provided with a flushing outlet to ensure no air bubbles existed in the path of the permeation or flow. For this study when four (4) successive measurements are found within a small variation, the flow is considered steady. On establishing a steady flow, a continuous flow is then allowed to pass through the sample through the elevated tank. The time and the quantity of the outflow water were monitored during the entire test period, then, the cumulative flow was computed and presented. The hydraulic conductivity measurements were conducted daily or three times per day during the discharge or flow. This is enabled by observing the level of the graduated burette attached to the outflow level of the tank. This process is repeated daily for an extended period of time. The testing period varied from 150 to 200 days.
The content of fines (material finer than 75-μm) was investigated and reported prior to the test and after the completion of the test. This will indicate if a considerable amount of fines is lost during the test. Fine content was determined following ASTM D 1140 [38].
The temperature variations during the testing period were continually traced using self-recording sensors. The influence of temperature is not investigated as all tests were conducted at room temperature.
3.4. Soil Water Retention Curve (SWRC)
Soil water retention curves (SWRC) for the mixtures were performed using the axis translation technique [39] and filter paper method [40]. The details and procedures regarding the determination of SWRC were available on Al-Mahbashi 2014, [28] and Al-Mahbashi et al. [29]. These curves are essential in understanding the holding capacity and reflecting the distribution of particles on both micro and macro scale.
4. Results and Discussion
The hydraulic conductivity of the mixtures (before subjecting to F-T cycles) was tested in the first stage, for a period that continued to more than 200 days. This stage covered mixtures of 20% Al-Qatif clay, and 15% bentonite clay. The Al-Qatif clay was tested under two surcharge stress levels: 7 kPa and 30 kPa, while the commercial bentonite was tested under 7 kPa. In the second stage of the testing program, samples identical to those tested in stage one were subjected to freeze-thaw cycles as described in the section of the experimental program. For each stage, the cumulative flow during the entire testing period has been presented in association with measured hydraulic conductivity.
Al-Mahbashi and Dafalla, [9] presented the variations in the hydraulic conductivity during the first stage. Rise and fall of the hydraulic conductivity were observed repeatedly for all mixtures for the first period and continued in less frequency beyond that. The stage 2 testing period was conducted over a period of 160 days for samples initially subjected to freeze and thaw. The main parameters examined included the hydraulic conductivity, the mass of fines, and the applied stresses.
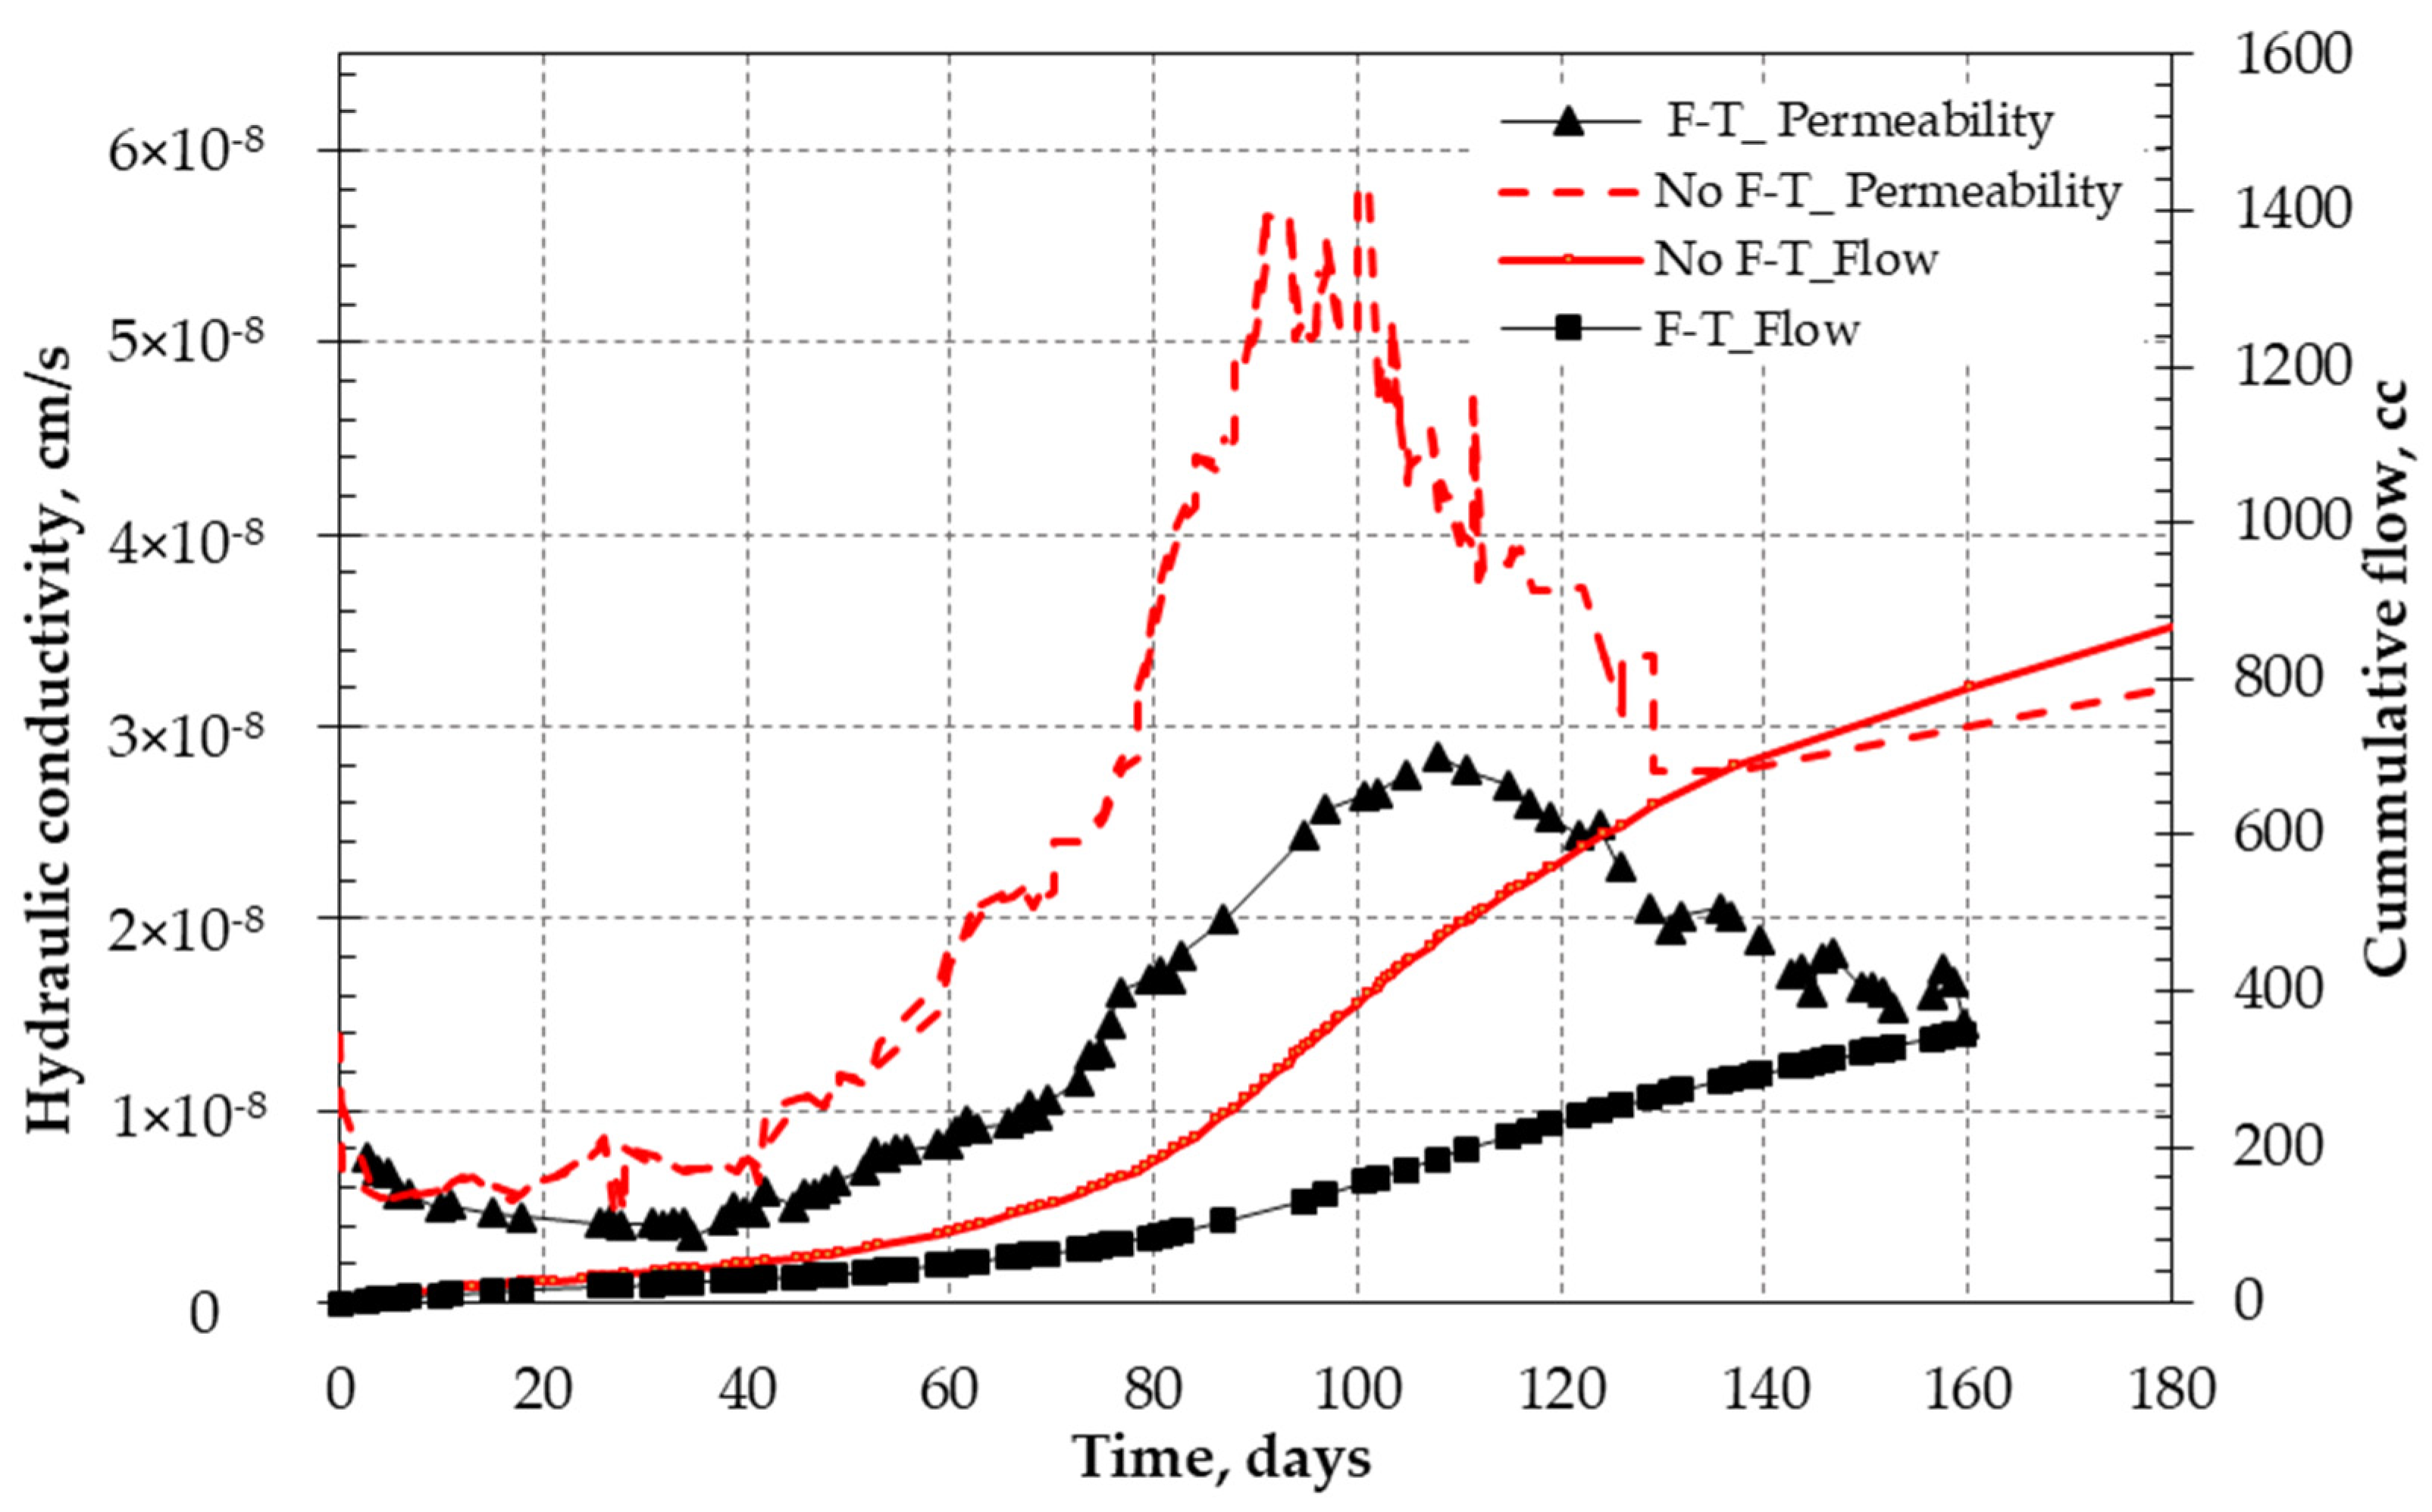
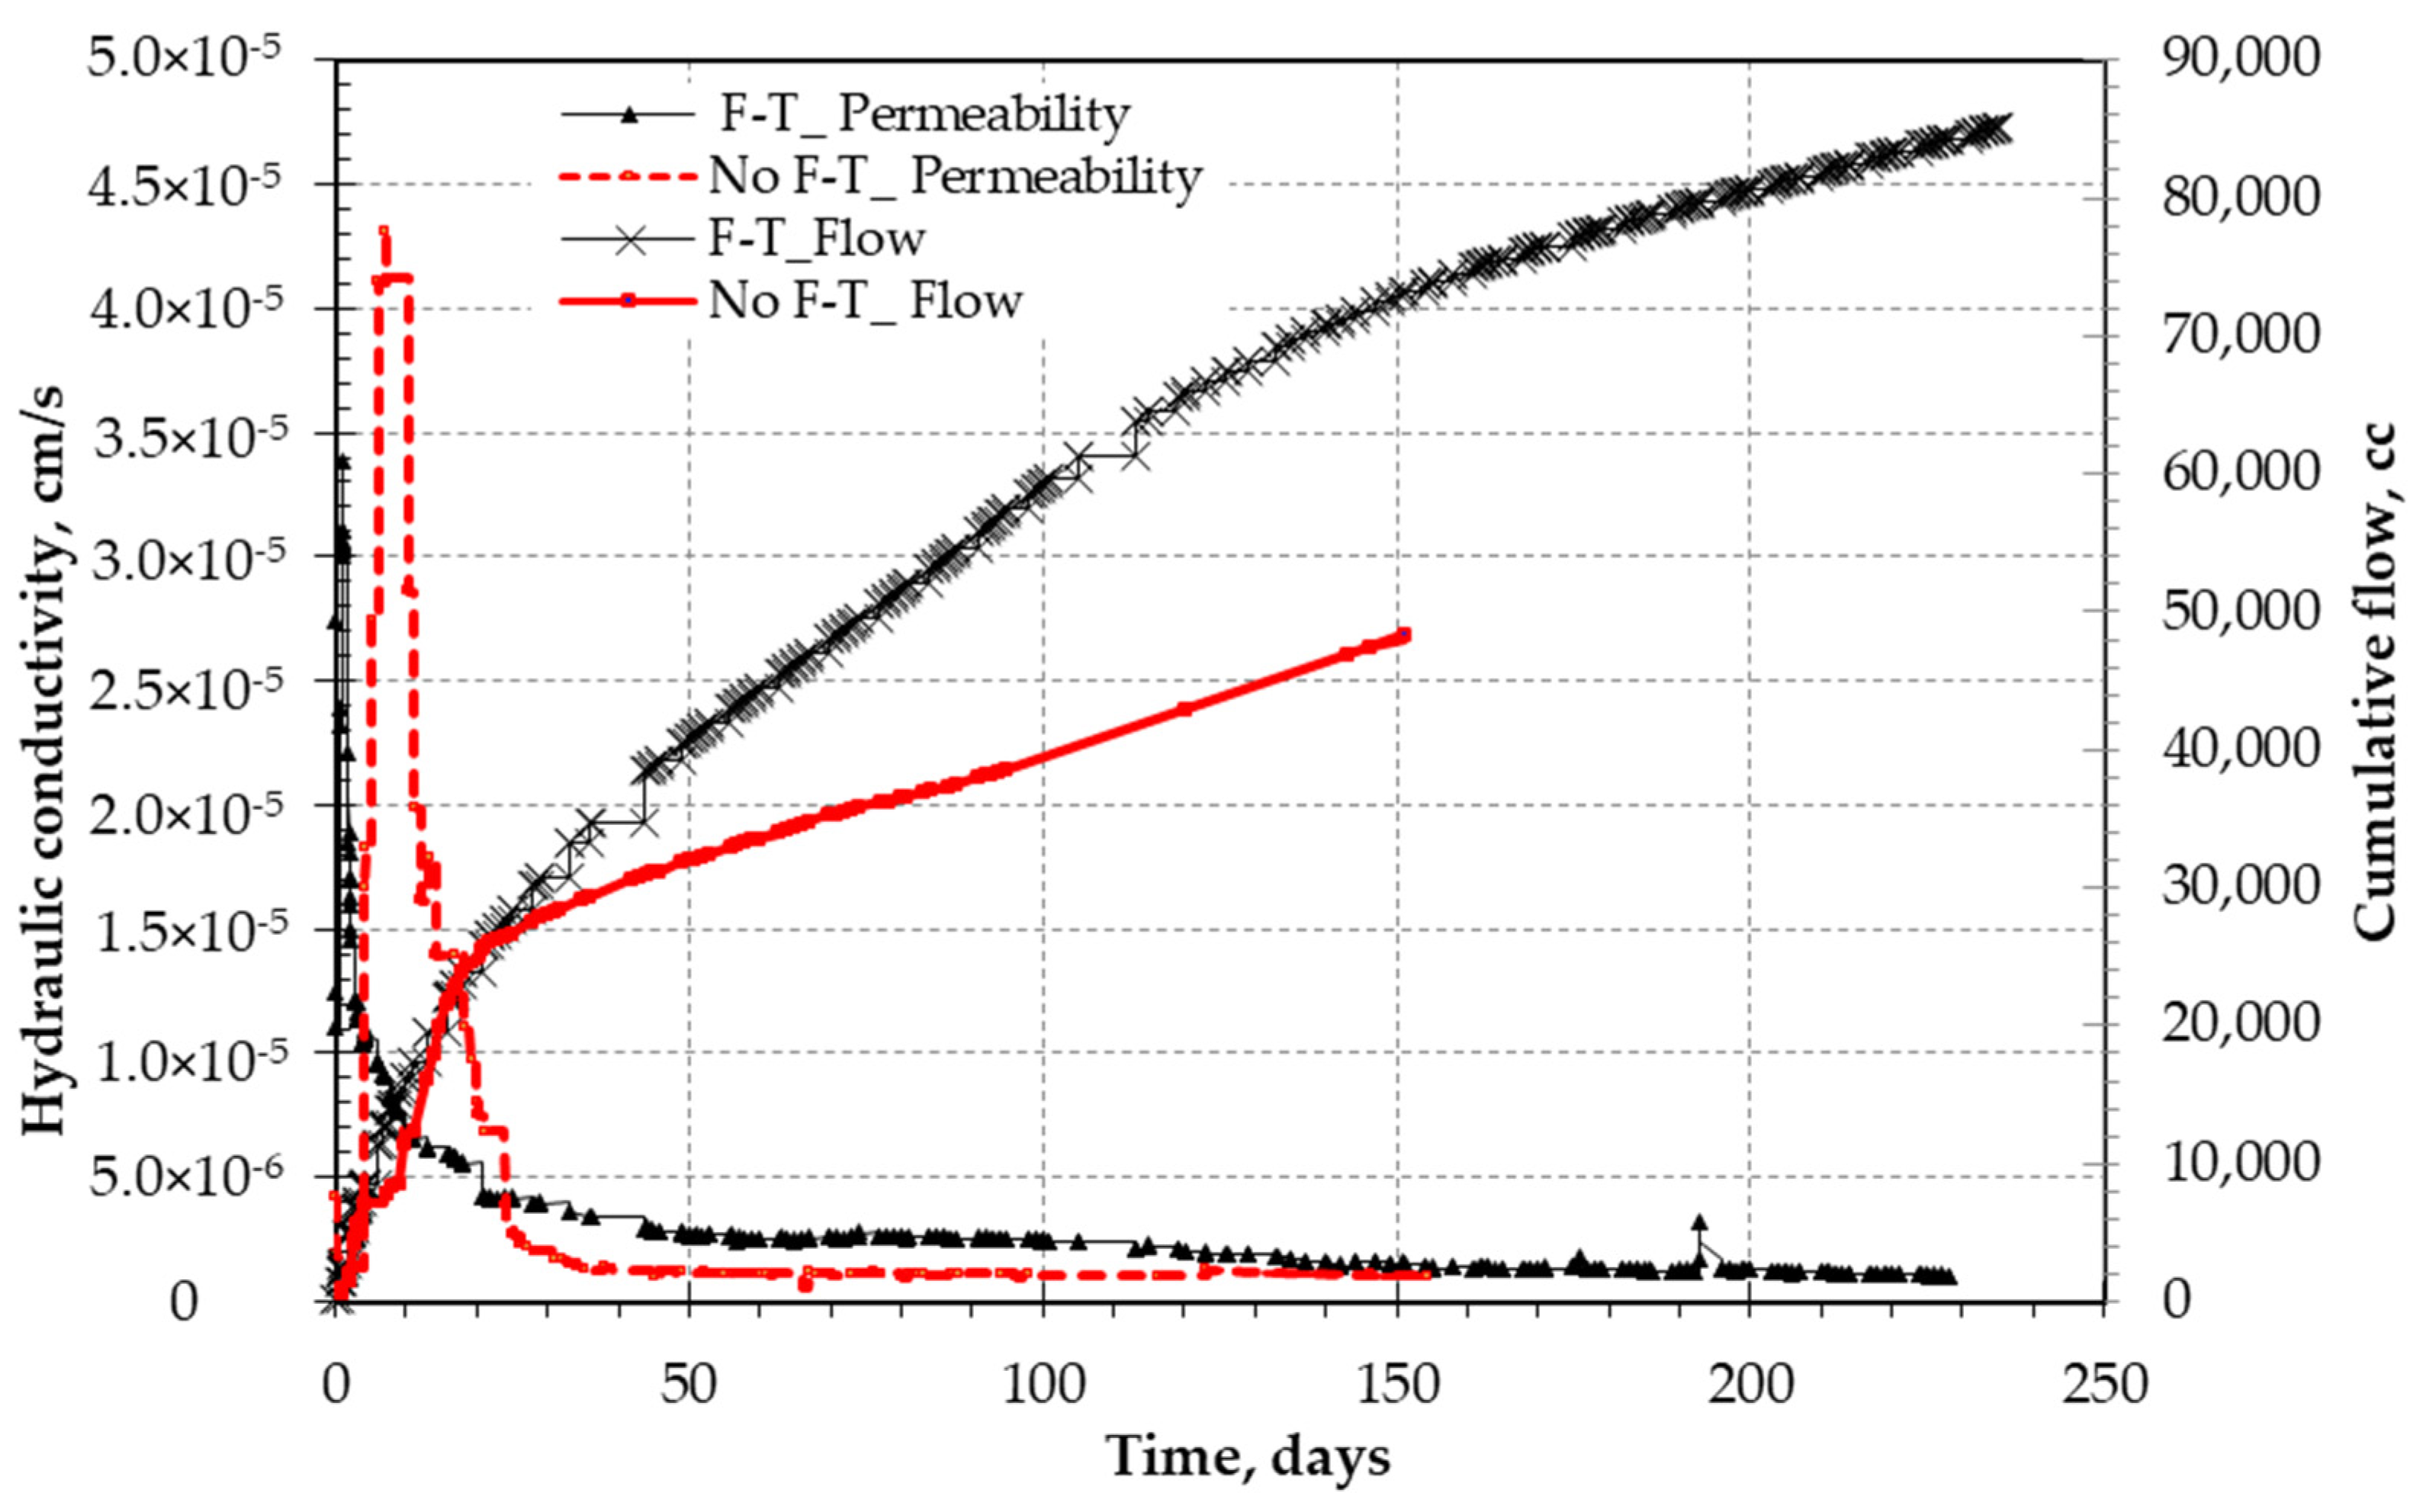
The specimens of 15% bentonite mix subjected to freeze-thaw cycles (stage 2) showed a similar continuous drop in the hydraulic conductivity (as for stage 1, no F-T) and reached the peak beyond 100 days (Figure 4), while the 20% Al-Qatif clay content under low applied vertical stress showed a continuous drop within the first 20 days (Figure 5). The drop in the hydraulic conductivity can be explained by the collapse of the skeleton holding particles together and the changes in the fabric structure. This is likely due to the loss of fine clay particles caused by continuous flow. When the clay paste within the voids swells, cotton-like soft flakes are formed. These light flakes are easily washed out with the flowing water. Due to the low hydraulic conductivity of the clay, moisture introduction into soil takes time and further swelling will initiate when inner clay particles are inundated. When light flakes are washed a new cycle of swelling occurs. This phenomenon causes an increase and decrease in hydraulic conductivity. The overall trend is a continuous drop in hydraulic conductivity. For the specimens subjected to cycles of freeze-thaw, it can be noted that lower values of hydraulic conductivity are achieved. The trend and profile of time versus k is similar with a minor shift of the maximum k value.
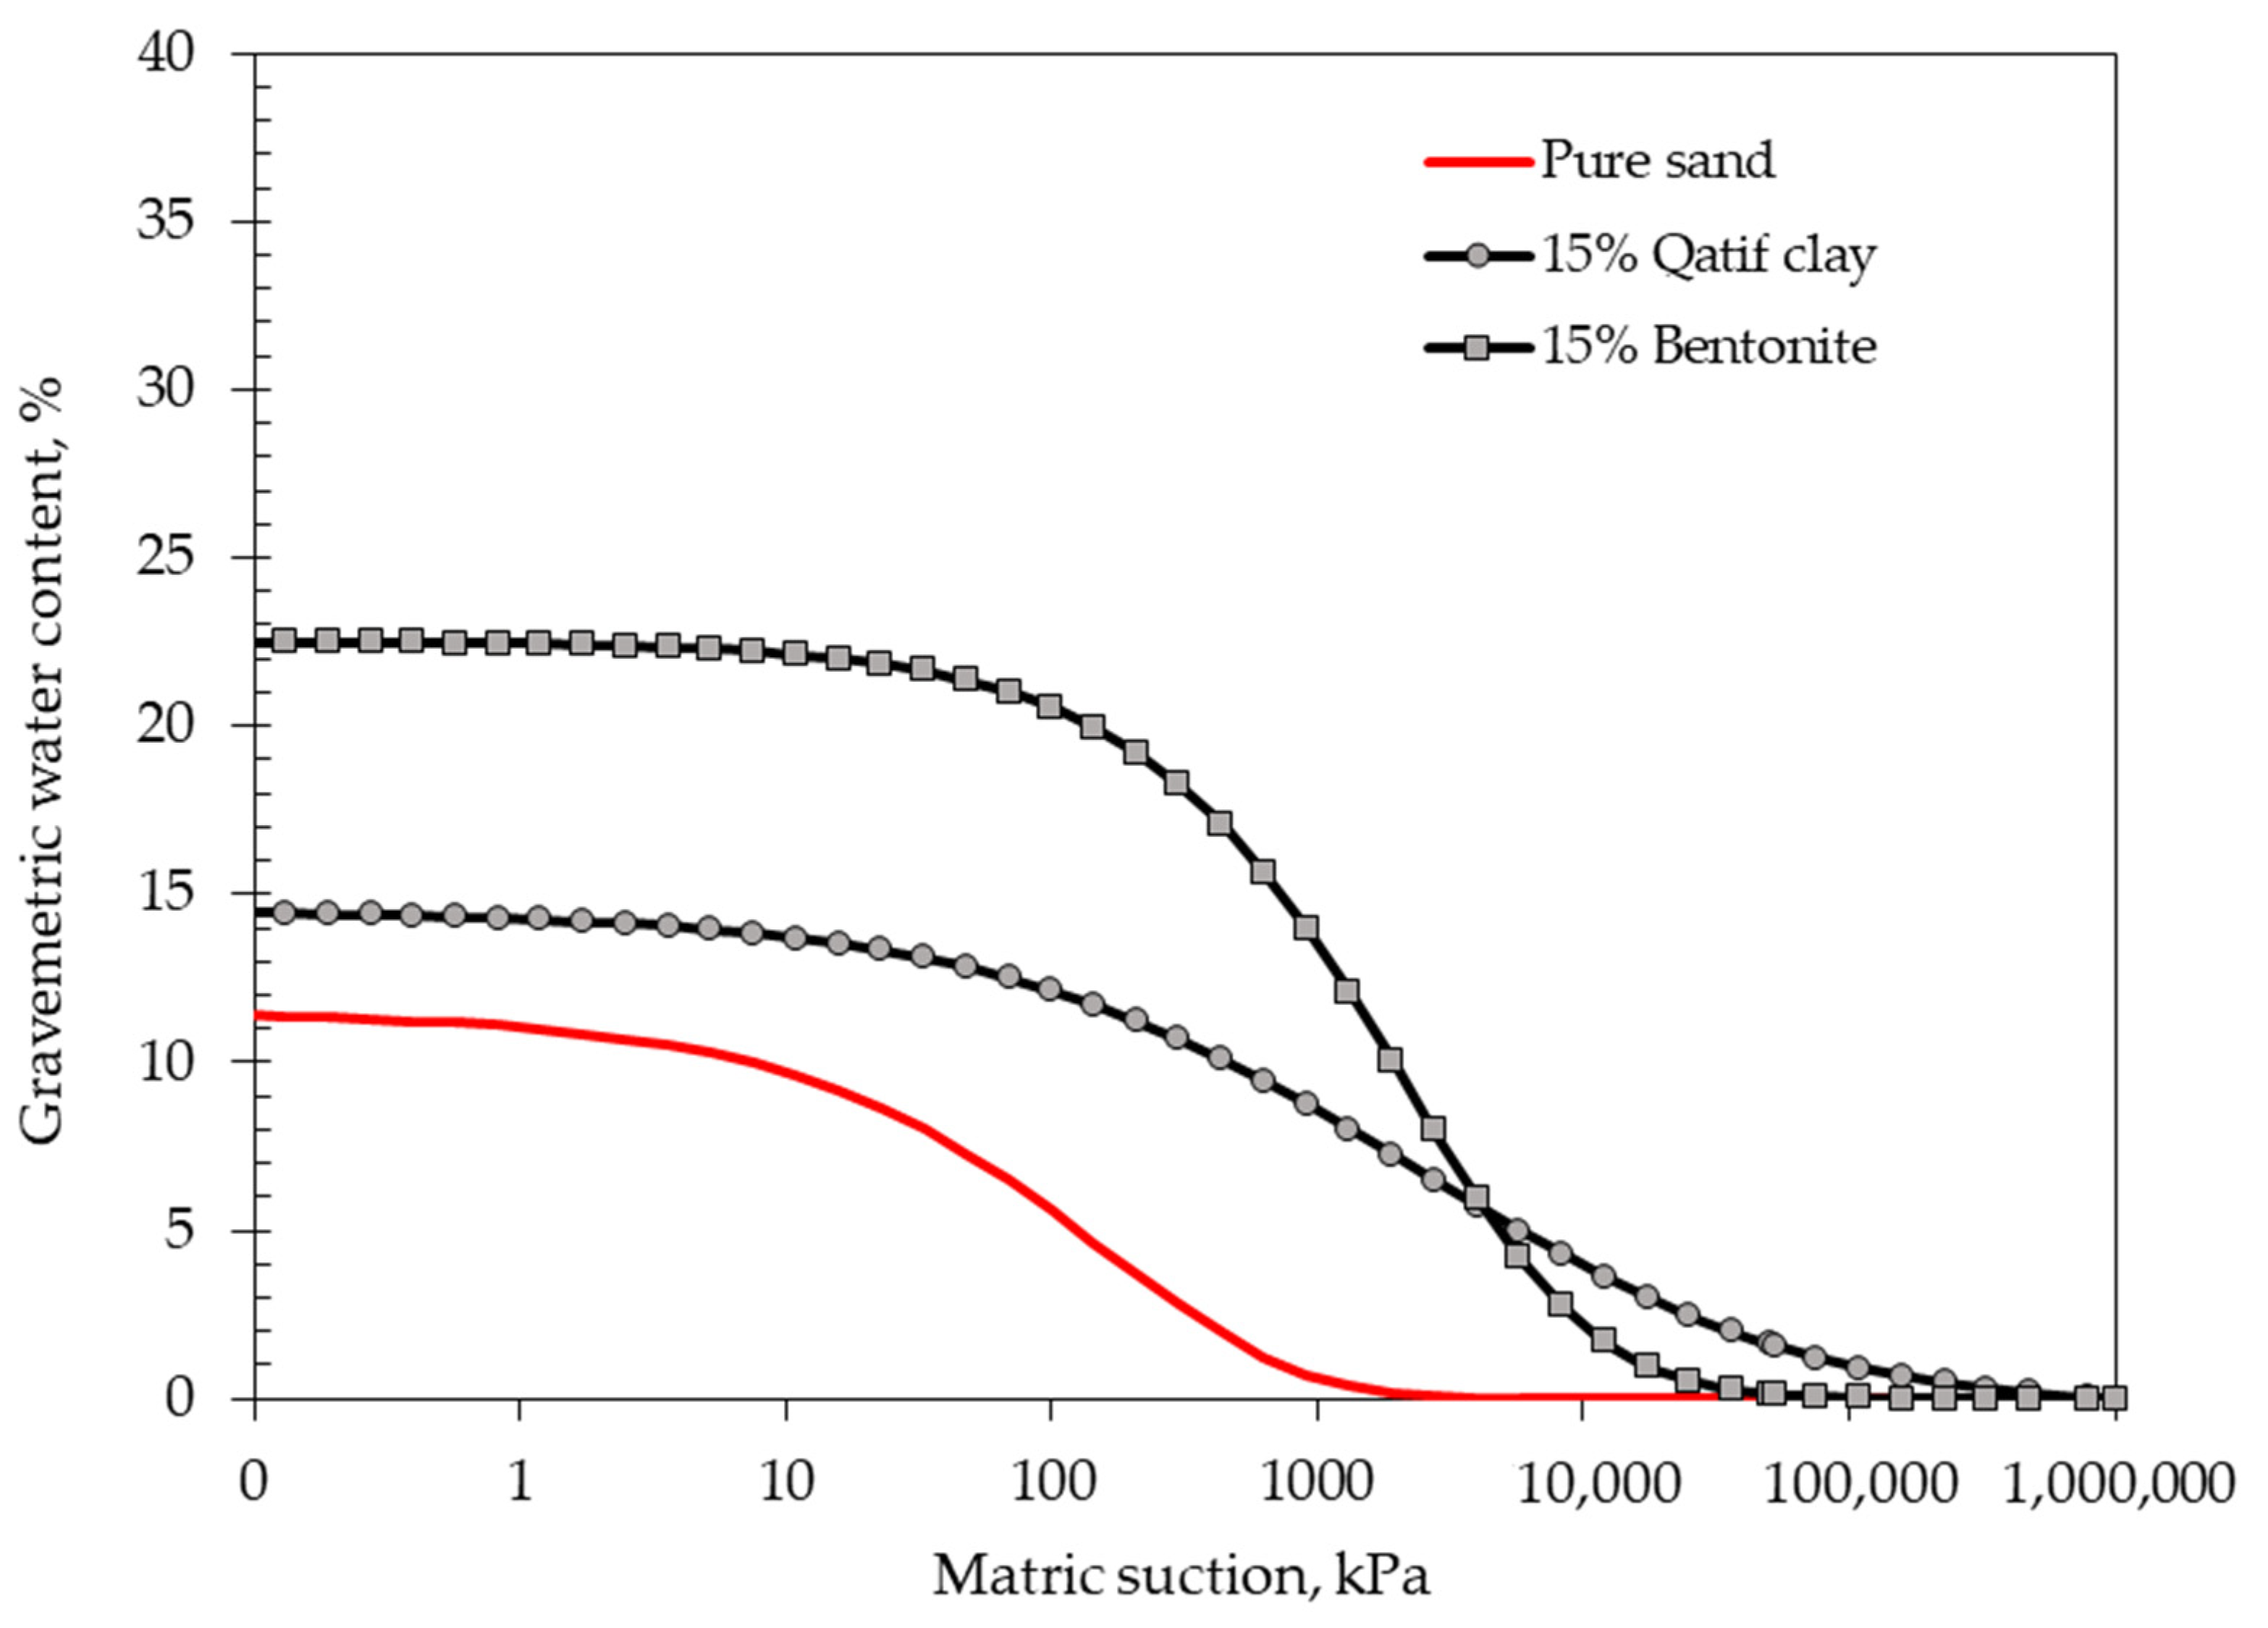
The drop in the hydraulic conductivity value (k) for samples not subjected to the freeze-thaw process was observed from 5.8 × 10⁻⁸ to 3.0 × 10⁻⁸ over the period from 100 days to 160 days for the mixture with 15% bentonite clay. In the case of freeze-thaw condition, the drop is reported from 2.8 × 10⁻⁸ to 1.2 × 10⁻⁸ (Figure 4). This can be estimated as half the k value. The drop in the hydraulic conductivity value (k) for the mixture including 20% natural Al-Qatif clay under a low surcharge of 7 kPa (Figure 5), was found within a small range of 2.5 × 10⁻⁶ to 1.5 × 10⁻⁶ in a period of 25 to 150 days. When comparing this result to the samples subjected to freeze-thaw cycles we can observe that the freeze-thaw indicates a variant effect and shows a minor (Figure 5) to major (Figure 4) change in the hydraulic conductivity trend. The freeze-thaw cycles can cause structural disturbance or disperse the clay, sealing the pores and voids within the clay. Expansive clays with significant amounts of montmorillonite and smectite minerals were found the most affected by freeze-thaw cycles. It seems that the effect of the freeze-thaw cycle is linked to the level of plasticity and rate of expansiveness. The natural clay is less expensive than the bentonite and the changes in expansion and contraction are less than that of the bentonite. This in turn could be deduced from the higher retention capacity of bentonite, soil water retention curves of used mixtures, and the base material of sand (Figure 6). These curves illustrate the retention capacity of the materials and reflect their pore size distribution and porosity, depending on texture and structure [41,42]. The higher water content values at the state of saturation (saturated water content) indicate higher total porosities and show further effects of the cracks induced due to the freeze-thaw cycles [17]. The freeze and thaw cycles can change the micro and macro pore structure and fabric, and this may affect the SWCC. The scope of study of this work did not include this work and can be presented in future studies.
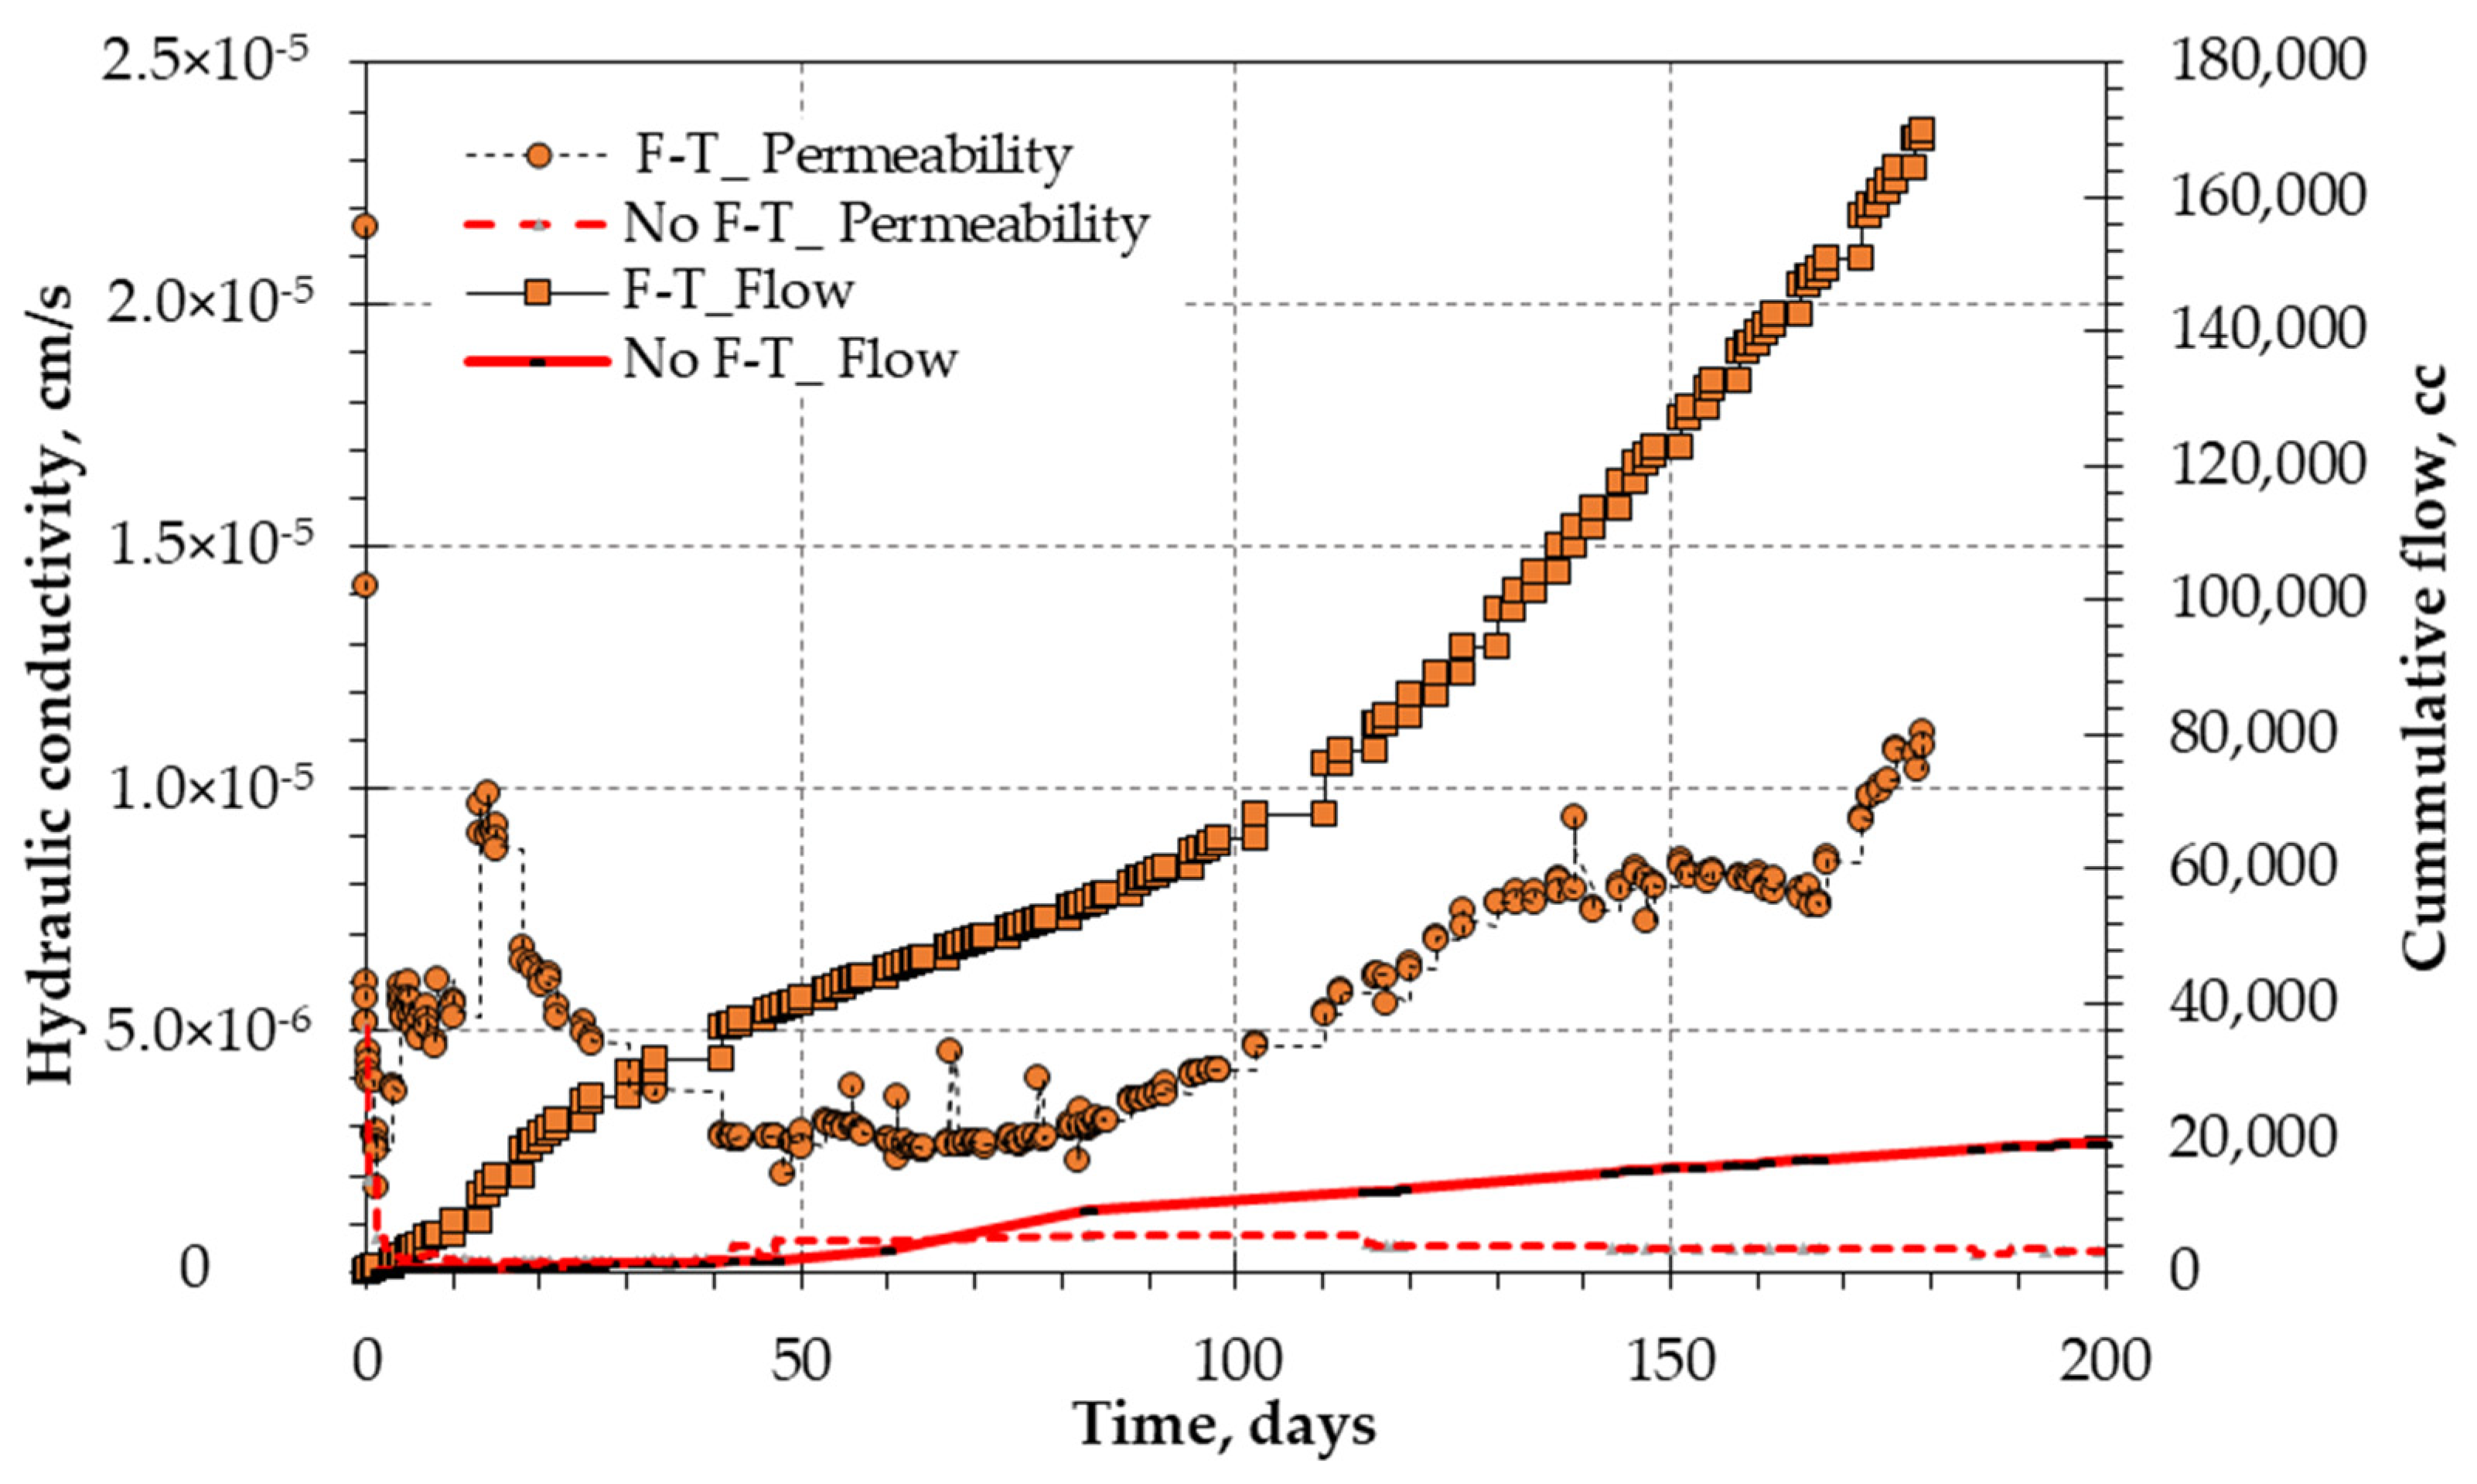
The drop in the hydraulic conductivity value (k) from 7.5 × 10⁻⁷ to 2.8 × 10⁻⁷ is reported for the time from 100 days to 200 days for the mixture with 20% Al-Qatif clay subjected to a vertical stress of 30 kPa (Figure 7). The effect of freeze-thaw cycles under this surcharge load is notable; the hydraulic conductivity has been increased several times indicating a fluctuation behavior. The applied load squeezes soil pores and fines may become easier to wash throughout large pores.
The continuous reduction in the hydraulic conductivity will normally occur at a later stage for all mixtures whether subjected to freeze-thaw cycles or not. The reduction is due to the settlement and compression in the sand-clay mixture. The increase and decrease in the initial period depend on the mineralogy of the clay.
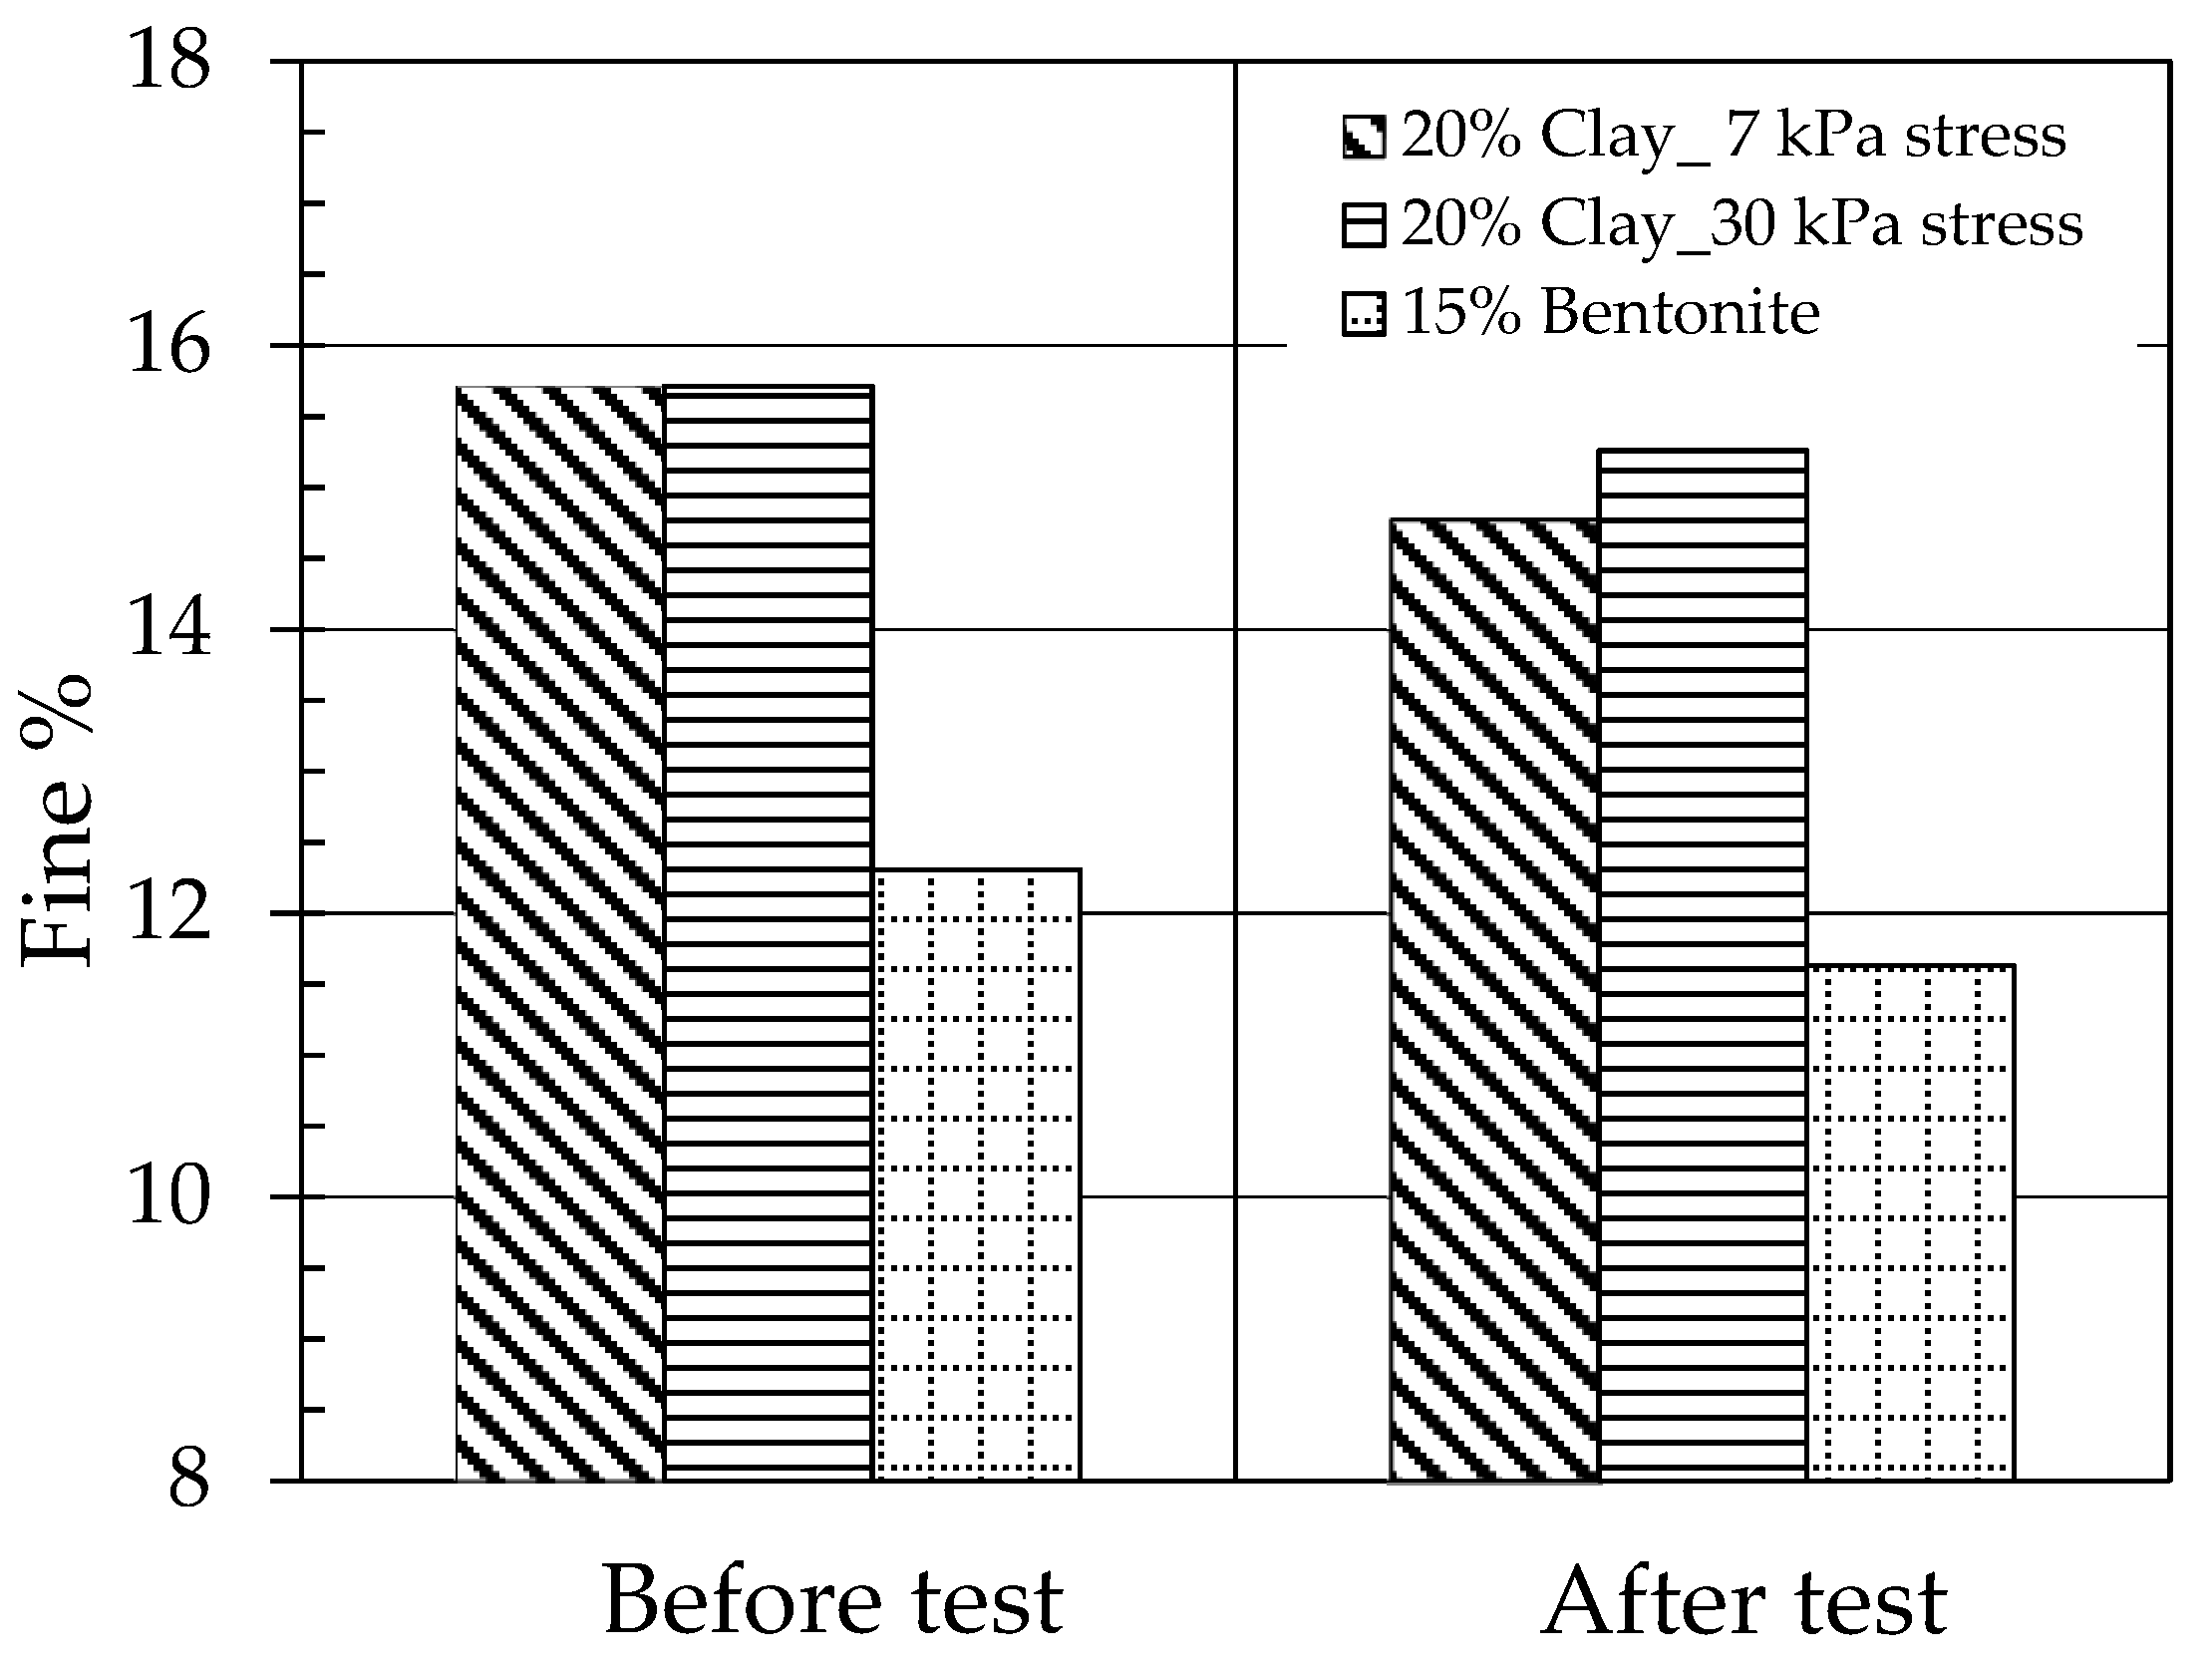
The migration of the fine material during the process of permeation is of significance in the determination of hydraulic conductivity. Figure 8 shows the fine percent before and after extended time hydraulic conductivity tests; three mixtures were investigated: 15% bentonite under surcharge stress of 7 kPa, 20% Al-Qatif clay under vertical stress of 7 kPa, and 20% Al-Qatif clay under a surcharge of 30 kPa. The results indicated a reduction in the fine percent at the end of the test. The mixture of 20% Al-Qatif clay under low surcharge (7 kPa) showed a high reduction in fines percent while the mixtures of 15% bentonite and 20% Al-Qatif clay under a surcharge of 30 kPa showed a small reduction. It can be stated that for specimens tested without a freeze-thaw effect, the loss of fines will be lower for clays of higher plasticity or when subjected to higher surcharge stress.
When the vertical applied stress is increased the hydraulic conductivity is decreased as voids will compress. The tunnels or water passways will constrict, thus retarding water flow. The higher stresses can consolidate and cause the clay fabric to change. Comparing Figure 5 and Figure 7 for the 150 days’ measurements, the hydraulic conductivity is increased by more than two orders of magnitude (5 × 10⁻⁷ to 0.2 × 10⁻⁵). The application of vertical stress of 30 kPa was found to stabilize the constituents of the mixtures and reduce the loss of fines in cases of no F-T action, while the notable drop and repeated waves have been noticed for specimens subjected to multiple F-T cycles.
5. Conclusions
This study investigated the effect of successive freeze-thaw cycles on the long-run performance of liner layers and the following points can be concluded.
- The performance of a liner could be measured by assessing the variations of hydraulic conductivity of clay-sand liners under continuous water flow. Freeze and thaw cycles were found to increase the hydraulic conductivity. The reduction in the hydraulic conductivity was found due to settlement and compression in the sand-clay mixture.
- The history of freeze and thaw, the fine content, and the vertical stress applied were found to be the main parameters that influence the hydraulic conductivity.
- The loss of fines is found to be lower for clays with higher plasticity. It is found that the mineralogy and type of clay do have a great influence on hydraulic conductivity in general.
- The liners subjected to freeze-thaw cycles indicated better performance for highly plastic clays. This can be explained due to stabilization caused by successive cycles of freezing and thawing. The natural clay soil used did not show a reduction in the hydraulic conductivity as a result of the freeze-thaw process.
- The hydraulic conductivity can be reduced by more than two orders of magnitude (5 × 10⁻⁷ to 0.2 × 10⁻⁵) when applied stresses on Al-Qatif clay-sand mixture are increased from 7 kPa to 30 kPa.
Author Contributions
Conceptualization, A.M.A.-M.; methodology, A.M.A.-M.; software, A.M.A.-M.; validation, A.M.A.-M.; formal analysis, A.M.A.-M.; investigation, A.M.A.-M.; resources, A.M.A.-M. and M.D.; data curation, A.M.A.-M.; writing—original draft preparation, M.D. and A.M.A.-M.; writing—review and editing, A.M.A.-M. and M.D.; visualization, A.M.A.-M. and M.D.; supervision, M.A.-S.; project administration, A.M.A.-M. and M.A.-S.; funding acquisition, M.A.-S. All authors have read and agreed to the published version of the manuscript.
Funding
This research was funded by [King Saud University, Deanship of Scientific Research through the Vice Deanship of Scientific Research Chairs, Research Chair of Bugshan Research Chair in Expansive Soils].
Data Availability Statement
All data, models, and code generated or used during the study appear in the submitted article.
Acknowledgments
The authors extend their appreciation to the Deanship of Scientific Research, King Saud University, for funding this research through the Vice Deanship of Scientific Research Chairs, Research Chair of Bugshan Research Chair in Expansive Soils.
Conflicts of Interest
The authors declare that they have no conflict of interest.
References
- Daniel, D.E. Predicting hydraulic conductivity of clay liners. J. Geotech. Eng. Div. ASCE 1984, 110, 285–300. [Google Scholar] [CrossRef]
- Chapuis, R.P. Sand–bentonite liners: Predicting permeability from laboratory tests. Can. Geotech. J. 1990, 27, 47–57. [Google Scholar] [CrossRef]
- Kenney, T.C.; Van Veen, W.A.; Swallow, M.A.; Sungaila, M.A. Hydraulic conductivity of compacted bentonite-sand mixture. Can. Geotech. J. 1992, 29, 364–374. [Google Scholar] [CrossRef]
- Sällfors, G.; Öberg-Högsta, A.L. Determination of hydraulic conductivity of sand-bentonite mixtures for engineering purposes. Geotech. Geol. Eng. 2002, 20, 65–80. [Google Scholar] [CrossRef]
- Cui, Y.J.; Tang, A.M.; Loiseau, C.; Delage, P. Determining the unsaturated hydraulic conductivity of a compacted sand-bentonite mixture under constant-volume and free-swell conditions. Phys. Chem. Earth A/B/C 2008, 33 (Suppl. 1), 462–471. [Google Scholar] [CrossRef] [Green Version]
- Obrike, S.E.; Osadebe, C.C.; Sam, O.S. Geotechnical analysis of two Nigerian soils for use as clay liners. Bull. Eng. Geol. Environ. 2009, 68, 417–419. [Google Scholar] [CrossRef]
- Dafalla, M.A. Efficiency of Sand Clay Liners in Controlling Subsurface Water Flow. In Engineering Geology for Society and Territory-Volume 3: River Basins, Reservoir Sedimentation and Water Resources; Springer: Berlin/Heidelberg, Germany, 2014; pp. 497–499. [Google Scholar]
- Al-Mahbashi, A.M.; Dafalla, M.; Shaker, A.; Al-Shamrani, M.A. Sustainable and Stable Clay Sand Liners over Time. Sustainability 2021, 13, 7840. [Google Scholar] [CrossRef]
- Al-Mahbashi, A.M.; Dafalla, M. Impact of placement and field conditions on hydraulic conductivity and lifetime of liners. J. King Saud Univ. Sci. 2021, 33, 101410. [Google Scholar] [CrossRef]
- Abdolahzadeh, A.M.; Lacroix Vachon, B.; Cabral, A.R. Evaluation of the effectiveness of a cover with capillary barrier effect to control percolation into a waste disposal facility. Can. Geotech. J. 2011, 48, 996–1009. [Google Scholar] [CrossRef]
- Belkhatir, M.; Schanz, T.; Arab, A. Effect of fines content and void ratio on the saturated hydraulic conductivity and undrained shear strength of sand–silt mixtures. Environ. Earth Sci. 2013, 70, 2469–2479. [Google Scholar] [CrossRef]
- Wang, Q.; Cui, Y.; Tang, A.M.; Barnichon, J.; Saba, S.; Ye, W. Hydraulic conductivity and microstructure changes of compacted bentonite/sand mixture during hydration. Eng. Geol. 2013, 164, 67–76. [Google Scholar] [CrossRef]
- Yilmaz, F.; Fidan, D. Influence of freeze-thaw on strength of clayey soil stabilized with lime and perlite. Geomech. Eng. 2018, 14, 301–306. [Google Scholar] [CrossRef]
- Baldovino, J.D.J.A.; dos Santos Izzo, R.L.; Rose, J.L. Effects of freeze-thaw cycles and porosity/cement index on durability, strength and capillary rise of a stabilized silty soil under optimal compaction conditions. Geotech. Geol. Eng. 2021, 39, 481–498. [Google Scholar] [CrossRef]
- Othman, M.A.; Benson, C.H. Effect of freeze-thaw on the hydraulic conductivity of three compacted clays from Wisconsin. Transp. Res. Rec. 1993, 1369, 118–125. [Google Scholar]
- Yıldız, M.; Soğancı, A.S. Effect of freezing and thawing on strength and permeability of lime-stabilized clays. Sci. Iran. 2012, 19, 1013–1017. [Google Scholar] [CrossRef] [Green Version]
- Fouli, Y.; Cade-Menun, B.J.; Cutforth, H.W. Freeze-thaw cycles and soil water content effects on infiltration rate of three Saskatchewan soils. Can. J. Soil Sci. 2013, 93, 485–496. [Google Scholar] [CrossRef]
- Korshunov, A.A.; Doroshenko, S.P.; Nevzorov, A.L.; Boldyrev, G.G. Effect of freezing and thawing on soil permeability: Newly equipment and experimental results. J. Phys. Conf. Ser. 2021, 1928, 012012. [Google Scholar] [CrossRef]
- Othman, M.A. Effect of Freeze-Thaw on the Structure and Hydraulic Conductivity of Compacted Clays; The University of Wisconsin-Madison: Madison, WI, USA, 1992. [Google Scholar]
- Sterpi, D. Effect of freeze-thaw cycles on the hydraulic conductivity of a compacted clayey silt and influence of the compaction energy. Soils Found. 2015, 55, 1326–1332. [Google Scholar] [CrossRef] [Green Version]
- Othman, M.A.; Benson, C.H. Effect of freeze-thaw on the hydraulic conductivity and morphology of compacted clay. Can. Geotech. J. 1993, 30, 236–246. [Google Scholar] [CrossRef]
- Starkloff, T.; Larsbo, M.; Stolte, J.; Hessel, R.; Ritsema, C. Quantifying the impact of a succession of freezing-thawing cycles on the pore network of a silty clay loam and a loamy sand topsoil using X-ray tomography. CATENA 2017, 156, 365–374. [Google Scholar] [CrossRef]
- Leuther, F.; Schlüter, S. Impact of freeze–thaw cycles on soil structure and soil hydraulic properties. Soil 2021, 7, 179–191. [Google Scholar] [CrossRef]
- Kraus, J.F.; Benson, C.H.; Erickson, A.E.; Chamberlain, E.J. Freeze-thaw cycling and hydraulic conductivity of bentonitic barriers. J. Geotech. Geoenvironmental Eng. 1997, 123, 229–238. [Google Scholar] [CrossRef]
- ASTM D2487-17; Standard Practice for Classification of Soils for Engineering Purposes (Unified Soil Classification System). ASTM International: West Conshohocken, PA, USA, 2017. [CrossRef]
- Rafi, A. Engineering Properties and Mineralogical Composition of Expansive Clays in Al-Qatif Area. Doctoral Dissertation, KFUPM, Dhahran, Saudi Arabia, 1988. [Google Scholar] [CrossRef]
- Abduljauwad, S.N.; Al-Sulaimani, G.J. Determination Of Swell Potential Of Al-qatif Clay. Geotech. Test. J. ASTM 1993, 16, 469–484. [Google Scholar] [CrossRef]
- Al-Mahbashi, A.M. Soil water characteristic curves of treated and untreated highly expansive soil subjected to different stresses. Master’s Thesis, Department of Civil Engineering, King Saud University, Riyadh, Saudi Arabia, 2014. [Google Scholar]
- Al-Mahbashi, A.M.; Elkady, T.Y.; Alrefeai, T.O. Soil Water Characteristic Curve and Improvement in Lime Treated Expansive Soil. Geomech. Eng. 2015, 8, 687–706. [Google Scholar] [CrossRef]
- Elkady, T.Y.; Al-Mahbashi, A.M. Effect of solute concentration on the volume change and shear strength of compacted natural expansive clay. Environ. Earth Sci. 2017, 76, 483. [Google Scholar] [CrossRef]
- ASTM D7928-17; Standard Test Method for Particle-Size Distribution (Gradation) of Fine-Grained Soils Using the Sedimentation (Hydrometer) Analysis. ASTM International: West Conshohocken, PA, USA, 2017.
- Chittoori, B.C.S.; Moghal, A.A.B.; Pedarla, A.; Al-Mahbashi, A.M. Effect of unit weight on porosity and consolidation characteristics of expansive clays. J. Test. 2017, 45, 94–104. [Google Scholar] [CrossRef]
- ASTM D698-2000; Standard Test Methods for Laboratory Compaction Characteristics of Soil Using Standard Effort (12400 ft-lbf/ft3 (600 kNm/m3)). ASTM International: West Conshohocken, PA, USA, 2000; Volume 4.08.
- ASTM D560-03; Standard Test Methods for Freezing and Thawing Compacted Soil- Cement Mixtures (Withdrawn 2012). ASTM International: West Conshohocken, PA, USA, 2003.
- Aldaood, A.; Bouasker, M.; Al-Mukhtar, M. Effect of water during freeze-thaw cycles on the performance and durability of lime-treated gypseous soil. Cold Reg. Sci. Technol. 2016, 123, 155–163. [Google Scholar] [CrossRef]
- Hotineanu, A.; Bouasker, M.; Aldaood, A.; Al-Mukhtar, M. Effect of freeze-thaw cycling on the mechanical properties of lime-stabilized expansive clays. Cold Reg. Sci. Technol. 2015, 119, 151–157. [Google Scholar] [CrossRef]
- ASTM D5856-02; Standard Test Method for Measurement of Hydraulic Conductivity of Porous Material Using a Rigid-Wall, Compaction-Mold Permeameter. ASTM International: West Conshohocken, PA, USA, 2002.
- ASTM D1140-17; Standard Test Methods for Determining the Amount of Material Finer than 75-μm (No. 200) Sieve in Soils by Washing. ASTM International: West Conshohocken, PA, USA, 2017.
- ASTM D6836-16b; Standard Test Methods for Determination of the Soil Water Characteristic Curve for Desorption Using a Hanging Column, Pressure Extractor, Chilled Mirror Hygrometer, and/or Centrifuge. ASTM: West Conshohocken, PA, USA, 2016.
- ASTM D5298-16a; Standard Test Method for Measurement of Soil Potential (Suction) Using Filter Paper. ASTM: West Conshohocken, PA, USA, 2016.
- Romero, E.; Della Vecchia, G.; Jommi, C. An insight into the water retention properties of compacted clayey soils. Géotechnique 2011, 61, 313–328. [Google Scholar] [CrossRef]
- Della Vecchia, G.; Dieudonné, A.C.; Jommi, C.; Charlier, R. Accounting for evolving pore size distribution in water retention models for compacted clays. Int. J. Numer. Anal. Methods Geomech. 2015, 39, 702–723. [Google Scholar] [CrossRef]
Figure 1.
Hydrometer analysis of Al-Qatif clay.

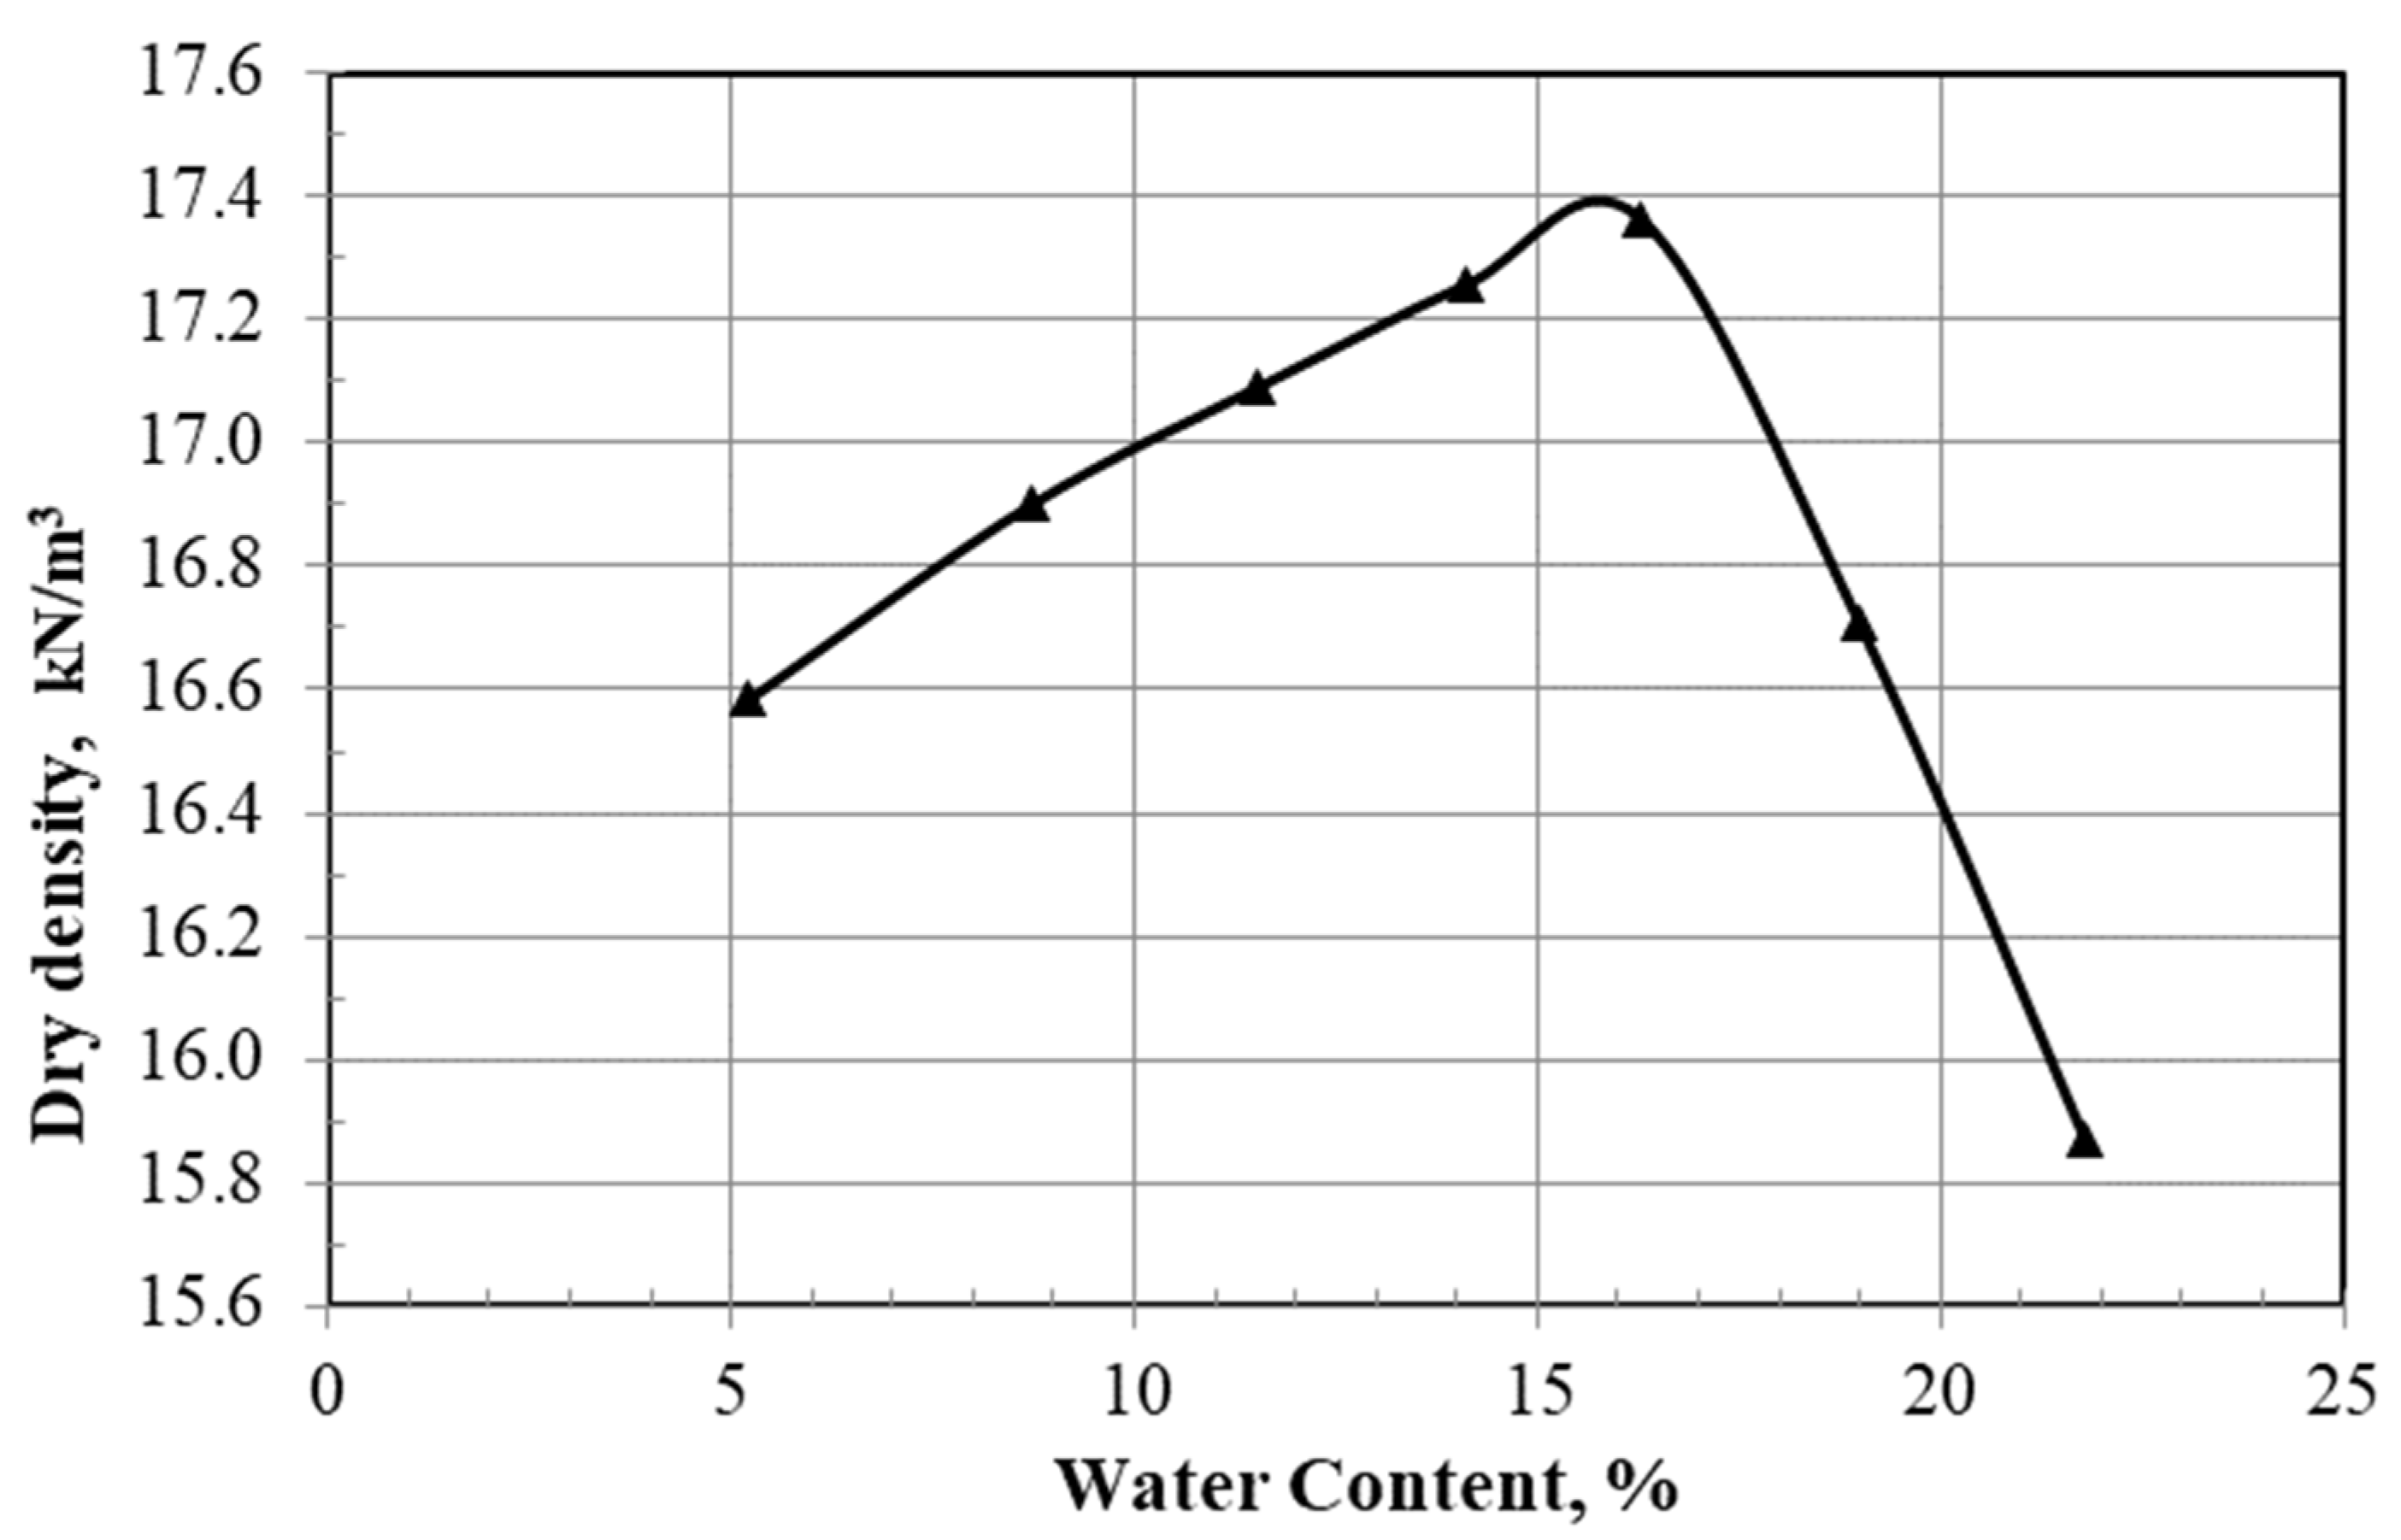
Figure 2.
Compaction curve of sand-bentonite mixture.

Figure 3.
Schematic diagram of the testing setup.

Figure 4.
Hydraulic conductivity and cumulative flow for 15%B before and after freeze-thaw cycles.

Figure 5.
Hydraulic conductivity and cumulative flow for 20%Q before and after freeze-thaw cycles under 7 kPa stress.
Figure 5.
Hydraulic conductivity and cumulative flow for 20%Q before and after freeze-thaw cycles under 7 kPa stress.

Figure 6.
Soil-water retention curves for liner mixtures.

Figure 7.
Hydraulic conductivity and cumulative flow for 20%Q before and after freeze–thaw cycles under 30 kPa stress.
Figure 7.
Hydraulic conductivity and cumulative flow for 20%Q before and after freeze–thaw cycles under 30 kPa stress.

Figure 8.
Fine percent before and after extended time hydraulic conductivity tests for different mixtures.
Figure 8.
Fine percent before and after extended time hydraulic conductivity tests for different mixtures.


Table 1.
Soil Characterization for Al-Qatif Soil.
| Test | Value |
|---|---|
| Specific Gravity, Gs | 2.70 |
| Liquid Limit, wL (%) | 160% |
| Plastic Limit, wP (%) | 60% |
| Shrinkage Limit, wsh (%) | 12% |
| % passing Sieve No. 200 | 65–95% |
| Unified soil classification | CH |
| Maximum dry unit weight (kN/m3) | 12 kN/m3 |
| Optimum water content (%) | 38% |
| Swelling potential (ASTM D4546) | 16–18% |
| Swelling pressure (ASTM D4546) | 550–600 kN/m2 |
Publisher’s Note: MDPI stays neutral with regard to jurisdictional claims in published maps and institutional affiliations. |
© 2022 by the authors. Licensee MDPI, Basel, Switzerland. This article is an open access article distributed under the terms and conditions of the Creative Commons Attribution (CC BY) license (https://creativecommons.org/licenses/by/4.0/).
Share and Cite
MDPI and ACS Style
Al-Mahbashi, A.M.; Dafalla, M.; Al-Shamrani, M. Long-Term Performance of Liners Subjected to Freeze-Thaw Cycles. Water 2022, 14, 3218. https://doi.org/10.3390/w14203218
AMA Style
Al-Mahbashi AM, Dafalla M, Al-Shamrani M. Long-Term Performance of Liners Subjected to Freeze-Thaw Cycles. Water. 2022; 14(20):3218. https://doi.org/10.3390/w14203218
Chicago/Turabian StyleAl-Mahbashi, Ahmed M., Muawia Dafalla, and Mosleh Al-Shamrani. 2022. "Long-Term Performance of Liners Subjected to Freeze-Thaw Cycles" Water 14, no. 20: 3218. https://doi.org/10.3390/w14203218
Note that from the first issue of 2016, this journal uses article numbers instead of page numbers. See further details here.