
Developmental Mechanism of Rainfall-Induced Ground Fissures in the Kenya Rift Valley
1
Department of Geological Engineering, Chang’an University, Xi’an 710054, China
2
Key Laboratory of Western China Mineral Resources and Geological Engineering, Ministry of Education of the People’s Republic of China, Xi’an 710054, China
3
School of Engineering and Technology, China University of Geosciences (Beijing), Beijing 100083, China
4
China Jikan Research Institute of Engineering Investigations and Design Co., Ltd., Xi’an 710043, China
*
Author to whom correspondence should be addressed.
Water 2022, 14(20), 3215; https://doi.org/10.3390/w14203215
Submission received: 17 September 2022
/
Revised: 7 October 2022
/
Accepted: 10 October 2022
/
Published: 13 October 2022
(This article belongs to the Section Hydrogeology)
Abstract
:Active tectonic movement and frequent ground fissure disasters occur in the Kenya Rift Valley. Ground fissures are often exposed to the ground surface after rainfall, resulting in disasters and huge economic losses. We conducted a field geological survey and exploratory trenching in order to identify the developmental characteristics of ground fissures in the Kenya Rift Valley. The ground fissures were found to be connected with concealed bedrock fissures, which is a typical characteristic of tectonic ground fissures. From the perspective of regional tectonic stress and plate movement, we investigated the causes of hidden bedrock cracks and conducted a finite element numerical simulation to study the rainfall infiltration process in the presence of hidden bedrock fractures. The results showed that the fractures in the concealed bedrock are controlled by regional tectonic stress and a northwest-trending basement tectonic shear zone. The most intense rainfall infiltration erosion occurs in concealed cracks, where the settlement induced by rainfall is also greatest. Therefore, rainfall erosion is an important factor driving the expansion of ground fissures towards surface fractures. The results of this study provide a theoretical scientific basis for disaster reduction and the prevention of ground fissures in the Kenya Rift Valley.
1. Introduction
The Kenya Rift Valley is part of the East African Rift Valley, which extends from Lake Turkana in Kenya to northern Tanzania in a roughly north-south direction. It marks the boundary between the Nubian Plate and the Somali Plate and is an active continental rift [1]. Quaternary volcanic activity and regional extensional tectonic movement are intense in this area, and according to Global Positioning System (GPS) monitoring data, the Kenya Rift Valley is expanding at a rate of 0.5 mm/year [2]. The dominant rifting mechanisms in the Kenya Rift Valley are the active rising of anomalously hot mantle material and the thinning of the lithosphere from below [3].
The rock mass is relatively fragmented, owing to the active regional tectonic movement in the rift area. The near-surface strata mostly comprise loose volcanic sediments. In addition, climate conditions and heavy short-term rainfall in the rift area cause frequent ground fissure disasters during the rainy season [4]. For example, after a night of heavy rain in April 1995, a crack appeared on the surface of the rift valley, killing two children. In May 1991, an approximately 45 m-wide ground fissure subsided across the Nakuru–Njoro railway line, leaving the railway line gaping and unsupported, and causing a cargo train traveling from Nairobi to Njoro to derail. Similarly, this subsidence event occurred after a night of heavy rainfall. During the incident, five people were killed and an estimated USD 500,000 worth of goods were destroyed [5]. The most recent ground fissure event occurred on the evening of 13 March 2018; a ground fissure was exposed at the surface after heavy rainfall, which caused the collapse and damage of B3 Road (the main road in the rift valley region of Kenya). Such examples show that the Kenya Rift Valley region is prone to ground fissure disasters that cause substantial damage to property and claim lives.
At present, research on the developmental mechanism of ground fissures in the Kenya Rift Valley is relatively scarce. Most previous studies have conducted qualitative analyses that lack the verification of relevant geological survey work. For example, Ngecu (2000) qualitatively studied banded ground collapse in the area between Menengai Volcano and Nakuru Lake in the Kenya Rift Valley. The study determined that the near surface is composed of loose porous pyroclastic sediments placed above concealed faults. Under the action of water infiltration and erosion, this loose accumulation layer forms an underground cavity. In addition, when rainstorms or vibration from vehicles or trains occur, the exposed surface forms ground fissures [5]. Dindi (2015) described the land subsidence occurring in the southwest area of the Nakuru town in the Kenya Rift Valley, and determined that land subsidence in this area is linear (roughly north-south and consistent with the trend of the Kenya Rift Valley) and often occurs at the end of the rainy season [6].
Although in-depth research on the genetic mechanism of land subsidence in the Kenya Rift Valley has not been conducted, these findings have shown that ground fissures in this area are related to the fracturing of the underlying rock and soil mass, and surface water infiltration erosion caused by heavy rainfall is an important factor inducing the exposure of the underlying mass at the surface. However, few studies have investigated how the fracturing of hidden bedrock originates or how the rainfall infiltration process in shallow soil occurs under the existence of hidden bedrock cracks. Therefore, in this study, we conducted a field investigation including exploratory trenches in order to investigate the developmental characteristics associated with the rupturing of the buried rock mass in the Kenya Rift Valley. Using a numerical simulation, we studied the rainfall infiltration process under the rupture conditions relating to buried rock and soil. Here, we explain the genesis of the fracturing of concealed rock and soil in the Kenya Rift Valley from the perspective of regional tectonic activity. The results of this study can be used as a scientific theoretical basis for disaster prevention and the mitigation of ground fissures in the study area.
2. Tectonic Geological Background
Ground fissures are the rupture responses of shallow rock and soil to regional tectonic movement and continental deformation. The tensile and compressive stress fields formed by regional tectonic movement are the tectonic basis for the rupturing of buried rock and soil. In order to analyze the tectonic origin of the ground fissures in the Kenya Rift Valley, we briefly introduce the tectonic background of the ground fissures, including the rifting, plate movement, tectonic stress field, and basement structure of the Kenya Rift Valley.
2.1. Formation of the Kenya Rift Valley
The formation of the Kenyan rift began near Lake Turkana in the early Miocene and gradually migrated southward over time. Most Quaternary volcanic activity was concentrated on the rift axis, with activity in the central rift occurring from the middle to late Miocene [7]. The early stage of rift formation was accompanied by crustal uplift and volcanism, and depressions then developed from faults and formed the rift structure seen today [8].
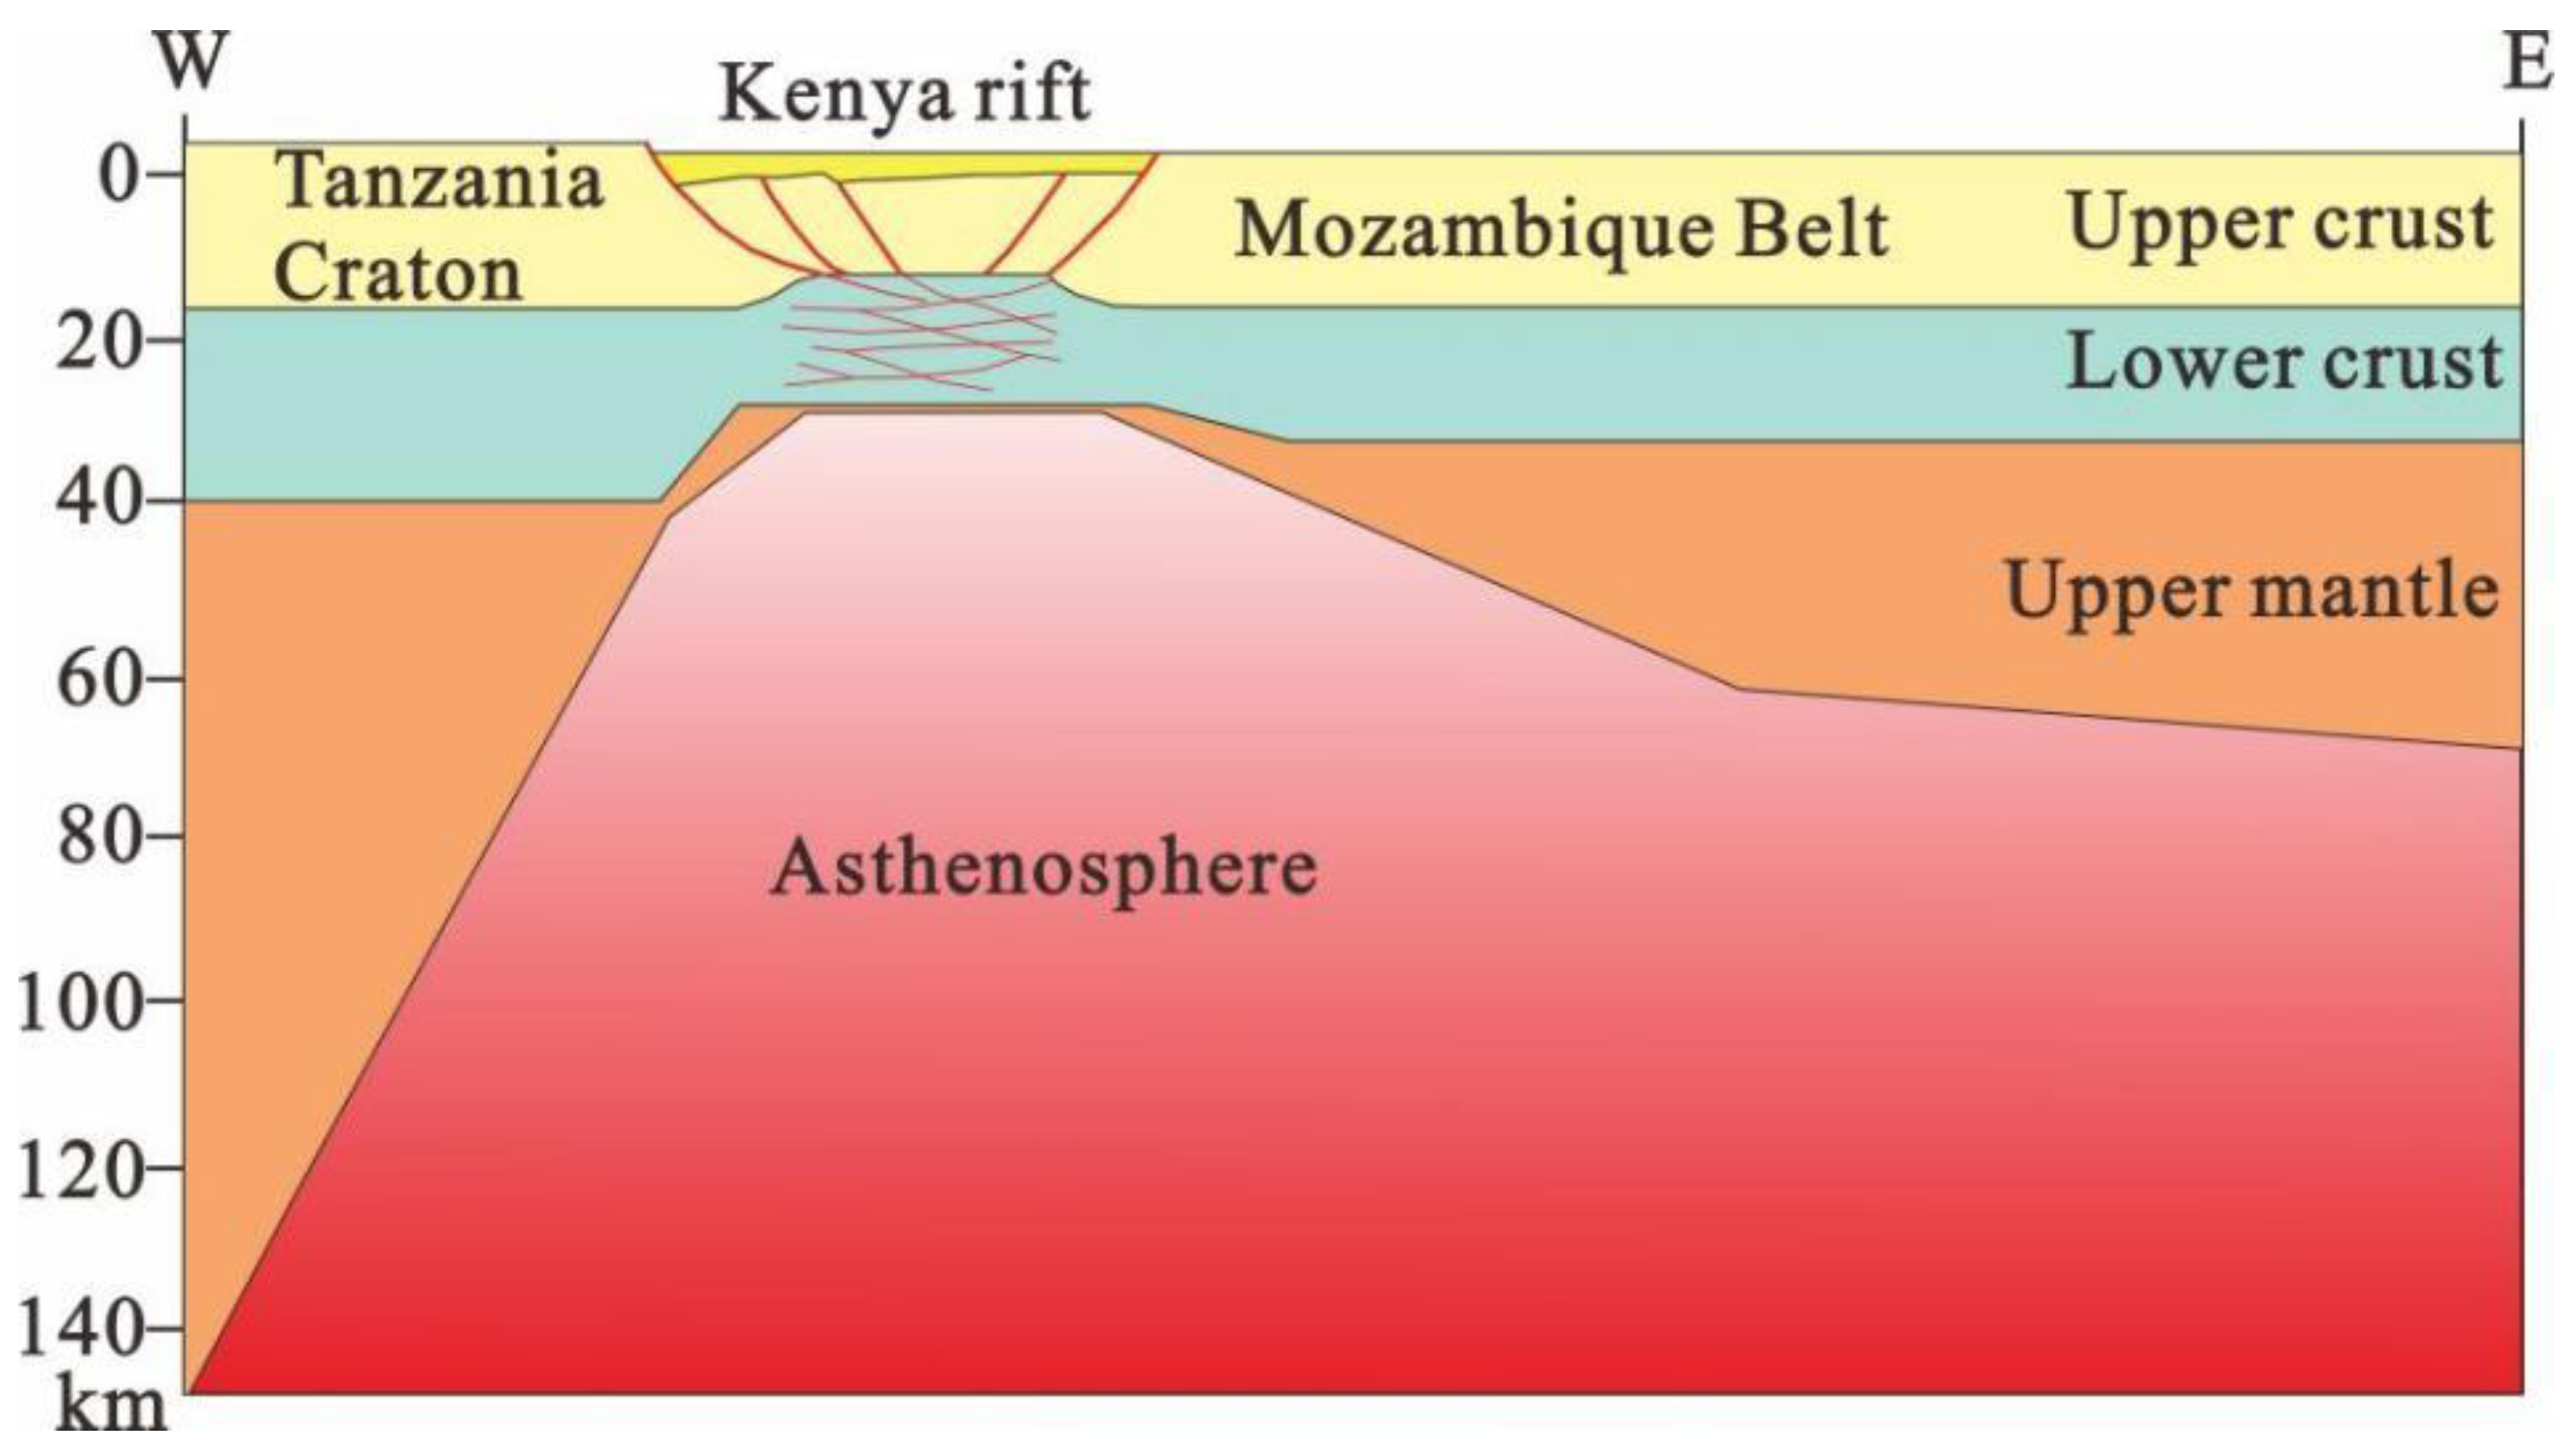
Turcotte and Emerman (1983) described two types of rifting styles: passive, in which asthenospheric material upwells passively into the gap caused by the extending lithosphere (volcanism occurs after faulting and rifting) in response to external plate forces; and active, in which the extension of the lithosphere occurs as a consequence of upwelling asthenospheric plumes (where volcanism precedes updoming, faulting, and rifting) [9]. The volcanism in the Kenya Rift Valley preceded fracturing by several million years, which indicates that the melt was formed by the upwelling of hot mantle material under the rift, rather than as a response to passive decompression melting caused by lithospheric tension. Therefore, the Kenya Rift Valley is a typical active rift. The active rise of anomalous hot mantle material and the thinning of the lithosphere from below are the main rifting mechanisms in the southern part of the Kenya Rift Valley, and they have formed the regional tectonic environment in which the rift region has been extended and stretched (Figure 1) [3]. The entire Kenya Rift Valley is the result of tensile stress [10].
2.2. Plate Movement and Tectonic Stress Field
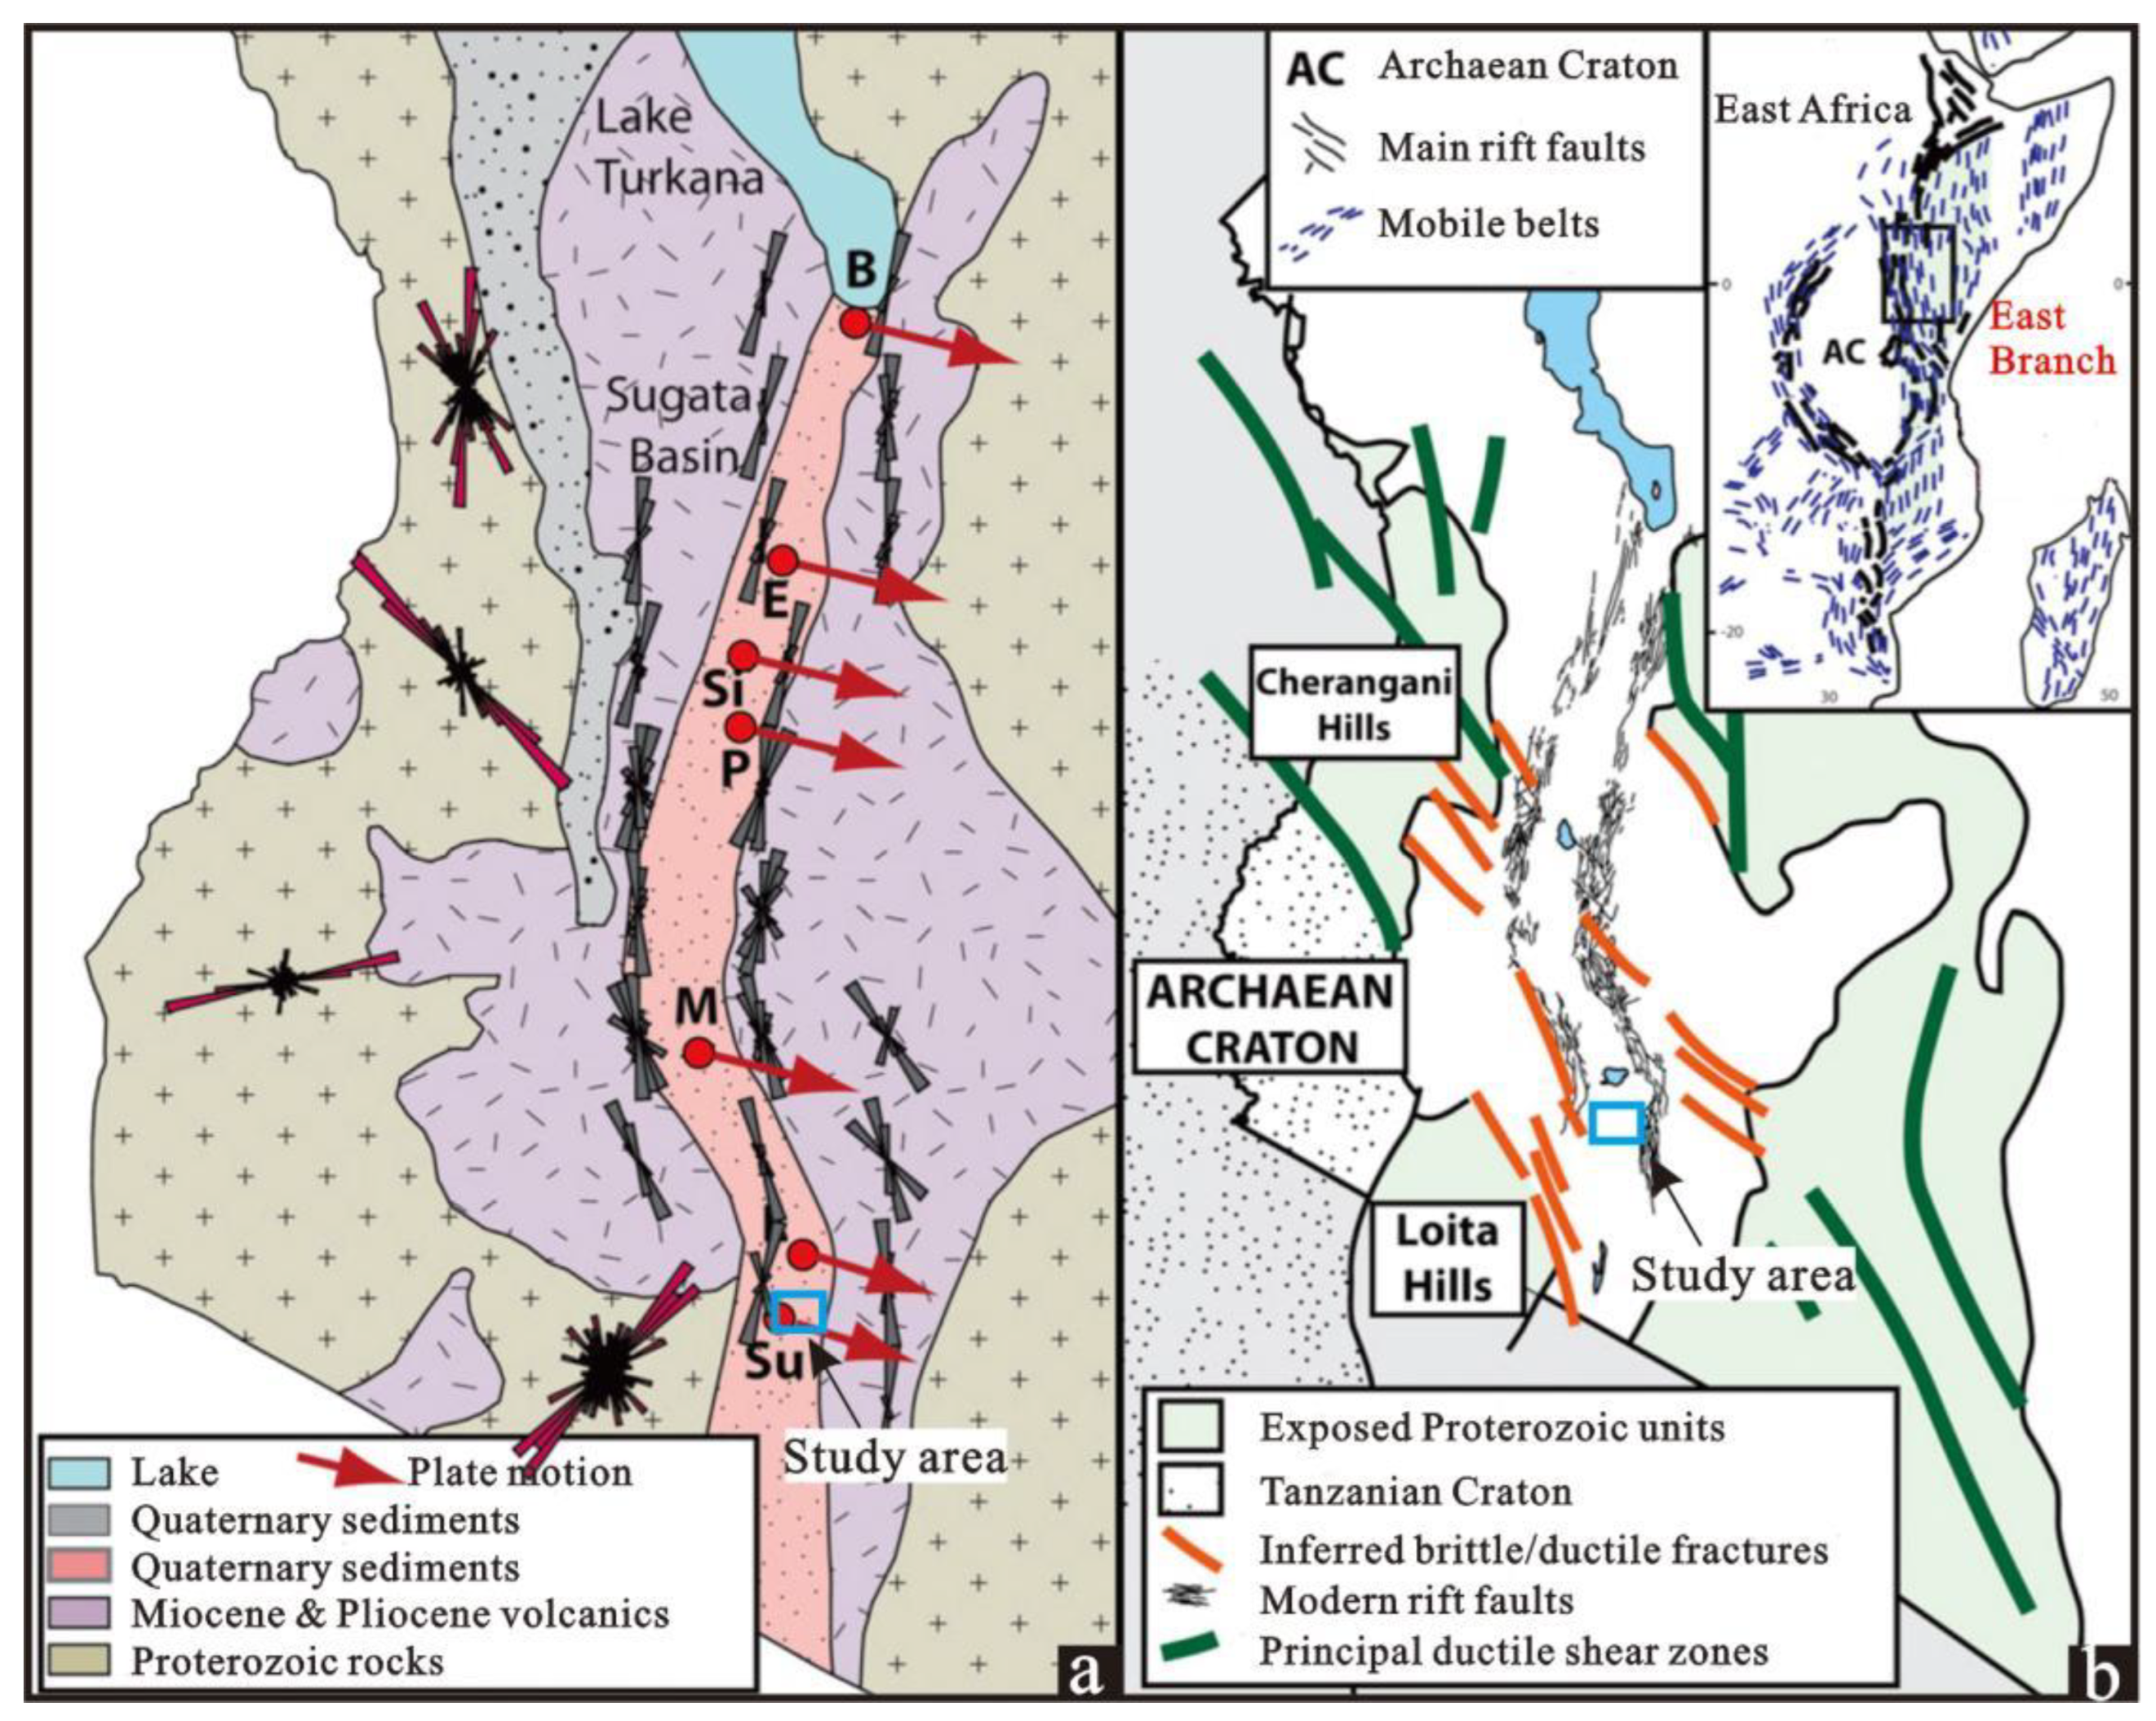
The Kenya rift is an active separation plate boundary between the Victoria Plate and the Somali Plate [11]. The motion of the Victoria Plate is currently constrained by eastern movement away from the Nubian Plate, with a velocity of 1.1 mm/yr in the north and 2.9 mm/yr in the south, according to the results of GPS studies and earthquake tensor analyses [12]. In contrast, the Somali Plate is currently constrained by movement away from the Victoria Plate, with a velocity of 3.1 mm/yr in the north and 0.9 mm/yr in the south [12]. The direction of plate movement at the location of the study area is generally towards the southeast (Figure 2).
Elliptical calderas in the rift zone are often used as indicators of the direction of far-field tectonic stress. The long axis of the crater represents the direction of the minimum principal stress in the shallow crust during the life of the potential magma chamber [13]. The rift-parallel volcanic vent and fissure alignments in the vicinity of the axial volcanoes suggest that during most of the Pleistocene, the minimum horizontal stress direction was oriented approximately E-W. During subsequent geological evolution, the direction of the regional stress field rotated 45° clockwise. Currently, the minimum horizontal stress in the rift valley is oriented NW-SE [14]. This is a very young stress field direction.
2.3. Basement Structure
A late Proterozoic collisional event caused the margin of the Tanzanian Archean craton to be reworked, overthrust, and effectively buried by tectonically emplaced “Mozambique Belt” rocks. Along the craton margin and within the mobile belt, a series of late Proterozoic continental-scale ductile/brittle shear zones trending in NW-SE and N-S orientations formed the basic tectonic pattern of the Precambrian rift basement [15] (Figure 2b). The mechanical strength of these shear fault areas is relatively weak, which identifies them as likely zones of reactivation or as potential stress guides under suitable deviatoric stress conditions.
The topographical and structural characteristics of the Kenya Rift Valley can be divided into three different sections, from north to south: the North Rift Valley in the NNE-SSW direction, the Central Rift Valley in the NW-SE direction at the equator, and the South Rift Valley in the SSW-NNE direction to the south of Suswa Volcano (Figure 2). The azimuth changes between these three different sections of the Kenya rift are controlled by the NW-SE-trending faults of the Cambrian basement of the rift [15]. Therefore, the formation of concealed rock and soil fractures in the rift area may also be affected by the basement structural shear zone.
After analyzing the tectonic background of the Kenya Rift Valley, it can be seen that:
- The Kenya rift is a typical active continental rift. Deep thermal dynamic activity has formed a regional tectonic environment for the extension of the rift area, which is conducive to the formation of tension cracks in rock and soil.
- The Kenya Rift Valley is the separation boundary between the Victoria Plate and the Somali Plate, with the latter moving southeast away from the former.
- The direction of the minimum horizontal stress in the Kenya rift rotated 45° clockwise from near E-W to NW-SE, which is its current trend. This stress environment is conducive to the formation of NE-SW tensile fractures.
- The major changes in the direction and structural evolution of the Kenya rift are controlled by the Cambrian basement NW-SE tectonic zone of weakness, and the formation of ruptures in the buried rock and soil in the rift area may also be affected by this shear zone.
3. Materials and Methods
3.1. Investigation and Analytical Methods Used to Determine Ground Fissure Characteristics
Tectonic ground fissures are usually oriented parallel or oblique to regional tectonic stress or active faults on the plane. The distribution law on the plane is the external manifestation of the internal mechanical ground fissure mechanism. The mechanical properties of ground fractures are reflected in their cross-sectional structure and fracture morphology. For example, the side walls of shear fractures are flat and smooth, while the side walls of tensile fractures are rough. In order to clarify the relationship between the mechanical properties of ground fissures and regional tectonic activity, we first need to investigate the plane distribution characteristics and cross-sectional structural characteristics of ground fissures in the study area.
Most of the ground fissures in the Kenya Rift Valley are developed in the southern rift section, and there is no historical record of the development of ground fissures in other regions. Therefore, we selected the area where the ground fissures are concentrated in the southern rift (36°17′30″–36°35′45″ E, 0°56′00″–1°09′00″ S) as our research area to conduct a detailed field geological survey on the development law of ground fissures.
For the study of the planar distribution of ground fissures in the Kenya Rift Valley, we mainly used data collection and analysis from historical Google images (2003–2022) to interpret the linear structures in the study area. We then carried out field mapping of the interpreted linear structures in order to obtain the location and shape information of ground fissures. Statistical analysis of the trend of ground fissures and the construction of a rose diagram of the ground fissure strikes intuitively demonstrated the dominant trend of the development of ground fissures in the study area. By analyzing the relationship between the dominant direction of the development of ground fissures and the direction of tectonic stress, the connection between ground fissures and regional tectonic activity was then established.
For the study of the structural characteristics of the ground fracture profile, we selected typical ground fractures for trench exposure. Through trench exposure, we obtained the profile shape of ground fractures, the filling of fractures, and the shape and mechanical properties of hidden bedrock fractures. The acquisition of this information provided the basis for subsequent analysis of the tectonic origin of the ground fissures.
3.2. Analysis of the Ground Fissure Formation Mechanism
On the basis of clarifying the distribution law and mechanical properties of ground fissures, we analyzed the theoretical dominant trend of ground fissures in the rift valley through plate movement, regional tectonic stress, and rock and soil fracture theory, and compared it with the actual trend of ground fissures in order to reveal the relationship between ground fissures and regional tectonic activity.
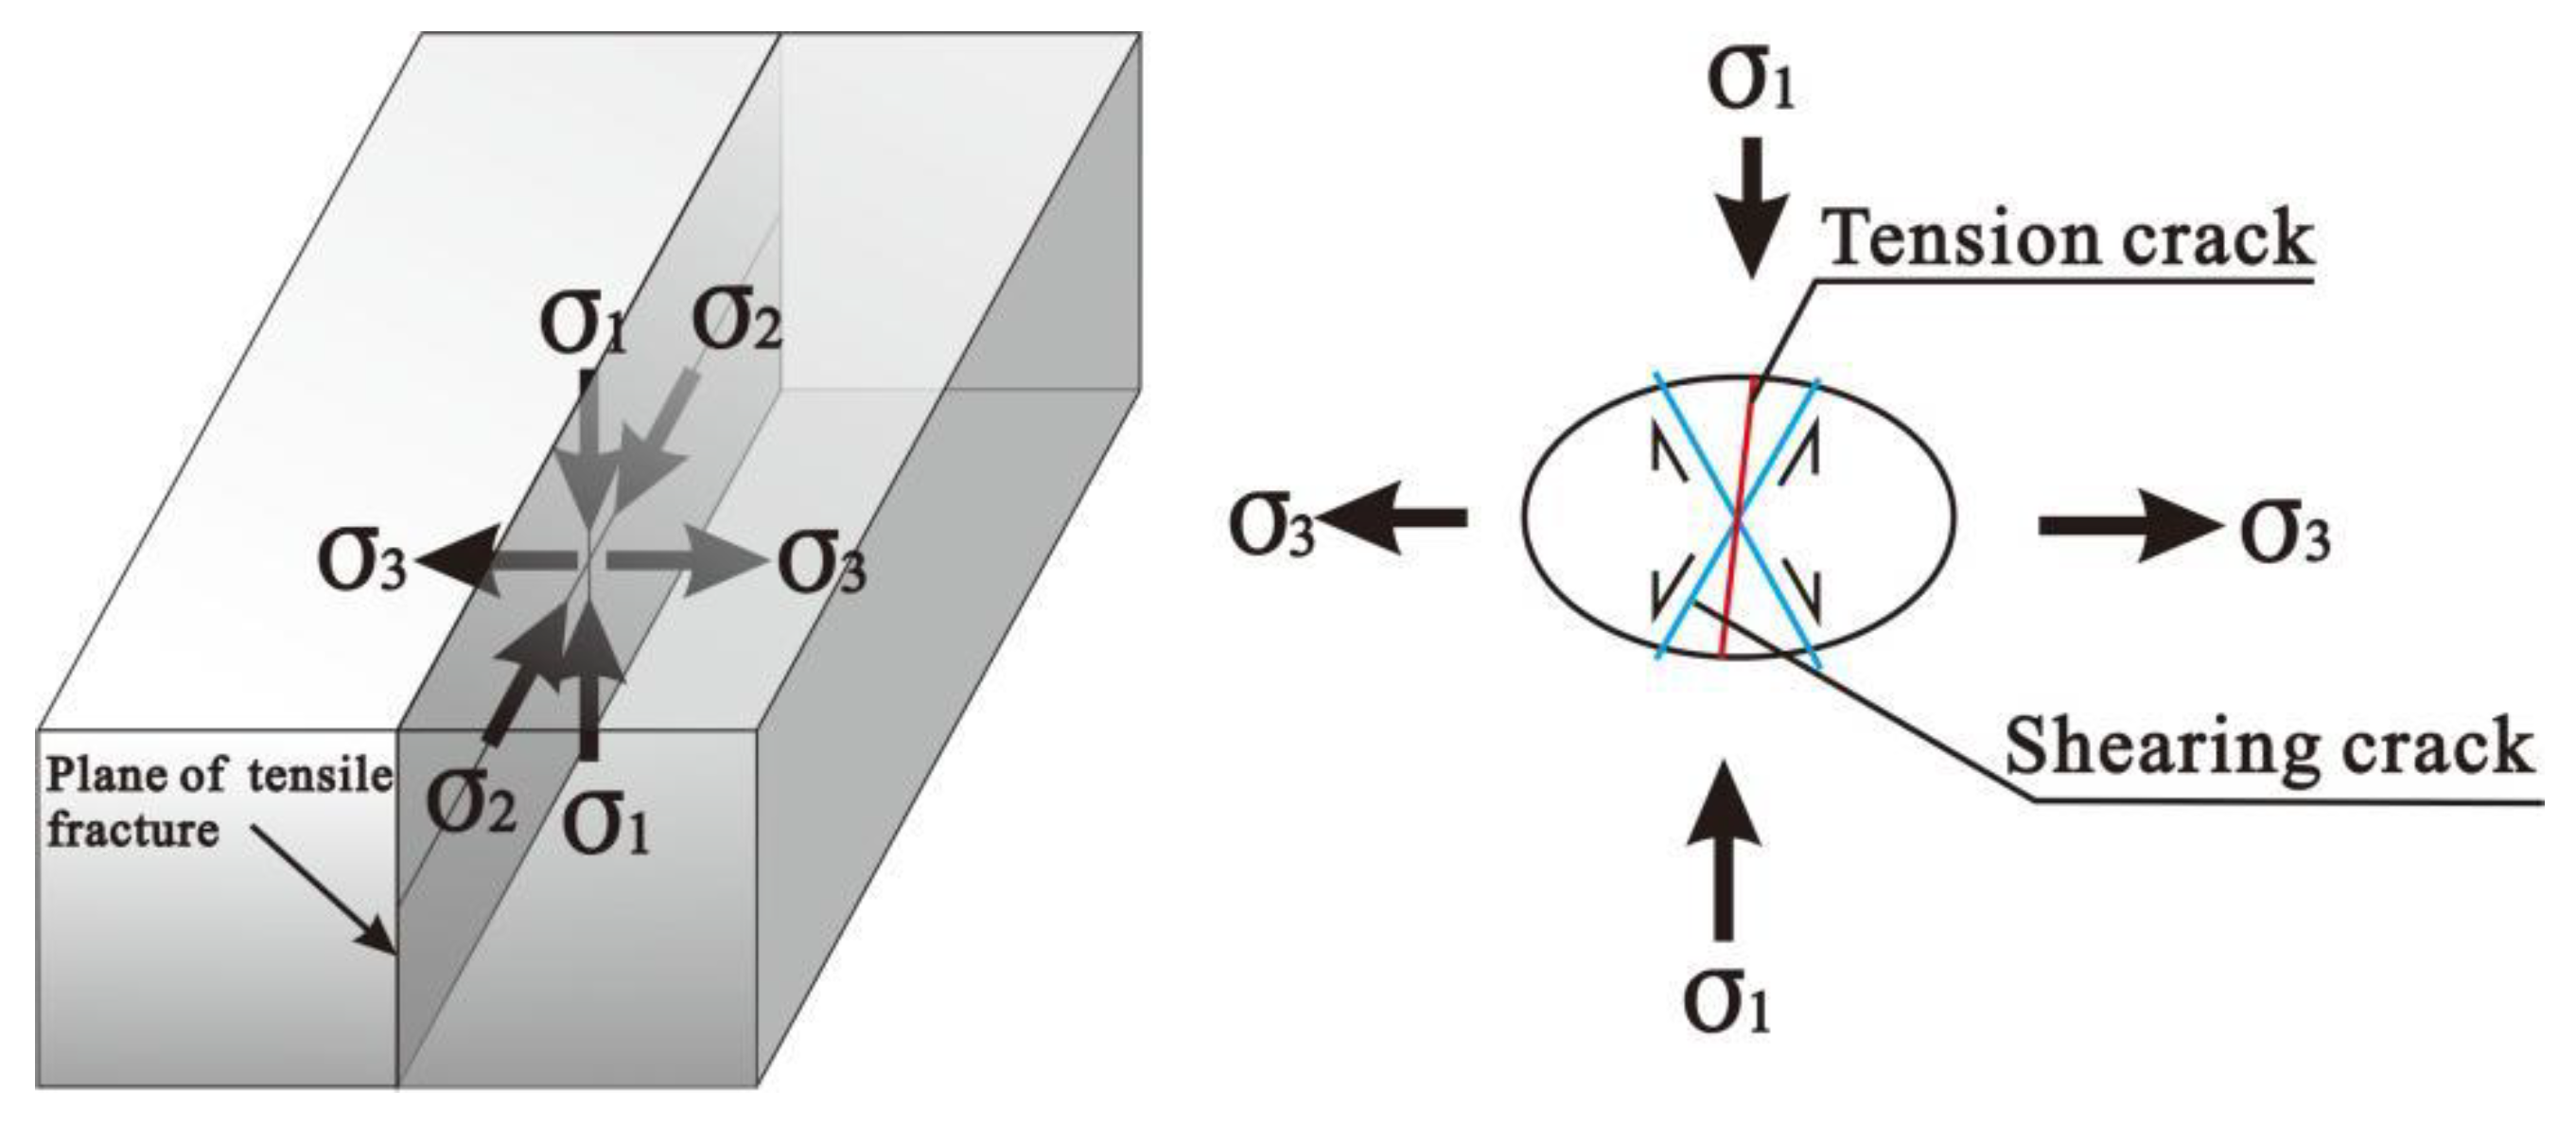
Two types of methods are mainly used to analyze tectonic stress in relation to the formation of ground fissures in a rift valley. The first is the analysis of the geometric relationship between the principal stress direction and the strikes of ground fissures. Tensile fractures usually develop perpendicular to the direction of the minimum principal stress (σ3) or parallel to the direction of the maximum principal stress (σ1) (Figure 3) [16]. According to the direction of the principal stress in the rift area, the theoretical direction of the development of tensile fractures in the rift area can be analyzed. The relationship between regional tectonic stress and tension fractures can be established by comparing the development direction of actual tension fractures and the theoretical development direction of tension fractures in the rift valley.
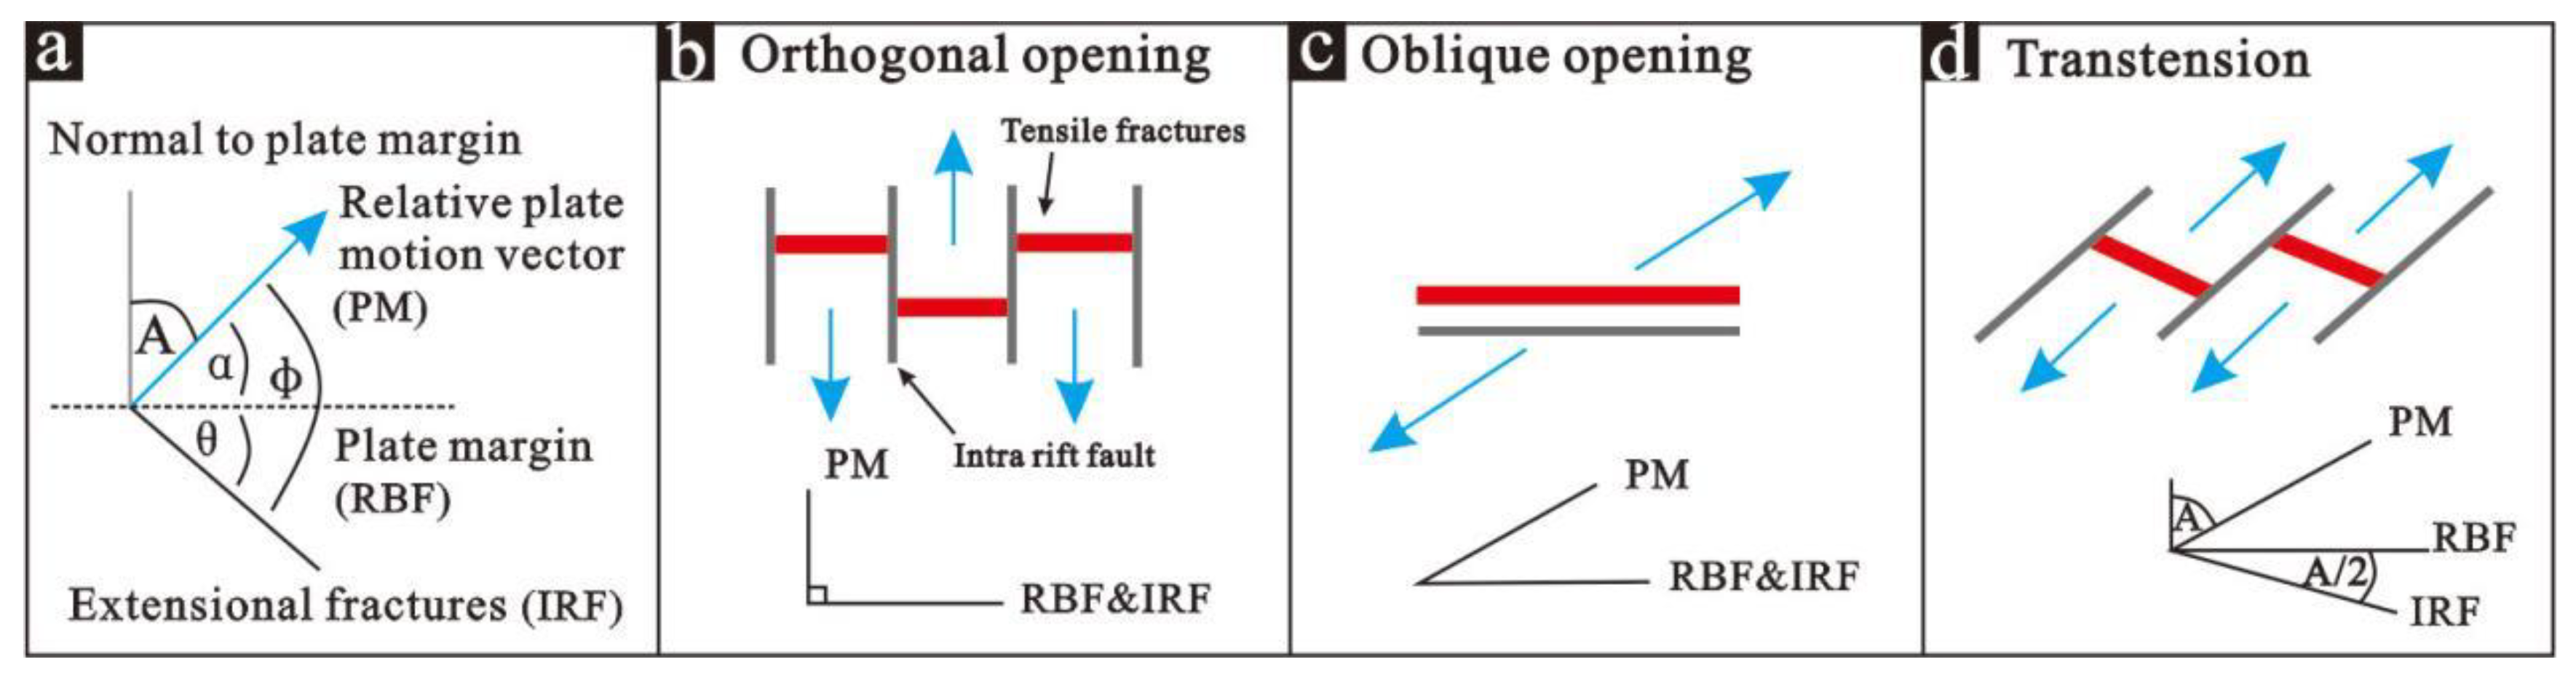
The second is the analysis of the geometric relationship between the direction of plate movement and the strike of the ground fissures. Tuckwell (1996) proposed that in a rift, there is a specific corresponding relationship between the angle of the plate motion vector, plate edge direction, and fault direction [17] (Figure 4). The formation of extensional tectonic fractures in rift valleys is not only related to regional tensile stress, but also to the direction of plate movement. According to the mode of fracture opening, extensional structures in rifts can be divided into three opening types: orthogonal, oblique, and transtensional (Figure 4). According to the opening model of an extensional fault in a rift region, the development direction of a tensile fracture under the joint action of a pre-existing fault and the plate tension in the rift can be obtained.
The basement fault in the Kenya rift obliquely intersects with the plate boundary in the NW-SE direction, and the plate movement direction is approximately parallel to the fault strike. Therefore, the formation of tension cracks in the rift conforms to the strike-slip extension model. The tensile fractures formed under this tectonic stress mode often have the properties of shear fractures and exhibit the characteristics of an en echelon distribution in the plane.
3.3. Numerical Simulation Method of Rainfall Infiltration
The rainfall infiltration process in soil proceeds from unsaturated infiltration to saturated infiltration, and the soil moisture content increases gradually with increasing rainfall. The finite element analysis software ABAQUS was used to simulate the soil from an unsaturated to a saturated state during the rainfall process. In the calculation, the finite element mesh was fixed on the soil skeleton, and gas or liquid flowed through the mesh [18]. The mechanical properties of soil meet the principle of effective stress, and the seepage of liquid in soil mass satisfies Forchheimer’s law of permeability, as in Equation (1):
where J is the hydraulic gradient, V is the seepage velocity of groundwater, and a and b are constants determined experimentally.
J = aV + bV2
Because the seepage velocity in a soil pore is small and mostly in the laminar flow state, we can simplify the seepage law to a certain extent, taking a as 1/k and b as 0, where k is the permeability coefficient of the soil; this law can be simplified as Darcy seepage. Rainfall in the Kenya Rift Valley is far greater than evaporation in the case of continuous rainfall during the rainy season. Here, we mainly simulated the general law of seepage and deformation of the upper soil of bedrock cracks under the extreme condition of continuous rainfall; hence, we ignored the influence of evaporation on the rainfall infiltration process.
In ABAQUS, the effect of saturation (Sr) on the permeability coefficient is determined by a reduction coefficient Ks. If unsaturated seepage occurs, ABAQUS defaults to a condition where Sr is less than 1.0:
when Sr ≥ 1.0, Ks = 1.0. When the soil saturation increases gradually, the infiltration rate also increases gradually.
Ks = (Sr)3,
The stress characteristics of soil meet the effective stress principle:
where σ’ is the effective stress, σ is the total stress, Ua is the gas pressure, Uw is the pore water pressure, and χ is the effective stress parameter of unsaturated soil, which has a value between 0 and 1.
σ’ = σ − Ua + χ(Ua − Uw),
We generated typical soil water characteristic curves according to soil types using the seep module in GeoStudio software. We then discretized the curve into coordinate points and converted the water content of the abscissa into saturation using the following formula, so that the relationship between saturation and matrix suction could be obtained (Table 1). Finally, these coordinate points were input into ABAQUS in order to define the unsaturated characteristics of the soil.
where Sr is saturation, w is water content, and e is the pore ratio.
Sr = Gs*w/e,
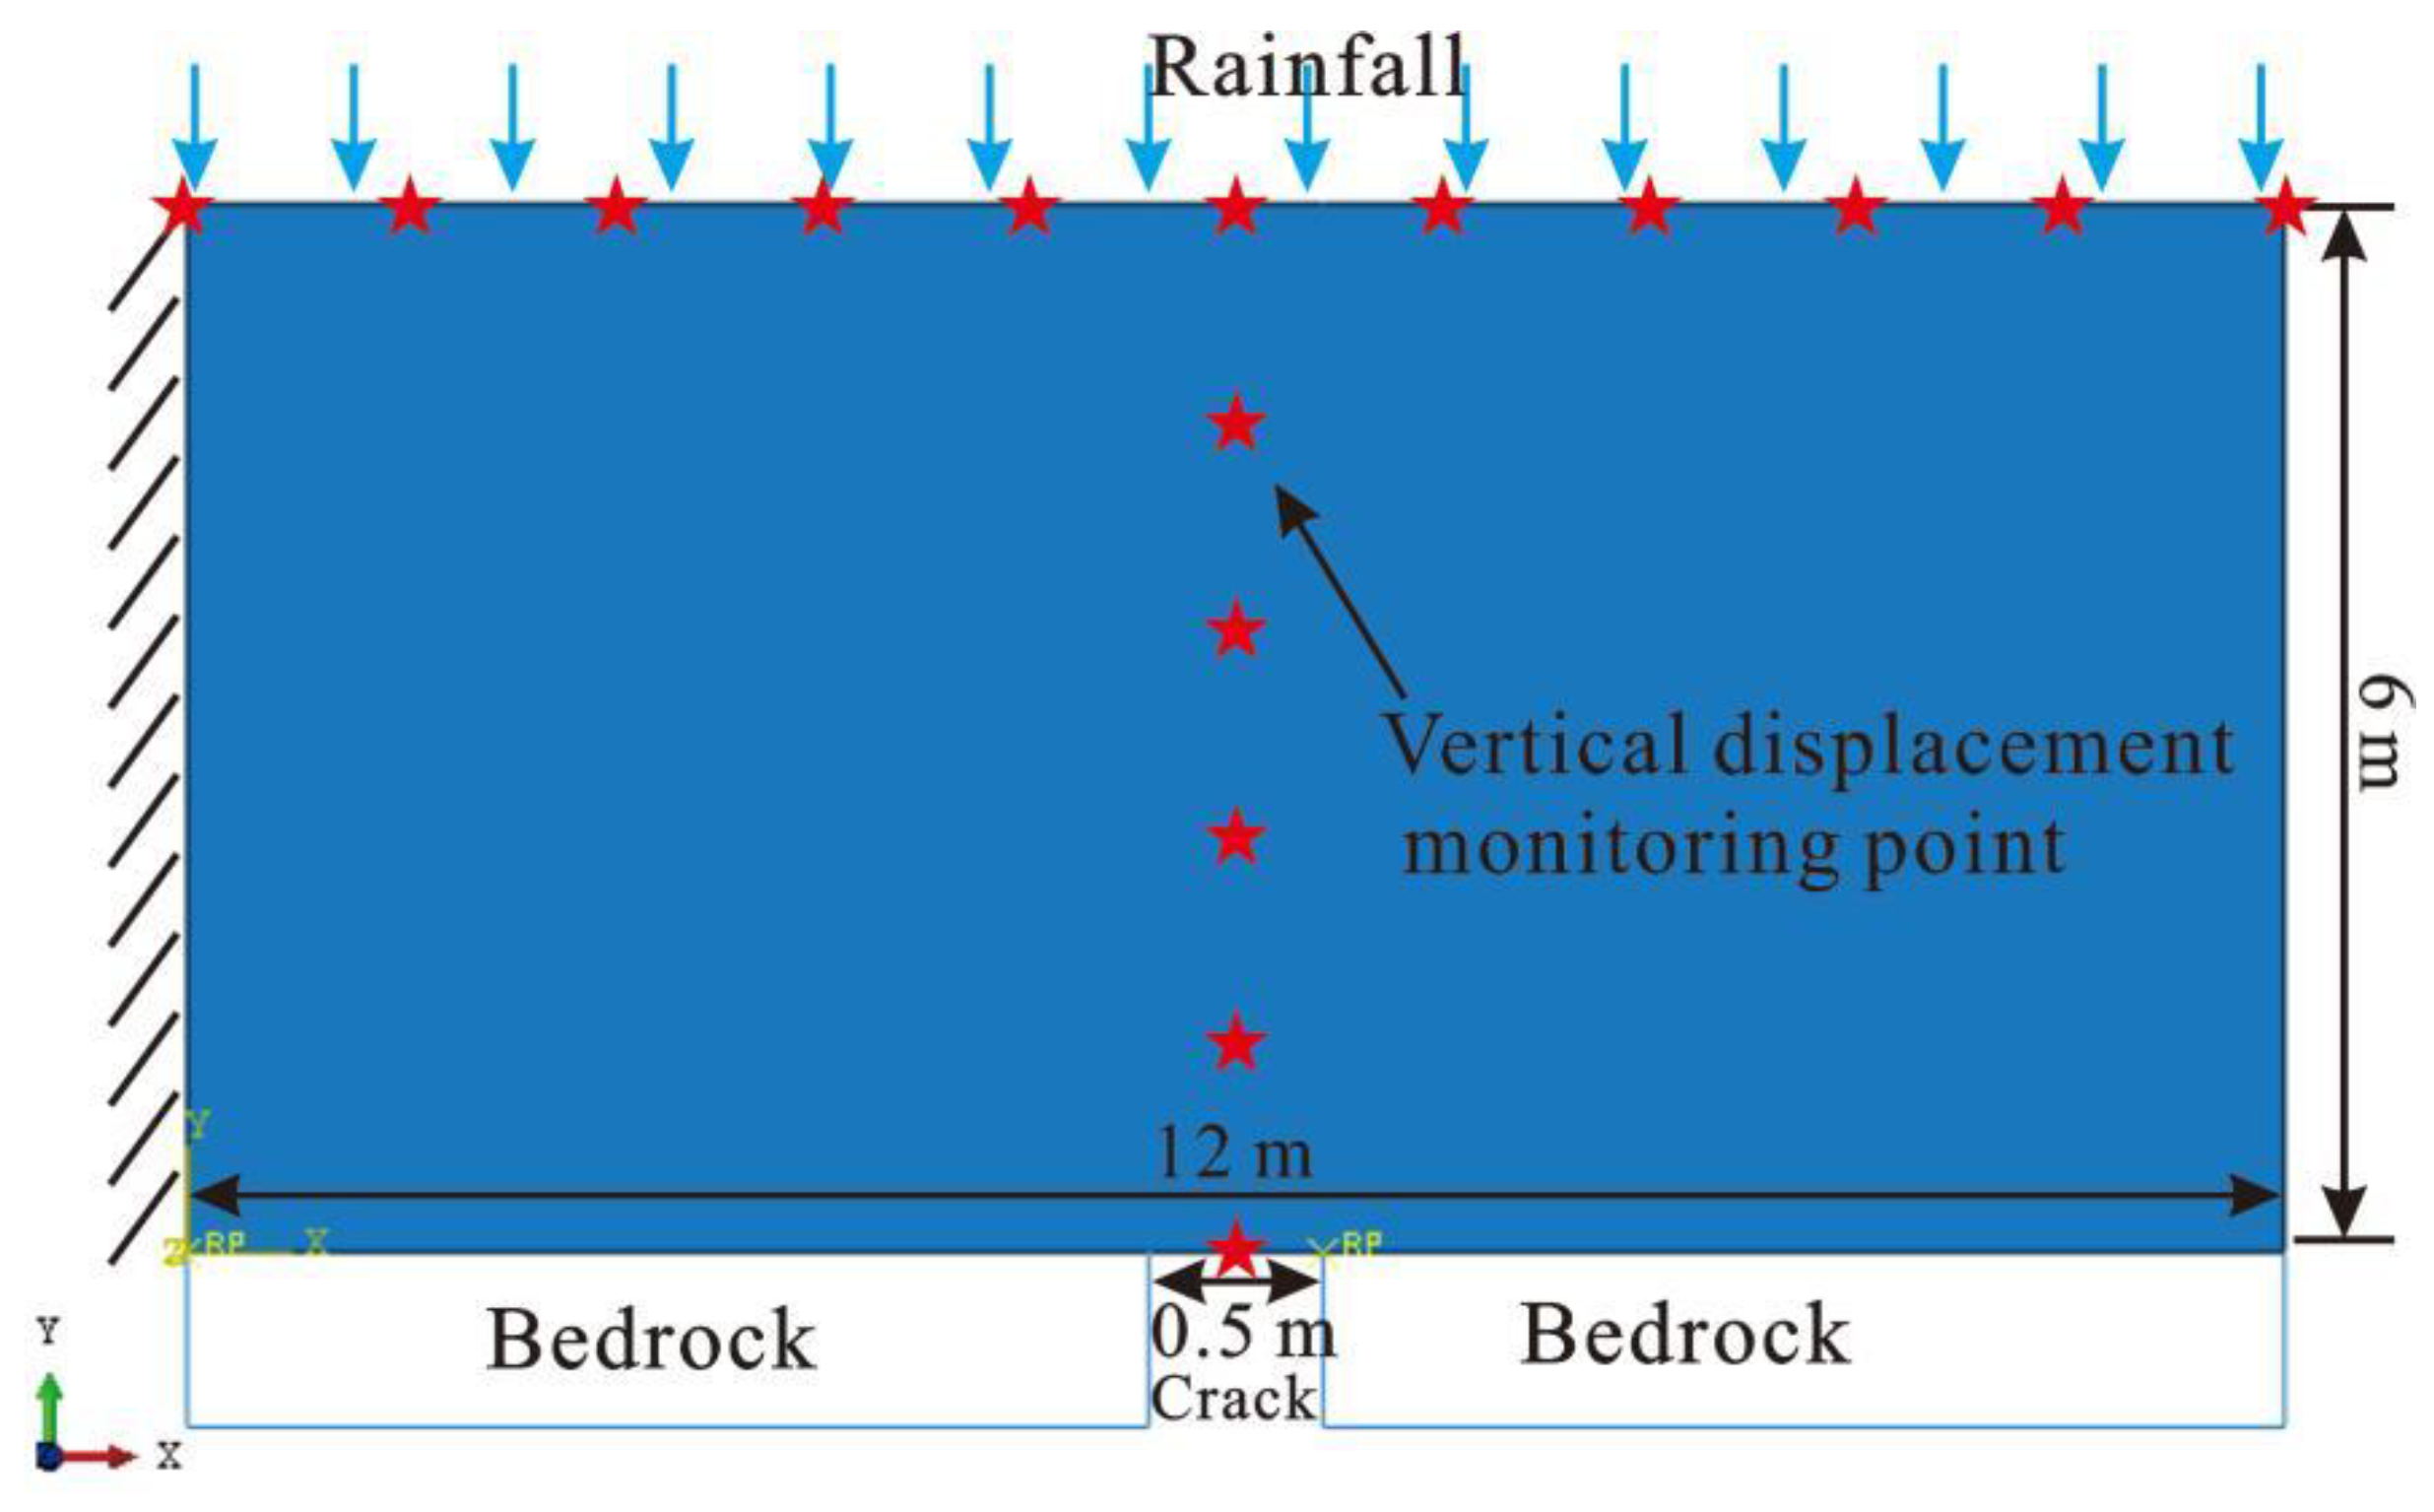
In this study, we focused on the loose volcanic sedimentary layer above the bedrock in the study area as the research object of the rainfall infiltration process. A numerical model was used to study the rainfall infiltration law and deformation characteristics of the soil above bedrock cracks, under the condition that hidden bedrock cracks exist and are no longer active. The thickness of the loose volcanic deposits revealed by the trenches was approximately 6 m, and the deposits consisted mainly of silty sand. A volcanic rock layer exists under a loose volcanic sedimentary layer, and the bedrock fissures are developed in this rock layer. Under the condition of continuous rainfall, the concealed bedrock fissures expand to the surface to form ground fissures. We derived a numerical calculation model (Figure 5) that simplified the soil layer into a single silty sand layer. The thickness of the soil layer and the width of the bedrock crack in the numerical model are taken as 6 m and 0.5 m, respectively, with reference to the thickness of the soil layer and the width of the crack exposed in Trench 1.
In the numerical model, we limited the horizontal and vertical displacements of the left and right boundaries of the soil and bedrock, while the upper and lower boundaries of the soil could be freely displaced and deformed. The upper surface of the soil represented the infiltration surface of seepage, and the lower surface of the soil represented the outlet of seepage. The bedrock surface acted as an impermeable surface. The stress state of the initial model before the solution satisfied the initial stress equilibrium condition, in that the in situ stress increased linearly with depth, and the initial displacement was zero. We set vertical displacement monitoring points on the surface of the calculation model and on the upper part of the hidden crack in order to monitor the deformation characteristics of the soil at different distances and depths from the hidden crack (Figure 5).
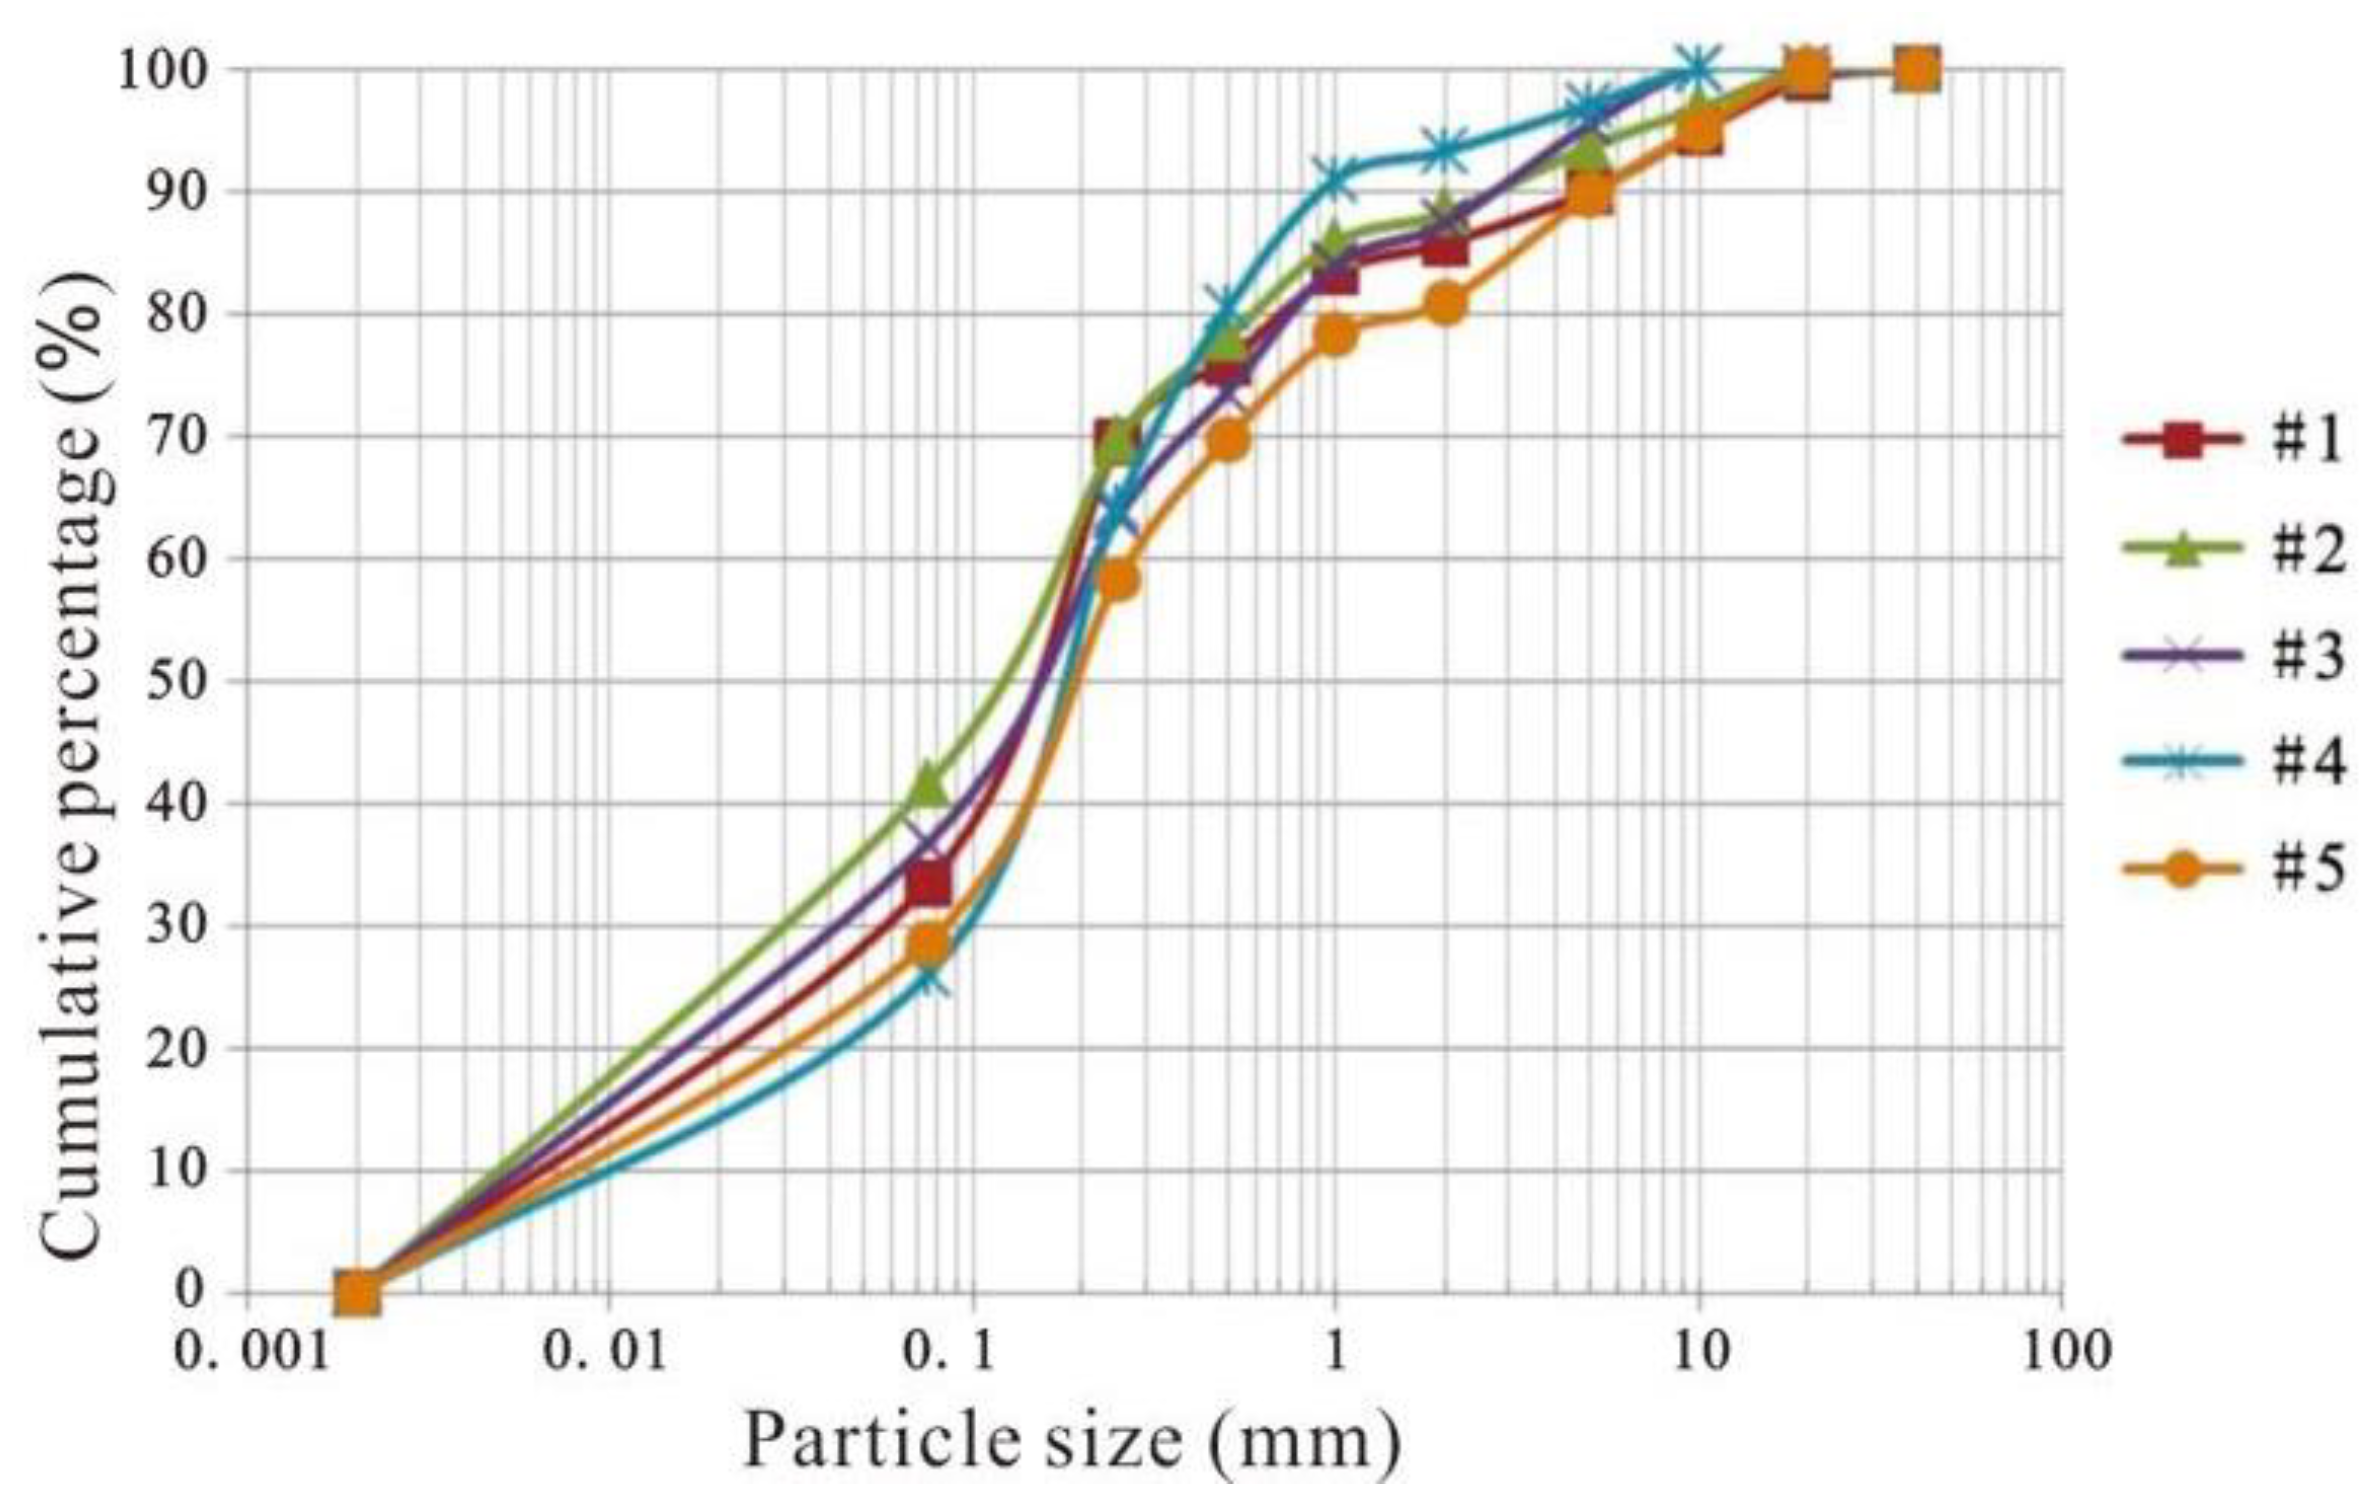
We sampled the soil at depths of 0.5, 2.5, 3.5, 4.5, and 6 m near the surface of the study area, and conducted indoor geotechnical tests. The results are shown in Table 2, and the grain size distribution curves are shown in Figure 6. The unified soil classification system (USCS) was used to classify the soil type; it was classified as silty sand (SM) according to the particle size distribution. The soil was found to be mixed with porous and light pumice particles formed by volcanic eruptions. Pumice is less dense than water due to its highly porous nature, and it is responsible for the low density and large void ratios of the analyzed soil.
During the actual rainfall process, when the rainfall intensity is greater than the soil infiltration rate, the surface runoff will be discharged to low-lying areas to form ponds. Because the depths of the ponds are controlled by many factors, such as rainfall intensity, duration, terrain, and geotechnical characteristics, it is difficult to reasonably generalize the pond characteristics. Therefore, in this simulation, we used the continuous rainfall mode without considering surface ponding to study the general law governing the infiltration and deformation of the overlying soil, under the conditions of hidden cracks and extreme rainfall. In ABAQUS, we applied pore flow on the soil surface with a slightly smaller seepage velocity than the soil permeability coefficient in order to achieve the continuous rainfall condition without considering surface ponding. The relevant calculation parameters are shown in Table 3. The basic physical parameters of the soil were obtained through indoor geotechnical tests, and the permeability coefficient of the silty sand was based on the permeability coefficient of the soil in the south section of the Kenya Rift Valley [19].
4. Results
4.1. Plane Distribution Characteristics of Ground Fissures
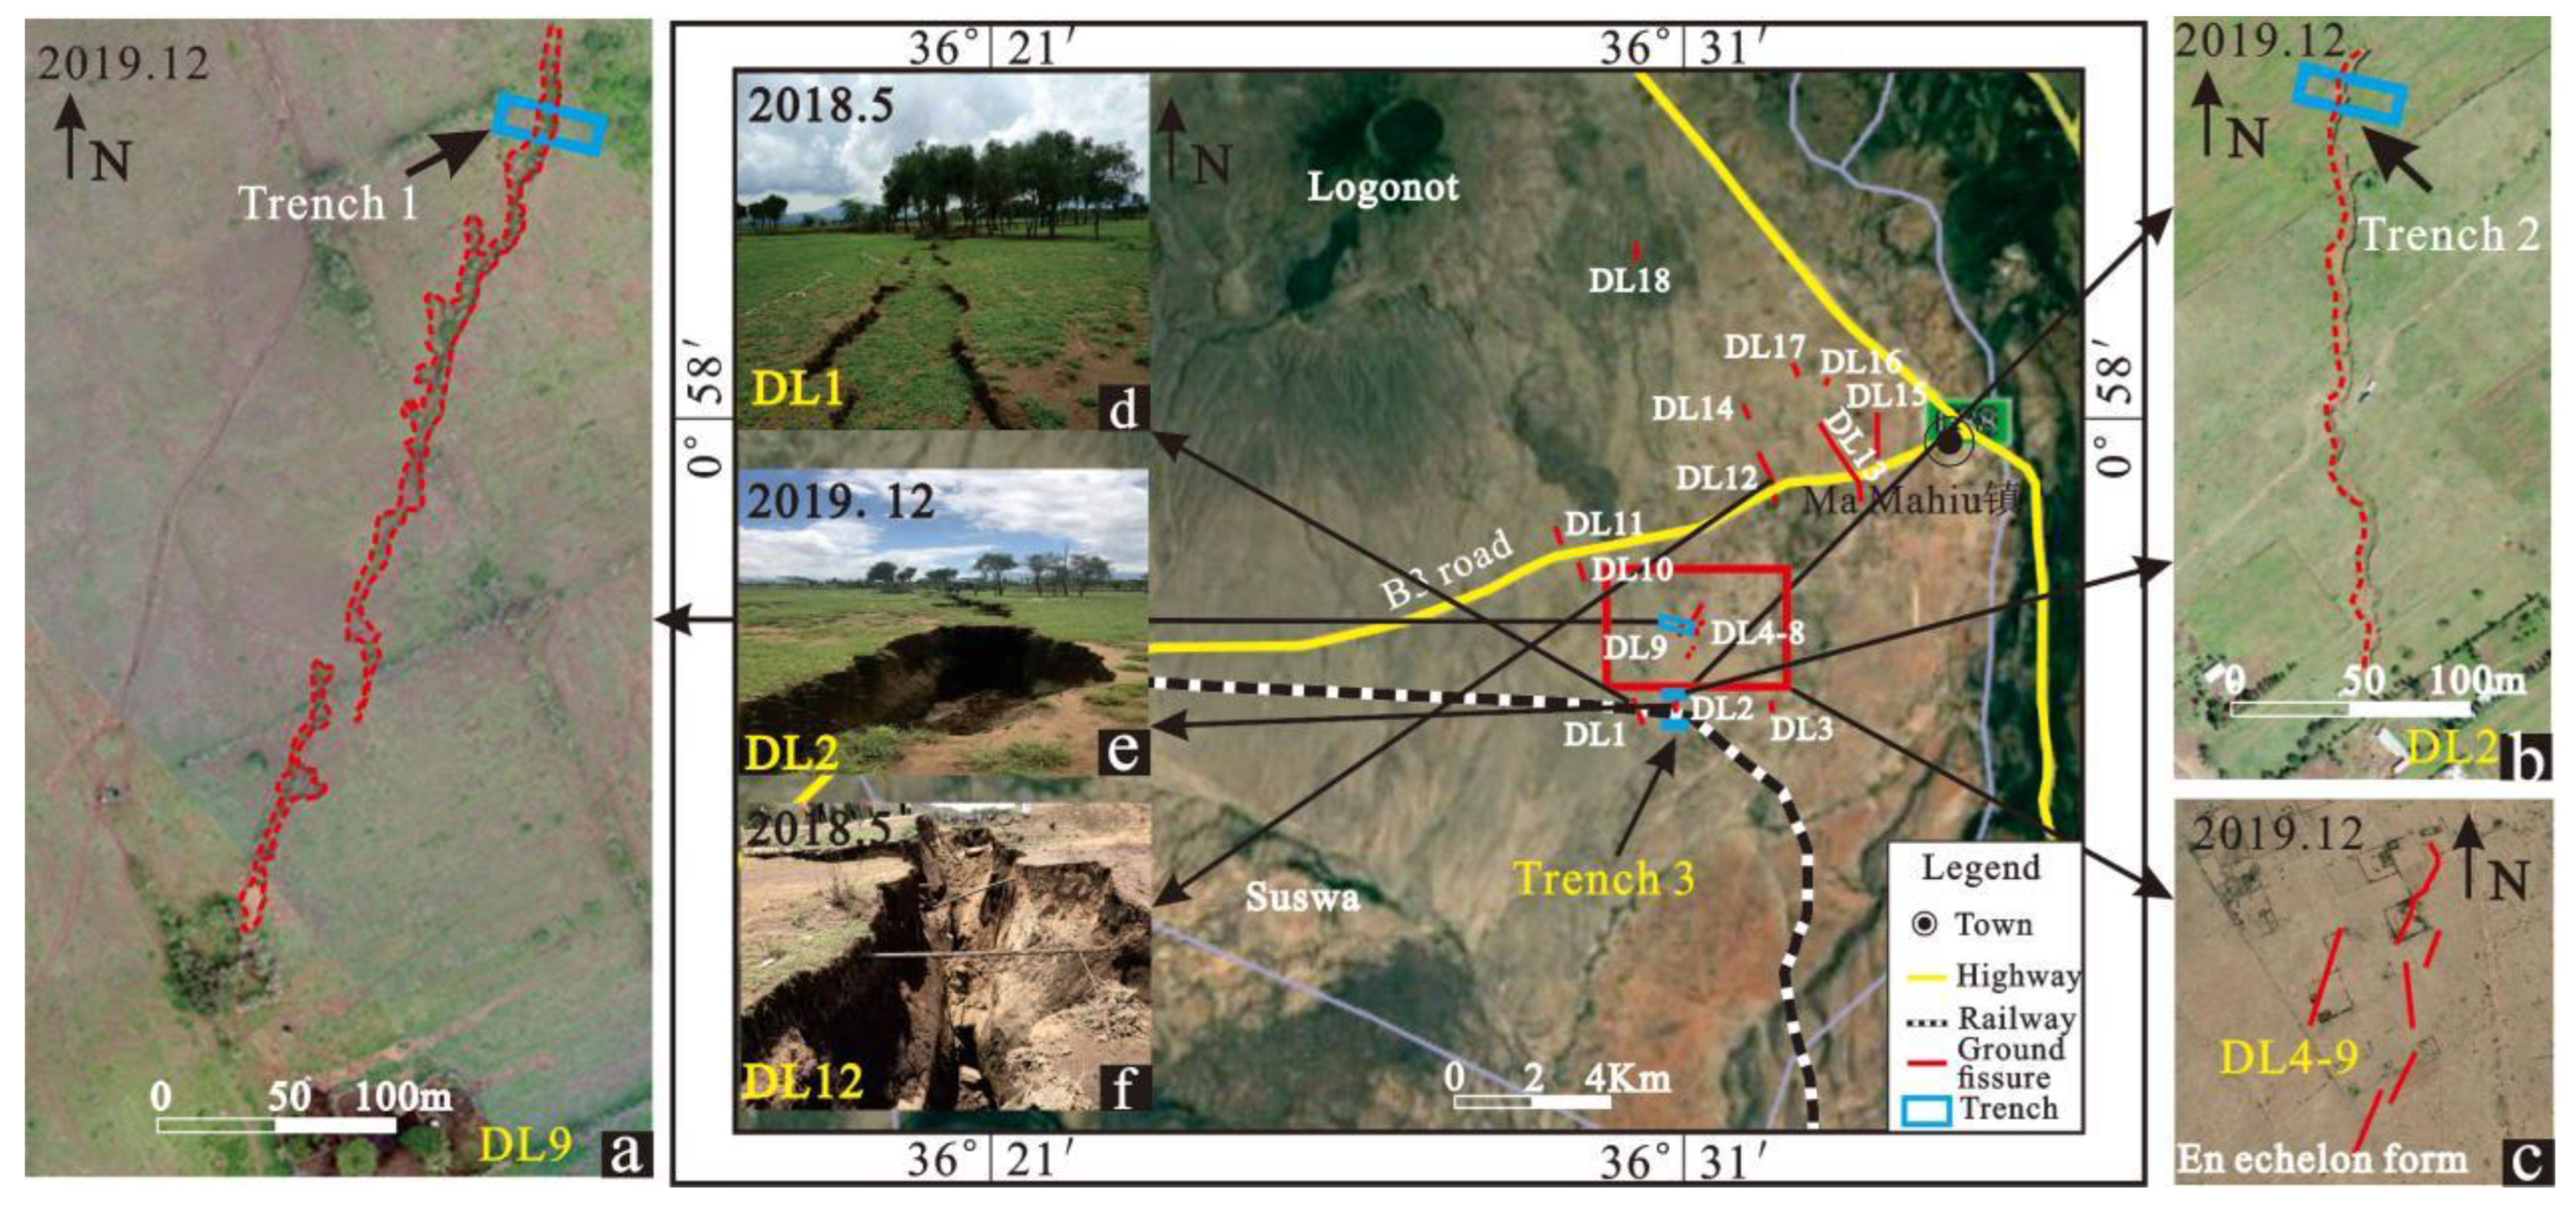
A total of 18 ground fissures were investigated in the study area, all of which showed linear collapse with beaded sinkholes on the surface (Figure 7d–f). The ground fissures mostly extended in a straight line, with an extension length ranging from hundreds of meters to several kilometers. The ground fissures were concentrated in the area close to the rift boundary on the east side, and they had specific directionalities. The plane combination shape of the ground fissures in some areas was distributed in an en echelon form (Figure 7c).
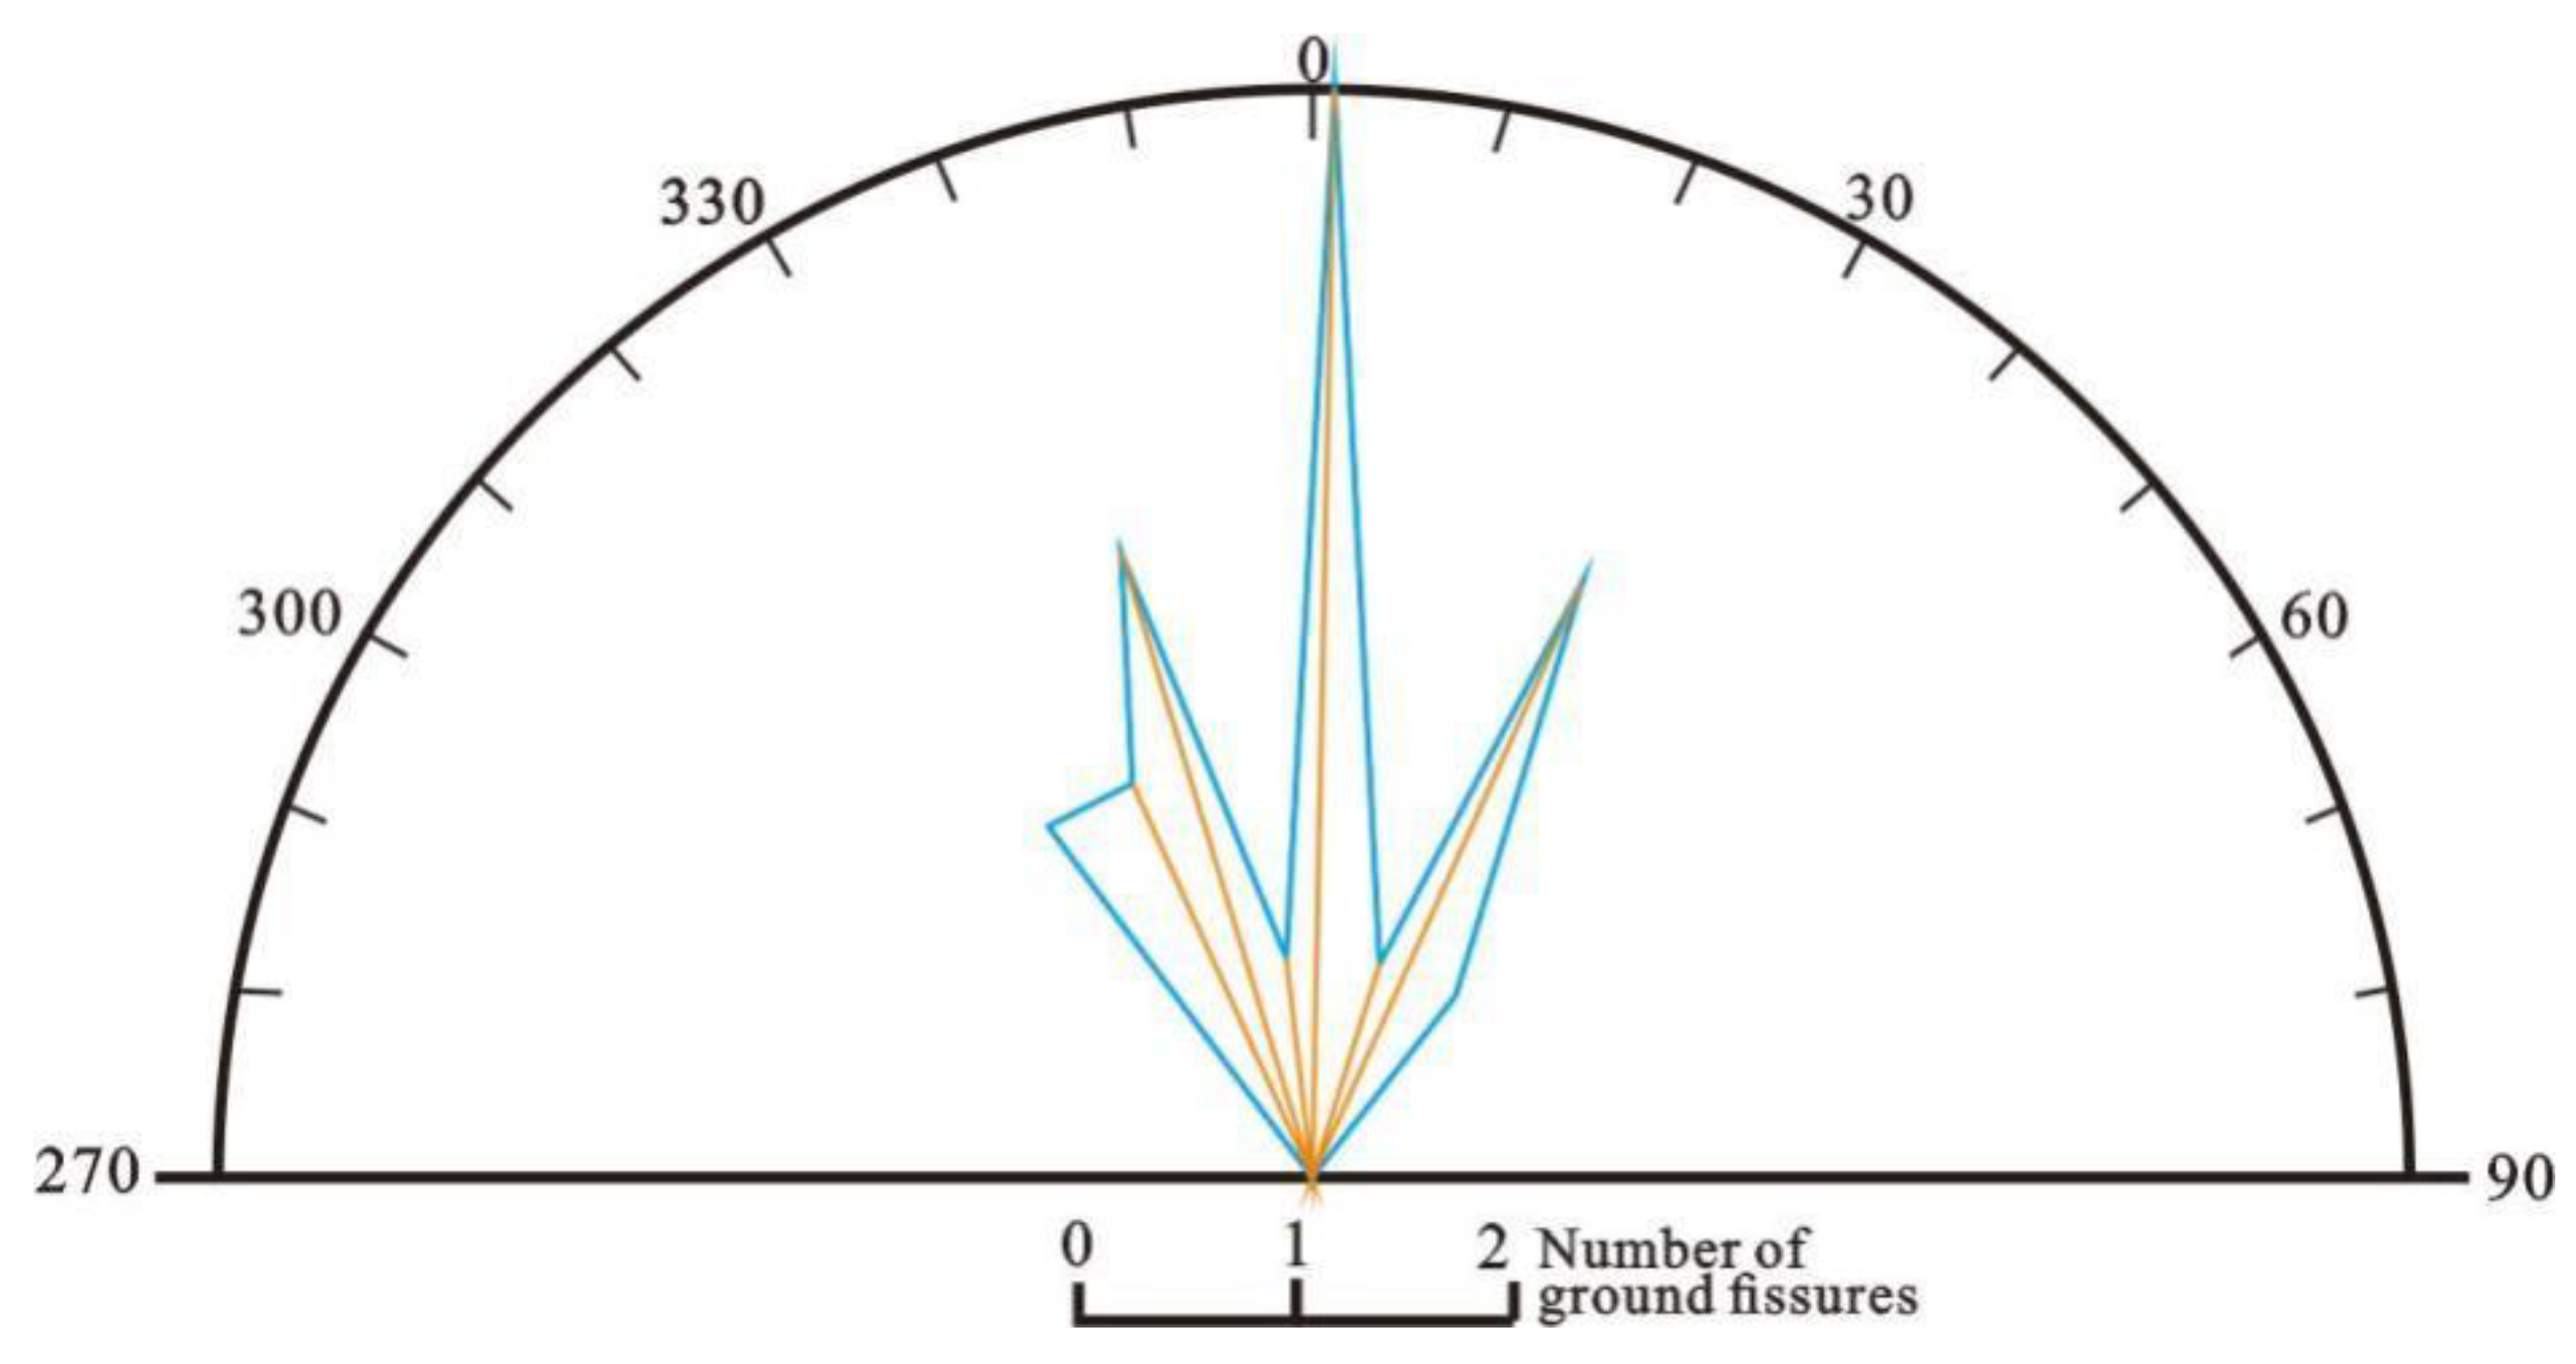
In order to intuitively reflect the directionality of the ground fissures in the study area, we conducted statistical analyses and constructed a rose diagram of the strikes of the 18 ground fissures (Table 4; Figure 8).
As shown in Figure 8, the ground fissure strikes are concentrated in the range of 330–350°, 0–10°, and 20–30°, of which 0–10° is the most developed, with obvious directional development characteristics. The ground fissure strikes are concentrated over a range of approximately 45°, and the historical tectonic stress in the rift area has been deflected by 45°. Therefore, the formation of ground fissures appears to be closely related to the evolution of regional tectonic stress.
4.2. Profile Structure Characteristics of Ground Fissures
In order to reveal the profile structure characteristics of the ground fissures, we created exploration trenches for ground fissures DL2 and DL9; the plane positions of the trenches are shown in Figure 7. The exploration trenches were excavated perpendicular to the direction of the ground fissures. The bottoms of the trenches were composed of weakly weathered volcanic breccia, and the upper part of this layer was composed of interbedded silty sand and pumice.
Two ground fissures were exposed in exploratory Trench 1 of DL9, namely the main fissure (f1) and secondary fissure (f2) (Figure 9a). The profile of f1 was a wedge shape with a wide top and a narrow bottom. The widest part at the top of the ground fissure was approximately 2.8 m wide, and the narrowest part at the bottom of the ground fissure was 0.7 m wide. The ground fissure had been extensively eroded by the infiltration of surface water. The soil around the crack was black-brown with a high organic matter content, and the soil had also clearly been eroded by surface water infiltration. In contrast to fissure f1, the width of fissure f2 was small (approximately 5–16 cm), and the portion above the bedrock surface had been filled. The fracture was nearly vertical in this section, and no obvious fracture had been formed on the surface, which was visible as a beaded sinkhole. The lower parts of the two ground fissures exposed by the exploration trench were connected by hidden bedrock cracks. The soil on both sides of the cracks was horizontal, and there was no obvious vertical dislocation.
The profile shapes of the ground fissures exposed by Trenches 2 and 3 (see Figure 7 for positions) were similar to those of Trench 1; these fissures also took the form of a wedge shape that was wide at the top and narrow at the bottom (Figure 9b,c). There was obvious erosion in the ground fissures, owing to rainfall infiltration in these trenches. The bottoms of the ground fissures were connected by bedrock cracks, which were characterized by tensile fracturing. The strata on both sides of the ground fissures were horizontal, without obvious vertical dislocation. The soil at the filled portions of the ground fissures was uniform and complete, and no tension or shear cracks were observed. Therefore, the walls of these ground fissures were relatively stable, and rainfall erosion infiltration was an important inducing factor for their exposure at the surface.
4.3. Fracture Characteristics of Concealed Bedrock
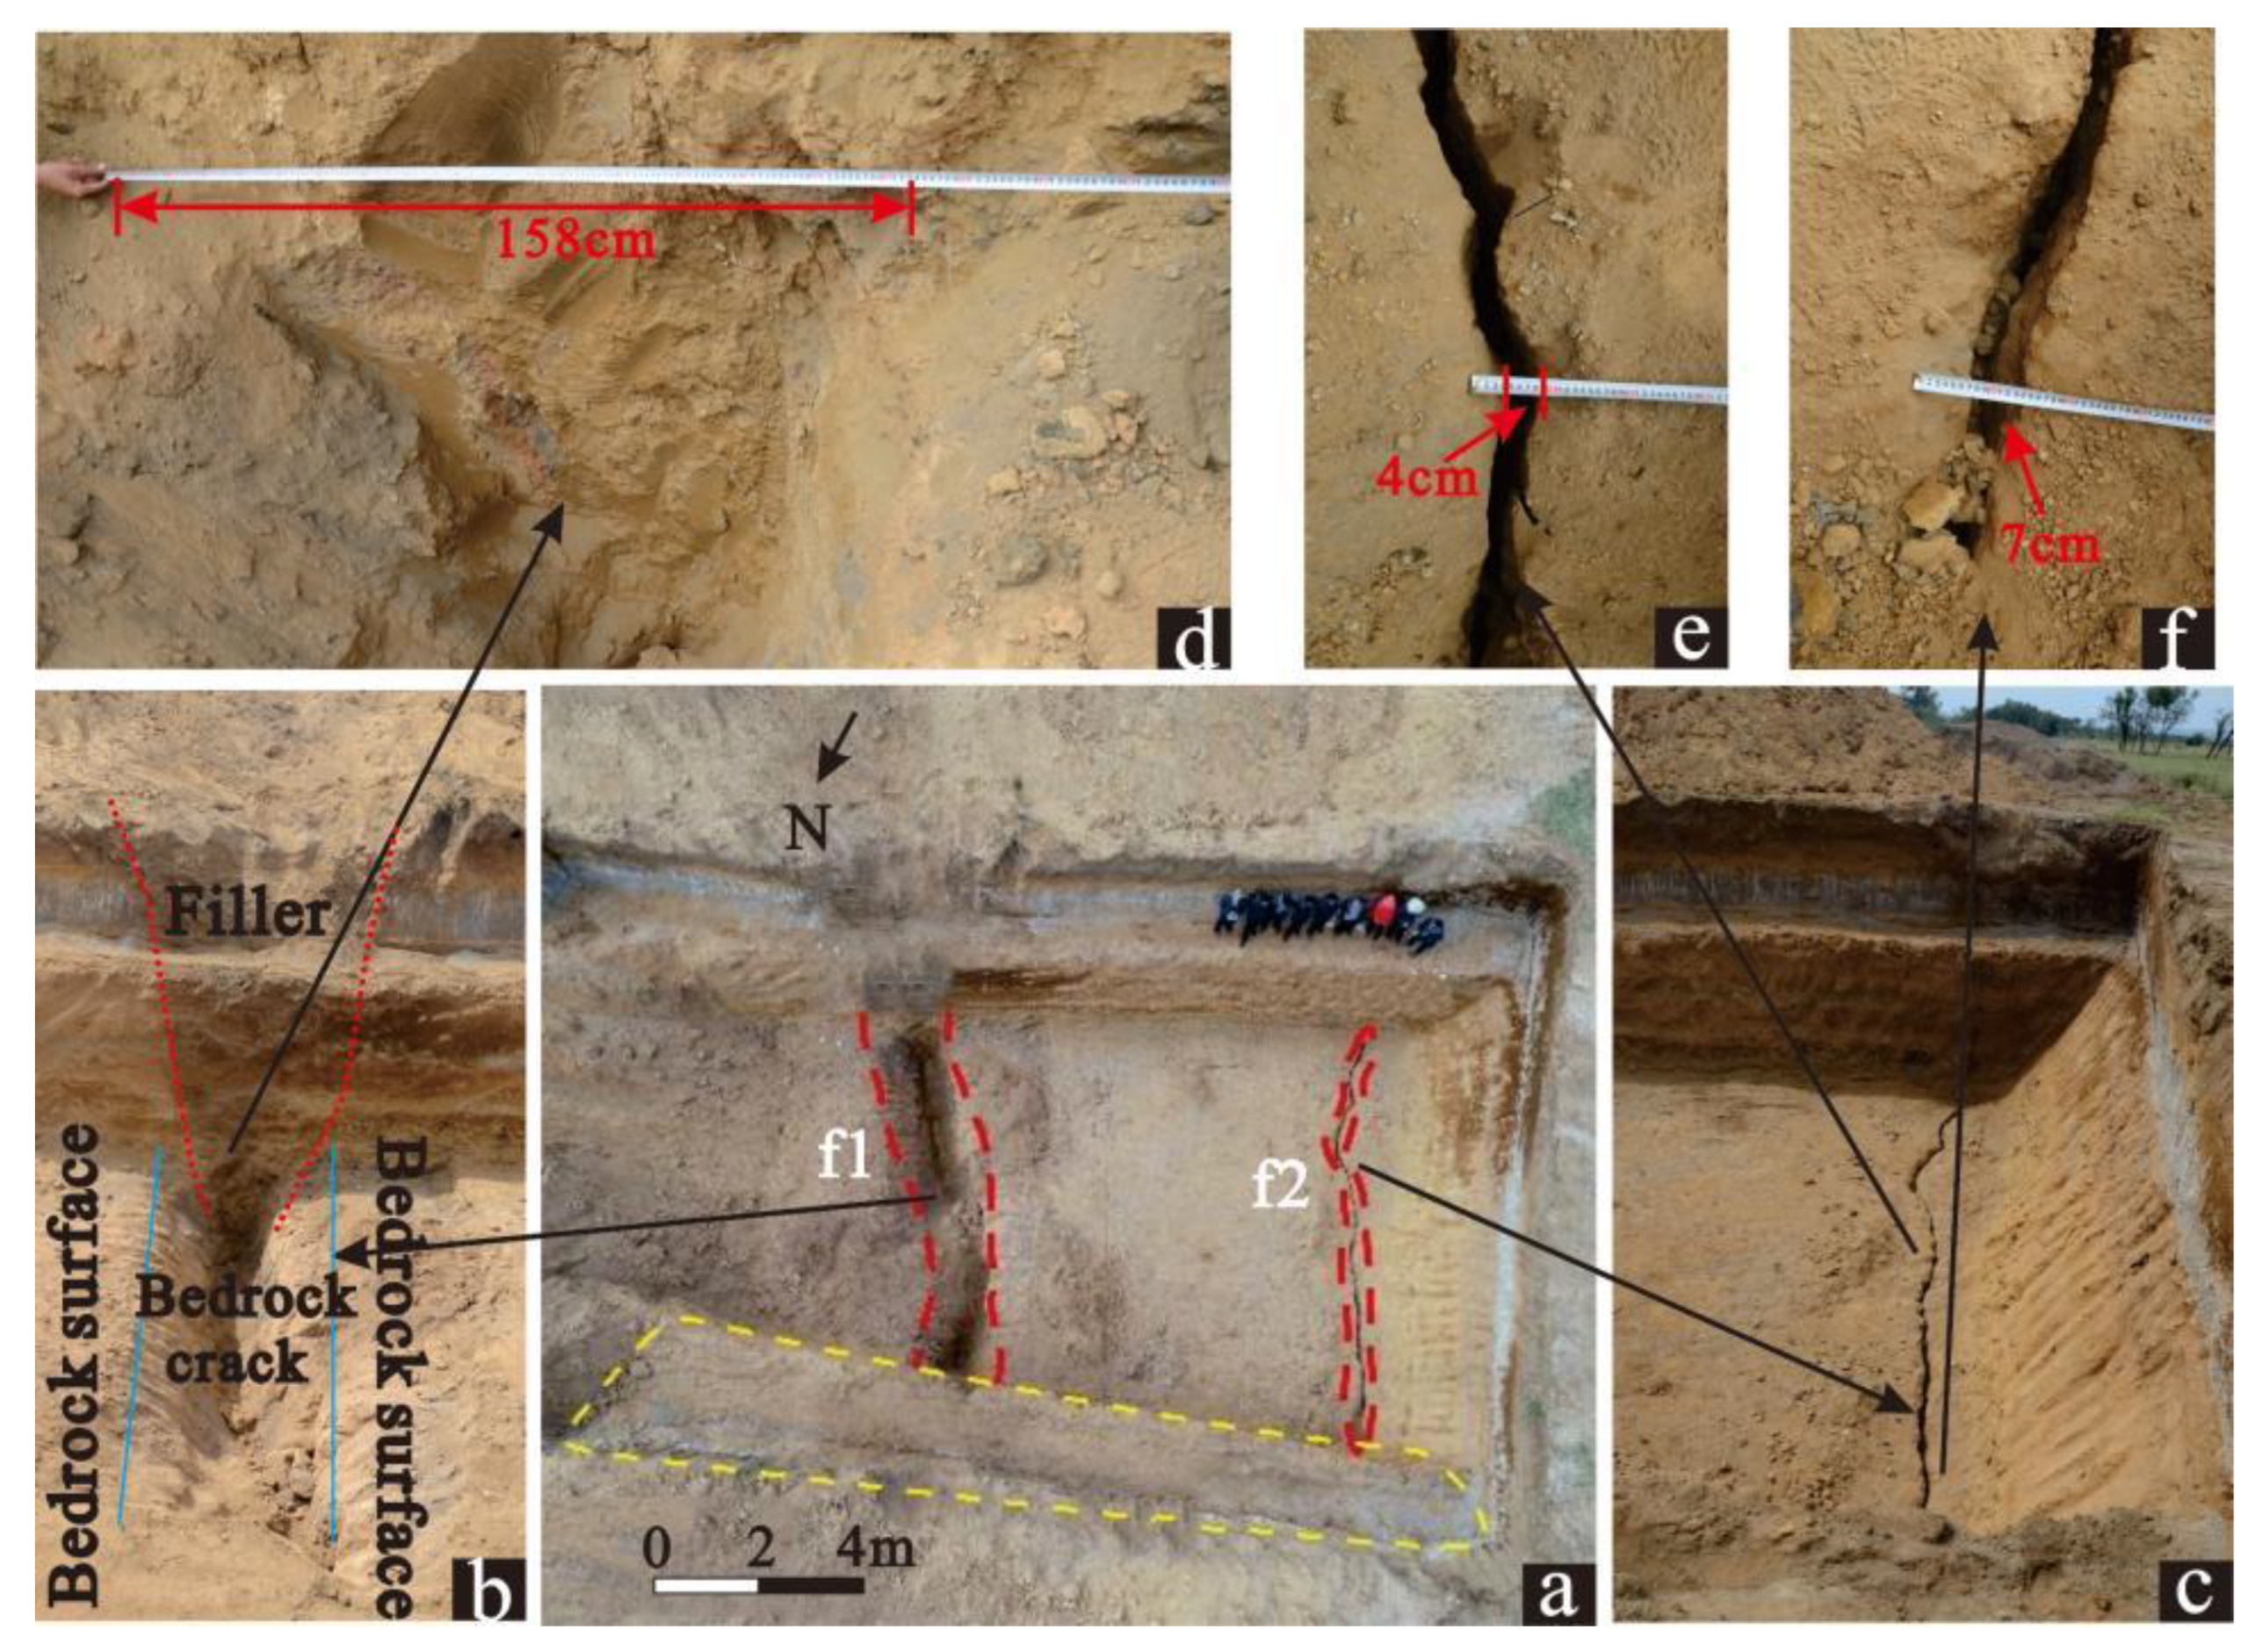
Exploratory Trench 1 was excavated to a depth of 6 m to reach the volcanic rock. After cleaning the bedrock surface, previously hidden bedrock cracks were clearly observed. The bedrock cracks and the area above the bedrock surface of f1 were filled with silty sand, whereas f2 remained open and unfilled (Figure 10d,e). Morphological observations of the f2 bedrock crack showed that the side wall of the crack was vertical and rough, but there were no obvious horizontal or vertical dislocations on either side; these are characteristics of obvious tensile cracking (Figure 10f). The widths of the f1 and f2 cracks were approximately 150 cm and 4–10 cm, respectively, and their strikes were 17° and 35°, respectively; both followed the NNE direction, which is approximately perpendicular to the direction of the minimum horizontal stress in the region.
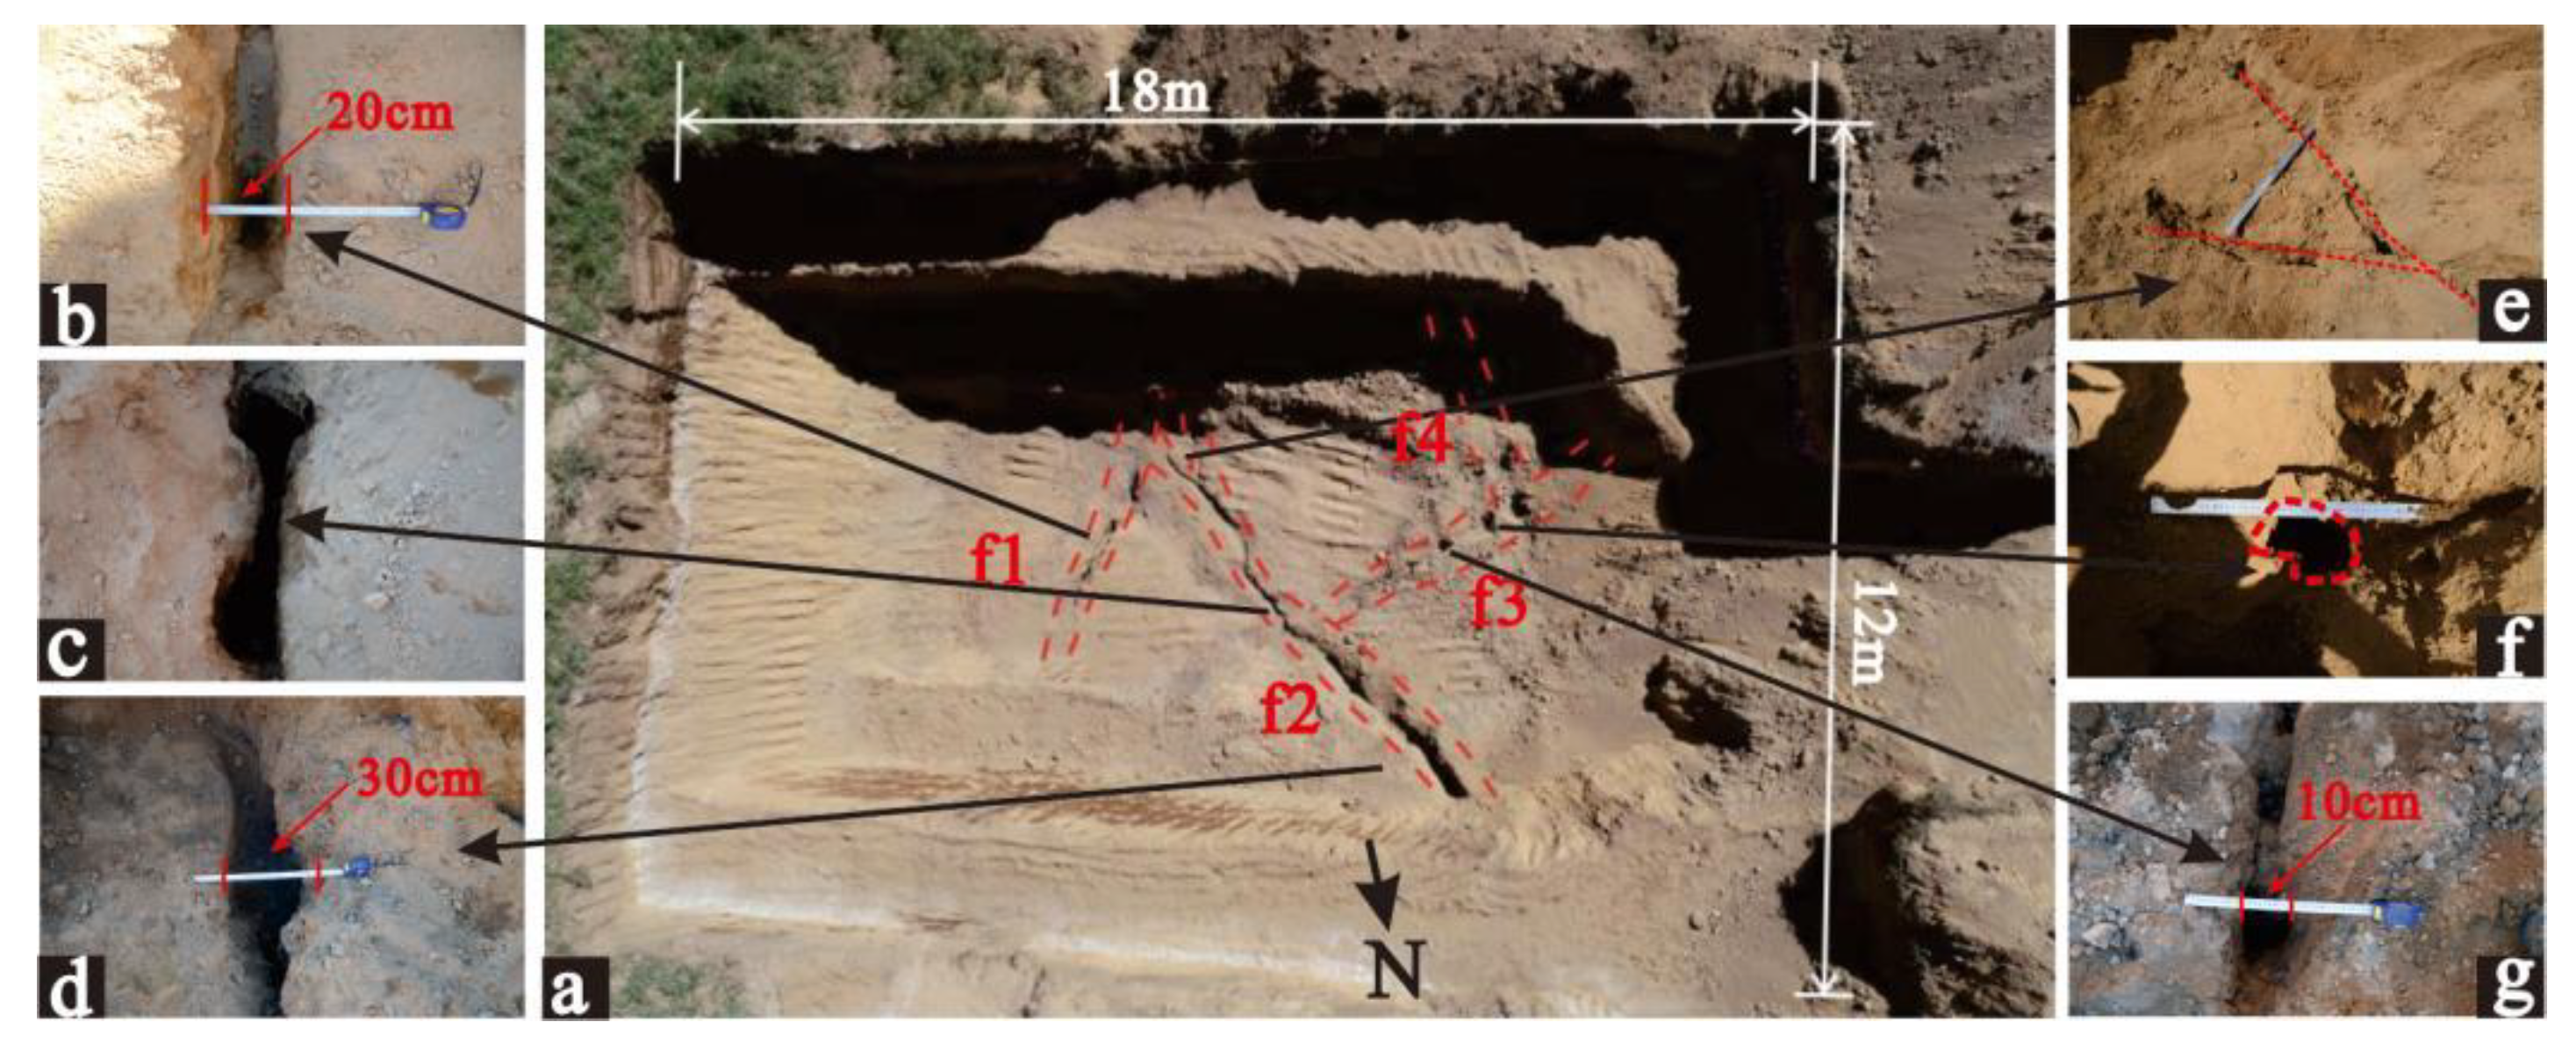
Four bedrock cracks were exposed in Trench 2 (Figure 11). The f2 bedrock crack corresponded to the surface collapse position. Of the four bedrock cracks, f2 had the largest opening (approximately 30 cm) and the best extensibility. We thus considered it to be the main crack within the bedrock fracture group. Crack f2 extended in the shape of a broken line and bifurcated in the south, forming a shape similar to the letter “Y” (Figure 11e). The strike of main fracture f2 was approximately 333.5°, extending in the NW direction. The secondary fractures f1, f3, and f4 were linear with NNE strikes, and they obliquely intersected the main fracture. The bedrock cracks in Trench 2 were grid-shaped, the soil on both sides of the cracks was horizontal, and there was no obvious vertical dislocation.
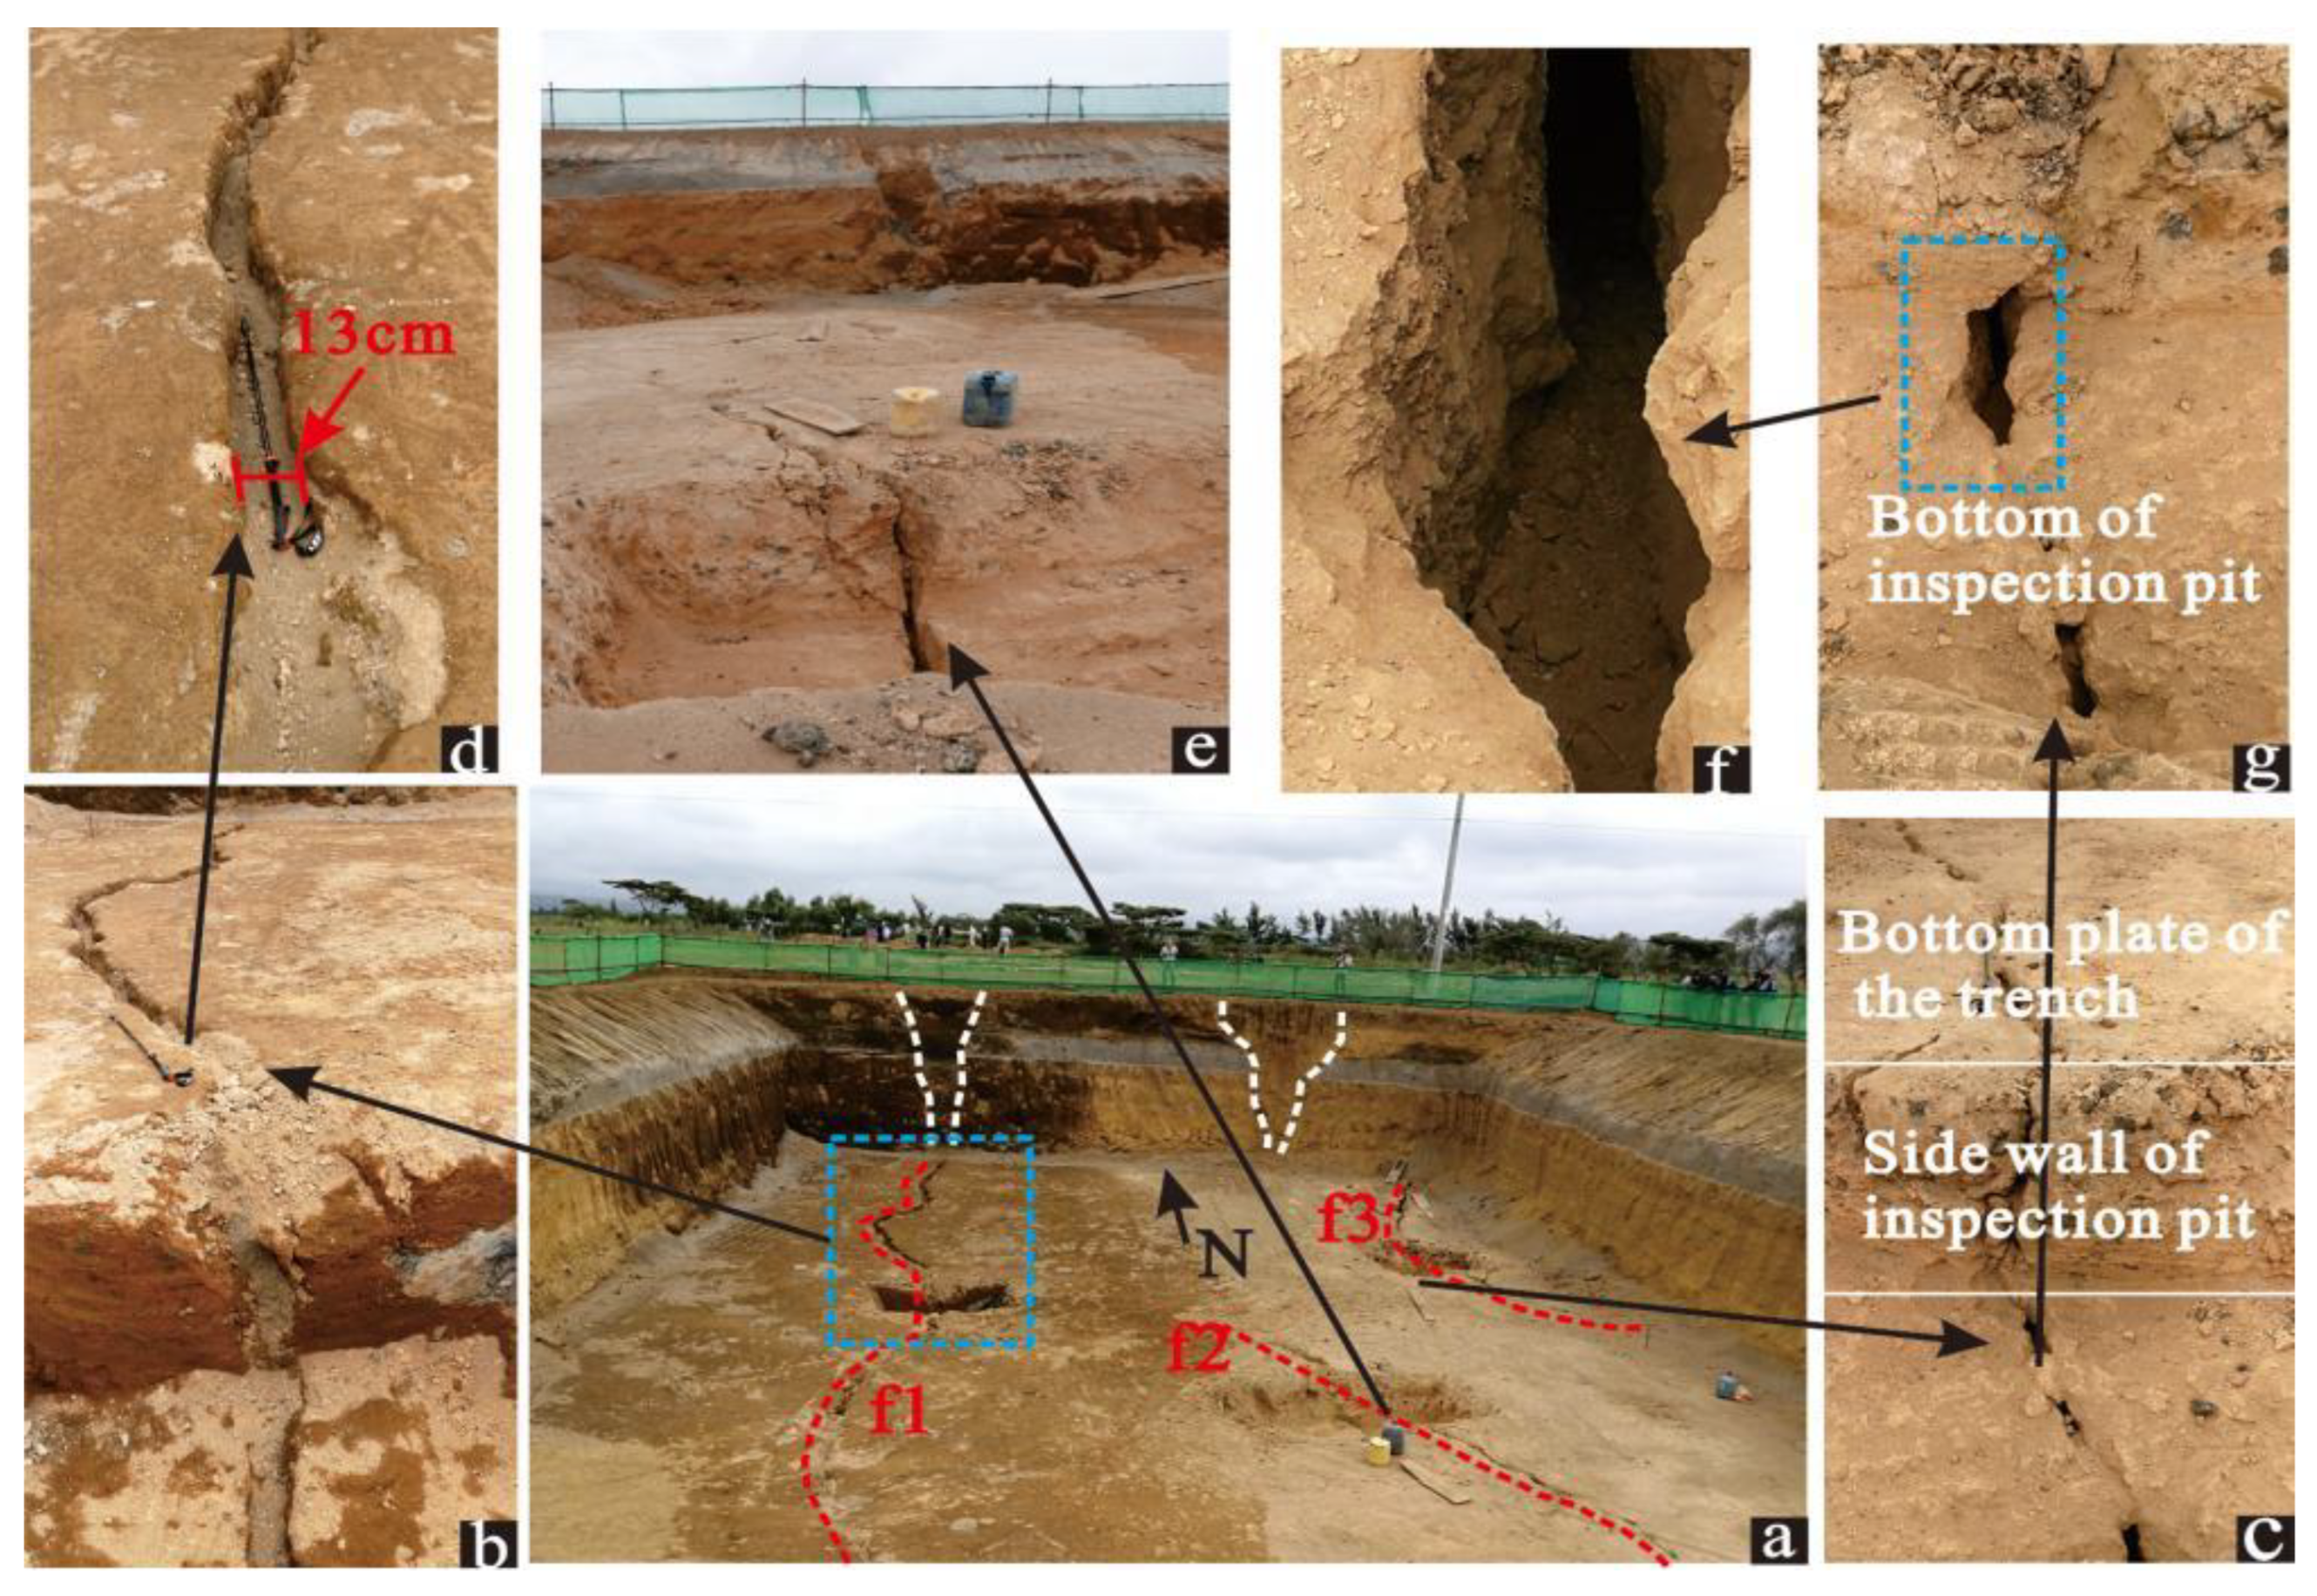
Three ground fissures were exposed in Trench 3 (Figure 12). Bedrock cracks f1 and f3 had the form of a curved extension, whereas f2 had the form of a straight line (Figure 12a). The crack opening was largest in f1, with a width of approximately 13 cm (Figure 12d). The fracture strike was mainly in the NE and NW directions. In order to determine the profile shape of the bedrock cracks, three inspection pits were excavated (Figure 12b–e). According to the exposure results of the inspection pits, the side walls of the bedrock cracks were vertical and rough, and some crack sections were filled. For all cracks, there were no obvious vertical dislocations on either side of the crack.
The concealed bedrock cracks exposed by the exploration trenches had the following common characteristics: (1) the plane shapes of the fractures were mainly curved with broken lines, and the ground fissures were distributed in parallel or in a grid; (2) the bedrock cracks had obvious directionality and were mainly concentrated in the NNE, NW, and NS directions; and (3) the side walls of the cracks were vertical and rough, and had a certain degree of opening, indicating tensile crack characteristics.
The hidden bedrock fractures show typical tensile fracture characteristics, which are consistent with the tectonic stress environment of extensional and tensile regions formed by deep thermal activity in the Kenya Rift Valley.
4.4. Numerical Simulation of Rainfall Infiltration Process
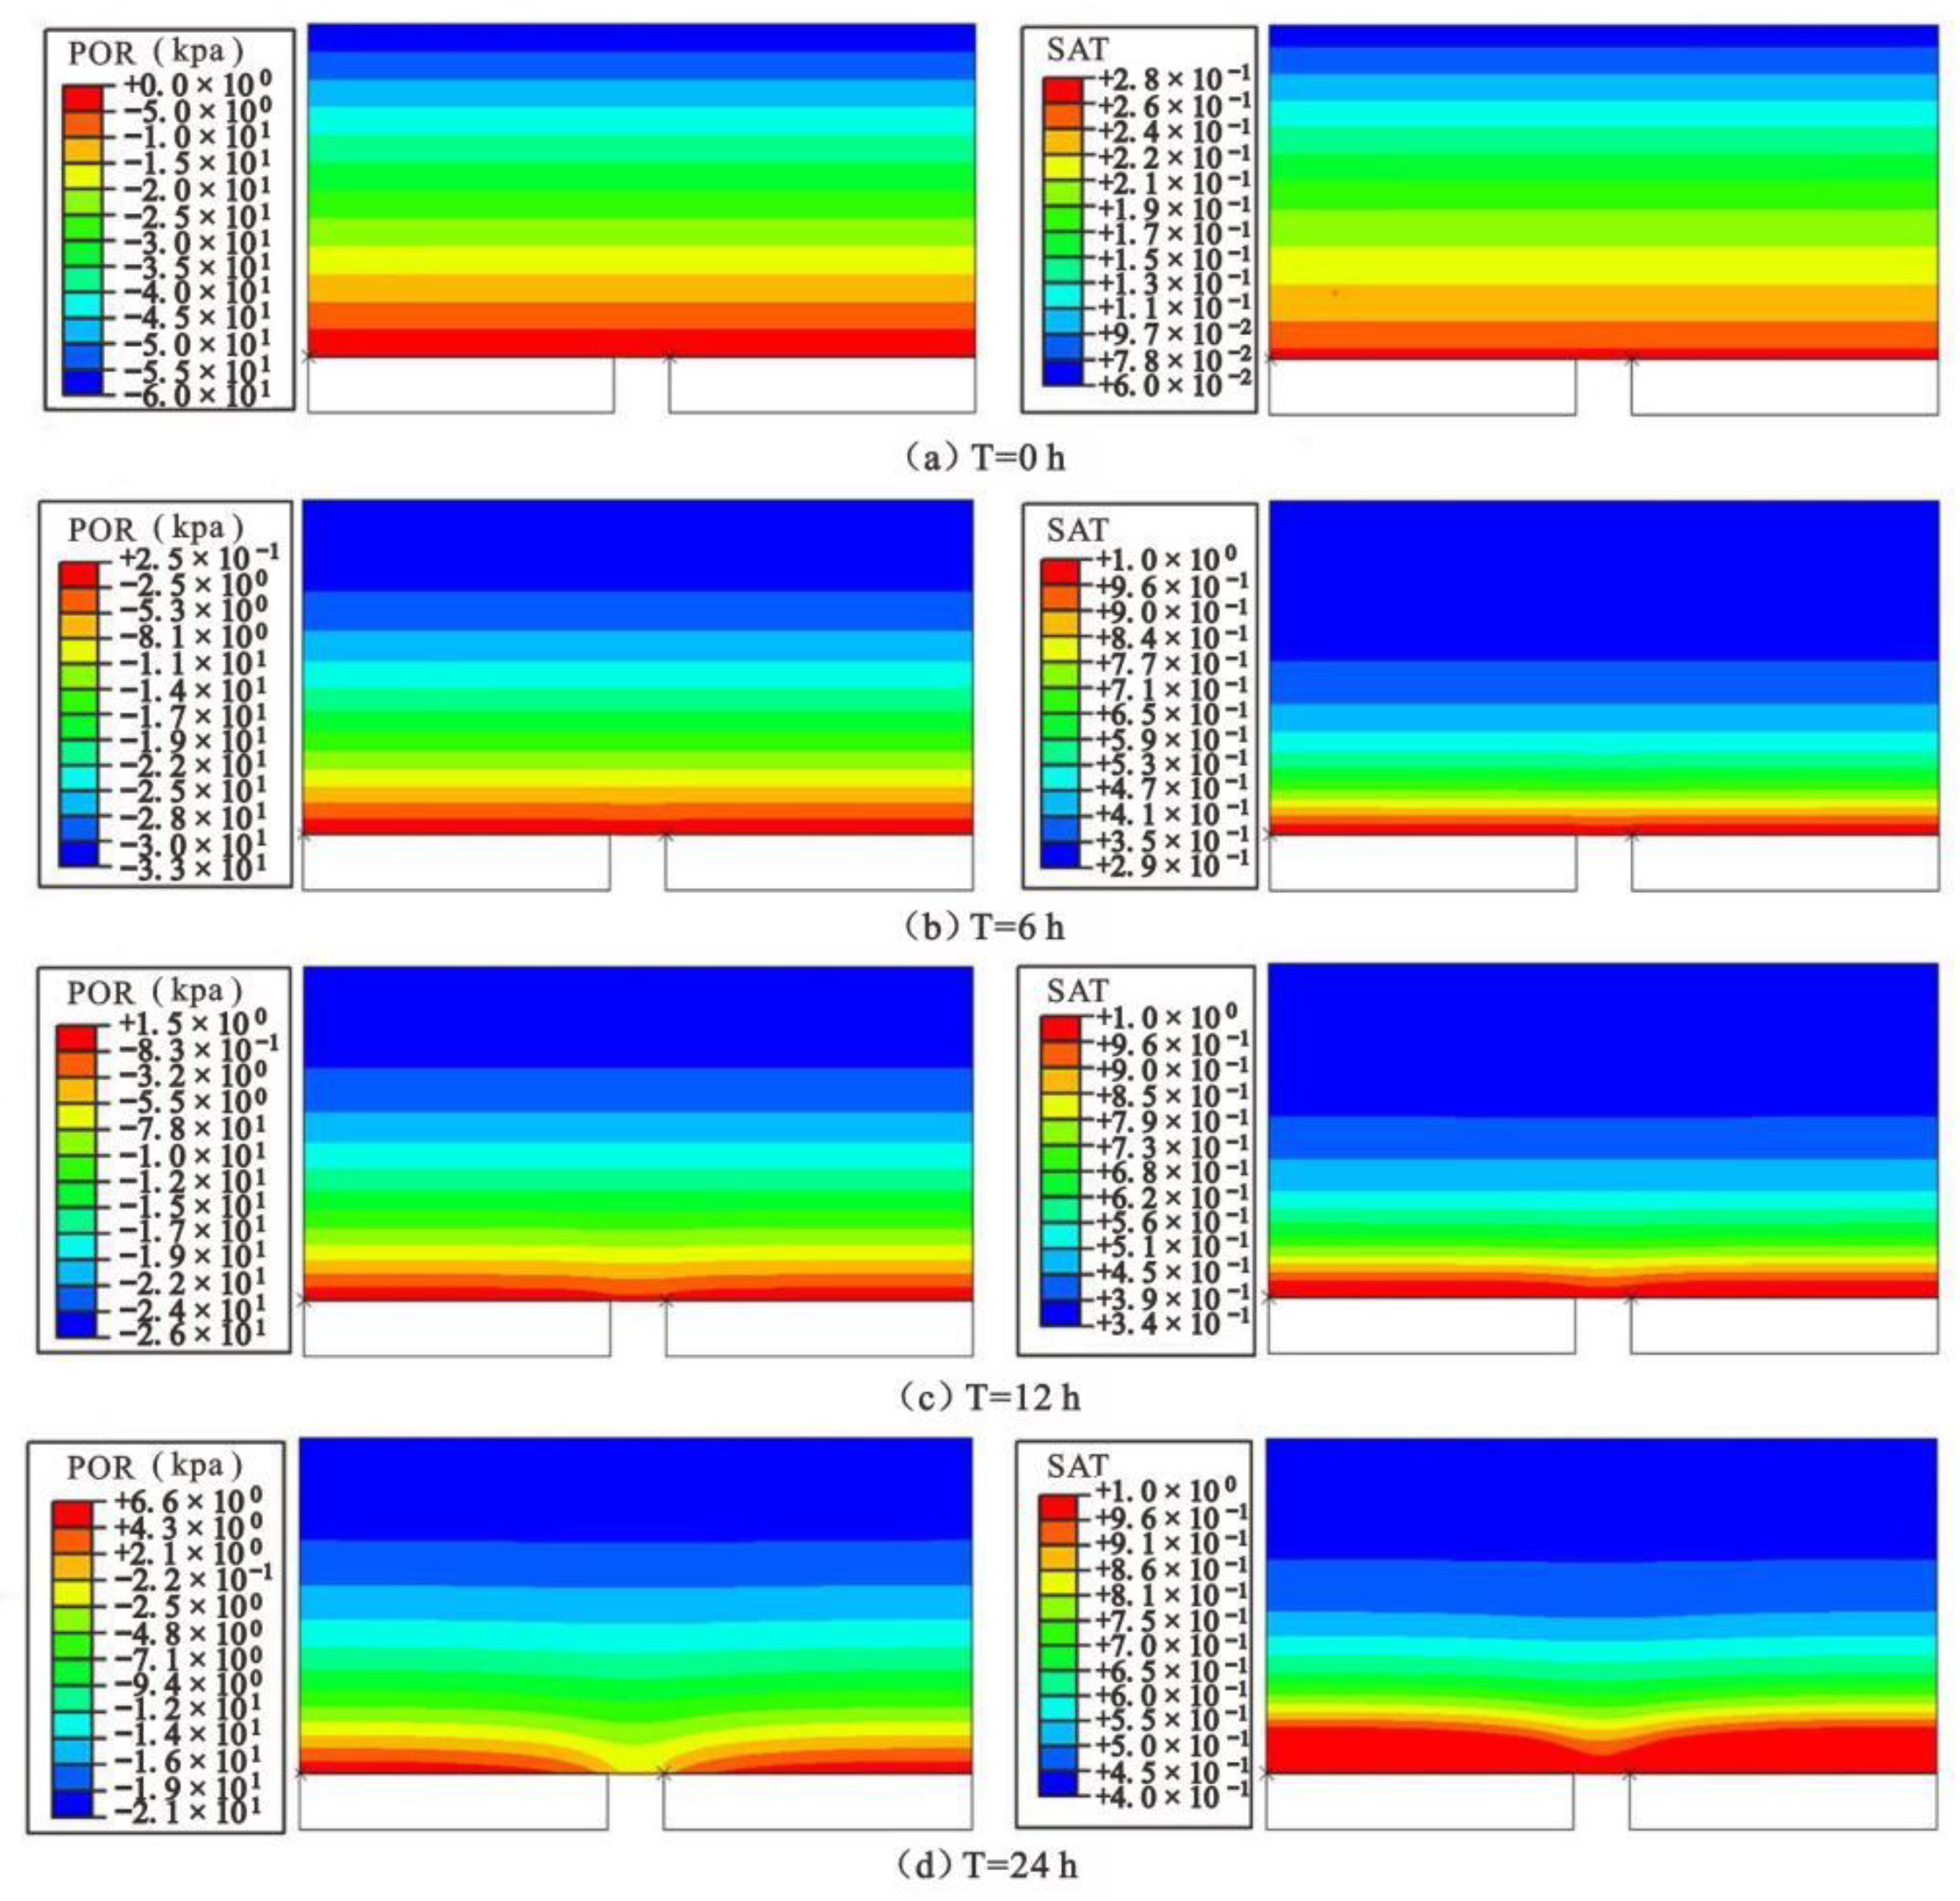
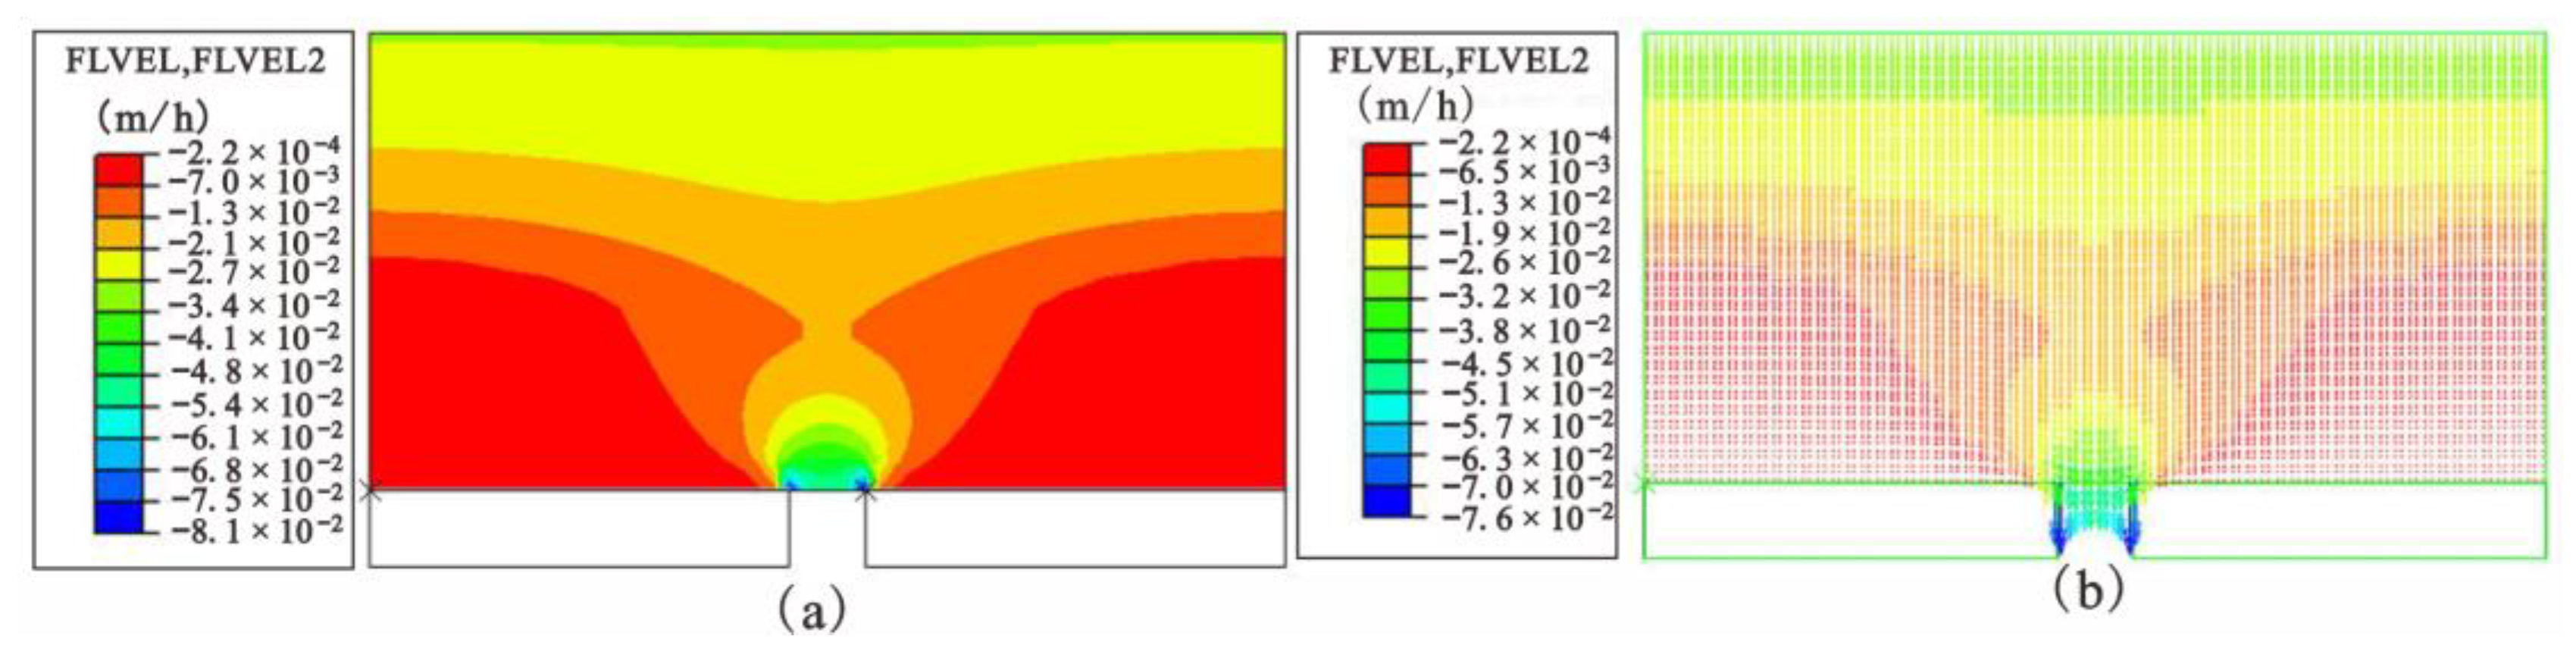
Initially, the soil was found to be in an unsaturated state with negative pore water pressure (Figure 13a). However, with rainfall, water gradually seeped downwards from the surface. A rock layer with a low permeability coefficient exists at the bottom of the loose overburden, forming a relatively water-resistant layer; thus, water accumulated at the bedrock surface. This accumulation resulted in the gradual saturation of the soil near the bedrock surface. After six hours of rainfall, the soil at the bottom became saturated, and at the same time, positive pore pressure began to appear (Figure 13b). During the subsequent continuous rainfall process, the saturated area gradually expanded and the pore water pressure gradually increased (Figure 13c). The contact between the soil at the bedrock crack and the atmosphere provides a free surface for seepage; thus, the pore pressure was found to be relatively low on both sides of the crack (Figure 13d). According to a vertical velocity diagram, the flow velocity at the bedrock crack is larger than that at a position far away from the bedrock crack. The larger seepage velocity at the bedrock crack may cause the hydraulic erosion of the soil to be more intense than that in other areas (Figure 14).
4.5. Deformation Characteristics under Rainfall Infiltration
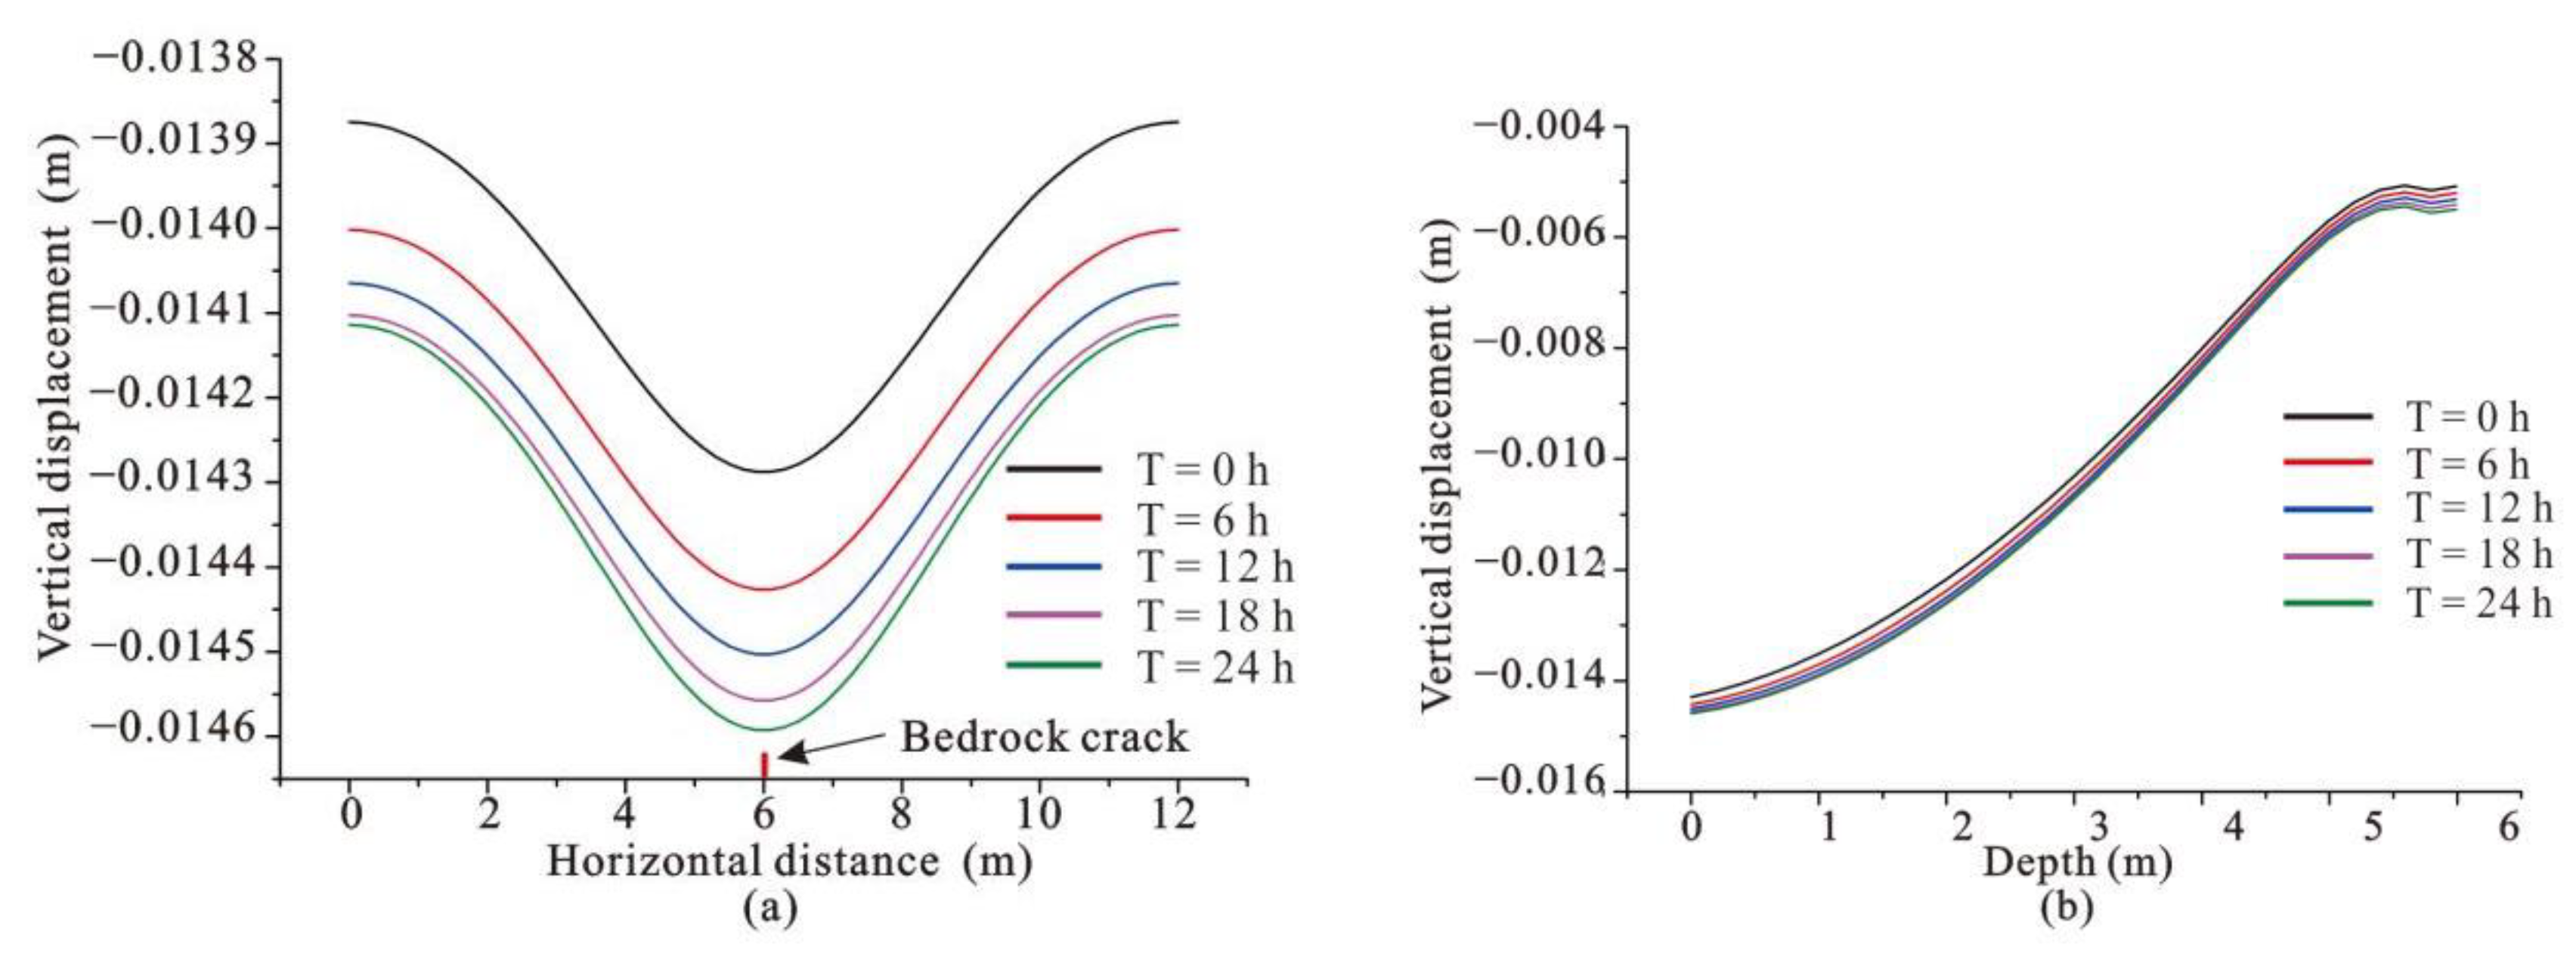
The soil mass of the loose accumulation layer was found to be deformed during continuous rainfall, to a certain extent. Therefore, we constructed a time-varying curve of the vertical displacement of the surface soil (Figure 15a) and a time-varying curve of the vertical displacement of the soil at different depths above the concealed crack (Figure 15b). The locations of the vertical displacement monitoring points in the numerical model are shown in Figure 5. In the presence of hidden cracks, the soil settled vertically under the action of gravity (corresponding to the displacement curve of T = 0 h in Figure 15). The maximum vertical displacement in the upper area of the concealed bedrock crack was approximately 14.3 mm, and there was a small amount of settlement away from the crack. After the onset of rainfall, the settlement of the surface soil was largest at the hidden bedrock crack. On the variation curve of the vertical displacement of the surface soil with time, the distance between adjacent time curves decreased gradually, which indicated that the settlement rate was fast during the initial stage of rainfall and gradually slowed down during the later stages (Figure 15a). This occurred because the soil mass was in an unsaturated state at the initial stage of rainfall, and rainfall then increased the weight of the soil mass, which resulted in its compression. With continuous rainfall, the soil gradually became saturated and the effective stress decreased, so the settlement rate gradually slowed down. The displacement versus time curves at different depths show that the settlement of shallow soil was greater than that of deep soil, because the settlement of shallow soil accumulated the combined settlement of lower soil (Figure 15b).
5. Discussion
5.1. Genesis Mechanism of Concealed Bedrock Fracture
According to the field survey results, the Kenya Rift Valley is characterized by obvious tectonic ground fissures. The ground fissures are distributed along the NW, NS, and NNE plane directions, and some ground fissures are distributed in an en echelon form. Parts of some of the ground fissures were exposed through exploratory trenches, and the results showed that the ground fissures were connected via concealed bedrock cracks. The existence of these concealed bedrock cracks is not only the tectonic basis for the formation of ground fissures in this area, but also the main controlling factor that determines the scale and location of ground fissures. The morphological characteristics of the hidden bedrock fractures in the Kenya Rift Valley show that they are tensile fractures. The strikes of the tension cracks are parallel to the direction of maximum principal stress (σ1) and perpendicular to the direction of minimum principal stress (σ3) (Figure 3) [16].
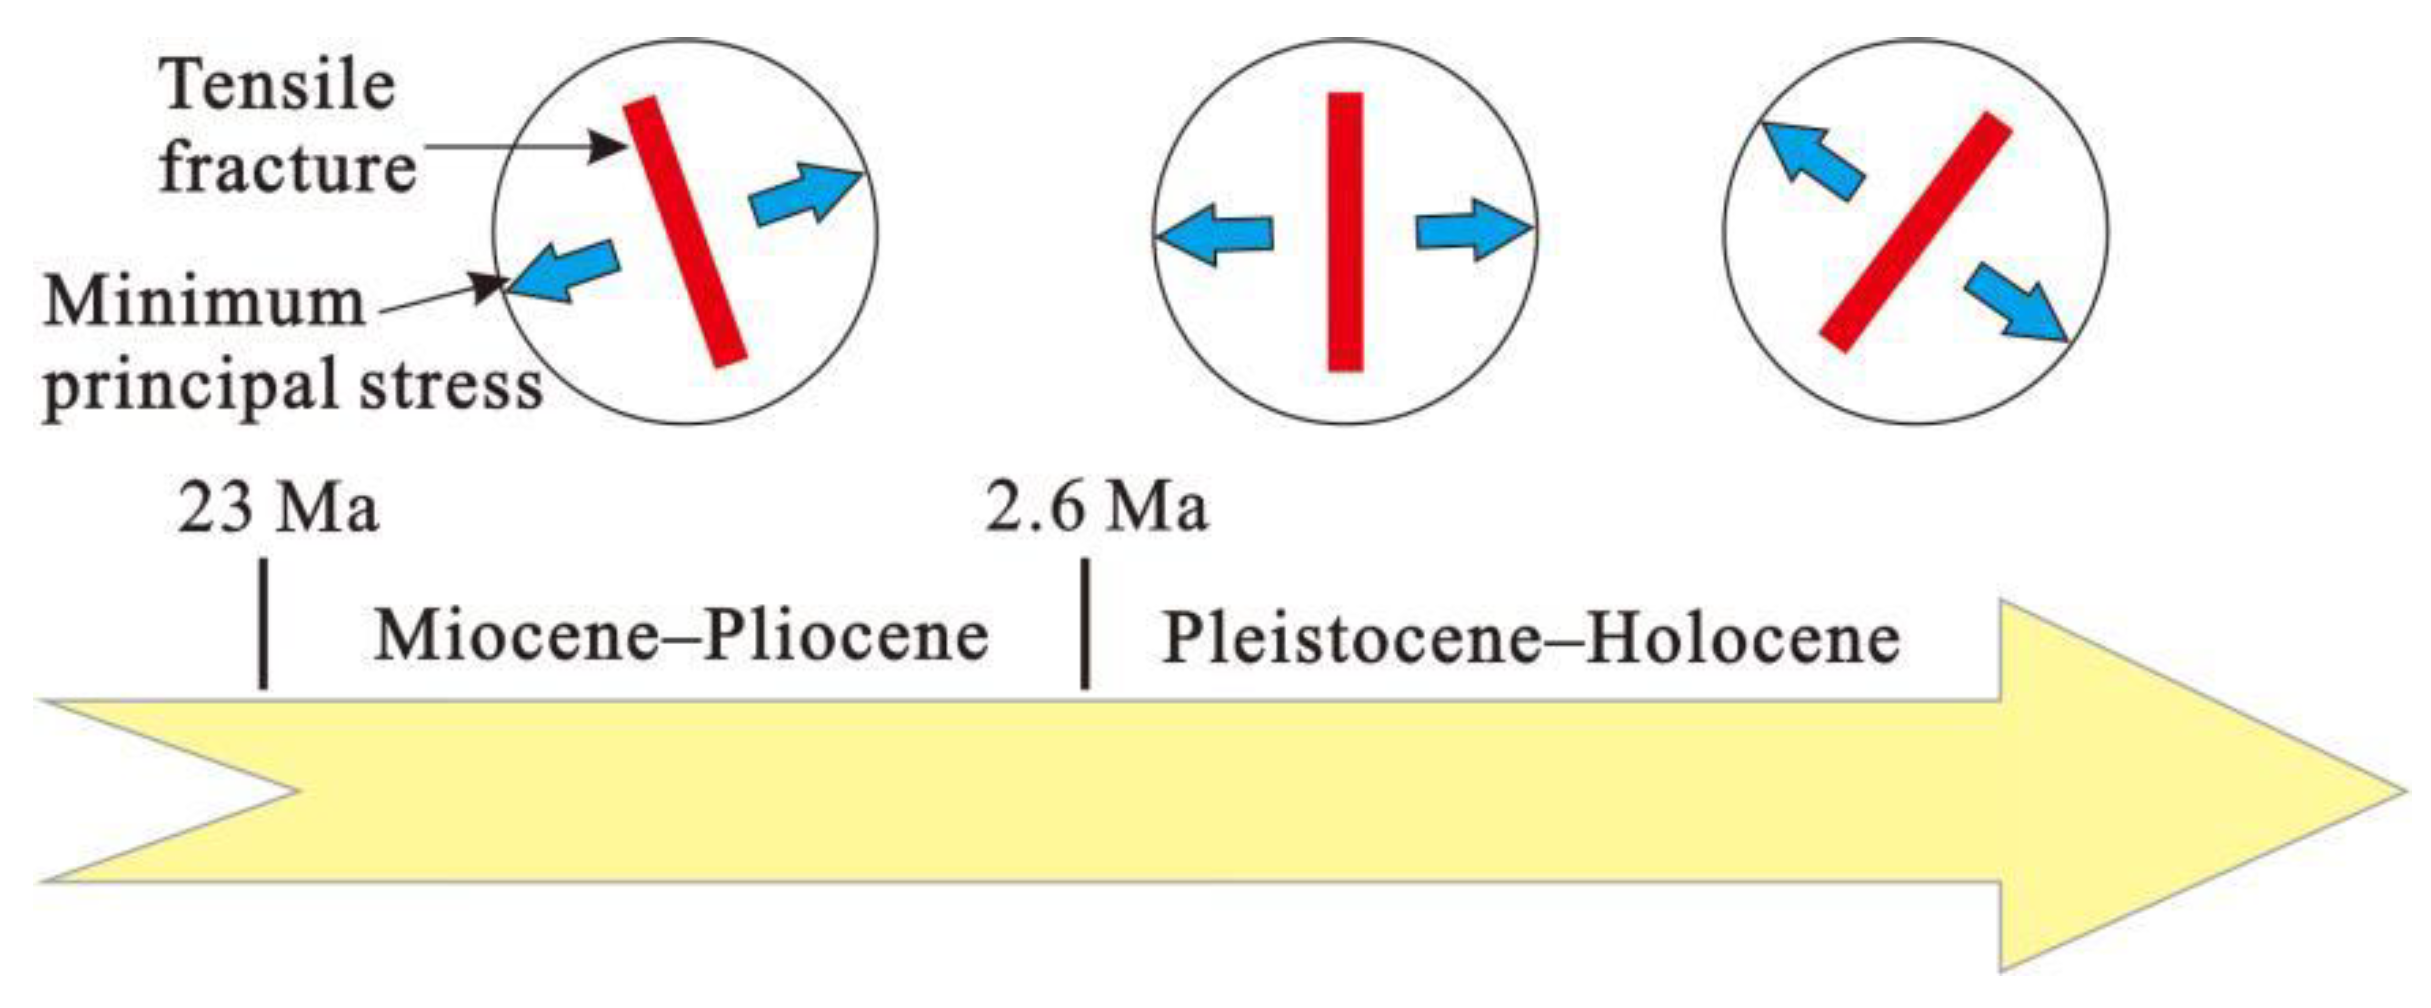
The direction of the minimum principal stress in the Kenya Rift Valley from the Miocene to the Pliocene was ENE-WNW. After the Upper Pleistocene, the minimum principal stress in East Africa rotated clockwise from E-W to NW-SE [20]. At present, the direction of the minimum principal stress in the rift area is NW-SE. According to the mechanical mechanism of tensile fracture development, its strike should be perpendicular to the direction of regional minimum stress. Therefore, the strike of the tension fractures formed between the Miocene and the Pliocene should be NNW. After the Pliocene, the principal stress was deflected clockwise, and the dominant trend of the tension fractures gradually deflected from N-S to NE-SW (Figure 16). According to the mechanical analysis of the tensile fracture and the principal stress direction, the direction of the theoretical tensile cracks in the rift valley area (NW to NE) is consistent with the dominant trend of the current concealed bedrock fractures found in the field. Therefore, the formation of concealed bedrock fractures is controlled by the direction of regional tectonic stress.
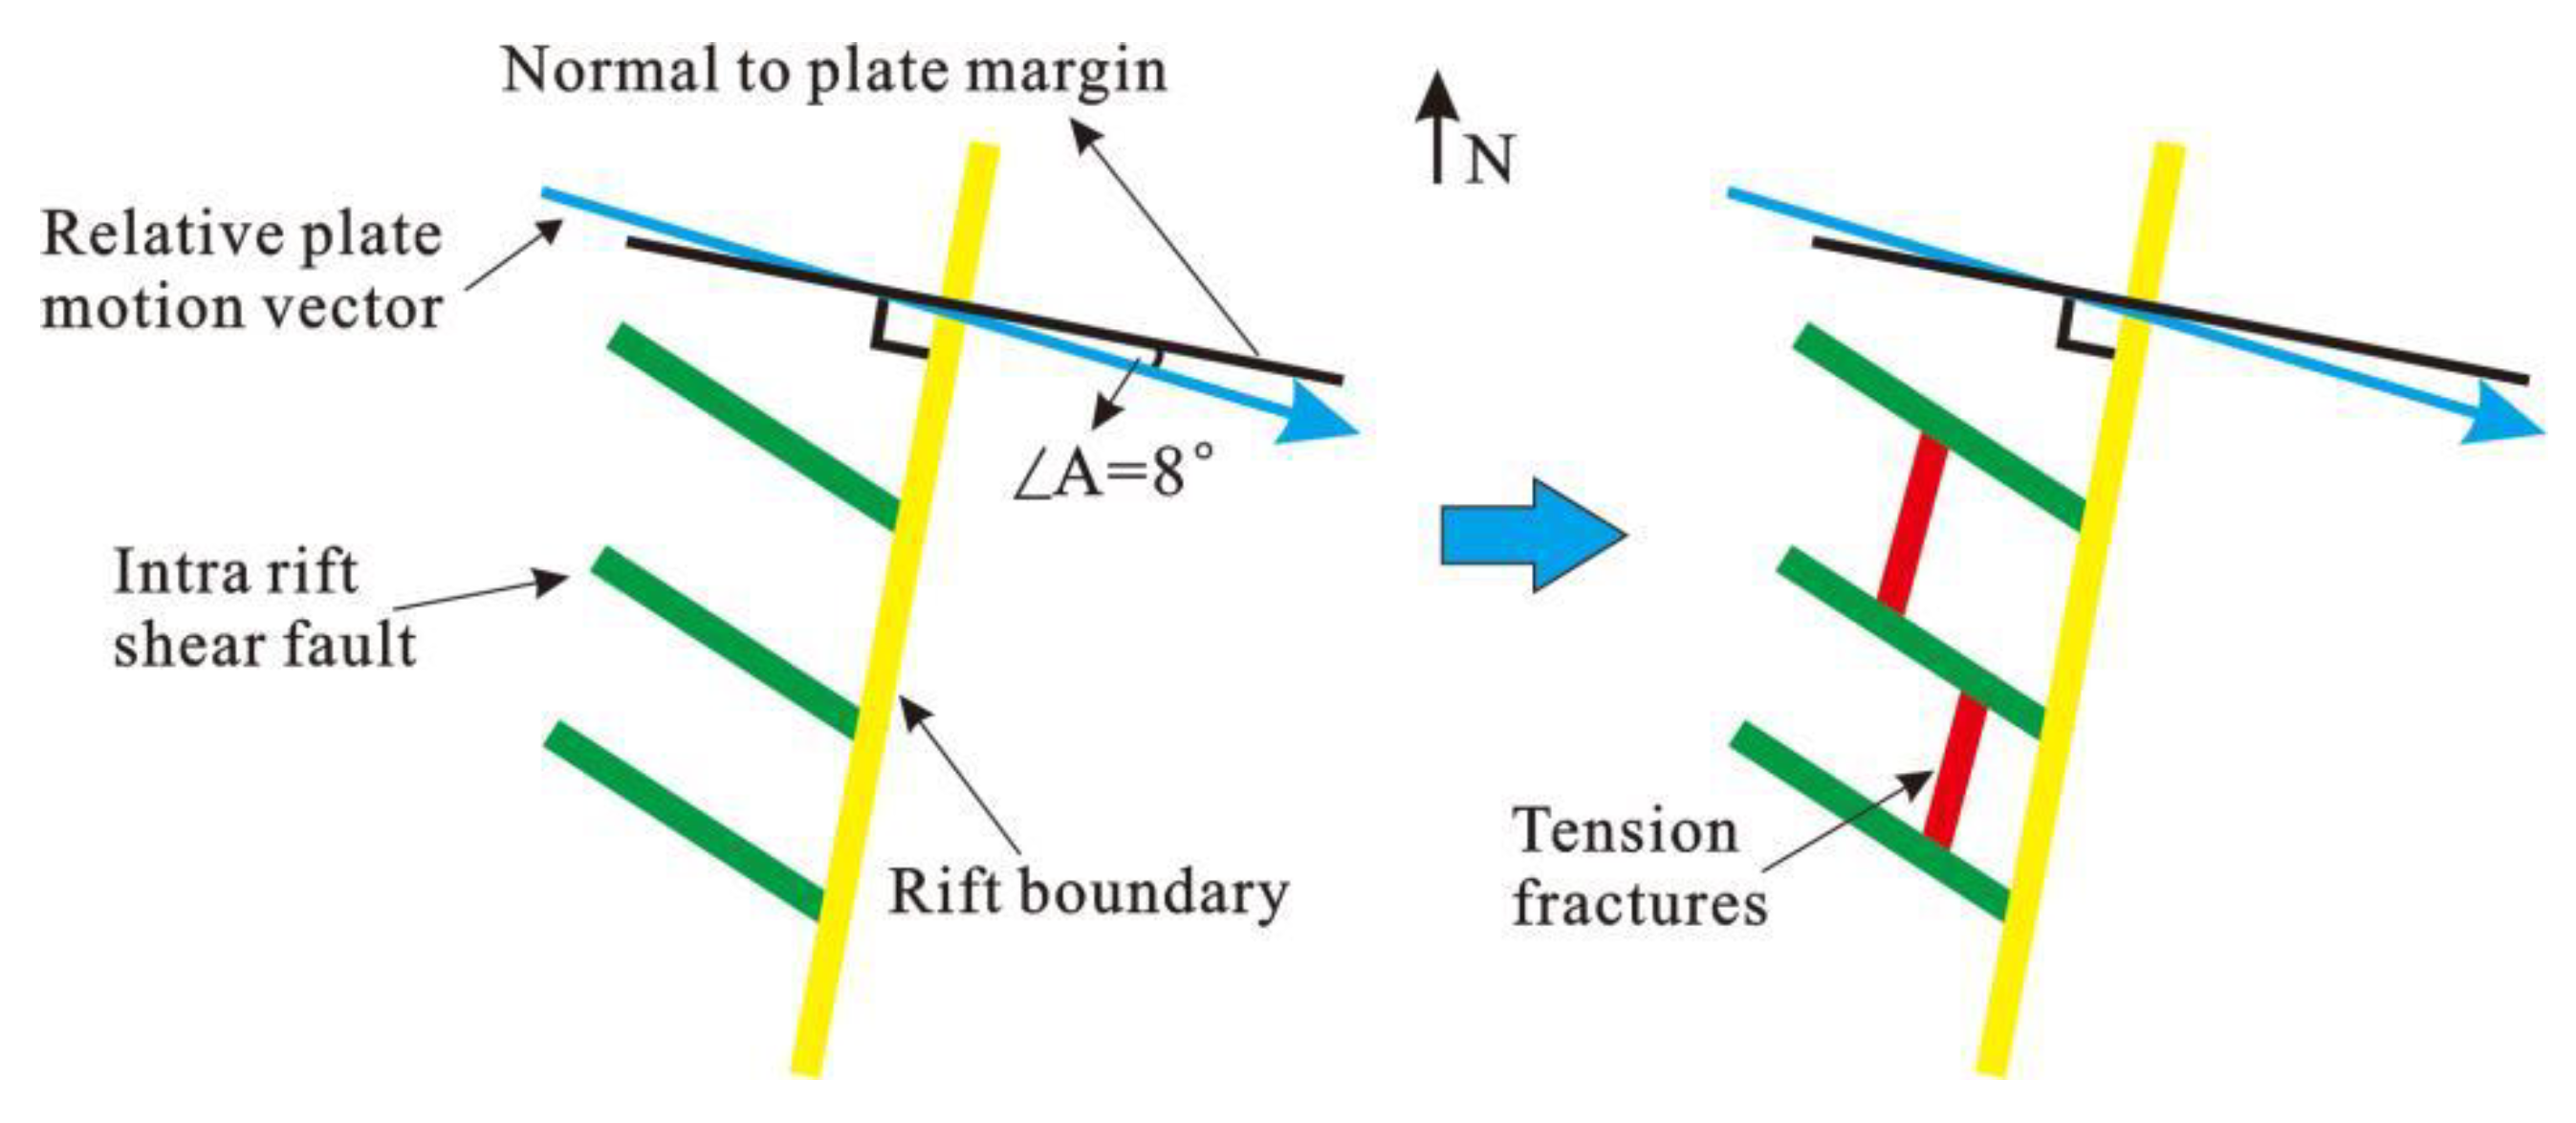
According to the extension fault opening models proposed by Tuckwell (1996) (mentioned in Section 3.2) and based on the rift boundary strike, plate extension direction, and the strikes of pre-existing faults, the dominant development direction of pull-down tension fractures under the combined influence of plate movement and pre-existing faults can be inversed. The strike of the rift boundary in the study area is NNE, the relative motion vector of the plate is SSE, and the strike of the Cambrian basement shear zone is NW (Figure 2). By extracting the geometric elements shown in Figure 2 and considering the angular relationship between the linear elements of the strike-slip extension model, the dominant development trend of the tension fractures in the rift was inverted (Figure 17).
According to the extensional fault opening models, the dominant trend of the bedrock tension fractures in the Kenya Rift Valley is consistent with the NNE directional trends of DL4, DL5, DL6, DL7, and DL8 (Figure 7c and Figure 17), all of which are distributed in an en echelon form on the plane. These fractures conform to a transtensional opening mode (Figure 4d) and are comprehensively affected by the NW-trending Cambrian basement faults and the rift extension movement. In conclusion, the NW-trending strike-slip shear zone of the rift basement and the regional tensile stress of the rift play important roles in controlling the formation of hidden bedrock fractures in the Kenya Rift Valley.
The genesis of the fractures can be indirectly studied by inverting the regional tension fracture formation through regional tectonic stress and plate movement. In order to evaluate the direct relationship between regional tectonic stress and tension fractures, it is necessary to determine the formation age of the tension fractures and analyze their correlation with regional tectonic history. In follow-up studies, the materials filling the hidden bedrock cracks can be used to determine the formation ages, as well as to subsequently analyze the relationship between formation age and regional tectonic stress.
5.2. Relationship between Rainfall Infiltration and Ground Fissures
Ground fissures exposed to the surface mostly occur in the rainy season, owing to infiltration from shallow water sources, such as rainfall and agricultural irrigation [21,22,23]. The ground fissures in the Kenya Rift Valley also show a close correlation with rainfall. The Kenya Rift Valley has a tropical steppe climate. The major rainy season is from March to June, while the minor rainy season is from October to December. The remaining months constitute the dry seasons. Our field investigation revealed that most ground fissures were formed after instances of heavy rainfall, most of which occurred during the rainy season. Most ground fissures form between March and June every year, during the rainy season in the Kenya Rift Valley. For example, ground fissure DL1 (Figure 7) was exposed on 7 March 2018, after heavy rain. DL2 was exposed at 9 p.m. on 4 May 2018, after a 1 h rainstorm. DL12 appeared in the evening of 13 March 2018, after heavy rainfall, causing the collapse and damage of the B3 highway. At the same time, the ground fissure trench exposed by the field trench also shows that the tectonic activity of the two sides of the ground fissure is weak, and the hydraulic erosion phenomenon of the soil in the fracture zone is obvious.
Fractures in concealed bedrock form weak tectonic zones in the upper soil mass. The soil mass above the cracks is prone to subsidence under its own weight, forming a depression. After rainfall, a large amount of rainwater will converge in the depression, which increases the hydraulic gradient of seepage and is conducive to the process of hydraulic erosion. The vertical displacement curve of the soil shows that the sediment deformation rate of the soil is relatively fast in the early stage of rainfall, and as the soil gradually becomes saturated, the sedimentation deformation rate gradually slows down. Therefore, the multi-frequency rainfall pattern of the rainy season is more conducive to seepage deformation of the soil. In the presence of bedrock cracks, rainwater will preferentially seep into the soil above the crack zone, where the seepage velocity is greatest. Under the long-term action of this differential hydraulic erosion, the soil above the hidden fractures is easily eroded, which in turn causes the hidden bedrock fractures to gradually expand upwards.
The formation of ground fissures in the study area is closely temporally related to rainfall, and rainfall erosion also tends to occur in the soil above the hidden bedrock fissures. The ground fissures exposed by the trench show weak tectonic activity, but also show obvious erosion. Therefore, rainfall erosion is an important factor inducing the expansion of hidden bedrock fissures towards the surface.
The strength of the soil is reduced, to a certain extent, during the actual seepage erosion process, and this reduction is accompanied by a loss of soil particles. The seepage erosion process is complex, which makes comprehensively reproducing it via numerical simulation a difficult task. Therefore, in this study, we adopted a simplified simulation method that does not consider the weakening of the soil strength or the loss of soil particles; thus, it was only possible to qualitatively reflect the general law of rainfall infiltration. In future research, the rainfall infiltration process should be simulated more carefully through in situ immersion or physical model tests.
6. Conclusions
Through field geological surveying, regional tectonic stress analysis, and numerical simulation, we have studied the development characteristics of ground fissures in the Kenya Rift Valley, the tectonic causes of hidden bedrock cracks, and the rainfall infiltration law of the upper soil mass of bedrock cracks occurring in the presence of hidden bedrock fissures. This research has several main conclusions, as follows.
The field geological survey results show that there are three dominant directions in the plane distribution of ground fissures, namely NW, NS, and NNE. Furthermore, some of the ground fissures have an en echelon plane combination form. The directional development of ground fissures is obvious. The characteristics of the ground fissure profile revealed by the trenches show that the lower parts of the ground fissures are connected by hidden bedrock cracks, and that the ground fissures are wedge-shaped, with a wide upper part and narrow lower part. The hydraulic erosion of the soil in the fissures is also obvious. The side walls of the hidden bedrock cracks exposed by the bottom plates of the trenches are vertical and rough, and they extend in broken lines that are characterized by tension cracks.
The ground fissures in the Kenya Rift Valley are concentrated and tend to be distributed in the range from northwest to northeast, which is consistent with the development direction of theoretical tension fractures, as was determined from regional tectonic stress analysis. Therefore, the formation of hidden bedrock fractures is controlled by the direction of regional tectonic stress. The en echelon ground fissures are jointly controlled by the basement tectonic shear zone and regional tectonic extension. In the follow-up study, if the fillings in the bedrock cracks can be taken for age testing, the corresponding relationship between the historical tectonic extension activities of the Kenya Rift Valley and the formation of bedrock cracks can be further clarified.
The numerical simulation results show that with the existence of hidden cracks, the seepage velocity and settlement deformation in the soil overlying the bedrock cracks are the largest near the cracks; thus, the rainfall infiltration erosion is strongest near the hidden cracks. The settlement deformation speed is relatively high at the beginning of rainfall and gradually slows down with increasing soil saturation. The finite element method used in this paper has limitations in simulating the large deformation of soil, so we cannot completely simulate the process of soil hydraulic erosion failure using this method. In future research, the physical model test method can be used to simulate the entire process of hidden bedrock fractures exposed to the surface under hydraulic erosion.
In conclusion, the ground fissures in the Kenya Rift Valley have dual characteristics of tectonic and hydraulic erosion. Regional tectonic tensile stress has formed the hidden bedrock fractures, and rainfall infiltration erosion accelerates the extension of the hidden bedrock fractures to the ground surface.
Author Contributions
Y.L. and J.P. conceived and designed the survey; Y.L. and F.W. performed the field survey; J.P. contributed funding support; Y.L. wrote the manuscript; F.Z. analyzed the field geological phenomena; Z.J. and M.H. provided the ABAQUS technology. All authors have read and agreed to the published version of the manuscript.
Funding
This study was supported by the National Science Foundation of China (Grant numbers 41920104010, 41877250, and 41807243).
Conflicts of Interest
The authors declare no conflict of interest.
References
- Baker, B.H.; Wohlenberg, J. Structure and Evolution of the Kenya Rift Valley. Nature 1971, 5286, 538–542. [Google Scholar] [CrossRef] [PubMed]
- Saemundsson, K. East African Rift System—An Overview. In Proceedings of the Short Course V on Exploration for Geothermal Resources, Lake Bogoria and Lake Naivasha, Kenya, Naivasha, Kenya, 29 October–19 November 2010. [Google Scholar]
- Mechie, J.; Keller, G.R.; Prodehl, C.; Khan, M.A.; Gaciri, S.J. A model for the structure, composition and evolution of the Kenya rift. Tectonophysics 1997, 278, 95–119. [Google Scholar] [CrossRef]
- Wang, D.W.; Liu, S.D.; Zhou, Z.G. Characteristics of ground fissures in Kenya’s East African Rift Valley and railway engineering countermeasures. Subgrade Eng. 2019, 4, 233–238. [Google Scholar]
- Ngecu, W.M.; Nyambok, I.O. Ground subsidence and its socio-economic implications on the population: A case study of the Nakuru area in Central Rift Valley, Kenya. Environ. Geol. 2000, 39, 567–574. [Google Scholar] [CrossRef]
- Dindi, E. An assessment of the performance of the geophysical methods as a tool for the detection of zones of potential subsidence in the area southwest of Nakuru town, Kenya. Environ. Earth Sci. 2015, 73, 3643–3653. [Google Scholar] [CrossRef]
- Hetzel, R.; Strecker, M.R. Late Mozambique Belt structures in western Kenya and their influence on the evolution of the Cenozoic Kenya Rift. J. Struct. Geol. 1994, 16, 189–201. [Google Scholar] [CrossRef]
- Omenda, P.A. The geology and geothermal activity of the East African Rift System[C]. In Proceedings of the Workshop for Decision Makers on Geothermal Projects and Management, Naivasha, Kenya, 14–18 November 2005. [Google Scholar]
- Turcotte, D.L.; Emerman, S.K. Mechanisms of active and passive rifting. Tectonophysics 1983, 94, 39–50. [Google Scholar] [CrossRef]
- Henry, W.J.; Mechie, J.; Maguire, P.; Khan, M.A.; Prodehl, C.; Keller, G.R.; Patel, J. A Seismic Investigation of the Kenya Rift Valley. Geophys. J. Int. 2010, 1, 107–130. [Google Scholar] [CrossRef] [Green Version]
- Stamps, D.S.; Saria, E.; Kreemer, C. A geodetic strain rate model for the East African Rift System. Sci. Rep. 2018, 8, 732. [Google Scholar] [CrossRef] [PubMed] [Green Version]
- Xue, L.; Gani, N.D.; Abdelsalam, M.G. Drainage incision, tectonic uplift, magmatic activity, and paleo-environmental changes in the Kenya Rift, East African Rift System: A morpho-tectonic analysis. Geomorphology 2019, 345, 106839. [Google Scholar] [CrossRef]
- Robertson, E.A.M.; Biggs, J.; Cashman, K.V.; Floyd, M.A.; Vye-Brown, C. Influence of regional tectonics and pre-existing structures on the formation of elliptical calderas in the Kenyan Rift. Geol. Soc. Lond. Spec. Publ. 2016, 420, 43–67. [Google Scholar] [CrossRef]
- Bosworth, W.; Burke, K.; Strecker, M. Magma chamber elongation as an indicator of intraplate stress field orientation: “borehole breakout mechanism” and examples from the Late Pleistocene to Recent Kenya Rift Valley. In Stress, Strain and Structure, A Volume in Honor of W.D. Means; Jessell, M.W., Urai, J.L., Eds.; Journal of Virtual Explorer; 2000; Volume II, Available online: http://www.virtualexplorer.com.au/VEjournal/Volume2 (accessed on 1 September 2022).
- Smith, M.; Mosley, P. Crustal heterogeneity and basement influence on the development of the Kenya Rift, East Africa. Tectonics 1993, 12, 591–606. [Google Scholar] [CrossRef]
- Zhou, X.P.; Wang, J.H. A new method for measuring in-situ stress. Geotech. Mech. 2002, 23, 316–320. [Google Scholar]
- Tuckwell, G.; Bull, J.; Sanderson, D. Models of fracture orientation at oblique spreading centres. J. Geol. Soc. Lond. 1996, 153, 185–189. [Google Scholar] [CrossRef]
- Helwany, S. Applied Soil Mechanics with ABAQUS Applications; John Wiley & Sons, Inc: Toronto, ON, Canada, 2007; pp. 332–356. [Google Scholar]
- Hua, J.X.; Zheng, J.G.; Wang, D.L. Engineering Geology Manual; China Archit. Press: Beijing, China, 2018. [Google Scholar]
- Strecker, M.R.; Blisniuk, P.M.; Eisbacher, G.H. Rotation of extension direction in the central Kenya Rift. Geology 1990, 18, 299–302. [Google Scholar] [CrossRef]
- Liu, Y.; Peng, J.B.; Jiang, F.Q.; Lu, Q.Z.; Zhu, F.J.; Qiang, X. Model test study on the formation and development of underground erosion ground fissures in the Kenya Rift Valley. J. Mt. Sci. 2022, 19, 1037–1050. [Google Scholar] [CrossRef]
- Jiang, Z.W.; Peng, J.B.; Wang, Q.Y. Study on the influence of early faults on ground fissures under pumping. J. Eng. Geol. 2010, 18, 651–656. [Google Scholar]
- Ma, W.Y. Study on the formation mechanism of ground fissures induced by irrigation. M.D. Thesis, Chang’an University, Xi’an, China, 2013. [Google Scholar]
Figure 1.
Composite lithospheric E-W cross-section of the Kenya rift, modified from Hetzel et al. [7]. The sub-horizontal thin red lines represent the anastomosing shear zones in the lower crust.
Figure 1.
Composite lithospheric E-W cross-section of the Kenya rift, modified from Hetzel et al. [7]. The sub-horizontal thin red lines represent the anastomosing shear zones in the lower crust.

Figure 2.
Geological structure of the Kenya Rift Valley, modified from Robertson et al. [13]. (a) Summary geological map of the Kenya Rift Valley. (b) Exposure of Kenyan Proterozoic units and principal structures. The locations of Quaternary caldera volcanoes (red circles) are labeled as: B, Barrier; E, Emuruangogolak; Si, Silali; P, Paka; M, Menengai; L, Longonot; and Su, Suswa.

Figure 3.
Schematic diagram of the mechanics of tension crack formation [16].
Figure 3.
Schematic diagram of the mechanics of tension crack formation [16].

Figure 4.
Models of extensional fault opening in rifts, modified from Tuckwell et al. [17]. θ = A/2 and φ = α/2 + 45°. (a) is the geometric relationship diagram of tectonic elements; (b) is orthogonal opening model of extension fractures; (c) is oblique opening model of extension fractures; (d) is transtension opening model of extension fractures.

Figure 5.
Visualization of the numerical calculation model.

Figure 6.
Grain size distribution curves. The different lines represent the different soil samples, as specified in Table 2.
Figure 6.
Grain size distribution curves. The different lines represent the different soil samples, as specified in Table 2.

Figure 7.
Ground fissure plane distributions. (a,b) top view of ground fissures; (c) distribution of ground fissures with an en echelon form; (d–f) ground fissure surface damage.
Figure 7.
Ground fissure plane distributions. (a,b) top view of ground fissures; (c) distribution of ground fissures with an en echelon form; (d–f) ground fissure surface damage.

Figure 8.
Rose diagram of ground fissure strikes.

Figure 9.
Trench profiles in the Kenya Rift Valley. (a–c) correspond to Trenches 1, 2, and 3, respectively. Areas labeled with “f” designate the ground fissures observed in the trenches.
Figure 9.
Trench profiles in the Kenya Rift Valley. (a–c) correspond to Trenches 1, 2, and 3, respectively. Areas labeled with “f” designate the ground fissures observed in the trenches.

Figure 10.
Bedrock cracks in Trench 1. (a) Top view of the exploratory trench; (b) f1 bedrock crack morphology; (c) f2 bedrock crack morphology; (d) f1 bedrock crack details; (e) and (f) f2 bedrock crack details.
Figure 10.
Bedrock cracks in Trench 1. (a) Top view of the exploratory trench; (b) f1 bedrock crack morphology; (c) f2 bedrock crack morphology; (d) f1 bedrock crack details; (e) and (f) f2 bedrock crack details.

Figure 11.
Bedrock cracks in Trench 2. (a) Top view of the exploration trench; (b) f1 bedrock crack in detail; (c–e) f2 bedrock crack in detail; (f) f4 bedrock crack in detail; (g) f3 bedrock crack in detail.
Figure 11.
Bedrock cracks in Trench 2. (a) Top view of the exploration trench; (b) f1 bedrock crack in detail; (c–e) f2 bedrock crack in detail; (f) f4 bedrock crack in detail; (g) f3 bedrock crack in detail.

Figure 12.
Bedrock cracks in Trench 3. (a) Overall view of the bedrock cracks; (b,d) f1 bedrock crack in detail; (e) f2 bedrock crack in detail; (c,g,f) f3 bedrock crack in detail.
Figure 12.
Bedrock cracks in Trench 3. (a) Overall view of the bedrock cracks; (b,d) f1 bedrock crack in detail; (e) f2 bedrock crack in detail; (c,g,f) f3 bedrock crack in detail.

Figure 13.
Pore water pressure and saturation contour plots. (a) is the initial pore water pressure and saturation contour plots; (b–d) are the pore water pressure and saturation contour plots in 6 h, 12 h and 24 h after the start of rainfall respectively.
Figure 13.
Pore water pressure and saturation contour plots. (a) is the initial pore water pressure and saturation contour plots; (b–d) are the pore water pressure and saturation contour plots in 6 h, 12 h and 24 h after the start of rainfall respectively.

Figure 14.
Vertical velocity of seepage. (a) Velocity distribution diagram and (b) velocity vector diagram, where Flvel is the velocity vector of seepage and Flvel2 is the vertical velocity vector of seepage. The seepage rate is in m/h.
Figure 14.
Vertical velocity of seepage. (a) Velocity distribution diagram and (b) velocity vector diagram, where Flvel is the velocity vector of seepage and Flvel2 is the vertical velocity vector of seepage. The seepage rate is in m/h.

Figure 15.
Vertical displacement curves. (a) Variation curve of vertical displacement of surface soil with time; (b) variation curve of soil vertical displacement with time at different depths above concealed cracks.
Figure 15.
Vertical displacement curves. (a) Variation curve of vertical displacement of surface soil with time; (b) variation curve of soil vertical displacement with time at different depths above concealed cracks.

Figure 16.
Evolution of bedrock fractures in the Kenya Rift Valley.

Figure 17.
Inversion model of the bedrock fractures in the Kenya Rift Valley.


Table 1.
Saturation and matrix suction.
| Saturation | 0.02 | 0.18 | 0.25 | 0.36 | 0.50 | 0.66 | 0.80 | 0.89 | 0.94 | 0.97 | 1.00 |
|---|---|---|---|---|---|---|---|---|---|---|---|
| Matrix suction | −100 | −61.58 | −37.93 | −23.36 | −14.38 | −8.86 | −5.46 | −3.36 | −2.07 | −1.27 | 0 |
Table 2.
Soil parameters.
| Soil Sample Number | Sampling Depth (m) | Water Content (%) | Density (g/cm3) | Grain Specific Gravity | Void Ratio | Internal Friction Angle (°) | Cohesion (kPa) |
|---|---|---|---|---|---|---|---|
| #1 | 0.5 | 24.28 | 1.41 | 2.62 | 1.31 | 27 | 17 |
| #2 | 2.5 | 22.31 | 1.44 | 2.63 | 1.23 | 32 | 14 |
| #3 | 3.5 | 23.2 | 1.46 | 2.61 | 1.20 | 34 | 15 |
| #4 | 4.5 | 16.4 | 1.36 | 2.65 | 1.27 | 35 | 15 |
| #5 | 6 | 30.1 | 1.48 | 2.60 | 1.29 | 29 | 16 |
| Average value | - | 23.3 | 1.43 | 2.62 | 1.26 | 31.4 | 15.4 |
Table 3.
Calculation parameters for the numerical model.
| Soil | Dry Density (g/cm3) | Void Ratio | Internal Friction Angle (°) | Cohesion (kPa) | Young’s Modulus (MPa) | Poisson Ratio | Permeability Coefficient (m/h) | Surface Pore Flow Velocity (m/h) |
|---|---|---|---|---|---|---|---|---|
| Silty sand | 1.2 | 1.3 | 30 | 15 | 16 | 0.3 | 2.88 × 10⁻² | 2.8 × 10⁻² |
Table 4.
Ground fissure strike statistics.
| Strike Interval | Quantity | Average Strike | Strike Interval | Quantity | Average Strike |
|---|---|---|---|---|---|
| 0–10° | 5 | 1 | 270–280° | - | - |
| 10–20° | 1 | 17 | 280–290° | - | - |
| 20–30° | 3 | 24.08 | 290–300° | - | - |
| 30–40° | 1 | 38 | 300–310° | - | - |
| 40–50° | - | - | 310–320° | - | - |
| 50–60° | - | - | 320–330° | 2 | 323.05 |
| 60–70° | - | - | 330–340° | 2 | 336.3 |
| 70–80° | - | - | 340–350° | 3 | 343.0 |
| 80–90° | - | - | 350–360° | 1 | 353.4 |
Publisher’s Note: MDPI stays neutral with regard to jurisdictional claims in published maps and institutional affiliations. |
© 2022 by the authors. Licensee MDPI, Basel, Switzerland. This article is an open access article distributed under the terms and conditions of the Creative Commons Attribution (CC BY) license (https://creativecommons.org/licenses/by/4.0/).
Share and Cite
MDPI and ACS Style
Liu, Y.; Peng, J.; Wang, F.; Zhu, F.; Jia, Z.; He, M. Developmental Mechanism of Rainfall-Induced Ground Fissures in the Kenya Rift Valley. Water 2022, 14, 3215. https://doi.org/10.3390/w14203215
AMA Style
Liu Y, Peng J, Wang F, Zhu F, Jia Z, He M. Developmental Mechanism of Rainfall-Induced Ground Fissures in the Kenya Rift Valley. Water. 2022; 14(20):3215. https://doi.org/10.3390/w14203215
Chicago/Turabian StyleLiu, Yang, Jianbing Peng, Feiyong Wang, Fengji Zhu, Zhijie Jia, and Ming He. 2022. "Developmental Mechanism of Rainfall-Induced Ground Fissures in the Kenya Rift Valley" Water 14, no. 20: 3215. https://doi.org/10.3390/w14203215
Note that from the first issue of 2016, this journal uses article numbers instead of page numbers. See further details here.