
The Effects of Hypoxia on Threshold Food Concentrations in Different Daphnia Species
 , ,
, ,
Abstract
:
1. Introduction
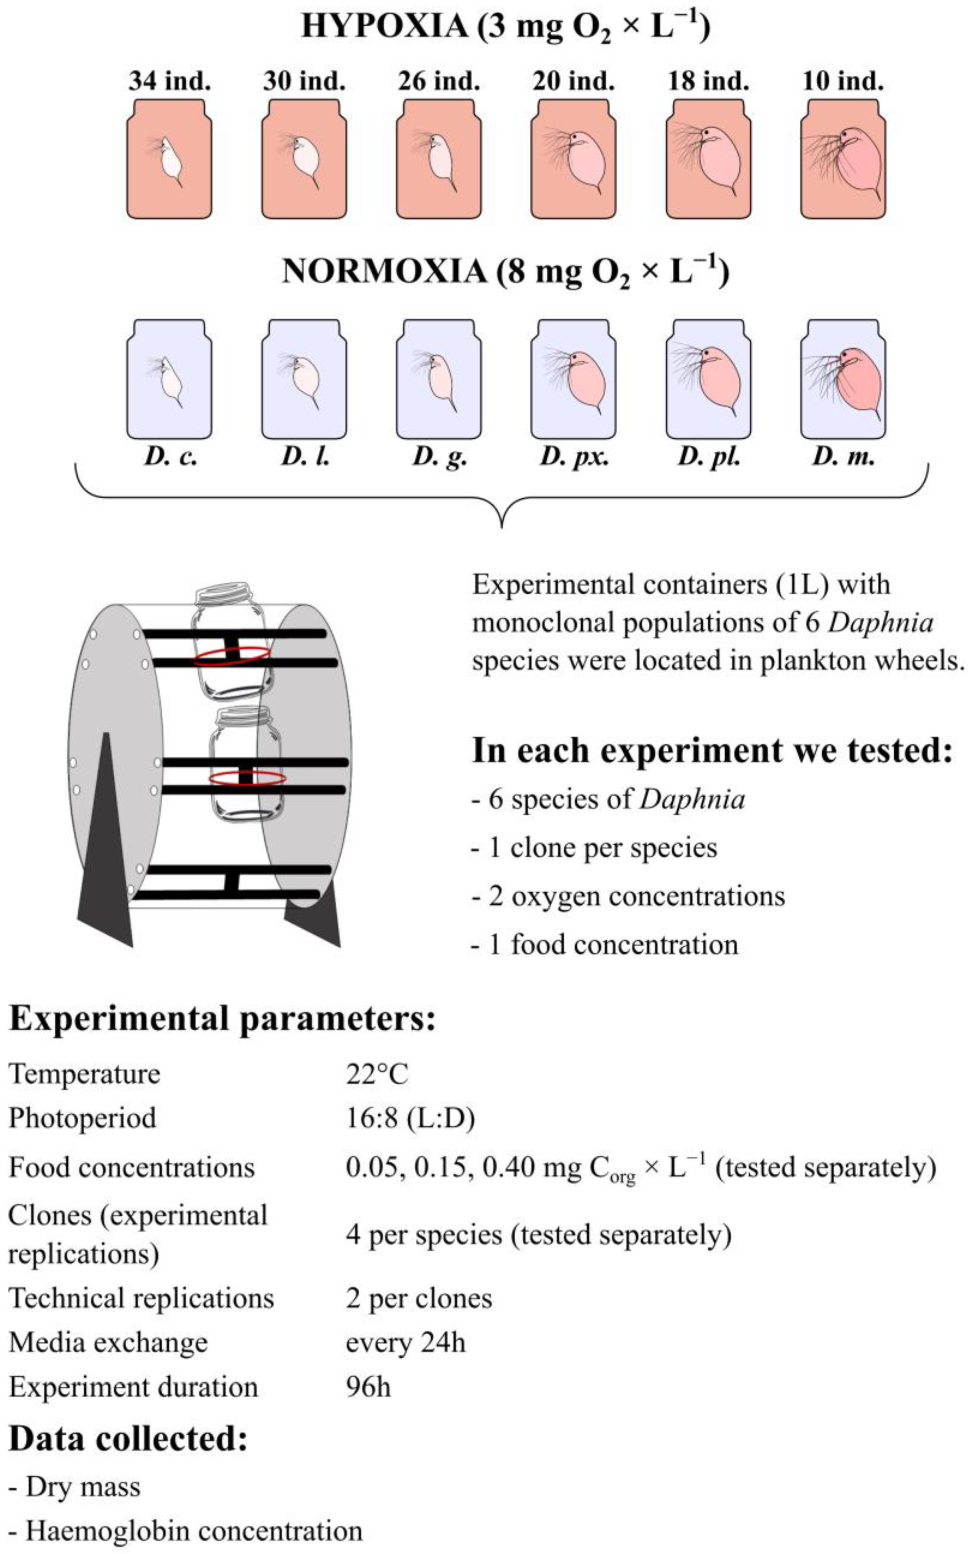
2. Materials and Methods
2.1. Experimental Animals
2.2. Experimental System
2.3. Experimental Design
2.4. Data Analysis
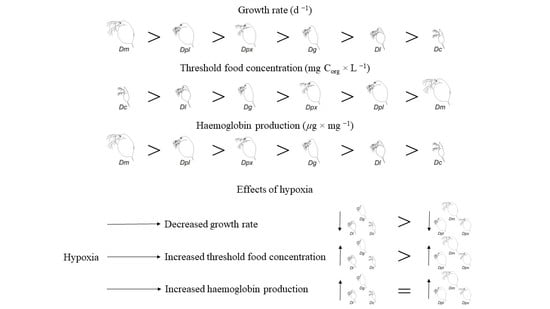
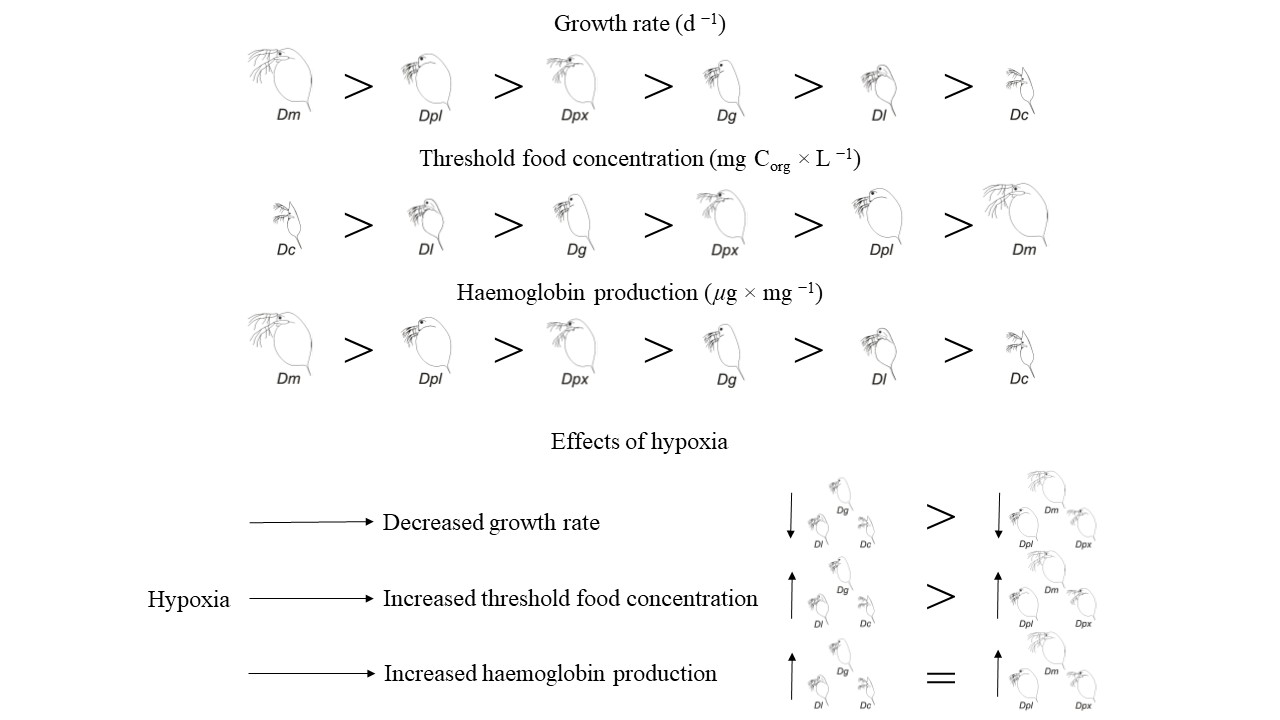
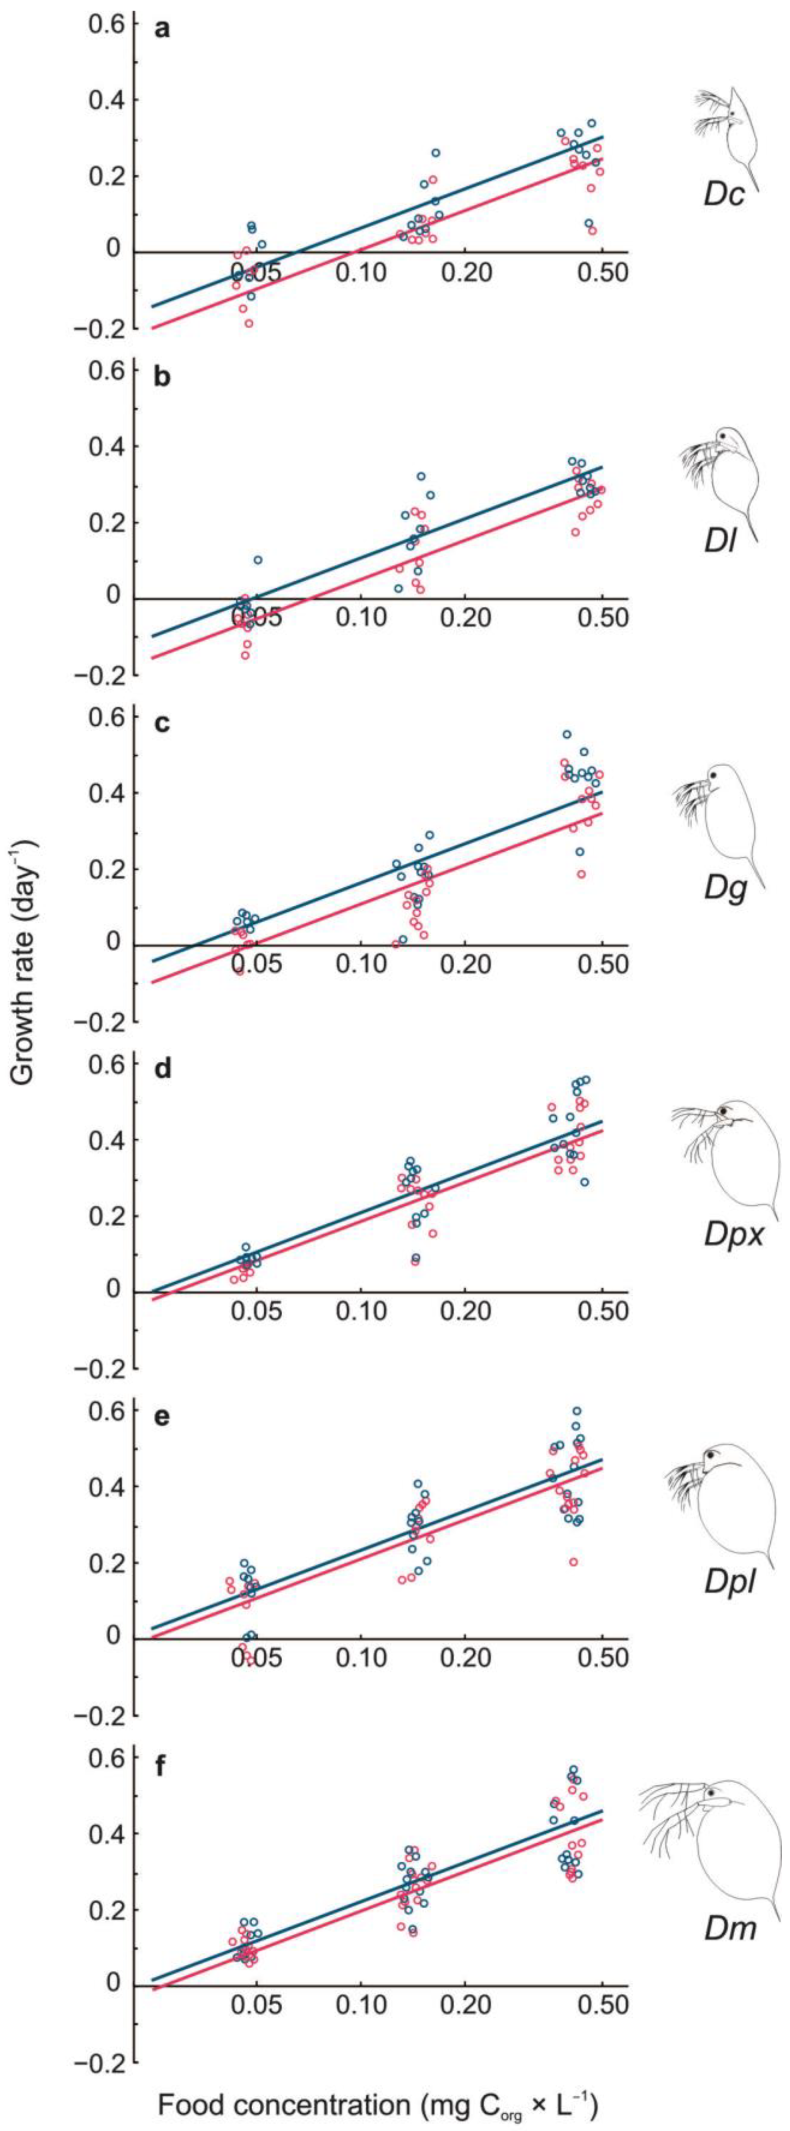
3. Results
3.1. Growth Rate
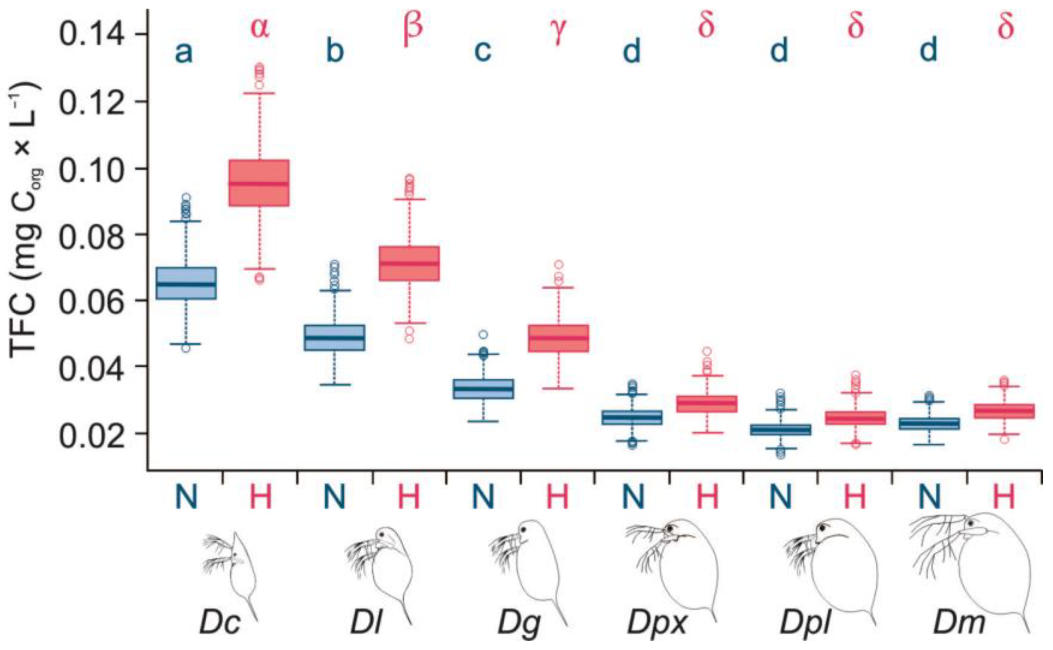
3.2. Threshold Food Concentrations
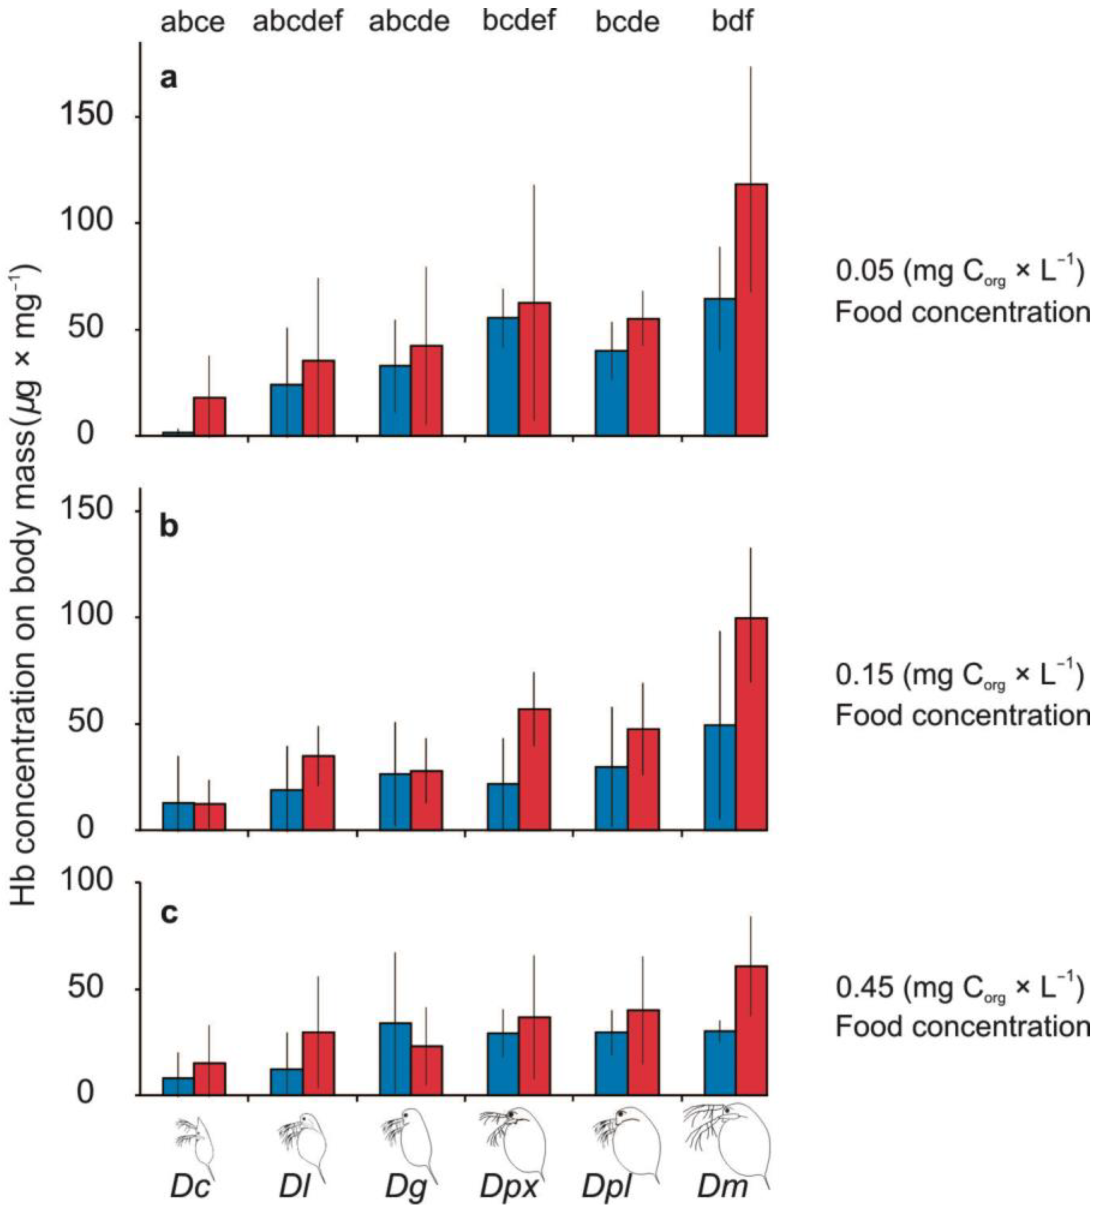
3.3. Haemoglobin Production
4. Discussion
5. Conclusions
Supplementary Materials
Author Contributions
Funding
Institutional Review Board Statement
Informed Consent Statement
Data Availability Statement
Acknowledgments
Conflicts of Interest
References
- Olalla-Tárraga, M.Á.; Rodríguez, M.Á.; Hawkins, B.A. Broad-scale patterns of body size in squamate reptiles of Europe and North America. J. Biogeogr. 2006, 33, 781–793. [Google Scholar] [CrossRef] [Green Version]
- Cushman, J.; Lawton, J.H.; Manly, B.F. Latitudinal patterns in European ant assemblages: Variation in species richness and body size. Oecologia 1993, 95, 30–37. [Google Scholar] [CrossRef] [PubMed]
- Maszczyk, P.; Brzezinski, T. Body size, maturation size, and growth rate of crustaceans. Nat. Hist. Crustacea Life Hist. 2018, 5, 35–72. [Google Scholar]
- Bergmann, C. Uber die verhaltnisse der warmeokonomieder tiere zu ihrer grosse. Gott. Stud. 1847, 3, 595. [Google Scholar]
- Atkinson, D. Temperature and organism size: A biological law for ectotherms? Adv. Ecol. Res. 1994, 25, 1–58. [Google Scholar]
- Atkinson, D.; Morley, S.A.; Weetman, D.; Hughes, R.N. Offspring size responses to maternal temperature in ectotherms. In Environment and Animal Development: Genes, Life Histories and Plasticity; BIOS Scientific: Oxford, UK, 2001; pp. 269–285. [Google Scholar]
- Green, J. Altitudinal distribution of tropical planktonic Cladocera. In Cladocera as Model Organisms in Biology; Springer: Dordrecht, The Netherlands, 1995; pp. 75–84. [Google Scholar]
- Gillooly, J.F.; Dodson, S.I. Latitudinal patterns in the size distribution and seasonal dynamics of new world, freshwater cladocerans. Limnol. Oceanogr. 2000, 45, 22–30. [Google Scholar] [CrossRef]
- Anufriieva, E.V.; Shadrin, N.V. Factors determining the average body size of geographically separated Arctodiaptomus salinus (Daday, 1885) populations. Zool. Res. 2014, 35, 132. [Google Scholar]
- Sommer, U.; Gliwicz, Z.M.; Lampert, W.; Duncan, A. The PEG-model of seasonal succession of planktonic events in fresh waters. Arch. Für Hydrobiol. 1986, 106, 433–471. [Google Scholar]
- Hawkins, S.J.; Moore, P.; Burrows, M.; Poloczanska, E.; Mieszkowska, N.; Herbert, R.J.H.; Jenkins, S.R.; Thompson, R.C.; Genner, M.J.; Southward, A.J. Complex interactions in a rapidly changing world: Responses of rocky shore communities to recent climate change. Clim. Res. 2008, 37, 123–133. [Google Scholar] [CrossRef] [Green Version]
- Forster, J.; Hirst, A.G.; Atkinson, D. Warming-induced reductions in body size are greater in aquatic than terrestrial species. Proc. Natl. Acad. Sci. USA 2012, 109, 19310–19314. [Google Scholar] [CrossRef] [Green Version]
- Horne, C.R.; Hirst, A.G.; Atkinson, D. Temperature-size responses match latitudinal-size clines in arthropods, revealing critical differences between aquatic and terrestrial species. Ecol. Lett. 2015, 18, 327–335. [Google Scholar] [CrossRef] [PubMed]
- Parmesan, C.; Yohe, G. A globally coherent fingerprint of climate change impacts across natural systems. Nature 2003, 421, 37–42. [Google Scholar] [CrossRef] [PubMed]
- Walther, G.R.; Post, E.; Convey, P.; Menzel, A.; Parmesan, C.; Beebee, T.J.C.; Fromentin, J.M.; Hoegh-Guldberg, O.; Bairlein, F. Ecological responses to recent climate change. Nature 2002, 416, 389–395. [Google Scholar] [CrossRef]
- Daufresne, M.; Lengfellner, K.; Sommer, U. Global warming benefits the small in aquatic ecosystems. Proc. Natl. Acad. Sci. USA 2009, 106, 12788–12793. [Google Scholar] [CrossRef] [Green Version]
- Verberk, W.C.; Atkinson, D.; Hoefnagel, K.N.; Hirst, A.G.; Horne, C.R.; Siepel, H. Shrinking body sizes in response to warming: Explanations for the temperature–size rule with special emphasis on the role of oxygen. Biol. Rev. 2021, 96, 247–268. [Google Scholar] [CrossRef]
- Sikora, A.B.; Petzoldt, T.; Dawidowicz, P.; Von Elert, E. Demands of eicosapentaenoic acid (EPA) in Daphnia: Are they dependent on body size? Oecologia 2016, 182, 405–417. [Google Scholar] [CrossRef] [PubMed] [Green Version]
- Kozlowski, J.; Czarnoleski, M.; Danko, M. Can optimal resource allocation models explain why ectotherms grow larger in cold? Integr. Comp. Biol. 2004, 44, 480–493. [Google Scholar] [CrossRef] [Green Version]
- Gliwicz, Z.M.; Wrzosek, D. Predation-mediated coexistence of large-and small-bodied Daphnia at different food levels. Am. Nat. 2008, 172, 358–374. [Google Scholar] [CrossRef]
- Atkinson, D.; Morley, S.A.; Hughes, R.N. From cells to colonies: At what levels of body organization does the ‘temperature-size rule’ apply? Evol. Dev. 2006, 8, 202–214. [Google Scholar] [CrossRef]
- Ohlberger, J. Climate warming and ectotherm body size–from individual physiology to community ecology. Funct. Ecol. 2013, 27, 991–1001. [Google Scholar] [CrossRef]
- McBryan, T.L.; Anttila, K.; Healy, T.M.; Schulte, P.M. Responses to temperature and hypoxia as interacting stressors in fish: Implications for adaptation to environmental change. Integr. Comp. Biol. 2013, 53, 648–659. [Google Scholar] [CrossRef] [PubMed] [Green Version]
- Pörtner, H.O.; Langenbuch, M.; Michaelidis, B. Synergistic effects of temperature extremes, hypoxia, and increases in CO2 on marine animals: From Earth history to global change. J. Geophys. Res. Oceans 2005, 110, C09S10. [Google Scholar] [CrossRef]
- Clark, M.S.; Husmann, G.; Thorne, M.A.; Burns, G.; Truebano, M.; Peck, L.S.; Abele, D.; Philipp, E.E.R. Hypoxia impacts large adults first: Consequences in a warming world. Glob. Chang. Biol. 2013, 19, 2251–2263. [Google Scholar] [CrossRef] [PubMed]
- Sikora, A.; Dawidowicz, P. Do the presence of filamentous cyanobacteria and an elevated temperature favor small-bodied Daphnia in interspecific competitive interactions. Fundam. Appl. Limnol. 2014, 185, 307–314. [Google Scholar] [CrossRef]
- Angilletta, M.J., Jr.; Dunham, A.E. The temperature-size rule in ectotherms: Simple evolutionary explanations may not be general. Am. Nat. 2003, 162, 332–342. [Google Scholar] [CrossRef]
- Audzijonyte, A.; Barneche, D.R.; Baudron, A.R.; Belmaker, J.; Clark, T.D.; Marshall, C.T.; Morongiello, J.R.; van Rijn, I. Is oxygen limitation in warming waters a valid mechanism to explain decreased body sizes in aquatic ectotherms? Glob. Ecol. Biogeogr. 2019, 28, 64–77. [Google Scholar] [CrossRef] [Green Version]
- Reyes, V.P.; Ventura, M.A.; Amarillo, P.B. Ecotoxicological assessment of water and sediment in areas of Taal Lake with heavy aquaculture practices using Allium cepa and Daphnia magna assay. Philipp. J. Sci. 2022, 151, 969–974. [Google Scholar] [CrossRef]
- Seidl, M.D.; Paul, R.J.; Pirow, R. Effects of hypoxia acclimation on morpho-physiological traits over three generations of Daphnia magna. J. Exp. Biol. 2005, 208, 2165–2175. [Google Scholar] [CrossRef] [Green Version]
- Czarnoleski, M.; Ejsmont-Karabin, J.; Angilletta, M.J.; Kozlowski, J. Colder rotifers grow larger but only in oxygenated waters. Ecosphere 2015, 6, 1–5. [Google Scholar] [CrossRef]
- Woods, H.A. Egg-mass size and cell size: Effects of temperature on oxygen distribution. Am. Zool. 1999, 39, 244–252. [Google Scholar] [CrossRef]
- Subczynski, W.K.; Hyde, J.S.; Kusumi, A. Oxygen permeability of phosphatidylcholine--cholesterol membranes. Proc. Natl. Acad. Sci. USA 1989, 86, 4474–4478. [Google Scholar] [CrossRef] [PubMed] [Green Version]
- Havens, K.E.; Pinto-Coelho, R.M.; Beklioğlu, M.; Christoffersen, K.S.; Jeppesen, E.; Lauridsen, T.L.; Mazumder, A.; Methot, G.; Alloul, B.P.; Vijverberg, J.; et al. Temperature effects on body size of freshwater crustacean zooplankton from Greenland to the tropics. Hydrobiologia 2015, 743, 27–35. [Google Scholar] [CrossRef] [Green Version]
- Achenbach, L.; Lampert, W. Effects of elevated temperatures on threshold food concentrations and possible competitive abilities of differently sized cladoceran species. Oikos 1997, 79, 469–476. [Google Scholar] [CrossRef]
- Vijverberg, J.; Vos, M. Predator-released compounds, ambient temperature and competitive exclusion among differently sized Daphnia species. Freshw. Biol. 2006, 51, 756–767. [Google Scholar] [CrossRef]
- Chapelle, G.; Peck, L.S. Amphipod crustacean size spectra: New insights in the relationship between size and oxygen. Oikos 2004, 106, 167–175. [Google Scholar] [CrossRef]
- Walczyńska, A.; Sobczyk, L. The underestimated role of temperature–oxygen relationship in large-scale studies on size-to-temperature response. Ecol. Evol. 2017, 7, 7434–7441. [Google Scholar] [CrossRef] [PubMed]
- Hoefnagel, K.N.; Verberk, W.C. Is the temperature-size rule mediated by oxygen in aquatic ectotherms? J. Therm. Biol. 2015, 54, 56–65. [Google Scholar] [CrossRef]
- Lampert, W., IV. Determination of the “threshold” concentration as a factor controlling the abundance of zooplankton species. Arch. Für Hydrobiol. 1977, 48, 361–368. [Google Scholar]
- Gliwicz, Z.M. Food thresholds and body size in cladocerans. Nature 1990, 343, 638–640. [Google Scholar] [CrossRef]
- Tessier, A.J.; Leibold, M.A.; Tsao, J. A fundamental trade-off in resource exploitation by Daphnia and consequences to plankton communities. Ecology 2000, 81, 826–841. [Google Scholar] [CrossRef]
- Tessier, A.J.; Woodruff, P. Trading off the ability to exploit rich versus poor food quality. Ecol. Lett. 2002, 5, 685–692. [Google Scholar] [CrossRef]
- Iwabuchi, T.; Urabe, J. Food quality and food threshold: Implications of food stoichiometry to competitive ability of herbivore plankton. Ecosphere 2012, 3, 1–17. [Google Scholar] [CrossRef]
- Rider, C.V.; Gorr, T.A.; Olmstead, A.W.; Wasilak, B.A.; LeBlanc, G.A. Stress signaling: Coregulation of hemoglobin and male sex determination through a terpenoid signaling pathway in a crustacean. J. Exp. Biol. 2005, 208, 15–23. [Google Scholar] [CrossRef] [PubMed] [Green Version]
- Heisey, D.; Porter, K.G. The effect of ambient oxygen concentration on filtering and respiration rates of Daphnia galeata mendotae and Daphnia magna 1. Limnol. Oceanogr. 1977, 22, 839–845. [Google Scholar] [CrossRef] [Green Version]
- Sell, A.F. Adaptation to oxygen deficiency: Contrasting patterns of haemoglobin synthesis in two coexisting Daphnia species. Comp. Biochem. Physiol. Part A Mol. Integr. Physiol. 1998, 120, 119–125. [Google Scholar] [CrossRef]
- Wilczynski, W.; Dynak, P.; Babkiewicz, E.; Bernatowicz, P.; Leniowski, K.; Maszczyk, P. The combined effects of hypoxia and fish kairomones on several physiological and life history traits of Daphnia. Freshw. Biol. 2019, 64, 2204–2220. [Google Scholar] [CrossRef]
- Hrycik, A.R.; Almeida, L.Z.; Höök, T.O. Sub-lethal effects on fish provide insight into a biologically-relevant threshold of hypoxia. Oikos 2017, 126, 307–317. [Google Scholar] [CrossRef]
- Ekau, W.; Auel, H.; Pörtner, H.O.; Gilbert, D. Impacts of hypoxia on the structure and processes in pelagic communities (zooplankton, macro-invertebrates and fish). Biogeosciences 2010, 7, 1669–1699. [Google Scholar] [CrossRef] [Green Version]
- Winter, A.; Ciborowski, J.J.; Reynoldson, T.B. Effects of chronic hypoxia and reduced temperature on survival and growth of burrowing mayflies, (Hexagenia limbata) (Ephemeroptera: Ephemeridae). Can. J. Fish. Aquat. Sci. 1996, 53, 1565–1571. [Google Scholar] [CrossRef]
- Lefevre, S.; McKenzie, D.J.; Nilsson, G.E. In modelling effects of global warming, invalid assumptions lead to unrealistic projections. Glob. Chang. Biol. 2018, 24, 553–556. [Google Scholar] [CrossRef] [Green Version]
- Fox, H.M.; Gilchrist, B.M.; Phear, E.A. Functions of haemoglobin in Daphnia. Proc. R. Soc. Lond. Ser. B Biol. Sci. 1951, 138, 514–528. [Google Scholar] [CrossRef] [PubMed]


Publisher’s Note: MDPI stays neutral with regard to jurisdictional claims in published maps and institutional affiliations. |
© 2022 by the authors. Licensee MDPI, Basel, Switzerland. This article is an open access article distributed under the terms and conditions of the Creative Commons Attribution (CC BY) license (https://creativecommons.org/licenses/by/4.0/).
Share and Cite
Wilczynski, W.; Babkiewicz, E.; Pukos, S.; Wawrzeńczak, J.; Zebrowski, M.L.; Banasiak, Ł.; Kudriashov, M.; Maszczyk, P. The Effects of Hypoxia on Threshold Food Concentrations in Different Daphnia Species. Water 2022, 14, 3213. https://doi.org/10.3390/w14203213
Wilczynski W, Babkiewicz E, Pukos S, Wawrzeńczak J, Zebrowski ML, Banasiak Ł, Kudriashov M, Maszczyk P. The Effects of Hypoxia on Threshold Food Concentrations in Different Daphnia Species. Water. 2022; 14(20):3213. https://doi.org/10.3390/w14203213
Chicago/Turabian StyleWilczynski, Wojciech, Ewa Babkiewicz, Szymon Pukos, Julia Wawrzeńczak, Marcin Lukasz Zebrowski, Łukasz Banasiak, Mark Kudriashov, and Piotr Maszczyk. 2022. "The Effects of Hypoxia on Threshold Food Concentrations in Different Daphnia Species" Water 14, no. 20: 3213. https://doi.org/10.3390/w14203213