
Comparison of the Causes of Erosion–Deposition between Yellow River, Yangtze River, and Mekong River Subaqueous Delta l: Model Building

1
College of Oceanography and Space Information, China University of Petroleum, Qingdao 266580, China
2
Department of Marine, Earth and Atmospheric Sciences, North Carolina State University, Raleigh, NC 27695, USA
3
Laboratory for Marine Geology, Qingdao National Laboratory for Marine Science and Technology, Qingdao 266100, China
4
Shandong Provincial Key Laboratory of Marine Environment and Geological Engineering, Ocean University of China, Qingdao 266100, China
*
Author to whom correspondence should be addressed.
Water 2022, 14(20), 3208; https://doi.org/10.3390/w14203208
Submission received: 18 August 2022
/
Revised: 7 October 2022
/
Accepted: 8 October 2022
/
Published: 12 October 2022
(This article belongs to the Special Issue Sediment Dynamics in Coastal and Marine Environment)
Abstract
:An estuary delta is an area with active human economic activities and a fragile natural ecological environment. With the intensification of global changes and human activities, coastal and seabed erosion around the world is becoming more and more serious. This study compared the hydrodynamic effect and sediment diffusion path at the Yellow River subaqueous delta (river control type) and the Yangtze River subaqueous delta (tide-river type) in the East Asian monsoon area using a Delft 3D numerical simulation to analyse the causes of the distribution of accumulation and erosion landform in the different types of subaqueous deltas. This study found that the river deltas were dominated by the river when the accumulation landforms concentrated in the direction of the Coriolis forces, which was due to hydrodynamic erosion driven by wind, and the sediment diffusion range was mainly concentrated in shallow water areas (water depth < 6 m), resulting the Yellow River subaqueous delta presenting the pattern of “northern erosion and south accumulation”. The Yangtze River subaqueous delta was controlled by tidal effects, making the southern part of the estuary more susceptible to erosion. The research results can not only further deepen the understanding of the physical process and mechanism of erosion and deposition in the subaqueous delta but also provide stronger scientific support for the deltas’ ecological environment protection, geological environment safety, and disaster geology prevention.
1. Introduction
Since the 1950s, the amounts of sediment transported by large East Asian rivers have decreased significantly due to the impacts of human activities, such as reservoirs and dams [1,2,3,4]. The erosion and deposition process is a main environmental degradation threat [5] because water-induced soil erosion can cause land degradation [6].
The Yellow River delta is a modern estuary delta that was formed by the Yellow River, which transports a large amount of sediment to the Bohai Sea [7] (Figure 1). The coastline of the Yellow River delta is 227 km and the area of the intertidal zone and subaqueous delta is 5129 km2 [8]. It is famous for its high sediment transport, second only to the Amazon River [9]. The large amount of sediment carried by its runoff plays an important role in shaping the modern Yellow River delta [10]. Since 1976, the Yellow River delta has been increasingly affected by strong winds [11]. The increased dynamics of the ocean caused by the increase in strong winds means that the Yellow River needs to transport more sediment into the sea to maintain the delta’s growth trend. However, during 1950–2018, the water and sediment transported by the Yellow River significantly decreased. From 1999 to 2008, the average annual runoff was 27.7% of the runoff from 1950 to 1959, while the amount of suspended sediment was only 11.8% from 1950 to 1959 [12]. Further, from 2009 to 2018, the amount was less than 50% of that from 1999 to 2008 [1]. Due to the changes in the amounts of suspended sediment transported by the Yellow River in the past 70 years, the geomorphological evolution of the Yellow River subaqueous delta experienced three different stages: rapid accumulation, moderate accumulation, and slow accumulation [13].
Further, every increase of 1 × 10⁸ t/a in the suspended sediment amount transported by the river causes the subaqueous delta to deposit 3.28 km2/a. On the one-year and three-year scales, the critical sediment amounts transported by the Yellow River with regard to the subaqueous delta accumulation and erosion balance were 1.79 × 10⁸ t/a and 1.29 × 10⁸ t/a, respectively [13]. However, after 2005, the high concentration of suspended sediment transported by the Yellow River was restricted to the subaqueous delta and a 12 m water depth due to the impact of human activities [14], resulting in increases in the sediment accumulation rates in the subaqueous delta, while the sediment amount with regards to the subaqueous delta accumulation and erosion balance has reduced to 0.5 × 10⁸ m3/a [15].
Since the end of the 1990s, the amounts of sediment transported by the Yangtze River have shown an obvious downward trend [4] (Figure 2). During 2013–2015, the amounts decreased to 1.20 × 10⁸ tons, which was less than one-fifth of the amount in 1964. However, if the Yangtze River delta reaches a balance between erosion and accumulation, the amount needs to exceed 6.0 × 10⁸ tons [16]. Further, the shear stress on the bottom bed during storms is greater than the critical shear stress of the sediment [17]. This leads to erosion in the Yangtze River course within the mouth and the sandbar area. The Yangtze River subaqueous delta was also eroded [18]. The accelerated erosion process could induce deltaic ecosystem changes [19].
Other than the Yellow River and Yangtze River, the runoff and sediment fluxes of the Mekong River changed significantly due to natural processes and human activities (Figure 3). The amount of sediment transported by the Mekong River between 2012 and 2015 was only 43.1 × 10⁶ t/a, which was less than 30% of the amount before 1992 [2]. This resulted in almost no accumulation of river sediments in the Mekong subaqueous delta after the construction of the dam [20], and the sea bed under the action of the monsoon was subjected to strong shear stress [21], which caused the coastal coastline growth of the Mekong Delta to gradually decrease from 7.8 m/a to 2.8 m/a from 1973 to 2005 and then become −140 m/a after 2005. The net increase in land area in the Mekong Delta also slowed down, with the average rate dropping from 4.3 km2/a (1973–1979) to 1.0 km2/a (1995–2005), and then to −0.05 km2/a (2005–2015) [22]. Therefore, around 2005, the Mekong Delta changed from a constructive delta to an erosive delta. In addition, not only did the land area of the Mekong Delta gradually decrease but its subaqueous delta was also gradually eroded and accompanied by the formation of scouring grooves [22].
In the estuary delta area adjacent to the bay, the later transformation of the sediments [23,24,25,26] and the delta sedimentary characteristics, such as beach erosion, topography, and coastline evolution [27,28,29,30], are all affected by ocean dynamics. The erosion and accumulation of a subaqueous delta are caused by the combined effect of suspended sediment deposition and hydrodynamic scouring [31]. The wind is the most important driving force of waves and currents and it is an important factor that affects the direction and distance of suspended sediment diffusion [32]. Therefore, wind, as one of the driving forces of sediment diffusion and transport, is necessary to consider when analyzing the influence of different seasons and different wind directions on the diffusion of sediment under the influence of monsoon climate [33].
To summarise, even within the same East Asian monsoon region and with the same source (three-river source), the erosion and accumulation control factors were different in the different control types of the Yellow River (river control type), Yangtze River (tide-river shape), and Mekong River (tide-wave shape) subaqueous deltas. However, as typical East Asian deltas, the amount of the runoff and sediment transported by rivers was significantly reduced due to human activities, which led to different degrees of erosion in these deltas [25]. Although the previous studies defined the distribution characteristics of erosion and accumulation landforms in the three subaqueous deltas, the formation mechanism of the distribution characteristics remains unheeded. The types of river deltas may be changed with the reduction in the amount of sediment transported by the rivers.
Therefore, this study intended to build a model to analyze the combined effect of sediment diffusion and hydrodynamics in East Asian estuaries through simulation technology to identify the formation mechanism and control factors of erosion and accumulation landforms at the three different types of major estuary deltas in East Asia. The research results can not only further deepen the understanding of the physical process and mechanism of erosion and deposition in subaqueous deltas, but also provide stronger scientific support for these deltas’ ecological environment protection, geological environment safety, and disaster geology prevention. They can also lay a foundation for the rapid assessment of erosion and accumulation conditions in subaqueous deltas.
2. Method
The Delft 3D software and model were used to simulate the sediment diffusion and shear stress on the bottom beds of the Yellow River, Yangtze River, and Mekong River subaqueous deltas during the flood and dry seasons. The simulated results in the Yellow River subaqueous delta were used to verify the accuracy of the model. The simulated results in the Yangtze River subaqueous delta were used to verify whether the model can be applied to other subaqueous deltas. Then, the verified model was used to simulate the sediment diffusion and the shear stress on the bottom bed in the Mekong River.
2.1. Mathematical Model
The Delft 3D software was developed by the Dutch Delft Hydraulic Research Institute. It is a modular three-dimensional hydrodynamic water quality simulation system, including water flow, hydrodynamics, waves, water quality, and ecology, which can accurately calculate 2D or 3D currents, waves, water quality, sediment transport, ecology, bottom landforms, and interactions between processes. Delft3D-Flow is the main module for simulating hydrodynamic conditions. This module is based on the Navier–Stokes equation and conforms to the Boussinesq assumption. It can accurately simulate estuary deltas and bays with shallow water depths. The ADI calculation method is used to discretely solve the governing equations in the set coordinates. When the influence of vertical acceleration is ignored, the equation of water continuity under static water pressure [34] is
∂ξ/∂t + 1/(GξξGηη)0.5 × ∂[(D + ξ)U Gηη0.5]/∂ξ + 1/(GξξGηη)0.5 × ∂[(D + ξ)U Gξξ0.5]/∂η = Q
In Formula (1), Q represents the effect of the source and sink, such as drainage, precipitation, and evaporation.
In three-dimensional fluids, the momentum equations of ξ and η (the orthogonal coordinate directions) are
∂u/∂t + u/Gξξ0.5 × ∂u/∂ξ + v/Gηη0.5 × ∂u/∂η + uv/(GξξGηη)0.5 × ∂ Gξξ0.5/∂η − v2/(GξξGηη)0.5 × ∂ Gηη0.5/∂ξ+ ω/(D + ξ) × ∂u/∂σ = fv − Pξ/ρ0 Gξξ0.5 + Fξ + 1/(D + ξ)2 × ∂(vv∂u/∂σ)/∂σ + Mξ
∂v/∂t + u/Gξξ0.5 × ∂v/∂ξ + v/Gηη0.5 × ∂v/∂η + uv/(GξξGηη)0.5 × ∂Gξξ0.5/∂ξ − u2/(GξξGηη)0.5 × ∂Gηη0.5/∂η + ω/(D + ξ) × ∂v/∂σ = − fu − Pη/ρ0Gηη0.5 + Fη + 1/(D + ξ)2 × ∂(vv∂u/∂σ)/∂σ + Mη
Here, Pξ and Pη are pressure gradients, Fξ and Fη represent Reynolds stresses, G = x2 + y2 represents the coordinate conversion coefficients between Cartesian coordinates (x, y) and orthogonal curve coordinates (ξ, η), D is the relative water depth, and Mξ and Mη are the momentum of the source and sink, respectively.
The wave module uses the SWAN model. The SWAN model is the most common solution model for wave conservation equations and was successfully applied in various environments, including shallow water estuaries [35]. The model uses a fully implicit finite difference scheme, which is unconditionally stable so that the calculation of the spatial grid and time step will not be limited. The wave conservation equation of the source terms of the equilibrium equation, which include wind-induced waves, deep fragmentation, wave interaction, four-wave interaction, fragmentation, and friction terms, is
where t is time; x and y are the horizontal coordinates; θ is the direction of wave propagation; c = σ/k is the phase velocity of the wave; cgx and cgy are the x and y components of the wave group velocity cg; N is the ratio of the wave energy to the wave frequency σ; and S represents the change in wave energy, reflecting the nonlinear wave interactions, frictional dissipation, wave growth, and wave attenuation. When considering the influence of the current field, the wave action N(σ, θ) (the ratio of the energy density E(σ, θ) to the relative frequency σ) is conserved [36]. The amount of action changes with time and space.
∂N/∂t + ∂(cgxN)/∂x + ∂(cgyN)/∂y + ∂(cσN)/∂σ + ∂(cθN)/∂θ = S/σ
In Formula (4), the first term on the left is the rate of change of N(σ, θ) with time; the second and third terms represent the propagation of N(σ, θ) in the x and y directions, respectively; the fourth term represents the changes in N(σ, θ) in space due to the current field and water depth; and the fifth term represents changes due to N(σ, θ) propagation in space, i.e., the water depth and refraction of the current field.
2.2. Model Building
The three simulation areas were divided into 1.0 km × 1.0 km grids, and the time step was 1 min. The boundary conditions of the area connected with the open sea were provided by the harmonic constants of the four main tidal components.
2.2.1. The Yellow River Subaqueous Delta Simulation
In order to analyze the impact of the decrease in the amount of sediment from the Yellow River on the erosion and deposition of the Yellow River’s subaqueous delta, the simulation times of the “Summer–Autumn Flood” in July and August of 2017 and the “Winter Flood” in November and December in 2017 were selected and compared with the diffusion of water and sediment during the “Summer Flood” period in July and August 2016. The amount of sediment transport and the wind speed and direction were the average values of the “Summer Flood” in July and August 2016, the “Summer Flood” in July and August 2017, and the “Winter Flood” in November and December 2017 (Table 1) [37].
2.2.2. The Yangtze River Subaqueous Delta Simulation
The average values of the runoff and sediment fluxes in the flood season in July and August 2018 and the dry season in January and February (Table 2, data from the Yangtze River Sediment Bulletin; Dai and Zhu, 2015) were used as variables for the Yangtze River numerical simulation of the water–sediment diffusion process and the shear stress on the bottom bed in the flood and dry seasons. The results can be used to analyze the influence of sediment transported by the Yangtze River and the wind speed and direction on seabed erosion and deposition.
3. Simulation Results
3.1. Tidal Model Verification
The tidal model was validated using data from August to September 2014 from two locations along the Bohai Sea coast. The correlation between the measured and simulated tidal ranges is shown in Figure 4 and Figure 5. It can be seen that the calculated results were basically consistent with the tidal ranges of the observation.
3.2. Current Velocity Verification
From August 1 to 25 August 2014, the research team conducted continuous observations at the Yellow River estuary for 25 days [38]. The observation data were used to verify the calculation results of the current velocity (Figure 6). Figure 3a shows the change in the measured current velocity and the simulated current velocity with time. From the figure, it can be seen that the trend of the simulated current velocity was basically consistent with the measured current velocity. Figure 6b shows the correlation between the measured current velocity and the simulated current velocity (Pearson’s r = 0.69). As shown in the figure, there was a significant positive correlation between the two. However, there was a difference between the simulated current velocity and the actual current velocity under the action of the wind-induced current because the simulated wind direction and wind velocity were not the same as the actual wind direction and wind velocity.
According to the verification results of the tide and current, the SWAN model used in this study was able to reflect the tide and current changes at the Yellow River estuary, but there were still differences in the specific values. The verification results showed that a qualitative comparative study of suspended sediment transport under the action of wind and waves in the estuary area was feasible. However, if quantitative research is needed, the model needs to be further supplemented and verified.
3.3. Diffusion Range of the Water and Sediment
3.3.1. The Diffusion Simulation Results of the water and Sediment in the Yellow River Subaqueous Delta
The simulation results showed that during the “Summer Flood” in 2016, the flux of sediment transported by the Yellow River was relatively large. Under the influence of the southeast monsoon, the sediment mainly spread to Bohai Bay and affected Laizhou Bay and the central basin of the Bohai Sea (Figure 7a,d). During the “Summer Flood” in 2017, the flux of sediment was reduced; it was no longer able to affect Laizhou Bay, and its impact on Bohai Bay was also limited to the coast of Bohai Bay (Figure 7b,e). In 2017, the flux of sediment in the “Winter Flood” was greater than that of the same year in the “Summer Flood”. Under the influence of the northwest monsoon, the sediment mainly spread towards Laizhou Bay, and it spread along the whole coast of Laizhou Bay (Figure 7c,f).
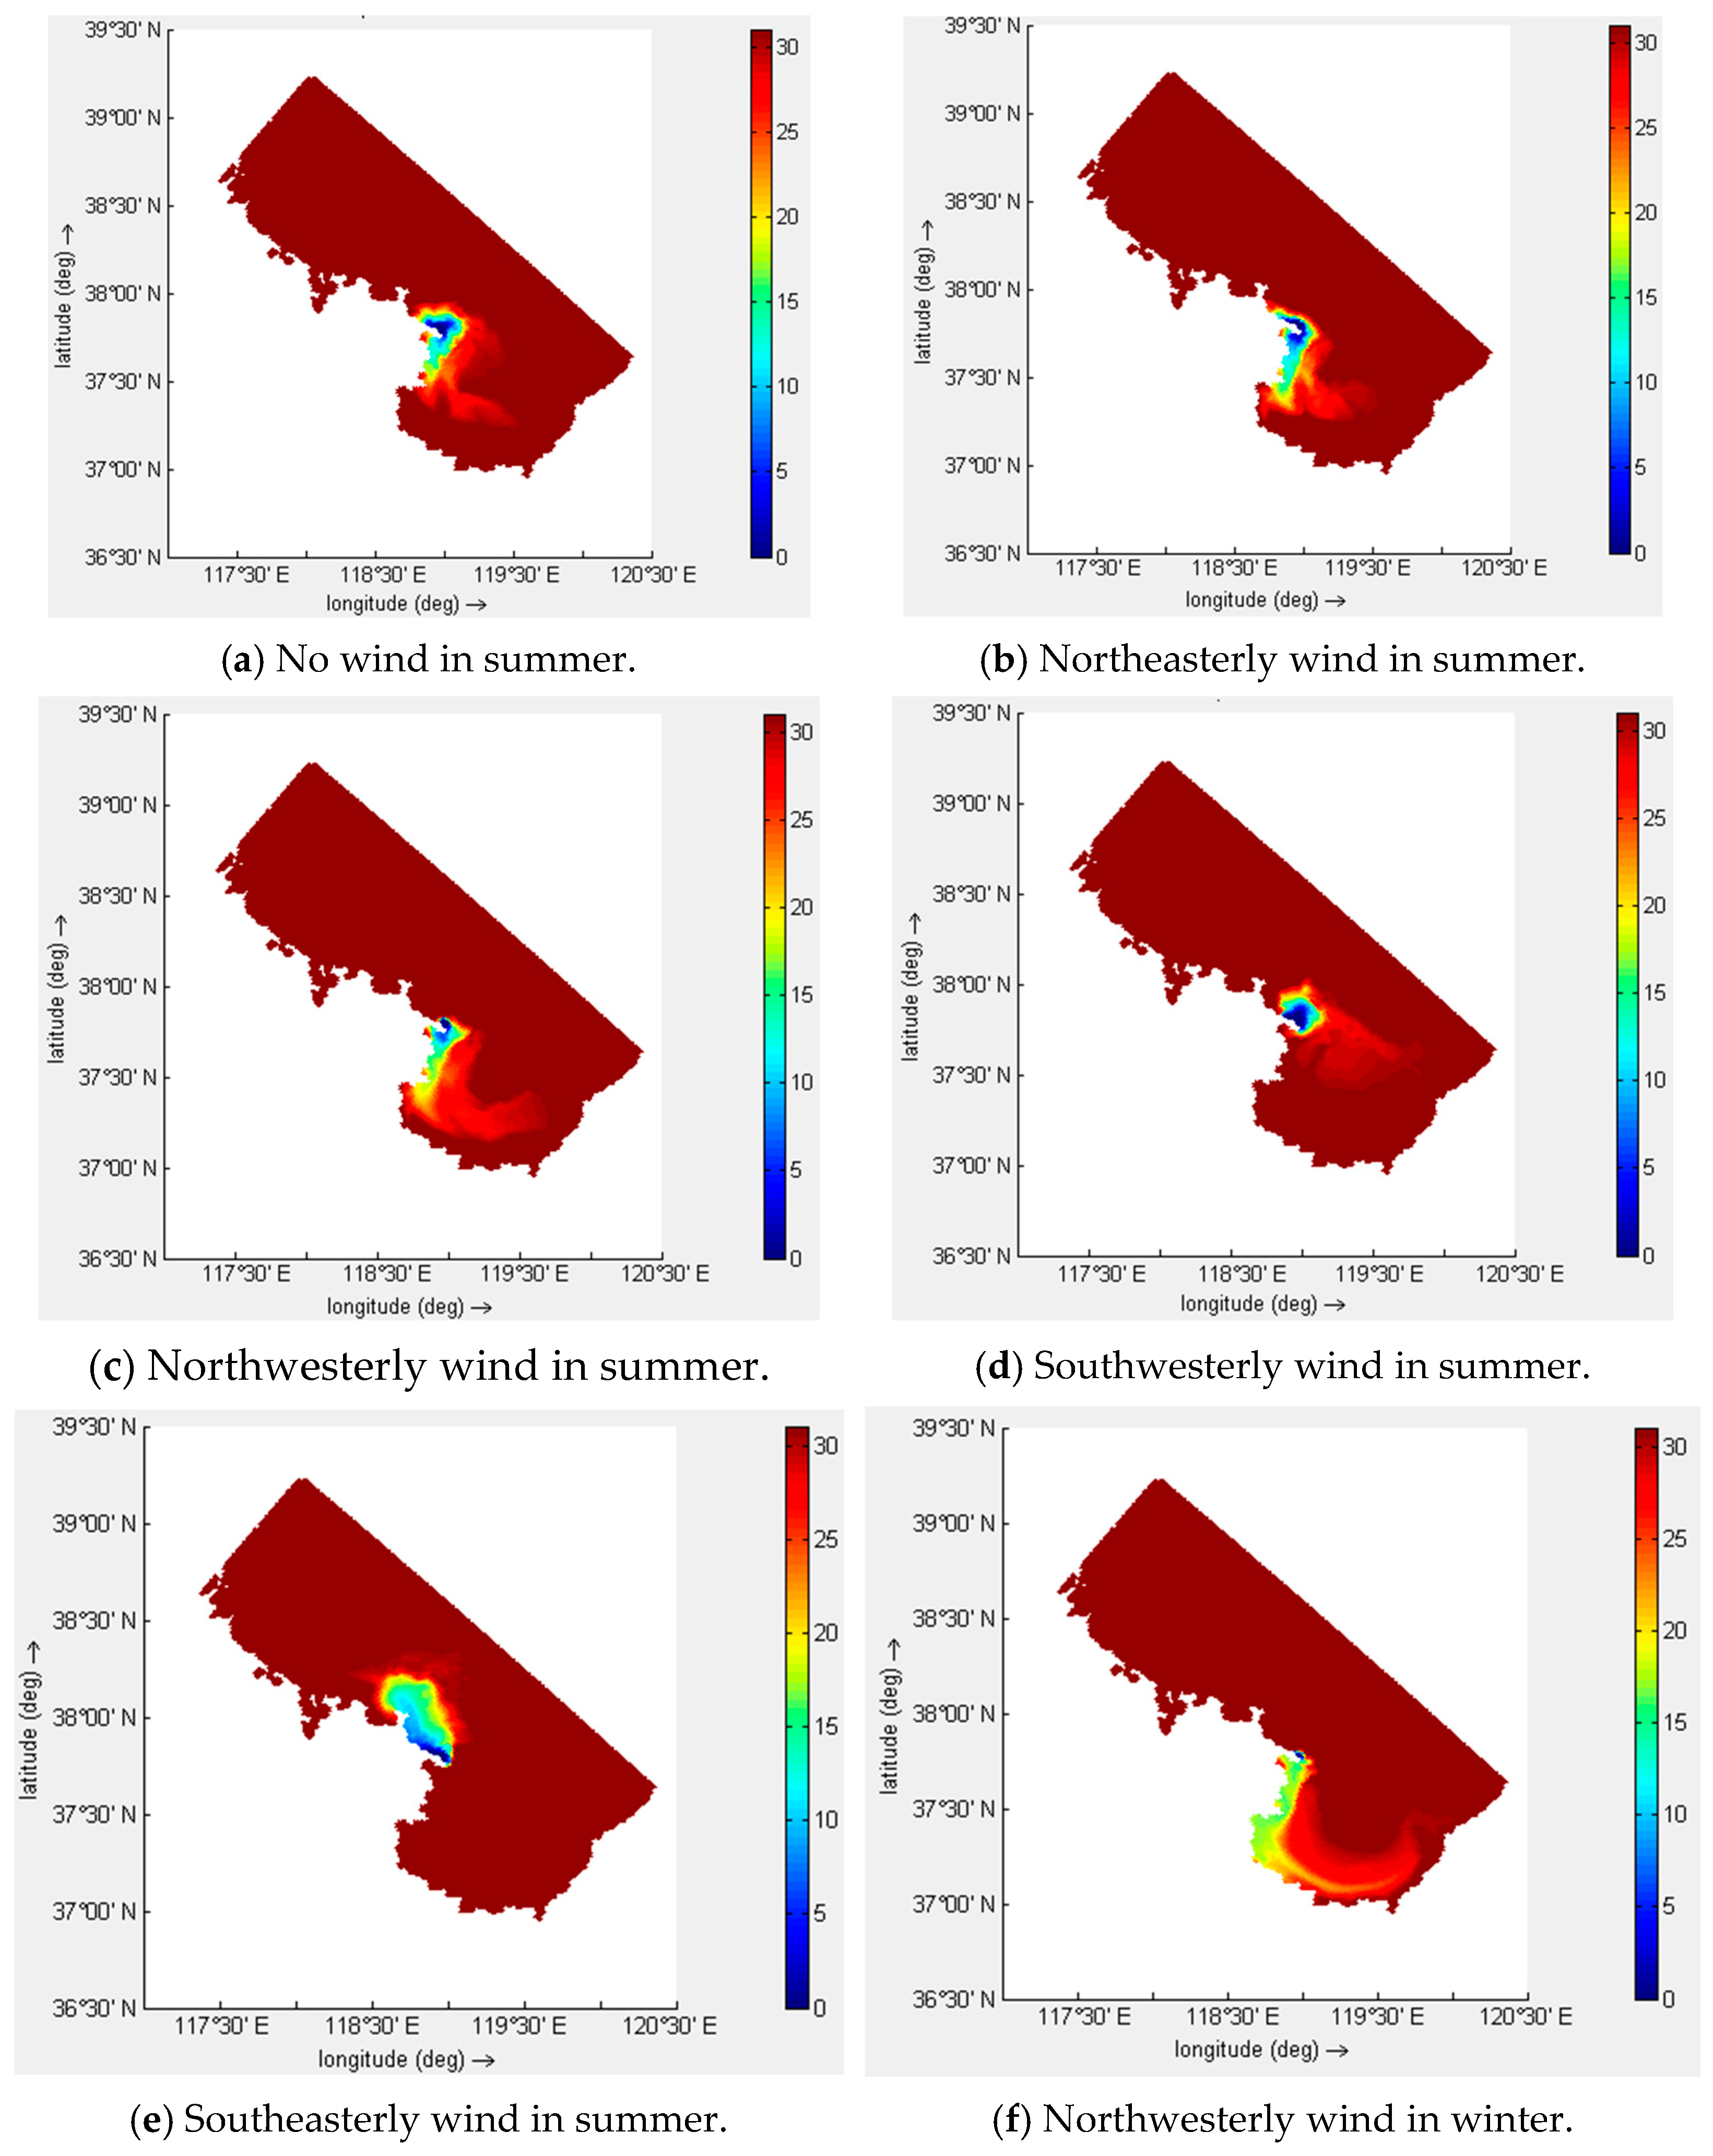
The simulation results showed that most of the sediment from the Yellow River was deposited in the estuary area, and part of the sediment spread to adjacent sea areas under the combined action of wind, waves, and currents. As shown in Figure 8 and Figure 9, in the absence of wind influence, the incoming water and sediment mainly gathered near the estuary, and a small part was transported to the southeast of Laizhou Bay (Figure 8a and Figure 9a). Based on this, it was speculated that during the period of the northerly wind, the effect of the wind was beneficial to the diffusion of sediment. The simulation results showed that the sediment spread along the west coast of Laizhou Bay under the action of the northeasterly wind in summer and reached the middle part of Laizhou Bay (Figure 8b and Figure 9b); under the action of the northwesterly wind in summer, the diffusion of sediment was similar to that under the action of the northeasterly wind, but the diffusion intensity was greater and the transport distance was longer (Figure 8c and Figure 9c). Since the wind speed in the Yellow River subaqueous delta is greater in winter than in summer, and the Yellow River delta is affected by the monsoon climate, the southeasterly wind prevails in summer, and the normal wind direction in winter is northerly [37]. The wind direction is the same as the Yellow River’s water and sediment diffusion direction, and it is more conducive to the diffusion of water and sediment. Moreover, considering the Yellow River’s “four floods” a year, the results showed that the water and sediment transported by the Yellow River in the “Winter Flood” was not less than that transported in the “Summer Flood” (Table 1); therefore, under the influence of the northwesterly wind in winter, the sediment spreading effect was stronger in the direction of Laizhou Bay, and the sediment was able to cover the entire Laizhou Bay area (Figure 8f and Figure 9f).
In contrast, the southerly wind may inhibit the diffusion of sediment. Under the influence of the southwesterly wind, the sediment in summer gathered at the mouth of the Yellow River and tended to spread to northwestern Bohai Bay, and a small part of it spread to the southeast of the Laizhou Bay mouth (Figure 8d and Figure 9d). Under the action of the southeasterly wind in summer, the sediment mainly spread to Bohai Bay near the northwest of the estuary (Figure 8e and Figure 9e). The simulation results showed that the influence of the southerly wind hindered the transportation of sediment to Laizhou Bay, and thus, the diffusion of sediment to Laizhou Bay was weakened, even to Bohai Bay.
3.3.2. The Diffusion Simulation Results for the Water and Sediment in the Yangtze River Subaqueous Delta
The simulation results showed that in the flood season in 2018 when the runoff and sediment fluxes were larger, the water and sediment diffused to Hangzhou Bay in the south of the Yangtze River estuary (Figure 10a,c); in the dry season, the runoff and sediment fluxes decreased, and the water and sediment fluxes were mainly concentrated near the estuary of the Yangtze River (Figure 10b,d).
The simulation results for the effect of wind on the diffusion of water and sediment showed that under the condition of no wind in summer, the transport intensity to the outside of the Yangtze River estuary was relatively high. Affected by the Coriolis force, the sediment was transported south (Hangzhou Bay and the coast of Fujian and Zhejiang, Figure 11a and Figure 12a). Under the action of the easterly wind in summer, the transportation of water and sediment to the south was weaker than that under no wind, and their transportation to the north of the Yangtze River estuary was strengthened (Figure 11b and Figure 12b). Under the southerly wind in summer, the southward transport of the water and sediment was weaker than that under no wind and the easterly wind, and the transport in the southward direction was strengthened (Figure 11c and Figure 12c). Under the action of the westerly wind in summer, the northward transport intensity of the water and sediment was close to that under the northerly wind, and the offshore direction was weaker than that under no wind and the easterly wind, but stronger than that under the northerly wind (Figure 8d and Figure 9d). The prevailing wind in the Yangtze River estuary in summer is the southerly wind [39]; therefore, the effect of the wind hindered the propagation of the sediment to the south (Hangzhou Bay and the coast of Fujian and Zhejiang). Therefore, the results showed that the sediment transported by the Yangtze River in summer mainly gathered near the Yangtze River mouth, and the offshore and northward transport intensity of the water and sediment was significantly enhanced (Figure 11e and Figure 12e).
The northerly wind prevails in the Yangtze River estuary in winter [39]. Under the influence of the winter northerly wind, the results showed that the transport intensities to the south Hangzhou Bay and the coast of Fujian and Zhejiang were increased, and those to the northward and offshore directions were weakened (Figure 11f and Figure 12f). Although the transport mode of the northerly wind in winter was similar to that in summer, the amount of runoff and sediment transported by the Yangtze River in winter was much smaller than that in summer, the runoff was less than half of that in summer, and the amount of sediment was only one-tenth of that in summer. Therefore, the diffusion range of sediment in winter was still smaller than that in summer (Figure 11e,f and Figure 12e,f).
3.4. Simulation Results of Shear Stress on the Bottom Bed
The wind is the most important driving force of waves and currents; it not only has an important effect on suspended sediment diffusion but also affects shear stress on the bottom bed. Therefore, accounting for wind as one of the driving forces of bottom bed erosion is necessary to analyze the influence of different seasons and different wind directions on the shear stress under the influence of the monsoon climate.
3.4.1. Simulation Results of the Shear Stress on the Bottom Bed of the Yellow River Subaqueous Delta
Combined with modern observation data assuming that the wind speed remained unchanged, under the six conditions of no wind in summer, northeasterly wind in summer, northwesterly wind in summer, southwesterly wind in summer, southeasterly wind in summer, and northeasterly wind in winter, the effect of shear stress changes on the bottom bed affected by changes in the wind direction was simulated. The simulation results showed that under the condition of constant wind speed, the change in wind direction had little effect on the shear stress on the bottom bed (Figure 13a–e). The wind speed in the Yellow River delta in winter was greater than that in summer. As the wind speed increased, the shear stress on the bottom bed along the coast increased accordingly (Figure 13f), indicating that the wind speed was the main factor that affected the shear stress on the bottom bed.
3.4.2. Simulation Results of Shear Stress on the Bottom Bed of the Yangtze River Subaqueous Delta
The changes in the shear stress on the bottom bed were simulated under the conditions of no wind in summer, easterly wind in summer, northerly wind in summer, westerly wind in summer, southerly wind in summer, and northerly wind in winter. The simulation results showed that the shear stress on the bottom bed was similar under the six wind conditions, and the shear stress was stronger around the river month and in the northeastern part of the Yangtze River subaqueous delta (Figure 14). These results illustrated that wind had a small impact on the shear stress.
4. Discussion
4.1. The Characteristics of Erosion and Deposition in the Yellow River Subaqueous Delta
Past studies have found that the pits are distributed in groups in the shallow waters near the northwestern part of the Yellow River delta. The diameters of the entire group of erosion pits reach about 800 m. At the same time, several small pit groups developed in the coastal area of Feiyantan in the northeastern part of the Yellow River delta. Further, under the action of tidal currents and coastal currents, scour troughs formed in the coastal area between Shenxiangou and Dongying Seaport in the northern part of the Yellow River Delta, and eroded landforms formed, such as erosion residues and sand spots. These scoured sediments and sediments carried by tidal currents accumulated outside the river mouth. Additionally, under the interaction of strong wind, wave, and tidal current action, these sediments, which consisted of coarse-grained silty sand, developed large seabed sand waves, sand ridges, and estuary dunes at the water depth of 0.7 m in the front edge of modern estuary deltas, and sand dams at the depth of 7–12 m [40]. In the Yellow River subaqueous delta region, the accumulation pattern appeared as “southern accumulation and northerly erosion”.
In the early winter, the downstream water surface is frozen while the upstream water surface is not frozen, resulting in water storage in the upper reaches of the Yellow River. When the downstream ice surface is broken, the upstream storage water flows out from the “Winter Flood”. The “Winter Flood” induces a large amount of water and sediment transport into the sea in winter. Therefore, under the action of the Coriolis force, the relatively strong winter monsoon effect makes the southward transport volume of sediment greater than the northward transport volume. As a result, the southern part of the Yellow River subaqueous delta (the eastern and southeastern part of Laizhou Bay) had fine-grained sediments transported by the Yellow River [41], while the northern part developed erosive landforms [42], presenting a “south deposition and north erosion” model. The critical erosion stress of the Yellow River delta is about 0.30 Pa [43].
4.2. The Characteristics of Erosion and Deposition in the Yangtze River Subaqueous Delta
The scour troughs in the Yangtze River delta are mainly distributed between Hangzhou Bay and the Zhoushan Islands in the southern part of the delta. The evolution trend shows a trend of accumulation in the north and erosion in the south. The sand ridges are dominated by tidal currents and are mainly distributed at the southern part of Subei Shoal in the northern part of the Yangtze River subaqueous delta and the southeastern outer edge of the delta [42]. The bottom bed changes in the Yangtze River mouth are mainly characterised by “channel erosion and shoal accumulation”, “near-shore (depth < 6.4 m) accumulation and far-shore (6.4 m < depth < 19 m) erosion” outside the mouth, and the accumulation pattern appears as “southern erosion and northerly accumulation” [44].
From the above results, it can be seen that the transportation of water and sediment from the Yangtze River estuary to Hangzhou Bay and the coast of Fujian and Zhejiang were mainly found to be concentrated under no wind, the westerly wind, the easterly wind, and the northerly wind in summer and under the northerly wind in winter. The southerly wind prevailed in the Yangtze River estuary in summer, and the diffusion effect was the strongest under the action of the southerly wind; therefore, the offshore and northward transportation of water and sediment mainly occurred in summer, except for the period of the northerly wind. Therefore, the southward transportation mainly occurred in winter, and the diffusion of water and sediment in the Yangtze River estuary in summer fully confirmed the sediment transportation mode of “summer storage and winter transportation” [45].
5. Conclusions
In the Yellow River delta, the river subaqueous deltas were dominated by rivers when the accumulation landforms concentrated in the direction of the Coriolis force due to hydrodynamic erosion driven by wind, and the sediment diffusion range was mainly concentrated in shallow water areas (water depth < 6 m). In contrast, the subaqueous deltas were dominated by hydrodynamics. For example, the Yellow River delta is located in the East Asian temperate monsoon climate zone. Due to the existence of “winter floods”, there were strong fluxes of water and sediment in both winter and summer in the Yellow River delta. Therefore, under the action of the Coriolis force, the relatively strong winter monsoon effect made the volume of sediment transported southward greater than that transported northward, leading to the development of accumulation in the southern part of the Yellow River subaqueous delta and the development of eroded landforms in the north, presenting a pattern of “northern erosion and south accumulation”.
The sediment transported from the Yangtze River was concentrated in summer. The amount of sediment in summer was more than 10 times that in winter. It spread northward under the action of the southerly wind in summer. In contrast, the wind and waves increased under the action of the northerly wind in winter. Further, the decrease in the amount of sediment, coupled with the influence of the Coriolis force, made the southern part of the estuary more susceptible to erosion.
Author Contributions
Software, J.P.L.; data curation, B.L.; writing—original draft preparation, B.L.; writing—review and editing, B.L.; funding acquisition, B.L.; supervision, Y.J. All authors have read and agreed to the published version of the manuscript.
Funding
This research project was supported by “the Fundamental Research Funds for the Central Universities, SCUT” (22CX01004A-8, 21CX06016A) and the “National Natural Science Foundation of China” (42107157).
Institutional Review Board Statement
Not applicable.
Informed Consent Statement
Not applicable.
Data Availability Statement
The data presented in this study are available on request from the corresponding author. The data are not publicly available due to the data takes up too much space.
Acknowledgments
Special thanks go to the Ocean University of China for the joint training MSc programs and NC State University for giving me a visiting scholar opportunity.
Conflicts of Interest
The authors declare no conflict of interest.
References
- Wang, H.; Sun, F. Variability of annual sediment load and runoff in the Yellow River for the last 100 years (1919–2018). Sci. Total Environ. 2020, 758, 143715. [Google Scholar] [CrossRef] [PubMed]
- Van Binh, D.; Kantoush, S.; Sumi, T. Changes to long-term discharge and sediment loads in the Vietnamese Mekong Delta caused by upstream dams. Geomorphology 2019, 353, 107011. [Google Scholar] [CrossRef]
- Lu, J.; Qiao, F.; Wang, X.; Teng, Y.; Jung, K.T.; Liu, Y. Modeling the Yellow River sediment flux and its deposition patterns under climatological conditions. Ocean Dyn. 2013, 63, 709–722. [Google Scholar] [CrossRef]
- Zhang, R.; Wang, Y.; Pan, S. Variations of Suspended Sediment Concentrations and Loads into the Estuary Area from Yangtze River in Recent 50 Years. Mar. Sci. Bull. 2008, 27, 1–9. (In Chinese) [Google Scholar]
- Stefanidis, S.; Alexandridis, V.; Ghosal, K. Assessment of Water-Induced Soil Erosion as a Threat to Natura 2000 Protected Areas in Crete Island, Greece. Sustainability 2022, 14, 2738. [Google Scholar] [CrossRef]
- Mashhadi, A.; Jafari, R. Mapping and quantitative identification of sensitive regions to land degradation in south of Isfahan province using modified MEDALUS model. J. Geogr. Environ. Hazards 2022, 11, 57–75. [Google Scholar]
- Wang, H.; Yang, Z.; Li, Y.; Guo, Z.; Sun, X.; Wang, Y. Dispersal pattern of suspended sediment in the shear frontal zone off the Huanghe (Yellow River) mouth. Cont. Shelf Res. 2007, 27, 854–871. [Google Scholar] [CrossRef]
- Chu, Z.X.; Sun, X.G.; Zhai, S.K.; Xu, K.H. Changing pattern of accretion/erosion of the modern Yellow River (Huanghe) subaerial delta, China: Based on remote sensing images. Mar. Geol. 2006, 227, 13–30. [Google Scholar] [CrossRef]
- Milliman, J.D.; Syvitski, J.P.M. Geomorphic/tectonic control of sediment discharge into the ocean: The importance of small mountainous rivers. J. Geol. 1992, 100, 525–544. [Google Scholar] [CrossRef]
- Peng, J.; Chen, S.L.; Dong, P. Temporal variation of sediment load in the Yellow River basin, China, and its impacts on the lower reaches and river delta. Catena 2010, 2–3, 135–147. [Google Scholar] [CrossRef]
- Fan, Y. Seabed Erosion and Its Mechanism in the Littoral Area of Yellow River Delta. Ph.D. Thesis, East China Normal University, Shanghai, China, 2019. (In Chinese). [Google Scholar]
- Peng, J.; Chen, S. The Variation Process of Water and Sediment and Its Effect on the Yellow River Delta over the Six Decades. Acta Geogr. Sin. 2009, 64, 1353–1362. (In Chinese) [Google Scholar]
- Jiang, C.; Pan, S.Q.; Chen, S.L. Recent morphological changes of the Yellow River (Huanghe) submerged delta: Causes and environmental implications. Geomorphology 2017, 293, 93–107. [Google Scholar] [CrossRef]
- Wu, X.; Bi, N.; Yuan, P.; Li, S.; Wang, H. Sediment dispersal and accumulation off the present Huanghe (Yellow River) delta as impacted by the Water-Sediment Regulation Scheme. Cont. Shelf Res. 2015, 111, 126–138. [Google Scholar] [CrossRef]
- Bi, N.S.; Wang, H.J.; Yang, Z.S. Recent changes in the erosion–accretion patterns of the active Huanghe (Yellow River) delta lobe caused by human activities. Cont. Shelf Res. 2017, 90, 70–78. [Google Scholar] [CrossRef]
- Jia, J.; Gao, J.; Cai, T.; Li, Y.; Yang, Y.; Wang, Y.P.; Xia, X.; Li, J.; Wang, A.; Gao, S. Sediment accumulation and retention of the Changjiang (Yangtze River) subaqueous delta and its distal muds over the last century. Mar. Geol. 2018, 401, 2–16. [Google Scholar] [CrossRef]
- Yang, H.F.; Yang, S.L.; Xu, K.; Wu, H.; Shi, B.W.; Zhu, Q.; Zhang, W.X.; Yang, Z. Erosion potential of the Yangtze Delta under sediment starvation and climate change. Sci. Rep. 2017, 7, 10535. [Google Scholar] [CrossRef] [Green Version]
- Luan, H.L.; Ding, P.X.; Wang, Z.B.; Ge, J.Z. Process-based morphodynamic modeling of the Yangtze Estuary at a decadal timescale: Controls on estuarine evolution and future trends. Geomorphology 2017, 290, 347–364. [Google Scholar] [CrossRef]
- Zhao, H.; Lin, Y.; Delang, C.O.; Ma, Y.; Zhou, J.; He, H. Contribution of soil erosion to the evolution of the plateau-plain-delta system in the Yellow River basin over the past 10,000 years. Palaeogeogr. Palaeoclimatol. Palaeoecol. 2022, 601, 111133. [Google Scholar] [CrossRef]
- DeMaster, D.; Liu, P.; Eidam, E.; Nittrouer, C.; Nguyen, T. Determining rates of sediment accumulation on the Mekong shelf: Timescales, steady-state assumptions, and radiochemical tracers. Cont. Shelf Res. 2017, 147, 182–196. [Google Scholar] [CrossRef]
- Xue, Z.; He, R.; Liu, J.; Warner, J.C. Modeling transport and deposition of the Mekong River sediment. Cont. Shelf Res. 2012, 37, 66–78. [Google Scholar] [CrossRef]
- Liu, P.; DeMaster, D.; Nguyen, T.; Saito, Y.; Nguyen, V.L.; Ta, T.K.O.; Li, X. Stratigraphic Formation of the Mekong River Delta and Its Recent Shoreline Changes. Oceanography 2017, 30, 72–83. [Google Scholar] [CrossRef]
- Jia, Y.G.; Fu, Y.B.; Xu, G.H.; Shan, H.X.; Cao, X.Q. The fractal character’s change in the Huanghe River Estuary due to the hydrodunamic condition’s variation. Acta Ocean. Sin. 2003, 2, 191–200. [Google Scholar]
- Jia, Y.G.; Liu, X.L.; Shan, H.X.; Zhen, J.W.; Huo, S.X. The effects of hydrodynamic conditions on geotechnical strength of the sediment in Yellow River Delta. Int. J. Sediment Res. 2011, 3, 318–330. [Google Scholar] [CrossRef]
- Zheng, J.W.; Shan, H.X.; Jia, Y.G.; Liu, X.; Hou, W. Field tests and observation of wave-loading influence on erodibility of silty sediments in the Huanghe (Yellow River) Estuary, China. J. Coast. Res. 2011, 27, 706–717. [Google Scholar]
- Meng, X.M.; Jia, Y.G.; Shan, H.X.; Yang, Z.N.; Zheng, J.W. An experimental study on erodibility of inter tidal sediments in the Yellow River delta. Int. J. Sediment Res. 2012, 27, 240–249. [Google Scholar] [CrossRef]
- Yang, Z.; Ji, Y.; Bi, N.; Lei, K.; Wang, H. Sediment transport off the Huanghe (Yellow River) delta and in the adjacent Bohai Sea in winter and seasonal comparison. Estuar. Coast. Shelf Sci. 2011, 93, 173–181. [Google Scholar] [CrossRef]
- Baldock, T.E.; Alsina, J.A.; Caceres, I.; Vicinanza, D.; Contestabile, P.; Power, H.; Sanchez-Arcilla, A. Large-scale experiments on beach profile evolution and surf and swash zone sediment transport induced by long waves, wave groups and random waves. Coast. Eng. 2011, 58, 214–227. [Google Scholar] [CrossRef]
- Nam, P.T.; Larson, M.; Hanson, H. A numerical model of beach morphological evolution due to waves and currents in the vicinity of coastal structures. Coast. Eng. 2011, 58, 863–876. [Google Scholar] [CrossRef]
- Fan, H.; Huang, H.; Zeng, T.Q.; Wang, K. River mouth bar formation, riverbed aggradation and channel migration in the modern Huanghe (Yellow) River delta, China. Geomorphology 2006, 74, 124–136. [Google Scholar] [CrossRef]
- Burchard, H.; Schuttelaars, H.M.; Ralston, D.K. Sediment trapping in estuaries. Annu. Rev. Mar. Sci. 2018, 10, 371–395. [Google Scholar] [CrossRef]
- Nakanowatari, T.; Nakamura, T.; Mitsudera, H.; Nishioka, J.; Kuroda, H.; Uchimoto, K. Interannual to decadal variability of phosphate in the Oyashio region: Roles of wind-driven ocean current and tidally induced vertical mixing in the Sea of Okhotsk. Prog. Oceanogr. 2021, 197, 102615. [Google Scholar] [CrossRef]
- Gong, W.; Zhang, G.; Yuan, L.; Zhu, L.; Zhang, H. Effects of swell waves on the dynamics of the estuarine turbidity maximum in an idealized convergent partially mixed estuary. J. Mar. Syst. 2022, 235, 103784. [Google Scholar] [CrossRef]
- Qiao, F.; Zheng, B.; Lei, K.; Zhou, G.; Liu, Q. Hydrodynamic in the Lower Reaches of the Yangtze River and Its Estuary. Res. Environ. Sci. 2017, 30, 389–397. (In Chinese) [Google Scholar]
- Lettmann, A.K.; Wolff, J.O.; Badewien, H.T. Modeling the impact of wind and waves on suspended particulate matter fluxes in the East Frisian Wadden Sea (southern North Sea). Ocean Dyn. 2009, 59, 239–262. [Google Scholar] [CrossRef]
- Carniello, L.; Defina, A.; Fagherazzi, S.; D’Alpaos, L. A combined wind wave–tidal model for the Venice lagoon, Italy. J. Geophys. Res. 2005, 4, 110. [Google Scholar] [CrossRef]
- Ren, H.; Li, G.; Cui, L.; He, L. Phases and periodic changes of water discharge and sediment load from the Yellow River to the Bohai Sea during 1950–2011. Acta Geogr. Sin. 2014, 69, 619–631. (In Chinese) [Google Scholar]
- Li, B.; Jia, Y.; Liu, J.P.; Liu, X.; Wang, Z. Effect of Wave, Current and Lutoclines on Sediment Resuspension in the Yellow River Delta-Front. Water 2020, 12, 845. [Google Scholar] [CrossRef]
- Dai, R.; Zhu, J. Statistical analysis of the wind at the Chongming eastern beach. J. East China Norm. Univ. (Nat. Sci.) 2015, 4, 17–25. (In Chinese) [Google Scholar]
- Li, P. Mechanism and Division of Typical Geological Hazards on the Surface and Shall of Seabed of the Yellow River Delta Offshore. Ph.D. Thesis, Ocean University of China, Qingdao, China, 2015. (In Chinese). [Google Scholar]
- Qiao, S.; Shi, X.; Zhu, A.; Liu, Y.; Bi, N.; Fang, X.; Yang, G. Distribution and transport of suspended sediments off the Yellow River (Huanghe) mouth and the nearby Bohai Sea. Estuar. Coast. Shelf Sci. 2010, 86, 337–344. [Google Scholar] [CrossRef]
- Song, W. Research on the geological hazard in the sea aera of the Yangtze River Mouth. Shanghai Land Resour. 2005, 3, 10–15. (In Chinese) [Google Scholar]
- Li, B.; Jia, Y.; Liu, J.P.; Su, J.; Liu, X.; Wen, M. The controlling factors of high suspended sediment concentration in the intertidal flat off the Huanghe River Estuary. Acta Oceanol. Sin. 2020, 39, 96–106. [Google Scholar] [CrossRef]
- Yi, S. Accretion-Erosion Evolution and its Driving Mechanisms of Yangtze Underwater Delta Over the Past Nearly 20 Years. Master’s Thesis, Chengdu University of Technology, Chengdu, China, 2018. (In Chinese). [Google Scholar]
- Guo, Z.; Yang, Z.; Fan, D.; Pan, Y. Seasonal Sedimentary Effect on the Changjiang Estuary Mud Area. Acta Geogr. Sin. 2003, 4, 591–597. (In Chinese) [Google Scholar]
Figure 1.
The Yellow River subaqueous delta.

Figure 2.
The critical shear stress in the Yangtze River subaqueous delta [17].
Figure 2.
The critical shear stress in the Yangtze River subaqueous delta [17].

Figure 3.
The Mekong River subaqueous delta [22].
Figure 3.
The Mekong River subaqueous delta [22].

Figure 4.
Changes in (a) and correlation between (b) the measured tidal range and simulated tidal range over time at 119.16° E, 37.19° N (Pearson’s r = 0.94).
Figure 4.
Changes in (a) and correlation between (b) the measured tidal range and simulated tidal range over time at 119.16° E, 37.19° N (Pearson’s r = 0.94).

Figure 5.
Changes in (a) and correlation between (b) the measured tidal range and simulated tidal range over time at 118.93° E, 38.08° N (Pearson’s r = 0.92).
Figure 5.
Changes in (a) and correlation between (b) the measured tidal range and simulated tidal range over time at 118.93° E, 38.08° N (Pearson’s r = 0.92).

Figure 6.
Changes in (a) and correlation between (b) the measured current velocity and simulated current velocity over time (Pearson’s r = 0.69).
Figure 6.
Changes in (a) and correlation between (b) the measured current velocity and simulated current velocity over time (Pearson’s r = 0.69).

Figure 7.
The diffusion of suspended sediment (a–c) and water (b–f) in the Yellow River delta during the summer flood periods in 2016 (a,d) and 2017 (b,e), and the winter flood period in 2017 (c,f).
Figure 7.
The diffusion of suspended sediment (a–c) and water (b–f) in the Yellow River delta during the summer flood periods in 2016 (a,d) and 2017 (b,e), and the winter flood period in 2017 (c,f).

Figure 8.
Water diffusion in the Yellow River delta under no wind (a), northeasterly wind (b), northwesterly wind (c), southwesterly wind (d), and southeasterly wind (e) in summer and northwesterly wind (f) in winter (unit: ppt).
Figure 8.
Water diffusion in the Yellow River delta under no wind (a), northeasterly wind (b), northwesterly wind (c), southwesterly wind (d), and southeasterly wind (e) in summer and northwesterly wind (f) in winter (unit: ppt).

Figure 9.
Suspended sediment diffusion in the Yellow River delta under no wind (a), northeasterly wind (b), northwesterly wind (c), southwesterly wind (d), and southeasterly wind (e) in summer and northwesterly wind (f) in winter (unit: g/L).
Figure 9.
Suspended sediment diffusion in the Yellow River delta under no wind (a), northeasterly wind (b), northwesterly wind (c), southwesterly wind (d), and southeasterly wind (e) in summer and northwesterly wind (f) in winter (unit: g/L).

Figure 10.
The diffusion of suspended sediment (a,c) and water (b,d) in the Yangtze River delta during the flood (a,b) and dry seasons (c,d) in 2018.
Figure 10.
The diffusion of suspended sediment (a,c) and water (b,d) in the Yangtze River delta during the flood (a,b) and dry seasons (c,d) in 2018.


Figure 11.
Water diffusion in the Yangtze River delta under no wind (a), easterly wind (b), northerly wind (c), westerly wind (d), and southerly wind (e) in summer and northerly wind (f) in winter (unit: ppt).
Figure 11.
Water diffusion in the Yangtze River delta under no wind (a), easterly wind (b), northerly wind (c), westerly wind (d), and southerly wind (e) in summer and northerly wind (f) in winter (unit: ppt).

Figure 12.
Suspended sediment diffusion of the Yangtze River delta under no wind (a), easterly wind (b), northerly wind (c), westerly wind (d), and southerly wind (e) in summer and northerly wind (f) in winter (unit: g/L).
Figure 12.
Suspended sediment diffusion of the Yangtze River delta under no wind (a), easterly wind (b), northerly wind (c), westerly wind (d), and southerly wind (e) in summer and northerly wind (f) in winter (unit: g/L).

Figure 13.
The shear stress on the bottom bed of the Yellow River delta under no wind (a), northeasterly wind (b), northwesterly wind (c), southwesterly wind (d), and southeasterly wind (e) in summer and northwesterly wind (f) in winter (unit: Pa).
Figure 13.
The shear stress on the bottom bed of the Yellow River delta under no wind (a), northeasterly wind (b), northwesterly wind (c), southwesterly wind (d), and southeasterly wind (e) in summer and northwesterly wind (f) in winter (unit: Pa).

Figure 14.
The shear stress on the bottom bed of the Yangtze River delta under no wind (a), easterly wind (b), northerly wind (c), westerly wind (d), and southerly wind (e) in summer and northerly wind (f) in winter (unit: Pa).
Figure 14.
The shear stress on the bottom bed of the Yangtze River delta under no wind (a), easterly wind (b), northerly wind (c), westerly wind (d), and southerly wind (e) in summer and northerly wind (f) in winter (unit: Pa).


Table 1.
Average values of water, sediment fluxes, and wind velocity in the Yellow River during the summer flood periods in 2016 and 2017 and the winter flood period in 2017.
Table 1.
Average values of water, sediment fluxes, and wind velocity in the Yellow River during the summer flood periods in 2016 and 2017 and the winter flood period in 2017.
| Summer Flood (2016) | Summer Flood (2017) | Winter Flood (2017) | |
|---|---|---|---|
| Average water flux | 680 m3/s | 380 m3/s | 430 m3/s |
| Average suspended sediment concentration | 2.4 g/L | 0.5 g/L | 1.5 g/L |
| Wind velocity | 3 m/s | 3 m/s | 5 m/s |
| Wind direction | 130° | 130° | 310° |
Table 2.
Average values of water, sediment fluxes, and wind velocity in the Yangtze River during the flood and dry seasons in 2018.
Table 2.
Average values of water, sediment fluxes, and wind velocity in the Yangtze River during the flood and dry seasons in 2018.
| Flood Season (July, August) | Dry Season (January, February) | |
|---|---|---|
| Average water flux | 39,000 m3/s | 17,000 m3/s |
| Average suspended sediment concentration | 0.2 g/L | 0.05 g/L |
| Wind velocity | 4.9 m/s | 4.4 m/s |
| Wind direction | 180° | 0° |
Publisher’s Note: MDPI stays neutral with regard to jurisdictional claims in published maps and institutional affiliations. |
© 2022 by the authors. Licensee MDPI, Basel, Switzerland. This article is an open access article distributed under the terms and conditions of the Creative Commons Attribution (CC BY) license (https://creativecommons.org/licenses/by/4.0/).
Share and Cite
MDPI and ACS Style
Li, B.; Liu, J.P.; Jia, Y. Comparison of the Causes of Erosion–Deposition between Yellow River, Yangtze River, and Mekong River Subaqueous Delta l: Model Building. Water 2022, 14, 3208. https://doi.org/10.3390/w14203208
AMA Style
Li B, Liu JP, Jia Y. Comparison of the Causes of Erosion–Deposition between Yellow River, Yangtze River, and Mekong River Subaqueous Delta l: Model Building. Water. 2022; 14(20):3208. https://doi.org/10.3390/w14203208
Chicago/Turabian StyleLi, Bowen, Jing Paul Liu, and Yonggang Jia. 2022. "Comparison of the Causes of Erosion–Deposition between Yellow River, Yangtze River, and Mekong River Subaqueous Delta l: Model Building" Water 14, no. 20: 3208. https://doi.org/10.3390/w14203208
Note that from the first issue of 2016, this journal uses article numbers instead of page numbers. See further details here.