
Effects of Land Consolidation and Precipitation Changes on the Balance of Water Supply and Demand in Western Jilin


1
Heilongjiang Xingkai Lake Wetland Ecosystem National Observation and Research Station & Key Laboratory of Wetland Ecology and Environment & Jilin Provincial Joint Key Laboratory of Changbai Mountain Wetland and Ecology, Northeast Institute of Geography and Agroecology, Chinese Academy of Sciences, Changchun 130102, China
2
University of Chinese Academy of Sciences, Beijing 100049, China
3
College of Agriculture, Jilin Agricultural University, Changchun 130118, China
4
Jilin Yanming Lake National Nature Reserve Administration, Dunhua 133700, China
*
Author to whom correspondence should be addressed.
Water 2022, 14(20), 3206; https://doi.org/10.3390/w14203206
Submission received: 31 August 2022
/
Revised: 2 October 2022
/
Accepted: 10 October 2022
/
Published: 12 October 2022
(This article belongs to the Section Hydrology)
Abstract
:As an important ecosystem service, water supply is closely related to human well-being. Maintaining the balance of water supply and demand is essential in the sustainable development of a regional economy and society. Taking western Jilin, where the difference between water supply and demand is increasingly prominent, as the research object, from the perspective of land consolidation and precipitation changes, this paper analyzes the temporal and spatial changes of water resources supply and demand at the regional and county scales in western Jilin from 2000 to 2018 by the InVEST model and the water resource demand model. The results show that water production in western Jilin did not change significantly before and after land consolidation. The change in planting structure made water demand increase from 3.03 billion m3 to 4.96 billion m3, which reversed the relationship between supply and demand. The impact of precipitation changes on water production is extremely significant. The annual production of water in wet years is 8.05 billion m3, and the annual water production in dry years is 1.08 billion m3. The amount of precipitation can directly change the relationship between the supply and demand of local water resources. The evolution of the water resources supply and demand pattern in western Jilin is the result of the combined effect of land consolidation and precipitation changes. Precipitation mainly affects supply, while land consolidation mainly affects demand.
1. Introduction
Ecosystem services refer to all the benefits that humans derive from ecosystems, including provisioning, regulating, cultural, and supporting services. The sustainable supply of these services is an important guarantee for sustainable economic and social development [1,2]. However, humans did not manage ecosystem services effectively, and the demand far exceeded the supply, resulting in the degradation of more than 60% of the ecosystem services worldwide in the past century [3], which seriously damaged the sustainable development of human society. Reasonable determination of the supply and demand of ecosystem services is crucial to the scientific management of ecosystem services.
Water is the source of life and all being. Water supply services refer to the freshwater resources provided by ecosystems for human beings, and they play an essential role in human production and life and regional water cycles [4]. Marked by the millennium ecosystem assessment (MA) listing freshwater supply as an important ecosystem supply service, water supply has gradually become a hotspot in ecosystem services research [3,5]. There are abundant modeling methods related to water supply, including the ecosystem service assessment model (ARIES), the classical hydrological model (SWAT), a tool for the integrated valuation of ecosystem services and tradeoffs (InVEST), etc. [6,7,8,9]. Among them, the InVEST model jointly developed by Stanford University, the WWF, and the Nature Conservancy in 2007 is one of the most widely used models in ecosystem management decisions. Compared with the traditional ecosystem service assessment methods, the InVEST model has advantages in dynamic change assessment, spatial evolution, and future-scenario analysis of ecosystem services. The InVEST model can effectively reveal the spatial heterogeneity of ecosystem services [3,10] and has achieved good results in the assessment of ecosystem services in China, the United Kingdom, western Europe, India, and other regions [11,12,13,14]. Water supply has been a hotspot in the last years as an important ecosystem service, but relevant studies are rarely integrated with local demand, especially for the spatial evolution of water demand [13,15,16]. A common practice in existing research is to estimate the spatialized water demand based on spatialized socioeconomic data combined with the water demand of various types of land. The simulation of precipitation changes using the water production module also starts from two respects: on the one hand, combining different representative concentration pathways (RCP) to simulate the precipitation of future climate change [17]; on the other hand, selecting the actual precipitation of several specific years to set as the scenario [18]. These perspectives do not take into account the impact of precipitation uncertainty on the supply and demand of water, making it difficult for research to effectively guide the formulation of local water policies.
In addition, using the InVEST model to assess the impact of ecological engineering on ecosystem services has gradually increased in recent years, but there has been little research on land consolidation [19,20]. Since the 21st century, China’s demand for food has increased mainly because of the constant growth of the standard of living and population. Therefore, China has promulgated a series of land consolidation policies to ensure the country’s food security. Land consolidation is an important means to realize the sustainable development of agriculture and rural areas [21,22]. It is different from the ecological project whose primary goal is to improve the ecological environment and realize the harmonious development of man and nature [20,23]. The increase in grain production is the core goal of land consolidation, and, on this basis, the organic combination of ecological security and food security is realized [24]. Specifically, land consolidation has gradually reclaimed unused or unreasonably used land for arable land through a series of means [24]. The process of converting a large amount of unused land into arable land will rapidly increase agricultural water use, thereby changing the relationship between regional water supply and demand. Therefore, this paper analyzed the spatial-temporal evolution of regional water resources supply and demand from the perspective of land consolidation and precipitation changes.
Taking western Jilin as the study area, the InVEST model, ARIES model, and supply-demand ratio index were used to explore the supply and demand status and spatial-temporal evolution of water resources in western Jilin in 2000, 2010, and 2018. The rational allocation of regional water resources can be achieved by identifying the supply and demand relationship of water resources in administrative regions at all levels under different precipitation conditions. This study aims to answer three questions. (1) What changes have occurred in the land use area before and after land consolidation in western Jilin from 2000 to 2018? (2) What is the spatiotemporal distribution and evolution of water production and water supply and demand before and after land consolidation in western Jilin from 2000 to 2018? (3) What impact will different precipitation conditions have on the supply and demand pattern of water resources in western Jilin?
2. Materials and Methods
2.1. Study Area
As shown in Figure 1, western Jilin includes two prefecture-level cities, Baicheng and Songyuan, and ten county-level administrative units (43°59′–46°18′ N, 121°38′–126°11′ E). The elevation of the area ranges from 22 to 672 m, with a total area of 47,793 km2. The area has a semi-arid temperate continental monsoon climate, with an annual average temperature of 4.4 °C and an average annual precipitation (384–521 mm) much lower than the average annual potential evaporation (1110–1279 mm). Western Jilin is located in one of the three concentrated distribution areas of soda-alkali land in the world and has a large number of saline-alkali land resources that meet the conditions for arable land development. To ensure national food security and achieve the goal of increasing grain production, Jilin Province implemented a land consolidation project in 2009, converting the saline-alkali land in the western region into paddy fields gradually, and implemented a series of water conservancy projects to alleviate the difference between local water supply and demand. Since land consolidation, more than 700 km2 of saline-alkali land has been effectively treated. The increasing demand for irrigation water for agricultural land and the climatic characteristic of evaporation being far greater than precipitation make the difference between the supply and the demand of water resources in the study area increasingly prominent.
2.2. Data Sources and Processing
The data of running the water yield module in the InVEST model include land use, annual precipitation, reference evapotranspiration, depth to root-restricting layer, plant available water fraction, watersheds, biophysical table, and Z parameter. Please see the Table 1 for all the data sources. The input data were all projected WGS84 coordinates, and the spatial resolution of the grid data was 30 m. Raster data such as precipitation, evaporation, root depth, and soil available water content are obtained after calculation, spatial interpolation, and resampling. Based on SRTMDEM 90 m resolution data, the ArcSWAT model was used to divide western Jilin into 2 watersheds and 29 sub-watersheds.
2.2.1. Land Use
The land-use data are mainly based on US Landsat-TM/ETM and Landsat 8 satellite remote sensing data, obtained by human-computer interaction technology, visual interpretation, and field verification of random sampling points. Among them, the image of western Jilin was collected from mid-June to late September for cloud-free images. In this paper, we reclassified land-use data into seven types: agricultural land, forest land, grassland, waters, built-up land, wetlands, and saline-alkali soil.
2.2.2. Precipitation and Reference Evapotranspiration
To avoid the low representativeness of the regional climate from the data of a few years in the analysis of precipitation change, we collected the climate data of seven weather stations in western Jilin from 1960 to 2020 and used ArcGIS 10.2 (Environmental Systems Research Institute (ESRI), Redlands, CA, USA) Kriging interpolation and resampling to obtain raster data of annual mean precipitation. Based on the collected climate data, we selected the corrected Hargreaves formula [25] to calculate the reference crop evapotranspiration; that is:
where ET0 is the reference crop evapotranspiration, Tmax and Tmin are the daily maximum and daily minimum air temperatures, respectively, and Ra is the solar radiation value [MJ·(m2·d)−1]. The solar radiation data comes from the WorldClim database (https://www.worldclim.org/ (accessed on 23 May 2022)) [26]. Through the daily reference crop evapotranspiration data, the annual average reference crop evapotranspiration data are obtained and a raster map is generated.
2.2.3. Biophysical Table
The biophysical table mainly reflects the biophysical properties of each land-use type, including LULC desc (land cover), lucode (LULC code), LULC veg (1 for all vegetated classes except wetlands and 0 for all other classes), root depth (maximum root depth for plants in LULC class), and Kc (evapotranspiration coefficient, between 0–1.5). The biophysical coefficients of each land-use type used by the model refer to the InVEST User’s Guide and related research by other scholars [27,28]. More details of this part can be referred to the InVEST User Guide [27]. The biophysical table of this paper is shown in Table 2.
2.2.4. Z Parameter
The parameter Z value is an empirical constant [29] that represents the regional precipitation distribution and other hydrogeological characteristics, and the value ranges from 1 to 30.
In the InVEST water yield model, we adjusted the value z parameter to calibrate the water yield of the region on land cover, annual precipitation, and evapotranspiration data from 2018. When Z = 20.9, the simulated water production data was in good agreement with the actual water production, with an error of 0.6%.
2.3. Method
2.3.1. Water-Yield Model
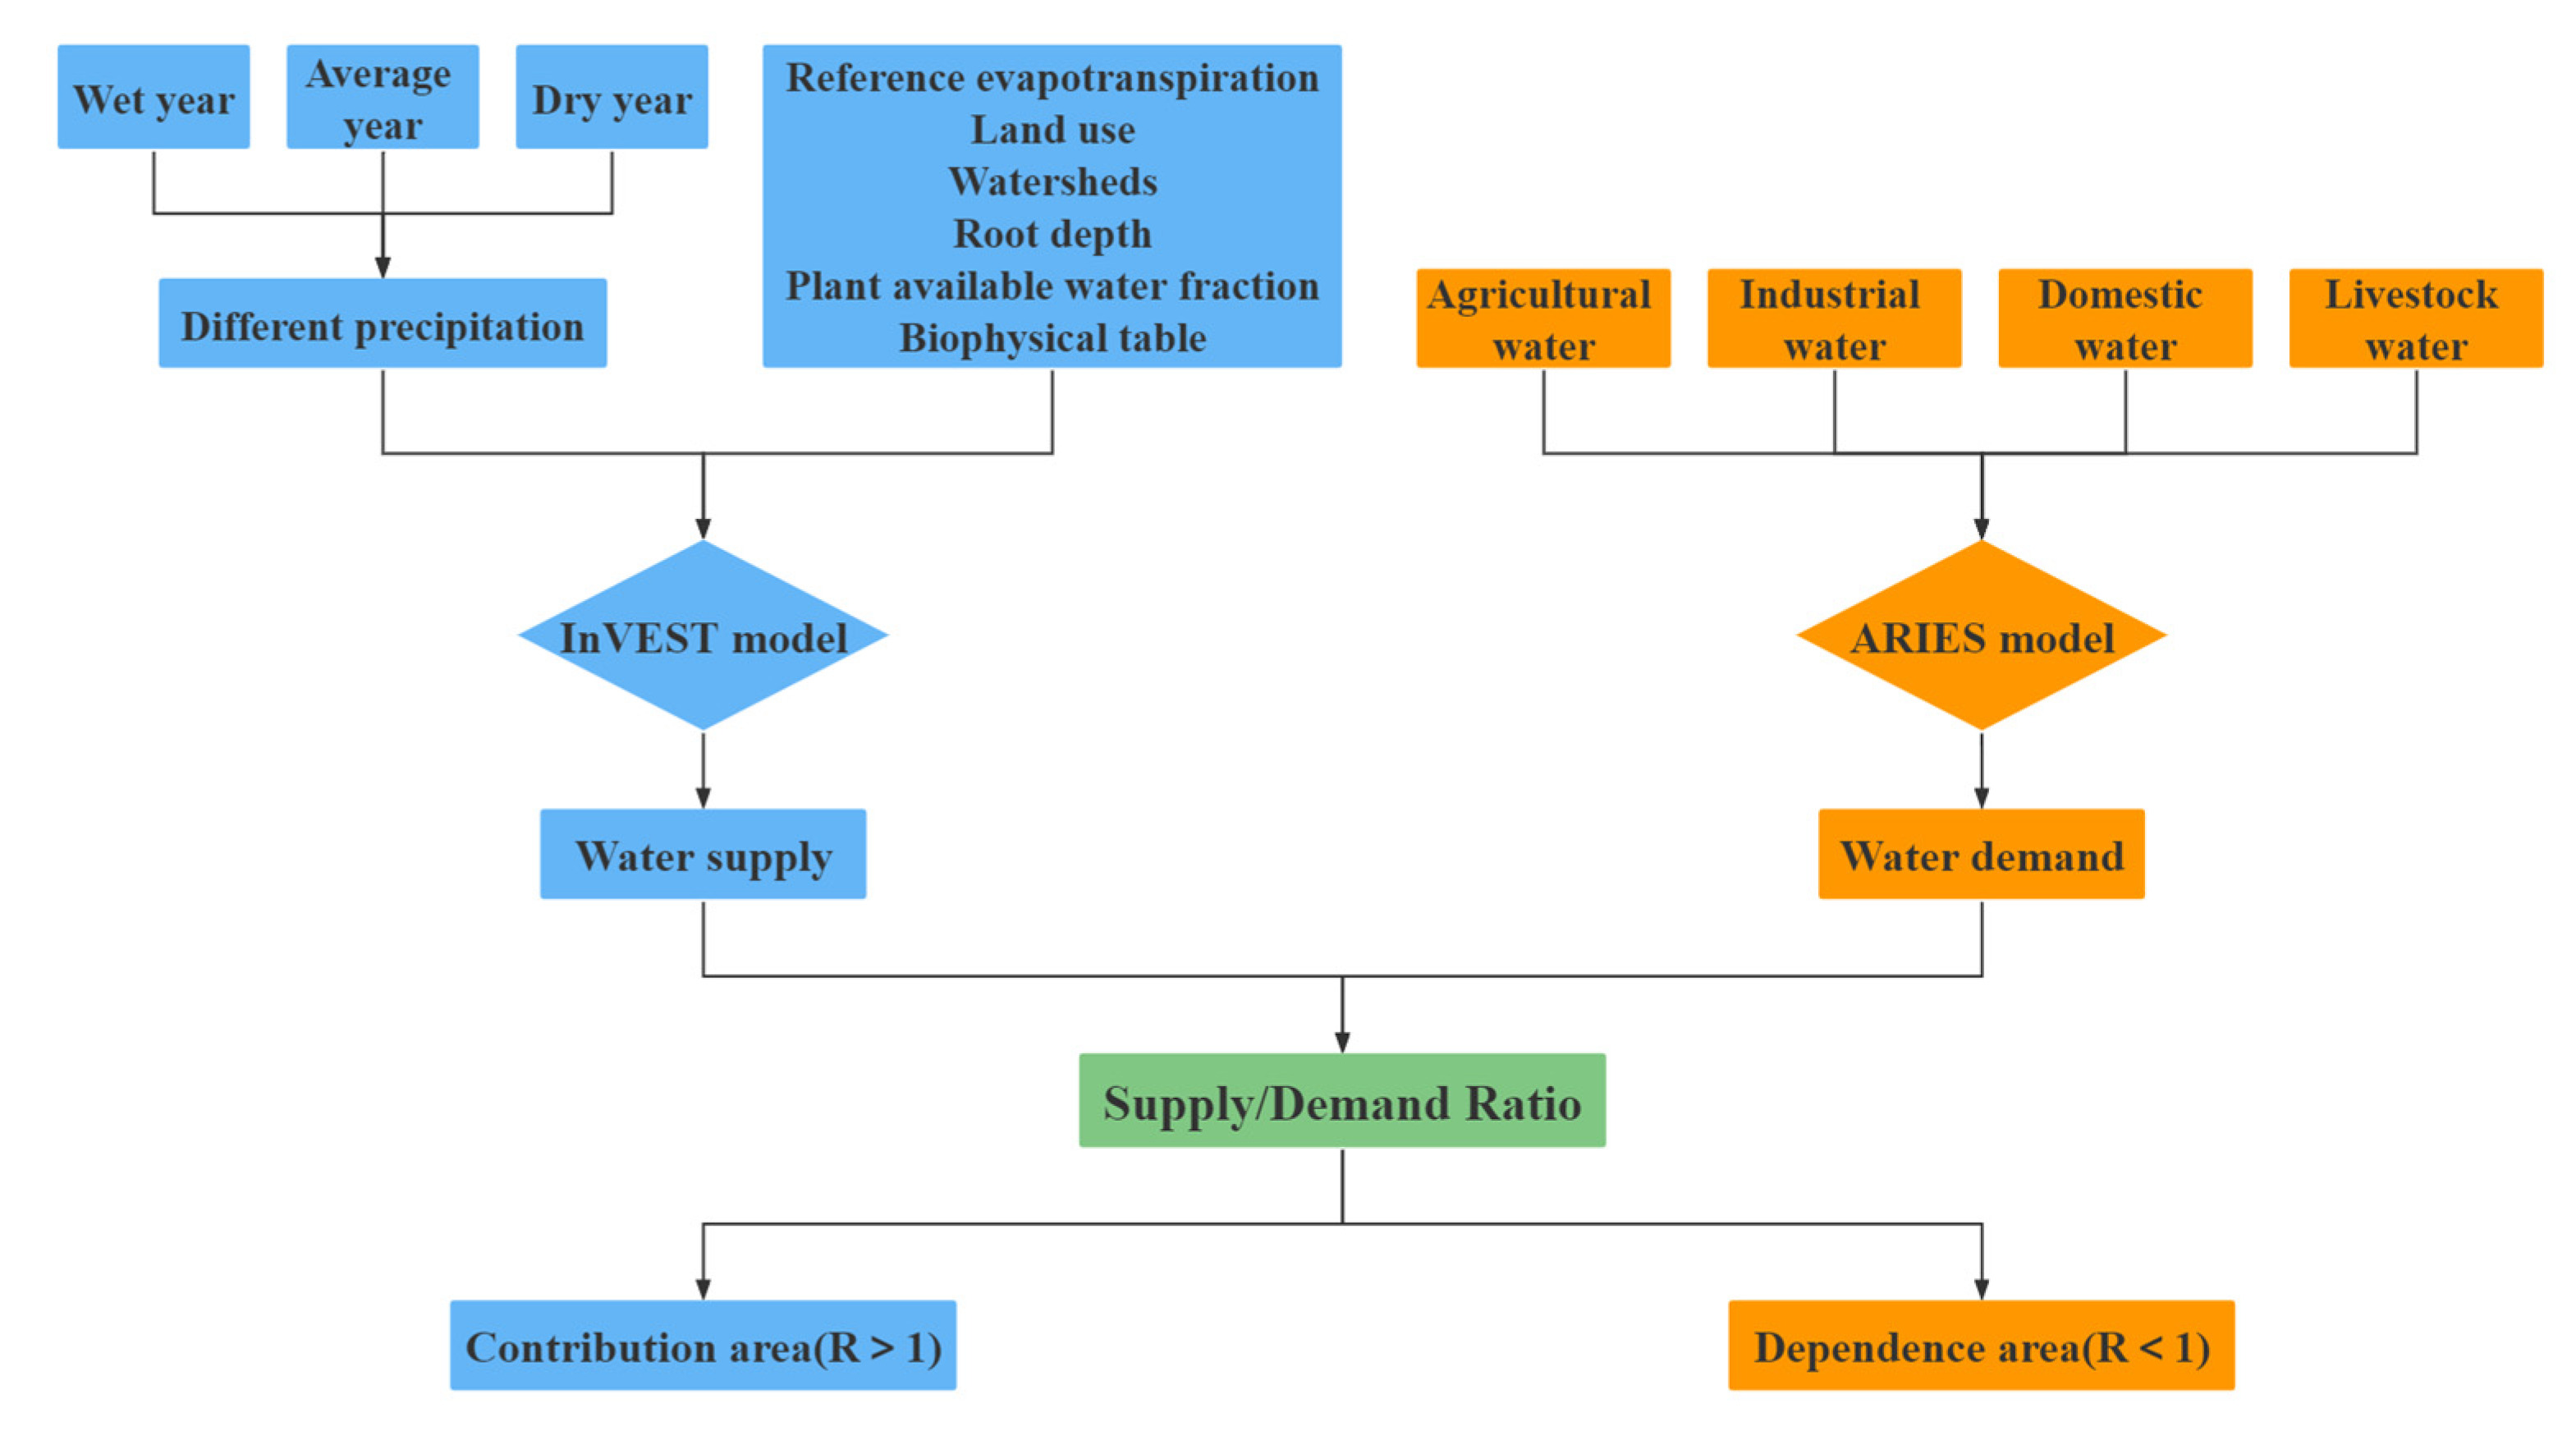
The research selected the water-yield module of the InVEST model to calculate the water supply in western Jilin. This is an estimation method based on the water balance formula; according to the Budyko water-heat coupling balance assumption [30] and the average annual precipitation, the model estimates the annual water yield for each pixel of the study catchment as the average annual precipitation minus the annual actual evapotranspiration (AET) [16], as in Equation (2):
where Y(x) is the water yield for each pixel on the landscape x, AET(x) is the actual annual evapotranspiration, and P(x) is the average annual precipitation for pixel x. AET(x)/P(x) refers to the cover type vegetation evapotranspiration.
where ω refers to the nonphysical parameters of the soil properties and natural climate, which are related to precipitation, soil available water content, and seasonal constants. PET(x) refers to the potential evapotranspiration for pixel x. PET(x) can be calculated as follows:
where Kc is the evapotranspiration coefficient, largely determined by the vegetative characteristics of the land use found on that pixel. More details of the water-yield module can be found in the InVEST User Guide [27].
2.3.2. Water-Demand Model
Combined with the definition and classification of water resources demand by the ARIES model [31], the research divided the water demand in western Jilin into four categories: agricultural water (crop irrigation), industrial water (factory production), domestic water (human daily life), and livestock water (animal husbandry). Then, estimates were made of the water resources demand of 10 counties in western Jilin. Water demand can be calculated as follows:
where Uagrx, Uindx, Uurbx, and Ulivx refer to agricultural water, industrial water, domestic water, and livestock water in county x, respectively. Axj refers to the cultivated area (ha) of the j-type crops in the x county, and Agrxj refers to the annual irrigation water quota per hectare of the j-type crops in the x county (m3/ha). G refers to the total industrial water consumption of Jilin Province in the whole year, and Indx refers to the proportion of the total industrial production value of the x county in the total industrial production value of the province. Px refers to the population in the x county, Dom refers to the average annual domestic water consumption of urban and rural residents in the province (m3·person), Qxj refers to the total number of j-type livestock in the x county, and Livx refers to the livestock breeding water quota in the x county (m3·head). The water quota data for irrigation and livestock come from the local standards of Jilin Province (DB22/T 389-2019), and the data on cultivated area and industrial production value are from the Jilin Provincial Statistical Bulletin, the Jilin Water Resources Bulletin, and Regional Statistical Bulletin.
2.3.3. Supply/Demand Ratio
The ratio of supply to demand is an important indicator in the study of the water supply and demand balance [32]. This paper calculated the supply-demand ratio index from two scales, regional and county, which is:
where R is the index of supply and demand ratio, S is the supply of water resources, and D is the demand of water resources. R = 1 means supply and demand balance, R > 1 means supply is greater than demand, and R < 1 means supply exceeds demand.
If R > 1, the region can export water resources to other regions, and the water resources contribution of this region to other regions can be calculated. The formula is as follows:
where Con is the proportion of water supply from the region to other regions in the total. The higher the Con, the more abundant the water resources in the region.
If R < 1, the region needs other regions to input water resources to meet the local production and living needs. The region’s dependence on other regions’ water resources can be calculated as follows:
where Dep is the region’s dependence on water resources in other regions, and the higher the Dep, the more urgent the region’s demand for external water transfer.
2.3.4. Annual Precipitation Variation
Precipitation is an important factor affecting surface runoff. However, there is uncertainty in precipitation, and the amount of precipitation will have a direct impact on the balance of water supply and demand in the region [33]. Therefore, it is necessary to divide the abundance and dryness of regional annual precipitation.
There are various calculation methods for the division of precipitation wet and dry years, such as the frequency analysis method, anomaly percentage method, and standard deviation method [34]. The study selected the anomaly percentage method to divide the annual precipitation of seven meteorological stations in western Jilin into wet and dry, as in Equation (9):
where ηDP is anomaly percentage, Pi is the precipitation in a certain year, and P is the average annual rainfall data from seven weather stations. According to the “Hydrological Information Forecast Specifications (GB/T 22482-2008)” [35], the classification standards for the types of precipitation are as follows:
wet year: ηDP > 20%; normal year: −20% ≤ ηDP ≤ 20%; dry year: ηDP < −20%.
The relationship between the methods is shown in Figure 2.
3. Results
3.1. Land-Cover Change before and after Land Consolidation
The results of the changes in the land use in western Jilin before and after land consolidation are shown in Table 3. It can be seen from the land-use transfer matrix that cultivated land, saline-alkali land, and grassland have always been the main land-use types in western Jilin. From 2000 to 2010, 467.37 km2 of agricultural land and 512.93 km2 of saline-alkali land were transformed into grassland, and 1004.45 km2 and 537.16 km2 of grassland were transformed into cultivated and saline-alkali land, respectively. There is a high frequency of mutual transformation between grassland, cultivated land, and saline-alkali land. Grassland is the most frequent land-use change in western Jilin. However, among the ecological lands, in addition to the forest area increasing by 7%, the area of water bodies, grasslands, and wetlands decreased by 13%, 11%, and 3%, respectively, compared with 2000. The ecological environment in western Jilin has deteriorated. Among the non-ecological land, the areas of cultivated land, construction land, and saline-alkali land have increased to varying degrees. From 2010 to 2018, 344.83 km2 of saline-alkali land, 258.70 km2 of grassland, and 221.40 km2 of wetland were converted into cultivated land. The area of cultivated land further increased, while the area of saline-alkali land decreased. However, wetlands showed a trend of accelerated degradation, and the wetland area decreased by 19% compared with 2010. In conclusion, the data fully show that before and after land consolidation in western Jilin, the arable land increased and the saline-alkali land decreased, and the local area is gradually fulfilling the goal of increasing grain production. Nevertheless, in the process of land consolidation, not much attention has been paid to ecological issues, and the wetland ecosystem still faces a greater risk of degradation.
3.2. The Balance of Water Supply-and-Demand Change before and after Land Consolidation
3.2.1. Level of Spatial Distribution Characteristics in Region
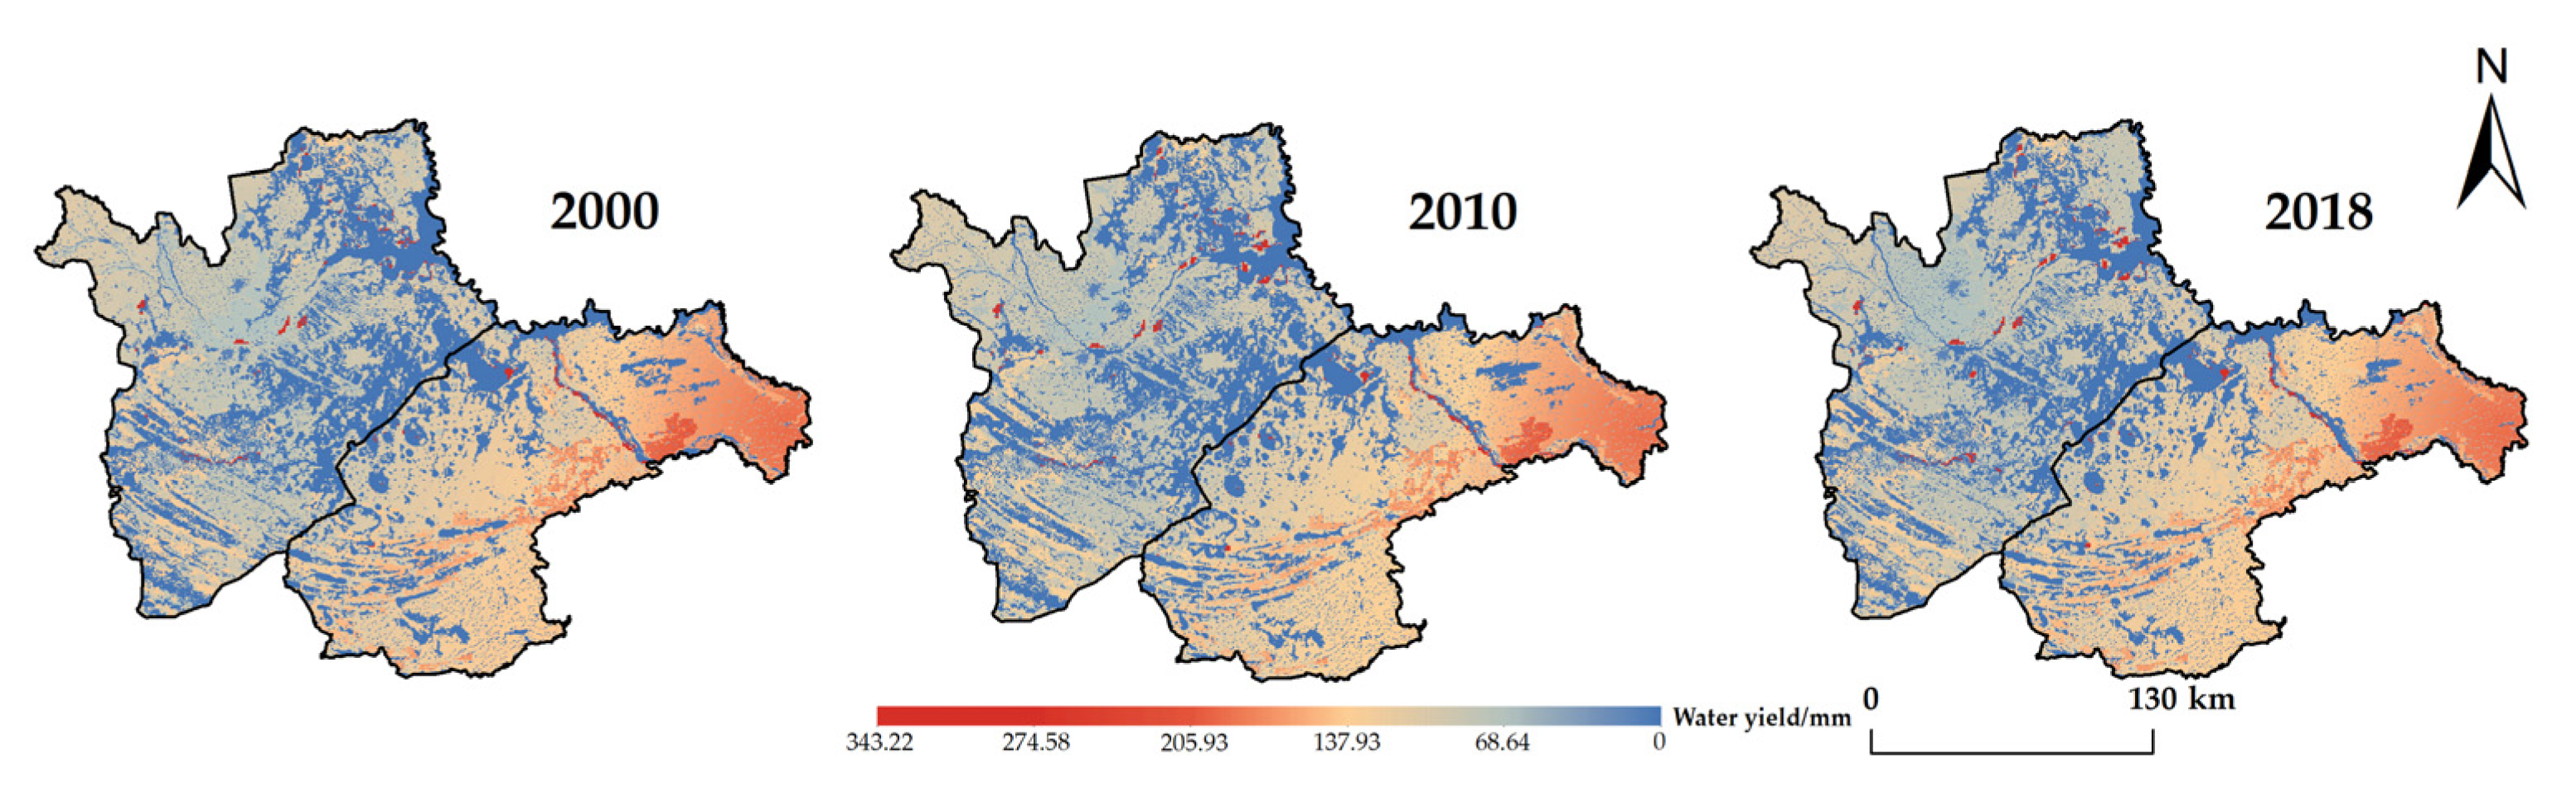
Figure 3 and Table 4 show the results of the spatial distribution of water production and the quantification of water supply and demand before and after land consolidation. Figure 3 shows that the spatial pattern of water supply services has not changed significantly, and water production services show strong spatial heterogeneity. The distribution of precipitation with more to the east and less to the west is related to the natural condition of widespread wetlands in the middle.
As shown in Table 4, the total water production in western Jilin was 3.689, 3.732, and 3.782 billion m3 in 2000, 2010, and 2018, respectively, showing a slow upward trend, while the total water demand in western Jilin was 3.035, 4.028, and 4.959 billion, respectively; the growth rate was much higher than the supply. The specific manifestation of the rapid increase in water demand in western Jilin is the substantial increase in agricultural water use, which rose from 2.436 billion in 2000 to 3.137 billion in 2010 and 4.389 billion in 2018. The proportion of local agricultural water has also increased from 80% in 2000 to 88% in 2018. The rapid increase in agricultural water use has reversed the balance of supply and demand, resulting in the change of supply exceeding demand by 654 million m3 in 2000 to an overall water shortage of 1.17 billion m3 in 2018. External water transfer and groundwater exploitation are urgently needed to meet local production and living needs.
Specifically, the two cities of Baicheng and Songyuan in the west of Jilin have little change in supply. However, there are obvious differences in the demand between the two cities. Compared with 2000, the agricultural water in Baicheng City increased by 57% in 2010 and 118% in 2018, which is higher than the growth rate of 9% and 54%, respectively, in Songyuan City. Compared with Baicheng, there is a certain lag in the increase in agricultural water use in Songyuan City, which is caused by the order in which the land consolidation policy is implemented. There were certain fluctuations in livestock water use and domestic water from 2000 to 2018, but it was not enough to change the overall trend of rapid increase in demand, while industrial water use experienced sharp fluctuations in which a sharp increase was followed by a rapid decrease.
Overall, before and after land consolidation, the water demand in Baicheng City has changed from being substantially less than that in Songyuan City in 2000 to a similar difference in 2018, while the water supply is about 600 million m3 less than that in Songyuan City. The difference between the supply and demand of water resources in Baicheng City is more prominent.
3.2.2. Level of Spatial Distribution Characteristics in Counties
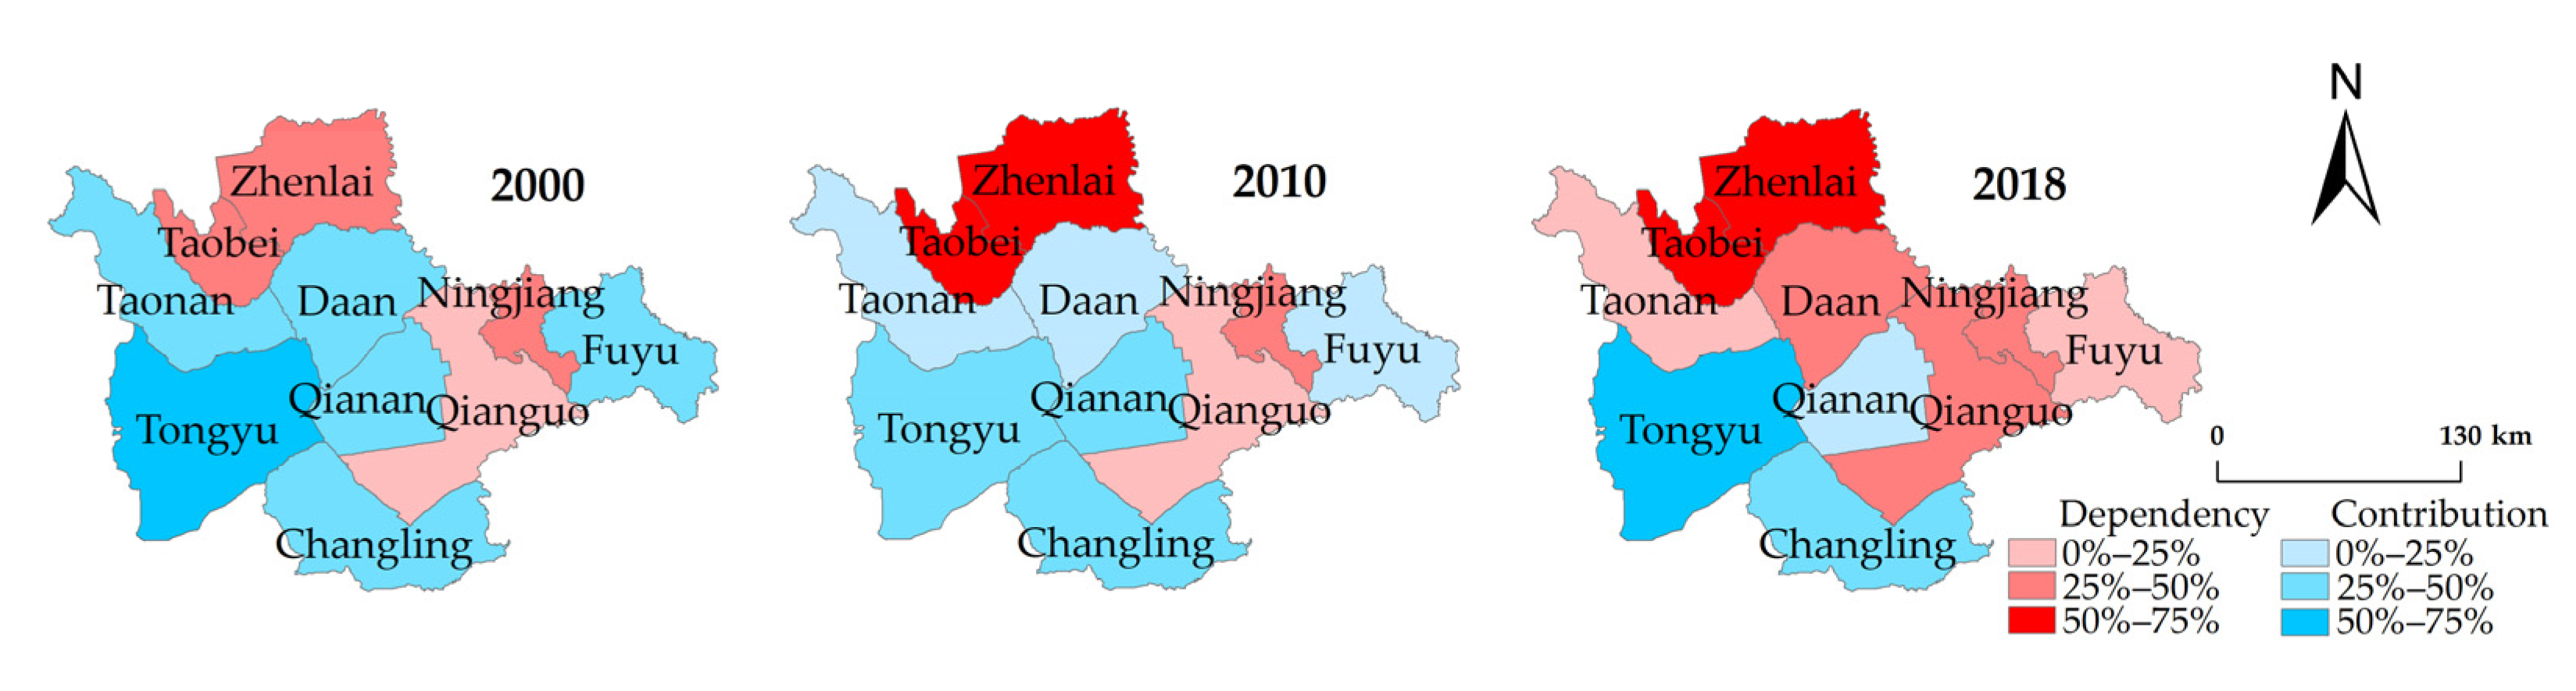
Figure 4 shows the results of the change of the water supply-and-demand ratio at the county scale before and after land consolidation. With the advancement of land consolidation and the increase in agricultural irrigation water, the supply and demand of water resources has changed from an oversupply in most counties in 2000 to a shortage in most counties in 2018.
Among the ten counties in western Jilin, there were six, six, and three counties whose supply exceeded demand in 2000, 2010, and 2018, respectively. Among these three counties, the contribution of Qianan County to other areas’ water resources has declined, from 47.8% in 2000 to 24.6% in 2018. During this period, the agricultural water in Qianan County increased from 113 million m3 to 170 million m3; the increase in agricultural water is an important reason for the decline in the contribution and for it even eventually becoming a dependence. Tongyu’s contribution is the highest in western Jilin, reaching 63.7% in 2018, and can provide more than 300 million m3 of water resources to other regions every year.
While the number of counties with short supply is increasing, the external dependence of water resources is also increasing. Among them, Taobei’s dependence has increased from 46.6% in 2000 to 74.3% in 2018. Taobei’s water production was only 149 million m3 in 2018, but its water demand reached 579 million m3; the water shortage was as high as 430 million m3. With the implementation of the land consolidation policy, the contribution of Taonan, Daan, and Fuyu decreased from 36–49% in 2000 to 11–19% in 2010. Finally, the balance of supply and demand reversed, changing to a 10–27% dependency in 2018, when the water shortage in six counties ranged from 70 million to 610 million m3.
3.3. The Impact of Precipitation Changes on the Balance of Water Supply and Demand
3.3.1. Annual Precipitation Division of Dry and Wet Years
The annual precipitation at seven weather stations in western Jilin from 1960 to 2020 was divided by the anomaly percentage method. The statistical results of the corresponding wet years, dry years, and average annual precipitation are shown in Table 5, and the locations of the weather stations are shown in Figure 1.
The average annual precipitation in western Jilin is 384.67–521.4 mm, the average annual precipitation in a wet year is 482.02–730.02 mm, and the average annual precipitation in a dry year is 244.47–338.61 mm. The inter-annual variation of precipitation is large; the average annual precipitation in dry years is only about 50% of that in wet years. The maximum annual precipitation in Baicheng Station is 717.3 mm, but the minimum annual precipitation is only 152.1 mm, and the inter-annual extreme value ratio is as high as 4.7. At the same time, the inter-annual extreme value ratios of other stations are also 2.66–3.72, which shows that the inter-annual variation of precipitation in western Jilin is relatively large. Through the statistics of the wet and dry years at each station, it is found that 31–51% of the years in western Jilin have been in the state of wet and dry years in the past 60 years, and the precipitation has great uncertainty.
3.3.2. The Balance of Water Supply-and-Demand Change in Regions
Input the mean precipitation data of each station in wet years and dry years into ArcGIS point coordinates, and the Kriging interpolation generates precipitation raster data in wet years and dry years. Combined with the land-use data in 2018, the simulation of different precipitation conditions in 2018 is carried out. The supply-and-demand balance of water resources in western Jilin is shown in Table 6.
From a regional perspective, precipitation is positively correlated with supply, and the more precipitation, the greater the supply. The average precipitation in dry years was 278.76 mm, and the average annual precipitation (421.26 mm) and precipitation in wet years (576.73 mm) increased by 51% and 107%, respectively, compared with those in dry years. The annual water supply in dry years is 1.079 billion m3. Compared with dry years, the annual average annual water supply increases by 250% and 646% in average annual rainfall and wet years, respectively, and the increase in water supply is greater than that in precipitation. In dry years, water resources in western Jilin are in short supply, and 78% of the water needs to be exploited underground and the water transferred across regions. Baicheng City is 84% dependent on external water resources, Songyuan City is 72% dependent on external water resources, and the difference between supply and demand in Baicheng City is even more prominent. In wet years, the water supply in western Jilin is sufficient; 38% of the water in the area can be used to supply other areas, and the supply can be as high as 3.09 billion m3, and the external contribution of water resources in Songyuan City can reach 44%.
3.3.3. The Balance of Water Supply-and-Demand Change in Counties
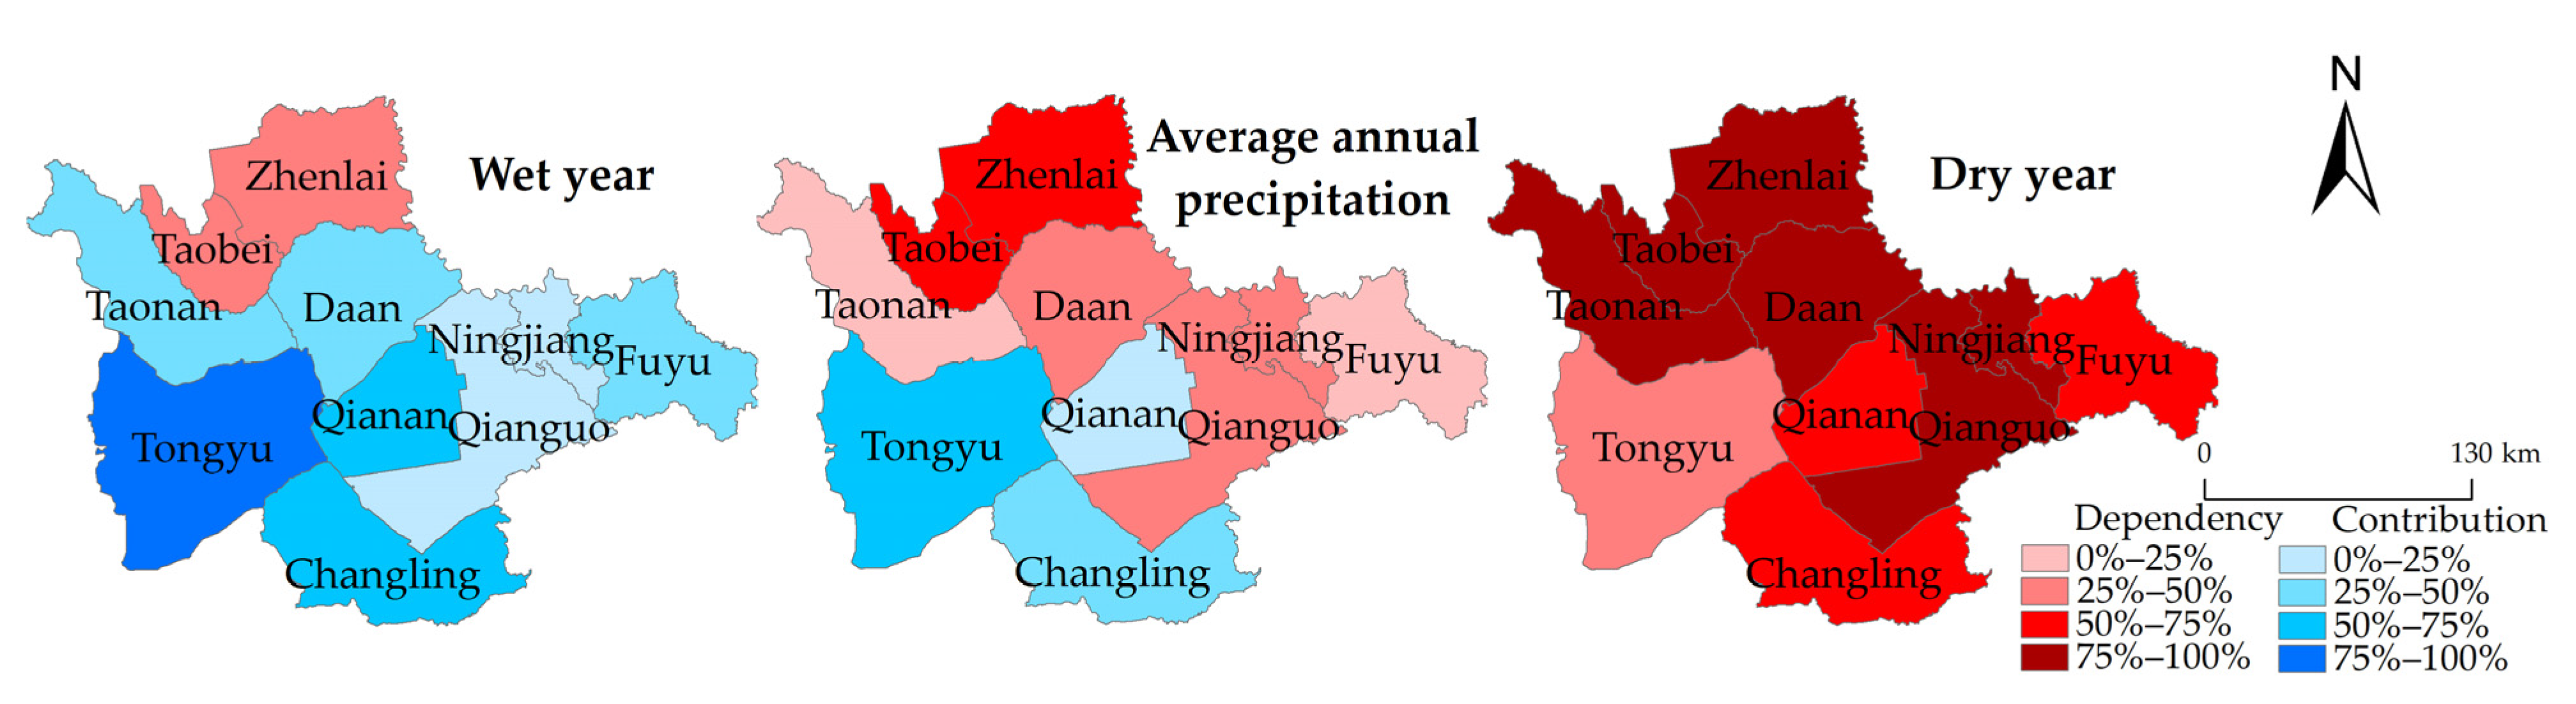
Based on the data in 2018, the impact of precipitation changes on the balance of water supply and demand at the county scale was analyzed (Figure 5).
When the precipitation is in wet years, only Zhenlai and Taobei counties are in short supply of water resources, and their external dependence is 30% and 37%, respectively, which is 38% and 37% lower than the average annual precipitation. The remaining counties can export water resources to other regions. Among them, the supply and demand of water resources in the Ningjiang is relatively balanced, with a contribution of less than 5%, while the contribution of Tongyu is as high as 82%, which can provide 916 million m3 of water resources for other regions. The other six counties can also provide water resources ranging from 200 million m3 to 810 million m3, which means the supply-and-demand conditions are good.
When the precipitation is in dry years, the external dependence of water resources in all counties exceeds 25%, and the external dependence of six counties even exceeds 75%. Among them, Taobei has the highest external dependence, reaching 95%, with a water production of 27 million m3, a water demand of 578 million m3, and a water shortage of 550 million m3. The external dependence of Zhenlai also exceeds 90%. The supply and demand of water resources in Tongyu is relatively good, with an external dependence of 26% and a water shortage of 50 million m3. The water shortage in other counties also ranges from 130–820 million m3. The water situation in western Jilin is extremely severe.
In general, the water supply in most counties exceeds the demand in wet years, and water shortages appear in all counties in dry years. The increase in precipitation can alleviate the difference between the supply and demand of water resources in various counties to a considerable extent, and the impact of changes in precipitation on the supply and demand of water resources in various counties is extremely obvious.
4. Discussion
4.1. Analysis of the Influence of Land Consolidation on Ecology and Water Resources Supply and Demand
In the first section, we explored the impact of land consolidation on the geographic landscape. In the process of land consolidation, along with the gradual reduction in saline-alkali land and the continuous increase of agricultural land, the government’s goal of increasing grain production has been achieved. However, during this period, a large amount of agricultural land encroached on the wetlands, thereby destroying the local ecological environment. The development of agriculture at the expense of natural wetlands is a global and historic phenomenon. In the Everglades of the United States, the Rhine Valley of Europe, and Inner Mongolia of China, agricultural encroachment on wetlands is also occurring and has continued for decades [36,37,38]. Therefore, there is an urgent need to explore a new mode of coexistence of agricultural production and wetland protection in western Jilin. For the water supply service, although the area of ecological land has been decreasing year by year, the water production in the western part of Jilin has not changed significantly. The reason is that the construction land is affected by the impervious surface and has less evapotranspiration, and a large amount of precipitation will directly form runoff—that is, water production. The new water production brought about by the increase in construction land is enough to make up for the loss of water supply caused by the loss of ecological land, especially wetlands, whereas the water demand continued to increase and exceeded the water production in the end. The increase in water demand was mainly caused by the increase in agricultural water use. The substantial increase in water demand was inseparable from the transformation of the internal planting structure of arable land. In the process of land remediation, the planting area of paddy fields has greatly increased, for which water required per unit area of paddy fields is much larger than that of crops such as corn and soybeans [39]. The new water demand caused by the new paddy field exceeds one billion cubic meters, resulting in a continuous decline in regional contribution and a continuous increase in dependence, and a reversal of the supply-and-demand balance in several counties. A similar phenomenon can also be found in the Atrak River basin in Iran, where the unbridled increase in agricultural water demand led to a decrease in reliable supply levels [40]. Fortunately, the increase in water demand in western Jilin is a government-led, controlled increase, but it is still necessary to do a good job of inter-basin water transfer to prevent a series of ecological and environmental problems caused by water shortages, especially the need to balance the relationship between agriculture and wetlands.
4.2. Analysis of the Influence of Precipitation Change on Water Supply and Demand
Precipitation is an important factor affecting water production and the spatial distribution of water resources [20]. Other scholars’ simulations of climate change mainly proceed from two directions. The first is to simulate future climate change with RCP and analyze the possible future precipitation and its impact on water production [41,42]. The second is to select the actual precipitation of a few specific years, input the parameters into the model, and complete the setting of different scenarios [43,44], which method ignores the uncertainty of precipitation. Compared with previous studies, the division of dry and wet years of precipitation is closer to the actual situation of the balance of local water supply and demand and has a more guiding role for the practical application of local water transfer.
The inter-annual variation of precipitation in western Jilin is large [45]; various regions are often in the state of dry and wet years. With the increase in precipitation, water production also increased significantly, and the reason why the increase in water supply was greater than that in precipitation was related to factors such as actual evapotranspiration [46]. When there is little precipitation, most of the precipitation will infiltrate into the ground and evaporate into the atmosphere, and only a small part of the precipitation will form actual runoff. When there is more precipitation, infiltration and evaporation tend to be saturated, and more precipitation will form actual runoff—that is water production [47]. As has been studied by Marquès et al. [48] for the Llobregat River basin in the Mediterranean region, extremely wet years can produce 13 times as much water as dry years. In a similar way for western Jilin during a wet year, it is assumed that water supply will be increased to 8.05 billion m3 while it is expected to decrease to 1.08 billion m3 in a dry year. Precipitation can dramatically alter the local water supply-and-demand balances [49]. If there is a long-term drought or a disorderly increase in agricultural water demand, western Jilin may fall into a dilemma similar to what Saudi Arabia may face: groundwater depletion and unsustainable agricultural production caused by long-term water shortage. Therefore, it is necessary to strengthen inter-basin water transfer and build a series of water conservancy engineering measures to alleviate water shortage in drought years in western Jilin.
4.3. Uncertainty in Water Supply and Demand Assessment
Due to data limitations, model design, and the complexity of some parameters, there are some uncertainties in the assessment of water supply and demand. There is little climate data in western Jilin, so the Penman-Monteith formula with higher precision cannot be used to calculate the reference evapotranspiration. The method chosen in this paper is the improved Hargreaves formula [25,50], which will affect the accuracy of water production simulation to a certain extent. The InVEST model considers that the root depth and Kc of the same type of land are fixed, but in practice, due to changes in climate, soil, vegetation, and other factors, the values of root depth and Kc are not constant, so the model still needs to be further improved [27]. In the estimation of water demand, the irrigation quota per unit area of various crops is formulated by the government based on the average data for many years, and the irrigation amount should change to a certain extent under abnormal precipitation conditions [47]. However, due to the lack of relevant data support, the paper still uses the quota to calculate the water demand in dry and wet years. Despite these uncertainties, the results of this paper can still reveal the impact of land consolidation and precipitation changes on the supply-and-demand pattern of water resources. Furthermore, it provides a scientific reference for ecological environment protection, rational water transfer, and full and efficient use of water resources in the process of land consolidation in western Jilin.
5. Conclusions
In this study, we used the InVEST model, the ARIES model, and the supply-demand ratio index to discuss the land-use transition and the balance of water supply and demand in western Jilin before and after land consolidation. The anomaly percentage method is innovatively used to divide the precipitation, so as to explore the impact of different precipitation conditions on the balance of water supply and demand in western Jilin. We found that land consolidation in western Jilin has achieved initial results, with an increase of 1040.58 km2 of agricultural land and a decrease of 645.54 km2 of saline-alkali land. However, during the project implementation, the local government did not pay enough attention to ecological protection, and the total area of ecological land continued to decline, especially the wetland area, which decreased by 676.18 km2, resulting in further degradation of the wetland ecosystem. Land consolidation in western Jilin still needs to find a balance between agriculture and ecology in the future. Through the research on the balance of water supply and demand, it was found that there was no significant change in water production before and after land consolidation, but the change in planting structure caused a surge in water demand from 3.03 billion to 4.96 billion m3, which in turn reversed the overall regional water supply-and-demand relationship. On the basis of increasing grain production, land consolidation also puts forward higher requirements for water supply. The impact of precipitation changes on water production is extremely significant, and the amount of precipitation can directly change the relationship between the supply and demand of local water resources. In addition, the relationship between water supply and demand also presents spatial heterogeneity, and the supply and demand of water resources in the northwest is very tight under any scenario. Overall, compared with the water supply-and-demand problems faced by Iran, Saudi Arabia, Spain, and other places, the agriculture in western Jilin is being developed in an orderly manner, led by the government, which is undoubtedly very lucky. Through the construction of water conservancy projects and cross-basin water transfer measures, water resources can be effectively utilized, and groundwater depletion and ecological environment damage can be avoided to achieve long-term sustainable development of agriculture.
Author Contributions
Conceptualization, M.Z. and Y.Z.; methodology, M.Z.; software, M.Z.; validation, M.Z.; investigation, M.Z.; resources, Y.Z.; data curation, M.Z.; writing—original draft preparation, M.Z.; writing—review and editing, Y.Z., H.Y., X.W. and L.Y.; funding acquisition, Y.Z. and H.Y. All authors have read and agreed to the published version of the manuscript.
Funding
This research was funded by FAO/GEF (grant number GCP/CPR/048/GEF), the National Natural Science Foundation of China (grant numbers 41971136, 42171107, and 42001112) and the Professional Association of the Alliance of International Science Organizations (grant number ANSO-PA-2020-14).
Data Availability Statement
The date presented in this study are available on request from the corresponding authors.
Conflicts of Interest
The authors declare no conflict of interest.
References
- Daily, G.C. Nature’s Service: Societal Dependence on Natural Ecosystems; Island Press: Washington, DC, USA, 1997. [Google Scholar]
- Costanza, R.; d’Arge, R.; de Groot, R.; Farber, S.; Grasso, M.; Hannon, B.; Limburg, K.; Naeem, S.; O’Neill, R.V.; Paruelo, J.; et al. The value of the world’s ecosystem services and natural capital. Nature 1997, 387, 253–260. [Google Scholar] [CrossRef]
- Daily, G.C.; Polasky, S.; Goldstein, J.; Kareiva, P.M.; Mooney, H.A.; Pejchar, L.; Ricketts, T.H.; Salzman, J.; Shallenberger, R. Ecosystem Services in Decision Making: Time to Deliver. Front. Ecol. Environ. 2009, 7, 21–28. [Google Scholar] [CrossRef] [Green Version]
- Mullin, M. The effects of drinking water service fragmentation on drought-related water security. Science 2020, 368, 274–277. [Google Scholar] [CrossRef]
- Das, R.; Laishram, B.; Jawed, M. Public participation in urban water supply projects—The case of South-West Guwahati, India. Water Res. 2019, 165, 114989. [Google Scholar] [CrossRef] [PubMed]
- Anjinho, P.D.; Barbosa, M.; Mauad, F.F. Evaluation of InVEST’s Water Ecosystem Service Models in a Brazilian Subtropical Basin. Water 2022, 14, 1559. [Google Scholar] [CrossRef]
- Sharps, K.; Masante, D.; Thomas, A.; Jackson, B.; Redhead, J.; May, L.; Prosser, H.; Cosby, B.; Emmett, B.; Jones, L. Comparing strengths and weaknesses of three ecosystem services modelling tools in a diverse UK river catchment. Sci. Total Environ. 2017, 584, 118–130. [Google Scholar] [CrossRef] [PubMed] [Green Version]
- Wang, Q.F.; Qi, J.Y.; Wu, H.; Zeng, Y.; Shui, W.; Zeng, J.Y.; Zhang, X.S. Freeze-Thaw cycle representation alters response of watershed hydrology to future climate change. Catena 2020, 195, 104767. [Google Scholar] [CrossRef]
- Vigerstol, K.L.; Aukema, J.E. A comparison of tools for modeling freshwater ecosystem services. J. Environ. Manag. 2011, 92, 2403–2409. [Google Scholar] [CrossRef]
- Nelson, E.; Mendoza, G.; Regetz, J.; Polasky, S.; Tallis, H.; Cameron, D.R.; Chan, K.M.A.; Daily, G.C.; Goldstein, J.; Kareiva, P.M.; et al. Modeling Multiple Ecosystem Services, Biodiversity Conservation, Commodity Production, and Tradeoffs at Landscape Scales. Front. Ecol. Environ. 2009, 7, 4–11. [Google Scholar] [CrossRef]
- Zuo, S.; Yang, L.; Dou, P.; Ho, H.C.; Dai, S.; Ma, W.; Ren, Y.; Huang, C. The direct and interactive impacts of hydrological factors on bacillary dysentery across different geographical regions in central China. Sci. Total Environ. 2021, 764, 144609. [Google Scholar] [CrossRef]
- Zawadzka, J.E.; Harris, J.A.; Corstanje, R. Assessment of heat mitigation capacity of urban greenspaces with the use of InVEST urban cooling model, verified with day-time land surface temperature data. Landsc. Urban Plan. 2021, 214, 104163. [Google Scholar] [CrossRef]
- Sánchez-Canales, M.; Benito, A.L.; Passuello, A.; Terrado, M.; Ziv, G.; Acuña, V.; Schuhmacher, M.; Elorza, F.J. Sensitivity analysis of ecosystem service valuation in a Mediterranean watershed. Sci. Total Environ. 2012, 440, 140–153. [Google Scholar] [CrossRef] [PubMed]
- Rajbanshi, J.; Das, S. Changes in carbon stocks and its economic valuation under a changing land use pattern-A multitemporal study in Konar catchment, India. Land Degrad. Dev. 2021, 32, 3573–3587. [Google Scholar] [CrossRef]
- Hughes, J.; Petheram, C.; Taylor, A.; Raiber, M.; Davies, P.; Levick, S. Water Balance of a Small Island Experiencing Climate Change. Water 2022, 14, 1771. [Google Scholar] [CrossRef]
- Yang, D.; Liu, W.; Tang, L.; Chen, L.; Li, X.; Xu, X. Estimation of water provision service for monsoon catchments of South China: Applicability of the InVEST model. Landsc. Urban Plan. 2019, 182, 133–143. [Google Scholar] [CrossRef]
- Marquès, M.; Bangash, R.F.; Kumar, V.; Sharp, R.; Schuhmacher, M. The impact of climate change on water provision under a low flow regime: A case study of the ecosystems services in the Francoli river basin. J. Hazard. Mater. 2013, 263, 224–232. [Google Scholar] [CrossRef]
- Wei, P.J.; Chen, S.Y.; Wu, M.H.; Deng, Y.F.; Xu, H.J.; Jia, Y.L.; Liu, F. Using the Invest Model to Assess the Impacts of Climate and Land Use Changes on Water Yield in the Upstream Regions of the Shule River Basin. Water 2021, 13, 1250. [Google Scholar] [CrossRef]
- Wang, Y.; Zhao, J.; Fu, J.; Wei, W. Effects of the Grain for Green Program on the water ecosystem services in an arid area of China—Using the Shiyang River Basin as an example. Ecol. Indic. 2019, 104, 659–668. [Google Scholar] [CrossRef]
- Hu, W.; Li, G.; Gao, Z.; Jia, G.; Wang, Z.; Li, Y. Assessment of the impact of the Poplar Ecological Retreat Project on water conservation in the Dongting Lake wetland region using the InVEST model. Sci. Total Environ. 2020, 733, 139423. [Google Scholar] [CrossRef]
- Janus, J.; Markuszewska, I. Land consolidation—A great need to improve effectiveness. A case study from Poland. Land Use Policy 2017, 65, 143–153. [Google Scholar] [CrossRef]
- Haldrup, N.O. Agreement based land consolidation—In perspective of new modes of governance. Land Use Policy 2015, 46, 163–177. [Google Scholar] [CrossRef]
- Paul, B.; Bhattacharya, S.S.; Gogoi, N. Primacy of ecological engineering tools for combating eutrophication: An ecohydrological assessment pathway. Sci. Total Environ. 2021, 762, 143171. [Google Scholar] [CrossRef]
- Han, X.L.; Lv, P.Y.; Zhao, S.; Sun, Y.; Yan, S.Y.; Wang, M.H.; Han, X.N.; Wang, X.R. The Effect of the Gully Land Consolidation Project on Soil Erosion and Crop Production on a Typical Watershed in the Loess Plateau. Land 2018, 7, 113. [Google Scholar] [CrossRef] [Green Version]
- Hu, Q.; Yang, D.; Wang, Y.; Yang, H. Global calibration of Hargreaves equation and its applicability in China. Adv. Water Sci. 2011, 22, 160–167. [Google Scholar]
- Fick, S.E.; Hijmans, R.J. WorldClim 2: New 1-km spatial resolution climate surfaces for global land areas. Int. J. Climatol. 2017, 37, 4302–4315. [Google Scholar] [CrossRef]
- Sharp, R.; Douglass, J.; Wolny, S.; Arkema, K.; Bernhardt, J.; Bierbower, W.; Chaumont, N.; Denu, D.; Fisher, D.; Glowinski, K.; et al. InVEST 3.11.0 User’s Guide; The Natural Capital Project: Stanford, CA, USA, 2020. [Google Scholar]
- Xiang, H.X.; Wang, Z.M.; Mao, D.H.; Zhang, J.; Xi, Y.B.; Du, B.J.; Zhang, B. What did China’s National Wetland Conservation Program Achieve? Observations of changes in land cover and ecosystem services in the Sanjiang Plain. J. Environ. Manag. 2020, 267, 110623. [Google Scholar]
- Zhang, L.; Dawes, W.R.; Walker, G.R. Response of mean annual evapotranspiration to vegetation changes at catchment scale. Water Resour. Res. 2001, 37, 701–708. [Google Scholar] [CrossRef]
- Donohue, R.J.; Roderick, M.L.; McVicar, T.R. Roots, storms and soil pores: Incorporating key ecohydrological processes into Budyko’s hydrological model. J. Hydrol. 2012, 436, 35–50. [Google Scholar] [CrossRef]
- Ren, M.; Mao, D. Supply and demand analysis and service flow research of water production service in Lianshui River Basin. Ecol. Sci. 2021, 40, 186–195. [Google Scholar]
- Yu, Y.; Zhou, T.Y.; Zhao, R.; Li, Z.L.; Shen, C. A scenario analysis-based optimal management of water resources supply and demand balance: A case study of Chengdu, China. PLoS ONE 2022, 17, e0267920. [Google Scholar] [CrossRef]
- Li, Z.; Li, Y.P.; Shi, X.P.; Li, J.J. The characteristics of wet and dry spells for the diverse climate in China. Glob. Planet. Chang. 2017, 149, 14–19. [Google Scholar] [CrossRef]
- Niu, J.; Wu, Z.; Jia, H. Quantitative Assessment for Impacts of Precipitation Variation and Runoff-Yield Change on Fenhe River Runoff. J. Jilin Univ. Earth Sci. Ed. 2016, 46, 814–823. [Google Scholar]
- GB/T 22482-2008; Standard for Hydrological Information and Hydrological Forecasting. Ministry of Water Resources of the People’s Republic of China: Beijing, China, 2008.
- Li, Z.; Bagan, H.; Yamagata, Y. Analysis of spatiotemporal land cover changes in Inner Mongolia using self-organizing map neural network and grid cells method. Sci. Total Environ. 2018, 636, 1180–1191. [Google Scholar] [CrossRef]
- Richardson, C.J.; King, R.S.; Qian, S.; Vaithiyanathan, P.; Qualls, R.G.; Stow, C.A. Estimating ecological thresholds for phosphorus in the Everglades. Environ. Sci. Technol. 2007, 41, 8084–8091. [Google Scholar] [CrossRef]
- Eerden, M.R.; Lenselink, G.; Zijlstra, M. Long-term changes in wetland area and composition in The Netherlands affecting the carrying capacity for wintering waterbirds. Ardea 2010, 98, 265–282. [Google Scholar] [CrossRef] [Green Version]
- Liu, C.; Jiang, W.L.; Wu, Y.F.; Liu, Y.F.; Liang, L.J. Estimation of regional farmland irrigation water requirements and water balance in Northeast China. Environ. Sci. Pollut. R 2022, 29, 71840–71856. [Google Scholar] [CrossRef]
- Fadaeizadeh, K.; Shourian, M. Determination of the Optimal River Basin-Wide Agricultural Water Demand Quantities Meeting Satisfactory Reliability Levels. Water Resour. Manag. 2019, 33, 2665–2676. [Google Scholar] [CrossRef]
- Shirmohammadi, B.; Malekian, A.; Salajegheh, A.; Taheri, B.; Azarnivand, H.; Malek, Z.; Verburg, P.H. Impacts of future climate and land use change on water yield in a semiarid basin in Iran. Land Degrad. Dev. 2020, 31, 1252–1264. [Google Scholar] [CrossRef]
- Yang, D.; Liu, W.; Xu, C.H.; Tao, L.Z.; Xu, X.L. Integrating the InVEST and SDSM Model for Estimating Water Provision Services in Response to Future Climate Change in Monsoon Basins of South China. Water 2020, 12, 3199. [Google Scholar] [CrossRef]
- Lang, Y.; Song, W.; Zhang, Y. Responses of the water-yield ecosystem service to climate and land use change in Sancha River Basin, China. Phys. Chem. Earth 2017, 101, 102–111. [Google Scholar] [CrossRef]
- Peng, L.C.; Lin, Y.P.; Chen, G.W.; Lien, W.Y. Climate Change Impact on Spatiotemporal Hotspots of Hydrologic Ecosystem Services: A Case Study of Chinan Catchment, Taiwan. Water 2019, 11, 867. [Google Scholar] [CrossRef] [Green Version]
- Knapp, A.K.; Hoover, D.L.; Wilcox, K.R.; Avolio, M.L.; Koerner, S.; La Pierre, K.J.; Loik, M.E.; Luo, Y.; Sala, O.E.; Smith, M.D. Characterizing differences in precipitation regimes of extreme wet and dry years: Implications for climate change experiments. Global. Chang. Biol. 2015, 21, 2624–2633. [Google Scholar] [CrossRef] [PubMed] [Green Version]
- Lopez-Moreno, J.I.; Vicente-Serrano, S.M.; Moran-Tejeda, E.; Zabalza, J.; Lorenzo-Lacruz, J.; Garcia-Ruiz, J.M. Impact of climate evolution and land use changes on water yield in the ebro basin. Hydrol. Earth Syst. Sci. 2011, 15, 311–322. [Google Scholar] [CrossRef] [Green Version]
- Zhao, H.; Wu, D.; Liu, Y.; Xu, R. Multi-factor Analysis of the Effective Precipitation for Crops in Semi-arid Region. J. Irrig. Drain. 2019, 38, 101–109. [Google Scholar]
- Terrado, M.; Acuna, V.; Ennaanay, D.; Tallis, H.; Sabater, S. Impact of climate extremes on hydrological ecosystem services in a heavily humanized Mediterranean basin. Ecol. Indic. 2014, 37, 199–209. [Google Scholar] [CrossRef]
- Sterling, S.M.; Ducharne, A.; Polcher, J. The impact of global land-cover change on the terrestrial water cycle. Nat. Clim. Chang. 2013, 3, 385–390. [Google Scholar] [CrossRef]
- Hargreaves, G.H.; Allen, R.G. History and evaluation of Hargreaves evapotranspiration equation. J. Irrig. Drain. Eng. 2003, 129, 53–63. [Google Scholar] [CrossRef]
Figure 1.
Location of the western Jilin.

Figure 2.
Supply-and-demand relationship of water resources in western Jilin.

Figure 3.
Spatial variation map of water yield in western Jilin.

Figure 4.
Spatial variation map of the supply/demand ratio of water resources in western Jilin at the county scale.
Figure 4.
Spatial variation map of the supply/demand ratio of water resources in western Jilin at the county scale.

Figure 5.
Spatial variation map of the water supply-and-demand balance in western Jilin counties in different precipitation years.
Figure 5.
Spatial variation map of the water supply-and-demand balance in western Jilin counties in different precipitation years.


Table 1.
The input data sources for water yield model.
| Data | Data Formats | Sources and Descriptions |
|---|---|---|
| Land use/cover | Grids, 30 m × 30 m resolution | The land-use data for west Jilin province in 2000, 2010, and 2018, which were downloaded from the Data Center for Resources and Environment Sciences, Chinese Academy of Sciences (http://www.resdc.cn (accessed on 28 June 2022)). |
| Climate data | Grids, 30 m × 30 m resolution | The climate data include daily precipitation and temperature, which were collected from the China Meteorological Science Data Center (http://data.cma.cn (accessed on 3 March 2022)). |
| Soil properties | Grids, 1 km × 1 km resolution | The soil properties data include soil available water content and root depth, which were downloaded from the National Tibetan Plateau Data Center (http://data.tpdc.ac.cn (accessed on 10 July 2022)). |
| Digital elevation model | Grids, 90 m × 90 m resolution | The SRTM data are provided by the Geospatial Data Cloud site, Computer Network Information Center, and Chinese Academy of Sciences (http://www.gscloud.cn (accessed on 6 July 2022)). |
Table 2.
Biophysical table.
| LULC Desc | Lucode | Kc | Root Depth (mm) | LULC Veg |
|---|---|---|---|---|
| Agricultural land | 1 | 0.7 | 600 | 1 |
| Forest | 2 | 1 | 5000 | 1 |
| Grassland | 3 | 0.65 | 2000 | 1 |
| Waters | 4 | 1 | 1000 | 0 |
| Built-up land | 5 | 0.3 | 100 | 0 |
| Wetlands | 6 | 1.2 | 3000 | 0 |
| Saline-alkali soil | 7 | 0.5 | 100 | 0 |
Table 3.
Land-use transition matrix of western Jilin from 2000 to 2018 (km2).
| Period | Land-Use Type | I | II | III | IV | V | VI | VII | Total (2000) |
|---|---|---|---|---|---|---|---|---|---|
| 2000–2010 | I | 23,055.37 | 429.00 | 467.37 | 37.84 | 264.16 | 264.19 | 209.24 | 24,727.17 |
| II | 323.95 | 1974.77 | 107.62 | 6.54 | 15.31 | 30.62 | 40.77 | 2499.58 | |
| III | 1004.45 | 138.26 | 3241.25 | 10.92 | 27.96 | 537.16 | 154.71 | 5114.71 | |
| IV | 45.32 | 15.36 | 42.16 | 1323.26 | 12.59 | 138.22 | 219.51 | 1796.42 | |
| V | 206.65 | 11.82 | 14.26 | 1.04 | 1342.15 | 18.85 | 3.24 | 1598.01 | |
| VI | 366.47 | 24.21 | 512.93 | 83.74 | 58.05 | 6874.96 | 97.23 | 8017.59 | |
| VII | 269.98 | 94.29 | 149.81 | 97.83 | 6.27 | 193.45 | 2323.52 | 3135.15 | |
| Total (2010) | 25,272.19 | 2687.71 | 4535.4 | 1561.17 | 1726.49 | 8057.45 | 3048.22 | ||
| 2010–2018 | I | 24,608.53 | 366.08 | 78.82 | 11.80 | 118.51 | 55.44 | 32.35 | |
| II | 260.35 | 2380.74 | 8.35 | 16.09 | 4.26 | 5.02 | 12.68 | ||
| III | 258.70 | 15.55 | 4115.32 | 33.09 | 19.33 | 64.07 | 29.08 | ||
| IV | 32.60 | 1.18 | 14.36 | 1405.42 | 1.31 | 24.80 | 81.34 | ||
| V | 41.34 | 3.42 | 2.64 | 11.92 | 1662.05 | 4.49 | 0.63 | ||
| VI | 344.83 | 4.87 | 307.58 | 93.11 | 65.16 | 7191.26 | 50.57 | ||
| VII | 221.40 | 1.67 | 166.17 | 375.12 | 4.17 | 26.97 | 2252.32 | ||
| Total (2020) | 25,767.75 | 2773.51 | 4693.24 | 1946.55 | 1874.79 | 7372.05 | 2458.97 |
Notes: I. agricultural land; II. forest land; III. grassland; IV. waters; V. built-up land; VI. saline-alkali soil; VII. wetlands.
Table 4.
Quantification of water supply and demand in western Jilin (108 m3).
| Year | Area | Agricultural Water | Livestock Water | Industrial Water | Domestic Water | Total Demand | Total Supply |
|---|---|---|---|---|---|---|---|
| 2000 | Baicheng | 9.93 | 0.92 | 0.55 | 0.85 | 12.25 | 15.25 |
| Songyuan | 14.43 | 1.05 | 1.45 | 1.16 | 18.10 | 21.64 | |
| Western Jilin | 24.36 | 1.97 | 2.00 | 2.02 | 30.35 | 36.89 | |
| 2010 | Baicheng | 15.58 | 0.57 | 1.17 | 0.91 | 18.23 | 15.39 |
| Songyuan | 15.79 | 1.65 | 3.30 | 1.31 | 22.05 | 21.93 | |
| Western Jilin | 31.37 | 2.22 | 4.47 | 2.22 | 40.28 | 37.32 | |
| 2018 | Baicheng | 21.69 | 1.10 | 0.52 | 0.81 | 24.12 | 15.72 |
| Songyuan | 22.20 | 1.07 | 1.02 | 1.18 | 25.47 | 22.10 | |
| Western Jilin | 43.89 | 2.16 | 1.54 | 1.99 | 49.59 | 37.82 |
Table 5.
Wet-dry division of annual precipitation of seven weather station in western Jilin.
| Precipitation | Conditions | Baicheng | Daan | Qianan | Qianguo | Tongyu | Changling | Fuyu |
|---|---|---|---|---|---|---|---|---|
| Wet | Max | 717.3 | 743.0 | 772.0 | 646.5 | 580.2 | 716.2 | 860.5 |
| Mean | 545.7 | 569.6 | 575.1 | 585.6 | 512.8 | 614.1 | 730.0 | |
| Average | 394.2 | 417.4 | 421.6 | 439.5 | 384.6 | 439.5 | 521.4 | |
| Dry | Max | 244.4 | 287.5 | 282.9 | 299.7 | 257.5 | 299.9 | 338.6 |
| Mean | 152.1 | 241.1 | 220.3 | 243.2 | 194.4 | 258.9 | 231.4 |
Table 6.
Water supply-and-demand quantification table in different precipitations in western Jilin (108 m3).
Table 6.
Water supply-and-demand quantification table in different precipitations in western Jilin (108 m3).
| Precipitation Conditions | Baicheng | Songyuan | Western Jilin | |||
|---|---|---|---|---|---|---|
| Supply | Demand | Supply | Demand | Supply | Demand | |
| Wet year | 34.46 | 24.12 | 46.03 | 25.47 | 80.49 | 49.59 |
| Average year | 15.72 | 24.12 | 22.10 | 25.47 | 37.82 | 49.59 |
| Dry year | 3.83 | 24.12 | 6.96 | 25.47 | 10.79 | 49.59 |
Publisher’s Note: MDPI stays neutral with regard to jurisdictional claims in published maps and institutional affiliations. |
© 2022 by the authors. Licensee MDPI, Basel, Switzerland. This article is an open access article distributed under the terms and conditions of the Creative Commons Attribution (CC BY) license (https://creativecommons.org/licenses/by/4.0/).
Share and Cite
MDPI and ACS Style
Zhu, M.; Yu, H.; Yang, L.; Wang, X.; Zou, Y. Effects of Land Consolidation and Precipitation Changes on the Balance of Water Supply and Demand in Western Jilin. Water 2022, 14, 3206. https://doi.org/10.3390/w14203206
AMA Style
Zhu M, Yu H, Yang L, Wang X, Zou Y. Effects of Land Consolidation and Precipitation Changes on the Balance of Water Supply and Demand in Western Jilin. Water. 2022; 14(20):3206. https://doi.org/10.3390/w14203206
Chicago/Turabian StyleZhu, Mingbo, Han Yu, Liang Yang, Xiaohai Wang, and Yuanchun Zou. 2022. "Effects of Land Consolidation and Precipitation Changes on the Balance of Water Supply and Demand in Western Jilin" Water 14, no. 20: 3206. https://doi.org/10.3390/w14203206
Note that from the first issue of 2016, this journal uses article numbers instead of page numbers. See further details here.