
Low-Cost Adsorbents for the Removal of Phenol/Phenolics, Pesticides, and Dyes from Wastewater Systems: A Review

Faculty of Health and Life Sciences, INTI International University, Putra Nilai 71800, Nilai, Negeri Sembilan, Malaysia
Water 2022, 14(20), 3203; https://doi.org/10.3390/w14203203
Submission received: 5 September 2022
/
Revised: 19 September 2022
/
Accepted: 29 September 2022
/
Published: 12 October 2022
(This article belongs to the Special Issue Solid/Liquid Adsorption in Water and Wastewater Treatment)
Abstract
:The huge development of industrial production and human activities throughout the world has resulted in serious water pollution. Pesticides, dyes, phenol, and phenolic compounds may be life-threatening to humans and marine aquatic animals, even at low concentrations. These pollutants must be removed by using different techniques to provide high-quality water. So far, the adsorption process has been considered an effective method to remove pollutants from an aqueous solution. The adsorption method has several advantages, such as low cost, easy operation, and high performance. This article reviewed the removal of dye, pesticides, phenol, and phenolic compounds through zeolite, activated carbon, clay, ash fly, and carbon nanotubes by reviewing the existing literature from 2000 to 2022. The properties of the adsorbent, adsorption studies, the method of design, and optimization conditions were reported. The thermodynamic studies were conducted to determine Gibbs free energy change, standard entropy change, and standard enthalpy change. Adsorption isotherms (Langmuir, Freundlich, and Temkim models) revealed the relationship between the amount of adsorbates per unit adsorbent in the equilibrium process. The adsorption kinetic investigations (pseudo-first-order and pseudo-second-order kinetic model) were carried out to determine the rate of adsorption and correlate the experimental data. Experimental results indicated that a higher adsorption capacity can be observed when the adsorbents have a high surface area and high-porosity structure. The removal percentage of pollutants increased when the adsorbent dosage was increased due to the availability of a larger number of adsorption sites. In conclusion, cheaper adsorbents can be used in wastewater treatment to improve water quality and protect the environment.
1. Introduction
The rapid development of industrial production throughout the globe has been followed by increasing wastewater. The discharge of wastewater (e.g., brine) degrades water quality [1], and thus water cannot be directly used for potable water (via desalination) and industrial applications [2,3]. Wastewater containing pesticides, dyes, phenol, and phenolic compounds may be life-threatening to humans and marine aquatic species, even at low concentrations. Phenols are employed in the manufacture of nylon, resins, and fibers. It is classified as highly toxic due to being carcinogenic in nature [4] and very difficult to degrade through biological methods. Pesticides (including herbicides, insecticides, and fungicides) are used to control pests and cultivate plants [5]. However, they can cause acute and chronic effects on humans and animals. Dyes, described as a colored substance [6], are utilized to impart color in several industries (paper, ink, leather, textiles). Highly colored wastewater should be treated prior to discharge in order to comply with environmental-protection laws. In recent years, numerous techniques [7] have been reported by different researchers from around the globe to remove these pollutants. The advantages of these methods were highlighted such as ozonation (no sludge production), oxidative process (simplicity of application), fenton reagents (high efficiency of water soluble, non-water soluble pollutants), photo chemical degradation (no sludge production), adsorption (high efficiency for removal of different types of dyes and metal ions), ionic exchange (regeneration-no adsorbent loss), electro kinetic coagulation (low cost), irradiation (effective oxidation at lab scale), biological process (ecological feasible) and coagulation/flocculation (low cost). However, some of these techniques have major issues. For example: high sludge production (electro kinetic coagulation), low adsorption capacity (ionic exchange), high costs (irradiation), very slow process (biological process) and Heavy chemical consumption (coagulation/flocculation). The adsorption process (so-called surface phenomenon) has some advantages [8], such as simple design, lower capital cost, and lower operating cost. Recently, researchers have been looking for low-cost adsorbents that can be produced by using agricultural wastes, industrial wastes, and natural materials. The selection of adsorbent mainly depends on factors [9] such as low-cost production, adsorption capacity, re-generability properties, high surface area, and high pore volumes. During the adsorption process, the solute will be deposited onto the adsorbent’s surface due to the forces of attraction [10]. Eventually, it can form a monolayer [8] or multilayer (Figure 1) based on the experimental results. Researchers observed that the adsorption process was spontaneous, a low temperature is favorable, and the concentration of substance will be increased (on the adsorbent surface) over longer timeframes. The adsorption process can be classified into two groups (Figure 2), namely, physical adsorption and chemical adsorption [11]. We can distinguish these processes based on Table 1.
The adsorption capacity at equilibrium (qe, mmol/g) can be determined based on the following equation (Equation (1)).
where V, M, Co, and Ce represent the volume (L), mass of adsorbent (g), initial adsorbate concentration (mmol/L), and equilibrium adsorbate concentration (mmol/L). The Langmuir model and Freundlich model can be used to describe the adsorption data. The adsorption isotherm explains the amount of solute adsorbed on the surface of the adsorbent under constant temperature. The monolayer adsorption capacity and heterogeneous surface adsorption process can be represented by using the Langmuir isotherm (Equation (2)) and Freundlich model (Equation (3)), respectively.
represent the equilibrium adsorbate concentration (mmol/L), theoretic maximum adsorption capacity (mmol/g), and constant value (L/mmol), respectively.
where represent the equilibrium adsorbate concentration (mmol/L), constant value (mmol/g), and constant value, respectively.
In this work, the removal of dyes, pesticides, phenols, and phenolic compounds from wastewater by using various adsorbents is reported. The properties of the prepared adsorbent and the adsorption capacity of the adsorbate are highlighted based on the literature survey.
2. Types of Adsorbents
There are two types of adsorbents, namely, natural and synthetic adsorbents [12]. Several examples of natural adsorbents include clay and zeolite (abundant and cheap). On the other hand, researchers can produce synthetic adsorbents (activated carbon) via agricultural waste, industrial waste, and household waste. Each of these adsorbents has a unique surface area [13] and porosity structure that enhance the adsorption capacities.
Chitosan can be prepared from chitin (aminopolysaccharide polymer). Chitin occurs in nature (skeletons of crab, shrimp, and lobster), as indicated in Figure 3, contributing to the second most abundant polysaccharide. Chitosan is a non-toxic biopolymer [14], biodegradable, and biocompatible. Chitosan consists of β-(1–4)-D-glucosamine [15], which can be considered a partially deacetylated product of chitin (Figure 4). Chitosan contains nitrogen, in contrast to other polysaccharides, and the hydroxyl group in cellulose is replaced by an amino group at carbon-2 in chitosan (Figure 5) in terms of structure. It has been noted that flake chitosan is a non-porous material with a lower surface area (less than 10 m2/g). Therefore, physical and chemical modifications are required to enhance the surface area and improve the adsorption capacity. Chitosan has been used to remove pollutants due to several advantages [16], such as chemical stability, being the cheapest adsorbent, excellent reactivity (due to hydroxyl and amino groups), and selectivity. The world chitosan market size was USD 1.7 billion in 2019 and is expected to reach USD 4.7 billion in 2027 due to a rapid growth in waste (seafood industry) and full support from the government [17]. Nowadays, the top global chitosan manufacturers include Primex (Siglufjordur, Iceland), AgraTech (New Jersey, United States), Advanced Biopolymers (Haugesund, Norway), NovaMatrix (Sandvika, Norway) and Dainichiseika Color & Chemicals Mfg. Co., Ltd. (Tokyo, Japan), Bioline (Chonburi, Thailand).
Fly ash is considered a waste residue from the coal-combustion process and results in water, air, and soil pollution if not treated well [18]. It is deposited in different ways, such as in dry landfills and ash ponds [19]. Fly ash is considered a natural adsorbent and shows unique properties, such as very high carbon content, excellent adsorptive capacity (hydrophilic surface), highly porous structure with a large surface area [20], and large pore volume. In addition, it is composed of SiO2 (93%) and Al2O3 (90.79%) with small amounts of Fe2O3, TiO2, CaO, P2O5, MgO, Na2O, BaO, K2O, SrO, MnO, Cr2O3, and NiO. Some researchers have concluded that fly ash is readily available and cheaper compared to activated carbon. Activated carbon is costly and has high production costs. Experimental results showed that chemically modified fly ash successfully improved the surface area and pore volume, with low energy consumption and better adsorption capacity. For example, the surface area and total pore volume were found to be 4.975 and 45.716 m2/g and 0.0137 and 0.157 cm3/g in raw fly ash and acid-treated (hydrochloric acid) fly ash, respectively [21]. A variety of factors, such as combustion conditions, the type of coal, collector setup, and air–fuel ratio, may have an effect on the properties of fly ash. Experimental findings showed that the average size and bulk density were 20 µm and 0.54–0.86 g/cm3, respectively. Morphology analysis revealed that 70–90% of the particles were solid glassy spheres, while the balance consisted of magnetite, hematite, mullite, quartz, and a small part of unburned carbon. Sanjuan and co-workers [22] studied the morphology of coal fly ash obtained from a coal-fired power station (Spain). Figure 6 indicates the SEM image and particle size distribution of the samples. The scanning electron microscopy (SEM) image showed that the coal fly ash contained many fine particles that were spherically shaped and had a predominantly amorphous structure. Fly ash is fine powder that is a by-product of burning coal in power plant. Most of the fly ash is mainly spherical, produced in high temperature conditions. Particle sizes were in the range of 0.3 µm to 250 µm. The major fraction was observed in the range of 20 µm to 25 µm.
Carbon nanotubes were identified as carbon-based materials [23] and successfully discovered by Sumio Iijima in the 1990s. They can be divided into single-walled (single graphite sheet) carbon nanotubes and multi-walled (multiple concentric) carbon nanotubes [24] based on the number of layers (Figure 7). There are several methods (laser deposition, chemical vapor deposition, and arc discharge method) that can be used to produce carbon nanotubes from different sources (xylene, methane, acetylene, benzene, and carbon monoxide ethylene). Chemical vapor deposition has several advantages (low temperature, economical, and potential for mass production) compared to the arc discharge method (which requires high temperatures such as 900–1200 °C). Danikiewicz and co-workers [25] have produced a multi-walled carbon nanotube using the chemical vapor deposition technique. A high-resolution transmission electron microscopy (HRTEM) image confirmed homogeneity morphology with a diameter of 10 nm. A Raman spectrum showed that three peaks appeared at 1345 cm−1 (structure disorder (D)), 1576 cm−1 (nanotube graphitization (G)), and 2685 cm−1 (stresses (2D)). Several researchers found that carbon nanotubes were more attractive than activated carbon and clay because of their high selectivity and favorable physico-chemical stability [26]. Other unique properties, such as excellent electric properties, large specific surface area (Table 2), good superior thermal conductivity (2000–6000 W/(m.K)), high elastic modulus (1000–3000 GPa), and high tensile strength (50–100 GPa) were also highlighted. In 2017, the world carbon nanotube market was USD 15.3 billion and is expected to achieve USD 103.2 billion in 2030 [27]. Currently, major global carbon nanotube producers are Arkema SA (multi-walled CNT), Nanocyl SA (multi-walled CNT), Nanoshell LLC (multi-walled CNT), Carbon Solutions Inc. (single-walled CNT), Hyperion Catalysis International (multi-walled CNT), SHOWA DENKO KK (CNT), and Klean Commodities (single-walled CNT).
Activated carbon can be synthesized from any carbonaceous materials (agricultural waste, different parts of the plants, biomass) containing high amounts of carbon and less inorganic content [36]. The obtained activated carbon (powdered, granular, fibers, and extruded form) showed a high surface area and high-porosity structure [37] and can be used to remove pollutants from aqueous solutions. Granular activated carbon can be used in the food and beverage industry, wastewater treatment, and air and gas purification [38]. There is a high demand for the granular form due to its simple regeneration and reusability [39]. On the other hand, powdered activated carbon showed a larger surface-area-to-volume ratio with a particle size less than 0.177 mm. It can be employed for the removal of unwanted odor, taste, and color. Generally, activated carbon can be categorized into three groups, namely, microporous (smaller than 2 nm), mesoporous (2 to 50 nm), and macroporous (more than 50 nm), depending on pore sizes based on the IUPAC definition. During the preparation of activated carbon, there are various types of precursors that can be converted into activated carbon through physical activation (under an inert atmosphere in the carbonization process) and chemical activation (activating agent: acidic, basic, or salt). Octoli and co-workers [40] have produced sago waste-based activated carbon by using different activating agents, such as phosphoric acid, zinc chloride, potassium permanganate, and potassium hydroxide. The textural properties of these activated carbons are highlighted in Table 3. Mistar and co-workers [41] pointed out that the surface area was strongly dependent on the experimental conditions (pyrolysis temperature and weight ratio between carbon and sodium hydroxide (NaOH)). The Bambusa vulgaris-based activated carbon produced by using a weight ratio of 1:1 (carbon to NaOH) at a temperature of 700 °C and at 800 °C showed that the surface area was 308 m2/g and 560 m2/g, respectively. In addition, experimental results revealed that a higher surface area could be obtained when the weight ratio was increased from 1:2 (635 m2/g) to 1:3 (1041 m2/g). It was noted that a similar trend result was observed in the total pore volume as well. When the residual loss of hydrocarbons increased, it resulted in more pores, an increased surface area, and contributed to a bigger pore diameter. Based on Equation (4), NaOH reacted with carbon (C) to produce carbon dioxide (CO2) gas, corroded the carbon wall, and formed new pores.
Toni and co-workers [42] have reported the influence of zinc chloride on the properties of peat-based activated carbon. The percentage of yield reduced (45.7% to 14.2%), while total carbon increased (87.2% to 96%) with an increase in the carbonizing temperature (723 K to 1073 K). The volatilization process and decomposition of the carbon occurred rapidly (enhanced pore development) when the carbonization temperature was increased. The percentage of yield increased when reducing the impregnation ratio (from 2 to ¼) due to zinc chloride reacting with hydrogen atoms and oxygen atoms to form a water molecule and hydrogen molecule, respectively. However, the mesoporosity structure increased when the impregnation ratio was increased from ¼ (57.9% to 65.5%) to 2 (65.7% to 80.2%). Jiang and co-workers [43] compared the psychical properties of commercial activated carbon and acid-treated carbon (sulfuric acid). Research findings confirmed that BET surface area (1126 to 1234 m2/g), acidic surface oxygen complexes (0.071 to 1.986 meq/g), and mesoporous volume (0.243 to 0.452 mL/g) were increased after the impregnation process (concentrated sulfuric acid). When the treatment temperature was at 250 °C, several observations could be described. These included the opening of micro pores, the destruction of pore walls, and the production of carboxyl and hydroxyl groups.
The world’s activated carbon market volume increased from 2015 (2.7 million metric tons), 2017 (3.4 million metric tons), 2019 (4.3 million metric tons) to 2021 (5.4 million metric tons) due to the environmental regulations [44]. Activated carbon has been used in water treatment (38%), air purification (24%), and food processing (19%). China accounted for the world′s largest consumption [45] of activated carbon in 2020, followed by the United States and Western Europe (Figure 8). Currently, the major activated carbon manufacturers globally include Jacobi Carbons Groups located in Kalmar, Sweden (coconut shell), Kuraray Co. Ltd. Located in Tokyo, Japan (coal and coconut shell), Haycarb (Pvt) Ltd. Located in Chennai, India (coconut shell), General Carbon Corp located in New Jersey, United States (wood, coal, coconut shell), and Cabot Norit located in Amersfoort, The Netherlands and Texas, United States (wood, peat, coconut shell).
Zeolite has been used in gas adsorption [46], water treatment, soil amendment, construction, agriculture, petroleum refining, detergent builders, catalysts, and animal feed additives. Zeolite is produced from alumina (Al) and silica () via the interlinkage of oxygen atoms [47]. The primary (consisting of the central atom and terminal oxygen) and secondary building blocks (bridging via oxygen–oxygen atoms) can be observed (Figure 9) in zeolites [48]. Generally, zeolite can be classified into natural zeolites (volcanic and sedimentary rocks) and synthetic zeolites, which account for 37% and 63% of the total zeolite consumption, respectively. Currently, China is the largest producer (of natural zeolite) in the world, followed by South Korea and Slovakia.
Synthetic zeolite can be produced by using different methods, including hydrothermal, solvothermal, and inothermal methods. Zeolite X and zeolite Y showed a bigger void space with a rigid structure. Zeolite A, produced from sodium aluminosilicate, had an excellent ion-exchange capacity with a specific particle size (4 to 10 µm). Zeolite can be prepared by using natural sources. These zeolites are low in cost and exhibit interesting properties (hydrophilic in nature, highly porous cavities, and specific surface area). In addition, experimental results showed that the size was estimated to be 0.3 to 1 nm, and thermal stability and resistance to acid were increased when the silicon to aluminum ratio was increased [49].
Sometimes, modified zeolite (to improve adsorption capacity) is created in the laboratory through different methods such as physical modification (thermal and ultrasonic modification), chemical modification (by using salt, acid, base, a cationic surfactant, and rare earth), and composite modification. Thermal (muffle or microwave heating) and ultrasonic modification (sound waves) have been observed to reduce surface resistance and eliminate impurities in the pores. Acid has the potential to dissolve impurities in the pores; the H+ ions replaced K+, Ca2+, and Mg2+ in order to increase porosity. In the alkali-modification process, NaOH reduced the ratio of silicon to aluminum and formed a mesoporous structure. Salt modification can be carried out through ammonium chloride, aluminum chloride, sodium chloride, and magnesium chloride. During the modification process, the salt solution removed impurities and exchanged the zeolite cations with cations from the salt solution.
The surfactant-modified zeolite [50] was created by mixing a cationic surfactant with natural zeolite (Figure 10). The negative charge (zeolite surface) could adsorb surfactant cations through electrostatic force when the concentration of surfactant was equal to or smaller than the critical micelle concentration. However, the alkyl chain of the surfactant was attracted via hydrophobic interaction when the concentration of the surfactant exceeded the critical micelle concentration. Eventually, a positive charge was produced on the zeolite to remove anionic contaminants.
Rare earth modification can be achieved through lanthanum, zirconium, and cerium hydroxide. These zeolites can remove ammonium (cation exchange with zeolite) and phosphate (exchange of the ligand and electrostatic attraction) effectively. Composite modification can be carried out through several techniques. Alkali/acid/salt composite modification can reduce the adsorption period. Zeolite was treated at high temperatures to increase the porosity under heating composite modification. The ultrasound and salt-modification process can dissolve impurities and reduce the reaction time as well [50].
Currently, the largest manufacturing companies [51] include Zeolyst International located in Pennsylvania, United States (zeolite Y, zeolite beta, ZSM-5, ferrierite, Mordenite), Rota Mining Co located in Istanbul, Turkey (clinoptilolite), Clariant located in Bitterfeld, Germany (advanced zeolite powder), W.R. Grace & Co. located in Maryland, United States (zeolite molecular sieves), Zeocem AG, located in Bystre, Slovak Republic (natural zeolite), CWK Chemiewerk Bad Kostritz GmbH, located in Bad Kostritz, Germany (zeolite molecular sieves), Bear River Zeolite Co, located in Montana, United States (natural zeolite), Northern Filter Media Inc located in Lowa, United States (resin zeolite), Grace & Co, located in Worms, Germany (zeolite catalysts), Zeo Inc. located in Texas, United States (natural zeolite), Anten Chemical Co. Ltd. Located in Xiamen, China (zeolite powder), Arkema located in Paris, France (molecular sieves), and ZeoliteMin located in Xiamen, China (natural zeolite).
3. Adsorption of Phenol and Phenolic Compounds Using Different Adsorbents
Phenol is an organic compound that appears as a colorless liquid and is more soluble in water [52]. Phenol can be used in many applications (bisphenol-A, alkyl phenolphenol-formaldehyde resin industry, adipic acid). The global market value increased [53] between 2015 (19.17 billion USD) and 2021 (21.61 billion USD). There are various sources of phenolic compounds, such as medical and household products, industrial waste, agricultural waste, decomposition of organic matter, and municipal waste, synthesized by plants and microorganisms. Phenol is a very toxic substance due to hydrophilic and lipophilic behaviors [54], resulting in necrosis and denatured protein. Table 4 shows the structure, sources, and unhealthy effects of various types of phenol and phenolic compounds. It has been noted that phenol can distribute widely within a few minutes via multiple routes, such as dermal contact, ingestion, and inhalation. The major sources of phenol can be observed in industrial, agricultural, and human activities. For example, coke processing (1000 mg/L) and resin plants (12–300 mg/L) produced a higher concentration of phenol. Based on the Environmental Protection Agency (EPA) and World Health Organization (WHO) guidelines, the limit of phenol concentration is 0.1 mg/L (wastewater) and 0.001 mg/L (portable water), respectively. According to the experimental findings, the removal of the phenol from wastewater has been carried out by using different techniques, such as photocatalytic degradation, membrane-based separation, ion exchange, ozonation, electro-Fenton, extraction, biological method, and adsorption.
Based on X-ray fluorescence (XRF) studies, the formula of neat clay is Mg3.27Zn1.01Al2(OH)12.83CO3.nH2O [55]. The highest adsorption efficiency was observed to be 85% when the clay calcined at 500 °C (majority periclase phase with the highest specific surface area (30 m2/g)) compared to other temperatures, such as 1100 °C (50%) and 250 °C (6%). The adsorption rate decreases as the pH increases. When the number of hydroxyl ions increases at a higher pH value, the LDH reconstruction rate will also be increased, but reduced in the intercalation of phenolate ions. The heterogeneous process can be identified based on the Freundlich model (R2 = 0.998), and the heterogeneity factor was 2.2, representing physical adsorption (Figure 11). The adsorption data followed the Langmuir model (maximum adsorption capacity was 12 mg/g) and pseudo-second-order kinetic model (R2 = 0.9991). In clay regeneration and reusability studies, experimental findings revealed that the clay loses adsorption capacity after four adsorption cycles (drops 25%) compared to the first–third cycles (drops 2%) due to a reduction in its crystallinity.
Coconut-based activated carbon with a surface area of 236 m2/g and a total pore volume of 47 cm3/g was synthesized via carbonization and physical activation process [56]. The adsorption of phenol is fast at the preliminary stage (up to 800 min) and then slows down, eventually reaching equilibrium at 1440 min. The chemical activation of African beech wood sawdust in the presence of KOH creates activated carbon with a high surface area (1236–1553 m2/g) with well-developed pores, as reported by Abdel-Ghani and co-workers [57]. The highest removal of phenol can be seen under optimum preparation conditions of a pH of 7 (phenol exists as a neutral species when the pH is 7) and a contact time of 300 min. Phenol is a weak acid; the anionic form and molecular form can be observed in alkaline and acidic conditions, respectively. The pseudo-first-order kinetic isotherm and Langmuir model (maximum adsorption capacity = 1.73–4.33 mg/g) were used to represent adsorption data because the homogeneous distribution of active sites can be detected on the surface of the activated carbon. On the other hand, coir pith-based activated carbon was successfully prepared by Namasivayam and Kavitha [58]. The adsorption kinetics obeyed the pseudo-second-order kinetic isotherm; the rate-constant values were observed to be 0.0098–0.0672, 0.0949–0.88, and 0.172–0.305 in phenol, 2,4,6-trichlorophenol, and pentachlorophenol, respectively. The highest adsorption capacity of phenol and pentachlorophenol was 48.3 mg/g and 3.7 mg/g (in acidic conditions), as indicated in the Langmuir model. The overall results confirmed the process was chemisorption and an endothermic reaction (positive value of enthalpy: 8.9 to 24.99 kJ/mol).
The South African coal fly ash contained a large amount of quartz, mullite, and a small amount of calcium oxide and hematite [59]. Scanning electron microscopy (SEM) analysis revealed a spherical shape with a smooth surface in the obtained samples. The adsorption kinetics can be described using the pseudo-first-order Lagergen equation, and the rate constant values were 1.15 × 10⁻³/h, 1 × 10⁻³ /h and 6.32 × 10⁻³/h for phenol, 2-nitrophenol, and 4-nitrophenol, respectively. Experimental findings showed that the highest adsorption capacity (lower solubility and non-polar compound) was 2.6 × 10⁻² mg/g in 4-nitrophenol compared to other adsorbates. The removal of phenol using fly ash was reported [60]. Phenol removal increases (until 82.92–88.73%) when increasing the adsorbent dosage because of an increased number of active sites and surface area of the adsorbent. However, overcrowding of phenol can be seen at higher adsorbent doses. It was evident from the experimental results that the optimized conditions were pH = 6, contact time = 120 min, adsorbent dosage = 40 g/L, and adsorbate concentration = 20 mg/L. The chemical modification of fly ash through iron and aluminum was proposed by Neeru and co-workers [61]. Adsorption studies confirmed the highest removal efficiency was found when using aluminum-impregnated fly ash (85.6%) compared to iron (82.1%). The pseudo-second-order kinetic model and Redlich–Peterson isotherm were observed to represent the equilibrium data. According to the thermodynamic investigations, enthalpy and entropy values were 30.79 kJ/mol and 104.92 kJ/mol.K, respectively.
The use of various pairs of cations in the synthesis of layered double hydroxide (LDH) was studied by Ruiz and co-workers [62]. SEM images confirmed the different morphologies can be observed in TiO2/MgAl (irregular surface), TiO2/MgFe, and TiO2/ZnAl (smooth and more homogeneous). Energy-dispersive X-ray (EDX) analysis revealed that the highest atomic percentage was of carbon (10.7%), oxygen (61.4%), and titanium (32.3%) in TiO2/MgAl, TiO2/MgFe, and TiO2/ZnAl, respectively. The surface area (45.29–49.34 m2/g), pore total volume (11.12–15.53 cm3/g), and pore medium diameter (9.82–12.59 nm) in all samples were studied. Researchers concluded that a smaller surface area was obtained in theTiO2/LDH compared to LDH material due to TiO2, iron, and zinc having smaller surface areas. The surface fractal dimension (2.08–2.14) represented a rough surface and mesoporous structure in the obtained samples. In the adsorption studies, TiO2/ZnAl and TiO2/MgFe showed a better adsorption capacity than TiO2/MgAl.
Nourrdine and co-workers [63] studied the removal of phenol by using zeolite Y modified by silylation (to improve hydrophobic behavior). A study concluded that the rate of adsorption had increased by 30% after modification because of the replacement of the H atom (silanol group) by the trimethylsilyl group ((CH3)3Si). Saravanakumar [64] observed that the maximum adsorption capacity of phenol was 13.05 mg/L onto sodium zeolite based on the Langmuir isotherm (R2 = 0.9988).
Marijana and co-workers [65] reported that the original multi-walled carbon nanotube has unique properties (high purity with 99.8% carbon and hydrophobicity). The surface area (61.3 to 600 m2/g) and pore volume (0.974 to 4.22 cm3/g) increased significantly after acid treatment (nitric acid). Experimental results revealed that the original multiwalled carbon nanotube (OMWCNT) has higher adsorption affinities for larger molecules (molecular weight of 2,3,4,5-tetrachlorophenol = 232 g/mol, pentachlorophenol = 266 g/mol) due to the surface interaction being dominant. Smaller molecules (molecular weight of 2,4-dichlorophenol = 163 g/mol, 2,4,6-trichlorophenol = 197 g/mol) could penetrate deeper into the mesoporous structure of the adsorbent easily. The presence of carboxylic (0.208–0.67 mmol/g) and phenolic groups (0.009–0.618 mmol/g) on the MWCNT surface increased the adsorption of electron donors but reduced the adsorption of electron acceptors. Hadi and co-workers [66] synthesized a single-walled carbon nanotube via the catalytic chemical vapor method and treated it with acidic solutions (nitric acid and sulfuric acid). The length, outer diameter, inner diameter, and specific surface area were 10 µm, 1–2 nm, 0.8–1.1 nm, and 700 m2/g, respectively. The percentage removal of phenol increased with time (until it reached 30 min); however, it reduced when the phenol concentration was increased (less-favorable sites). Chemical modification improved the properties of the adsorbent and enhanced the adsorption process at pH 3–9. Phenol adsorption was low when the pH was more than pH 9 because more oxygen-containing groups were ionized, absorbed more water, and blocked the access of phenol to active sites. As highlighted in the Langmuir model (R2 = 0.983), the maximum adsorption capacity reached 50.5 mg/g (phenol concentration = 50 mg/L, adsorbent dose = 1.97 g/L, contact time = 36 min, pH = 6.57). The adsorption kinetics obeyed the pseudo-second-order kinetic, Freundlich model, and Redlich–Peterson isotherm.
Many researchers have reported the removal of phenol and phenolic compounds using chitosan. The adsorption data obeyed the Langmuir model (correlation coefficient = more than 0.97) in all samples. The maximum adsorption capacities were 8.5 mg/g and 34.93 mg/g, 20.49 mg/g and 179.73 mg/g, and 44.92 mg/g and 20.56 mg/g in salicylidene–chitosan and β-cyclodextrin-6-chitosan for phenol, p-chloro phenol, and p-nitro phenol, respectively, at pH 7 and temperature of 30 °C. The highest adsorption capacity of p-chloro phenol was observed in β-cyclodextrin-6-chitosan due to the formation of hydrogen bonding (chlorine, oxygen, and hydrogen) with hydroxyl in both chitosan and β-cyclodextrin. At the same time, researchers predicted that the removal of phenol by using aalicylidene–chitosan was predominated by the π-π interaction between the phenol and aromatic ring (salicylidene in salicylidene–chitosan). Meng and co-workers [67] have confirmed that KCl has little impact on the removal of phenol onto chitosan, indicating phenolate anions did not become involved in the adsorption process. In addition, it can be concluded that this adsorption process was not predominated by electrostatic interaction. On the other hand, a low temperature is favorable for the adsorption process. The removal of p-nitro phenol on salicylidene–chitosan (through π-π interaction between the aromatic ring) and p-chloro phenol onto β-cyclodextrin-6-chitosan (predominated by hydrogen bonding) was reduced when the temperature was increased (30 °C to 60 °C), indicating the interaction between chitosan and adsorbate was multiform. The influence of pH was studied (pH 5–11.5), and the obtained results reflected that the removal of phenolic compounds did not change when increasing the pH (until pH 10). However, the adsorption process reduced rapidly when the pH was more than pH 10. The pKa values were found to be pH 7.15, 9.41, and 9.89 for p-nitro phenol, p-chloro phenol, and phenol, respectively. Depending on its pKa, the phenol exists as either negative phenolate ions (above pKa value) or molecules (below pKa). The kinetics, thermodynamics, and isotherms of adsorption have been studied by many researchers (Table 5). The removal of phenol and phenolic compounds from wastewater using different adsorbents, such as layered double hydroxide clays, activated carbon, zeolite, pumice, bentonite, chitosan, and fly ash was reported based on the literature survey.
4. Adsorption of Pesticides by Using Different Adsorbents
A pesticide was employed to control the pests and to protect particular plants [90]. It included insecticide, herbicide, and fungicide. The chemical formula, structure, and molar mass of the different pesticides are highlighted in Table 6. Generally, pesticides could cause short-term and long-term adverse health effects on humans and animals. Using narrow-spectrum pesticides to prevent specific pests and minimize the impact of natural enemies has been recommended [91]. Research findings showed that a variety of pesticide residues could be observed in foods, soil, plants, and waterways. Table 7 shows the pesticide toxicity [92] based on the World Health Organization (WHO) guidelines.
The waste rubber tire was utilized to produce activated carbon via a chemical and thermal treatment process. The obtained activated carbon showed favorable surface chemistry with mesoporous and macroporous structures. The adsorption capacities for methoxychlr (112 mg/g), atrazine (104.9 mg/g), and methyl parathion (88.9 mg/g) were reported under specify conditions (pH = 2, contact time = 1 h, initial adsorbate concentration = 12 mg/L). Adsorption data fit well with the Langmuir model and pseudo-first-order kinetic model. The adsorption process had exothermic, spontaneous, and random behavior. Methoxychlor, a synthetic organochloride insecticide (to replace dichlorodiphenyltrichloroethane), was employed to protect livestock, crops, and pets against insects (chiggers, biting flies, mosquitoes, houseflies, fleas, and cockroaches). Sprayed methoxychlor can be detected in sediments. It takes a few months for the degradation process to occur. When methoxychlor is absorbed by a living organism, it can accumulate in the food chain. Exposure to methoxychlor causes tremors and reproductive system disturbance. Atrazine, an herbicide, can be categorized in the triazine class. It is employed to control broadleaf weeds and grasses before they emerge. Generally, it is sprayed on sugarcane, corn, and sorghum. It is a common contaminant of drinking water and groundwater. It can cause severe problems, such as lymphoma, leukemia, and cancer (breast, tumor, ovarian, uterine). Parathion methyl is a so-called organophosphate insecticide (on crops such as cotton, soybean, and vegetables). Exposure to parathion methyl results in diarrhea, sweating, dizziness, nausea, blurred vision, muscle twitching, and headache.
The removal of malathion was achieved using fly ash (surface area = 143.6 m2/g, pore volume = 0.1247 cm3/g, particle size = 149 µm) produced from the Anpara thermal power plant, India [93]. The experimental results confirmed that the adsorption process increased with the contact time, reached maximum, and then remained constant. A pH of 4.5 (99%) is considered favorable for the highest removal of malathion compared to pH 3 (96%) and pH 7 (95%). Additional experimental findings showed that adsorption increased (90% to 97.5%) with an increase in the temperature (35 °C to 55 °C); however, it decreased from 99% to 90% when increasing the initial malathion concentration (1 mg/L to 10 mg/L). Thermodynamic parameters were obtained, and it was found that the adsorption was an endothermic reaction (enthalpy value = +2.53 kJ/mol). Malathion is a so-called organophosphate insecticide (kills mealybugs, aphids, red spider mites, and whiteflies within a few minutes by damaging the nervous system) and is employed in public recreation areas, agricultural sectors (vegetable, tree, fruit, and grass crops), and residential landscaping to combat West Nile virus and mosquitoes. However, it can cause sensitization and skin irritation. The boiler fly ash [94] was used to remove herbicides (paraquat dichloride and glyphosate). The fly ash was soaked in nitric acid to wash off any soluble biomolecules and open up the pores. The obtained results showed that the amount of paraquat dichloride and glyphosate adsorbed onto the adsorbent were 13 mg/L and 12.33 mg/L when the contact time was 10 min; however, the adsorption amount dropped to 9.6 mg/L and 9 mg/L, respectively, after 40 min. Adsorption kinetics followed the pseudo-second-order kinetic model, and the rate of the constant was controlled by the chemisorption process. Furthermore, results (based on the Freundlich model) showed that the adsorbent has a high adsorption capacity for glyphosate compared to paraquat dichloride (longer half-life = 1000 days, higher soil adsorption coefficient = 1,000,000 µg/g). Paraquat, classified as viologen, is employed as an herbicide (to control grasses and weeds). Exposure to paraquat can damage the liver, kidney, and esophagus. Glyphosate is classified as an organophosphorus compound and is considered a non-selective herbicide because it can kill most plants and stop enzyme pathways. It is toxic and is known to cause genetic damage in birds and fish.
Several types of zeolites have been produced by Smedt and co-workers [95] for the removal of pesticides from aqueous solutions. Clopyralid adsorption by zeolite was found to be very low (2.72% to 16.94%) due to high water solubility (143,000 mg/L) and a low adsorption coefficient (5 mg/L). Zeolite beta (BEA) and zeolite Y (FAU) showed the highest adsorption capacity compared to other zeolites because of a higher surface area (348 to 661 m2/g) and limiting pore diameter (PLD) value (6.7 Å). The adsorption percentage of bentazone, clopyralid, imidacloprid, isoproturon, and metalaxyl m was observed to be 69.56%, 9.12%, 98.78%, 100%, and 42% in BEA zeolite, while 63.2%, 10.67%, 99.7%, 100%, and 99.8% in FAU zeolite. Experimental results indicated that hydrophobic behaviors were reduced when decreasing the aluminum content. Chabazite, clinoptilolite, and zeolite 4A displayed lower Si/Al values (1.12 to 5.6) and did not adsorb the pesticides well. Adsorption kinetics showed that the pseudo-second-order kinetic model (R2 = 0.9999) could fit the data better than other isotherms. The pseudo-second-order constant (k2) provides an indication of the adsorption rate and it has units of g/mg.h. The higher the k2 value, the faster the equilibrium has been achieved. It was noted that a higher adsorption rate could be observed for isoproturon (25.96 to 1666.67 g/mg.h) and metalaxyl-m (500 to 20,000 g/mg.h) and could reach equilibrium within 15 and 30 min, respectively. Freundlich isotherm shows the best correlation coefficient compared to the Langmuir model. Non-ionic pesticides such as metalaxyl-m and isoproturon showed higher adsorption intensity based on the Freundlich model. Bentazon is classified as a thiadiazine group and is employed in herbicides (to control the spread of weeds). It is sprayed on food crops (bean, pepper, rice, peas, maize, and peanuts). Exposure to bentazon causes skin and eye irritation. Isoproturon is a selective herbicide used to control broad-leaved weeds and annual grasses. It is very toxic to oysters (370 µg/L), algae (13 µg/L), and fish (1 mg/L) with long-term exposure in specific concentrations. Metalaxyl, an acylalanine fungicide, is employed to control pythium (in vegetable crops) and phytophthora (in peas). Long-term exposure to metalaxyl may cause skin allergies and is harmful to aquatic life. Clopyralid is known as a selective herbicide used to control broadleaf weeds (clover, dandelions, and thistles). Clopyralid enters the plant, replaces natural auxins, and results in unusual growth patterns. It shows low toxicity; however, clopyralid vapor causes eye irritations. Imidacloprid is a systematic insecticide (causes insect paralysis by blocking the nicotinic acetylcholine receptors) and is used to control soil insects, termites, and fleas. Chronic exposure results in drowsiness, diaphoresis, emesis, and disorientation. Table 8 highlights the information collected from various investigations, including the type of adsorbents and the pesticides used, experimental conditions, and results (isotherms, thermodynamics, and kinetics) of each work based on a literature survey.
5. Adsorption of Dye Compounds Using Different Adsorbents
Dye is a colored compound, and it contains very complex aromatic molecular structures [111]. Dyes can be divided into natural dyes (from fruit, plant, and mineral) and synthetic dyes (made from chemicals) [112]. The world synthetic dye market was valued at USD 31.97 billion in 2019, and is expected to reach USD 50.38 billion by 2023 due to the high demand in the packaging, paper, ink, leather, and textile industries [113]. Synthetic dye is cheaper compared to natural dye; however, it creates water pollution [114] and can be very harmful to humans (mutation, skin allergies, skin irritation) and animals. Common examples of synthetic dyes are basic dye, acid dye, direct dye, disperse dye, reactive dye, azo dye, and mordant dye. Currently, China is the largest manufacturer and exporter of dyes, followed by India, the United States, Brazil, and the United Kingdom [115]. There are several dye manufacturers, such as Bodal Chemicals Ltd located in Gujarat, India (more than 170 dyestuffs), Atul Chemicals Ltd located in Gujarat, India (Vat dyes and Sulphur Black dyes), Colourtex Industries Private Limited located in Pandesara Surat, India (disperse dye, brilliant and reactive dyes), Huntsman located in Delaware, United states (cationic dye, reactive dyes), Zhejiang Longsheng Dyestuff Chemicals Co Ltd located in Hangzhou Harbor Shaoxing, China (vat dyes, reactive dyes, acid dyes), Zhejiang Runtu Co. Ltd., located in Shanxi, China (disperse dyes, reactive dyes, direct dyes), Jiangsu Yabang Dyestuff Co. Ltd., located in Changzhou, China (vat dyes, disperse dye, solvent dyes), and BASF located in Ludwigshafen, Germany (vat dyes, solvent dyes). Many techniques have been used to remove dye from wastewater. However, some of these techniques have several disadvantages, such as ion exchange (very expensive), membrane process (very low flow rate), and bio-degradation (very slow process and nutrition requirement) method. In general, experimental results showed that different removal rates can be observed for a particular dye. For example, approximately 90% (cationic, acid, and mordant dyes), 40% (reactive, sulfur, direct, and disperse dyes), and 20% (vat dyes) removal rates can be seen by using activated carbon [116]. Table 9 presents the collection of various types of adsorbents employed to remove the different dye compounds from aqueous solutions. The adsorption kinetics, isotherms, and thermodynamics were reported from the selected literature survey. In this work, the application of different types of adsorbents for the removal of pollutants from wastewater has been reviewed. As highlighted by many researchers, the adsorption technique has many advantages, such as low cost, high performance, and easy operation compared to membrane filtration (which is very expensive). Table 10, Table 11, Table 12 and Table 13 showed the preparation costs and operation costs of activated carbon, fly ash, zeolite and carbon nanotubes, respectively. On the other hand, literature survey revealed that the average price of kaolin was increased from 2010 (137 US dollars per ton), 2012 (149 US dollars per ton), 2015 (151 US dollars per ton), 2017 (158 US dollars per ton), 2019 (162 US dollars per ton), and 2021 (160 US dollars per ton) in the United States, due to the high demand for zeolite in construction, agriculture and petrochemical sector [117].
6. Conclusions and Future Perspective
The presence of dyes, pesticides, phenols, and phenolic compounds has caused water pollution. It is a very serious environmental problem, the result of human activities and the development of industrialization. The experimental findings obtained from the literature review revealed that several low-cost adsorbents, such as activated carbon, zeolite, clay, fly ash, LDH, and carbon nanotubes, can be used to remove these pollutants in wastewater. These adsorbents showed a very high surface area and excellent porosity structure useful for improving the adsorption capacity. Adsorption is considered an effective and low-cost technique to adsorb undesired pollutants and produce high-quality treated effluent. Thermodynamic studies indicated that adsorption is a spontaneous process.
In the future, raw materials for activated carbon should be obtained from agricultural wastes due to an enhanced crop value, reduced solid waste management, increased profitability, and reduced environmental pollution. From the consumer’s point of view, the price plays a very important role in the market-analysis process. The price affects the huge demand for the adsorbent and the way these adsorbents are introduced into the market. Currently, researchers prepare adsorbate in the laboratory using analytical-grade chemicals. Pilot plant testing should be conducted rather than using an experimental scale. Wastewater samples can be collected directly from different plants/locations (from different industries).
Funding
This research is supported by the Office of Research and Development Consultancy, INTI International University.
Institutional Review Board Statement
Not applicable.
Informed Consent Statement
Not applicable.
Data Availability Statement
Not applicable.
Acknowledgments
The author would like to express sincere thanks to the editors and the reviewers for their constructive comments that have greatly enhanced the quality of this paper.
Conflicts of Interest
The authors declare no conflict of interest.
References
- Panagopoulos, A.; Giannika, V. Comparative techno-economic and environmental analysis of minimal liquid discharge (MLD) and zero liquid discharge (ZLD) desalination systems for seawater brine treatment and valorization. Sustain. Energy Technol. Assess. 2022, 53, 102477. [Google Scholar] [CrossRef]
- Panagopoulos, A. Brine management (saline water & wastewater effluents): Sustainable utilization and resource recovery strategy through Minimal and Zero Liquid Discharge (MLD & ZLD) desalination systems. Chem. Eng. Process. 2022, 176, 108944. [Google Scholar] [CrossRef]
- Panagopoulos, A. Techno-economic assessment and feasibility study of a zero liquid discharge (ZLD) desalination hybrid system in the Eastern Mediterranean. Chem. Eng. Process. 2022, 178, 109029. [Google Scholar] [CrossRef]
- Amine, M.; Dora, T.; Ben, S.; Bechir, H. Phenol removal from water by AG reverse osmosis membrane. Environ. Prog. Sustain. Energy. 2015, 34, 982–989. [Google Scholar]
- Mukherjee, A.; Mehta, R.; Saha, S. Removal of multiple pesticide residues from water by low-pressure thin-film composite membrane. Appl. Water Sci. 2020, 10, 244. [Google Scholar] [CrossRef]
- Nathan, G.; Nishil, M.; Wei, S.; Berry, M.; Tam, C. Dye Removal Using Sustainable Membrane Adsorbents Produced from Melamine Formaldehyde−Cellulose Nanocrystals and Hard Wood Pulp. Ind. Eng. Chem. Res. 2020, 59, 20854–20865. [Google Scholar]
- Vesna, P.; Sanja, S.; Nesic, A.; Sava, V. Adsorption of azo dyes on polymer materials. Hem. Ind. 2013, 67, 881–900. [Google Scholar]
- Moosavi, S.; Li, W.; Gan, S.; Zamiri, G.; Omid, A. Application of Efficient Magnetic Particles and Activated Carbon for Dye Removal from Wastewater. ACS Omega 2020, 5, 2684–20697. [Google Scholar] [CrossRef]
- Siyal, A.; Rashid, S.; Low, A.; Nurul, E. A review on recent developments in the adsorption of surfactants from wastewater. J. Environ. Manag. 2020, 254, 109797. [Google Scholar] [CrossRef]
- Mustafa, T.; Sen, T.; Ang, H.; Afrze, S. Dye and its removal from aqueous solution by adsorption: A review. Adv. Colloid Interface Sci. 2014, 209, 172–184. [Google Scholar] [CrossRef]
- Asep, B. Isotherm Adsorption of Carbon Microparticles Prepared from Pumpkin (Cucurbita maxima) Seeds Using Two-Parameter Monolayer Adsorption Models and Equations. Mor. J. Chem. 2020, 8, 745–761. [Google Scholar]
- Izabela, M.; Dariusz, W.; Aleksandra, S. Experimental investigation into CO2 capture from the cement plant by VPSA technology using zeolite 13X and activated carbon. J. CO2 Util. 2022, 61, 102027. [Google Scholar] [CrossRef]
- Kumar, P.; Ramesh, D.; Karthikeyan, S.; Subramanian, P. Activated carbon production from coconut leaflets through chemical activation: Process optimization using Taguchi approach. Bioresour. Technol. Rep. 2022, 19, 101155. [Google Scholar] [CrossRef]
- John, P.; Santos, M.; Noemi, Z. Synthesis, characterization and application of cross-linked chitosan/oxalic acid hydrogels to improve azo dye (Reactive Red 195) adsorption. React. Funct. Polym. 2020, 155, 104699. [Google Scholar] [CrossRef]
- Silva, A.; Healy, B.; Pinto, L.; Cadaval, T.; Breslin, C. Recent Developments in Chitosan-Based Adsorbents for the Removal of Pollutants from Aqueous Environments. Molecules 2021, 26, 594. [Google Scholar] [CrossRef]
- Paula, M.; Natalia, G.; Taina, K.; Franco, P. Adsorptive removal of basic dye onto sustainable chitosan beads: Equilibrium, kinetics, stability, continuous-mode adsorption and mechanism. Sustain. Chem. Pharm. 2020, 18, 100318. [Google Scholar] [CrossRef]
- Chitosan Market. Available online: https://www.alliedmarketresearch.com/chitosan-market (accessed on 2 September 2022).
- Zhang, X.; Yu, J.; Huang, Y.; Wang, Z. Experimental research on the gaseous PbCl2 adsorption by thermal alkali modified coal fly ash. J. Environ. Chem. Eng. 2022, 10, 107912. [Google Scholar] [CrossRef]
- Bing, Y.; Hu, H.; Biao, F.; Huang, Y.; Liu, H. Condensation and adsorption characteristics of gaseous selenium on coal-fired fly ash at low temperatures. Chemosphere 2022, 287, 132127. [Google Scholar] [CrossRef]
- Xin, Z.; Zhao, H.; Ji, P.; Wang, L.; Hu, X. Effect and mechanisms of synthesis conditions on the cadmium adsorption capacity of modified fly ash. Ecotoxicol. Environ. Safety 2021, 223, 112550. [Google Scholar] [CrossRef]
- Agus, T.; Hidayat, P.; Arif, H. Modified coal fly ash as low cost adsorbent for removal reactive dyes from batik industry. MATEC Web Conf. 2018, 154, 01037. [Google Scholar] [CrossRef] [Green Version]
- Sanjuan, A.; Argiz, C. Fineness of coal fly ash for use in cement and concrete. Fuels 2021, 2, 471–486. [Google Scholar] [CrossRef]
- Jiang, Z.; Kim, J.; John, L.; Barrera, V.; Valery, N. Improving the Dispersion and Integration of Single-Walled Carbon Nanotubes in Epoxy Composites through Functionalization. Nano Lett. 2003, 3, 1107–1113. [Google Scholar]
- Devi, R.; Gill, S. A squared bossed diaphragm piezoresistive pressure sensor based on CNTs for low pressure range with enhanced sensitivity. Microsyst. Technol. 2021, 27, 3225–3233. [Google Scholar] [CrossRef]
- Danikiewicz, A.; Wolany, W.; Cichocki, D. Carbon nanotubes manufacturing using the CVD equipment against the background of other methods. Arch. Mater. Sci. Eng. 2021, 64, 103–109. [Google Scholar]
- Rajabi, M.; Moradi, O.; Mahanpoor, K. Removal of dye molecules from aqueous solution by carbon nanotubes and carbon nanotube functional groups: Critical review. RSC Adv. 2017, 7, 47083–47090. [Google Scholar] [CrossRef] [Green Version]
- Carbon Nanotube Market. Available online: https://www.alliedmarketresearch.com/carbon-nanotube-market (accessed on 2 September 2022).
- Nour, T.; Ghadir, A.; Farag, S. Individual and competitive adsorption of phenol and nickel onto multi walled carbon nanotubes. J. Adv. Res. 2015, 6, 405–415. [Google Scholar]
- Pinero, E.; Amoros, C.; Szostak, K.; Beguin, F.; Delpeux, S. High surface area carbon nanotubes prepared by chemical activation. Carbon 2002, 40, 1597–1617. [Google Scholar]
- Sang, L.; Lee, S.; Jung, J.; Kim, H. Pore characterization of multi-walled carbon nanotubes modified by KOH. Chem. Phys. Lett. 2005, 416, 251–255. [Google Scholar]
- Sadeghpour, N.; Vadi, M.; Bagheri, N. Utilizing carbon nanotubes as efficient nanoadsorbent for pantprazole removal from aqueous solution samples: Kinetics, isotherm and thermodynamic studies. J. Chil. Chem. Soc. 2021, 66, 5324–5331. [Google Scholar] [CrossRef]
- Soma, C.; Jayanta, C.; Peng, H.; Chen, Z.; Arnab, M.; Rolf, S. Surface Area Measurement of Functionalized Single-Walled Carbon Nanotubes. J. Phys. Chem. B 2006, 110, 24812–24815. [Google Scholar]
- Fernando, J.; Isabel, A.; Sandep, A.; Jose, B. Adsorption Equilibria of light organics on single walled carbon nanotube heterogeneous bundles: Thermodynamically aspects. J. Phys. Chem. 2011, 115, 2622–2629. [Google Scholar]
- Oleg, B.; Liu, J.; Joh, T. Characterization of single wall carbon nanotubes by nonane pre-adsorption. Carbon 2006, 44, 2039–2044. [Google Scholar]
- Jalil, A.; Karim, A.; Nordin, K.; Hassim, H. Grape-like mesostructured silica nanoparticle decorated single-walled carbon nanotubes: Silica growth and dye adsorptivity. RSC Adv. 2015, 5, 71796–71804. [Google Scholar] [CrossRef]
- Ho, S.M. Removal of dye by adsorption onto activated carbons: Review. Eurasian J. Anal. Chem. 2018, 13, 332–338. [Google Scholar]
- Ho, S.M. Removal of Dyes from Wastewater by Adsorption onto Activated Carbon: Mini Review. J. Geosci. Environ. Prot. 2020, 8, 120–131. [Google Scholar] [CrossRef]
- Sircar, S.; Rao, M. Activated carbon for gas separation and storage. Carbon 1996, 34, 1–12. [Google Scholar] [CrossRef]
- Reza, M.; Saidur, R.; Yun, C.; Bakar, A. Shammya, Preparation of activated carbon from biomass and its’ applications in water and gas purification, a review. Arab J. Basic Appl. Sci. 2020, 27, 208–238. [Google Scholar] [CrossRef]
- Octolia, T.; Mumfaijah, M.; Allo, Y.K.; Dahlan, K.; Ansanay, Y.O. The Effect of Chemical Activating Agent on the Properties of Activated Carbon from Sago Waste. Appl. Sci. 2021, 11, 11640. [Google Scholar]
- Mistar, M.; Ahmad, S.; Muslim, A.; Supardan, M. Preparation and characterization of a high surface area of activated carbon from Bambusa vulgaris—Effect of NaOH activation and pyrolysis temperature. IOP Conf. Ser. Mater. Sci. Eng. 2018, 334, 012051. [Google Scholar] [CrossRef]
- Toni, V.; Bergna, D.; Riikk, L.; Romar, H.; Hu, T. Activated Carbon Production from Peat Using ZnCl2: Characterization and Applications. BioResources 2014, 12, 8078–8092. [Google Scholar]
- Jiang, Z.; Liang, C.; Liu, Y.; You, W.; Han, C.; Li, C. Activated Carbons Chemically Modified by Concentrated H2SO4 for the Adsorption of the Pollutants from Wastewater and the Dibenzothiophene from Fuel Oils. Langmuir 2003, 19, 731–736. [Google Scholar] [CrossRef]
- Global Market Volume Activated Carbon. Available online: https://www.statista.com/statistics/963555/global-market-volume-activated-carbon/ (accessed on 2 September 2022).
- Available online: https://ihsmarkit.com/products/activated-carbon-chemical-economics-handbook.html (accessed on 2 September 2022).
- Pei, Y.; Mo, S.; Xie, Q.; Ma, L.; Lili, H. Stellerite-seeded facile synthesis of zeolite X with excellent aqueous Cd2+ and Ni2+ adsorption performance. Chin. J. Chem. Eng. 2022, in press. [Google Scholar] [CrossRef]
- Chung, K.; Park, D.; Kim, K.; Lee, C. Adsorption equilibria and kinetics of ethane and ethylene on zeolite 13X pellets. Micropor. Mesopor. Mater. 2022, 343, 112199. [Google Scholar] [CrossRef]
- Emami, S.; Razif, H.; Mohd, N.; Zakaria, R. Potential of zeolite and algae in biomass immobilization. BioMed Res. Int. 2018, 6563196. [Google Scholar] [CrossRef] [Green Version]
- Shruti, A.; Kosankar, P. Review on Zeolite Synthesis. Zeichen J. 2020, 6, 395–399. [Google Scholar]
- Bo, L.; Dong, B.; Fang, C.; Chen, Z.; Zhao, Z. Effective adsorption of methylene blue from aqueous solution by coal gangue-based zeolite granules in a fluidized bed: Fluidization characteristics and continuous adsorption. Powder Technol. 2022, 408, 117764. [Google Scholar] [CrossRef]
- Zeolites: Chemical Economics Handbook. Available online: https://ihsmarkit.com/products/zeolites-chemical-economics-handbook.html#:~:text=Mainland%20China%20is%20the%20largest,world%20production%20is%20highly%20decentralized (accessed on 2 September 2022).
- Villegas, L.; Mashhadi, N.; Chen, M. A Short Review of Techniques for Phenol Removal from Wastewater. Curr. Pollut. Rep. 2016, 2, 157–167. [Google Scholar] [CrossRef] [Green Version]
- Global Market Value Phenol. Available online: https://www.statista.com/statistics/1244237/global-market-value-phenol/ (accessed on 2 September 2022).
- Raza, W.; Lee, J.; Raza, N.; Kim, K. Removal of phenolic compounds from industrial waste water based on membrane-based technologies. J. Ind. Eng. Chem. 2019, 71, 1–18. [Google Scholar] [CrossRef]
- Lehlogonolo, T.; Shepherd, T.; Frederick, L.; Evans, C. Adsorption of Phenol from Wastewater Using Calcined Magnesium-Zinc-Aluminium Layered Double Hydroxide Clay. Sustainability 2020, 12, 4273. [Google Scholar] [CrossRef]
- Masuma, S.; Rafat, M.; Sabrina, K.; Easir, A. Adsorption of Phenol from Aqueous Solution Using Activated Carbon prepared from Coconut Shell. J. Chem. Eng. 2017, 29, 9–13. [Google Scholar]
- Abdel-Ghani, N.; El-Chaghaby, G.; Helal, F. Preparation, characterization and phenol adsorption capacity of activated carbons from African beech wood sawdust. Glob. J. Environ. Sci. Manag. 2016, 2, 209–222. [Google Scholar] [CrossRef]
- Namasivayam, C.; Kavitha, D. Removal of phenol and chlorophenols from water by coir pith carbon: Equilibrium and rate studies. J. Environ. Sci. Eng. 2004, 46, 217–232. [Google Scholar] [PubMed]
- Potgieter, J.; Bada, S.; Vermaak, S. Adsorptive removal of various phenols from water by South African coal fly ash. Water SA 2009, 35, 89–96. [Google Scholar] [CrossRef] [Green Version]
- Rahel, C.; Mridula, B. Study on the removal characteristics of phenol from aqueous solution by coal fly ash. Int. J. Adv. Technol. Eng. Sci. 2014, 2, 52–66. [Google Scholar]
- Neeru, C.; Vidya, S.; Agrawal, B.; Chandrajit, B. Removal of Phenol Using Fly Ash and Impregnated Fly Ash: An Approach to Equilibrium, Kinetic, and Thermodynamic Study. Sep. Sci. Technol. 2015, 50, 690–699. [Google Scholar] [CrossRef]
- Ruiz, J.; Gallegos, S.; Juarez, G.; Miranda, G.; Rivas, L.; Regil, O. Influence of the Textural Parameters of LDH-TiO2 Composites on Phenol Adsorption and Photodegradation Capacities. Int. J. Photoenergy 2019, 2019, 5783507. [Google Scholar] [CrossRef] [Green Version]
- Nourrdine, C.; Ahcene, S.; Chater, M. Adsorption of phenol from aqueous solution onto zeolites Y modified by silylation. Comptes. Rendus Chim. 2013, 16, 222–228. [Google Scholar]
- Saravanakumar, K.; Kumar, A. Removal of phenol from aqueous solution by adsorption using zeolite. Afr. J. Agric. Res. 2013, 8, 2965–2969. [Google Scholar]
- Kragulj, M.; Tričković, J.; Kukovecz, Á.; Jović, B.; Molnar, J.; Rončević, S.; Kónya, Z.; Dalmacija, B. Adsorption of chlorinated phenols on multiwalled carbon nanotubes. RSC Adv. 2015, 5, 24920–24929. [Google Scholar] [CrossRef]
- Hadi, M.; Sahu, J.; Behzad, H.; Ahmad, B.; McKay, G.; Mubarak, M. High-performance removal of toxic phenol by single-walled and multi-walled carbon nanotubes: Kinetics, adsorption, mechanism and optimization studies. J. Ind. Eng. Chem. 2016, 35, 63–74. [Google Scholar]
- Meng, X.; Li, J.; Hu, C.; Du, J. Adsorption of phenol, p-chloro phenol and p-nitrophenol onto functional chitosan. Bioresour. Technol. 2009, 100, 1168–1173. [Google Scholar]
- Shane, L.; Frederick, J.; Shepherd, M. The Effect of Metallic Composition of Layered Double Hydroxide Clay on the Removal of Phenol from Aqueous Solution. Chem. Eng. Trans. 2020, 81, 193–198. [Google Scholar]
- Xiaoman, H.; Wang, B.; Zhang, Q. Phenols removal from water by precursor preparation for Mg-Al layered double hydroxide: Isotherm, kinetic and mechanism. Mater. Chem. Phys. 2019, 221, 108–117. [Google Scholar] [CrossRef]
- Shazryenna, D.; Piakong, M. Removal of phenol by zeolite. Trans. Sci. Technol. 2016, 3, 107–113. [Google Scholar]
- Khalid, M.; Guy, J.; Renaud, A.; Patrick, M. Removal of Phenol from Water by Adsorption Using Zeolites. Ind. Eng. Chem. Res. 2004, 43, 5275–5280. [Google Scholar] [CrossRef]
- Ba, B.; Yamni, K.; Lgaz, H.; Ramola, S.; Dehmani, Y. Enhanced removal efficiency of NaY zeolite toward phenol from aqueous solution by modification with nickel (Ni-NaY). J. Saudi Chem. Soc. 2021, 25, 101224. [Google Scholar] [CrossRef]
- Syaifullah, M.; Saputra, E.; Sun, H. Removal of Phenol Using Sulphate Radicals Activated by Natural Zeolite-Supported Cobalt Catalysts. Water Air Soil Pollut. 2013, 224, 1721. [Google Scholar] [CrossRef]
- Asgari, G.; Mohammadi, A.; Ebrahimi, A. Adsorption of phenol from aqueous solution by modified zeolite with FeCl3. Int. J. Environ. Health Eng. 2013, 2, 6. [Google Scholar] [CrossRef]
- Nan, J.; Ran, S.; Sebastiaan, G.; Luuk, C. Adsorption of triclosan, trichlorophenol and phenol by high-silica zeolites: Adsorption efficiencies and mechanisms. Sep. Purif. Technol. 2020, 235, 116152. [Google Scholar] [CrossRef]
- Hasan, B.; Duygu, O.; Ali, G.; Duran, C.; Soylak, M. Removal of phenol from aqueous solutions by adsorption onto organomodified Tirebolu bentonite: Equilibrium, kinetic and thermodynamic study. J. Hazard Mater. 2009, 172, 353–362. [Google Scholar] [CrossRef]
- Feryal, A. Sorption of phenol and 4-chlorophenol onto pumice treated with cationic surfactant. J. Environ. Manag. 2005, 74, 239–244. [Google Scholar] [CrossRef]
- Srihari, V.; Das, A. Comparative studies on adsorptive removal of phenol by three agro-based carbons: Equilibrium and isotherm studies. Ecotoxicol. Environ. Saf. 2008, 71, 274–283. [Google Scholar] [CrossRef] [PubMed]
- Gnanasundaram, N.; Rambabu, K.; Murugesan, T.; Show, P. Adsorptive removal of phenol using banyan root activated carbon. Chem. Eng. Commun. 2019, 208, 831–842. [Google Scholar] [CrossRef]
- Radhika, M.; Palanivelu, K. Adsorptive removal of chlorophenols from aqueous solution by low cost adsorbent--Kinetics and isotherm analysis. J. Hazard. Mater. 2006, 138, 116–124. [Google Scholar] [CrossRef] [PubMed]
- Sathishkumar, M.; Binupriya, A.; Yun, S.; Kavitha, D. Kinetic and isothermal studies on liquid-phase adsorption of 2,4-dichlorophenol by palm pith carbon. Bioresour. Technol. 2007, 98, 866–873. [Google Scholar] [CrossRef] [PubMed]
- Vijayaraghavan, K.; Sathishkumar, M.; Yun, E.; Choi, J.; Binupriya, A. Porogen effect on characteristics of banana pith carbon and the sorption of dichlorophenols. J. Colloid Interface Sci. 2008, 320, 22–29. [Google Scholar] [CrossRef]
- Yan, M.; Gao, N.; Chu, W.; Cong, L. Removal of phenol by powdered activated carbon adsorption. Front. Environ. Sci. Eng. 2013, 7, 158–165. [Google Scholar]
- Jun, T.; Huo, P.; Fu, Z.; Zhang, J.; Yang, Z.; Zhang, D. Characterization and phenol adsorption performance of activated carbon prepared from tea residue by NaOH activation. Environ. Technol. 2017, 40, 171–181. [Google Scholar] [CrossRef]
- Riaz, Q.; Abdul, R. A Study of the Adsorption of Phenol by Activated Carbon from Aqueous Solutions. Turk. J. Chem. 2002, 26, 357–361. [Google Scholar]
- Vimal, C.; Swamy, M.; Indra, M.; Prasad, B.; Mishra, M. Adsorptive removal of phenol by bagasse fly ash and activated carbon: Equilibrium, kinetics and thermodynamics. Colloids Surf. A Phys. Chem. Eng. Asp. 2006, 272, 89–104. [Google Scholar]
- Mitali, S.; Kumar, A. Use of fly ash for the removal of phenol and its analogues from contaminated water. Waste Manag. 2006, 26, 559–570. [Google Scholar] [CrossRef]
- Ugurlu, M.; Gurses, A.; Yalcin, M. Removal of Phenolic and Lignin Compounds from Bleached Kraft Mill Effluent by Fly Ash and Sepiolite. Adsorption 2005, 11, 87–97. [Google Scholar] [CrossRef]
- Shaokui, Z.; Yang, Z.; Do, J.; Yun, P. Removal of chlorophenols from groundwater by chitosan sorption. Water Res. 2004, 38, 2315–2322. [Google Scholar]
- Santos, D.; Rainer, H.; Rennio, F.; Gilson, B. Pesticides removal from industrial wastewater by a membrane bioreactor and post-treatment with either activated carbon, reverse osmosis or ozonation. J. Environ. Chem. Eng. 2020, 8, 104538. [Google Scholar] [CrossRef]
- Goh, P.; Ahmad, N.; Ismail, A.; Wong, W. Membrane technology for pesticide removal from aquatic environment: Status quo and way forward. Chemosphere 2022, 307, 136018. [Google Scholar] [CrossRef]
- Hanif, H.; Hashimi, R.; Ryan, Q. Toxic Effects of Pesticides on Humans, Plants, Animals, Pollinators and Beneficial Organisms. Asian Plant Res. J. 2020, 5, 37–47. [Google Scholar] [CrossRef]
- Vinay, K.; Ravi, S.; Prem, N.; Jai, K.; Fethiye, G.; Yogesh, C. Removal of Malathion from Aqueous Solutions and Waste Water Using Fly Ash. J. Water Resour. Prot. 2010, 2, 322–330. [Google Scholar]
- Jude, C.; Felix, C.; Augustine, A. Kinetics and Equilibrium Isotherms of Pesticides Adsorption onto Boiler Fly Ash. Terr. Aquat. Environ. Toxicol. 2012, 6, 21–29. [Google Scholar]
- Smedt, C.; Ferrer, F.; Leus, K.; Spanoghe, P. Removal of Pesticides from Aqueous Solutions by Adsorption on Zeolites as Solid Adsorbents. Adsorp. Sci. Technol. 2015, 33, 457–485. [Google Scholar] [CrossRef] [Green Version]
- Shattar, S.; Zakaria, N.; Foo, K. Utilization of montmorillonite as a refining solution for the treatment of ametryn, a second generation of pesticide. J. Environ. Chem. Eng. 2017, 5, 3235–3242. [Google Scholar] [CrossRef]
- Salman, M.; Hameed, H. Adsorption of 2,4-dichlorophenoxyacetic acid and carbofuran pesticides onto granular activated carbon. Desalination 2010, 256, 129–135. [Google Scholar] [CrossRef]
- Ignatowicz, K. A mass transfer model for the adsorption of pesticide on coconut shell based activated carbon. Int. J. Heat Mass Transfer. 2011, 54, 4931–4938. [Google Scholar] [CrossRef]
- Salman, M.; Nnoku, V.; Hameed, H. Bentazon and carbofuran adsorption onto date seed activated carbon: Kinetics and equilibrium. Chem. Eng. J. 2011, 173, 361–368. [Google Scholar] [CrossRef]
- Salman, M. Optimization of preparation conditions for activated carbon from palm oil fronds using response surface methodology on removal of pesticides from aqueous solution. Arab. J. Chem. 2014, 7, 101–108. [Google Scholar] [CrossRef] [Green Version]
- Mandal, A.; Kumar, A.; Singh, N. Sorption mechanisms of pesticides removal from effluent matrix using biochar: Conclusions from molecular modelling studies validated by single-, binary and ternary solute experiments. J. Environ. Manag. 2021, 295, 113104. [Google Scholar] [CrossRef] [PubMed]
- Ourania, A.; Albanis, T.; Islam, M.; George, S. Preparation of activated carbons from agricultural residues for pesticide adsorption. Chemosphere 2010, 80, 1328–1336. [Google Scholar]
- Gholamreza, M.; Hiwa, H.; Ahmad, A. The investigation of diazinon pesticide removal from contaminated water by adsorption onto NH4Cl-induced activated carbon. Chem. Eng. J. 2013, 214, 172–179. [Google Scholar]
- Elcin, D.; Elif, C. Adsorption of 2,4-dichlorophenoxyacetic acid on peanut shells: Effect of initial concentration. Environ. Res. Technol. 2018, 1, 23–26. [Google Scholar]
- Mira, P.; Stojic, N.; Igor, K. Removal of pesticides from water using zeolites. Kuwait J. Sci. 2017, 44, 99–105. [Google Scholar]
- Hartini, W.; Ahmad, J.; Ali, N.; Endut, A. Study on the removal of pesticide in agricultural run off by granular activated carbon. Bioresour. Technol. 2011, 102, 5312–5318. [Google Scholar]
- Ajoy, S.; Shabeer, A.; Suman, G.; Kumar, R. Removal of mixed pesticides from aqueous solutions using organoclays: Evaluation of equilibrium and kinetic model. Bull. Environ. Contam. Toxicol. 2013, 91, 111–116. [Google Scholar] [CrossRef]
- Roya, M.; Azam, K.; Rad, M. Highly efficient removal of paraquat pesticide from aqueous solutions using a novel nano Kaolin modified with sulfuric acid via host–guest interactions. J. Incl. Phenom. Macrocycl. Chem. 2020, 96, 307–313. [Google Scholar]
- Ouardi, E.; Said, A.; Ali, A.; Jamaa, D. Removal of Carbaryl Pesticide from Aqueous Solution by Adsorption on Local Clay in Agadir. Am. J. Anal. Chem. 2013, 4, 72–79. [Google Scholar] [CrossRef] [Green Version]
- Sergio, S.; Pero, J.; Ruiz, A.; Nuno, R.; Alves, A. Organochlorine pesticides removal from wastewater by pine bark adsorption after activated sludge treatment. Environ. Technol. 2011, 32, 673–683. [Google Scholar] [CrossRef]
- Oyarce, E.; Rivas, L.; Sotelo, S.; Plinio, C. Removal of Dyes by Polymer-Enhanced Ultrafiltration: An Overview. Polymers 2021, 13, 3450. [Google Scholar] [CrossRef]
- Chen, Y.; Ooi, W.; Hoe, B.; Chai, W.; Chiu, C. Removal of Ionic Dyes by Nanofiber Membrane Functionalized with Chitosan and Egg White Proteins: Membrane Preparation and Adsorption Efficiency. Membranes 2022, 12, 63. [Google Scholar] [CrossRef]
- Available online: https://www.globenewswire.com/news-release/2020/02/24/1989226/0/en/global-synthetic-dyes-market-outlook-2020-2030.html (accessed on 2 September 2022).
- Rana, K.; Faris, H.; Muayad, A.; Alberto, F. Removal of Dyes Using Graphene Oxide (GO) Mixed Matrix Membranes. Membranes 2020, 10, 366. [Google Scholar] [CrossRef]
- Available online: https://www.businesswire.com/news/home/20190219005492/en/Global-Dyes-Market-by-Type-Application-Region-and-Country---Forecast-to-2022---ResearchAndMarkets.com (accessed on 2 September 2022).
- Marmagne, O.; Coste, C. Color removal from textile plant effluents. Am. Dyest. Rep. 1996, 85, 15–21. [Google Scholar]
- Average Price of Kaolin. Available online: https://www.statista.com/statistics/248194/average-price-of-kaolin/#:~:text=The%20average%20kaolin%20price%20in,are%20found%20in%20central%20Georgia.&text=Kaolinite%20is%20a%20clay%20mineral,%2C%20orange%2C%20and%20yellow%20tints (accessed on 18 September 2022).
- Muthulakshmi, N.; Thangamani, K. Removal of Direct Dye using Activated Carbon Prepared from Prosopis juliflora Bark: Isothermal, Thermodynamic and Kinetic Studies. Chem. Sci. Rev. Lett. 2016, 5, 182–191. [Google Scholar]
- Ghani, N.; Lima, C.; Rawash, A.; Ghadir, A. Adsorption of coomassie brilliant blue R-250 dye onto novel activated carbon prepared from nigella sativa L waste: Equilibrium, kinetics and thermodynamics. J. Chil. Chem. Soc. 2017, 62, 3505–3511. [Google Scholar] [CrossRef]
- Pinedo, S.; Mendieta, S.; Segura, E.; Rios, S. Efficient removal of brilliant blue by clinoptilolite tuff modified with Fe3+ and Fe–Cu nanoparticles. Desalin. Water Treat. 2019, 144, 300–310. [Google Scholar] [CrossRef]
- Litefti, K.; Freire, M.; Stitou, M. Adsorption of an anionic dye (Congo red) from aqueous solutions by pine bark. Sci. Rep. 2019, 9, 16530. [Google Scholar] [CrossRef] [Green Version]
- Bazrafshan, E.; Mostafapour, K.; Mahvi, H. Decolorization of reactive red 198 by adsorption onto ZnCl2 activated pistachio hull wastes. Int. J. Environ. Health Eng. 2014, 3, 7. [Google Scholar] [CrossRef]
- Xavier, A.; Pandi, M. Adsorption of Reactive Green and Reactive Red Dyes from the Aqueous Solution using Activated Carbons. Int. J. Sci. Res. 2015, 4, 454–459. [Google Scholar]
- Edris, B.; Amir, M.; Morteza, A. Reactive red-120 removal by activated carbon obtained from cumin herb wastes. Freseniu Environ. Bull. 2013, 22, 584–590. [Google Scholar]
- Adaobi, I.; Joseph, T.; Dominic, O. Adsorptive Removal of Vat Yellow 4 on Activated Mucuna pruriens (Velvet Bean) Seed Shells Carbon. Asian J. Chem. Sci. 2016, 1, 1–16. [Google Scholar]
- Ahmad, A.; Hameed, H.; Ahmad, L. Removal of disperse dye from aqueous solution using waste-derived activated carbon: Optimization study. J. Hazard. Mater. 2009, 170, 62–619. [Google Scholar] [CrossRef]
- Markandeya, S.; Sheo, P.; Lal, A. Removal of Disperse Orange and Disperse Blue dyes present in textile mill effluent using zeolite synthesized from cenospheres. Water Sci. Technol. 2021, 84, 445–457. [Google Scholar] [CrossRef] [PubMed]
- Jan, S.; Ahmad, A.; Khan, A. Removal of azo dye from aqueous solution by a low-cost activated carbon prepared from coal: Adsorption kinetics, isotherms study, and DFT simulation. Environ. Sci. Pollut. Res. 2021, 28, 10234–10247. [Google Scholar] [CrossRef]
- Abbasi, M.; Habibi, M. Optimization and characterization of Direct Blue 71 removal using nanocomposite of Chitosan-MWCNTs: Central composite design modeling. J. Taiwan Inst. Chem. Eng. 2016, 62, 112–121. [Google Scholar] [CrossRef]
- Ainoa, S.; Jose, A.; Maria, I.; Estrella, N.; Jose, G. Egg By-Products as a Tool to Remove Direct Blue 78 Dye from Wastewater: Kinetic, Equilibrium Modeling, Thermodynamics and Desorption Properties. Materials 2020, 13, 1262. [Google Scholar] [CrossRef]
- Setareh, M.; Omid, M. The study of thermodynamics and kinetics methyl orange and malachite green by SWCNTs, SWCNT-COOH and SWCNT-NH2 as adsorbents from aqueous solution. J. Ind. Eng. Chem. 2014, 20, 3186–3194. [Google Scholar] [CrossRef]
- Ramazan, B.; Bingu, l.; Nas, M.; Mehmet, H.; Sen, F. Synthesis and application of AuNi@AC nano adsorbents for the removal of Maxilon Blue 5G azo dye from aquatic mediums. Food Chem. Toxicol. 2022, 167, 113303. [Google Scholar] [CrossRef]
- Alkaim, A.; Sadik, Z.; Mahdi, D. Preparation, structure and adsorption properties of synthesized multiwall carbon nanotubes for highly effective removal of maxilon blue dye. Korean J. Chem. Eng. 2015, 32, 2456–2462. [Google Scholar] [CrossRef]
- Junaidi, H.; Shahri, M.; Ashrul, A.; Nurul, A.; Eny, K. Adsorption of Acid Blue 25 on Agricultural Wastes: Efficiency, Kinetics, Mechanism, and Regeneration. Air Soil Water Res. 2021, 14, 11786221211057496. [Google Scholar] [CrossRef]
- Mark, J.; Wan, Z. Adsorption of Acid Orange 33 Dye by Bentonite and Surfactant Modified Bentonite. Asian J. Chem. 2018, 30, 2383–2388. [Google Scholar]
- Malik, P. Use of activated carbons prepared from sawdust and rice-husk for adsorption of acid dyes: A case study of Acid Yellow 36. Dyes Pigm. 2003, 56, 239–249. [Google Scholar] [CrossRef]
- Kaustubha, M.; Naidu, J.; Meikap, B.; Biswas, M. Removal of Crystal Violet from Wastewater by Activated Carbons Prepared from Rice Husk. Ind. Eng. Chem. Res. 2006, 45, 14, 5165–5171. [Google Scholar]
- Shirmardi, M.; Mahvi, A.; Hashemzadeh, B. The adsorption of malachite green (MG) as a cationic dye onto functionalized multi walled carbon nanotubes. Korean J. Chem. Eng. 2013, 30, 1603–1608. [Google Scholar] [CrossRef]
- Shirani, M.; Semnani, A.; Haddadi, H. Optimization of Simultaneous Removal of Methylene Blue, Crystal Violet, and Fuchsine from Aqueous Solutions by Magnetic NaY Zeolite Composite. Water Air Soil Pollut. 2014, 225, 2054. [Google Scholar] [CrossRef]
- Unal, G.; Ozcan, G.; Gizem, C. Removal of Methylene Blue from Aqueous Solution by Activated Carbon Prepared from Pea Shells (Pisum sativum). J. Chem. 2013, 2013, 614083. [Google Scholar] [CrossRef] [Green Version]
- Lunhong, A.; Zhang, C.; Wang, Y.; Li, M.; Meng, L. Removal of methylene blue from aqueous solution with magnetite loaded multi-wall carbon nanotube: Kinetic, isotherm and mechanism analysis. J. Hazard. Mater. 2011, 198, 282–290. [Google Scholar]
- Belachew, N.; Hinsene, H. Preparation of Zeolite 4A for Adsorptive Removal of Methylene Blue: Optimization, Kinetics, Isotherm, and Mechanism Study. Silicon 2022, 14, 1629–1641. [Google Scholar] [CrossRef]
- Mansour, A.; Abeer, E.; Attia, A.; Beheary, S. Brilliant Green Dye Biosorption Using Activated Carbon Derived from Guava Tree Wood. Int. J. Chem. Eng. 2020, 2020, 8053828. [Google Scholar] [CrossRef]
- Raziq, M.; Lim, C.; Roshan, T.; Chau, Y.; Abdul, H. Machine learning approaches to predict adsorption capacity of Azolla pinnata in the removal of methylene blue. J. Taiwan Inst. Chem. Eng. 2022, 132, 104134. [Google Scholar] [CrossRef]
- Lu, Y.; Raziq, M.; Linda, L.; Namal, P. Effective and Simple NaOH-Modification Method to Remove Methyl Violet Dye via Ipomoea aquatica Roots. Adsorp. Sci. Technol. 2021, 2021, 5932222. [Google Scholar] [CrossRef]
- Kooh, M.; Dahri, M.; Lim, L. Removal of methyl violet 2B dye from aqueous solution using Nepenthes rafflesiana pitcher and leaves. Appl. Water Sci. 2017, 7, 3859–3868. [Google Scholar] [CrossRef] [Green Version]
- Mousavi, S.; Kamarehie, B.; Almasi, A. Removal of Rhodamine B from aqueous solution by stalk corn activated carbon: Adsorption and kinetic study. Biomass Conv. Bioref. 2021. [Google Scholar] [CrossRef]
- Cheng, W.; Li, N.; Pan, Y.; Jin, L. The Adsorption of Rhodamine B in Water by Modified Zeolites. Mod. Appl. Sci. 2016, 10, 67–76. [Google Scholar] [CrossRef] [Green Version]
- Kumar, S.; Gaurav, B.; Kavita, J.; Neeraj, D. Utilization of carbon nanotubes for the removal of rhodamine B dye from aqueous solutions. J. Nanosci. Nanotechnol. 2014, 14, 4331–4336. [Google Scholar] [CrossRef]
- Bahram, M.; Talebi, R.; Naseri, A.; Nouri, S. Modeling and Optimization of removal of rhodamine B from wastewaters by adsorption on modified clay. Chiang Mai J. Sci. 2014, 41, 1230–1240. [Google Scholar]
- Marcelo, L.; Silva, J.; Samuel, C. Design, Cost Estimation and Sensitivity Analysis for a Production Process of Activated Carbon from Waste Nutshells by Physical Activation. Processes 2020, 8, 945. [Google Scholar] [CrossRef]
- Chilton, N.; Wayne, E.; Rao, M.; Losso, N. Activated carbon from pecan shell: Process description and economic analysis. Ind. Crops Prod. 2003, 17, 209–217. [Google Scholar]
- Keith, C.; John, P.; Gordon, M. Production of activated carbon from bamboo scaffolding waste-process design, evaluation and sensitivity analysis. Chem. Eng. J. 2005, 109, 147–165. [Google Scholar]
- Jia, L.; Lock, H. The production cost analysis of oil palm waste activated carbon: A pilot-scale evaluation. Greenh. Gases. 2020, 10, 999–1026. [Google Scholar] [CrossRef]
- Ng, C.; Ramu, M.; Wayne, M. Granular Activated Carbons from Agricultural By-Products: Process Description and Estimated Cost of Production. Bulletin Number 881, 2003, LSU AgCenter Bulletins, Louisiana State University. Available online: https://digitalcommons.lsu.edu/cgi/viewcontent.cgi?article=1034&context=agcenter_bulletins (accessed on 18 September 2022).
- Zahra, A.; Mohsen, M.; Habibollah, Y. The feasibility of cost-effective manufacturing activated carbon derived from walnut shells for large-scale CO2 capture. Environ. Sci. Pollut. Res. 2019, 26, 26542–26552. [Google Scholar] [CrossRef]
- Ozsoy, H.; Leeuwen, J. Removal of color from fruit candy waste by activated carbon adsorption. J. Food Eng. 2010, 101, 106–112. [Google Scholar] [CrossRef]
- Thomas, K.; Lynda, H.; Isabel, M. Activated carbons from flax shive and cotton gin waste as environmental adsorbents for the chlorinated hydrocarbon trichloroethylene. Bioresour. Technol. 2009, 100, 5045–5050. [Google Scholar]
- Tinnabhop, S.; Wanwisa, S. Economic comparative evaluation of combination of activated carbon generation and spent activated carbon regeneration plants. J. Eng. Sci. Technol. 2017, 12, 3329–3343. [Google Scholar]
- Ahmaruzzaman, M. A review on the utilization of fly ash. Prog. Energy Combust. Sci. 2010, 36, 327–363. [Google Scholar] [CrossRef]
- Sanchez, R. Sustainable Asphalt Pavement: Application of Slaughterhouse Waste Oil and Fly Ash in Asphalt Binder. Master’s Thesis, Texas A&M University, Kingsville, TX, USA, 2014; ProQuest Dissertations Publishing, Ann Arbor, MI, USA; p. 1573599. [Google Scholar]
- Jaime, L.; Shin, K.; Kawi, S.; Wang, C. Conversion of Coal Fly Ash into Zeolite Materials: Synthesis and Characterizations, Process Design, and Its Cost-Benefit Analysis. Ind. Eng. Chem. Res. 2017, 56, 11565–11574. [Google Scholar]
- Biniwale, R.; Sadhana, R.; Hasan, M. Cost estimates for production of fly ash based zeolite—A. J. Sci. Ind. Res. 2001, 60, 574–579. [Google Scholar]
- Ihab, H.; Jian, Z. Simulation of Synthetic Zeolites-4A and 5A Manufacturing for Green Processing. Eng. Sci. Technol. Int. J. 2012, 2, 188–195. [Google Scholar]
- Keka, O.; Narayan, C.; Amar, S. Zeolite from fly ash: Synthesis and characterization. Bull. Mater. Sci. 2004, 27, 555–564. [Google Scholar]
- Sapawe, N.; Jalil, A.; Karim, A.; Jusoh, R. Cost-effective microwave rapid synthesis of zeolite NaA for removal of methylene blue. Chem. Eng. J. 2013, 229, 388–398. [Google Scholar] [CrossRef]
- CNT Composites: Cost and Production. Available online: https://sites.google.com/site/cntcomposites/cost-and-production#:~:text=The%20cost%20of%20carbon%20nanotubes,%24%2020%2D2000%2Fg (accessed on 18 September 2022).
Figure 1.
Monolayer (a) and multilayer formation (b) [11].
Figure 1.
Monolayer (a) and multilayer formation (b) [11].

Figure 2.
Physical adsorption (a) and chemical adsorption (b) [11].
Figure 2.
Physical adsorption (a) and chemical adsorption (b) [11].

Figure 3.
Chitin content can be observed in various sources [15].
Figure 3.
Chitin content can be observed in various sources [15].

Figure 4.
Production of chitosan after deacetylation of chitin via alkaline treatment [15].
Figure 4.
Production of chitosan after deacetylation of chitin via alkaline treatment [15].

Figure 5.
Chemical structure of chitosan and chitin [15].
Figure 5.
Chemical structure of chitosan and chitin [15].

Figure 6.
Scanning electron microscopy image (a) and particle size distribution (b) of the coal fly ash [22].
Figure 6.
Scanning electron microscopy image (a) and particle size distribution (b) of the coal fly ash [22].

Figure 7.
Internal view of single-walled carbon nanotube (SWCNT) and multi-walled nanotube (MWCNT) [24].
Figure 7.
Internal view of single-walled carbon nanotube (SWCNT) and multi-walled nanotube (MWCNT) [24].

Figure 8.
Global consumption of activated carbon in 2020 [45].
Figure 8.
Global consumption of activated carbon in 2020 [45].

Figure 9.
Primary and secondary building units of zeolites [48].
Figure 9.
Primary and secondary building units of zeolites [48].


Figure 10.
The cationic surfactant on surface of zeolite can remove cation ion (a), anion ion (b), and organic ion (c) [50].
Figure 10.
The cationic surfactant on surface of zeolite can remove cation ion (a), anion ion (b), and organic ion (c) [50].


Figure 11.
Phenol adsorption onto calcined LDH clay: Langmuir model and Freundlich isotherm [55].
Figure 11.
Phenol adsorption onto calcined LDH clay: Langmuir model and Freundlich isotherm [55].


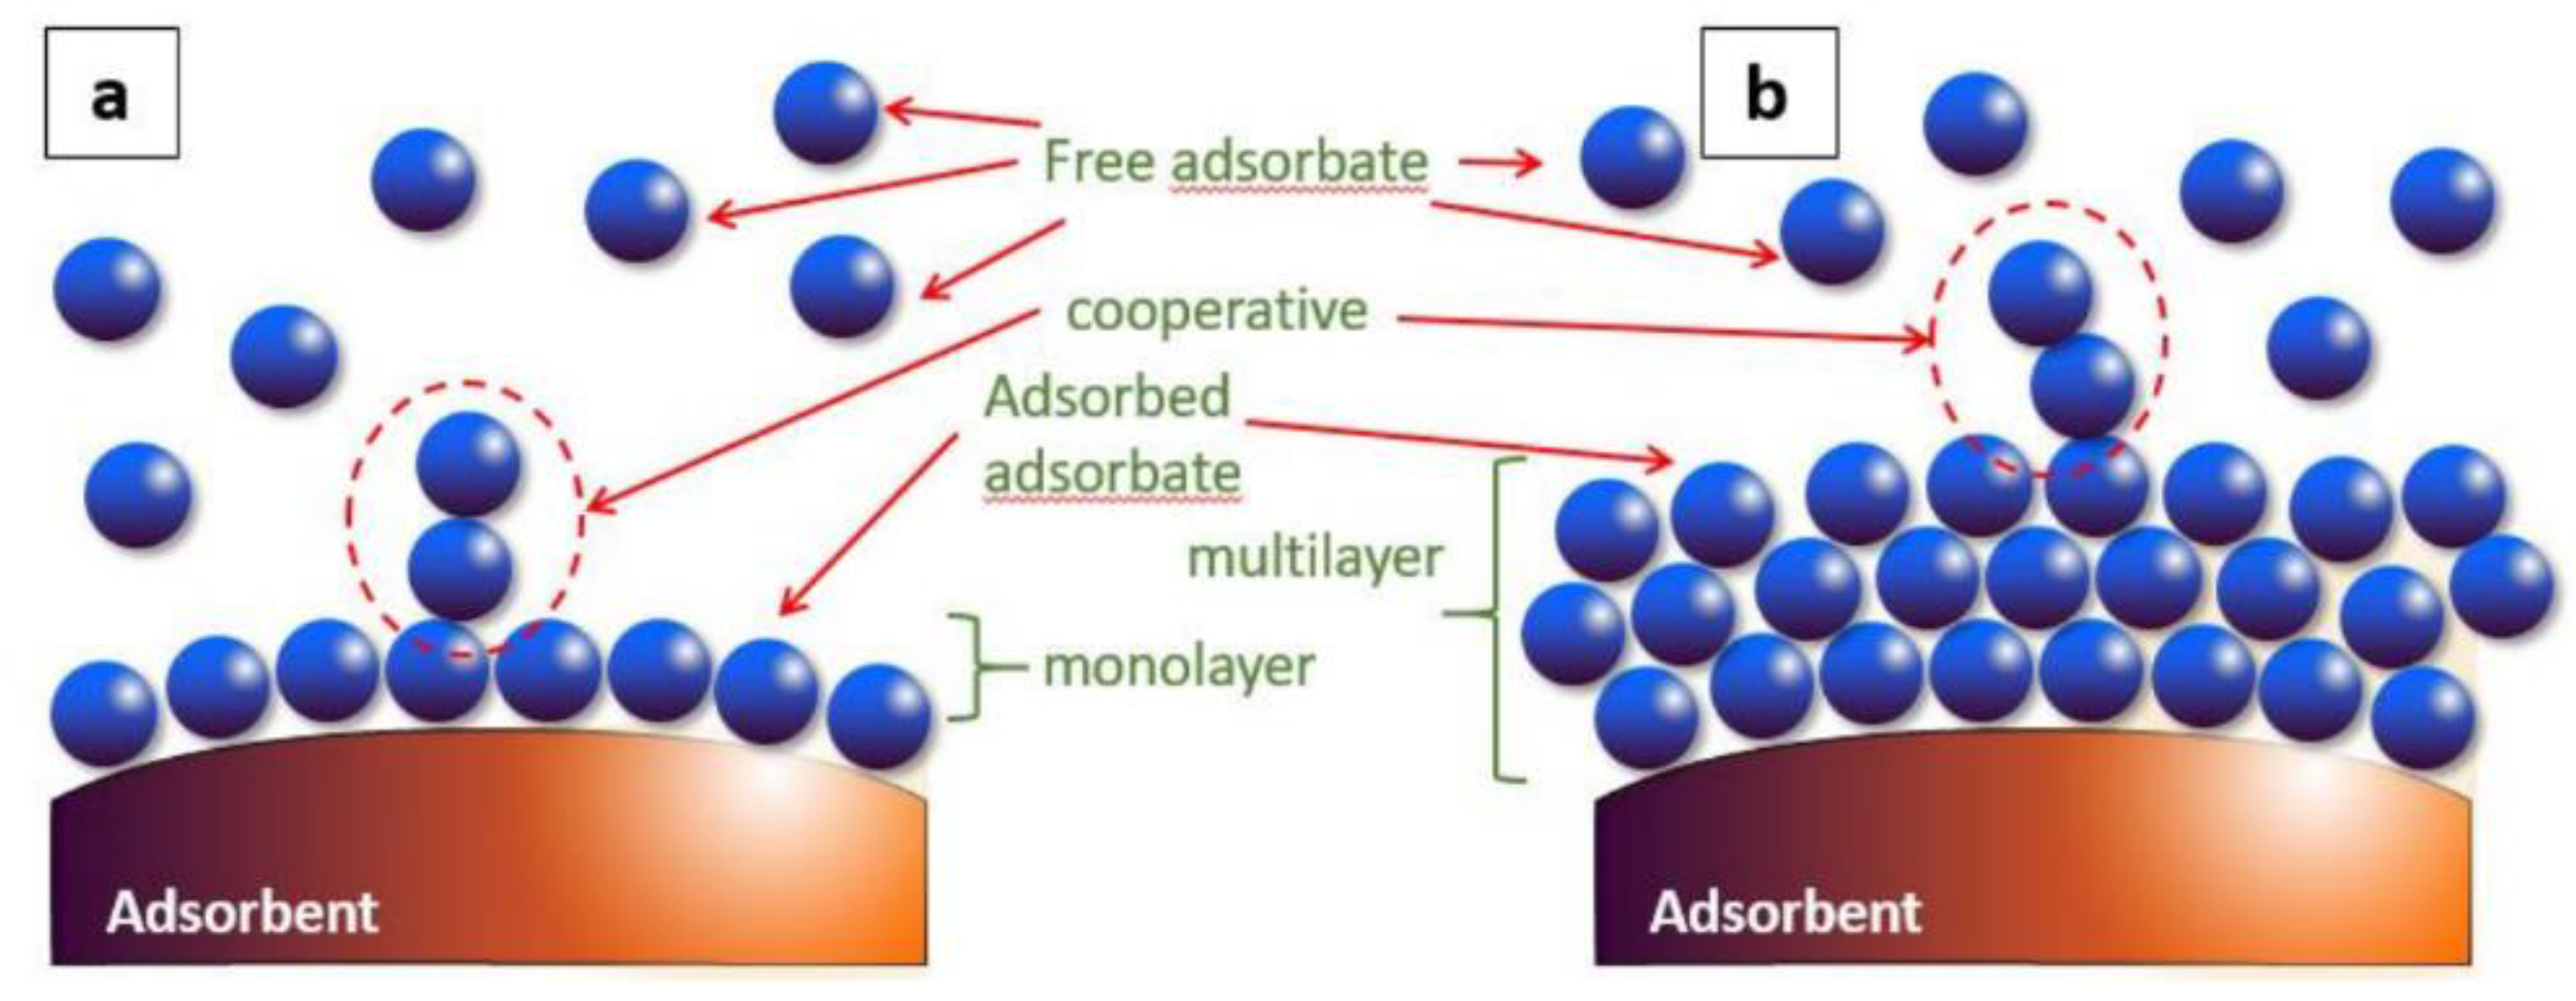
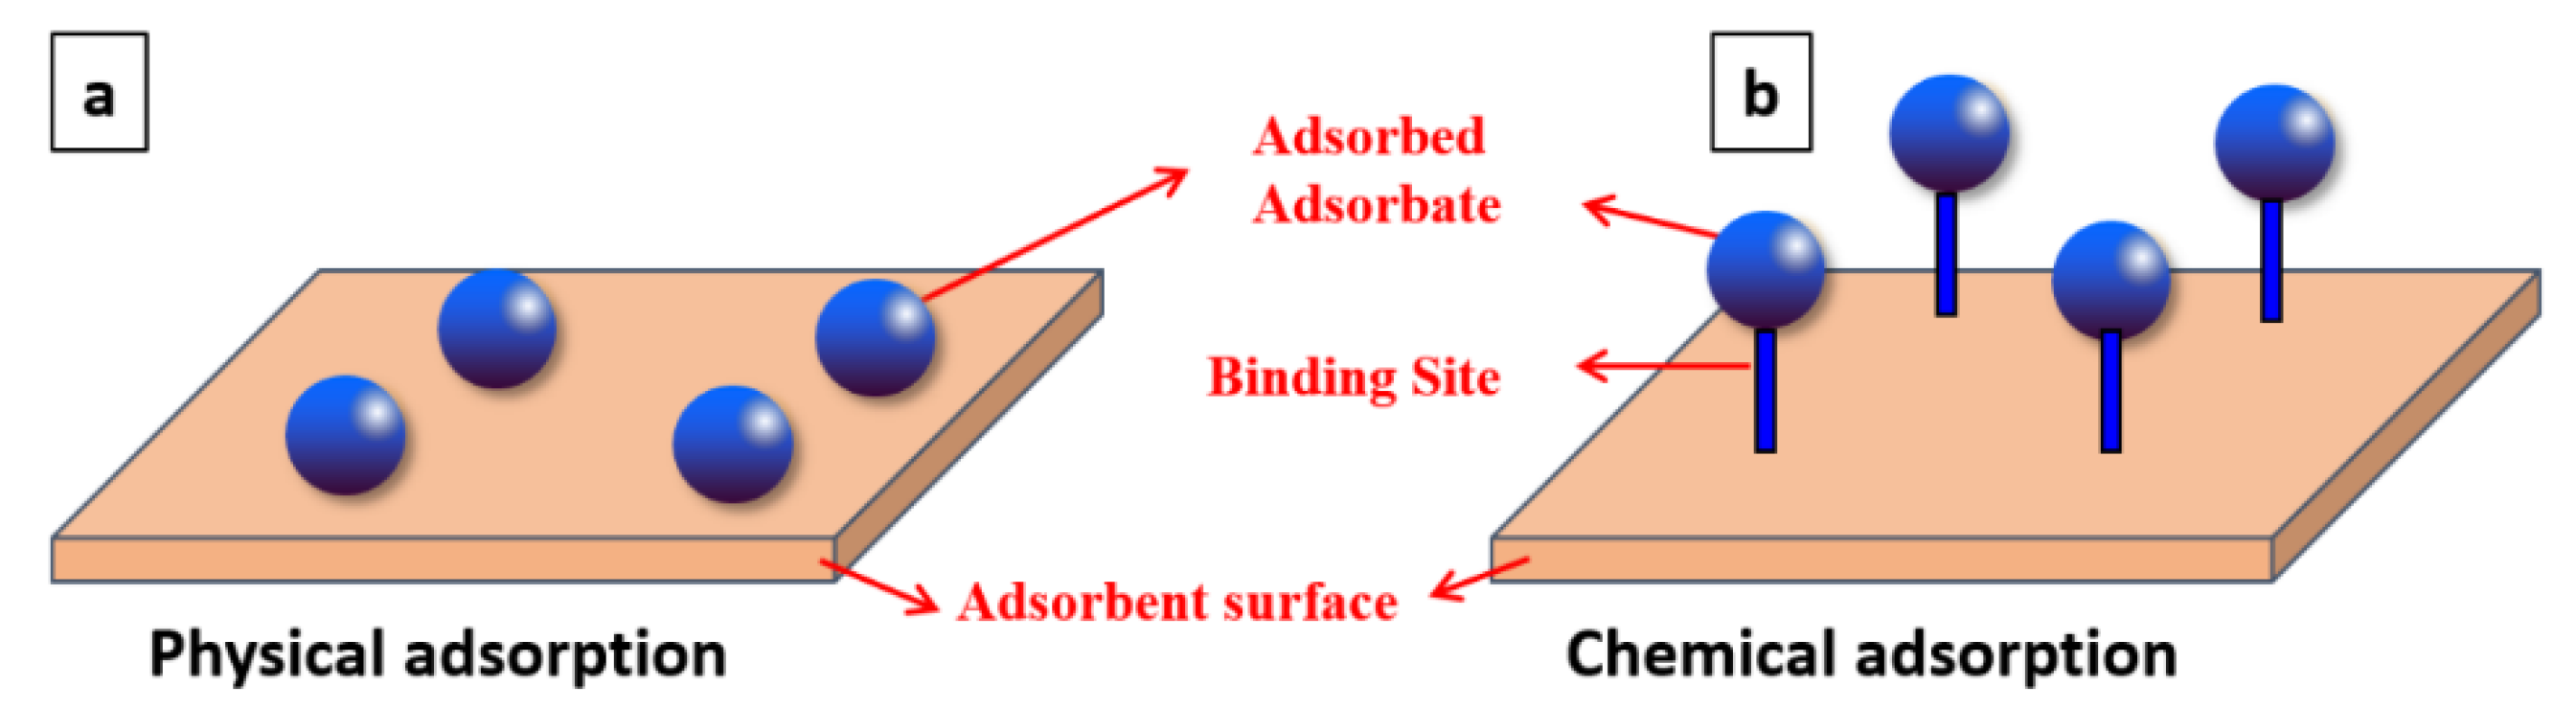
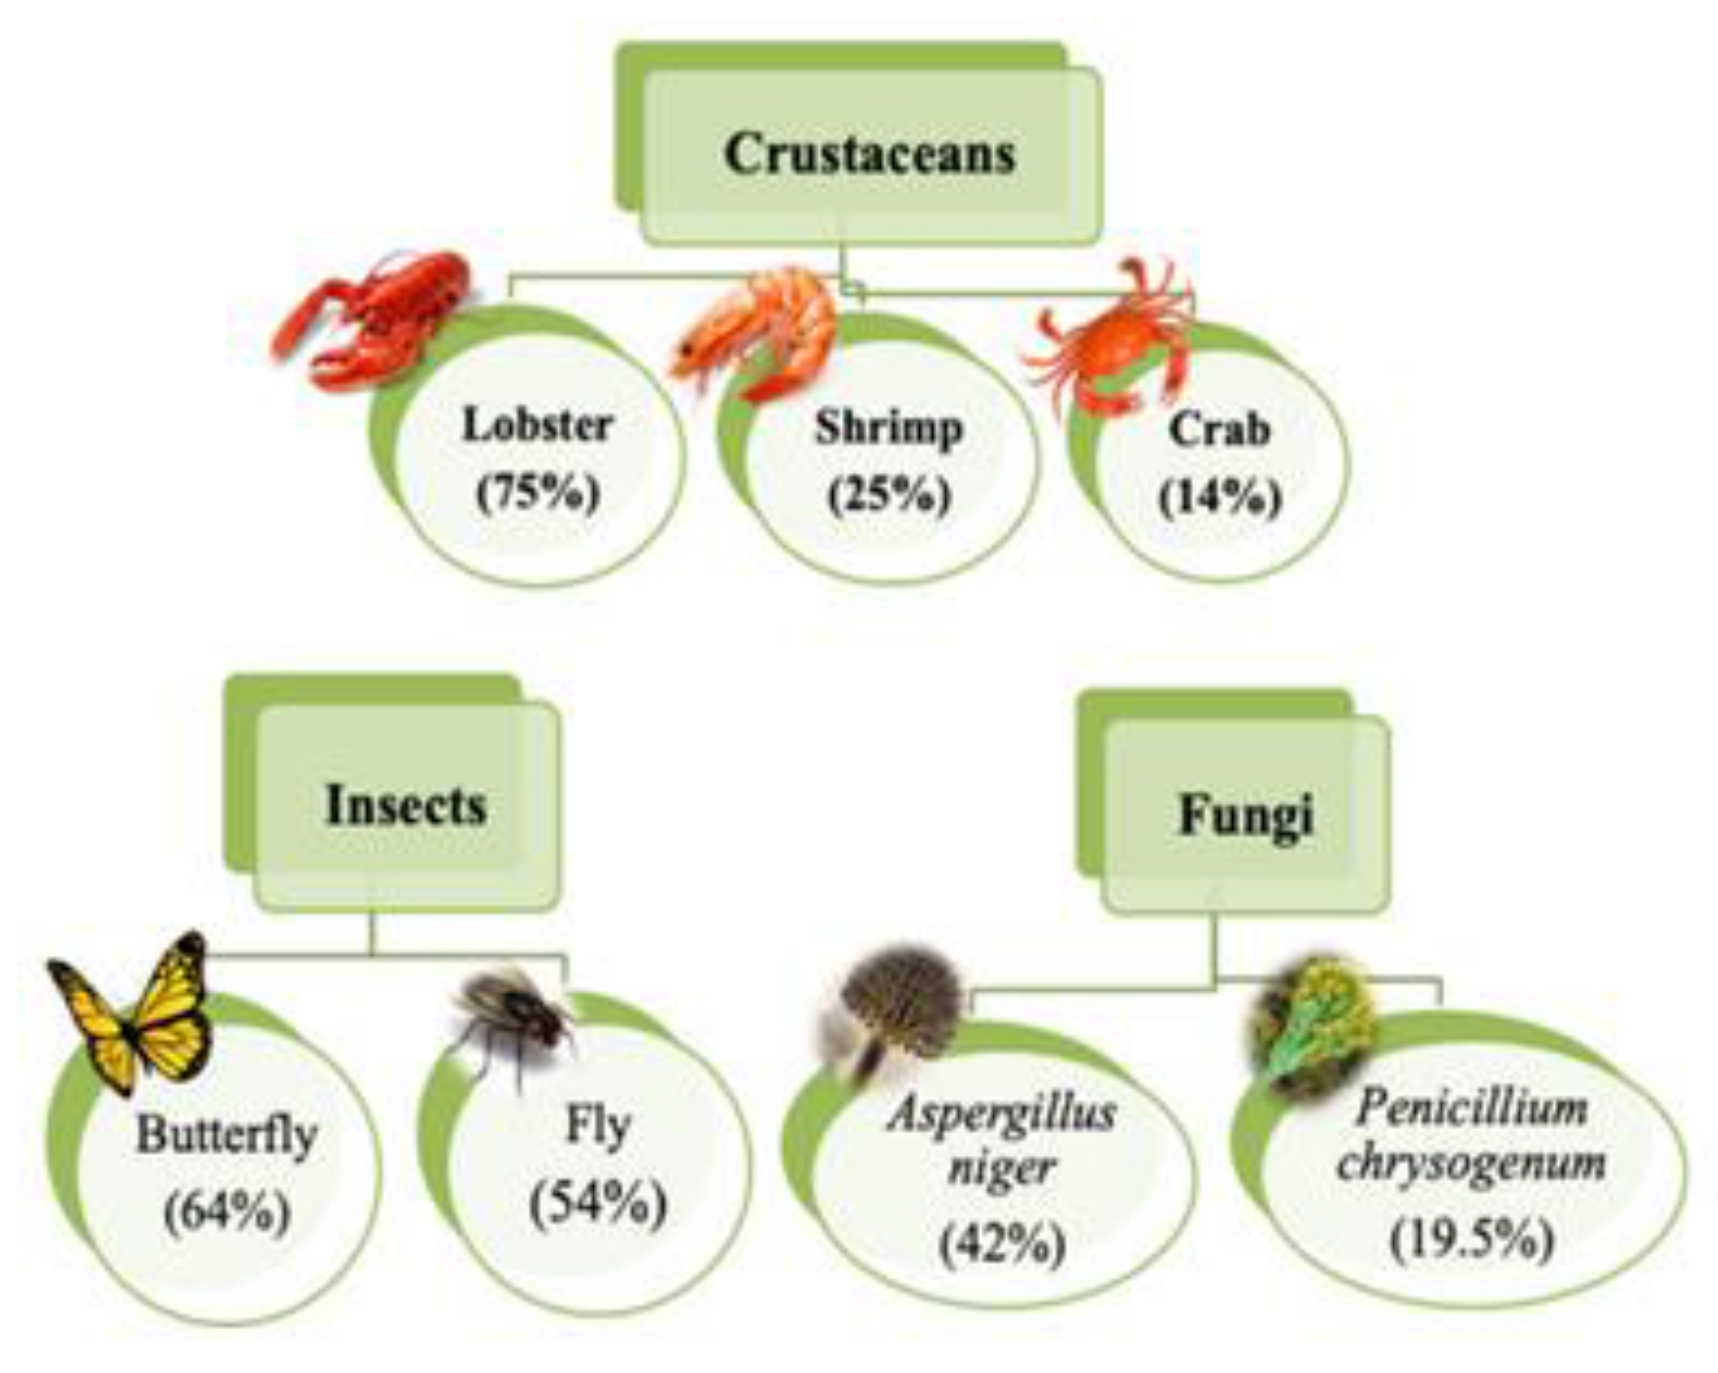
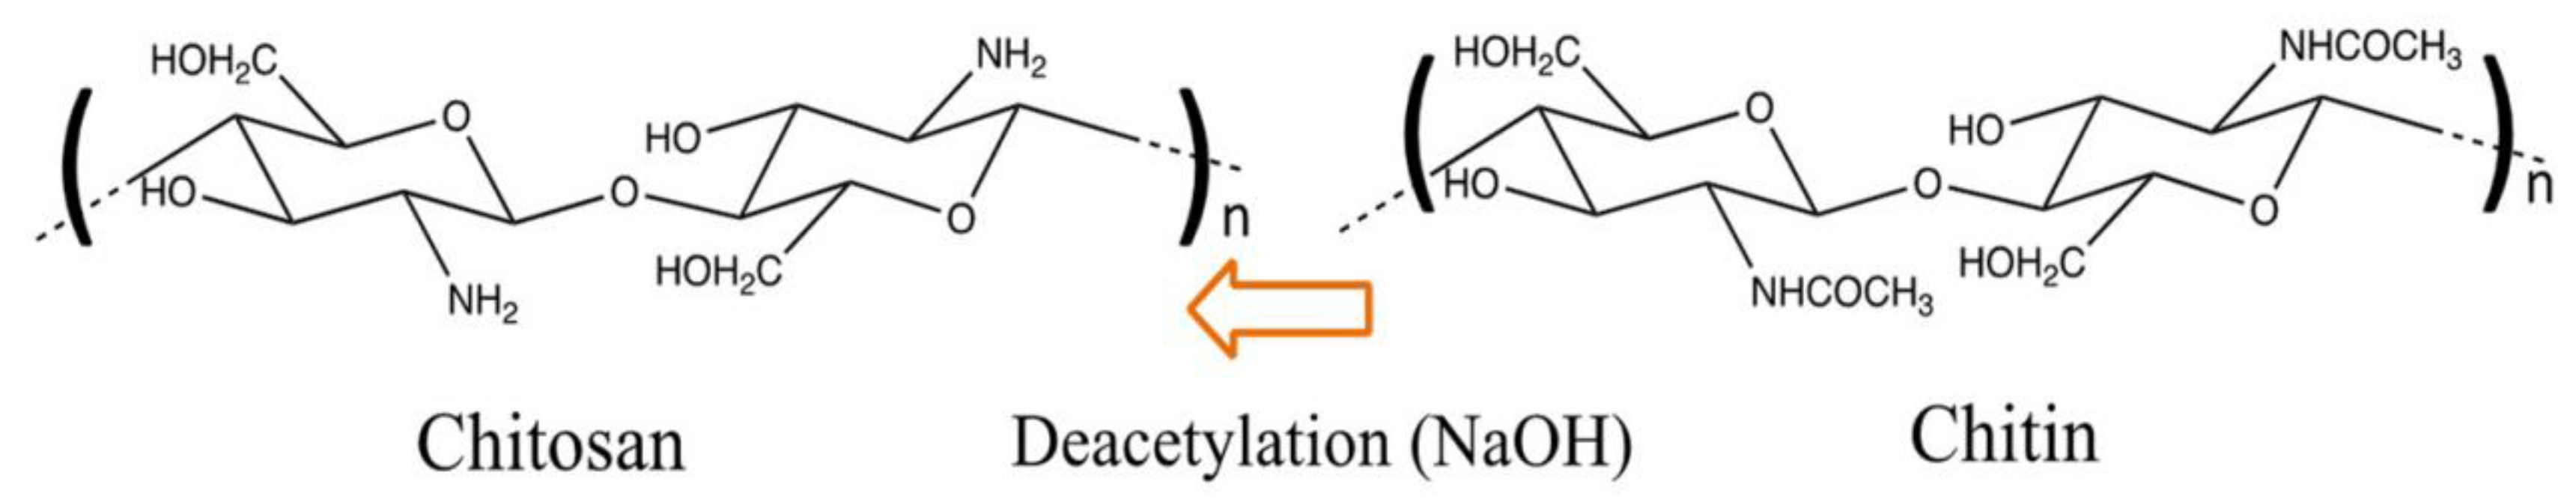
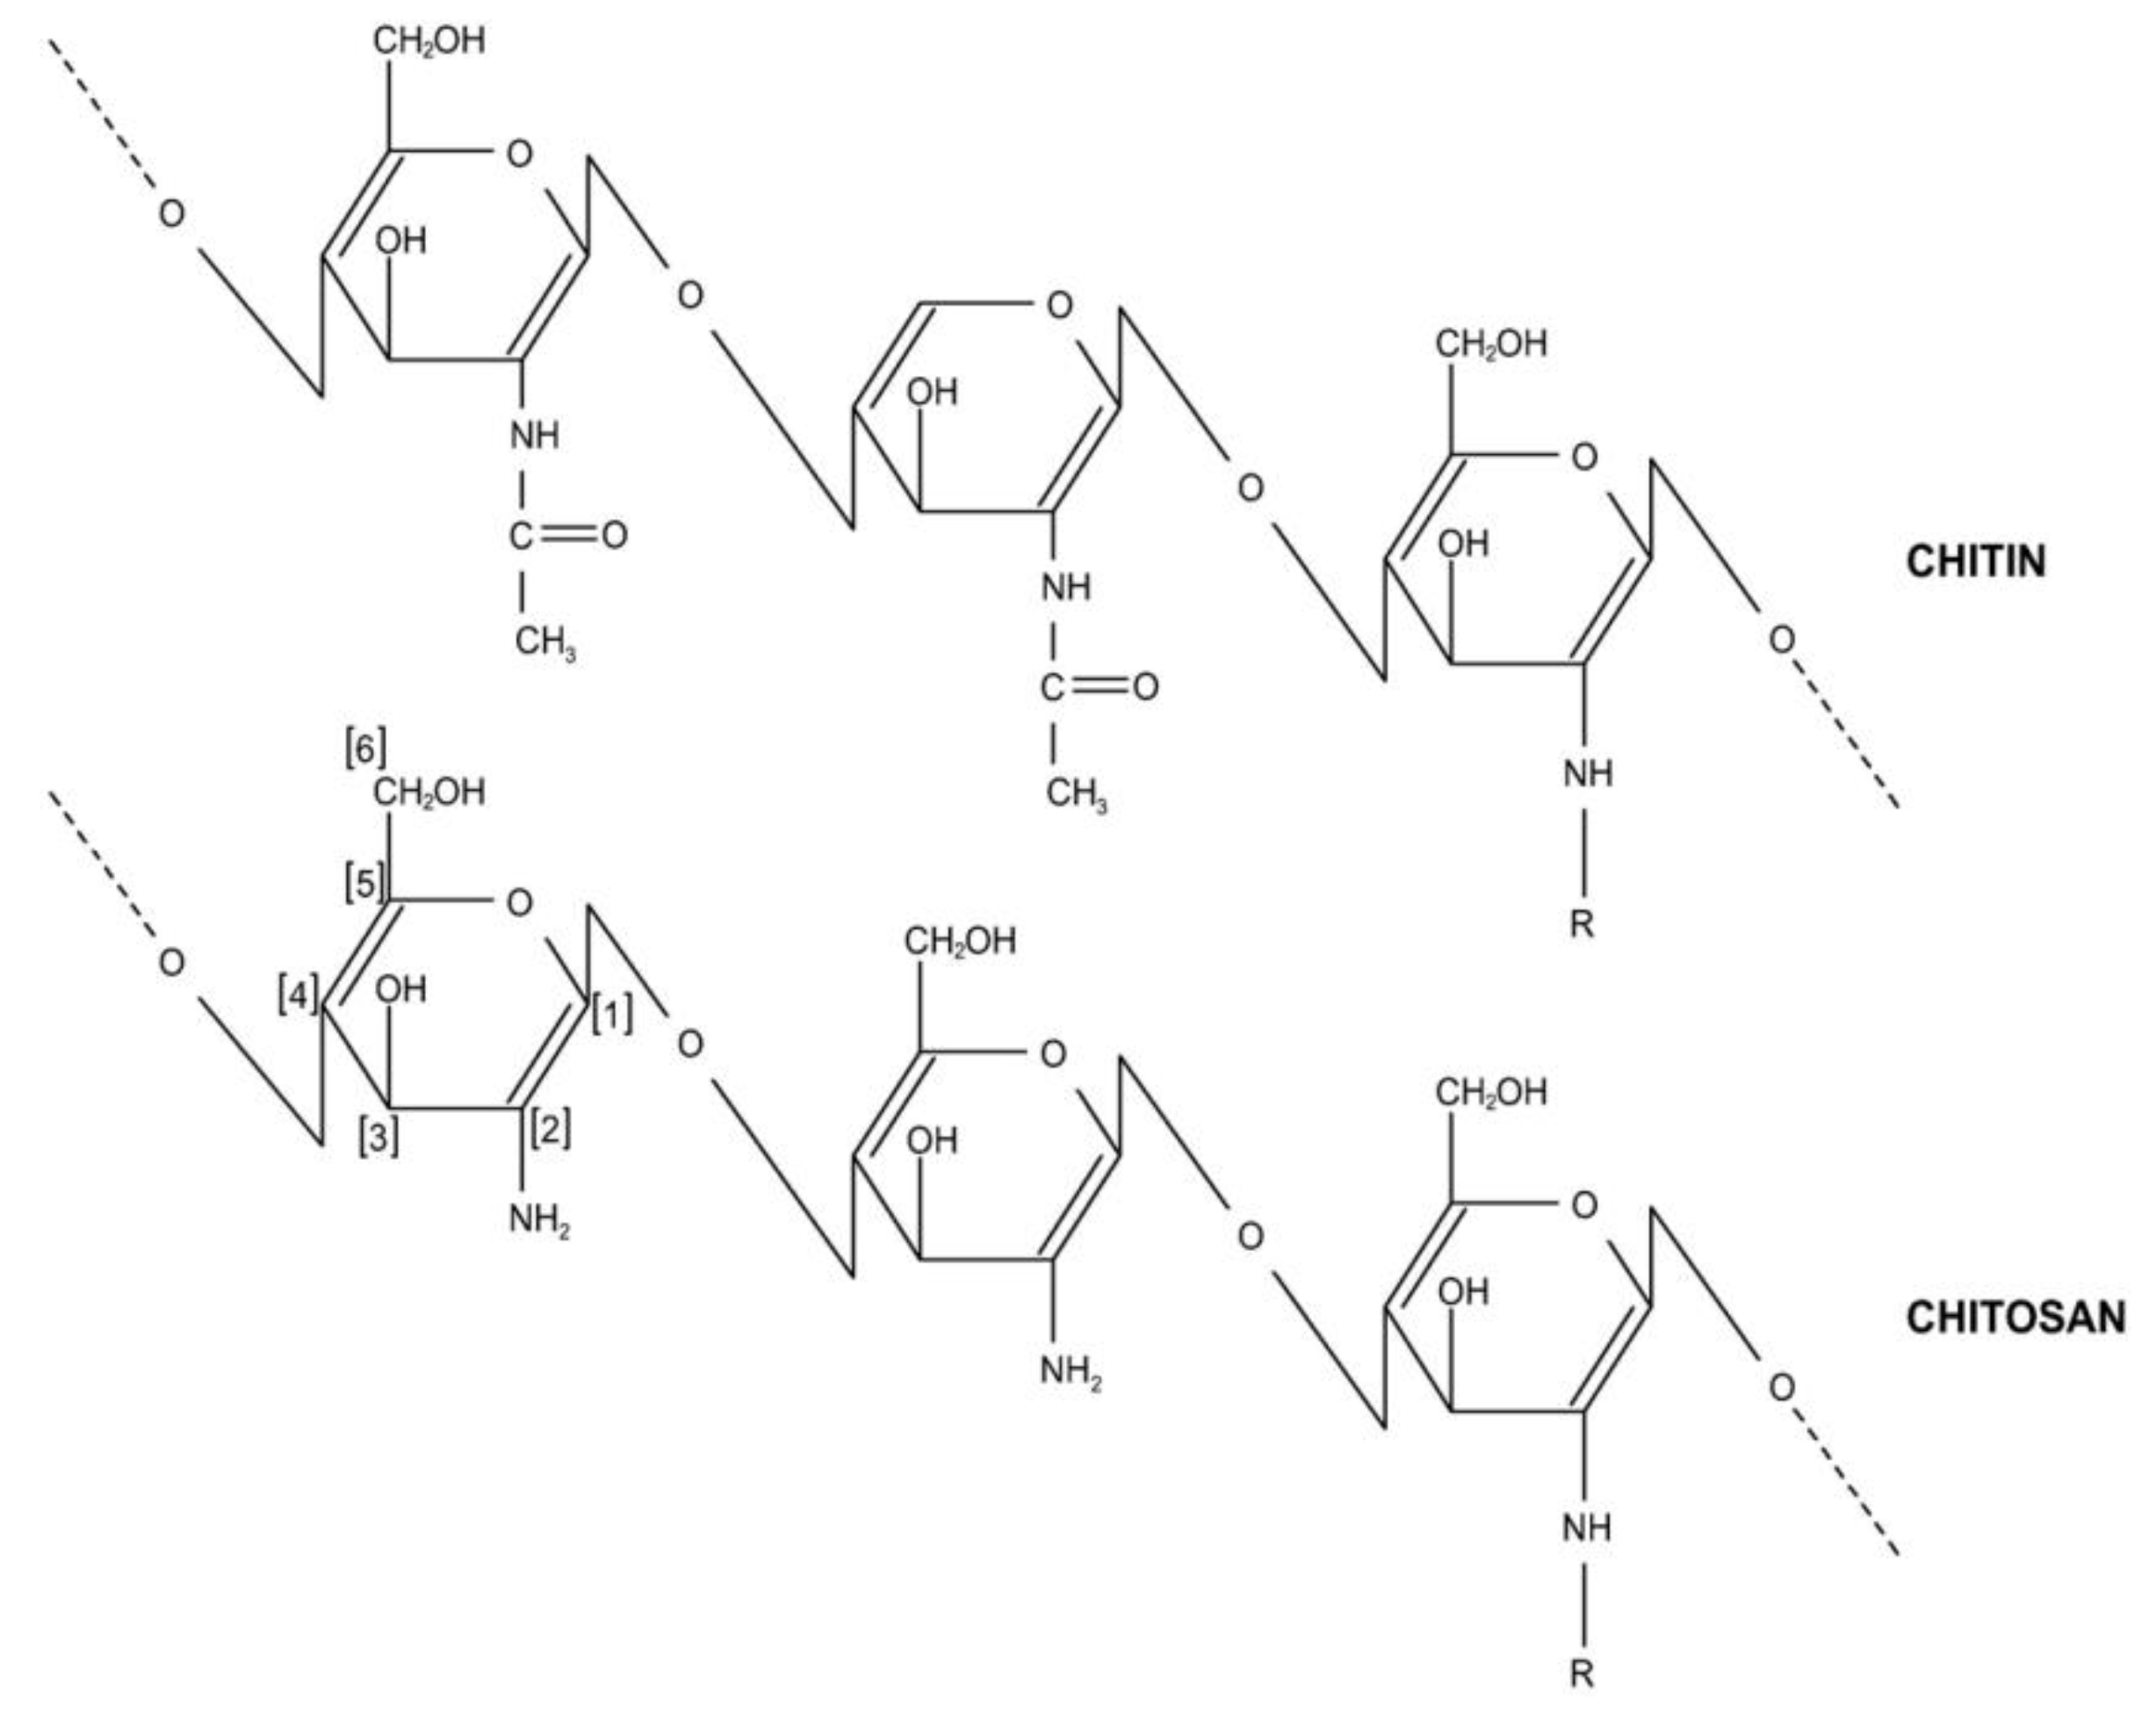
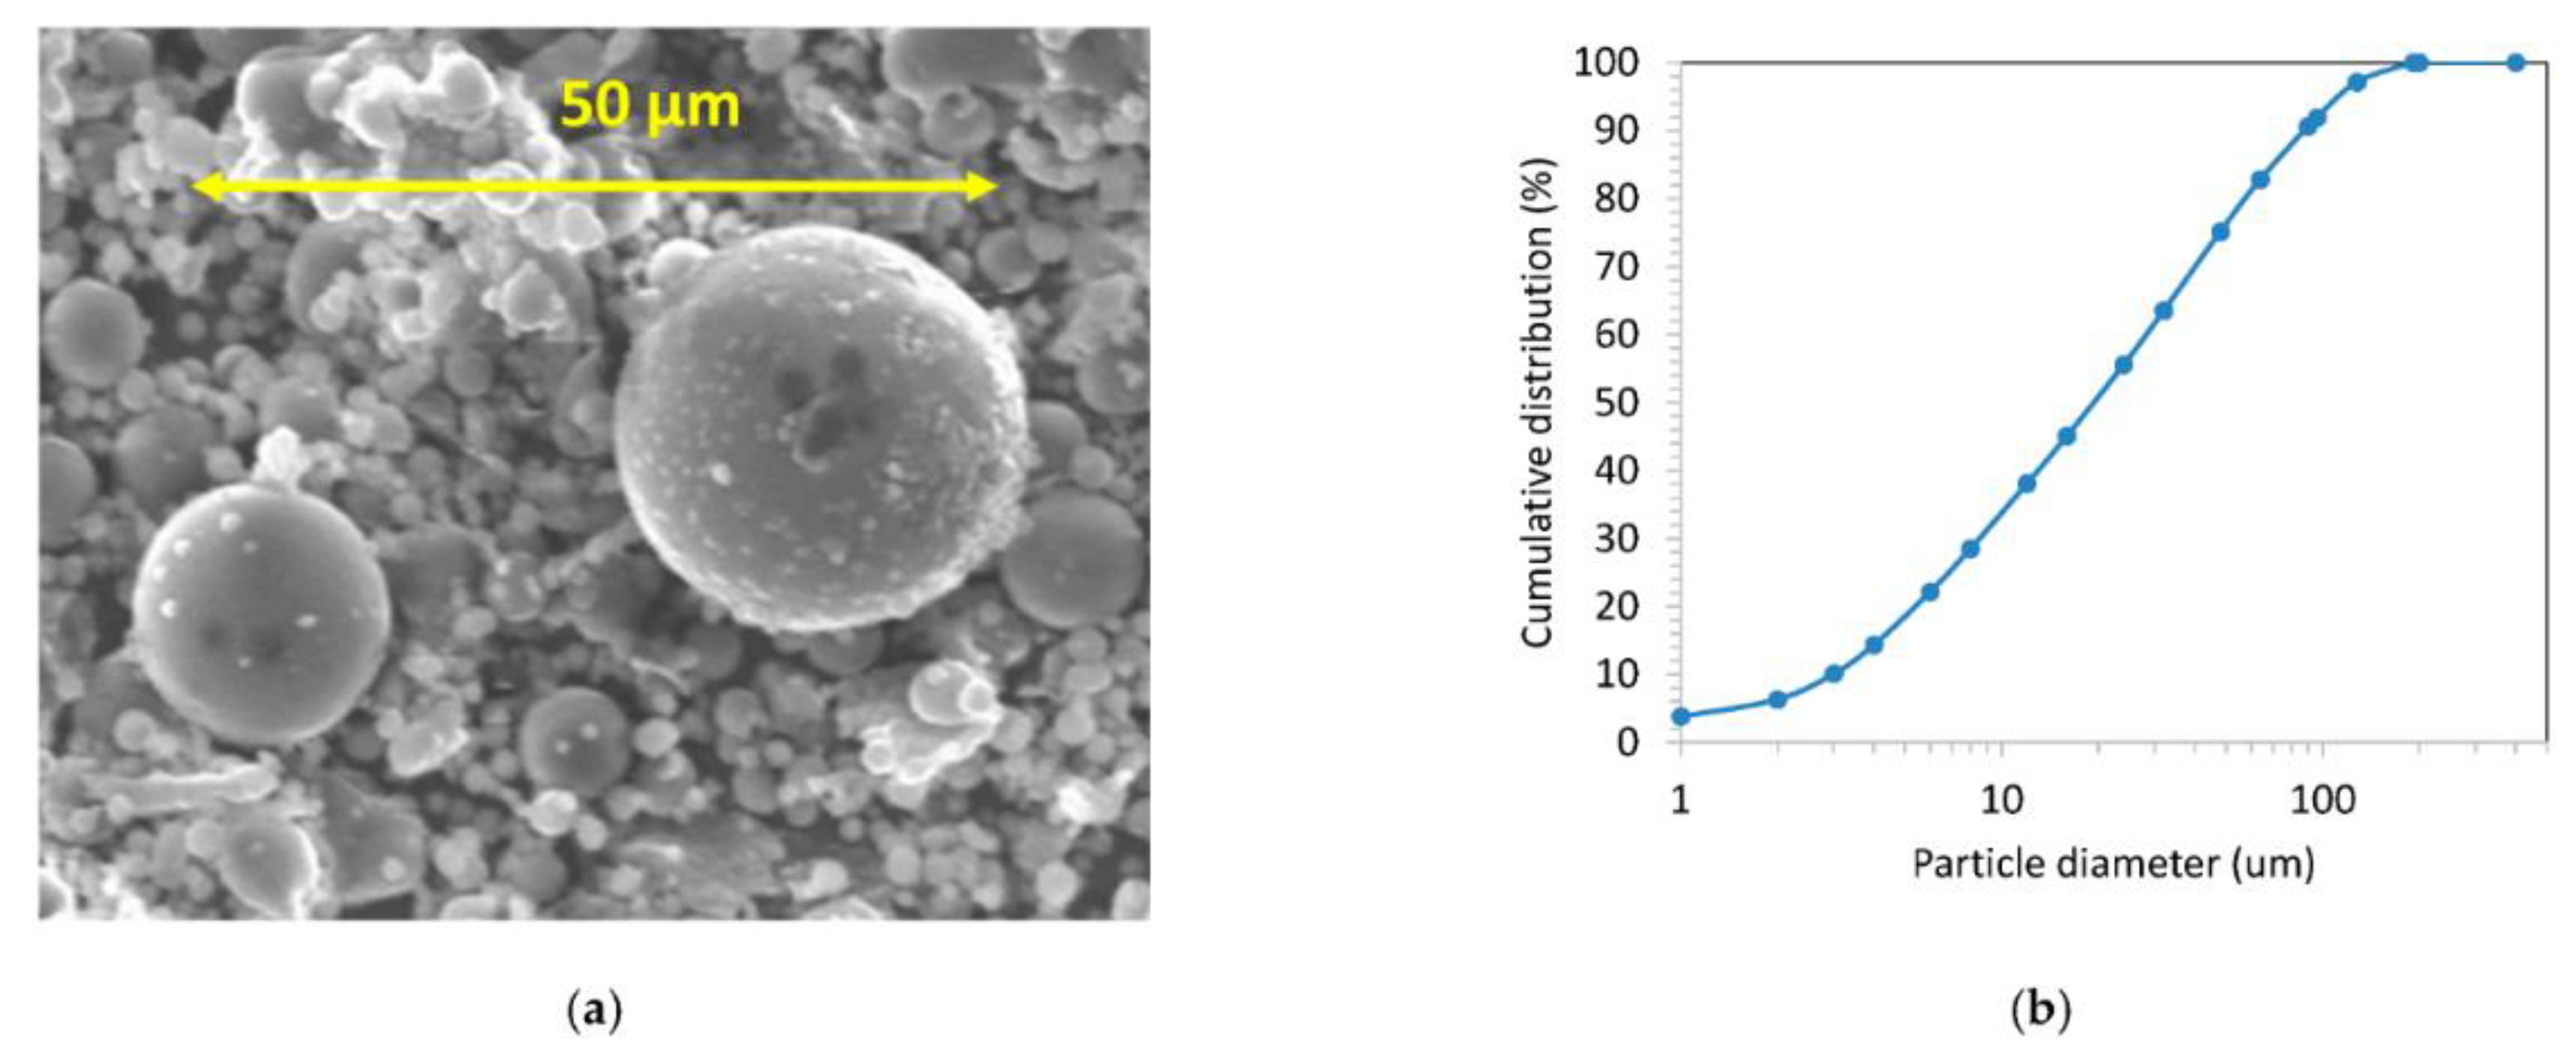
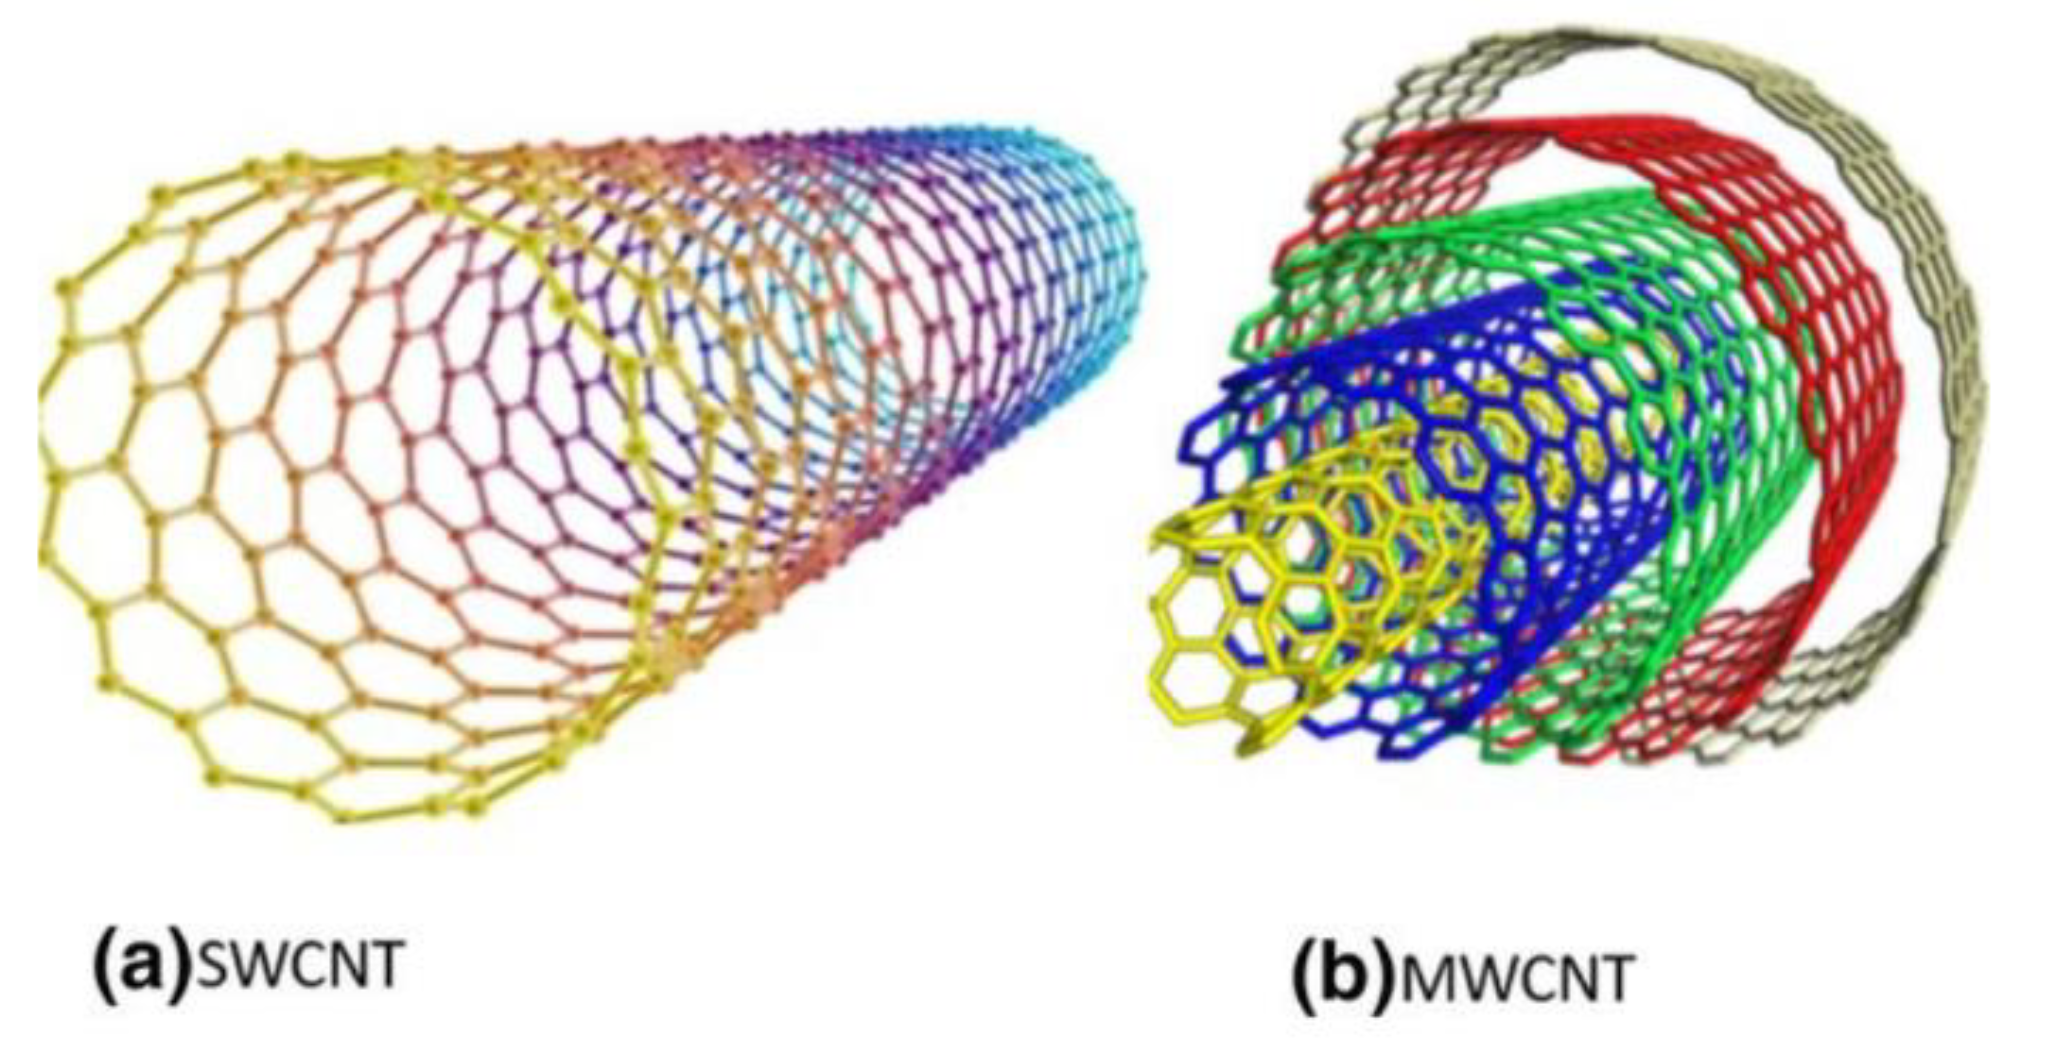
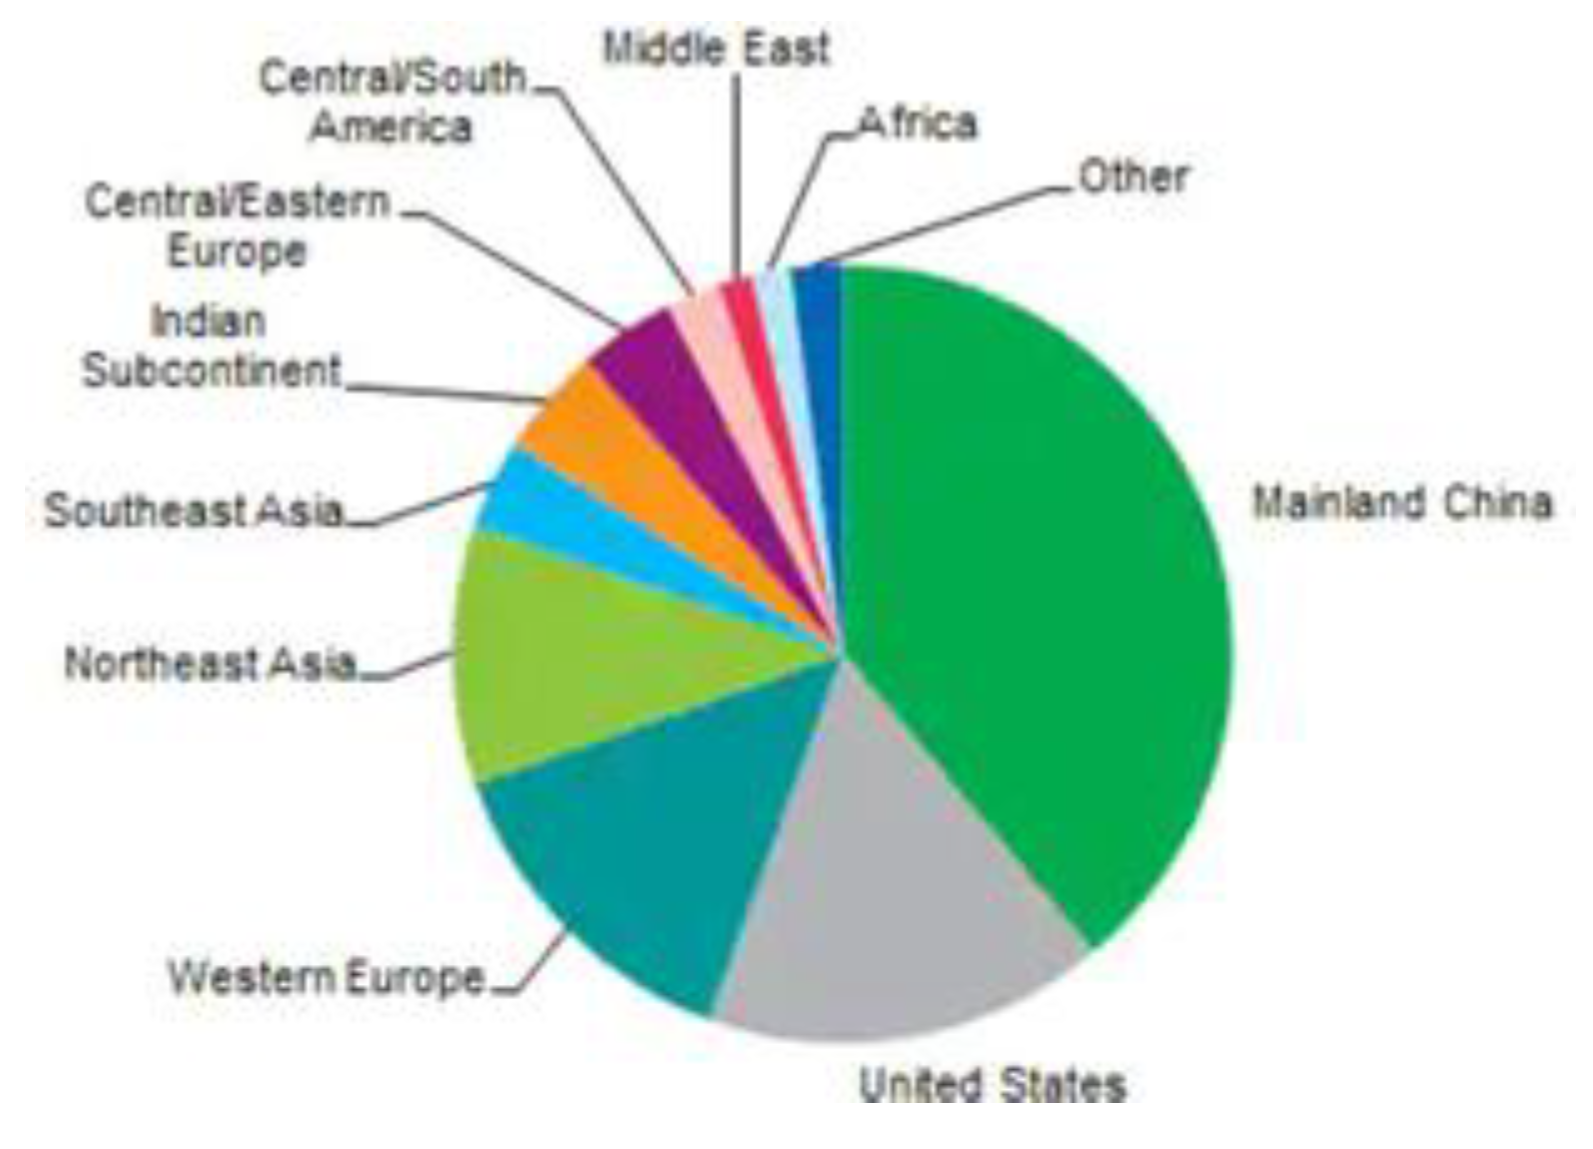
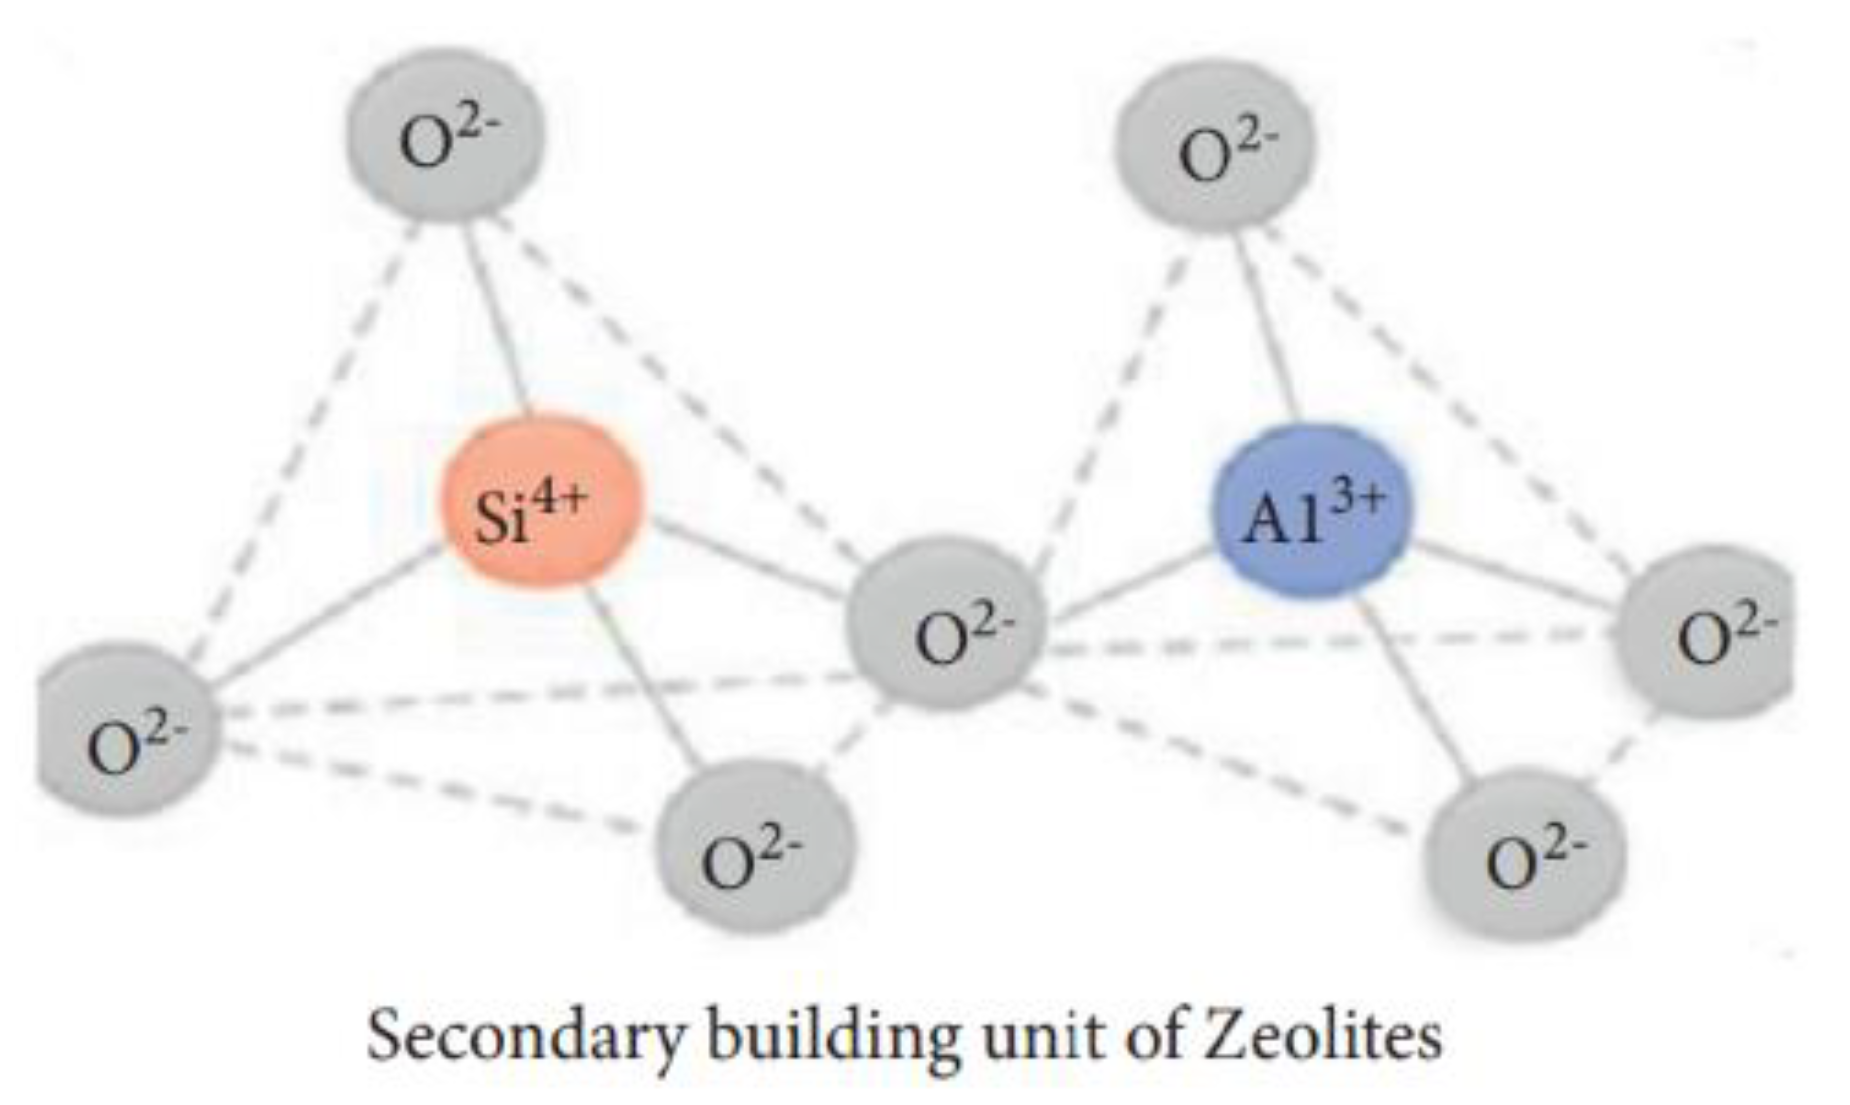
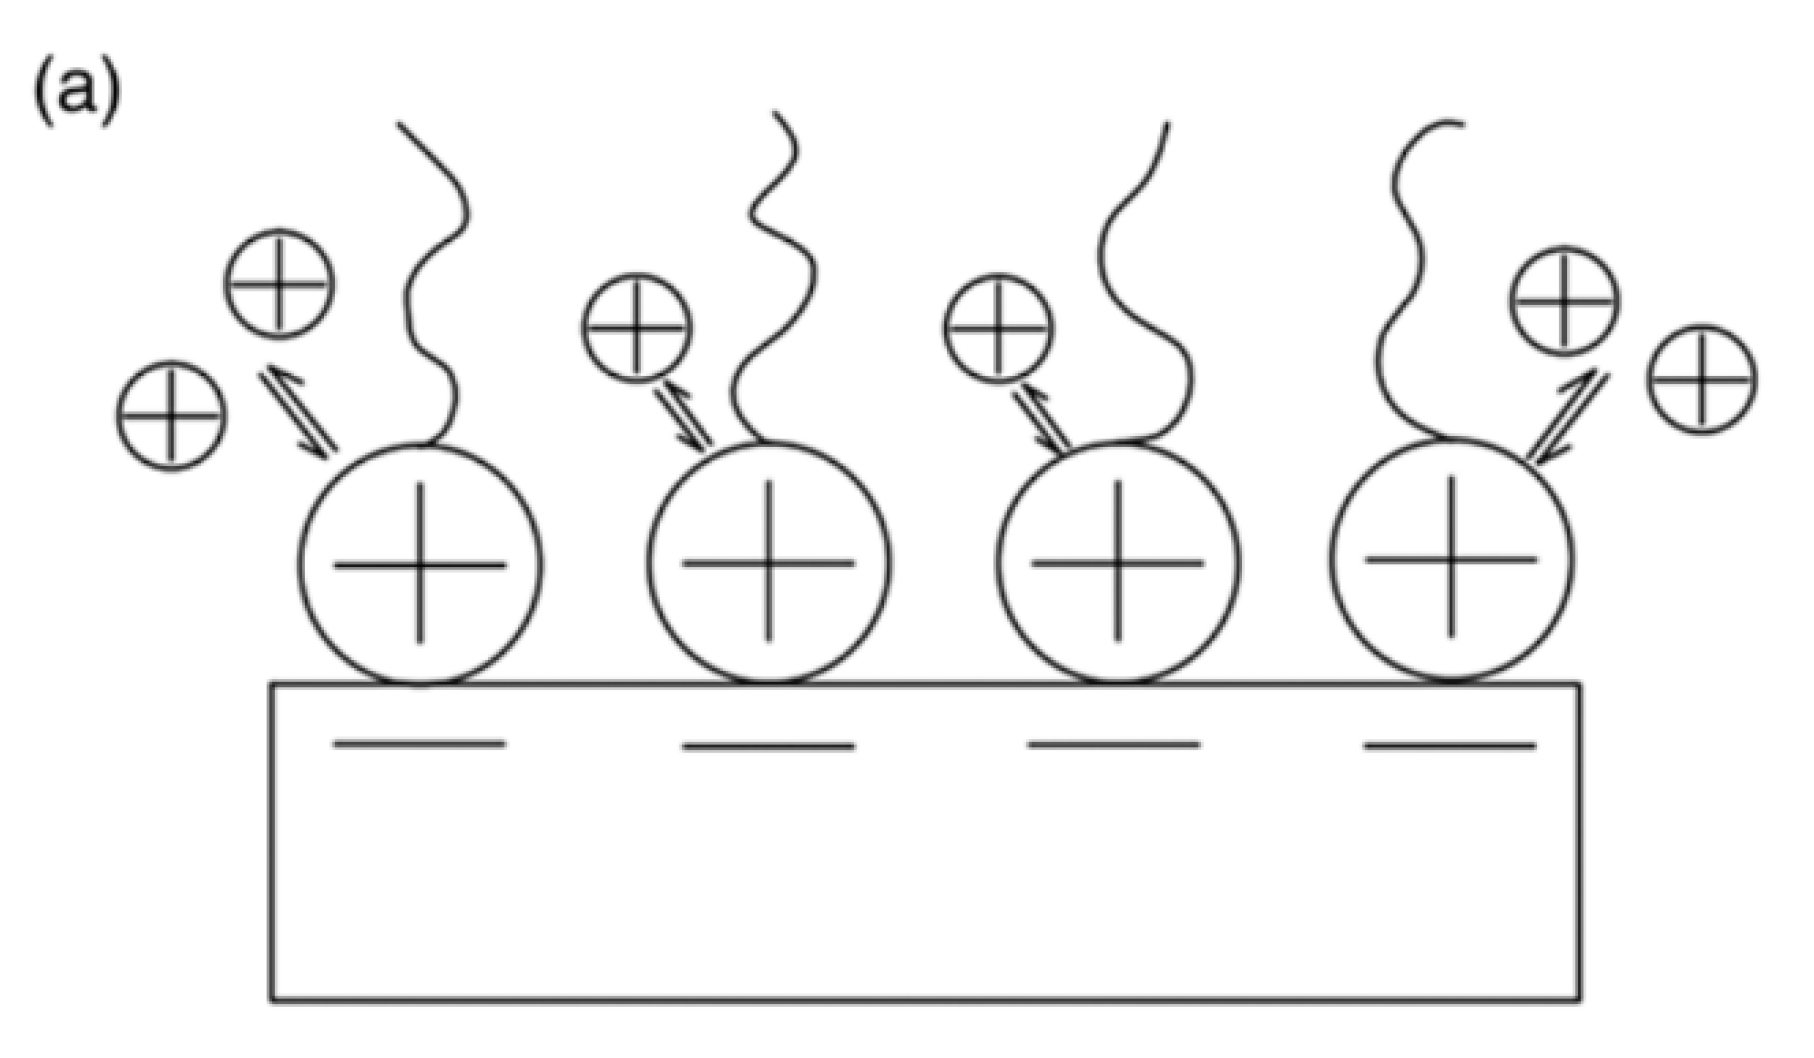
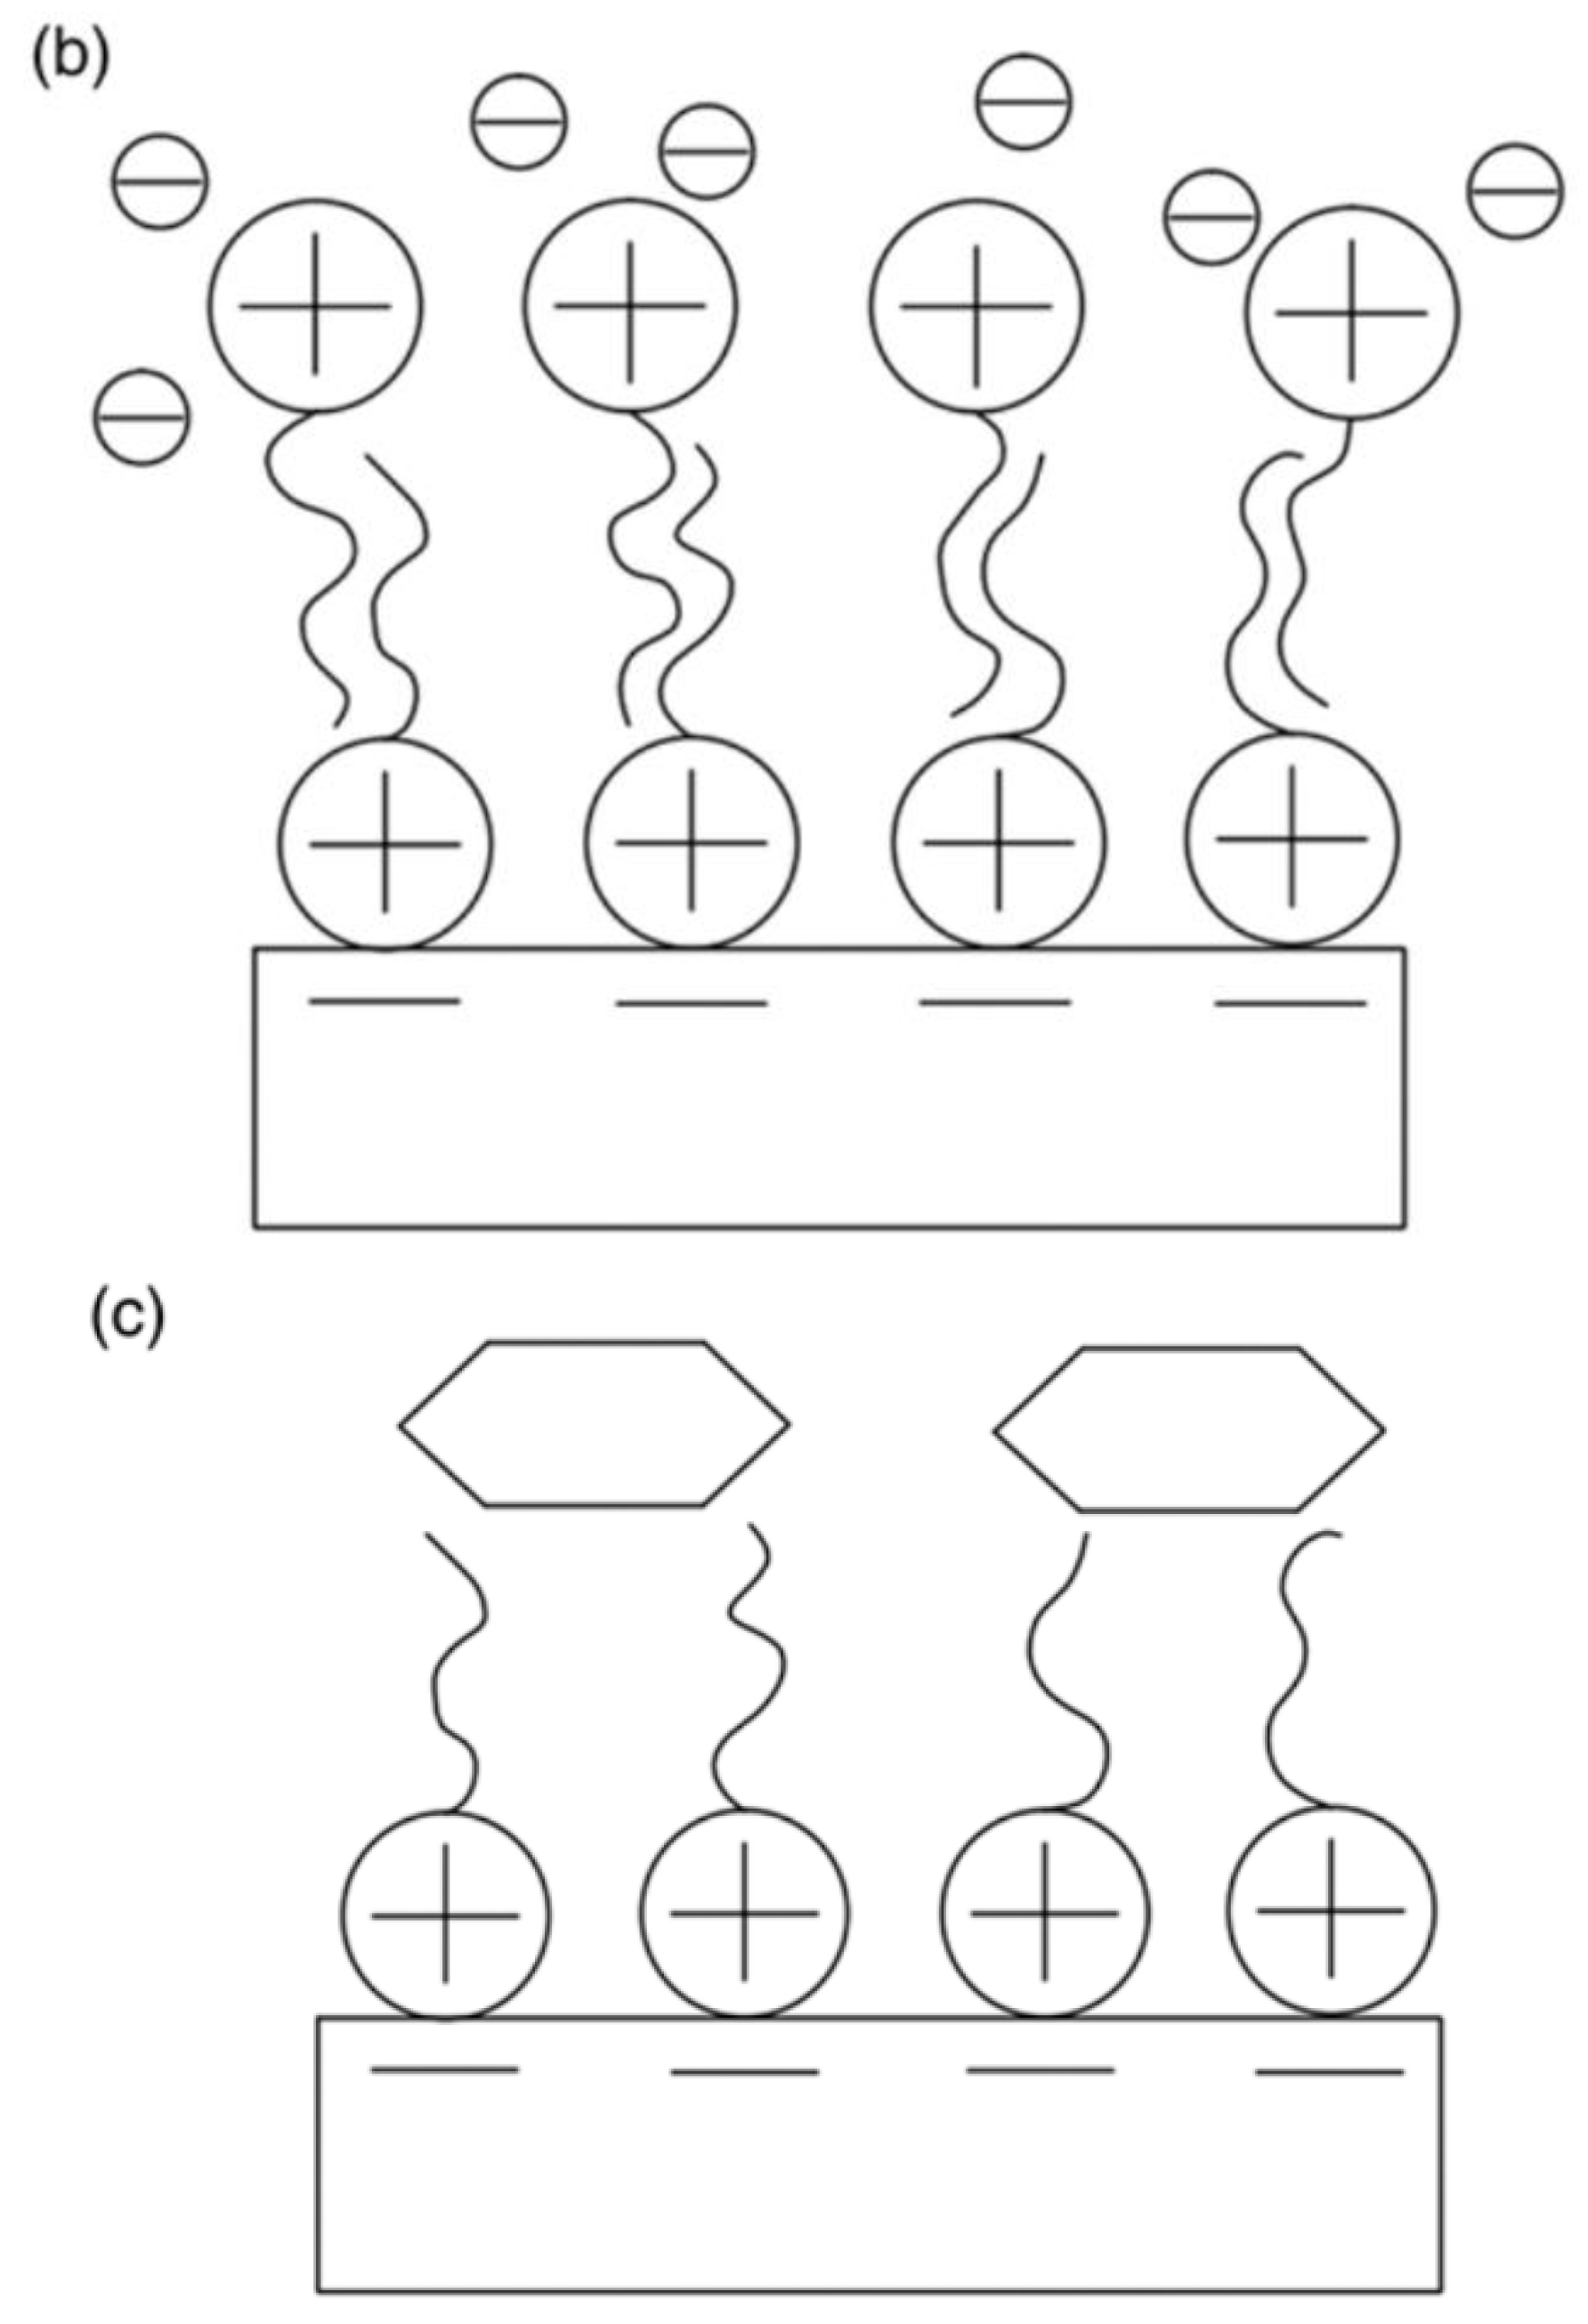
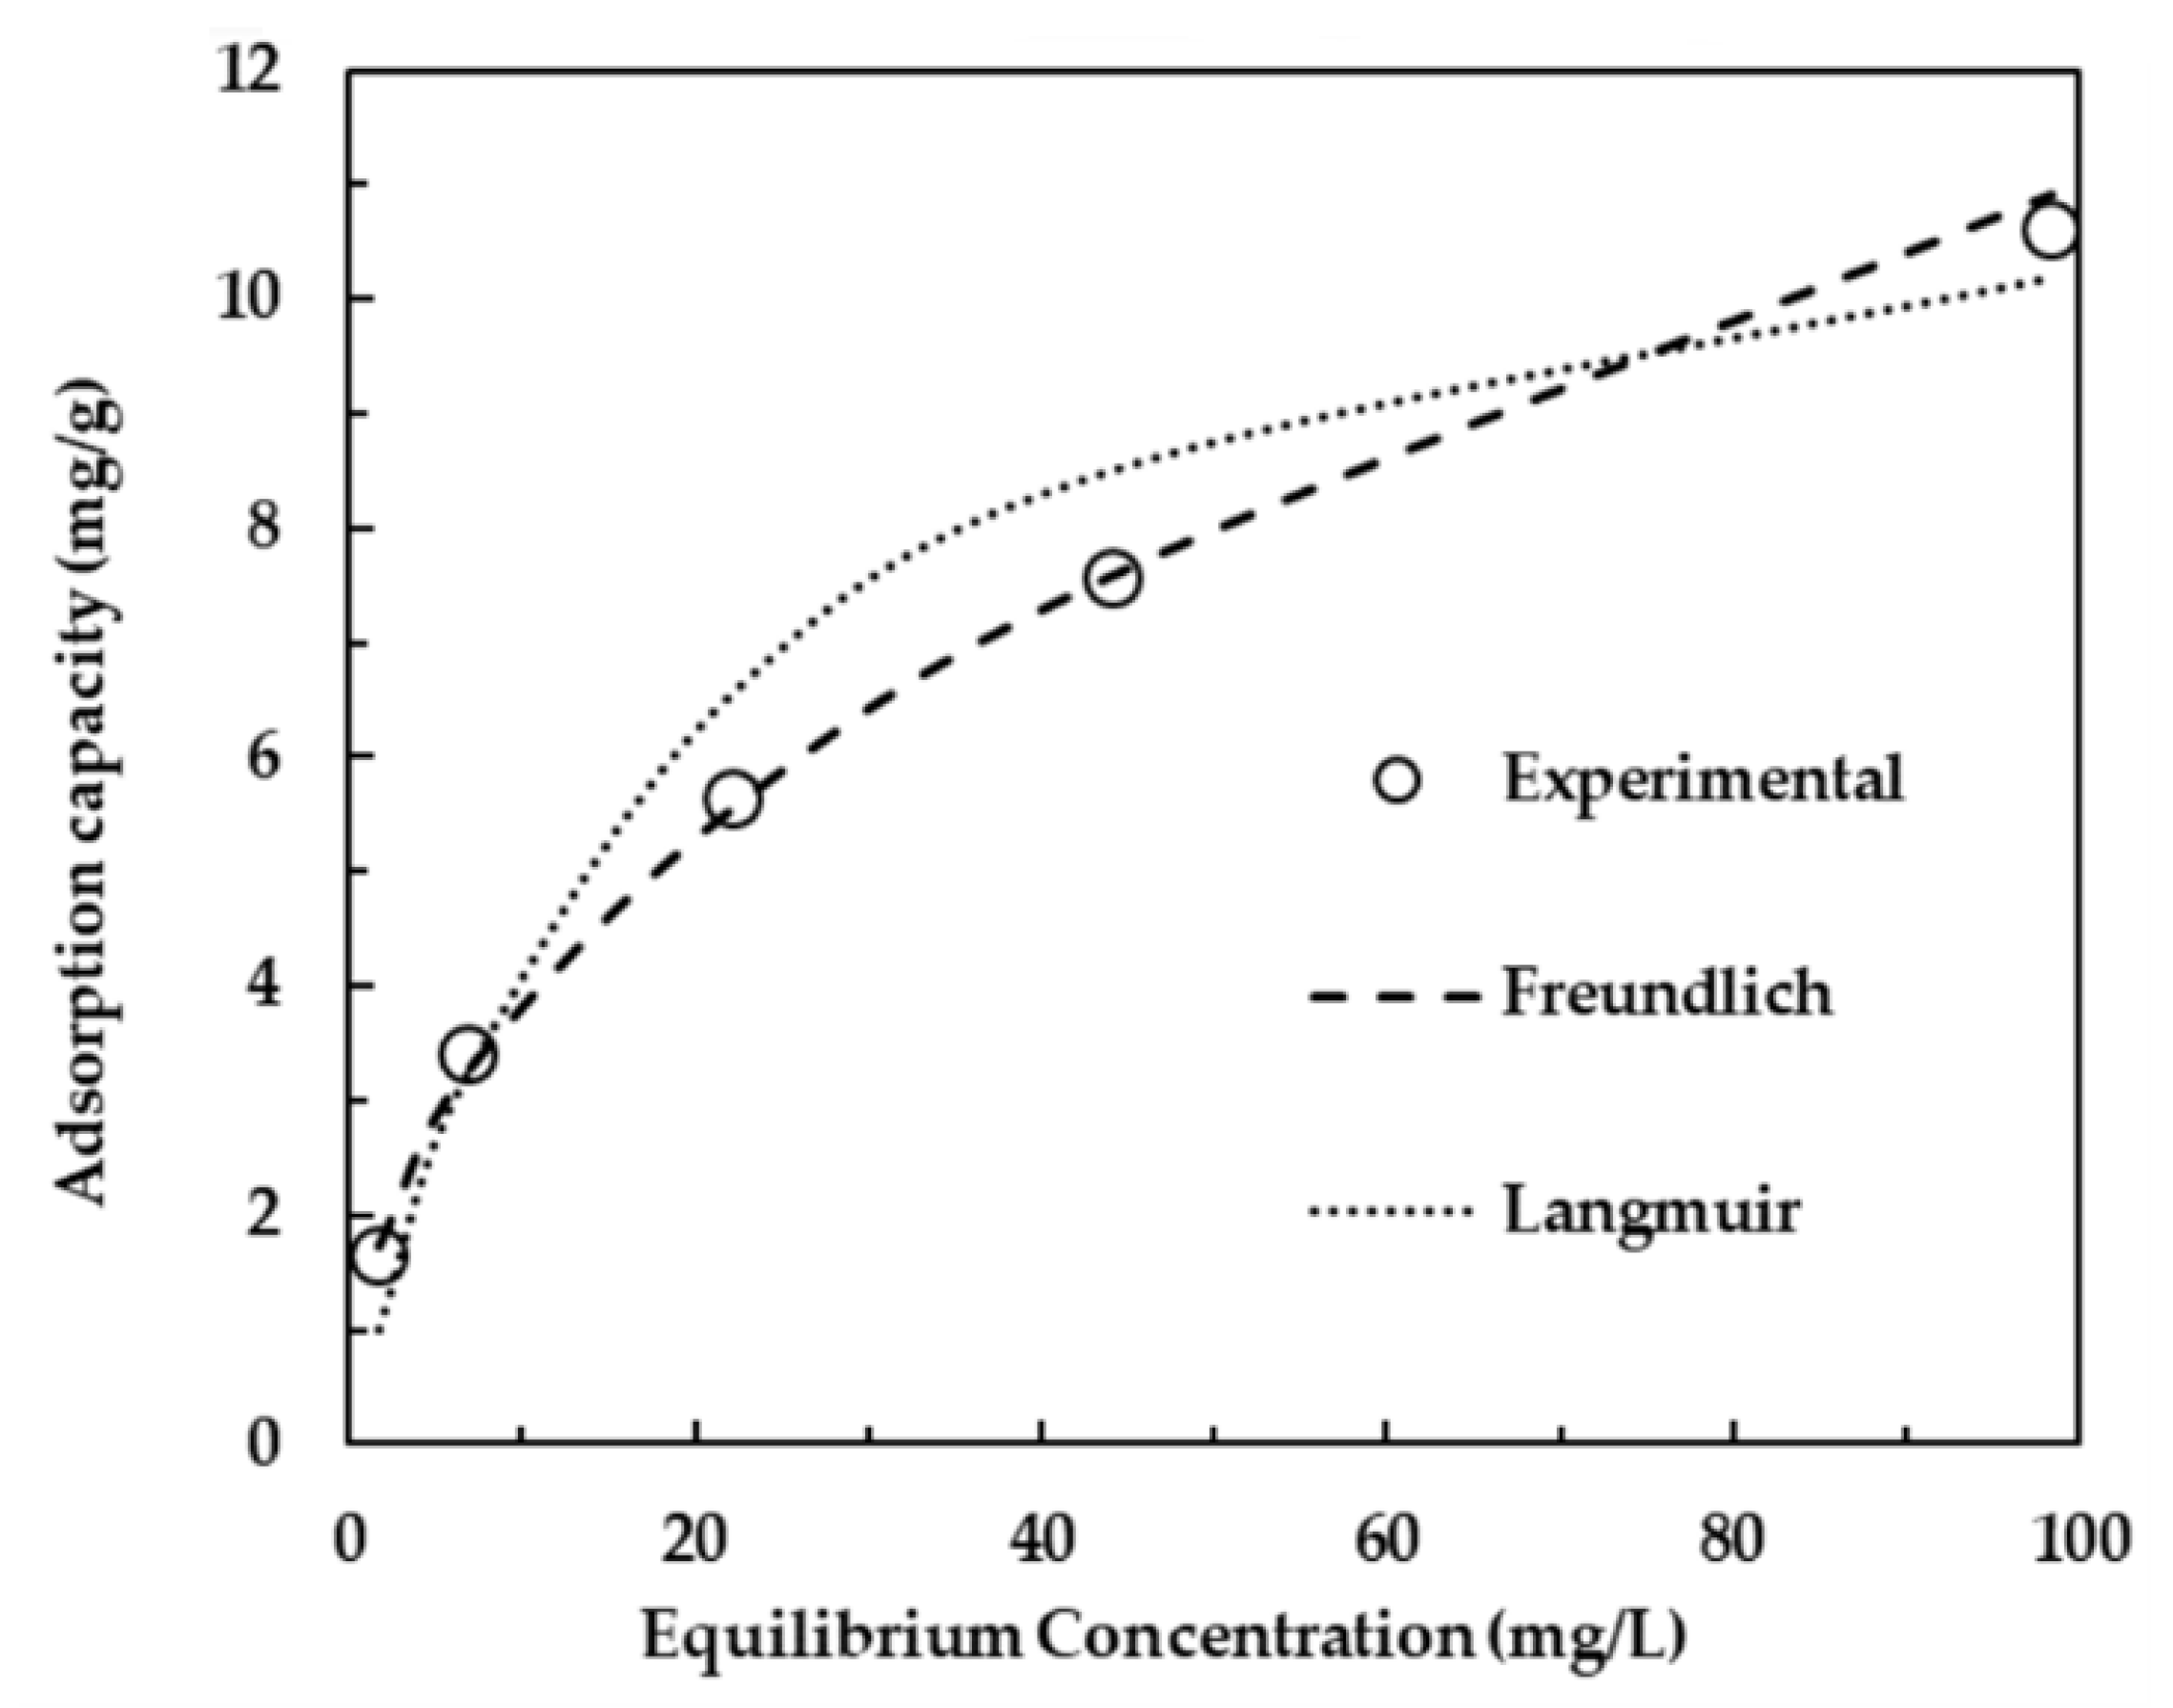
Table 1.
Difference between physical adsorption and chemical adsorption.
| Physical Adsorption | Chemical Adsorption |
|---|---|
| Van der Waal force of attraction is involved | Chemical bond is involved |
| The adsorption is considered a reversible process | The adsorption is considered an irreversible process |
| It does not require activation energy | Activation energy is needed |
| Lower value in heat of adsorption | Higher value in heat of adsorption |
| The adsorption occurs at lower temperatures | The adsorption occurs at higher temperature |
| It produces a multilayer (Figure 1) | It produces a monolayer (Figure 1) |
Table 2.
Physical properties of prepared carbon nanotube.
| Type | Physical Properties |
|---|---|
| Multi-walled carbon nanotube | Pore volume = 0.8 cm3/g |
| Specific surface area = 40–600 m2/g | |
| Outside diameter = 40–60 nm | |
| Core diameter = 5–10 nm [28] | |
| Length = 5–15 µm | |
| Surface area: 1000 m2/g | |
| Microspore volume = 0.5 cm3/g [29] | |
| Surface area = 407–650 m2/g | |
| Average pore width = 2.77 to 2.13 nm [30] | |
| Surface area = 98.7 m2/g | |
| Average pore diameter = 30.9 nm [31] | |
| Pore volume = 0.764 cm3/g | |
| Single-walled carbon nanotube | Surface area = 381 to 1068 m2/g |
| Average bundle size = 10–30 nm [32] | |
| Surface area = 302 m2/g [33] | |
| Pore volume of the bundles = 0.14 cm3/g | |
| Skeletal density = 0.806 g/cm3 | |
| Pore volume = 0.1 cm3/g | |
| Surface area = 911 m2/g | |
| Diameter = 9–25 Å [34] | |
| Surface area = 398 m2/g [35] | |
| Average pore size = 10.8 nm | |
| Pore volume = 0.92 cm3/g |
Table 3.
Textural properties of sago wastes-based activated carbon produced by using different chemical activation agents [40].
Table 3.
Textural properties of sago wastes-based activated carbon produced by using different chemical activation agents [40].
| Activating Agent | Microporous Volume (cm3/g) | Mesoporous Volume (cm3/g) | Total Pore Volume (cm3/g) | Surface Area (m2/g) | Average Pore Diameter (nm) | Yield (%) | Fixed Carbon (%) | Ash (%) |
|---|---|---|---|---|---|---|---|---|
| KOH | 0.101 | 0.085 | 0.186 | 374.03 | 5.12 | 30.5 | 43.78 | 10.9 |
| H3PO4 | 0.194 | 0.097 | 0.291 | 480.23 | 4.21 | 22.39 | 2.56 | 29.6 |
| Zinc chloride (ZnCl2) | 0.225 | 0.076 | 0.301 | 546.61 | 3.32 | 23.34 | 40.9 | 23.8 |
| Potassium Permanganate (KMnO4) | 0.152 | 0.092 | 0.244 | 274.92 | 4.3 | 29.98 | 14.02 | 26.02 |
Table 4.
Structure, sources, and toxic effects of phenol and phenolic compounds.
| Phenol and Phenolic Compound | Unhealthy Effect | Sources | Structure |
|---|---|---|---|
| Chlorophenol | Mouth and throat burning | herbicides and disinfectants |  |
| Hydroquinone | Damage to chromosomes | Cosmetic industries |  |
| 2,4-dimethyl phenol | Nausea and headache | Insecticides and fungicides |  |
| Para-cresol | Renal and digestive system disorder | Photographic sources and paint |  |
| Bisphenol A | Increase blood pressure and cardiovascular disease | Polycarbonate plastics |  |
| Alkylphenol | Testicular damage | Surfactants and detergents |  |
| Aminophenol | Skin allergies | Film and cosmetic products |  |
| Chlorocatechol | Eye irritation | Photography, dyeing fur |  |
| Nitrophenol | Bluish skin and headache | Fungicides and insecticides |  |
Table 5.
Kinetics, isotherms, and thermodynamic studies of the adsorption of phenol and phenolic compounds from wastewater using different adsorbents.
Table 5.
Kinetics, isotherms, and thermodynamic studies of the adsorption of phenol and phenolic compounds from wastewater using different adsorbents.
| Adsorbent | Adsorption Studies |
|---|---|
| Layered double hydroxide (LDH) clays | Neat clay has low phenol removal efficiency because of poor mixing of the clay with phenolic water [68]. Amorphous mixed metal oxide enhanced the surface area (8.7 to 29.73 m2/g) when heated at 500 °C. The highest percentage removal of phenol was 85% (contact time = 24 h, pH = 7, in the calcined clays). |
| Mg-Al LDH | The highest adsorption capacities for phenol and p-nitrophenol were 82.6 mg/g and 356.4 mg/g, respectively [69]. Adsorption kinetics were well-matched with pseudo-second-order kinetic model. |
| Natural Zeolite (clinoptilolite) | The adsorption efficiency of phenol increased (32% to 49%) when increasing the adsorbent dosage (5 g to 25 g). More phenol can be adsorbed with the increase in initial concentration due to the increase in the mass transfer driving force [70]. The highest adsorptive capacity was 0.7 mg/g, as indicated in the Langmuir model (R2 = 0.993). |
| Siliceous BEA zeolite | Zeolite has high Si/Al ratio [71]. High removal efficiency of phenol was obtained (the phenol concentration was less than 1.6 g/L). |
| NaY and nickel-modified NaY zeolites | The adsorption process achieved equilibrium within 120 min and at pH = 4. Ni-modified NaY zeolite showed the highest adsorption capacity (88.79%) compared to NaY (77.2%) due to low coordination number of nickel cations in the zeolite [72]. Adsorption kinetics followed pseudo-second-order model kinetic model and Freundlich model. |
| Zeolite | Natural zeolite-supported cobalt oxide catalysts were synthesized [73]. The adsorption efficiency of phenol was found to be 100% and 70% in cobalt-supported zeolite from Indonesia and Australia, respectively (0.2 g = catalyst, 25 ppm = phenol, 1 g = oxone, temperature = 25 °C). Higher activation energies were obtained in Australian sample (61.3 kJ/mol) compared to Indonesian sample (52.4 kJ/mol). |
| Modified zeolite with FeCl3 | Adsorption of phenol reached equilibrium within 100 min and at pH 3. Adsorption data were well-described by the Langmuir model (R2 = 0.98). Removal efficiency increased [74] from 65% to 95% (increase in surface area) with the adsorbent dose (up to 1 g). |
| High silicate zeolite | Removal of 2,4,6-trichlorophenol was more favorable when using FAU zeolite (lateral interaction) and showed S-shaped isotherm [75]. MFI zeolite has the highest adsorpion capacity due to close-fit phenomenon (interaction between adsorbate and adsorbent would be stronger). The zeolite pore structure was studied based on the opening sizes (5.1Å × 5.5 Å and 5.3 Å × 5.6 Å) and phenol size (4.34 Å × 0.87 Å × 5.55 Å). |
| Modified bentonite (cetyl trimethylammonium bromide) | The time to reach equilibrium was about 60 min at pH 9. The monolayer adsorption capacity was found to be 333 mg/g based on the Langmuir model [76]. Adsorption process was spontaneous and exothermic according to the thermodynamic studies. |
| Pumice | The pumice was treated with cationic surfactants (benzyldimethyl tetradecylammonium chloride and hexadecyltrimethyl ammonium bromide). The adsorption capacity increased with the increase in initial concentration [77]. The adsorption data fitted well with Freundlich model. |
| Rice husk, black gram husk, and green-gram-husk-based activated carbon | The optimum adsorption conditions obtained from the study were pH = 5.1, adsorbent dosage = 0.5 g/L, equilibrium time = 6 h). Adsorption process can best be described by the Redlich–Peterson isotherm [78]. |
| Banyan-root-based activated carbon | The maximum percentage removal was 89.2% in KOH-treated activated carbon [79]. The surface area and average pore radius were observed to be 988 m2/g and 24 nm, respectively. Adsorption process was spontaneous, exothermic, and obeyed Langmuir isotherm (maximum adsorption capacity = 26.95 mg/g). |
| Coconut-shell-based activated carbon | The percentage removal of parachlorophenol and 2,4,6-trichlorophenol was observed to be 99.9% and 99.8%, respectively [80]. The adsorption data supported Freundlich model and pseudo-second-order kinetic. |
| Palm-pith-based activated carbon | The small particle size (250–500 microns) and acidic conditions displayed a favorable behavior (adsorption capacity of 2,4-dichlorophenol = 19.16 mg/g). The entropy (Δ = 30.7 J/mol.K) and enthalpy value (7.16 kJ/mol) were reported [81]. |
| Banana-pith-based activated carbon | Based on the Langmuir model, the highest adsorption capacity of 2,4-dichlorophenol (pH = 2) was 129.4 mg/g in zinc-chloride-treated activated carbon [82]. Kinetic studies followed pseudo-first-order kinetic model. |
| Coal-, coconut-, and bamboo-based activated carbon | Adsorption capacities of phenol were found in the range of 13.16–24.96 mg/g, 10.86–21.22 mg/g, and 10.29–20.14 mg/g in bamboo-, coconut-, and coal-based activated carbon, respectively [83]. Free energy (−9.34 to −9.94 kJ/mol), enthalpy (−18.59 kJ/mol), and entropy (−30.05 J/K.mol) were reported. The adsorption data were well-described by the pseudo-second-order kinetic model and Freundlich model. |
| Tea-residue-based activated carbon | The kinetics of adsorption of phenol followed pseudo-second-order kinetic model. The highest adsorption capacity was 320 mg/g in NaOH-treated activated carbon. Surface area and total pore volume were found to be 819 m2/g and 0.443 cm3/g, respectively [84]. |
| Commercial activated carbon (Riedel-de Haen) | Removal of phenol was observed to be more than 99% when the shaking time was 10 min at room temperature [85]. Adsorption data can best be described by the Langmuir model (R2 = 0.9947). |
| Bagasse fly ash | The optimum conditions were determined (equilibrium time = 5 h, pH = 6.5, fly ash dose = 10 g/L) [86]. Adsorption process followed the Redlich–Peterson and pseudo-second-order kinetic model. The entropy change (1.8 J/kg.K) and heat of adsorption (0.5 MJ/kg) were highlighted. |
| Fly ash | Removal of phenol was strongly dependent on the initial adsorbate concentration and the molecular size [87]. According to thermodynamic studies, adsorption process was spontaneous (negative value of free energy). |
| Fly ash | The equilibrium time was found to be 60 min. Adsorption kinetics followed pseudo-second-order kinetic model [88]. External diffusion and pore diffusion can be observed during the experiment as indicated in intraparticle model. Removal of phenol increased when reducing the particle size but reduced when the temperature was increased. |
| Chitosan (D-glucosamine) | The adsorption efficiency from Freundlich model (0.17 to 0.4) was reported [89]. The highest adsorption capacity (Langmuir model) increased (0.1 to 0.18 mmol/kg) when the temperature was reduced (25 °C to 5 °C) in flake-type chitosan. The percentage removal reduced as pH increased due to the hydroxyl group (in the adsorbate) combined via hydrogen bond with chitosan (in hydroxyl group). Based on the Langmuir model, the highest adsorption capacities of 2,4,6-trichlorophenol, 3,4-dichlorophenol, 2,3-dichlorophenol, and 2,6 dichlorophenol were 0.7, 0.63, 0.6, and 1.08 mmol/kg, respectively (agitation speed = 150 rpm, equilibrium time = 4 days, natural pH). |
Table 6.
Chemical formula, molar mass, and structure of the pesticide.
| Chemical Formula | Name | Molar Mass (g/mol) | Structure |
|---|---|---|---|
| C16H15Cl3O2 | methoxychlr | 345.65 |  |
| C8H14ClN5 | atrazine | 215.69 |  |
| (CH3O)2P(S)OC6H4NO2 | methyl parathion | 263.2 |  |
| C10H19O6PS2 | malathion | 330.35 |  |
| C12H14Cl2N2 | paraquat dichloride | 257.16 |  |
| C3H8NO5P | glyphosate | 169.07 |  |
| C10H12N2O3S | bentazone | 240.28 |  |
| C6H3Cl2NO2 | clopyralid | 192 |  |
| C9H10ClN5O2 | imidacloprid | 255.661 |  |
| C12H18N2O | isoproturon | 206.28 |  |
| C15H21NO4 | metalaxyl-M | 279.33 |  |
Table 7.
World Health Organization highlighted classification of pesticides [92].
Table 7.
World Health Organization highlighted classification of pesticides [92].
| WHO Class | LD50* for the Rat (mg/kg Body Weight) | Example in Terms of Active Ingredients | ||
|---|---|---|---|---|
| Oral | Dermal | |||
| Ia | Extremely hazardous | <5 | <50 | Aldicarb, Parathion, Mercuric chloride |
| Ib | Highly hazardous | 5–50 | 50–200 | Acrolein, Cadusafos, Ca-arsenate |
| II | Moderately hazardous | 50–2000 | 200–2000 | Alachlor, Bentazone, Copper sulfate |
| III | Slightly hazardous | Over 2000 | Over 2000 | Hexaconazole, Atrazine, Butachlor |
| U | Unlikely to present acute hazard | 5000 or higher | 5000 or higher | Mancozeb, Captan, Bifenox. |
LD50*: the lethal dose is that to kill half of a test population of animals
Table 8.
Kinetics, isotherms, and thermodynamic studies of the adsorption of pesticides using different adsorbents.
Table 8.
Kinetics, isotherms, and thermodynamic studies of the adsorption of pesticides using different adsorbents.
| Pesticides | Adsorbent | Adsorption Studies |
|---|---|---|
| Ametryn Formula: C9H17N5S Molecular mass: 227.3 g/mol | Natural montmorillonite | Langmuir model: Maximum monolayer adsorption capacity was 188.8 mg/g. Thermodynamic studies: spontaneous and endothermic [96]. |
| Carbofuran Formula: C12H15NO3 Molecular mass: 221.256 g/mol 2,4-Dichlorophenoxyacetic acid Formula: C8H6Cl2O3 Molecular mass: 221.04 g/mol | Commercial granular-type activated carbon (Filtersorb 300) | Langmuir model: maximum adsorption capacities were 181.82 mg/ and 96.15 mg/g for 2,4-Dichlorophenoxyacetic acid and carbofuran, respectively. Adsorption kinetics followed pseudo-second-order kinetic isotherm [97]. |
| Hexachlorocyclohexane Formula: C6H6Cl6 Molecular mass: 290.8 g/mol | Coconut-shell-based activated carbon | Maximum monolayer adsorption capacity can be determined based on the Langmuir model [98]. |
| Bentazon Formula: C10H12N2O3S Molecular mass: 240.28 g/mol | Date seed activated carbon | Adsorption data were well-described by the Freundlich model and pseudo-second-order kinetic model [99]. The adsorption percentage of carbofuran was found to be higher compared to bentazon. |
| Bentazon, carbofuran, 2,4-Dichlorophenoxyacetic acid (2,4-D) | Palm-oil-frond-based activated carbon | The percentage removal of bentazon (48% to 95%), carbofuran (57% to 96%) and 2,4-D (71% to 98%) was studied with various activation temperatures (716 to 884 °C) and activation times (0.32 to 3.68 h) [100]. |
| Atrazine Formula: C8H14ClN5 Molecular mass: 215.69 g/mol Imidacloprid Formula: C9H10ClN5O2 Molecular mass: 255.661 g/mol Azoxystrobin Formula: C22H17N3O5 Molecular mass: 403.388 g/mol | Rice-straw-activated carbon | Experimental findings revealed pore filling and partitioning for imidacloprid, atrazine, and azoxystrobin, respectively [101]. |
| Bromopropylate Formula: C17H16Br2O3 Molecular mass: 428.120 g/mol | Corn-cob-based activated carbon | The adsorption data can best be described by the pseudo-second-order kinetic model and Langmuir isotherm [102]. |
| Diazinon Formula: C12H21N2O3PS Molecular mass: 304.34 g/mol | NH4Cl-induced activated carbon | Langmuir model: maximum adsorption capacity was 250 mg/g. Thermodynamic studies: The enthalpy (+77.5 kJ/mol), entropy (+296 J/K.mol), and free energy (−10.76 to −14.9 kJ/mol) were reported [103]. |
| 2,4-dichlorophenoxy acetic acid | Peanut-shell-based activated carbon | The adsorption data followed Freundlich model (R2 = 0.9347) and pseudo-first-order kinetic model R2 = 0.99). The percentage removal of 2,4-D reduced (78.6% to 47.2%) when the initial concentration was increased (10 to 50 mg/L) [104]. |
| atrazine | Zeolite (Fruška Gora) | The highest percentage removal was 73% (pH = 10, particle size = 1–2 mm, zeolite dos = 15 g) [105]. |
| Malathion | Coconut shell- and palm-shell-based activated carbon | Langmuir model: maximum adsorption capacity was 909 mg/g [106]. |
| Alachlor Formula: C14H20ClNO2 Molar mass: 269.7 g/mol Metolachlor Formula: C15H22ClNO2 molar mass: 283.8 g/mol Fipronil Formula: C12H4Cl2F6N4OS Molar mass: 437.14 g/mol Chlorpyriphos Formula: C9H11Cl3NO3PS Molar mass: 350.57 g/mol endosulfan sulfate formula: C9H6Cl6O4S molas mass: 422.9 g/mol | Organo-modified montmorillonite clays modified with octadecylamine, dimethyl- dialkylamine, octadecylamine, and aminopropyltriethoxysilane | The adsorption data followed Freundlich model (R2 = 0.951 to 0.992) and pseudo-second-order kinetic model [107]. Higher value of Freundlich constant (0.17 to 0.52 mg/g) represented higher affinity of these pesticides toward organo clays due to the hydrophobic interaction. The percentage removal of chlorpyriphos was 70% within 90 min due to high octanol–water partition coefficient and lower water solubility value. Based on the Freundlich model, adsorption of alachlor (1/n = 0.14), metolachlor (1/n = 0.25), fipronil (1/n = 0.09), and endosulfan sulfate (1/n = 0.21) was found to be non-linear and followed the L-type isotherms. |
| Paraquat Formula: C12H14Cl2N2 Molar mass: 257.16 g/mol | Kaolin modified with sulfuric acid | Equilibrium was achieved in 60 min. Adsorption data were fit well with Freundlich model [108]. |
| Carbaryl Formula: C12H11NO2 Malar mass: 201.225 g/mol | Clay (Agadir city) | Equilibrium was reached [109] in 120 min (initial concentration = 10 mg/L, mass of clay = 1 g/L, temperature = 20 °C). Adsorption process takes place in two stages, namely, transfer of external mass and diffusion phenomena. It was clear that the isoelectric point was pH 5.1. When the pH was more than pH 5.1, electrostatic repulsion happened and reduced the adsorption process. We can observe the high electronic density in carbaryl due to the Kekule forms of two nuclei. Adsorbed amount reduced (2.211, 2.001, 1.897, and 1.343 to 1.117 mg/g) when the temperature was 20 °C, 30 °C, 40 °C, 50 °C, and 60 °C due to releasing activation energy during the adsorption process. |
| Lindane Formula: C6H6Cl6 Molar mass: 290.81 g/mol Heptachlor Formula: C10H5Cl7 molar mass: 373.32 g/mol | Pine-bark-based activated carbon | The highest removal efficiencies of Lindane (76.6%) and heptachlor (77.7%) were reported [110]. |
Table 9.
Kinetic and adsorption study of dye removal using various types of adsorbents.
| Classification of Dyes | Example of Dyes | Adsorbent | Adsorption Studies and Thermodynamic Investigations |
|---|---|---|---|
| Direct dye | Direct Brown MR | Prosopis juliflora bark-based activated carbon | The highest percentage removal was 90.2% (contact time = 60 min, initial concentration = 400 mg/L, adsorbent dosage = 100 mg, pH = 2, temperature = 30 °C). Thermodynamic studies: spontaneous (ΔG = −0.289 to −0.33 kJ/mol) and endothermic reaction (ΔH = 0.22 kJ/mol). Adsorption data were well-fitted with Langmuir model (R2 = 0.992, maximum adsorption capacity = 500 mg/) and Freundlich model (R2 = 0.996) [118]. |
| Direct dye | Brilliant blue | Nigella Sativa L waste-based activated carbon | Thermodynamic studies: exothermic (ΔH = −3.264 kJ/mol), spontaneous (ΔG = −4.37 kJ/mol), and the disorder reduces at the solution/solid interface (ΔS = −24.89 J/mol.K) [119]. The Freundlich model (R2 = 0.994) described adsorption on heterogeneous surfaces with different adsorption energies. Langmuir model: The highest adsorption capacity was 14.49 mg/g. |
| Direct dye | Brilliant blue | Zeolite | The highest percentage of removal was 87.02% in Zeolite-Fe(Fe-Cu) zeolite [120], and the adsorption process was endothermic (126.29 kJ/mol). Removal efficiency was 75.29% in zeolite-Fe, and the adsorption process was endothermic (52.6 kJ/mol). The optimum pH was in the range of 3 to 5. The kinetics of adsorption followed pseudo-second-order kinetic model in both samples. |
| Direct dye | Congo red | Pinus pinaster bark-based activated carbon | The maximum adsorption capacity for Congo Red was 0.47 mg/g (pH = 2, temperature = 25 °C, initial dye concentration = 5 mg/L, activated carbon dose = 10 g/L), but dropped to 0.3 mg/g at pH 9 [121]. The highest correlation coefficient (R2 = 0.98) can be observed in the pseudo-second-order kinetic model, indicating chemical sorption process. Thermodynamic studies: exothermic process. The adsorption capacity was reduced when the temperature was increased (25 °C to 60 °C). |
| Reactive dye | Reactive red 198 | Pistachio hull-waste-based activated carbon | The highest adsorption capacity was 253.67 mg/g (pH = 2, initial concentration = 80 mg/L, temperature = 25 °C) [122]. The Freundlich model (R2 = 0.9289) shows the best correlation coefficient compared to Langmuir model (R2 = 0.8839). |
| Reactive dye | Reactive red 2, reactive green 19 | Ground nut shell, baby-corn-based activated carbon | Percentage removal of reactive green dye (71.6% to 79.5%) and reactive red dye (58.7% to 73.3%) by using ground-nut-shell-based activated carbon increased when the initial concentration of dye was reduced (65 ppm to 40 ppm). [123]. Percentage removal of reactive red dye (61.5% to 78%) and reactive green dye (72% to 80.5%) using baby-corn-based activated carbon increased when the initial concentration of dye was reduced (65 ppm to 40 ppm) [123]. |
| Reactive dye | Reactive Red-120 | Cumin-herb-wastes-based activated carbon | The adsorption capacity was reduced with the increase in pH (pH 2 to 12) due to binding sites (activated carbon) being associated with hydrogen ions (such as bridging ligands between activated carbon surface and reactive red-120) at lower pH values [124]. The highest percentage removal was 95.8% (pH = 2, initial concentration = 50 mg/L, temperature = 22 °C). The Langmuir model (R2 = 0.976) shows the best correlation coefficient compared to Freundlich model (R2 = 0.9308), which represented monolayer adsorption. |
| Vat dyes | Vat yellow 4 | Mucuna pruriens seed-shells-based activated carbon | The optimum pH adsorption was at pH 2 because electrostatic attraction occurred (negative charge in anionic and positively charged in the adsorbent surface). Adsorption kinetics were well described by the pseudo-second-order model (R2 = 0.99) [125]. Adsorption data fit well with Langmuir model (R2 = 0.989 to 0.997, maximum adsorption capacity = 34.48 to 52.63 mg/g), indicating a monolayer adsorption process on the homogeneous surface. |
| Disperse dyes | Disperse Orange 30 | Rattan-sawdust-based activated carbon | The highest adsorption capacities were observed in specific conditions (temperature = 470 °C, activation time = 134 min, impregnation ratio of phosphoric acid:precursors = 1:4.5) [126]. |
| Disperse dyes | Disperse Orange 25, dispese Blue 7 | Zeolite | The maximum adsorption capacities were 125 mg/g and 109.8 mg/g for disperse orange and disperse blue, respectively. The removal of dye increased when the initial concentration was increased (10 to 40 mg/L) but dropped (from 60 to 40 mg/L) in higher concentrations (due to limited adsorption sites) [127]. |
| Azo dyes | Azo dyes | Coal-based activated carbon | The highest adsorption capacity was 333 mg/g in acidic conditions [128]. Thermodynamic studies: spontaneous (ΔG = −12.4 kJ/mol), endothermic (ΔH = 39.66 kJ/mol), and feasible (ΔS = 174.55 J/mol.K). Adsorption data were well-fitted with Langmuir model, pseudo-second-order kinetic isotherm, and D-R model. |
| Azo dyes | Direct Blue 71 | Chitosan-multi walled carbon nanotubes | The optimized experimental conditions were reported (pH = 6.25, concentration of dye = 3 mg/L, adsorbent dose = 0.1 g) [129]. Langmuir model: maximum adsorption capacity was 29.3 mg/g. The highest correlation coefficient can be seen in Langmuir model (R2 = 0.9985) and pseudo-second order model (R2 = 0.999). |
| Azo dyes | Direct Blue 78 | Egg-shell-based activated carbon | The maximum adsorption capacity was 13 mg/g (adsorbent dose = 0.5 g, pH = 5). Adsorption process can be described by the Freundlich model and pseudo-second-order kinetic model. Thermodynamic studies: spontaneous and endothermic process [130]. |
| Azo dyes | Methyl orange | Single-walled carbon nanotube (SWCNT), carboxylate functionalized single-walled carbon nanotube (SWCNT-COOH), amide functionalized single-walled carbon nanotube (SWCNT-NH2) | Equilibrium was achieved at various times [131] using different adsorbents, such as SWCNT-NH2, (15 min) and SWCNT-COOH (20 min), and single-walled carbon nanotube (20 min). |
| Azo dye | Maxilon Blue 5G | Gold–nickel supported activated carbon | Equilibrium was reached after 30 min. The adsorption kinetics followed the pseudo-second-order kinetic model. Maximum adsorption capacity was 542.9 mg/g [132]. |
| Azo dye | Maxilon Blue 5G | Multi-walled carbon nanotube | The highest adsorption capacity was 260.7 mg/g [133]. The homogeneity of the carbon nanotube surface site can be observed based on the Freundlich model. Thermodynamic studies: endothermic and spontaneous process |
| Acid dyes | Acid blue 25 | Banana peel, Durian-peel-based activated carbon | Langmuir model (R2 = 0.99): monolayer adsorption with uniform binding energy [134]. The highest adsorption capacities were found to be 70 mg/g and 89.7 mg/g in banana and durian-peel-based activated carbon, respectively, in the optimized conditions. The rate constant values were found to be 0.163 g/mg.min and 0.092 g/mg.min in banana and durian peel activated carbon, respectively, based on the pseudo-second-order kinetic model (R2 = 0.999). Thermodynamic studies: spontaneous (ΔG = −13.6 to −14.7 kJ/mol) and exothermic process (ΔH = −12.1 to −13.4 kJ/mol). |
| Acid dyes | Acid Orange 3 | Sodium-bentonite, CTAB modified bentonite | The maximum adsorption capacity was 50 mg/g (dye concentration = 50 mg/L, adsorbent dosage = 80 mg, time = 90 min, pH = 2) in the cetyltrimethylammonium bromide (CTAB) modified bentonite [135]. Thermodynamic studies: spontaneous and endothermic. The correlation coefficient in Langmuir model (R2 = 0.959) was high compared to Freundlich model (R2 = 0.957). |
| Acid dyes | Acid Yellow 36 | Saw dust, rice-husk-based activated carbon | The maximum adsorption capacities were 183.8 and 86.9 mg/g for saw dust and rice-husk-based activated carbon, respectively [136]. Kinetic studies revealed that intraparticle diffusion was a rate-limiting step. |
| Basic dyes | Crystal violet | Rice husk | The maximum adsorption of crystal violet onto sulfuric acid treated activated carbon and zinc chloride treated activated carbon was found to be 64.875 mg/g and 61.575 mg/g, respectively [137]. The adsorption data were described well by the Langmuir model and Freundlich model. The adsorption process was fully controlled by intra-particle diffusion. |
| Basic dye | Malachite green | Multi-walled carbon nanotube | The maximum adsorption capacity was 142.85 mg/g based on the Langmuir model (R2 = 0.997) [138]. |
| Basic dyes | Crystal violet | Magnetic NaY zeolite | The highest dye-removal percentage was 98.1% (pH = 10.3, temperature = 50 °C, time = 45 min, initial dye concentration = 10 mg/L, adsorbent mass = 46.2 mg) [139]. |
| Basic dyes | Methylene blue | Pea-shells-based activated carbon | The adsorption of methylene blue increased with an increase in the temperature (25 °C to 55 °C) due to an increase in diffusion rate (via external boundary layer and the internal pores of adsorbent) [140]. According to Langmuir model (R2 more than 0.99), the maximum adsorption capacities were increased from 246.91, 261.1, and 269.54 to 270 mg/g when the temperature was 25 °C, 35 °C, 45 °C, and 55 °C, respectively. Thermodynamic studies: free energy (−28.4 to −33.73 kJ/mol), enthalpy (1457 kJ/mol), and entropy (0.147 kJ/mol.K) values were reported. |
| Basic dyes | Methylene blue | Magnetite-loaded Multi-walled carbon nanotube | The highest adsorption capacity was 48.06 mg/g due to the electrostatic attraction and π-π stacking interaction [141]. Adsorption data can best be described by the Langmuir model and pseudo-second-order kinetic model. |
| Basic dyes | Methylene blue | Zeolite 4A (Ethiopia kaolin) | The highest percentage removal was 99.37% (time = 179.82 min, concentration of dyes = 10 mg/L, adsorbent dose = 39.05 mg). Langmuir model: maximum adsorption capacity was 44.35 mg/g [142]. |
| Basic dye | Brilliant green | Guava-tree-wood-based activated carbon | Removal of dye can be considered a physical process based on the Freundlich model (R2 = 0.975) [143]. Thermodynamic studies: free energy (−86.188 kJ/mol), enthalpy (43.025 kJ/mol), and entropy (128 J/mol.K) values were reported. It is clear that the percentage removal increased (83% to 99%) with increase in adsorbent dose (0.1 g to 0.8 g). |
| Basic dyes | Methylene blue | Azolla pinnata aquatic plant | The adsorption of dye can be predicted via machine-learning algorithms [144]. The support vector regression was considered the best machine-learning algorithm due to providing the highest correlation coefficient value (R2 = 0.994) compared to other algorithms. |
| Basic dyes | Methyl violet | Ipomoea aquatica root | The highest adsorption capacity was 551.5 mg/g in NaOH-treated Ipomoea aquatica root based on the Sips model [145]. SEM images demonstrated that different morphologies could be observed in the untreated (flat surface) and NaOH-treated Ipomoea aquatica root (irregular and rough surface). |
| Basic dyes | Methyl violet | Nepenthes rafflesiana pitcher and Nepenthes rafflesiana leaves | The adsorption kinetics were best represented by pseudo-second-order kinetic model in both samples [146]. The highest adsorption capacities were found to be 288.7 mg/g and 194 mg/g in Nepenthes rafflesiana pitcher and Nepenthes rafflesiana leaves, respectively. Thermodynamic studies: spontaneous and endothermic reaction. |
| Amphoteric dye | Rhodamine B | Corn-stalk-activated carbon | Adsorption data were described well by the Freundlich model and pseudo-second-order kinetic model [147]. The highest adsorption capacity was 5.6 mg/g (pH = 3, adsorbent dose = 2.5 g/L). |
| Amphoteric dye | Rhodamine B | Zeolite | The modified zeolites (HCl and cetyl trimethyl ammonium bromide) had a higher adsorption capacity than the unmodified zeolite [148]. The adsorption data followed Freundlich model and pseudo-second-order kinetic model. The highest adsorption capacity was 7.955 mg/g at 303 K based on the Langmuir model. |
| Amphoteric dye | Rhodamine B | Multi-walled carbon nanotubes | The adsorption data followed pseudo-second-order kinetic model, Langmuir model, and Temkin isotherm [149]. The percentage removal of dye increased when the contact time was increased but dropped when increasing the dye concentration. |
| Amphoteric dye | Rhodamine B | Modified clay | The highest removal efficiency of dye from dyeing factory (in Tabriz, Iran) reached 70% [150]. |
Table 10.
The preparation costs and operation costs of activated carbon.
| Description | References |
|---|---|
| Activated carbon was produced from industrial waste nutshell via physical activation technique (water vapor). Cost of production was $2.15/kg. | Marcelo and co-workers (2020) [151] |
| Pecan-shell-based activated carbon was synthesized through steam activation and phosphoric acid activation. The estimated production cost was $2.72/kg for steam-activated carbon (based on 1400 kg/day output and 320 days per year production). For the phosphoric acid activation process, the production cost was estimated at $2.89/kg. (based on 3000 kg/day output and 320 days per year production). | Chilton and co-workers (2003) [152] |
| Bamboo was used to produce activated carbon. The cost of production was $1.93/kg. | Keith and co-workers (2005) [153] |
| Oil palm waste was used to produce activated carbon. For the zinc chloride activation process, the production cost was estimated at $3.24/kg. For the steam activation process, the production cost was $2.72/kg. The highest product cost was $8.60/kg AC through modification by magnesium oxide. | Jia and Lock, 2020 [154] |
| Sugarcane bagasse was used to prepare activated carbon. Cost of production was $3.12/kg (according to 1940 kg per day and 320 days per year production) | Ng and co-workers (2003) [155] |
| Walnut shell was used to synthesis activated carbon. The estimated cost of production was $1.83/kg (300 days/year of production and 2 labor forces per shift (two shifts) for 24 h/day) Production of activated carbon through carbonization (600 °C) and chemical activation process (KOH and phosphoric acid). | Zahra and co-workers (2019) [156] |
| The removal of color from fruit candy waste by using commercial activated carbon (Norit Darco 12 × 40, a lignite-based activated carbon). Estimated cost of decolorization process was reported as USD 19/ton for red colorant, USD 70/ton waste for yellow colorant, and USD 245/ton waste for blue fruit candy waste. | Ozsoy and co-workers (2010) [157] |
| Synthesis of flax-shive-based activated carbon through steam activation or phosphoric acid activation process. The percentage of yield of the activated carbon produced by chemical activation with phosphoric acid was 32%. The production cost was $7.10–8.90/kg. The percentage of yield of the activated carbon prepared by steam activation was 16%. The production cost was $1.50–4.30/kg. | Thomas and co-workers (2009) [158] |
| The sales prices for the generation (coconut shell as raw material), regeneration, and integrated plants were found to be 674.31, 514.66, and 536.66 USD/ton of product, respectively. Experimental findings showed that regeneration process of spent activated carbon obtained from petrochemical industries yielded more profits. | Tinnabhop and Wanwisa (2017) [159] |
Table 11.
The preparation costs and operation costs of fly ash.
| Description | References |
|---|---|
| The cost of waste baggase fly ash was $2 /ton (included transportation cost and rolling cost). The cost of finished product was $15 /ton (included transportation costs, chemicals, electrical energy, and labor fee). | Ahmaruzzaman, (2010) [160] |
| The cost of fly ash ranges from $15/ton to $40/ ton (majority of the cost was for transportation) | Sanchez (2014) [161] |
Table 12.
The preparation costs and operation costs of zeolite.
| Description | References |
|---|---|
| Total costs were recorded to be $1.3/kg based on the experimental results. The zeolite was produced from coal fly ash via the fusion method. For a 5000 kg/h raw material feed, a payback period of 7.1 years was feasible over 20-year operation time. Total equipment costs (fired heater, fusion reactor, cyclone, fluidized bed heat exchange tower, intermediate product storage, aging tank, hydrothermal reactor, pump, screw feeders, belt conveyor, multi-stage solids washers, rotary vacuum drum filter, rotary dryer, product storage, heat exchanger, forced draft fan, air compressor, stack) were $36,092,200. Overall results indicated that the utility prices for wastewater treatment were $83.79/1000 m3. | Jaime and co-workers (2017) [162] |
| This study was conducted in India. The Indian currency is called the Indian Rupee (Rs). Total project cost was Rs3.9crore with a plant capacity of 7500 kg/d. The profit margin was Rs5/kg and annual profits were Rs110.25lakh when the annual production was 2250 tons/year. The investment payback period was estimated to be 42 months. Overall results showed the cost of production for zeolite-A was Rs 18/kg, cheaper than commercial zeolite (Rs 23/kg). | Biniwale and co-workers (2001) [163] |
| Kaolin was used to produce zeolite. The zeolite 5A cost will be reduced (42 cents to 34 cents per pound) without heat integration. The product cost of the 67,000 metric tons/year plant was reduced to 22 cents/pound when the heat integration was included. | Ihab and Jian (2012) [164] |
| Zeolite of X-type was produced by using coal fly ash through alkali fusion and hydrothermal treatment. The cost was estimated to be cheaper than commercial 13X zeolite (almost one-fifth in the market). | Keka and co-workers (2004) [165] |
| Total cost for the production of NaA zeolite was found to be $0.003 and $1.16 by using microwave method and hydrothermal method, respectively. | Sapawe and co-workers (2013) [166] |
Table 13.
The preparation costs and operation costs of carbon nanotube.
| Description | References |
|---|---|
| The cost of carbon nanotube is dependent on purity and supplier. The cost of multi-wall carbon nanotube is $0.5–100/g. The cost of single-wall carbon nanotube is $20–2000/g. | [167] |
Publisher’s Note: MDPI stays neutral with regard to jurisdictional claims in published maps and institutional affiliations. |
© 2022 by the author. Licensee MDPI, Basel, Switzerland. This article is an open access article distributed under the terms and conditions of the Creative Commons Attribution (CC BY) license (https://creativecommons.org/licenses/by/4.0/).
Share and Cite
MDPI and ACS Style
Ho, S. Low-Cost Adsorbents for the Removal of Phenol/Phenolics, Pesticides, and Dyes from Wastewater Systems: A Review. Water 2022, 14, 3203. https://doi.org/10.3390/w14203203
AMA Style
Ho S. Low-Cost Adsorbents for the Removal of Phenol/Phenolics, Pesticides, and Dyes from Wastewater Systems: A Review. Water. 2022; 14(20):3203. https://doi.org/10.3390/w14203203
Chicago/Turabian StyleHo, Soonmin. 2022. "Low-Cost Adsorbents for the Removal of Phenol/Phenolics, Pesticides, and Dyes from Wastewater Systems: A Review" Water 14, no. 20: 3203. https://doi.org/10.3390/w14203203
Note that from the first issue of 2016, this journal uses article numbers instead of page numbers. See further details here.