Article

The Role of the Catchment Area in Shaping Water Quality in the Lowland Springs of the Knyszyn Forest (NE Poland)

by
Elżbieta Jekatierynczuk-Rudczyk
1,
Piotr Zieliński
1,
Katarzyna Puczko
1,*,
Krzysztof Micun
2 and
Emilia Puczyłowska
1
1
Department of Environmental Protection, Faculty of Biology, University of Bialystok, Ciołkowskiego 1J, 15-245 Bialystok, Poland
2
Faculty of Civil and Environmental Engineering, Bialystok University of Technology, Wiejska 45 E, 15-351 Bialystok, Poland
*
Author to whom correspondence should be addressed.
Water 2022, 14(20), 3202; https://doi.org/10.3390/w14203202
Submission received: 6 September 2022 / Revised: 5 October 2022 / Accepted: 8 October 2022 / Published: 11 October 2022
(This article belongs to the Special Issue Presence of Microorganisms in Soil and Water)

Abstract

:
The Puszcza Knyszyńska springs are an important element of the environment, conditioning the high geo- and biodiversity in the region. These springs are layered outflows that drain the waters of the Quaternary level. More than 200 outflows have been cataloged, and 80 of them have measured/estimated yields and analyses of their water qualities. During periods of low water levels, the discharge efficiency most often fluctuated within a range of 0.5–2.0 dm3·s–1. In light of the applicable legal standards, the tested waters were of excellent quality. They belonged to the two hydrochemical types HCO3-Ca and HCO3-Ca-Mg, indicating the Quaternary aquifer’s homogeneity in the post-glacial areas. Small concentrations of most of the chemical parameters of water were found in the forest springs. Larger transformations in the chemical composition of water occurred in the outflows located in agricultural land and rural areas. A characteristic feature of the chemical composition of the water in the region’s lowland springs was an increased concentration of biogenic compounds (nitrogen, phosphorus, and carbon compounds), both organic and inorganic. The average concentration of dissolved organic carbon in the water of the lowland springs in summer exceeded 4 mg·dm−3. In some outflows, most often of a swamp nature or located in peat areas, the concentration of dissolved organic carbon even exceeded a dozen or so mg·dm−3.

1. Introduction

Springs are unique ecosystems at the interface between groundwater and surface water [1,2] and between the terrestrial and the aquatic habitats [3]. It is a complex environment encompassing immense biodiversity for soil and water microorganisms that are the primary agents responsible for key ecosystem processes [4,5,6,7]. Springs occur more frequently in mountains and upland areas, and there are fewer reports on the biology and ecology of typical springs in lowlands of Central Europe [8,9]. Springs are mostly low-trophic ecosystems, except for those located in areas subject to strong human pressure, where groundwater may contain many nutrients or even be oxygen-deficient [10,11]. A water quality analysis in Bialystok indicated the lowest water trophy in the springs compared with other water types [11,12,13]. Unique wetland ecosystems may develop around springs, e.g., soligenous bogs or spring marshes. Sometimes, as a result of erosion in the outflow zone, concave landforms form—spring niches [14]. In lowland areas, these are shallow, but they contribute to the diversification of the old-glacial landscape, determining its geodiversity and providing a habitat for valuable flora and fauna species, often of a relict nature [15]. Significant differences in the number of bacteria in the springs from this area were also found, which reflected how the direct catchment was managed [4]. It influences the area’s high biodiversity, improving local water relations [3,5,6,7].
Although springs have been recognized as important, rare, and globally threatened ecosystems, there is, as of yet, no consistent and comprehensive classification or common lexicon for springs, especially for those in lowland areas [16]. In lowland areas, the most useful is the hydrobiological classification of springs reflecting the habitat’s quality features [10].
The scientific, educational, and landscape values of natural groundwater outflows and their natural, economic, and cultural significance in lowland areas are increasingly recognized [12]. Springs usually drain the first aquifer. In lowlands, the waters of the first aquifer are shallow and, therefore, are exposed to anthropogenic pollution. The use of the surface catchment is a good indicator of the degree of transformation of the water quality of the first aquifer. Current research on the springs in the Knyszyn Forest makes this possible. The crenological studies in the Knyszyn Forest (PK) were aimed at:
-
Drawing attention to the presence and importance of natural groundwater outflows in the lowlands;
-
The assessment of the physical and chemical compositions of the waters showing the specificity of the water quality of lowland springs (a significant concentration of biogenic elements that determine their fertility);
-
The impact of land use as a factor differentiating the quality of shallow groundwaters flowing onto the surface in the form of springs.
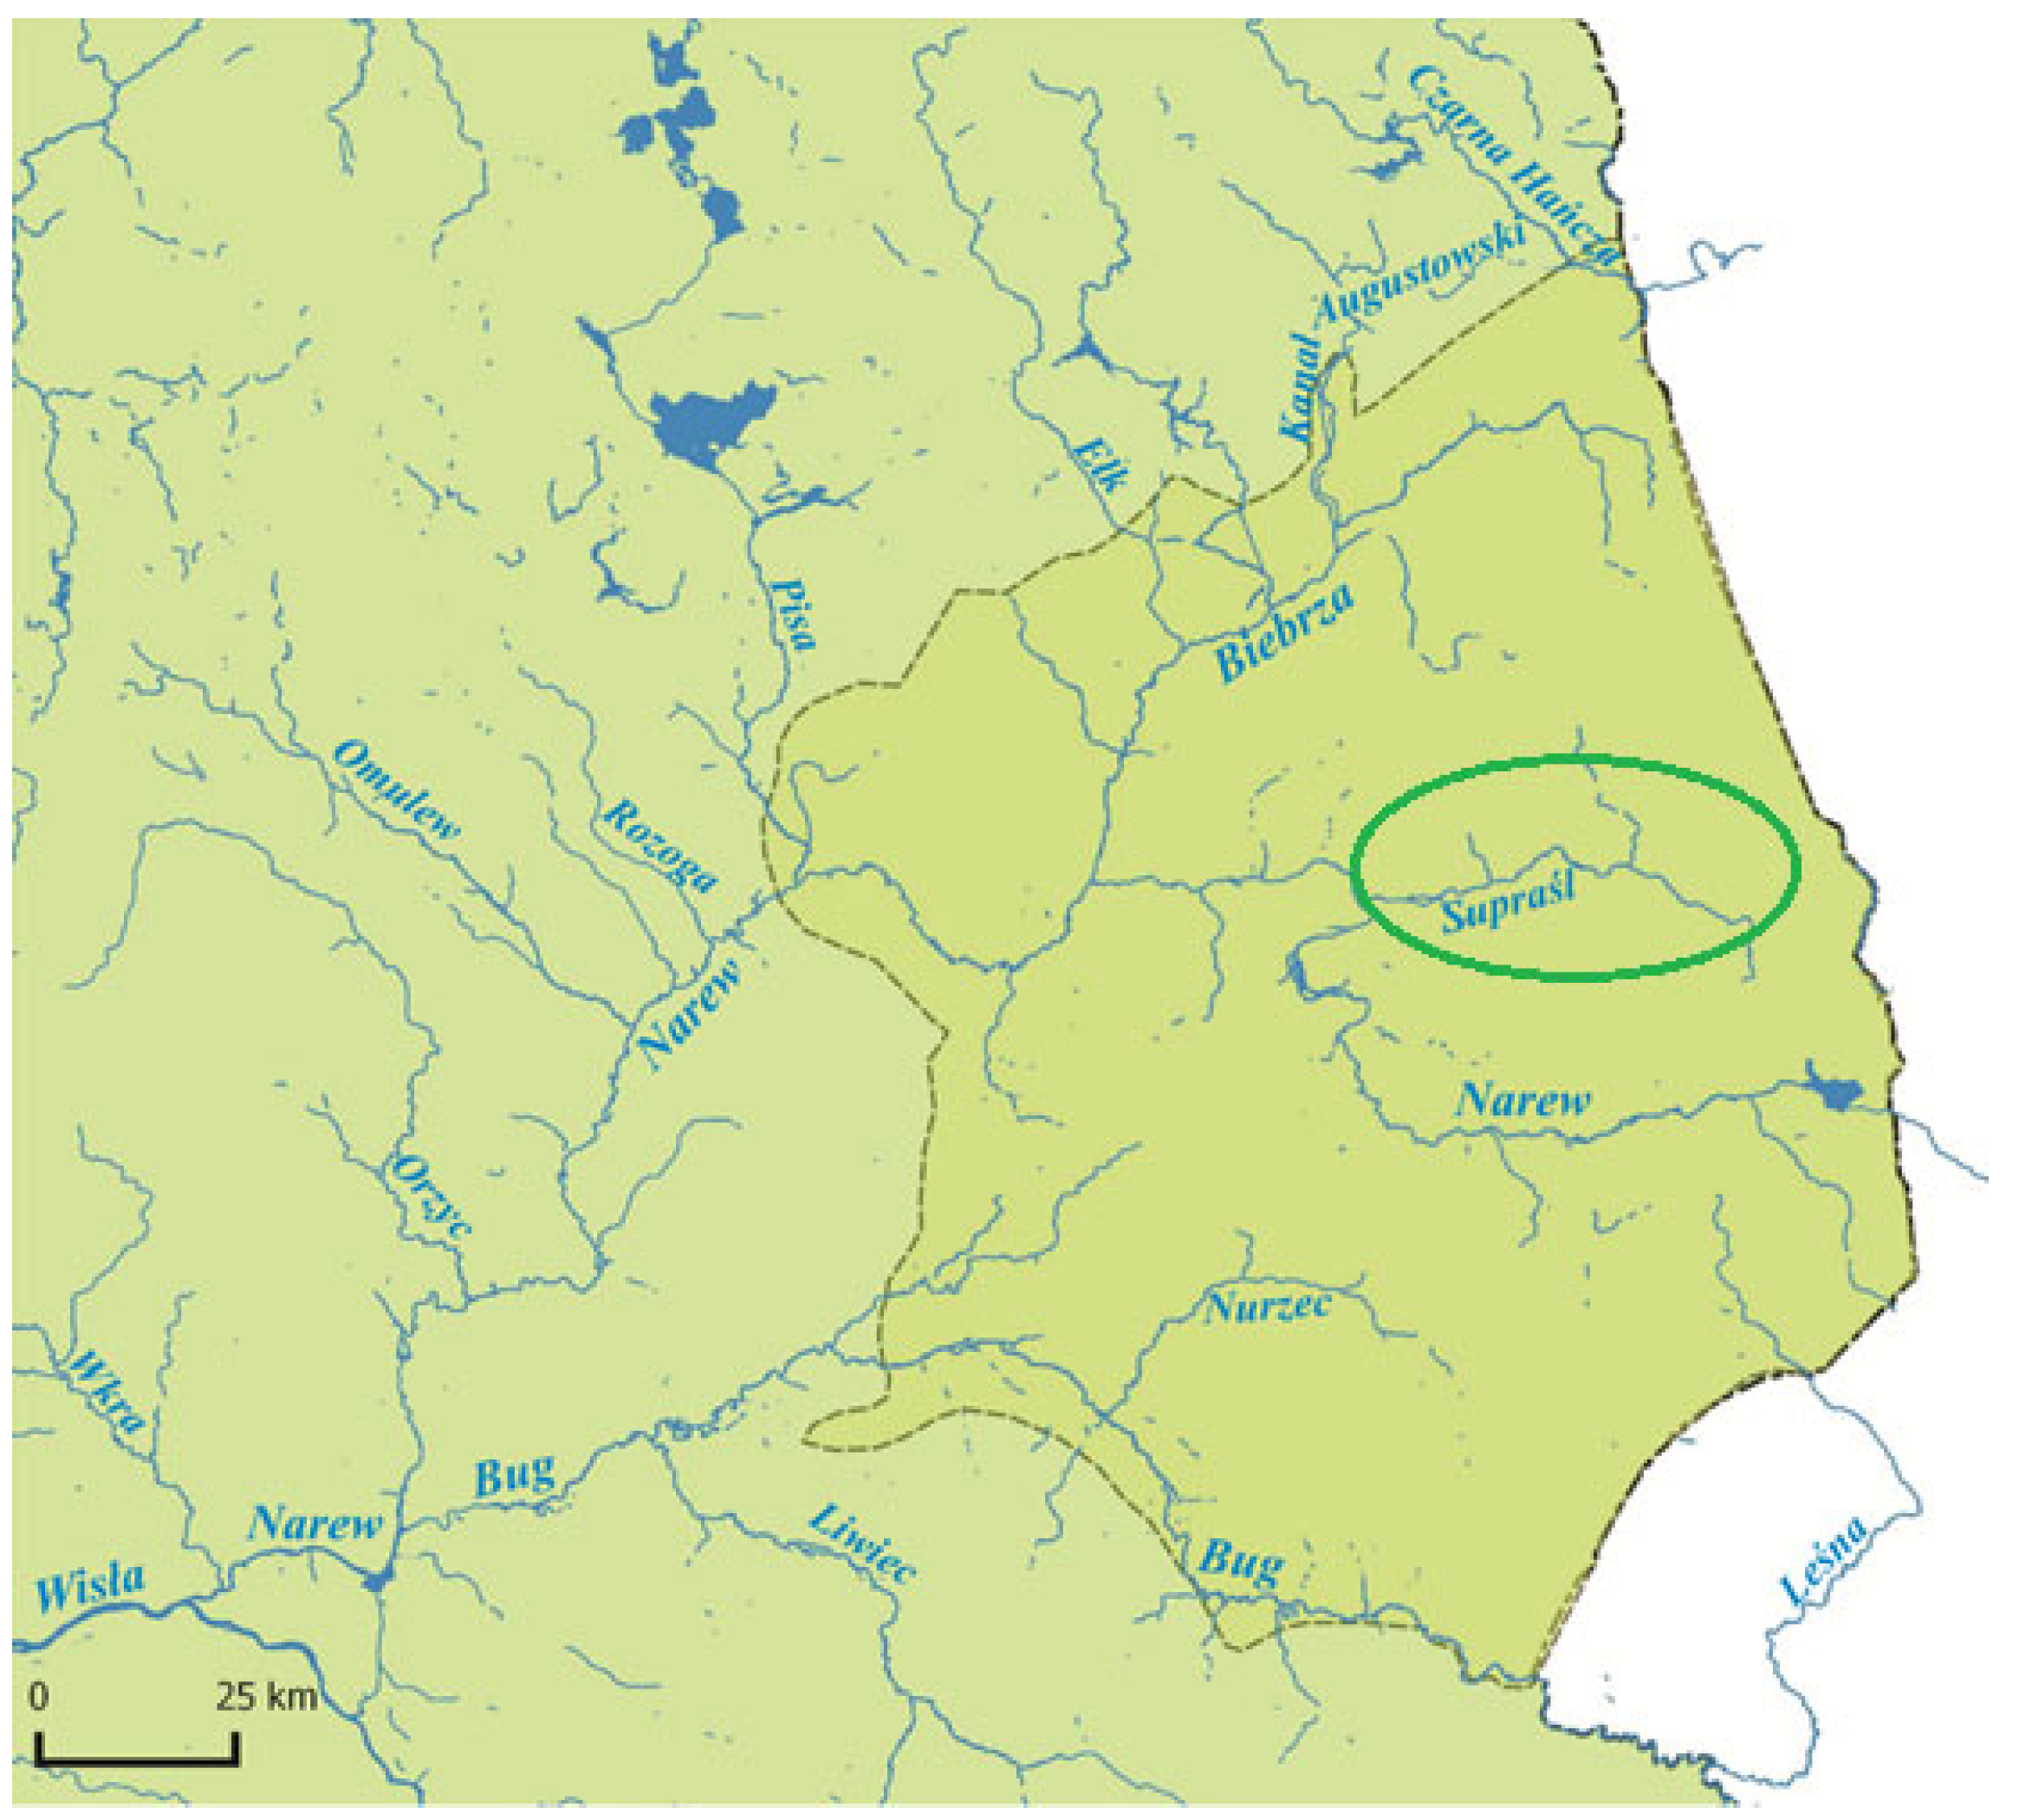
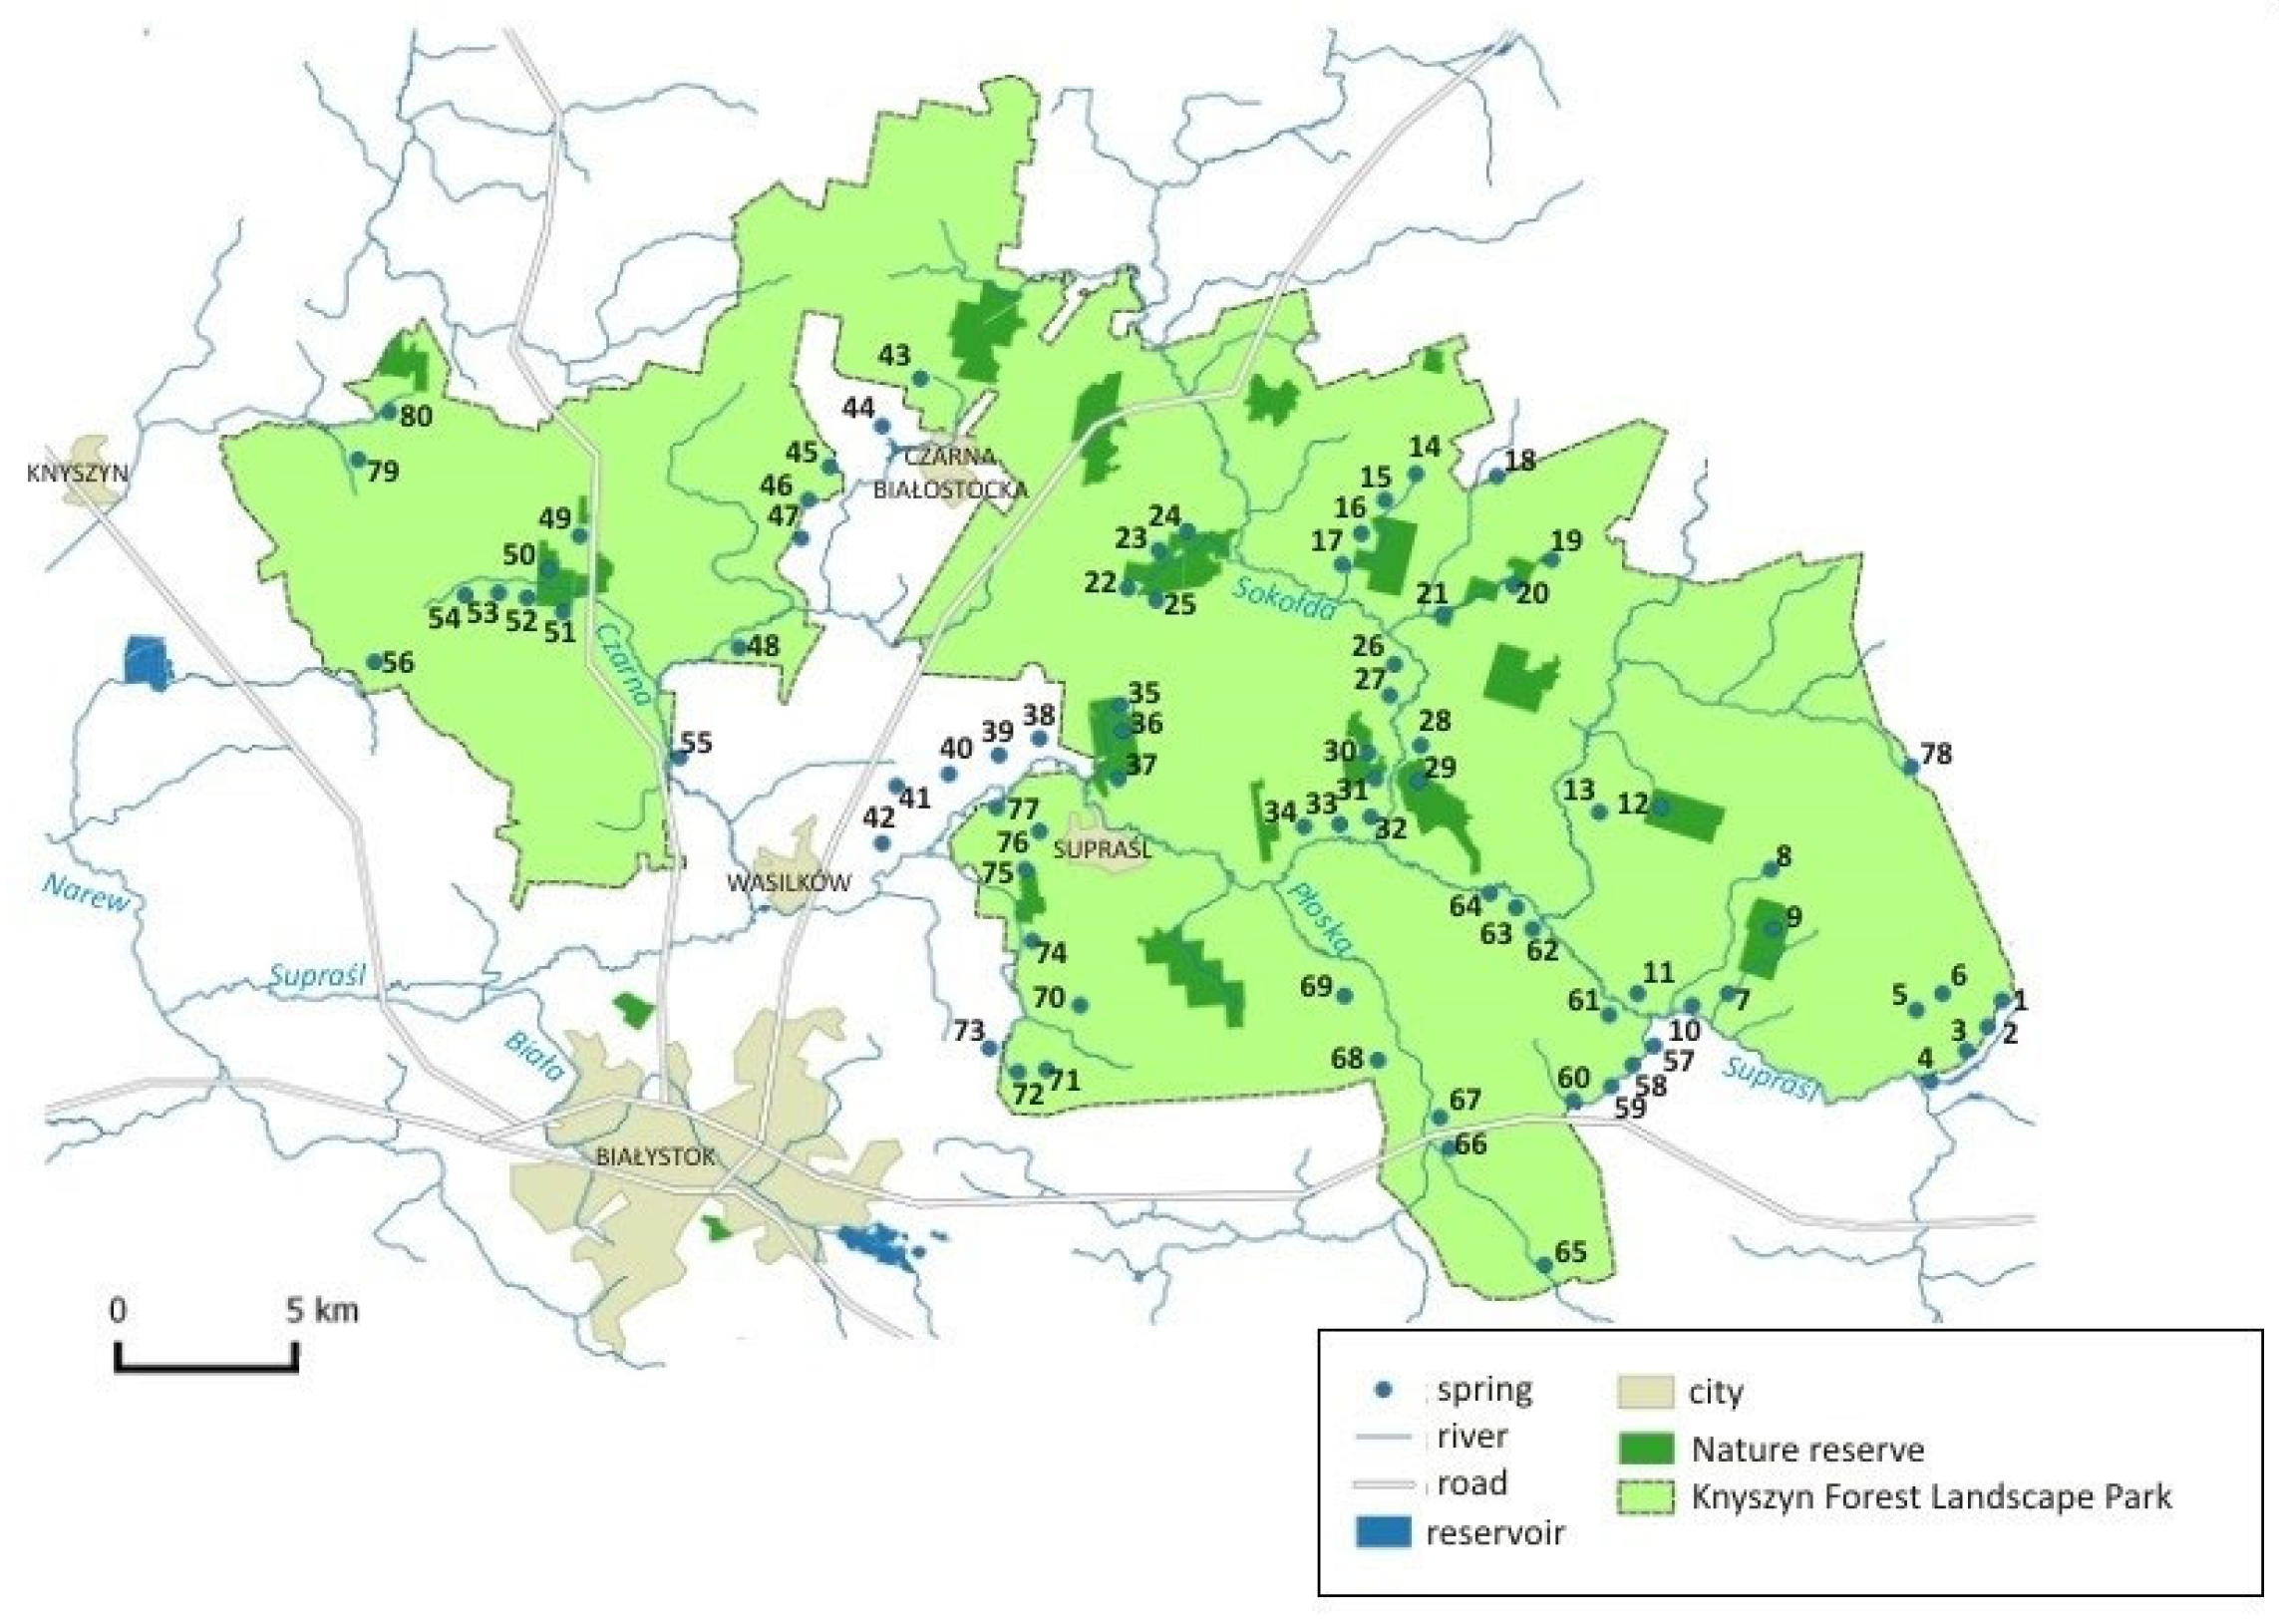
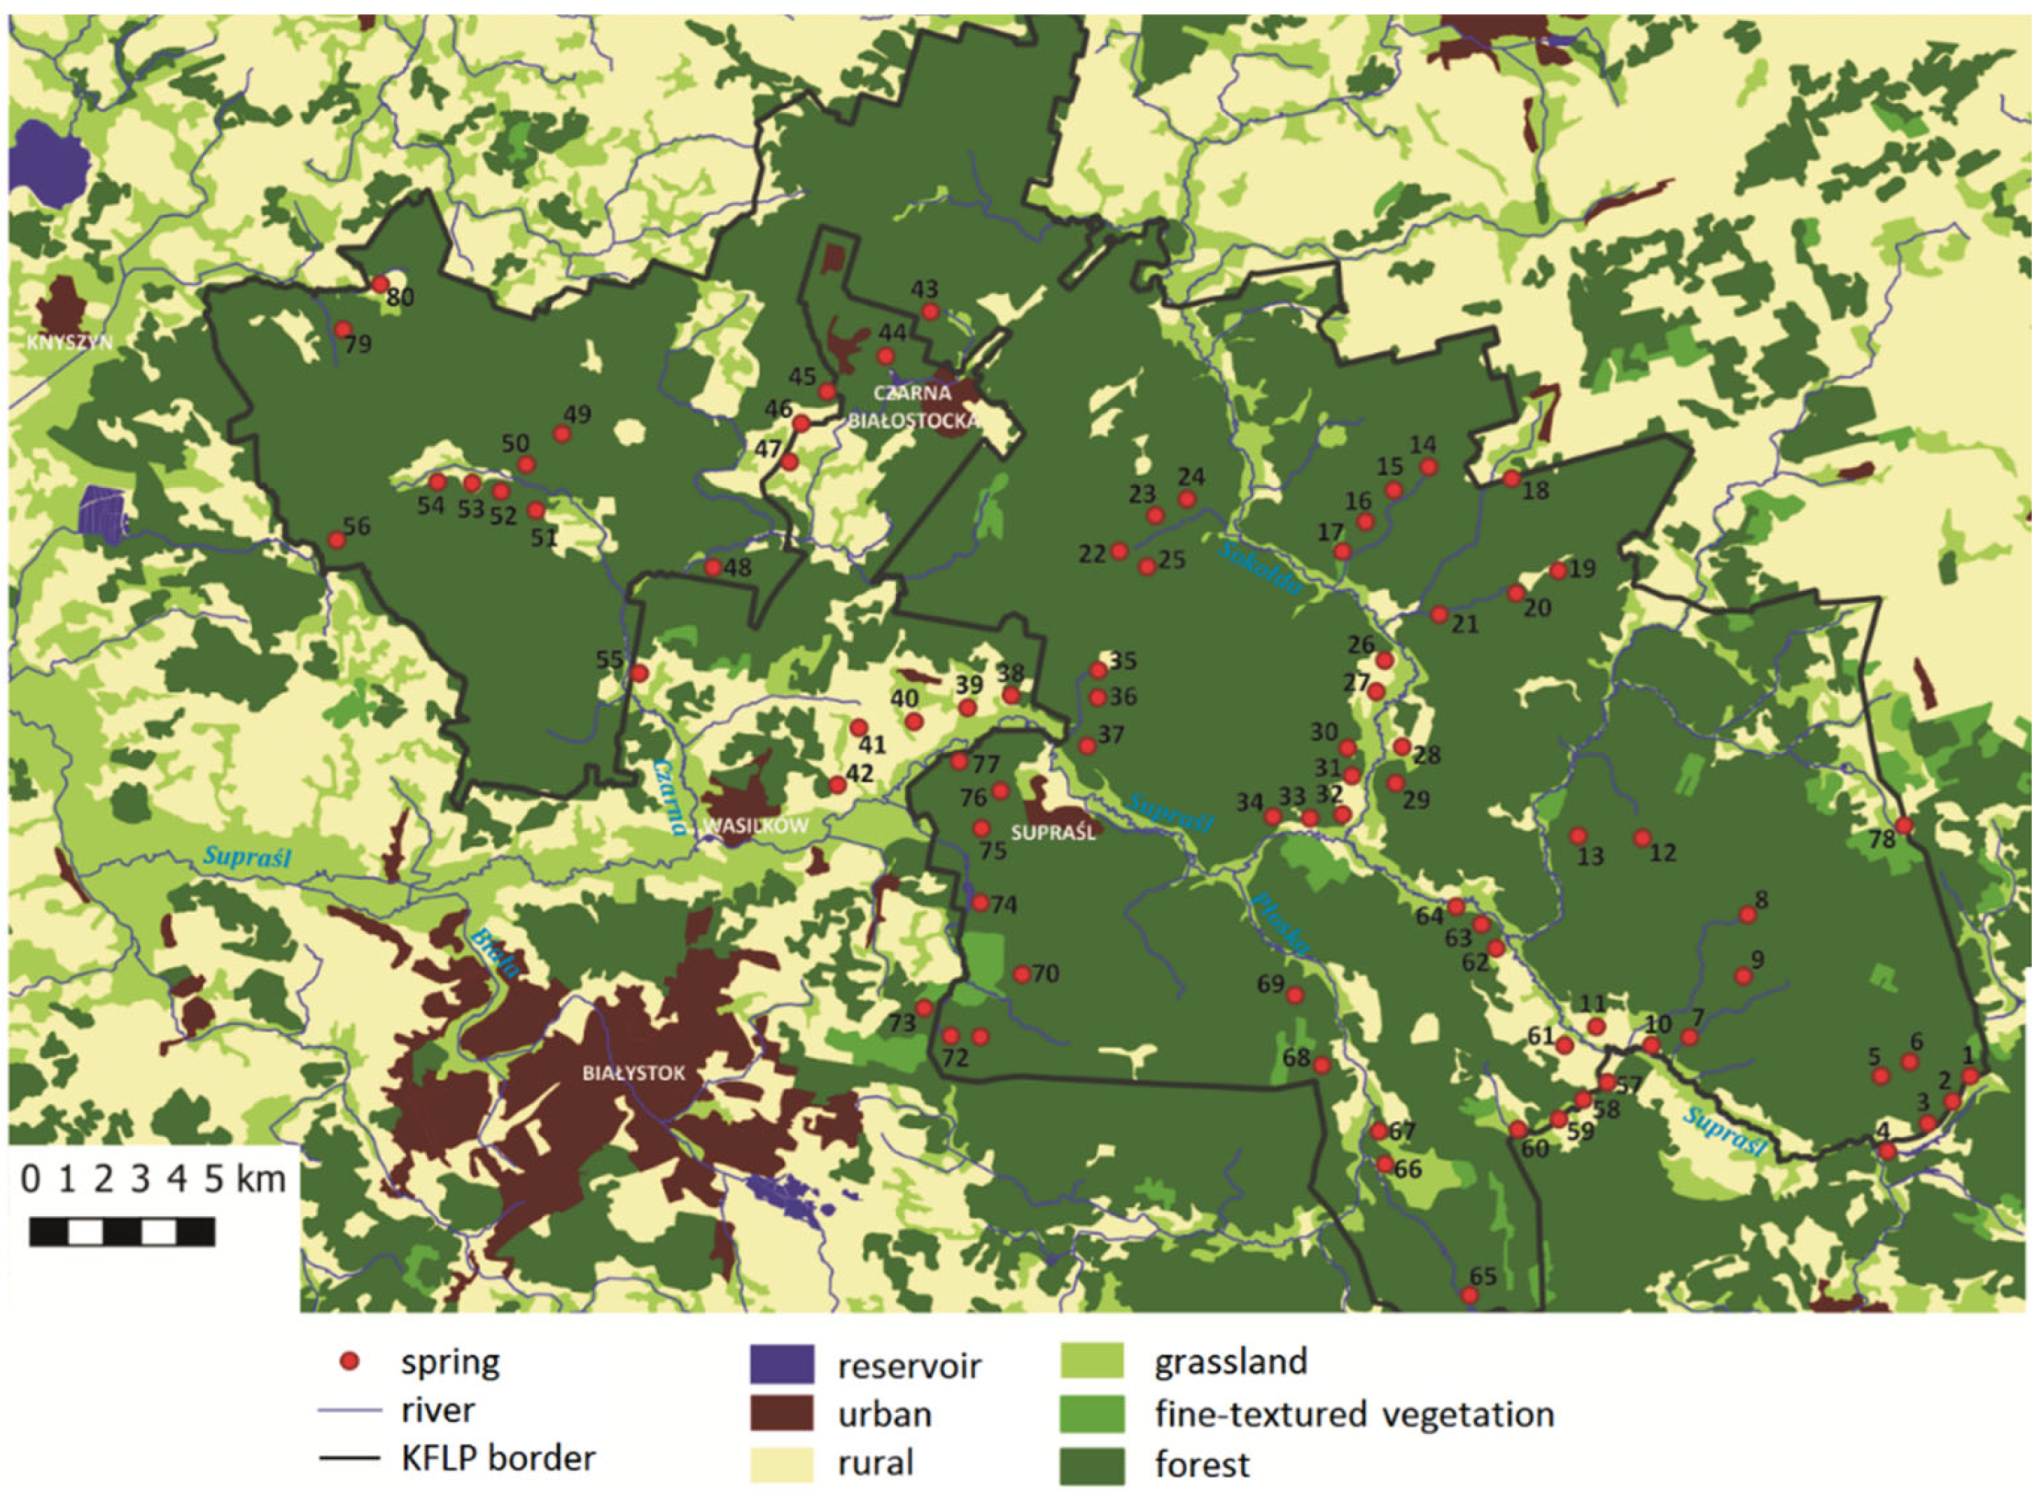
2. Study Area

The research area was located in Poland (Central Europe). The crenological studies were carried out in the Puszcza Knyszyńska located in the North Podlasie Lowland, which is part of the Podlasie-Belarusian Wysoczyzna sub-provinces, extending into the western part of the West Russian Lowland [17,18]. The Puszcza Knyszyńska is the second largest (after the Puszcza Białowieska) forest complex in the Podlaskie Voivodeship. It occupies over 126 thousand ha. In 1988, the Professor Witold Sławiński Puszcza Knyszyńska Landscape Park was created on its territory (PKLP). The Puszcza Knyszyńska has also been included in the Natura 2000 network. The special bird protection area “Puszcza Knyszyńska” (PLB200003) covers the entire Puszcza Knyszyńska and the Gródecko-Michałowska Basin. There are at least 38 species of birds from Annex 1 of the Birds Directive and 14 species from the Polish Red Book of Animals. The area of special protection of habitats “Ostoja Knyszyńska” (PLH200006) covers the entire forest complex of the Puszcza Knyszyńska. The forest areas are cut by agricultural valleys of small rivers and clearings. In the description of “Ostoja Knyszyńska”, attention was drawn to the varied topography and the mosaic of habitats which determine the great landscape value of this area. Numerous springs were considered peculiarities.
From a hydrological point of view, the area in question lies in the Baltic catchment, almost entirely in the Supraśl catchment belonging to the Upper Narew catchment (Figure 1), and extends along the main watershed between the Vistula and Neman catchments [19,20]. The natural drainage axis is the Supraśl river with its right-bank tributaries—Czarna, Sokołda, and Słoja, and left-bank tributaries—Płoska, Pilnica, and Biała.
In the North Podlasie Lowland, the Precambrian crystalline rocks of the Mazurian-Belarusian Anteclysis occur quite shallowly below the surface. This ascent is part of the great Eastern European Platform [21]. The series of sedimentary rocks older than the Quaternary is not very thick, with numerous stratigraphic gaps. The pieces of the Jurassic and Cretaceous appear directly on the crystalline foundation. The tertiary sediments occur in the forms of islands, e.g., in the Gródecko-Michałowska Basin. The quaternary sediments were formed during the Pleistocene glaciations, and their thicknesses range from 130 to 220 m [18,22,23]. They are represented by boulder clays, gravel-sand deposits, dammed lake silts, and varved clays (Figure 2a–c). The bottoms of the river valleys and the excavation depressions are filled with Holocene formations: silt, sand, gravel, gyttja, and peat [21].
The Upper Narew catchment, especially the Supraśl catchment, is richly carved for an old-glacial area [24,25]. Among the convex forms in the landscape, the Gródek-Czarna Białostocka field embankment, recognized as an esker, stands out [24]. Other convex landforms are latitudinal hills made of layered sand and gravel. These forms are considered to be melted-out glacier depression hills. The most common convex forms in the Upper Narew catchment are kames. The concave forms include melting basins, valleys, and shallower bowls and basins. The melting forms in the discussed area occur in groups, creating a complex polygenetic system of depressions connecting the Supraśl valley with an erosion base. The numerous springs are the consequence of the diversified relief of the area.
The main and most important groundwater environment of North-Eastern Poland is the Quaternary formations. The porous nature of the groundwater in the region is a common feature. They occur mainly in the infiltration equilibrium, and the shallowest aquifer occurs in the sands and gravels lying on the clays of the Warta glaciation [26]. The distribution of the springs in the Puszcza Knyszyńska is uneven (Figure 3). The largest number of springs occur in the valleys of the rivers: Krzemianka, Czarna, Jałówka, and Świniobródka. These are valley outflows (39 objects). There are slightly more outflows located at the feet of slopes and flanks (41 objects). From the hydrobiological point of view, rheocrenes dominate—55 springs (Figure 4), whilst there are fewer helocrenes—21 springs and limnocrenes—4 springs (Table 1). Among the limnocrenes, two artificially created ones were distinguished: No. 11 is a timbered spring in the countryside (Figure 5), and No. 57 is a limnocrene created by blocking the outflow of water with a beaver dam (Figure 6).

3. Material and Methods

3.1. Map Analysis and Field Research

The springs in the Puszcza Knyszyńska were researched. More than 200 outflows were cataloged. Outflows from which there was an outflow throughout the year (80 springs) were selected for the research (Figure 3). Water samples were collected in the summer (July/August) at the places of concentrated water outflow from the spring niches. In the field, the yield was measured with gauging weirs. Often, the yield was estimated. The geographic coordinates of the spring niches and the development of the direct catchment in the area were determined. In the fall period of the analysis of the thematic maps, the hydrological and geomorphological locations of the springs, the use of the catchment area, and the hydrobiological types were determined. Based on the land use of the Knyszyn Forest, four types of land use were selected: forest, rural, grassland, and fine-textured vegetation (FV).

3.2. Water Quality Assessment

In the field, using a HQ40D multiparameter probe, the following were examined: water temperature, reaction, electrolytic conductivity of water (EC), oxygen concentration, oxygen saturation (OS), and oxidation reduction potential (ORP). The water samples were collected in polyethylene liter containers for further analysis.
Detailed chemical analyses of the water samples in accordance with ISO standards were carried out in the laboratory of the Department of Environmental Protection in the University of Bialystok. Calcium ions (Ca2+) were determined via titration with disodium EDTA against calcite methods. HCO3 ions were determined via titration with hydrochloric acid (HCl) in the presence of an indicator, methyl orange [27]. The remaining water chemical parameters were determined using the spectrophotometric method with a SpectraMax M2, with the application of procedures and reagents by Riedel-de Haen. Sodium (Na+) and potassium (K+) ions were determined via flame photometry. The color of water on the Pt scale, concentration of phenols (method with Folin–Ciocalteu’s reagent), forms of phosphorus (molybdate method), and forms of iron (method with ortho-phenanthroline) were determined using spectrophotometric methods [27]. Sulfate (SO42−) ions were determined using the nephelometric method with barium chloride and chloride (Cl)ions using a method with mercury thiocyanate.
Water was filtered through a filter GF/F with a pore diameter of 0.45 μm. Five fractions of phosphorus and iron were analyzed:
  • Total (TP, TFe) samples of unfiltered and mineralized water;
  • Dissolved (DP, DFe) samples of filtered and mineralized water;
  • Reactive (SRP, SRFe) samples of unfiltered and non-mineralized water;
  • Particle fractions (PP, PFe) were calculated using the following formulas: PP = TP − DP PFe = TFe − Dfe;
  • Dissolved organic fractions (ODP, ODFe) were calculated using the following formulas: ODP = DP − SRP ODFe = DFe − SRFe.
Nitrate nitrogen (NO3-N) was determined using the reduction method with N-(1-naphthyl) ethylenediamine, nitrite nitrogen (NO2-N) with sulphanilic acid using the chromotropic acid method, and ammonium nitrogen (NH4+-N) using the indophenol method. Kjeldahl nitrogen was analyzed with a Tecator 2300 (Kjeldahl analyzer). Mineral nitrogen (TIN) was calculated as the sum of NH4+-N, NO3-N, and NO2-N. Total nitrogen (TN) was calculated as the sum of Kjeldahl nitrogen, nitrites, and nitrates. Dissolved organic carbon concentration (DOC) was determined using a Shimadzu TOC-5050A analyzer with an IR detector [28]. Aromaticity of organic matter (SUVA) was calculated according to the formula: SUVA = Absλ260 × 1000/DOC [abs 1 cm·1gC−1].

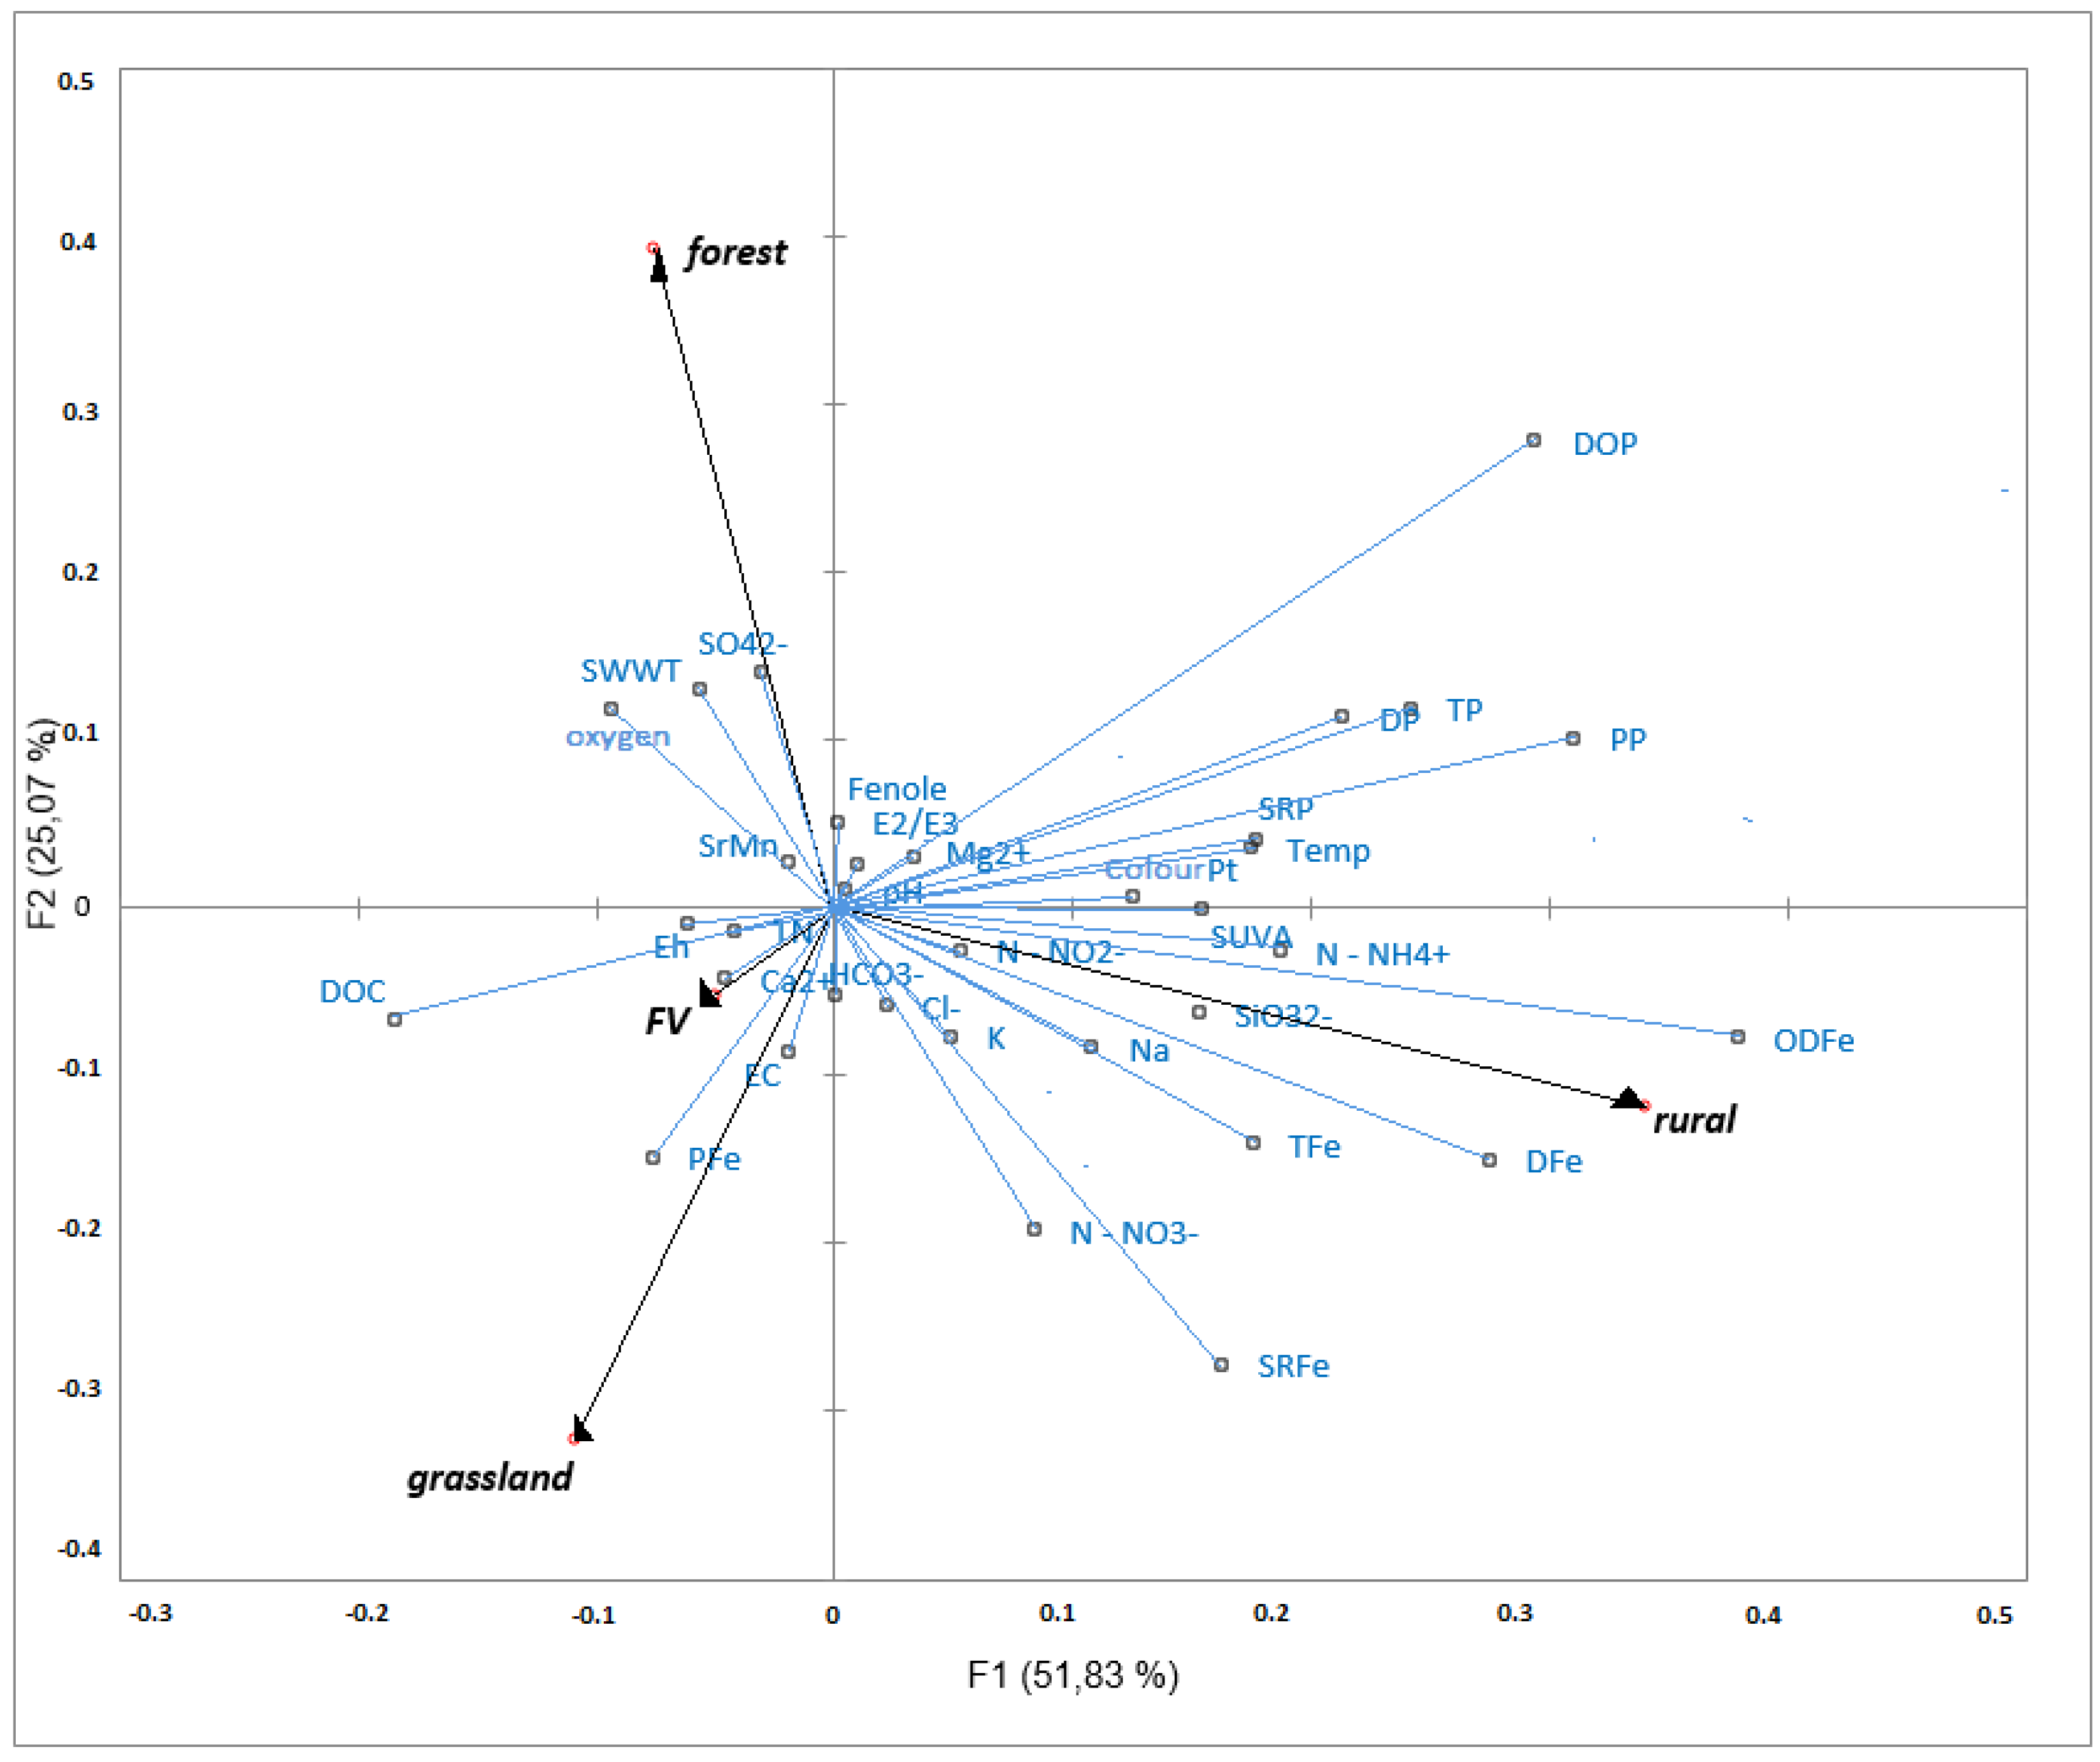
3.3. Statistical Analyses

The statistical calculations were performed with Statgraphics 5.0 for Windows and XLSTAT version 2017.6. The tested waters were classified according to the Alekin and Szczukariew–Prikłoński classifications [29]. These classifications were developed with all-natural waters in mind: atmospheric, surface, and underground. The Alekin classification considers one dominant anion, based on which the water class is determined, and one dominant cation, which determines the group of water distinguished within each class. Individual groups are also divided into types marked with Roman numerals, depending on the ions’ relations. Due to the prevalence, the hydrochemical types of water are presented according to the Szczukariew–Prikłoński classification. The class name is made up of the principal ions, with the anion name being given first [29].
Using PHREEQC Interactive 2.15 software, the water analyses results’ correctness, the calculations of the ionic compositions of the waters, and the saturation indexes (SI) were assessed. The correctness of a water analysis can be assessed based on the water ion balance. The analysis is correct when the following condition is met:
K t A n K t + A n × 100 % 10 %
where:
Kt = ∑ miKt·ziKt;
An = ∑ mjAn·zjAn;
miKt—cation concentration [mol·dm−3];
mjAn—anion concentration [mol·dm−3];
ziKt—valence of cations;
zjAn—valence of anions.
If the analysis error exceeds 10%, the analysis cannot be used to calculate the ionic composition of the water [30]. Based on the described method of statistical verification, all hydrochemical analyses were performed correctly in the conducted tests. Additionally, the migrations of macronutrients dissolved in the spring waters were determined [31,32]. The spatial analysis of the hydrochemical data was performed with the Surfer computer program.
Several statistical models were used to describe the relationship between the water quality and land use of the catchment area. First, the Kolmogorov–Smirnov test of the normality of the distribution was performed. Most of the variables did not distribute normally, so non-parametric statistical tests were conducted. The Spearman’s rank correlation and a redundancy analysis (RDA) were used to describe the water-quality–landscape interactions. A log transformation of exploratory and response variables was used prior to the regression analysis to reduce deviation from normality [33]. A partial RDA was employed to estimate the total variation in water quality data, which can be explained by the four groups of environmental variables, and to partition the influence of each group. The resulting graph of an RDA can express a water sample’s physical and chemical compositions and explanatory variables in the same coordinate plane. The length of the arrowhead of the explanatory variable indicates the influence degree of the explanatory variable on the water quality. A longer arrowhead indicates a larger influence. The angle between the explanatory-variable arrow and the water sample’s physical-and-chemical-compositions line indicates the correlation between them. When the angle is acute, they are positively correlated, and when it is equal to 90 degrees, there is no correlation.

4. Results

During periods of low water levels in the summer, the efficiencies of the natural groundwater outflows in the Puszcza Knyszyńska most often fluctuated within a range of 0.5–2.0 dm3·s–1.
The tested waters, according to the Alekin classification, belonged to the bicarbonate class C and the Ca group of the second type (r HCO3 < r Ca2+ + Mg2+ < r HCO3 + r SO42–) (CIICa). Most of them were three-ion waters and, less often, double-ion waters. According to the Szczukariew–Prikłoński classification, they were HCO3-Ca and HCO3-Ca-Mg types (Table 1). The Piper diagram is a graphic representation of the hydrochemical types of spring water showing the waters’ similarities (Figure 7).
The average water temperature in the studied springs in the summer period in 2014–2015 was 14.2 °C. In the complex of the most efficient springs (springs in Pieszczaniki, No. 57–61), the water temperature in the summer was around 9 °C. The springs’ water was characterized by a neutral pH (7.81 ± 0.44 pH), good oxygenation (OS 74 ± 74%), and a moderate concentration of dissolved mineral compounds (EC 399 ± 90 µS cm–1). The redox potential was within wide limits and slightly above 70 mV (Table 2), on average. A clear spatial variation in the water’s physical characteristics was noted in the springs of the Puszcza Knyszyńska (Figure 8a–d).
The analyses of the chemical compositions of the waters carried out with PHREEQC Interactive 2.15 software showed that in the Puszcza Knyszyńska springs, ionic forms were the basic form of occurrence of dissolved mineral compounds (HCO3, Cl, SO42−, NO3, Ca2+, Mg2+, Na+, K+, NH4+, and Fe2+).
Alkaline earth elements, calcium and magnesium, were also present at small concentrations in the forms of hydrated molecules of sulfates, carbonates, and hydrogen phosphates (CaHCO3, CaCO3, CaSO4, CaHPO4, MgHCO3, MgCO3, MgSO4, and MgHPO4). Sodium and potassium cations were present practically completely in the ionic form. Trace amounts of the hydrated neutral sodium bicarbonate molecule were recorded, but its content in the solutions did not exceed 1%. The mean concentration of calcium slightly exceeded 75 mg·dm−3, magnesium 14 mg·dm−3, sodium 5 mg·dm−3, and potassium 1.5 mg·dm−3 (Table 2).
The main forms of bicarbonates in the waters of the Puszcza Knyszyńska springs were the bicarbonate ion and carbon dioxide (HCO3, CO2). The average concentration of HCO3 oscillated around 290 mg·dm−3. The average CO2 concentration in the water, calculated with PHREEQC, was about 400 µmol·dm−3. Chloride ions appeared only in the anionic form (11.5 ± 8.7 mg·dm−3) and sulfate ions mainly in the anionic form and neutral aqueous complexes of calcium and magnesium sulfates (CaSO4 and MgSO4) (27.7 ± 8.0 mg·dm−3).
The total iron content in the outflow waters ranged on average between 0.09 and 5.20 mg·dm−3. Most iron compounds (65%) were dissolved, with the reactive iron form accounting for 13% and the molecular form accounting for about 30% TFe. The main forms of iron in the waters of the Puszcza Knyszyńska springs were the Fe2+, FeHCO3, and FeCO3.
The average values of the saturation indexes (SI) in relation to the minerals in the waters of the Knyszyn Primeval Forest springs are shown in Table 3. Its values range from8.81 to 16.43.
Relatively high concentrations of nitrogen and phosphorus compounds were also recorded in the spring waters (Table 2). Nitrogen compounds were practically limited in their occurrence to ionic forms (NO3 and NH4+). Phosphorus compounds appeared in the form of two ionic forms: mono and dihydrogen phosphates (H2PO4, CaHPO4, and MgHPO4). The monohydrogen phosphate ion predominated in the analyzed environment. The statistical analyses showed that in 70% of the samples, the concentrations of mineral and organic forms of these elements exceeded the average values, determining the exceptionally high fertility of the environment. Spatial changes in the concentrations of nitrogen and phosphorus compounds in the Puszcza Knyszyńska were significant (Figure 9a–d).
The average concentration of DOC in the spring waters exceeded 4 mg·dm−3. In some outflows, most often of a marsh nature or located in peat areas, DOC concentrations exceeded several mg·dm−3. The different quality of dissolved organic matter in these outflows is evidenced by the aromaticity of organic matter (SUVA), on average reaching 17 abs.1 cm·1gC−1. Nevertheless, this parameter’s variability range is wide: from 1 to 32 abs.1 cm·1gC−1. A large spatial variation in DOC and SUVA was noted (Figure 9e,f). The water color was also highly variable, on average reaching a value of almost 15 mgPt·dm−3 (Table 2).

5. Discussion

Springs are a unique resource from an ecological, economic, and cultural perspective [13,34]. Springs occur at the interface between groundwater, surface water, and terrestrial ecosystems, and, as such, they constitute a unique threeway ecotone [13]. Ecotones possess specific physical and chemical attributes, biotic values, and energy and matter exchange processes. They are unique in their interactions with adjacent ecosystems [35,36].
Ecotones often contain significant biodiversity values, including a diverse mixture of cosmopolitan and endemic flora and fauna and a range of ecosystem functions specific to the ecotone [12,26,37]. For this reason, they are often protected [6,35,38]. In many regions of the world, spring water is used as drinking water. It requires monitoring of its quality in terms of hydrochemical and biological features [39,40,41,42,43,44,45]. Additionally, in the era of climate change, natural groundwater outflows will serve as hydrological refugia [46,47,48].
The shallow groundwaters of the Quaternary level and the waters of the North Podlasie Lowland’s deeper aquifers and, thus, also those of the Puszcza Knyszyńska, are poorly mineralized waters. They occur under the overburden of glacial tills that are numerous in the lowlands of Poland. All the Polish Lowland’s aquifers are dominated by HCO3Ca twoion or HCO3CaMg threeion waters [23]. HCO3CaMg threeion waters dominated in the springs of the Puszcza Knyszyńska—50 springs (Table 1, Figure 4). One of the outflows located in the southern part of the study area (Świniobródka catchment) was characterized by HCO3MgCa water. The other outflows were HCO3Ca twoion waters—29 springs. More than half of the threeion waters occurred in anthropogenically transformed areas (28 springs) or their vicinity. This is typical in NorthEastern Poland [4,13,49].
The water of the lowland springs was characterized by oxidative environmental conditions (Eh > 0.15 V).The iron was at higher degrees of oxidation, and was formed as sparingly soluble compounds, observed in the niches as rusty sediment (iron hydroxide), on the sediments lining them and sometimes on the leaves of plants growing on niches. The range of total iron concentration in the waters of the Puszcza Knyszyńska springs was significant (0.09–5.20 mg dm−3), and the average content of this parameter was even higher than in the water of spring draining formations containing iron ores [50]. The concentration of total iron in the Quaternary layer’s waters is often abovenormative [4,13,39,51].
The saturation index shows that minerals containing chlorides, sulphates, and phosphates can dissolve. Compounds of silicates and carbonates are stable in terms of dissolution (Table 3). Iron compounds are precipitated, mainly in their hydrated forms. Their presence is visible in spring niches in the form of a ginger coating on sediments and plants [28].
Springs are sites of sharp environmental gradients, with rapid changes in water chemistry occurring over small spatial scales [12]. For example, the low pH of groundwater is associated with the dissolution of CO2. As soon as the water rises to the surface, the pH increases as CO2 is lost into the atmosphere. Oxygenation of reduced groundwaters also occurs rapidly at springheads [52]. The recorded oxygen concentrations in the majority of the natural groundwater outflows in the Puszcza Knyszyńska confirm this thesis. It is also evidenced by the significant positive Spearman’s correlation coefficient in the forest areas and negative in the green and rural areas (Table 4).
Redox conditions induce nitrification and denitrification processes in spring niches [53]. The mineralization of organic debris leads to the release of nitrogen from proteins. The ammonia nitrogen source in the waters is the ammonification process carried out by putrefactive bacteria and fungi, which lasts all year round. The released NH4+ ions under aerobic conditions are oxidized into their nitrate form in the nitrification process [54]. The importance of these processes involving bacteria in shaping nitrogen compounds in water was confirmed in the studies by Zieliński et al. [4]. The mean concentration of ammonium nitrogen in the waters varied and the mean content did not exceed 0.24 mg·dm−3. Nitrate ions are the most important source of nitrogen for green plants for many reasons. The preferential uptake of nitrate also has a metabolic basis: it is nitrate, not ammonia, that regulates the activity of assimilation enzymes. Plants cannot react to an increased concentration of NH4+ with respectively higher enzyme activity and faster nitrogen assimilation [55]. Studies on the distribution of vegetation in spring niches confirm this thesis [12,26]. Relatively high concentrations of total nitrogen were also recorded in the waters of the lowland springs. The statistical analysis showed that in 70% of the samples, its concentration did not exceed 2 mg·dm−3. Nevertheless, there were also outflows where the total nitrogen content was much higher, conditioning the environment’s exceptionally high fertility. These were mainly outflows located in rural building areas (Figure 8a,b, Figure 10). Natural nitrate levels in groundwater are generally very low, but nitrate concentrations grow due to human activities, such as agriculture, industry, domestic effluents, and emissions from combustion engines [39].
When assessing the habitat conditions in spring niches, one should also pay attention to phosphorus compounds in the water. The concentration of SRP in water is largely influenced by plant organisms’ uptake, which may lower their concentration in water, mainly in the summer periods. The complexation of this ion by organic substances or iron hydroxides also affects the reduction of SRP content [56]. On the other hand, the enrichment of water with orthophosphoric ions occurs due to the mineralization process of organic matter (which is more intensive in the warm season) and the leaching of this compound from an aquifer. The conversion of trivalent to divalent iron releases considerable amounts of phosphorus previously adsorbed by iron hydroxides. The decrease in the concentration of orthophosphates in the water is favored by humic substances, which bind phosphorus into mineral–organic complexes and sorption on trivalent iron hydroxides. The described processes were very clearly observed in the niches of the wells located in the areas characterized by the catchment area of forest and meadow spots (Table 4 and Table 5). In the springs located in rural areas, the concentrations of phosphorus forms were significantly influenced by anthropopressure (Table 4, Figure 8c,d).
The location of springs at the interface between groundwater and surface water drives many of their key physicochemical characteristics, including their relative physicochemical constancy. Indeed, the hydrogeological context of a spring strongly influences the flow stability, thermal constancy, and water chemistry [52], and can be seen as the overarching determinant of spring structure and function [35]. In our study, the investigated springs could not be differentiated into distinct classes. Due to the geological and geographical homogeneity of the area investigated in this study, the chemical conditions of the springs were very similar. Only largescale investigations of springs with different geological settings or investigations of acidified springs [48,57,58] show distinct differences in spring water chemistry. Such relationships also occur in mountain areas [59,60].
This study clearly showed the complexity of spring ecosystems in the Puszcza Knyszyńska. In the Puszcza Knyszyńska, there are rheocrenes, helocrenes, and limnocrenes (Table 1). The latter type of springs is extremely rare here, but the accumulation of spring waters by beavers or the housing of outflows causes artificial limnocrenes (Figure 5 and Figure 6). Natural groundwater outflows in the analyzed area are very rarely used for economic purposes, and therefore transformations of the groundwater outflow site to the surface are sporadic here. Helocrene springs usually emerge in a diffuse fashion in cienega (marshy, wet meadow) settings [16]. Rheocrenes usually accompany areas with increased ground leveling [16]. In the Puszcza Knyszyńska, these areas are mainly related to river valleys. The variable rate of water circulation between the types of springs and the impact of the type of outflow on organisms occurring in niches were the reasons for the search for a relationship between the type of outflow and the physical and chemical characteristics in the springs of the Puszcza Knyszyńska [3,61]. The prevailing number of rheocrenes in this area, the small number of helocrenes studied, and the minimal number of limnocrenes (including artificial ones) do not allow for drawing correct regularities between the biological type of outflow and water quality characteristics. Preliminary analyses show the significant fertility of the outflows of helocrenes, expressed by a higher concentration of nutrients. It does not always go together with the presence of different organisms. A correlation between abiotic and macrozoobenthos data showed that physicochemical parameters had little impact on macrozoobenthic composition, whereas specific substrate parameters strongly influenced macrofauna composition [62].
It is not easy to assess the influence of one factor on the quality of spring waters, even in areas where the fissure circulation of groundwater dominates [63]. In NE Poland, a region with a very wellpreserved natural environment, the important determinant of spring water quality is human activity. Most of the analyzed springs were located in forested areas. There were fewer spring niches associated with rural areas and grasslands (Table 1). The analysis of the spatial variability of water physicochemical characteristics shows that values deviating from the mean value were observed mainly in rural areas (Figure 8, Figure 9, Figure 10 and Figure 11). This is confirmed by the RDA analysis, where natural elements of land use are presented on the left side of the chart, while rural areas occupy the right side (Figure 11). The forest variable is positively correlated with the oxygen content of the water. Meanwhile, the rural variable is positively correlated with higher concentrations of iron forms and ammonia. The results of the partial redundancy analysis show that natural forests and seminatural grasslands have the greatest impact on water chemistry; in total, they explain more than 70% of the variability in water quality characteristics (Table 5).
In many forest systems, the near stream, or riparian zone, has control of both the quantity and quality of water DOC [64]. The DOC concentration increases toward the soil surface and results in an increased DOC level in the surface waters [65]. Landscape diversity has a negative impact on water quality, whereas forests and grasslands have a positive impact. Forest complexes promote the “sink” effect on nutrients and control the nutrients’ inflow from agricultural sources [66]. Human activity significantly increases water temperature and decreases oxygen concentration [49,67]. Rural areas significantly affect the increased concentrations of sodium, ammonium ions, and iron and phosphorous compounds in spring waters (Table 5). The impact of land use on the quality of shallow groundwater is often observed in the shallow groundwater environment [68,69,70].

6. Summary

In the Puszcza Knyszyńska (Supraśl catchment) located in the Polish Lowland (North Podlasie Lowland), springs are quite common. In terms of hydrobiology, rheocrenes—55 springs—dominate, and there are fewer helocrenes—21 springs and limnocrenes—4 springs (including two artificially created). The predominant share of rheocrenes results from the varied topography of the Knyszyn Forest (ground level differences reach several dozen meters). During periods of low water levels in the summers of 2014 and 2015, the outflow yields most often fluctuated within a range of 0.5–2.0 dm3·s–1.
Despite the low efficiencies of the springs, they increase the biodiversity and geodiversity of the area. They also testify to large resources of groundwater.
The studied waters, according to the Alekin classification, belonged to the bicarbonate class C and Ca group, the second type (r HCO3 < r Ca2+ + Mg2+ < r HCO3 + r SO42–) (CIICa). They were two or threeion waters (HCO3Ca and HCO3CaMg). The hydrochemical types of the spring waters in the Knyszyn Forest were typical for lowland areas. A specific feature of the spring waters was their significant nutrient content (mean value: TN = 1.86 mg dm−3, TP = 0.17 mg dm−3, and DOC = 4.16 mg dm−3). In the spring waters, a high content of total iron (TFe) was also found (average value 1.24 mg dm−3).
The nature of the catchment use exerted the greatest influence on the quality of the spring waters in the Supraśl catchment. The lowest concentrations of chemical parameters of water were found in the forest springs. Larger changes in the chemical composition of water occurred in the outflows located in agricultural land, and the largest in the rural development zone. In springs with a significantly transformed surface catchment, an increase in the concentrations of chlorides, sulfates, sodium, potassium, and nitrate nitrogen and a decrease in the concentration of oxygen dissolved in water were noted. Forest complexes are efficient filters and promote the “sink” effect on nutrients. Anthropogenic activities generally raise water temperature and decrease oxygen concentration. Rural areas may have significantly higher concentrations of sodium, ammonium ions, and iron and phosphorous compounds in spring waters.

Author Contributions

All authors contributed to the study conception and design. Material preparation, data collection, and analysis were performed by E.J.-R., P.Z., K.P., K.M. and E.P. The first draft of the manuscript was written by E.J.-R., and all authors commented on previous versions of the manuscript. All authors have read and agreed to the published version of the manuscript.

Funding

This research received no external funding.

Institutional Review Board Statement

Not applicable.

Informed Consent Statement

Not applicable.

Data Availability Statement

All data generated or analyzed during this study are available via the Data Repository of the University of Bialystok. Requests for material should be made to the corresponding author.

Conflicts of Interest

The authors declare no conflict of interest.

References

  1. Williams, D.D. The spring as an interface between groundwater and lotie faunas and as a tool in assessing groundwater quality. Verh. Internat. Verein. Limnol. 1991, 24, 1621–6124. [Google Scholar]
  2. Webb, D.W.; Wetzel, M.J.; Reed, P.C.; Philippe, L.R.; Young, T.C. The macroninvertebrate biodiversity, water quality, and hydrogeology of ten karst springs in the Salem Plateau of Illinois. In Studies in Crenobiology; The Biology of Springs and Springbrooks; Botosaneanu, L., Ed.; Backhuys Publishers: Leiden, The Netherlands, 1988; pp. 39–48. [Google Scholar]
  3. Cantonati, M.; Gerecke, R.; Bertuzzi, E. Springs of the Alps—Sensitive ecosystems to environmental change: From biodiversity assessments to longterm studies. Hydrobiologia 2006, 562, 59–96. [Google Scholar] [CrossRef]
  4. Zieliński, P.; JekatierynczukRudczyk, E.; Puczko, K. Factors affecting the abundance and activity of the bacterioplankton in lowland forest springs in northeastern Poland. Ecohydrol. Hydrobiol. 2020, 20, 675–686. [Google Scholar] [CrossRef]
  5. Cantonati, M.; LangeBertalot, H. Diatom Biodiversity of springs in the Berchtesgaden National Park (north—Eastern Alps, Germany), with the ecological and morphological characterization of two species new to science. Diatom Res. 2010, 25, 251–280. [Google Scholar] [CrossRef]
  6. Scarsbrook, M.; Barquín, J.; Gray, D. Science for Conservation 278, New Zealand Coldwater Springs and Their Biodiversity; Science & Technical Publishing: Wellington, New Zeland, 2007; 71p. [Google Scholar]
  7. Lai, G.G.; Burato, S.; Padedda, B.M.; Zorza, R.; Pizzul, E.; Delgado, C.; Lugliè, A.; Cantonati, M. Diatom Biodiversity in Karst Springs of Mediterranean Geographic Areas with Contrasting Characteristics: Islands vs Mainland. Water 2019, 11, 2602. [Google Scholar] [CrossRef] [Green Version]
  8. Chełmicki, W.; Jokiel, P.; Michalczyk, Z.; Moniewski, P. Distribution, discharge and regional characteristics of springs in Poland. Episodes 2011, 34, 244256. [Google Scholar] [CrossRef] [PubMed] [Green Version]
  9. Jokiel, P.; Michalczyk, Z. Springs of Poland—Save for the Future. Pr. Geogr. 2019, 157, 3–7, (In Polish with English summary). [Google Scholar]
  10. JekatierynczukRudczyk, E. Effects of drainage basin managment on the chemical composition of waters in lowlands springs. Acta Hydrobiol. 1999, 41, 97–105. [Google Scholar]
  11. JekatierynczukRudczyk, E. Threats to a small river and its urban catchment. Ecohydrol. Hydrobiol. 2008, 8, 77. [Google Scholar] [CrossRef]
  12. Puczko, K.; Zieliński, P.; Jusik, S.; Kołakowska, A.; JekatierynczukRudczyk, E. Vascular plant and bryophyte species richness in response to water quality in lowland spring niches with different anthropogenic impacts. Environ. Monit. Assess. 2018, 190, 338. [Google Scholar] [CrossRef] [PubMed] [Green Version]
  13. JekatierynczukRudczyk, E. Holy waters in the Podlasie region, Poland, as a witness of hydrological and hydrochemical changes. Ecohydrol. Hydrobiol. 2020, 20, 610–621. [Google Scholar] [CrossRef]
  14. Łoszewski, H. Springs in Bialystok and the need to protect them. Białostocczyzna 1995, 4, 140–153. [Google Scholar]
  15. Lehosmaa, K.; Jyväsjärvi, J.; Virtanen, R.; Rossi, P.M.; Rados, D.; Chuzhekova, T.; Markkola, A.M.; Ilmonen, J.; Muotka, T. Does habitat restoration enhance spring biodiversity and ecosystem functions? Hydrobiologia 2017, 793, 161–173. [Google Scholar] [CrossRef]
  16. Springer, A.; Stevens, L.E. Spheres of discharge of springs. Hydrogeol. J. 2009, 17, 83–89. [Google Scholar] [CrossRef]
  17. Kondracki, J. Regional Geography of Poland; Scientific PWN: Warsaw, Poland, 2011; 635p. [Google Scholar]
  18. Banaszuk, H. Problems of glacial morphogenesis of the North Podlasie Lowland. Work. Geogr. Stud. 2019, 64, 89–112, (In Polish with English Summary). [Google Scholar]
  19. Czarnecka, H. (Ed.) Atlas of the Hydrographic Division of Poland; Part I: Maps at a scale of 1: 200 000; IMGW: Warsaw, Poland, 2005. [Google Scholar]
  20. Czarnecka, H. (Ed.) Atlas of the Hydrographic Division of Poland; Part II: Lists of catchments; IMGW: Warsaw, Poland, 2005; 262p. [Google Scholar]
  21. Ber, A. Plejstocene of NorthEastern Poland and Neighbouring Areas Against Crystallone and Sedimentary Basement; Prace PIG, CLXX: Warszawa, Poland, 2000; 89p, (In Polish with English Summary). [Google Scholar]
  22. Banaszuk, H. Location of the Knyszyn Forest, outline of the relief and geological structure. In Puszcza Knyszyńska; Czerwiński, A., Ed.; Nature Monograph: Poland, 1995; pp. 11–22. (In Polish) [Google Scholar]
  23. Polish Geological Institute (PGI). Hydrogeological Map of Poland at the Scale 1:50 000, Sheet Bialystok; PIG: Warszawa, Poland, 2009. (In Polish) [Google Scholar]
  24. Musiał, A. Study of the Glacial Landscape of the Northern Podlasie; UW 403: Warszawa, Poland, 1992; 203p, (In Polish with English Summary). [Google Scholar]
  25. Mojski, E.J. Polish Territory During the Quaternary. An Outline of Morphogenesis; PIG: Warszawa, Poland, 2005; 404p, (In Polish with English Summary). [Google Scholar]
  26. JekatierynczukRudczyk, E. Transformation in Physicochemical Composition of Groundwaters within Lowland Drainage Zones; UwB: Bialystok, Poland, 2010; 224p, (In Polish with English Summary). [Google Scholar]
  27. Walter, W.G. Standard Methods for the Examination of Water and Wastewater; American Public Health Association: Washington, DC, USA, 1995. [Google Scholar]
  28. Puczko, K.; Zieliński, P.; JekatirynczukRudczyk, E. Dissolved organic matter in freshwaters. Kosmos 2017, 66, 457–464. [Google Scholar]
  29. Macioszczyk, A.; Dobrzyński, D. Hydrogeochemistry of Active Groundwater Exchange Zones; Scientific PWN: Warszawa, Poland, 2002; 440p. (In Polish) [Google Scholar]
  30. Łomotowski, J.; Siwoń, Z. Assessing the chemical stability of tap water by means of the software for ionic composition simulation. Ochr. Sr. 2004, 26, 13–16, (In Polish with English Summary). [Google Scholar]
  31. Małecki, J.J. Role of the Aeration Zone in Forming Chemical Composition of Shallow Ground Waters, Based on Cases of Selected Hydrogeochemical Environments; Biuletyn PIG 381: Warszawa, Poland, 1998; 219p, (In Polish with English Summary). [Google Scholar]
  32. Wiktorowicz, B. The forms of migration of constituents dissolved in acidulous waters in the Klodzko area. Prace Nauk. In. Gór. Politechniki Wrocławskiej 2007, 33, 121128, (In Polish with English Summary). [Google Scholar]
  33. Sliva, L.; Williams, D.D. Buffer zone versus whole catchment approaches to studying land use impact on river water quality. Water Res. 2001, 35, 3462–3472. [Google Scholar] [CrossRef]
  34. Goldstein, M.I.; S DellaSala, D.A. Encyclopedia of the World’s Biomes; Elsevier: Amsterdam, Netherlands, 2020; pp. 131–133. [Google Scholar]
  35. Barquín, P.; Scarsbrook, M. Management and conservation strategies for coldwater springs. Aquat. Conserv. Mar. Freshw. Ecosyst. 2008, 18, 580–591. [Google Scholar] [CrossRef]
  36. Pradhan, N. Conserving Springs and its Significance for Water Security in Himalayas. 2005. Available online: http://thesarcist.org/Opinion/103 (accessed on 26 February 2021).
  37. Czarnecka, B.; Rysiak, A.; Chabudziński, Ł. Spring flora diversity versus ecosystem stressors: Case studies from the Western Roztocze and Lublin Upland border, SouthEast Poland. Ecohydrol. Hydrobiol. 2020, 20, 693–706. [Google Scholar] [CrossRef]
  38. Baścik, M.; Chełmicki, W.; Urban, J. Geoconservation of Springs in Poland. Episodes 2009, 32, 177–185. [Google Scholar] [CrossRef] [PubMed]
  39. Khanna, P. Hydrochemical Assessment of Ground Water of Springs (Bowlis) of Udhampur District, J&K, India. Int. J. Sci. Res. 2014, 3, 1313–1321. [Google Scholar]
  40. AlKhashman, O.A.; Alnawafleh, H.M.; Jrai, A.M.; AlMuhtaseb, A. Monitoring and Assessing of Spring Water Quality in Southwestern Basin of Jordan. Open J. Mod. Hydrol. 2017, 7, 331–349. [Google Scholar] [CrossRef] [Green Version]
  41. Machona, L.; Chikodzi, D.; Sithole, N. Water Quality Analysis for Springs in Bvumba Catchment Area, Manicaland Province, Zimbabwe. Journal of Geography. Environ. Earth Sci. Int. 2017, 11, 1–13. [Google Scholar]
  42. Batool, A.; Samad, N.; Kazmi, S.S.; Ghufran, M.A.; Imad, S.; Shafqat, M.; Mahmood, T. Spring water quality and human health: An assessment of natural springs of margalla hills Islamabad zone III. Int. J. Hydrol. 2018, 2, 41–46. [Google Scholar] [CrossRef] [Green Version]
  43. Ameen, H.A. Spring water quality assessment using water quality index in villages of Barwari Bala, Duhok, Kurdistan Region, Iraq. Appl. Water Sci. 2019, 9, 176. [Google Scholar] [CrossRef] [Green Version]
  44. Ahmad, S.; Bhat, S.; Hamid, A.; Bhat, A. Quality assessment of springs for drinking water in the Himalaya of South Kashmir, India. Environ. Sci. Pollut. Res. 2020, 28, 2279–2300. [Google Scholar]
  45. Bhat, S.; Mushtaq, S.; Qayoom, U.; Sabha, I. Water Quality Scenario of Kashmir Himalayan Springs—A Case Study of Baramulla District, Kashmir Valley. Water Air Soil 2020, 231, 1–17. [Google Scholar] [CrossRef]
  46. Cartwright, J.; Johnson, H.M. Springs as hydrologic refugia in a changing climate? A remote-sensing approach. Ecosphere 2018, 9, e02155. [Google Scholar] [CrossRef]
  47. Freed, Z.; Aldous, A.; Gannet, M.W. Landscape controls on the distribution and ecohydrology of central Oregon springs. Ecohydrology 2019, 12, e2065. [Google Scholar] [CrossRef]
  48. Puczko, K.; JekatierynczukRudczyk, E. Analysis of urban land cover influence to organic carbon and nutrients in surface water via impacted groundwater. Environ. Monit. Assess. 2020, 192, 145. [Google Scholar] [CrossRef] [PubMed] [Green Version]
  49. Ferreira, C.A.; Palmieri, H.E.L.; Menezes, M.Â.; Auler, L.M.L.A. Hydrochemical Assessment of Spring Waters from the Iron Quadrangle Region, Minas Gerais, Brazil. Am. J. Water Resour. 2017, 5, 29–40. [Google Scholar]
  50. JekatierynczukRudczyk, E.; Zieliński, P.; Puczko, K. Is the protection of springs in Knyszyn Forest effective and satisfactory? Prot. Nativ. Nat. 2017, 73, 135–147, (In Polish with English Summary). [Google Scholar]
  51. Van der Kamp, R.O. The hydrogeology of springs in relation to the biodiversity of spring fauna: A review. In Ferrington L C Jr (ed.) Biodiversity of Aquatic Insects and Other Invertebrates in Springs. J. Kans. Entomol. Soc. 1995, 68, 4–17. [Google Scholar]
  52. Pei, Y.S.; Wang, J.; Wang, Z.Y.; Yang, Z.F. Characteristics of ammoniaoxidizing and denitrifying bacteria at the riversediment interface. Procedia Environ. Sci. 2010, 2, 1988–1996. [Google Scholar] [CrossRef] [Green Version]
  53. Wang, Z.; Qi, Y.; Wang, J.; Pei, Y. Characteristics of aerobic and anaerobic ammoniumoxidizing bacteria in the hyporheic zone of a contaminated river. World J. Microbiol. Biotechnol. 2012, 28, 2801–2811. [Google Scholar] [CrossRef]
  54. Ali, A. Nitrate assimilation pathway in higher plants: Critical role in nitrogen signalling and utilization. Plant Sci. Today 2020, 7, 182–192. [Google Scholar] [CrossRef]
  55. McDowell, R.W. Relationship between Sediment Chemistry, Equilibrium Phosphorus Concentrations, and Phosphorus Concentrations at Baseflow in Rivers of the New Zealand National River Water Quality Network. J. Environ. Qual. 2015, 44, 921–929. [Google Scholar] [CrossRef]
  56. Baltes, B. Einfluss der Gewässerversauerung auf aquatische Insekten. Mitt. Der Dtsch. Ges. Für Allg. Und Angew. Entomol. 2000, 12, 231–236. [Google Scholar]
  57. Hahn, H.J. Studies on classifying of undisturbed springs in Southwestern Germany by macrobenthic communities. Limnologica 2000, 30, 247–259. [Google Scholar] [CrossRef] [Green Version]
  58. Jasik, M.; Małek, S. Quality assessment of spring water from the area of the Łysogóry Mts. in Świętokrzyski National Park in 2010. Folia For. Pol. 2013, 55, 27–32. [Google Scholar] [CrossRef]
  59. Gaglioti, S.; Infusino, E.; Caloiero, T.; Callegari, G. Hydrochemical and qualitative assessment of natural water spring in southern Italy. Eur. Water 2017, 57, 399–405. [Google Scholar]
  60. Govoni, D.P.; Kristjánsson, B.K.; Olafsson, J.S. Spring type influences invertebrate communities at cold spring sources. Hydrobiologia 2018, 808, 315–332. [Google Scholar] [CrossRef]
  61. Von Fumetti, S.; Nagel, P.; Scheifhacken, N.; Baltes, B. Factors governing macrozoobenthic assemblages in perennial springs in northwestern Switzerland. Hydrobiologia 2006, 568, 467–475. [Google Scholar] [CrossRef]
  62. Chełmicki, W.; Siwek, J. Natural and anthropogenic factors controlling spring water quality in the southern part of the Malopolska Upland (Southern Poland). Impact of Human Activity on Groundwater Dynamics (Proceedings of a symposium held during the Sixth IAHS Scientific Assembly at Maastricht, The Netherlands, July 2001). IAHS Publ. 2001, 269, 317–322. [Google Scholar]
  63. Ågren, A.; Buffam, I.; Berggren, M.; Bishop, K.; Jansson, M.; Laudon, L. Dissolved organic carbon characteristics in boreal streams in a forestwetland gradient during the transition between winter and summer. J. Geophys. Res. 2008, 113, G3. [Google Scholar]
  64. Laudon, H.; Hedtjärn, J.; Schelker, J.; Bishop, K.; Sørensen, R.; Ågren, A. Response of dissolved organic carbon following forest harvesting in a boreal forest. AMBIO: A J. Hum. Environ. 2009, 38, 381–386. [Google Scholar] [CrossRef]
  65. Clément, F.; Ruiz, J.; Rodríguez, M.A.; Blais, D.; Campeau, S. Landscape diversity and forest edge density regulate stream water quality in agricultural catchments. Ecol. Indic. 2017, 72, 627–639. [Google Scholar] [CrossRef]
  66. Ding, J.; Jiang, Y.; Fu, L.; Liu, Q.; Peng, Q.; Kang, M. Impacts of Land Use on Surface Water Quality in a Subtropical River Basin: A Case Study of the Dongjiang River Basin, Southeastern China. Water 2015, 7, 4427–4445. [Google Scholar] [CrossRef] [Green Version]
  67. Eftimi, R.; Zojer, H. Human impacts on karst aquifers of Albania. Environ. Earth Sci. 2015, 74, 57–70. [Google Scholar] [CrossRef]
  68. Hossain, M.S. Impact of land use change on stream water quality: A review of modelling approaches. JREAS 2017, 2, 1–6. [Google Scholar] [CrossRef]
  69. Ramos, S.T.B.; Mafra, M.S.H.; Rech, T.D.; Siegloch, A.E.; Rech, Â.F. Water quality of springs in areas under different land uses in the southern highlands of Santa Catarina. Rev. Ambiente Água 2018, 13. [Google Scholar] [CrossRef] [Green Version]
  70. Rudczyk, E.; Puczko, K.; Żukowska, J.; Sawicka, A. Biota communities influence on nutrients circulation in hyporheic zone—A case study in urban spring niches in Bialystok (NE Poland). Aquat. Sci. 2021, 83, 75. [Google Scholar] [CrossRef]
Figure 1. Hydrological location of the study area.
Water 14 03202 g001
Figure 2. Hydrogeological cross-section through the Knyszyn Forest: the central part of Łażnie-Kowalewszczyzna (a), the central part of Krasny-Las Ożynnik (b), and the eastern part of Załuki-Dzierniakowo (c).
Water 14 03202 g002
Figure 3. Locations of the studied springs in the Knyszyn Forest.
Water 14 03202 g003
Figure 4. Rheocrene in the Migówka valley (Pstrągownia, spring No. 22).
Water 14 03202 g004
Figure 5. Artificial limnocrene created as a result of the outflow being captured by lining (spring No. 11).
Water 14 03202 g005
Figure 6. Artificial limnocrene created as a result of the construction of a beaver dam (spring No. 57).
Water 14 03202 g006
Figure 7. Hydrochemical types of water in springs in the Knyszyn Forest.
Water 14 03202 g007
Figure 8. Spatial variability of water’s physical properties: (a) electrolytic conductivity, (b) water reaction, (c) dissolved oxygen, and (d) oxidation-reduction potential.
Water 14 03202 g008
Figure 9. Spatial variability of water chemistry: (a) NH4+, (b) NO3, (c) TP, (d) SRP, (e) DOC, and (f) SUVA.
Water 14 03202 g009
Figure 10. Land use in the Knyszyńska Forest in comparison with the distribution of springs.
Water 14 03202 g010
Figure 11. Redundancy analysis (RDA) of water quality parameters and influence factors.
Water 14 03202 g011
Table 1. Characteristics of the springs in the Knyszyńska Forest.
NoGeographical CoordinatesHydrological LocationGeomorphological Type of SpringHydrobiological Type of SpringHydrochemical Type of WaterLand Use
1N: 53°8′58.19″
E: 23°42′56..39″
right-side direct tributary of the Supraśl river → Breszczeczka catchmenthillsloperheocreneHCO3-Caforest
2N: 53°8′17.31″
E: 23°41′41.48″
right-side direct tributary of the Supraśl river → Breszczeczka catchmenthillsloperheocreneHCO3-Ca-Mggrassland
3N: 53°8′7.23″
E: 23°41′24.34″
right-side direct tributary of the Supraśl river → Breszczeczka catchmenthillslopehelocreneHCO3-Ca-Mggrassland
4N: 53°8′7.52″
E: 23°40′52.87″
right-side direct tributary of the Supraśl river → Breszczeczka catchmenthillsloperheocreneHCO3-Ca-Mgrural area
5N: 53°8′47.39″
E: 23°40′39.82″
right-side direct tributary of the Supraśl river → Breszczeczka catchmenthillsloperheocreneHCO3-Ca-Mgforest
6N: 53°8′47.03″
E: 23°40′58.74″
right-side direct tributary of the Supraśl river → Breszczeczka catchmenthillsloperheocreneHCO3-Ca-Mgforest
7N: 53°10′25.56″
E: 23°38′7.25″
right-side direct tributary of the Supraśl river → Średnica catchmentvalleyhelocreneHCO3-Cagrassland
8N: 53°11′22.72″
E: 23°36′56.28″
right-side direct tributary of the Supraśl river → Radulinka catchmentvalleyrheocreneHCO3-Ca-Mgforest
9N: 53°10′19.79″
E: 23°36′18.84″
right-side direct tributary of the Supraśl river → Radulinka catchmentvalleyrheocreneHCO3-Cagrassland
10N: 53°9′38.68″
E: 23°34′29.02″
right-side direct tributary of the Supraśl river → Radulinka catchmentvalleyhelocreneHCO3-Ca-Mggrassland
11N: 53°9′29.32″
E: 23°34′16.04″
right-side direct tributary of the Supraśl river → Radulinka catchmentvalleyartificial
limnocrene
HCO3-Ca-Mgrural area
12N: 53°12′46.19″
E: 23°34′14.97″
Słoja catchment → Skrobacianka catchmenthillslopehelocreneHCO3-Caforest
13N: 53°12′30.63″
E: 23°32′11.91″
direct tributary of the Słoja river → Słoja catchment hillsloperheocreneHCO3-Ca-Mgforest
14N: 53°18′28.05″
E: 23°26′57.28″
Sokołda catchment → Karnicha catchmenthillsloperheocreneHCO3-Ca-Mgforest/grassland
15N: 53°17′42.44″
E: 23°25′37.06″
Sokołda catchment → Karnicha catchmentvalleyrheocreneHCO3-Ca-Mgforest
16N: 53°16′41.53″
E: 23°25′4.8″
Sokołda catchment → Karnicha catchmentvalleyrheocreneHCO3-Ca-Mgforest
17N: 53°17′35.3″
E: 23°28′44.07″
Sokołda catchment → Kowszówka catchmentvalleyhelocreneHCO3-Ca-Mgforest
18N: 53°17′43.72″
E: 23°30′21.1″
Sokołda catchment → Łanga catchmentvalleyrheocreneHCO3-Ca-Mgrural area
19N: 53°15′23.85″
E: 23°30′3.88″
Sokołda catchment → Łanga catchmentvalleyrheocreneHCO3-Ca-Mgrural area
20N: 53°16′52.31″
E: 23°30′51.01″
Sokołda catchment → Łanga catchmentvalleyrheocreneHCO3-Carural area
21N: 53°16′5.05″
E: 23°31′1.89″
Sokołda catchment → Łanga catchmenthillsloperheocreneHCO3-Ca-Mgrural area
22N: 53°16′53.67″
E: 23°22′15.75″
Sokołda catchment → Migówka catchmenthillsloperheocreneHCO3-Caforest
23N: 53°16′54.62″
E: 23°22′27.36″
Sokołda catchment → Migówka catchmenthillsloperheocreneCO3-Ca-Mgforest
24N: 53°16′49.47″
E: 23°22′44.93″
Sokołda catchment → Migówka catchmentvalleyrheocreneHCO3-Ca-Mgforest
25N: 53°16′26.7″
E: 23°21′24.73″
Sokołda catchment → Migówka catchmentvalleyrheocreneCO3-Ca-Mgforest
26N: 53°14′4.31″
E: 23°29′43.08″
direct tributary of the Sokołda river → Sokołda catchmentvalleyrheocreneHCO3-Cagrassland
27N: 53°14′35.73″
E: 23°27′38.92″
direct tributary of the Sokołda river → Sokołda catchmentvalleyhelocreneHCO3-Cagrassland
28N: 53°14′53.01″
E: 23°28′59.46″
direct tributary of the Sokołda river → Sokołda catchmenthillslopelimnocreneHCO3-Ca-Mgforest
29N: 53°14′38.13″
E: 23°29′28.2″
direct tributary of the Sokołda river → Sokołda catchmenthillsloperheocreneHCO3-Ca-Mgforest
30N: 53°12′44.98″
E: 23°27′28.53″
direct tributary of the Sokołda river → Sokołda catchmenthillslopehelocreneHCO3-Ca-Mggrassland
31N: 53°12′37.01″
E: 23°27′29.49″
direct tributary of the Sokołda river → Sokołda catchmenthillslopehelocreneHCO3-Caforest/grassland
32N: 53°12′24.64″
E: 23°27′16.42″
direct tributary of the Sokołda river → Sokołda catchmenthillslopehelocreneHCO3-Ca-Mgforest/grassland
33N: 53°12′19.2″
E: 23°27′7.29″
direct tributary of the Sokołda river → Sokołda catchmenthillslopehelocreneHCO3-Caforest/grassland
34N: 53°12′23.77″
E: 23°26′2.44″
direct tributary of the Sokołda river → Sokołda catchmenthillslopehelocreneHCO3-Ca-Mgrural area
35N: 53°13′40.52″
E: 23°20′26.84″
Sokołda catchment → Jałówka catchmentvalleyrheocreneHCO3-Ca-Mgforest/grassland
36N: 53°14′30.49″
E: 23°20′50.34″
Sokołda catchment → Jałówka catchmentvalleyrheocreneHCO3-Caforest/grassland
37N: 53°14′4.58″
E: 23°20′41.57″
Sokołda catchment → Jałówka catchmentvalleyrheocreneHCO3-Ca-Mgforest
38N: 53°14′28.01″
E: 23°18′7.49″
right-side direct tributary of the Supraśl river → Supraśl catchmenthillsloperheocreneHCO3-Ca-Mgforest/grassland
39N: 53°13′34.82″
E: 23°15′45.74″
right-side direct tributary of the Supraśl river → Supraśl catchmenthillsloperheocreneHCO3-Caforest/grassland
40N: 53°14′31.25″
E: 23°19’12.46″
right-side direct tributary of the Supraśl river → Supraśl catchmenthillsloperheocreneHCO3-Cagrassland
41N: 53°14′31.38″
E: 23°17′15.09″
right-side direct tributary of the Supraśl river → Supraśl catchmenthillsloperheocreneHCO3-Cagrassland
42N: 53°12′39.65″
E: 23°13′42.02″
right-side direct tributary of the Supraśl river → Supraśl catchmenthillslopehelocreneHCO3-Cagrassland
43N: 53°19′13.31″
E: 23°15′18.6″
Czarna catchment → Czapielówka catchmentvalleyrheocreneHCO3-Carural area
44N: 53°18′7.34″
E: 23°13′13.77″
Czarna catchment → Jurczycha catchmentvalleyhelocreneHCO3-Carural area
45N: 53°17′24.1″
E: 23°12′25.18″
Czarna catchment → Czarna Rzeczka catchmentvalleyhelocreneHCO3-Ca-Mgforest
46N: 53°16′50.22″
E: 23°11′31.01″
direct tributary of the Czarna river → Czarna catchmentvalleyrheocreneHCO3-Ca-Mgforest
47N: 53°16′3.72″
E: 23°12′56.16″
Czarna catchment → Czarna Rzeczka catchmentvalleyrheocreneHCO3-Ca-Mgforest
48N: 53°15′35.27″
E: 23°10′0.62″
direct tributary of the Czarna river → Czarna catchmentvalleyhelocreneHCO3-Cagrassland
49N: 53°17′12.6″
E: 23°8′2.38″
Czarna catchment → Czarna Rzeczka catchmenthillslopehelocreneHCO3-Ca-Mgforest
50N: 53°16′55.79″
E: 23°7′5.98″
Czarna catchment → Krzemianka catchmentvalleyrheocreneHCO3-Ca-Mgforest
51N: 53°16′38.56″
E: 23°3′30.18″
Czarna catchment → Krzemianka catchmentvalleyrheocreneHCO3-Ca-Mgforest/FV
52N: 53°16′27.53″
E: 23°5′28.25″
Czarna catchment → Krzemianka catchmentvalleyrheocreneHCO3-Ca-Mgforest
53N: 53°15′5.65″
E: 23°8′40.17″
Czarna catchment → Krzemianka catchmentvalleyrheocreneHCO3-Caforest
54N: 53°14′46.25″
E: 23°8′10.17″
Czarna catchment → Krzemianka catchmentvalleyhelocreneHCO3-Ca-Mgforest
55N: 53°13′39.73″
E: 23°10′4.77″
direct tributary of the Czarna river → Czarna catchmenthillsloperheocreneHCO3-Ca-Mggrassland
56N: 53°13′9.44″
E: 23°1′24.03″
right-side direct tributary of the Supraśl river → Supraśl catchmenthillslopehelocreneHCO3-Carural area
57N: 53°8′19.35″
E: 23°33′17.86″
left-side direct tributary of the Supraśl river → stream from Sofipol catchmenthillslopeartificial
limnocrene
HCO3-Cagrassland
58N: 53°8′17.93″
E: 23°33′12.44″
left-side direct tributary of the Supraśl river → stream from Sofipol catchmenthillsloperheocreneHCO3-Cagrassland
59N: 53°8′20.26″
E: 23°33′5.42″
left-side direct tributary of the Supraśl river → stream from Sofipol catchmenthillsloperheocreneHCO3-Ca-Mggrassland
60N: 53°8′21.2″
E: 23°33′7.51″
left-side direct tributary of the Supraśl river → stream from Sofipol catchmenthillsloperheocreneHCO3-Ca-Mggrassland/FV
61N: 53°9′26.11″
E: 23°31′44.04″
left-side direct tributary of the Supraśl river → stream from Sofipol catchmentvalleyrheocreneHCO3-Cagrassland
62N: 53°9′52.42″
E: 23°31′30.91″
left-side direct tributary of the Supraśl river → Supraśl catchmentvalleyrheocreneHCO3-Carural area
63N: 53°10′21.9″
E: 23°31′2.85″
left-side direct tributary of the Supraśl river → Supraśl catchmenthillsloperheocreneHCO3-Ca-Mgforest
64N: 53°10′35.29″
E: 23°30′3.76″
left-side direct tributary of the Supraśl river → Supraśl catchmentvalleyrheocreneHCO3-Ca-Mgforest
65N: 53°6′20.46″
E: 23°29′48.26″
Płoska catchment → Świniobródka catchmentvalleyrheocreneHCO3-Caforest
66N: 53°6′53.57″
E: 23°29′43.86″
Płoska catchment → Świniobródka catchmentvalleyrheocreneHCO3-Ca-Mgforest/grassland
67N: 53°7′13.04″
E: 23°30′34.1″
Płoska catchment → Świniobródka catchmentvalleyrheocreneHCO3-Mg-Caforest/grassland
68N: 53°6′12.95″
E: 23°24′31.8″
direct tributary of the Płoska river → Płoska catchment hillslopehelocreneHCO3-Ca-Mgforest/grassland
69N: 53°9′42.33″
E: 23°27′18.34″
direct tributary of the Płoska river → Płoska catchmenthillsloperheocreneHCO3-Ca-Mgforest
70N: 53°9′52.69″
E: 23°21′41.36″
left-side direct tributary of the Supraśl river → Starzynka catchmentvalleyrheocreneHCO3-Ca-Mgforest
71N: 53°9′5.69″
E: 23°18′25.66″
Supraśl catchment → Krasna Rzeczka catchmenthillslopehelocreneHCO3-Ca-Mgforest
72N: 53°9′13.86″
E: 23°17′26.2″
Supraśl catchment → Krasna Rzeczka catchmenthillsloperheocreneHCO3-Ca-Mgforest
73N: 53°9′12.1″
E: 23°17′24.11″
Supraśl catchment → Krasna Rzeczka catchmenthillslopelimnocreneHCO3-Caforest/FV
74N: 53°9′29.54″
E: 23°17′42.11″
left-side direct tributary of the Supraśl river → Supraśl catchment valleyrheocreneHCO3-Caforest
75N: 53°9′43.62″
E: 23°17′47.22″
left-side direct tributary of the Supraśl river → Supraśl catchmenthillsloperheocreneHCO3-Ca-Mgforest
76N: 53°13′17.37″
E: 23°18′1.96″
left-side direct tributary of the Supraśl river → Supraśl catchmentvalleyrheocreneHCO3-Caforest
77N: 53°13′13.9″
E: 23°18′5.54″
left-side direct tributary of the Supraśl river → Supraśl catchmentvalleyrheocreneHCO3-Ca-Mgforest/grassland
78N: 53°11′37.9″
E: 23°42′17.62″
Niemen catchment → Nietupa catchmenthillsloperheocreneHCO3-Ca-Mgforest/grassland/FV
79N: 53°18′19.94″
E: 23°1′55.69″
Narew catchment → Jaskranka catchmenthillslopehelocreneHCO3-Ca-Mgrural area
80N: 53°19′12.49″
E: 23°3′23.81″
Narew catchment → Jaskranka catchmenthillsloperheocreneHCO3-Carural area
Table 2. Statistical summary of the physical and chemical parameters of the Knyszyn Forest springs water.
Parameter MeanMin.Max.SDCV
Water temperature°C14.29.421.23.1322
ReactionpH7.816.229.020.446
Electrolytic conductivityµS cm−13991538469023
ORPmV73.028.3145.034.147
Oxygenmg dm−37.421.129.741.6622
Oxygen saturation%7410967423
Water color (Pt)mg Pt dm−314.70.164.214.782
Ca2+mg dm−378.443.1122.613.918
Mg2+mg dm−314.43.635.16.243
Na+mg dm−35.20.0131.624.3684
K+mg dm−31.60.0137.144.58289
HCO3 (C)mg dm−353.828.782.39.017
SO42−mg dm−327.71.650.0828
Clmg dm−311.55.352.68.776
SiO32mg dm−32.240.55.31.0547
TFemg dm−31.240.095.201.2454
DFemg dm−30.820.041.590.8261
PFemg dm−30.420.0024.130.42124
SRFemg dm−30.150.0090.850.1698
ODFemg dm−30.670.0121.530.6774
TNmg dm−31.860.4018.1621.6116
N-NH4+mg dm−30.240.0490.9390.24455
N-NO3mg dm−30.660.0524.5760.916139
N-NO2mg dm−30.0020.00010.0090.00171
TPmg dm−30.170.0281.3110.1696
DPmg dm−30.1210.0171.1740.144119
PPmg dm−30.04900.2530.050103
SRPmg dm−30.0660.0130.7170.086130
DOPmg dm−30.05600.4570.056134
DOCmg dm−34.161.0916.273.3280
SUVAmg dm−317.031.632.89.053
Phenolsmg dm−30.460.131.190.2248
Note(s): (ORP–oxidation reduction potential, TFetotal iron, DFedissolved iron, PFeparticle iron, SRFesoluble reactive iron, ODFedissolved organic iron, TN–total nitrogen, TP–total phosphorus, DPdissolved phosphorus, PPparticle phosphorus, SRP–soluble reactive phosphorus, ODPdissolved organic phosphorus, DOCdissolved organic carbon, SUVAaromaticity of organic matter, and CVcoefficient of variation).
Table 3. Average values of the saturation indexes (SI) in relation to minerals in the waters of the springs of the Knyszyn Forest.
MineralsSaturation Index
Halite NaCl−8.81
Iron (III) hydroxide, hydratedFe(OH)31.97
GoethiteFeOOH7.25
HematiteFe2O316.43
CalciteCaCO30.28
AragoniteCaCO30.12
DolomiteCaMg(CO3)2−0.29
SideriteFe CO3−0.47
GypsumCaSO4 2H2O−2.01
AnhydriteCaSO4−2.27
Jarosite KKFe3(SO4)2(OH)6−6.65
MelanteriteFe SO4 7 H2O−7.31
HydroxyapatiteCa5(PO4) 3OH−0.07
VivianiteFe3(PO4)2 8 H2O−3.84
QuartzSiO20.07
ChalcedonySiO2−0.41
ChrysoliteMg3Si2O5(OH)4−7.61
SepioliteMg2Si3O7 5OH 3 H2O−5.34
TalcMg3Si4O10(OH)2−4.96
Table 4. Results of the Spearman’s rank correlation analyses of water quality parameters and niche land use type of the Knyszyn Forest.
Niche Land Use Type
ParameterForestGrasslandRural AreaFV
Water temperature0.003−0.1350.255−0.009
Reaction0.125−0.1450.042−0.010
Electrolytic conductivity−0.3010.0810.0400.276
Eh−0.0790.030−0.1430.161
Oxygen0.272−0.194−0.2660.070
Oxygen saturation0.212−0.220−0.1610.120
Water color0.030−0.0130.070−0.088
Ca2+−0.090−0.019−0.0340.164
Mg2+0.003−0.086−0.0460.124
Na+−0.3060.0820.1850.182
K+−0.1150.1450.082−0.071
HCO3−0.188−0.1010.1490.255
SO42−0.215−0.091−0.068−0.142
Cl−0.1870.176−0.0460.091
SiO32−0.090−0.0730.2670.015
TFe−0.145−0.0290.2120.053
DFe−0.1330.0090.2270.024
PFe−0.126−0.0130.0670.065
SRFe−0.2560.1460.2160.011
ODFe−0.068−0.0260.2050.005
SRMn−0.046−0.125−0.0210.211
TN0.0160.126−0.051−0.136
NNH4+−0.037−0.0600.286−0.070
NNO3−−0.0950.0810.116−0.011
NNO2−−0.0330.0560.060−0.049
TP0.120−0.2220.255−0.115
DP0.128−0.1900.238−0.153
PP0.039−0.0960.130−0.054
SRP0.099−0.0460.217−0.264
DOP0.086−0.2790.1570.065
DOC0.0280.184−0.227−0.085
SUVA−0.044−0.1770.2000.120
Fenols0.0060.0220.013−0.037
Values in bold are different from 0 with the significance level alpha = 0.05.
Table 5. Percentage of variance accounted for by land use, partitioned by a partial redundancy analysis.
Variance ComponentExplanation [%]
Land UseForest46.5
Finetextured vegetation (FV)16.9
Grassland25.7
Rural10.7
Total explained68.9
Unexplained31.1
Publisher’s Note: MDPI stays neutral with regard to jurisdictional claims in published maps and institutional affiliations.

