

Evaluation of Fresh Groundwater Lens Volume and Its Possible Use in Nauru Island


Civil and Environmental Engineering Department, Politecnico di Milano, Piazza L. da Vinci 32, Milano 20133, Italy
*
Author to whom correspondence should be addressed.
Water 2022, 14(20), 3201; https://doi.org/10.3390/w14203201
Submission received: 6 September 2022
/
Revised: 26 September 2022
/
Accepted: 6 October 2022
/
Published: 11 October 2022
(This article belongs to the Special Issue Groundwater Hydrological Model Simulation)
Abstract
:A proper management of fresh groundwater lenses in small islands is required in order to avoid or at least limit uncontrolled saltwater intrusion and guarantee the availability of the resource even during drought occurrences. An accurate estimation of the freshwater volume stored in the subsoil is a key step in the water management decision process. This study focused on understanding the hydrogeological system behaviour and on assessing the sustainable use of the groundwater resource in Nauru Atoll Island (Pacific Ocean). A first phase, concerning the hydrogeological characterization of the island, highlighted the occurrence of few drought-resilient freshwater lenses along the seashore. The second part of the study focused on the characterization of a freshwater lens found in the northern coastal area and identified such area as the most suitable for the development of groundwater infrastructures for water withdrawal. The characterization activities allowed quantifying the freshwater lens thickness and volume in order to assess the capability to satisfy the population water demand. A geo-electrical tomography survey was carried out, and a 3D density-dependent numerical model was implemented in SEAWAT. The model results demonstrated that in small islands freshwater can unexpectedly accumulate underground right along the seashore and not in the centre of the island as is commonly believed. Furthermore, the model can constitute a useful tool to manage the groundwater resources and would allow the design of sustainable groundwater exploitation systems, avoiding saltwater intrusion worsening.
1. Introduction
The management of freshwater reserves is nowadays becoming increasingly important. Freshwater stored in coastal aquifers is particularly vulnerable to degradation because of its proximity to seawater. Coastal aquifers often must face environmental problems related to seawater intrusion as the result of indiscriminate and unplanned groundwater exploitation for fulfilling the freshwater need of the growing global population [1,2,3,4,5].
Small islands, consisting of extremely small surface areas [6] and maximum elevations approaching only a few metres [7], have a particular physical structures and unique hydrological systems. This category includes the small coral islands of the Caribbean Sea and the coral atolls of the Pacific and Indian Oceans, where the surface water does not exist in an exploitable form, and fresh groundwater resources are limited. On these islands, conventional options for freshwater supplies are limited to groundwater development and rainwater harvesting [8]. The groundwater in small islands is located into the subsoil in the form of lenses, relatively thin layers of freshwater floating above the denser seawater. The mixing zone separating freshwater and seawater influences the depth at which freshwater is available [9]. Usually, in small islands’ subsoil, the mixing zone contains a gradual transition in salinity from freshwater to seawater as well [6,10,11], and its thickness is related to the tidal fluctuations [12,13]. Buddemeier and Oberdorfer [14] suggested that the mixing zone, defined by salinities between 2.5% and 95% of seawater concentration, can occupy a significant volume of atoll island aquifers compared to the freshwater component. Water infiltrates into the ground and becomes recharged to groundwater that moves from the inner parts of the island towards the coast and discharges along the coastline, where the outflow is usually not regular but varies according to changes in permeability and aquifer thickness [8,15,16]. Fresh groundwater lenses’ salinization due to seawater intrusion is a main issue and has a great impact on groundwater quality and can even prevent the utilization of the underground resource [6,7,8,17]. Werner et al. [18] found that the combined effects of complex geology, tides, episodic ocean events, strong climatic variability, and human pressures strongly influence the extension of fresh groundwater lenses. Thus, these underground water resources are particularly vulnerable to saline contamination but, on the other hand, are the unique water supply sources for many island populations. Furthermore, the freshwater supply security is threatened by the sea level rise due to the effects of climate change [19,20]. A correct knowledge of the hydrogeological system and the fresh groundwater lens availability is fundamental for the water resources management of many small islands [2,21,22]. Numerical modelling is a very useful tool and able to solve many hydrogeological issues: from the interpretation of the contamination sources to their path in the aquifer [23] to the study of the best remediations strategies [24,25]. In this case, numerical modelling is a tool used to quantify freshwater availability range, starting from simple empirical relationships to three-dimensional density-dependent models [18,26]. Using a variable-density numerical model, Underwood et al. [27] discussed the effect of various hydrogeological parameters, already identified by Falkland [8], on the size of the fresh groundwater lenses on small islands. Bailey et al. [28] also started from Falkland’s study [8] and carried out a sensitivity analysis of atoll fresh groundwater lens thickness, providing an insight into some of the fresh groundwater lens-controlling factors. Alberti et al. [15] implemented a 2D numerical density-dependent model to understand the phenomenon of freshwater accumulation in the sandy part of Nauru coastal belt. Similarly, Babu et al. [29] presented a quasi-3D sharp interface finite element model to investigate the saltwater intrusion dynamics in Tongatapu Island, Kingdom of Tonga, Polynesia. As an example of groundwater resource management in island aquifers using numerical models, Coulon et al. presented first a parameter estimation framework [30] and then a numerical model to optimize the pumping rates while avoiding saltwater intrusion in the Magdalen Islands, Quebec, Canada [31].
Vulnerability studies focused on many small islands in the Pacific: Houghton et al. [32] showed that the costs of general infrastructure for water supply (e.g., reverse osmosis (RO) desalination plant) and protection are often well beyond the financial possibilities of most small island states. The need to implement measures for reducing vulnerability and increasing resilience of systems to climate variability in small islands was highlighted by Nurse and Moore [33]. The objective for small islands is then to look at alternative sources of water in the long run [34,35,36].
Nauru is an isolated raised coral-limestone island located 41 km south of the Equator in the central Pacific Ocean, standing 4300 m above the ocean floor. The National Sustainable Development Strategy (NSDS) for Nauru was prepared in November 2005. In the document the government identified sustainable supply of power and water as fundamental for supporting the island economic growth. In the past, Nauru imported water from the neighbouring islands (Marshall Islands and Solomon Islands), but this is very expensive and is no longer an option. At present, Nauru’s main sources of water are rainfall and desalination (RO). These water supplies are enough in normal rainfall year but become insufficient in case of prolonged drought or when the desalination plants are not in operation. On the other hand, the RO is expensive in terms of energy consumption and needs expertise for its maintenance. Thus, the best option is to look for alternative water resources such as groundwater, which could turn out to be a potential source of water for Nauru and that has not yet been exploited accordingly to its possibilities. Several studies were focused on the groundwater potential for Nauru, such as Falkland’s study [37] that reports the activities needed to inspect this water resource in the island and make it available for the people.
In this context, Politecnico di Milano was in charge of a project concerning the assessment of the practicability of infrastructural actions for sustainable usage of groundwater resources in the island [38]. The project consisted of three steps: (1) development of the conceptual site model (CSM) through the geological and hydrogeological characterization of the island; (2) implementation of 2D and 3D density-dependent flow and transport groundwater numerical models focused on the island’s part more suitable for the groundwater development; and (3) study and preliminary design of infrastructural actions for groundwater sustainable exploitation. Alberti et al. [15] presented the first step of the project, describing both the island geological structure, its climate, the activities carried out to identify the hydrogeological setting, the seawater intrusion occurrence in Nauru aquifer, and, at last, implemented the 2D numerical model. The present paper mainly focused on the second project step concerning the 3D modelling and the survey carried out. The main challenges concerned: (a) better understanding the behaviour of the hydrogeological system and why groundwater accumulates along the coast rather than in the centre of the island and (b) quantifying the thickness and volume of the freshwater lens in the northern sector of the island to evaluate the possibility, aiming to satisfy, at least in part, the water demand of the population. The study shows, as a proper combination of hydrogeological investigations and density-dependent groundwater modelling, all the necessary steps to correctly manage groundwater resources on small islands prone to saltwater intrusion and long drought periods.
2. Materials and Methods
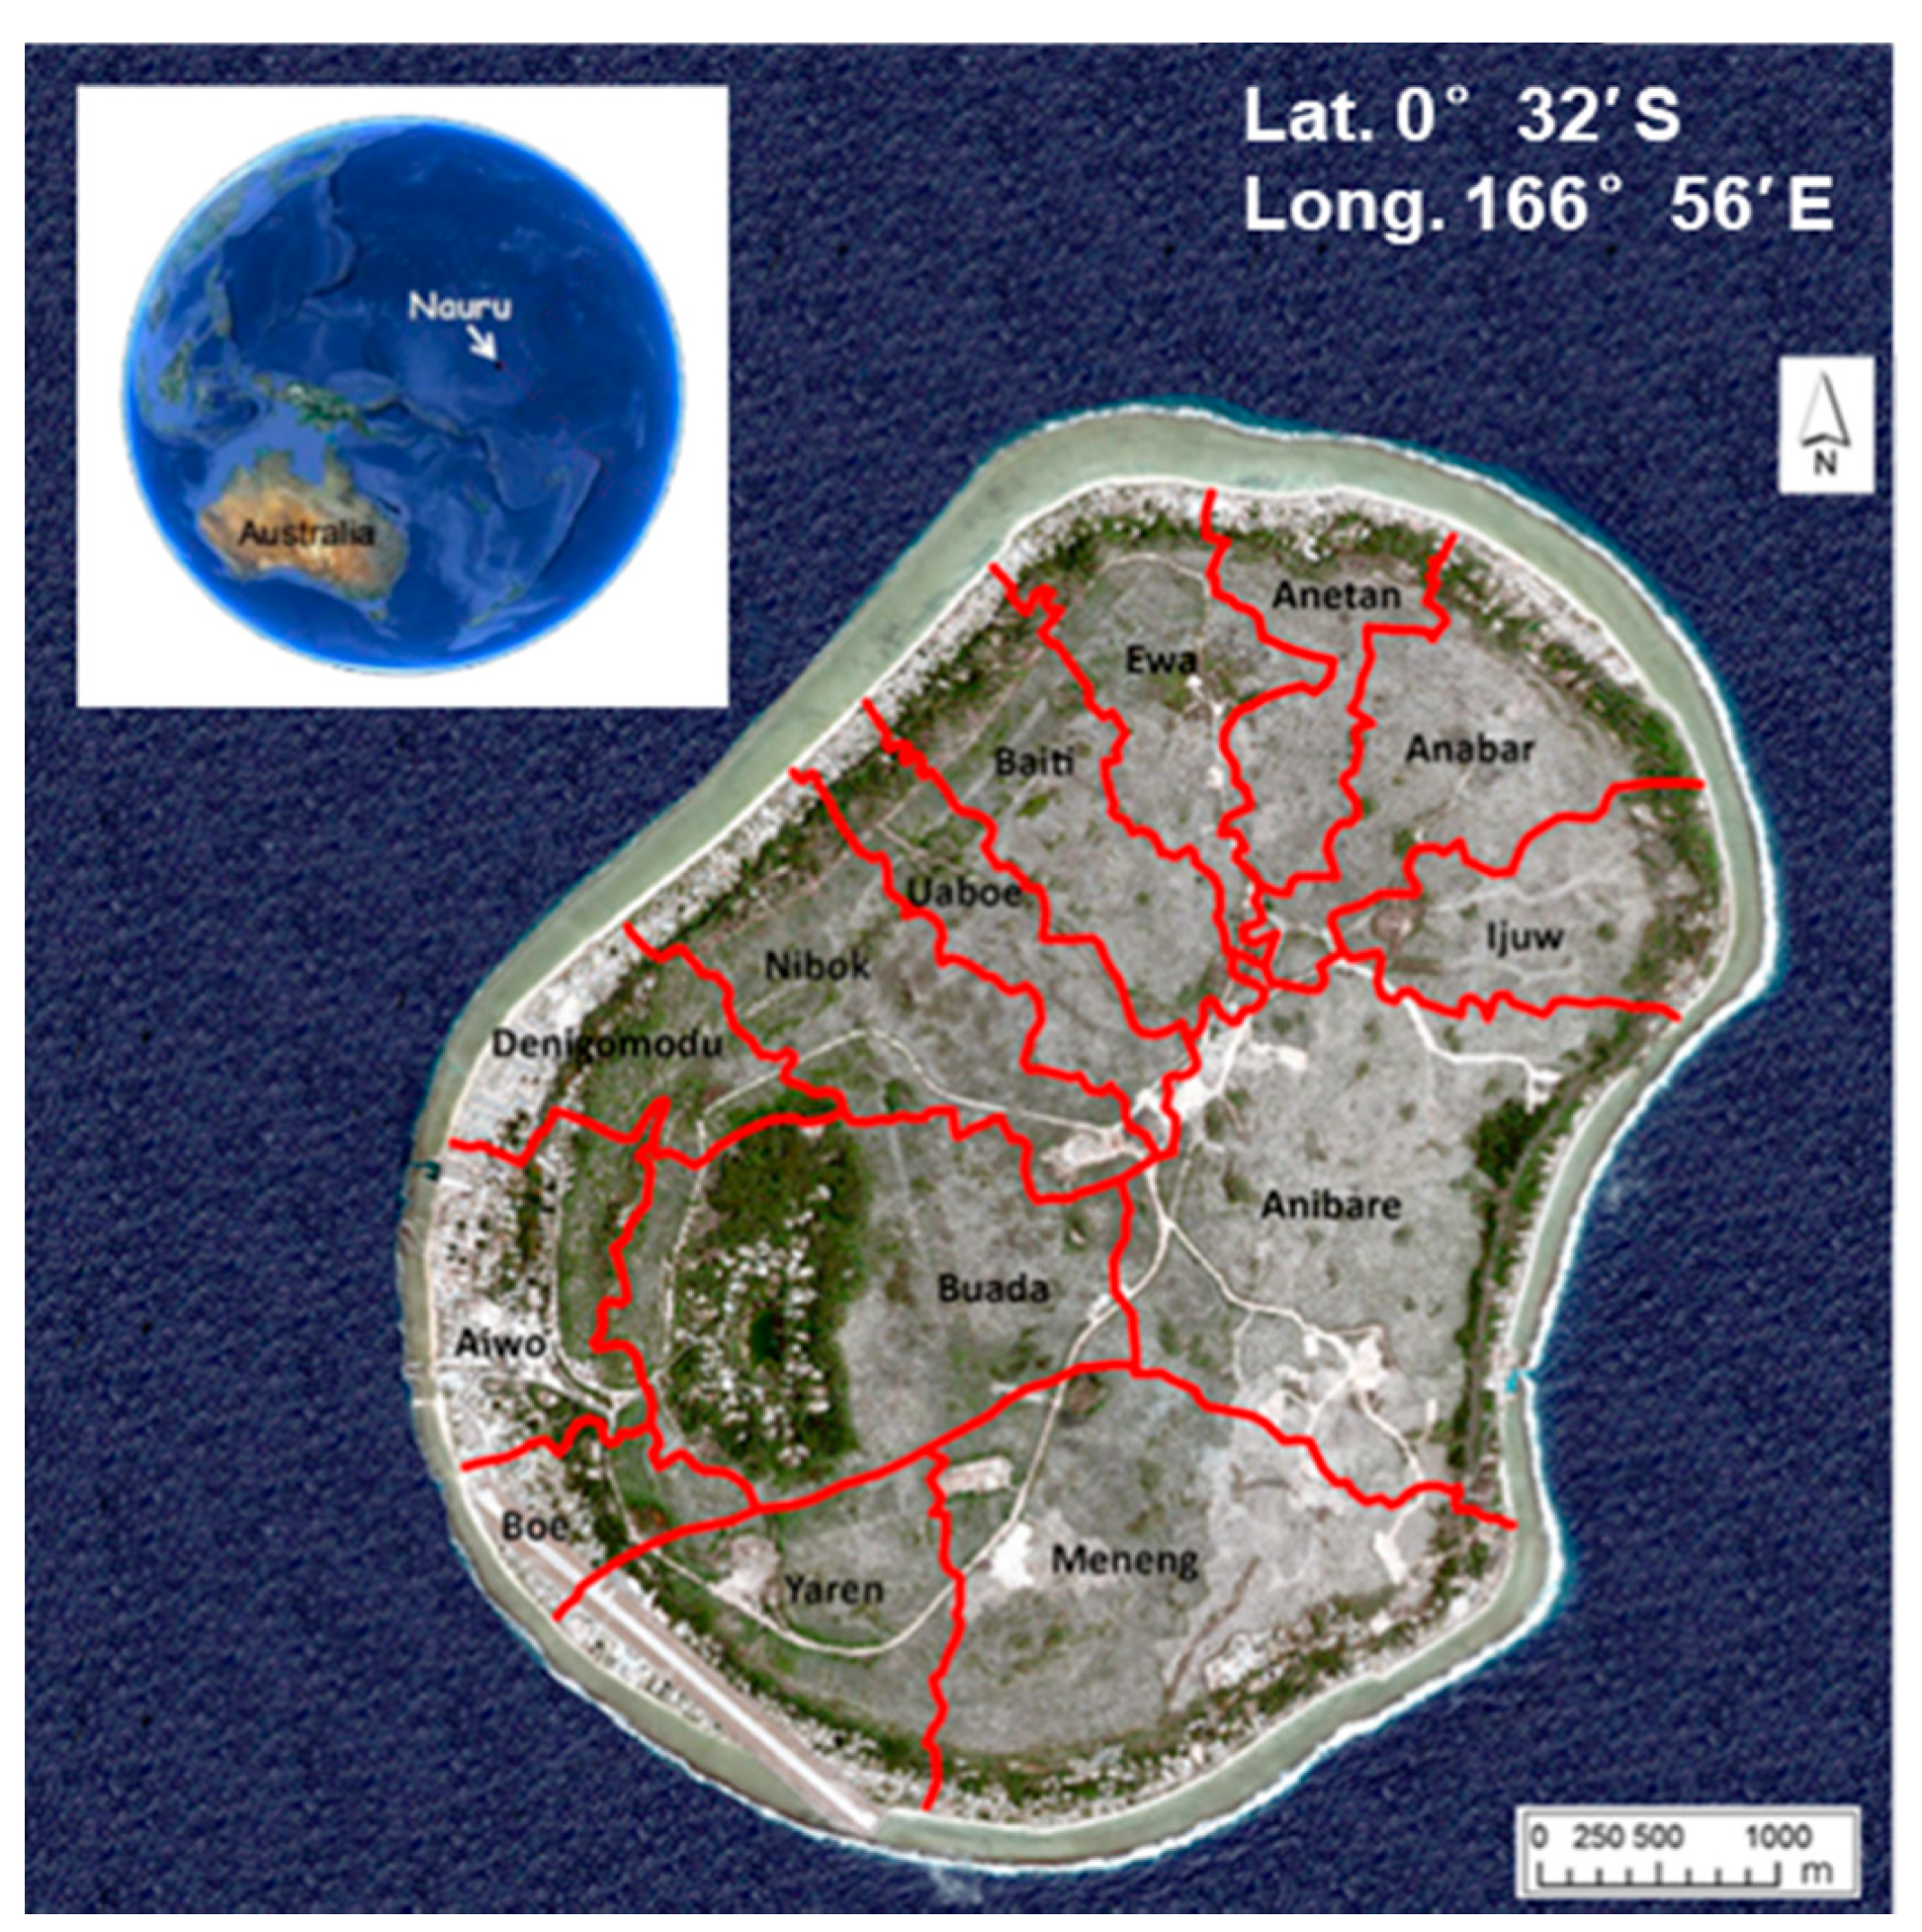
The Republic of Nauru (Figure 1) is an isolated, uplifted limestone island located 41 km south of the equator (0°32′ S, 166°56′ E). This island represents a raised atoll standing 4300 m above the ocean floor, with a maximum land-surface altitude of 70 m above the sea level (cross section in Figure S1 in Supplementary Materials). The total land area of Nauru is only 22 km2, surrounded by a fringing coral reef between 150 and 250 m wide. The land area consists of a narrow coastal plain (Bottomside) 100 to 300 m wide and with an elevation ranging from 0 to 10 m a.s.l., which encircles a limestone escarpment rising some 30 m to a central plateau (named Topside). The Bottomside consists of a sandy or rocky beach on the seaward edge and a beach ridge or foredune, behind which are either relatively flat ground or, in some places, low-lying small lagoons filled by brackish water. The high plateau consists of a matrix of coral-limestone pinnacles and limestone outcrops, between which lie extensive deposits of soil and high-grade tricalcic phosphate rock, which was extensively mined in the past century. On the southwest-central part of the island, there is a wide and fertile depression (about 120,000 m2), where a brackish water lake, known as Buada Lagoon, is located (Figure 1). This is the only surface water body (38,000 m2) existing on the entire island. Jacobson and Hill [39], in 1987, led the first hydrogeological survey in Nauru, basing all their measurements on a reference point called the reduced level (RL). Groundwater level measurements of all the following hydrogeological studies on the island [6,15] were referred to as RL [40].
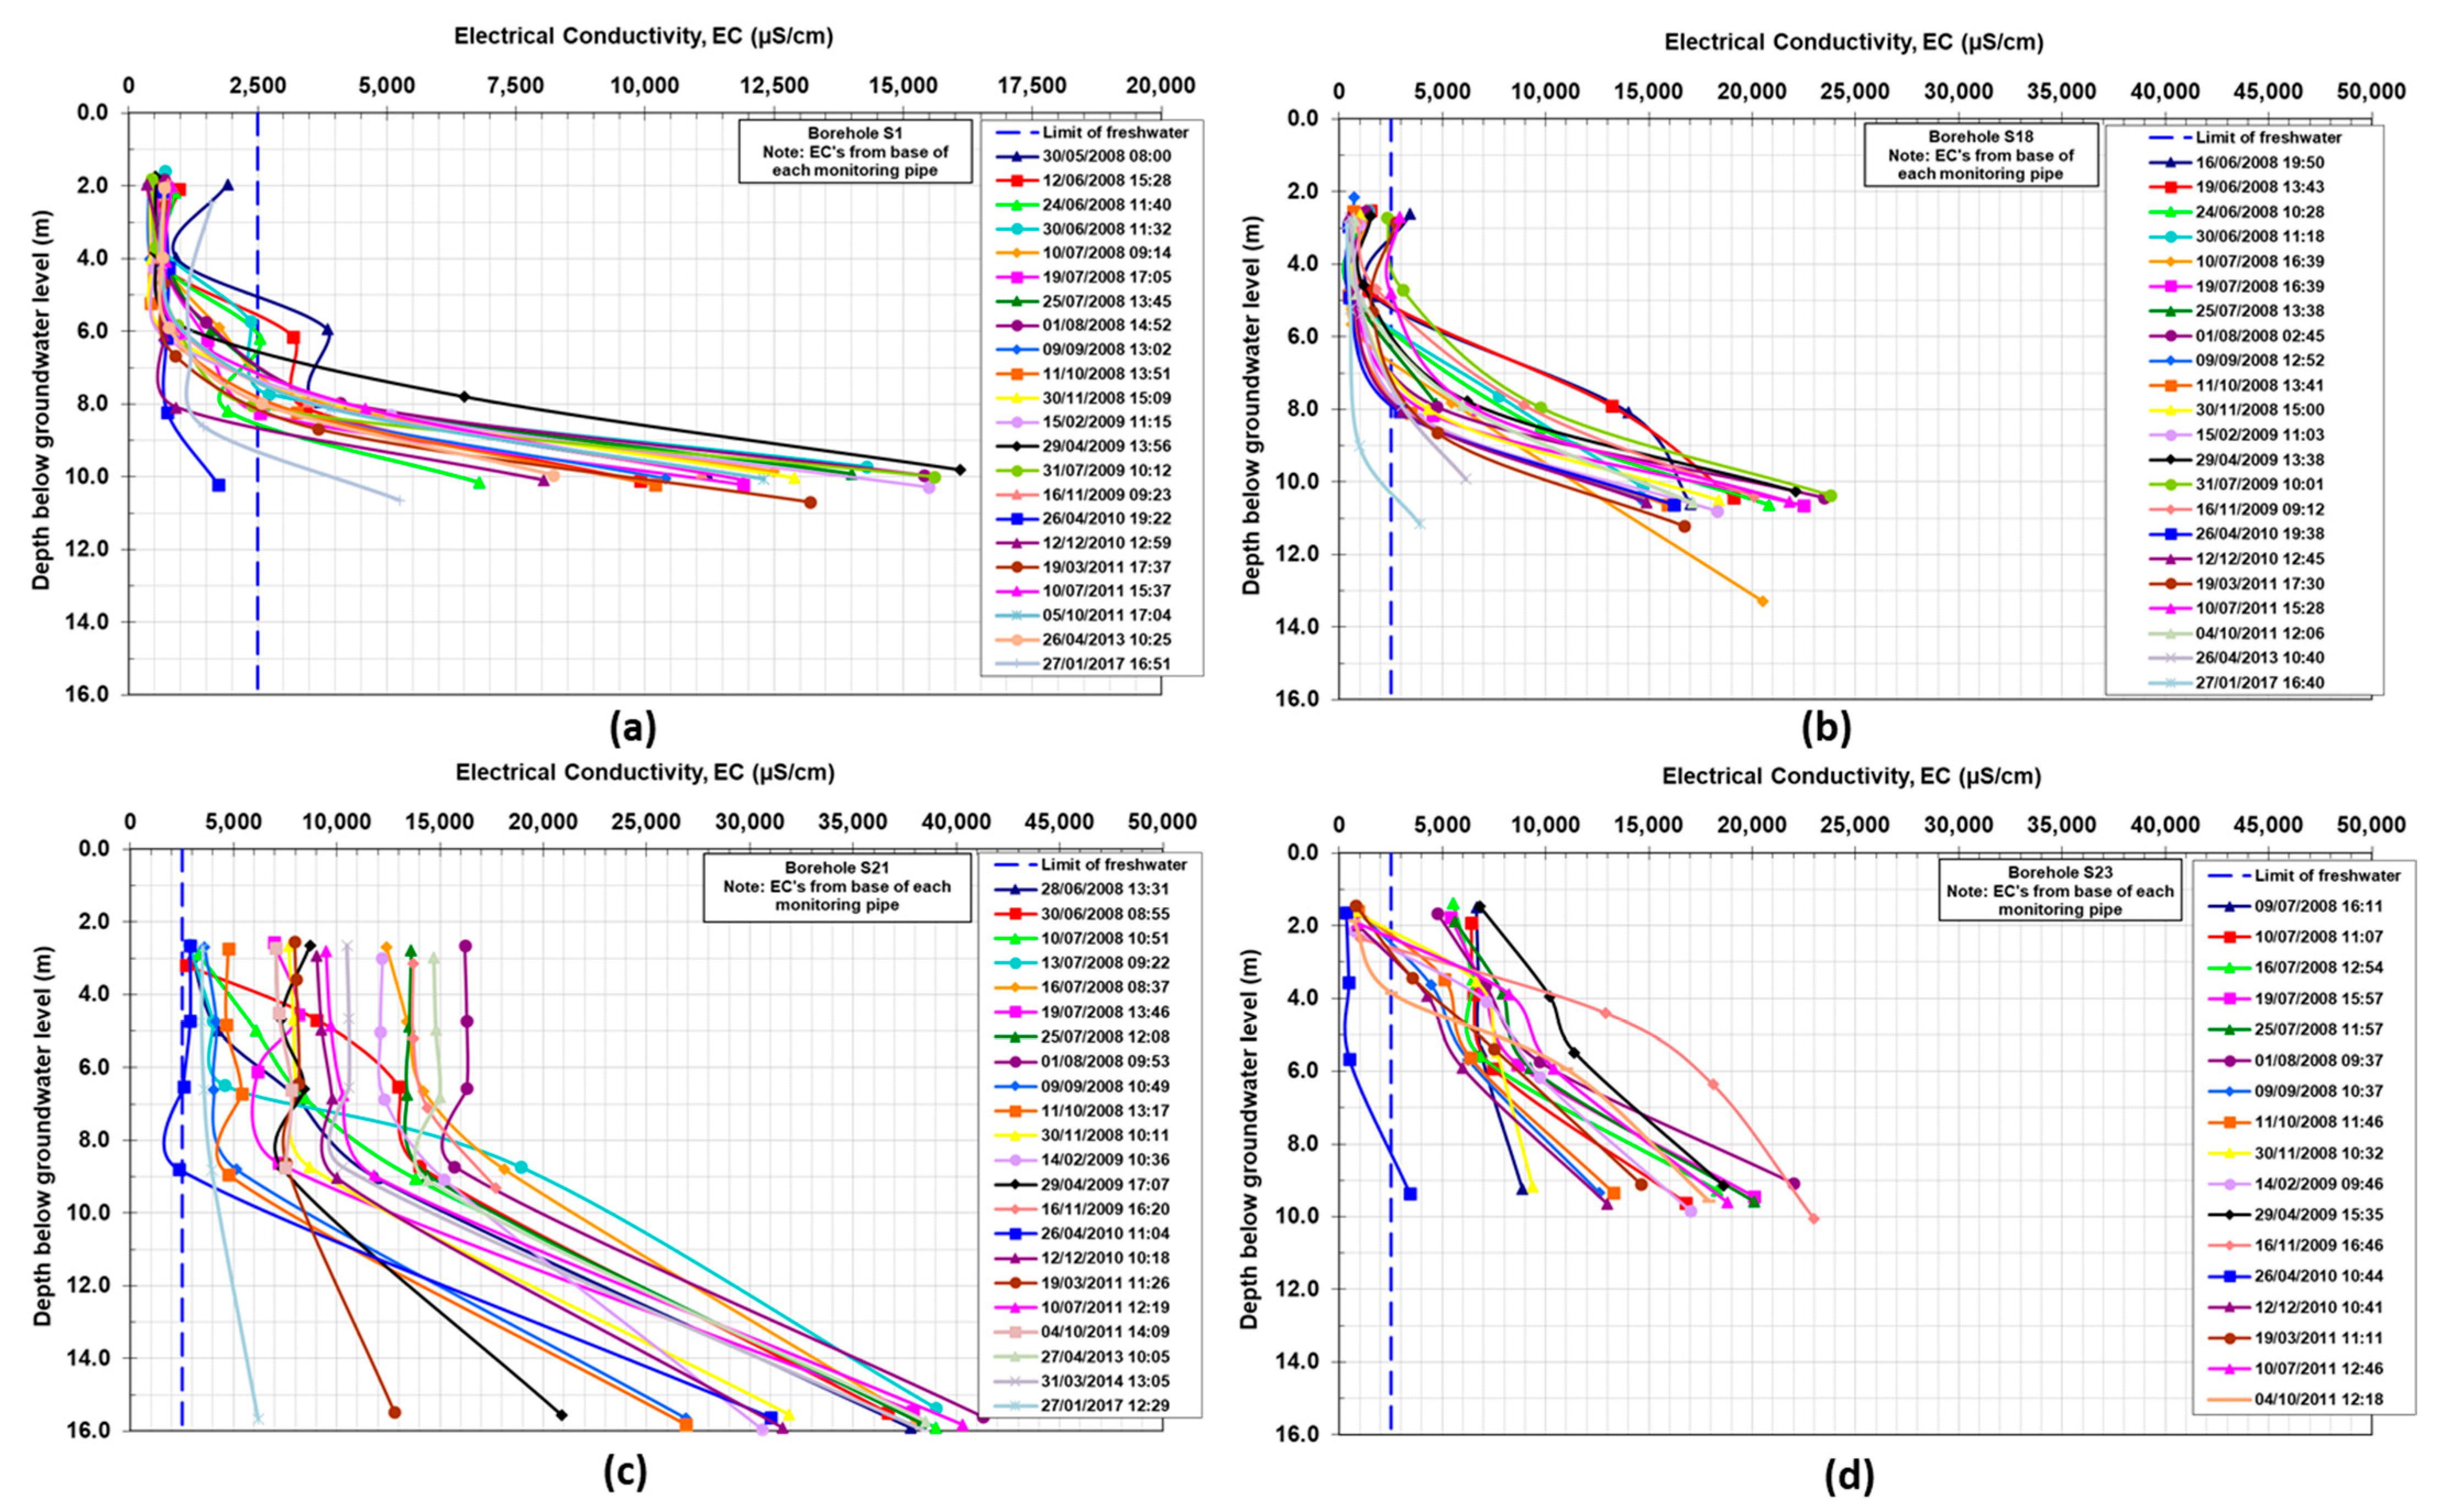
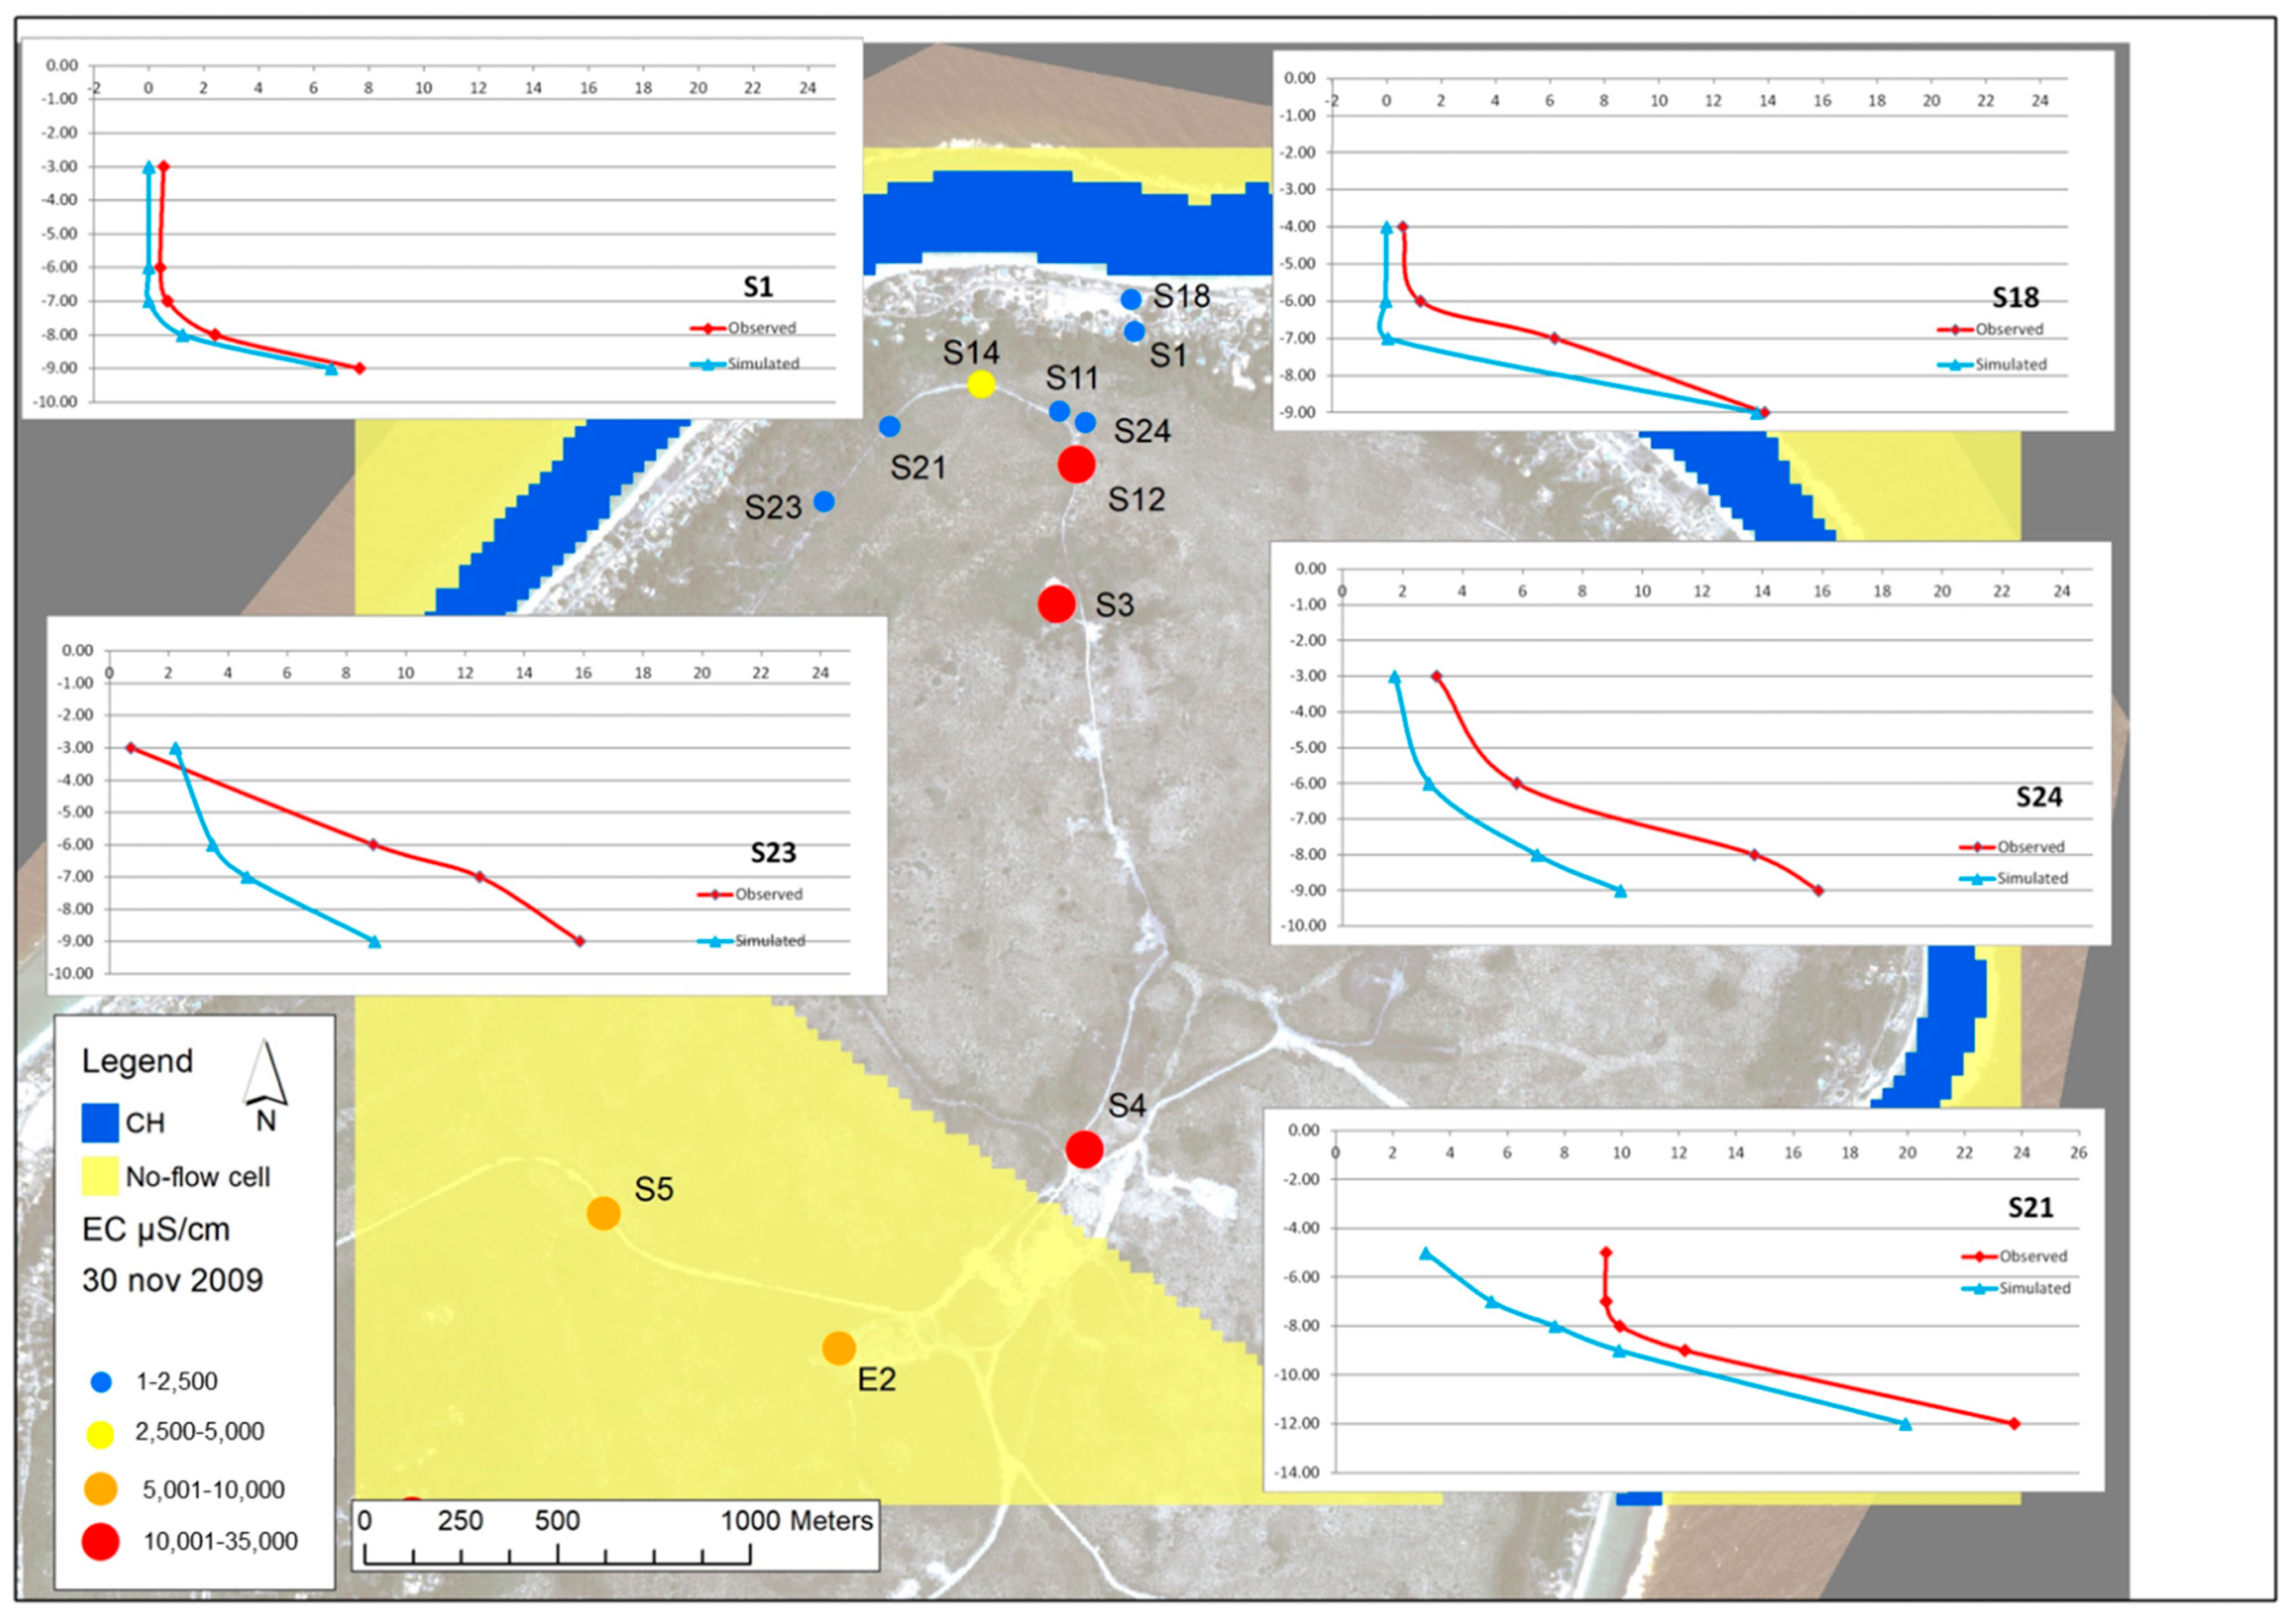
Most of the wells and monitoring wells in Nauru are located along the coastline [15], where most people live, and the groundwater is mainly exploited. Methods used for water extraction are pumping or bailing. In detail, along the coastline, there are about 350 domestic wells, 126 of which are used as monitoring wells [15,41]; referring to the measurements carried out by Nauru government, most of these wells present electrical conductivity (EC) values definitely higher than 2200 μS/cm, which is the drinkable limit (1.5 g/L of TDS) defined by Nauru government [42]. Only in the northern part of the island, in Anetan and Ewa districts, the EC values in multipipe monitoring well S1 (5 pipes) and S18 (4 pipes) are lower than the drinkable limit in the shallow part (Figure 2a,b). The surveys show that in this zone, freshwater depth ranges between 6 m (June 2008) and 8 m (April 2010) below the ground level. In other areas, the common EC values are always higher, as shown in Figure 2c,d for monitoring wells S21 and S23.
For a better understanding of the geological and hydrogeological setting of the island, Alberti et al. [15] discussed in detail its hydrogeological structure and the activities carried out to identify the related properties and the seawater intrusion occurrence in Nauru aquifer.
2.1. Hydraulic Tests
During a first characterization phase, Politecnico’s researchers tried to perform some pumping tests, but the small size of the pumps available in Nauru did not allow the adequate stressing of the aquifer. Consequently, none of these provided satisfactory results, and during the last visit to Nauru, 12 pneumatic slug tests were performed focusing on the northern sector of the island. The tests were carried out in situ, pushing the Geoprobe systems ® rods in the aquifer to the desired depth and pumping air into the rods to lower the water level. Once reached, the system equilibrium air was released, and the sensor registered the groundwater recovery inside the rods. The duration of each test was about 20 min. The slug tests allowed obtaining hydraulic conductivity values in the proximity of the piezometers S1 and S18. For the slug tests, the method used for the interpretation was derived from Bouwer and Rice [43], whereas for the pumping test, the interpretative approach was derived from the adaptation for unconfined aquifer of Neumann [44]. In detail, the test carried out 10 m north of the piezometer S1 provided a hydraulic conductivity value of 11.98 m/d at 5 m depth, while the slug tests carried out next to the piezometers S1 and S18 showed the common feature of having a greater permeability with increasing depth. Close to S1, the hydraulic conductivity increases from 3.46 m/d to a depth of 7 m from the ground level and up to 29 m/d at a depth of 15 m from the ground level; next to S18 instead, the measured hydraulic conductivity is 0.38 m/d at 14 m depth and increases up to 7.08 m/d at a depth of 17 m. The tests allowed to achieve the hydraulic conductivity values for the Bottomside for the Anetan district. All the tests performed are summarized in Table 1.
2.2. Geo-Electrical Investigation
For the Nauru project [38], the researchers of Politecnico di Milano, in partnership with the National Research Council (Consiglio Nazionale delle Ricerche—CNR), carried out a geoelectrical survey in order to define in detail the thickness and quantity of the freshwater lens present in the northern area of Nauru, in the Capelle zone belonging to Anetan and Ewa districts (Figure 2). The results of the Nauru project’s first phase [15] show that this area presents a freshwater lens that maintains significant thickness over the years and has been resilient even in drought periods. The 2D numerical model [15] allowed to interpret the cause of the freshwater presence in the proximity of the seashore.
The geoelectrical prospections are part of the geophysical survey methods and, through an indirect way, allow detecting and characterizing the shape, dimensions, and physical properties of the underground structures. The electrical resistivity tomography (ERT), through vertical electrical sounding (VES), is the most used technique. A georesistivimeter “PASI E3 Digit” (produced by Pasi s.r.l.) was used for the geo-electrical investigation, while the software “Earthimager 2D” (Advanced Geosciensces Inc.) was used for the tomographic inversion. It is based on the observation of the potential difference created by the introduction of electrical current into the ground and on the evaluation of the electrical resistivity. As this parameter is very sensitive to the presence of water in pores and to salt concentration in water, its spatial variations give a hint of the freshwater thickness in the subsoil. However, the data interpretation is difficult when the study is carried out in thin aquifers affected by saltwater intrusion. Indeed, assuming these conditions, a sharp surface separating the freshwater unit from the salty one does not exist, and a transition zone is present, characterized by variable thickness and salt concentration (related also to tidal fluctuations [12]). In the Nauru case, a clear evaluation of the freshwater thickness of the transition zone and of the saltwater occurrence was carried out by means of the integration of geoelectrical data with EC (electrical conductivity) and head measurements in wells close to geo-electrical investigations. Tidal fluctuations turned out to affect the tomographic data because their acquisition occurred in a time frame comparable with the one of sea level variations. Thus, the collected hydrogeological data were used to link, at known depth, the EC values to the geophysical resistivity data.
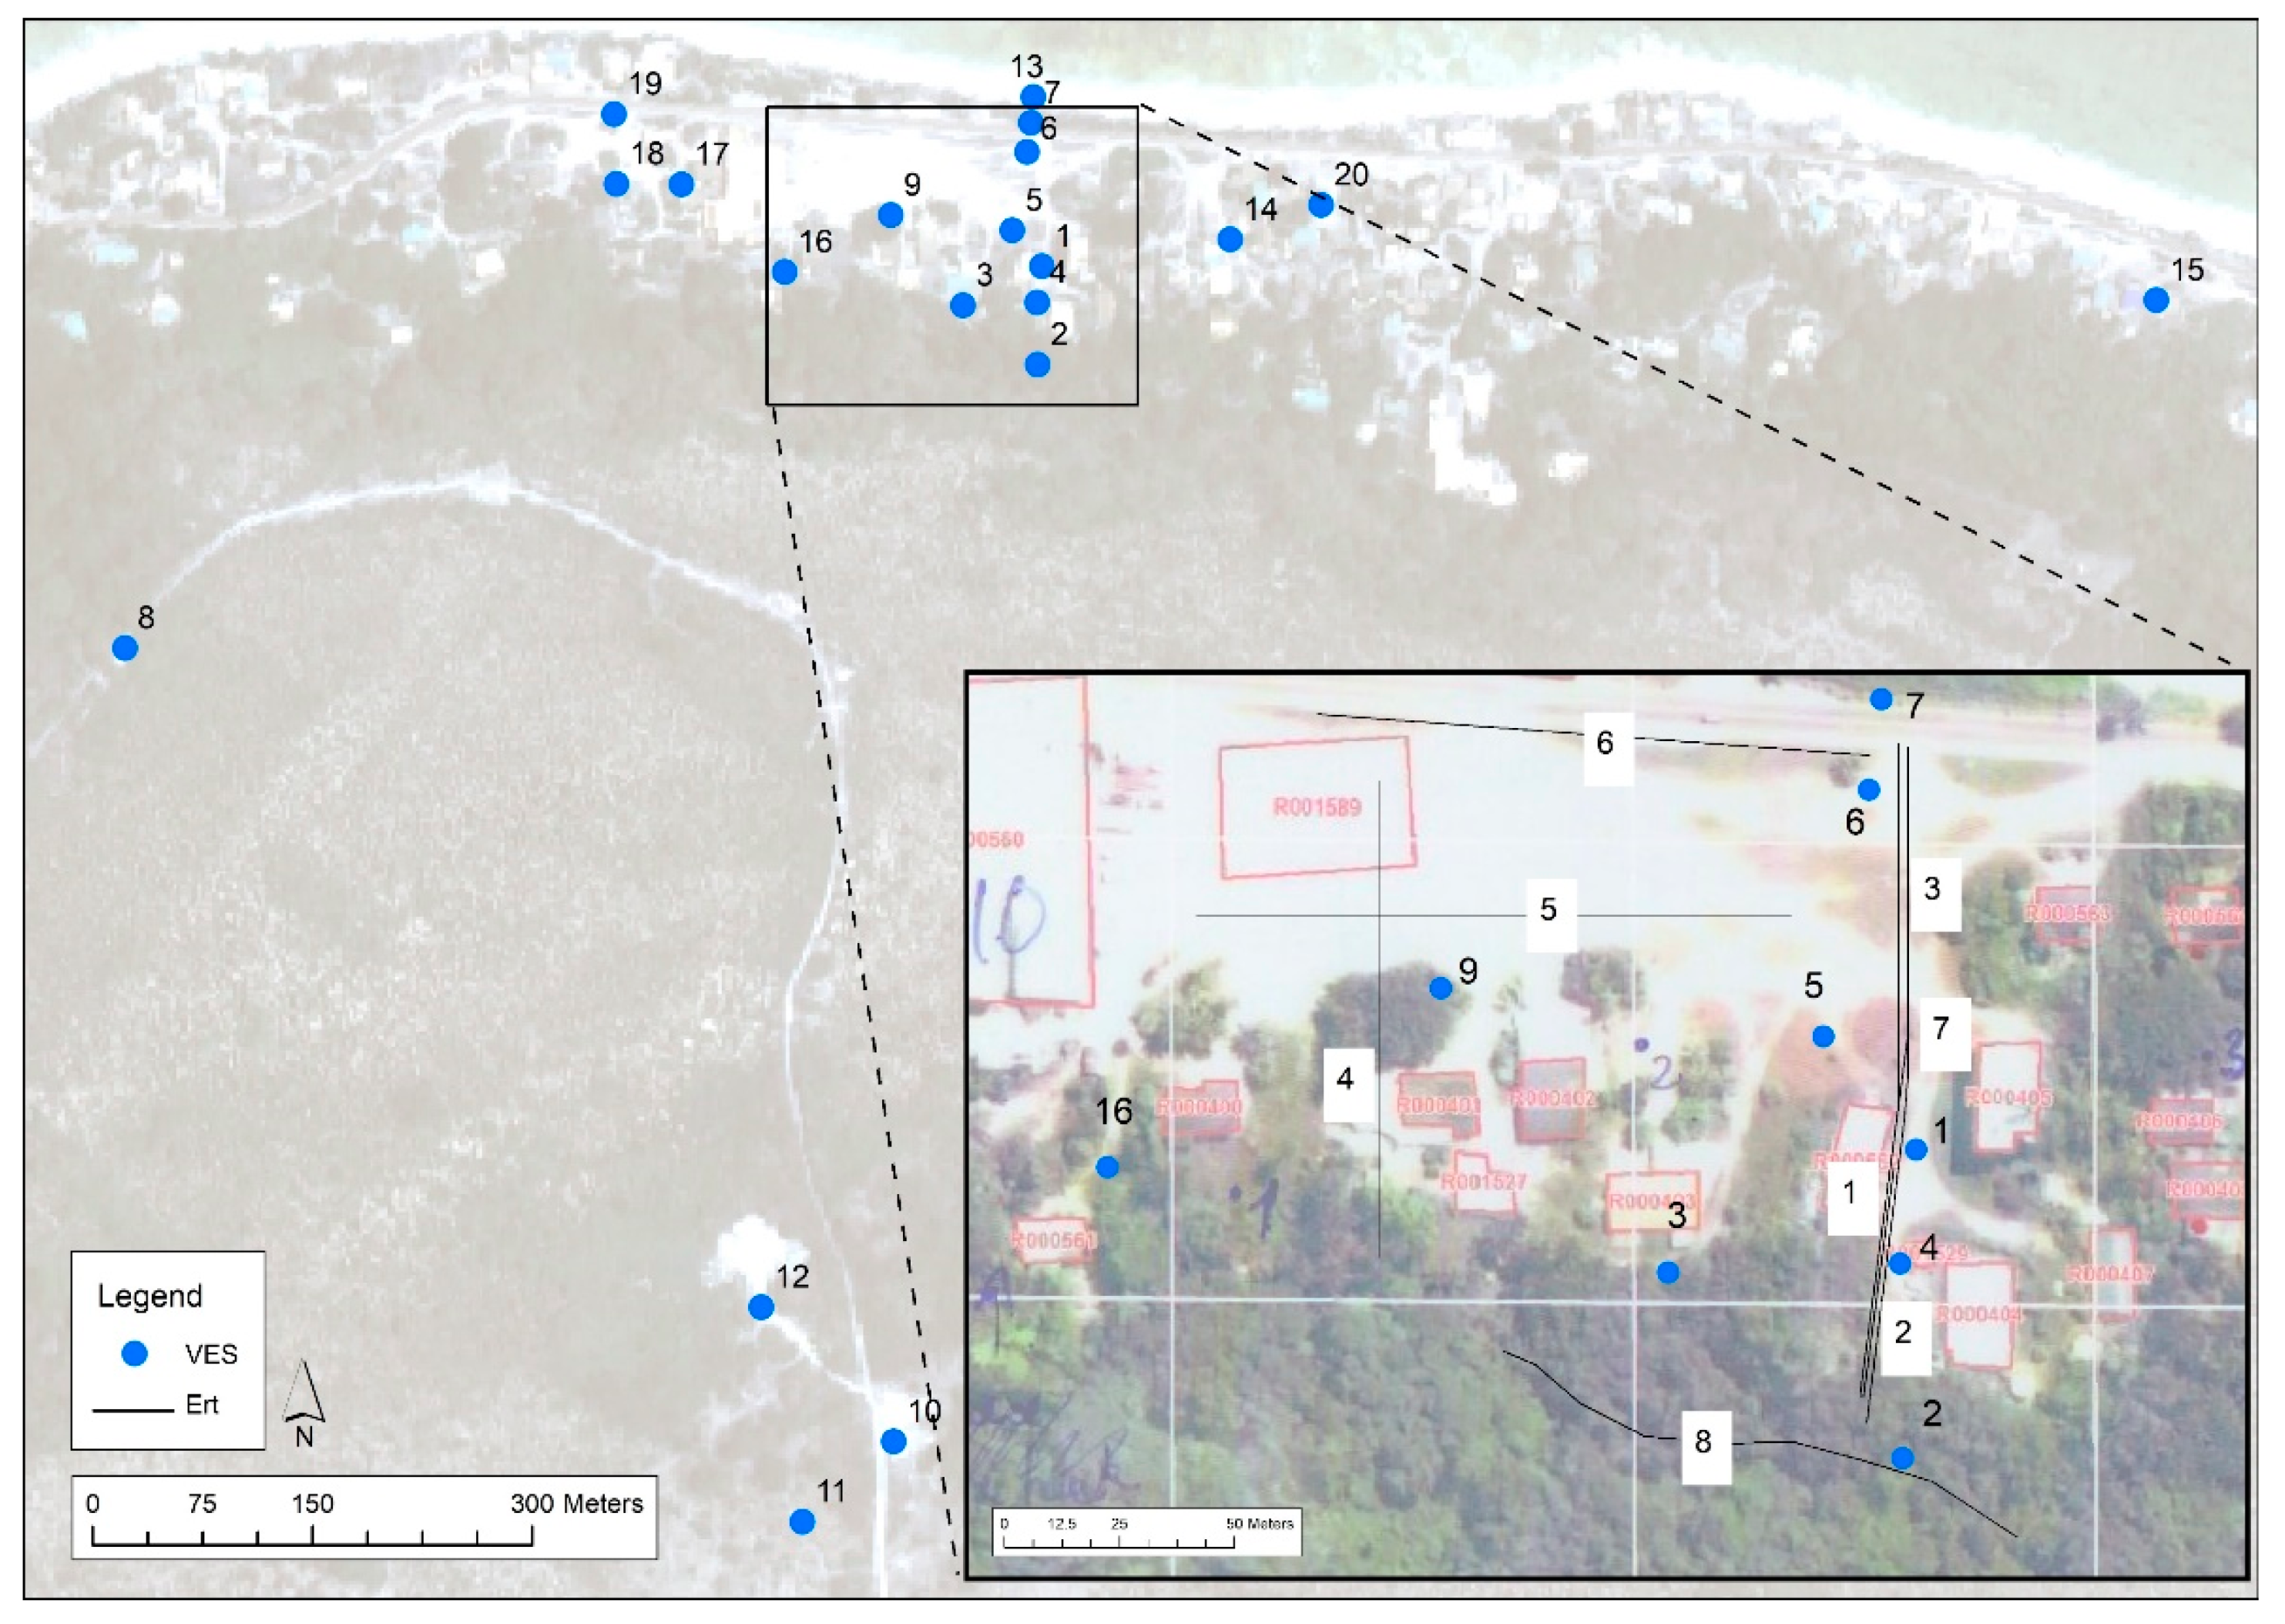
On April 2013, during the geophysical survey, 20 VES and 8 ERT were carried out in the northern part of the island (Figure 3). The survey was mainly focused on the Bottomside, where 16 VES were carried out at 8–10 m depth from the ground level, and 4 on the Topside at a depth ranging from 17 to 27 m from the ground level. All the VES were performed by means of the Schlumberger quadrupole using an AB/2 spacing of about 50 m. Differently, all the ERT were carried out on the Bottomside along 4 cross-sections having a length ranging from 100 to 150 m.
2.3. 3D Numerical Model Implementation
The evaluation of the available freshwater volume in the Nauru aquifer is the starting point for the sustainable use of the groundwater resource. The next step of the study is the implementation of the 3D numerical model. This is the tool to evaluate the effect on the characterized fresh groundwater lens related to the infrastructural actions for groundwater sustainable exploitation that is planned at point 3 of the Nauru project. Infrastructures for groundwater supply indeed have to be designed with great consideration of the system’s impact on the natural groundwater resource. Pumping water infrastructure often involves large-scale ground water withdrawals, which is not feasible in small islands such as Nauru, where the saltwater intrusion phenomenon could be worsened by groundwater extraction for the well-known up-coning effect. Infiltration galleries, horizontal wells, or skimming wells could be appropriate methods of groundwater abstraction from small coral islands aquifers: they avoid the problem of saline intrusion by spreading the impact of pumping (head loss) over a larger area of the freshwater lens than wells normally do [45,46]. Nauru, as many small islands, is vulnerable to water shortage, and the use of horizontal drains is thought to be a suitable tool for a sustainable groundwater management.
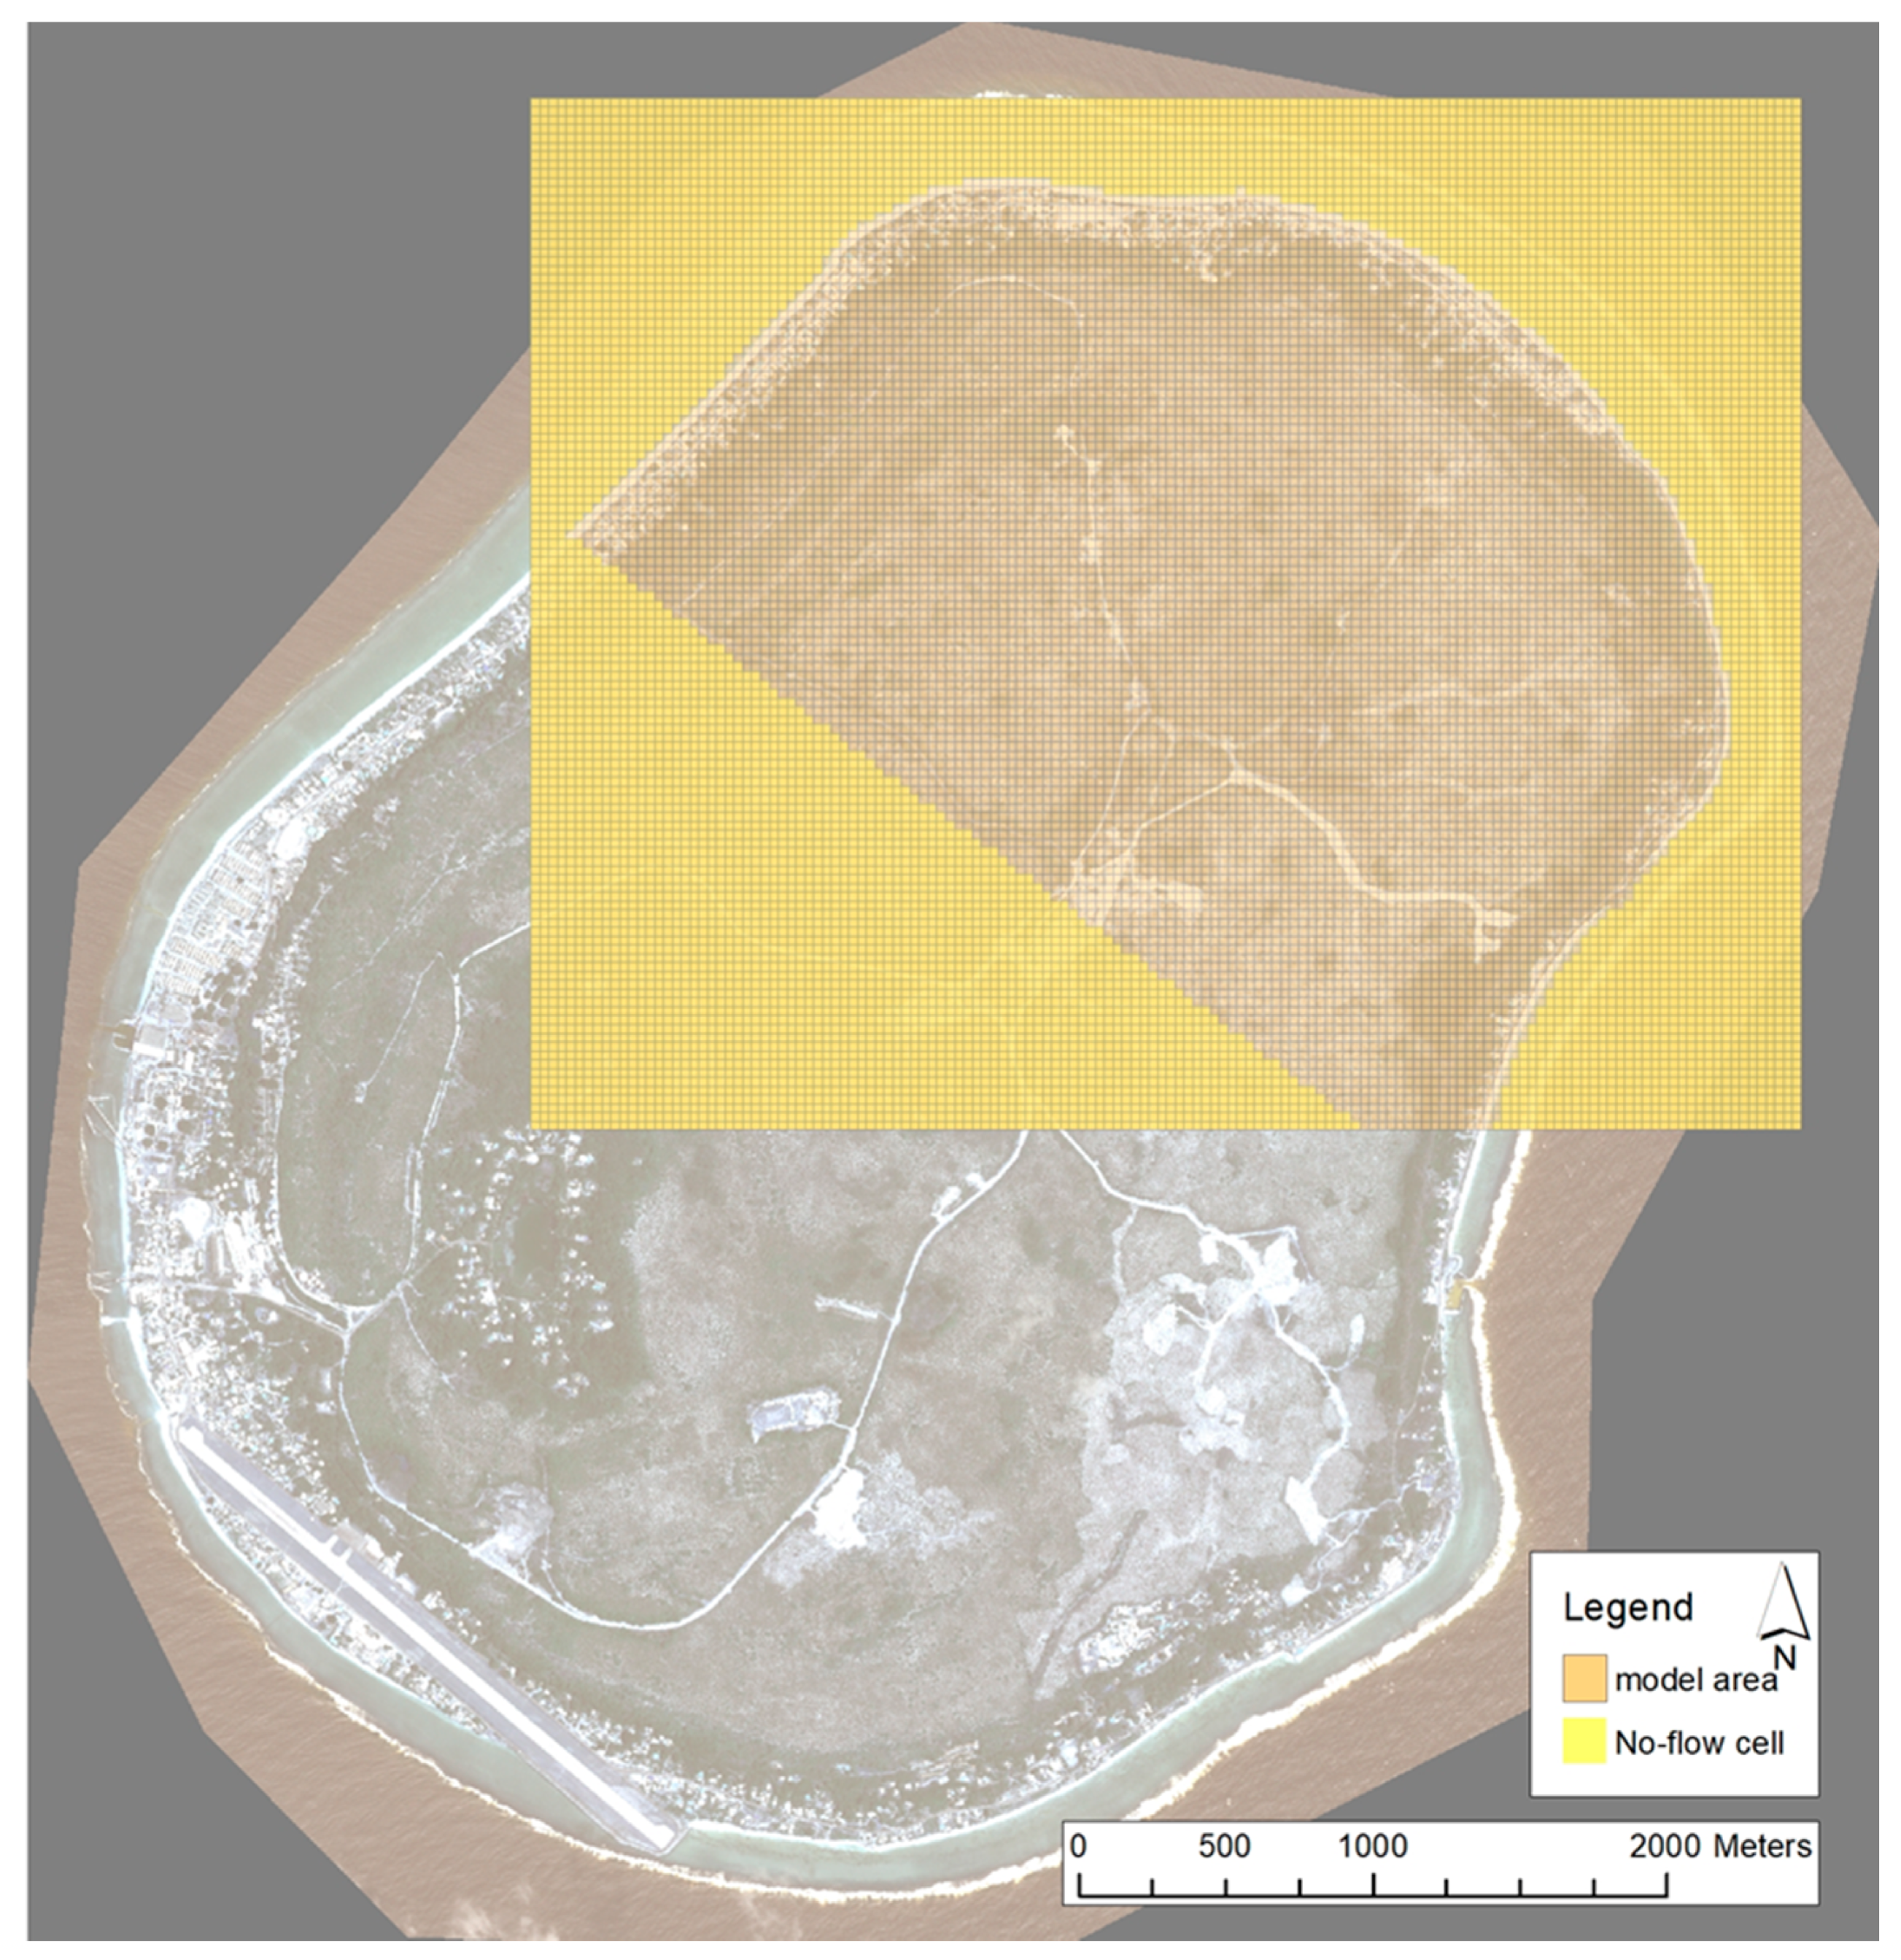
The 2D model discussed in detail by Alberti et al. [15] was used as the basis for the 3D numerical model. A great number of layers was needed to simulate the saltwater intrusion phenomenon. Since the freshwater occurs mostly in the northern zone, only the northern half of the island was modelled (Figure 4). The model was created using the MODFLOW-2000 and SEAWAT-2000 finite difference codes [47,48], by means of the graphical user interface Groundwater Vistas. SEAWAT-2000 is a previous release of the SEAWAT computer program for simulation of three-dimensional, variable-density, transient ground-water flow in porous media. SEAWAT-2000 was designed by combining a modified version of MODFLOW-2000 and MT3DMS into a single computer program. SEAWAT-2000 contains all the processes distributed with MODFLOW-2000 and also includes the variable-density flow process and the integrated MT3DMS transport process.
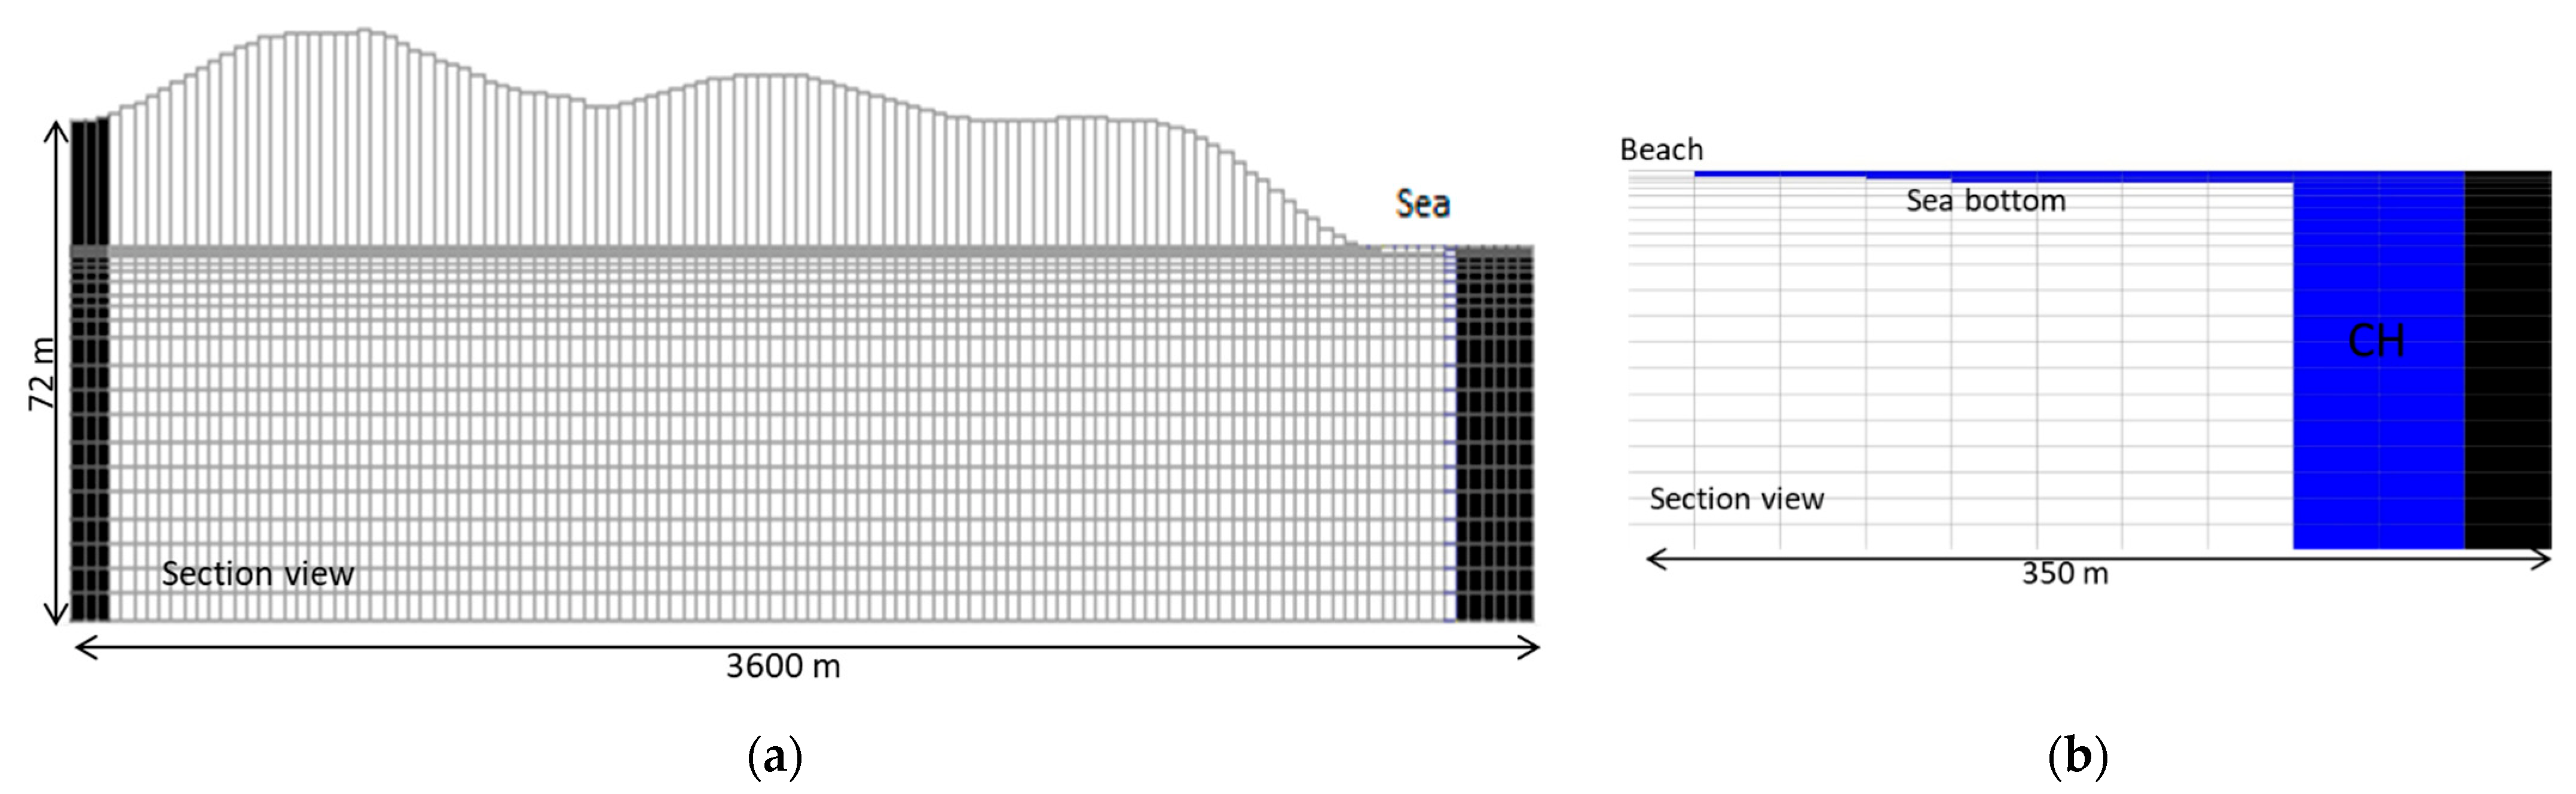
The model consisting of 117 rows and 144 columns has a uniform spacing of cells (30 × 30 m) that cover a model domain of about 15 km2 (Figure 4). No-flow boundary conditions were applied to the cells outside the area of interest (yellow cells in Figure 4), reducing to 9 km2 the model domain covered by active cells. Over the vertical direction, the domain was subdivided by 22 layers (north-south section in Figure 5a), for which thickness increases from the surface to the bottom, ranging from 0.5 m to 5 m. The choice to reproduce the shallow layers through a strong refinement is justified since the concentration data in monitoring wells showed greater changes in the upper part of the aquifer [15]. The bottom of the model is set at the −70 m depth related to the reference level (RL) in order to have a stable configuration of the saltwater wedge.
Similar to the 2D numerical model [15], constant head and concentration (Dirichlet) boundary conditions representing the sea were assigned in the cells surrounding the island considering the sea bottom slope from the coastal line to the reef. In order to reproduce the sea bottom slope, the first 7 layers were used assigning them the Dirichlet condition at an increasing depth (Figure 5b). Then, at the border of the model domain from the first layer to the deepest one, the same boundary conditions was assigned using the following values (Figure S2 in Supplementary Materials): a constant head of 1.59 m above RL (corresponding to average sea level [4]) and a concentration of 35.7 kg/m3 of total dissolved solids (TDS) [49].
The hydrogeological and physical parameters values (i.e., hydraulic conductivity, porosity, dispersivity, etc.) initially implemented in the 3D numerical model were the same values implemented in the 2D numerical model [15] and reported here (Table 2).
Before starting the calibration process, some of these values were changed considering the hydrogeological investigations result and the specific hydrological data for each year considered in the 3D simulation.
Concerning the hydraulic conductivity, the hydrogeological characterization and the 2D numerical model [15] highlighted (in many areas of the Bottomside) the presence of sand sediments covering the karstified limestone for a depth ranging from 1 to 15 m below the ground level depending on the direction of the oceanic currents. These sediments were probably originated because of the erosion operated by the atmospheric agents and the waves during the last phase of the island formation, when the sea level decreased, and the cliff was created. Based on 67 available stratigraphic logs, the subsoil setting was implemented into the numerical model through two different zones of hydraulic conductivity and dispersivity. To the first zone, representing the sandy sediment of the Bottomside (layers 1–12), were assigned low values of dispersivity and hydraulic conductivity (Figure S2) as in the 2D simulation [15] but decreasing in the latter (from 40 to 20 m/d) based on hydraulic tests average results (Table 1); to the second zone, representing the Topside and the deep limestone of the Bottomside, higher values of the two parameters (800 m/d and 50 m) were assigned, maintaining the same values used in the 2D simulation.
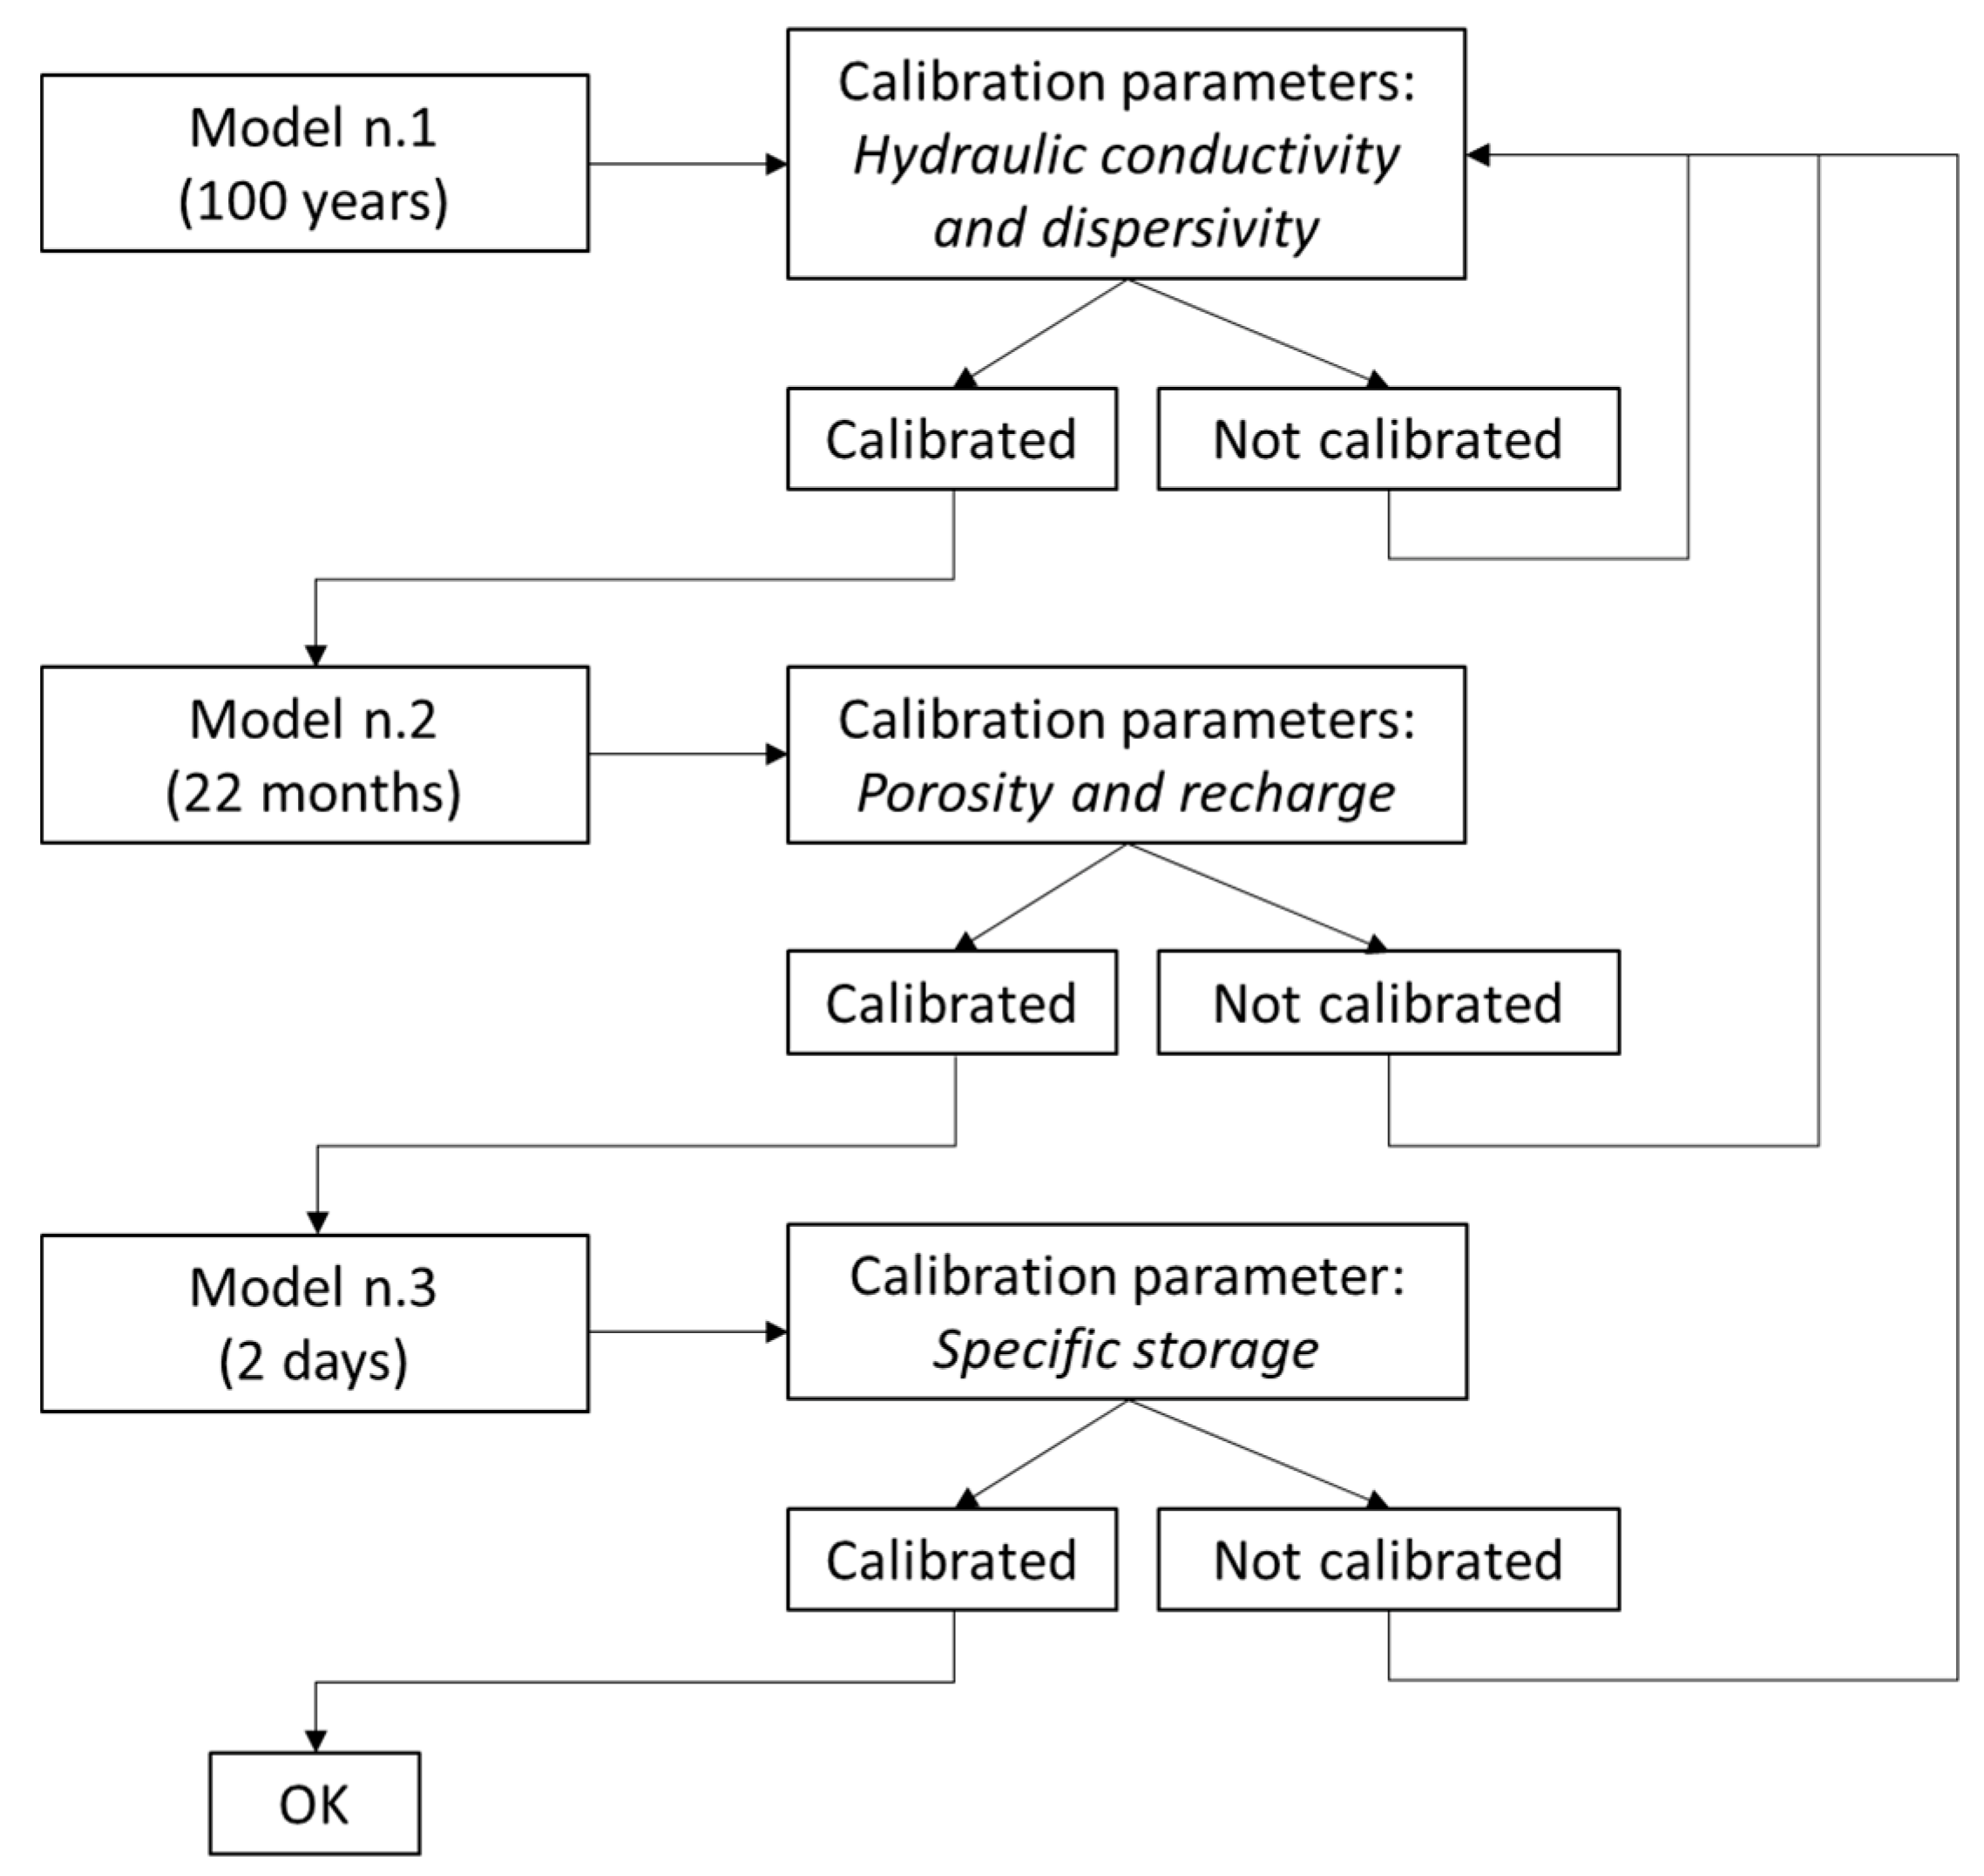
The parameters calibration of the density-dependent flow model was carried out through the simulation of 3 different transient conditions (Figure 6).
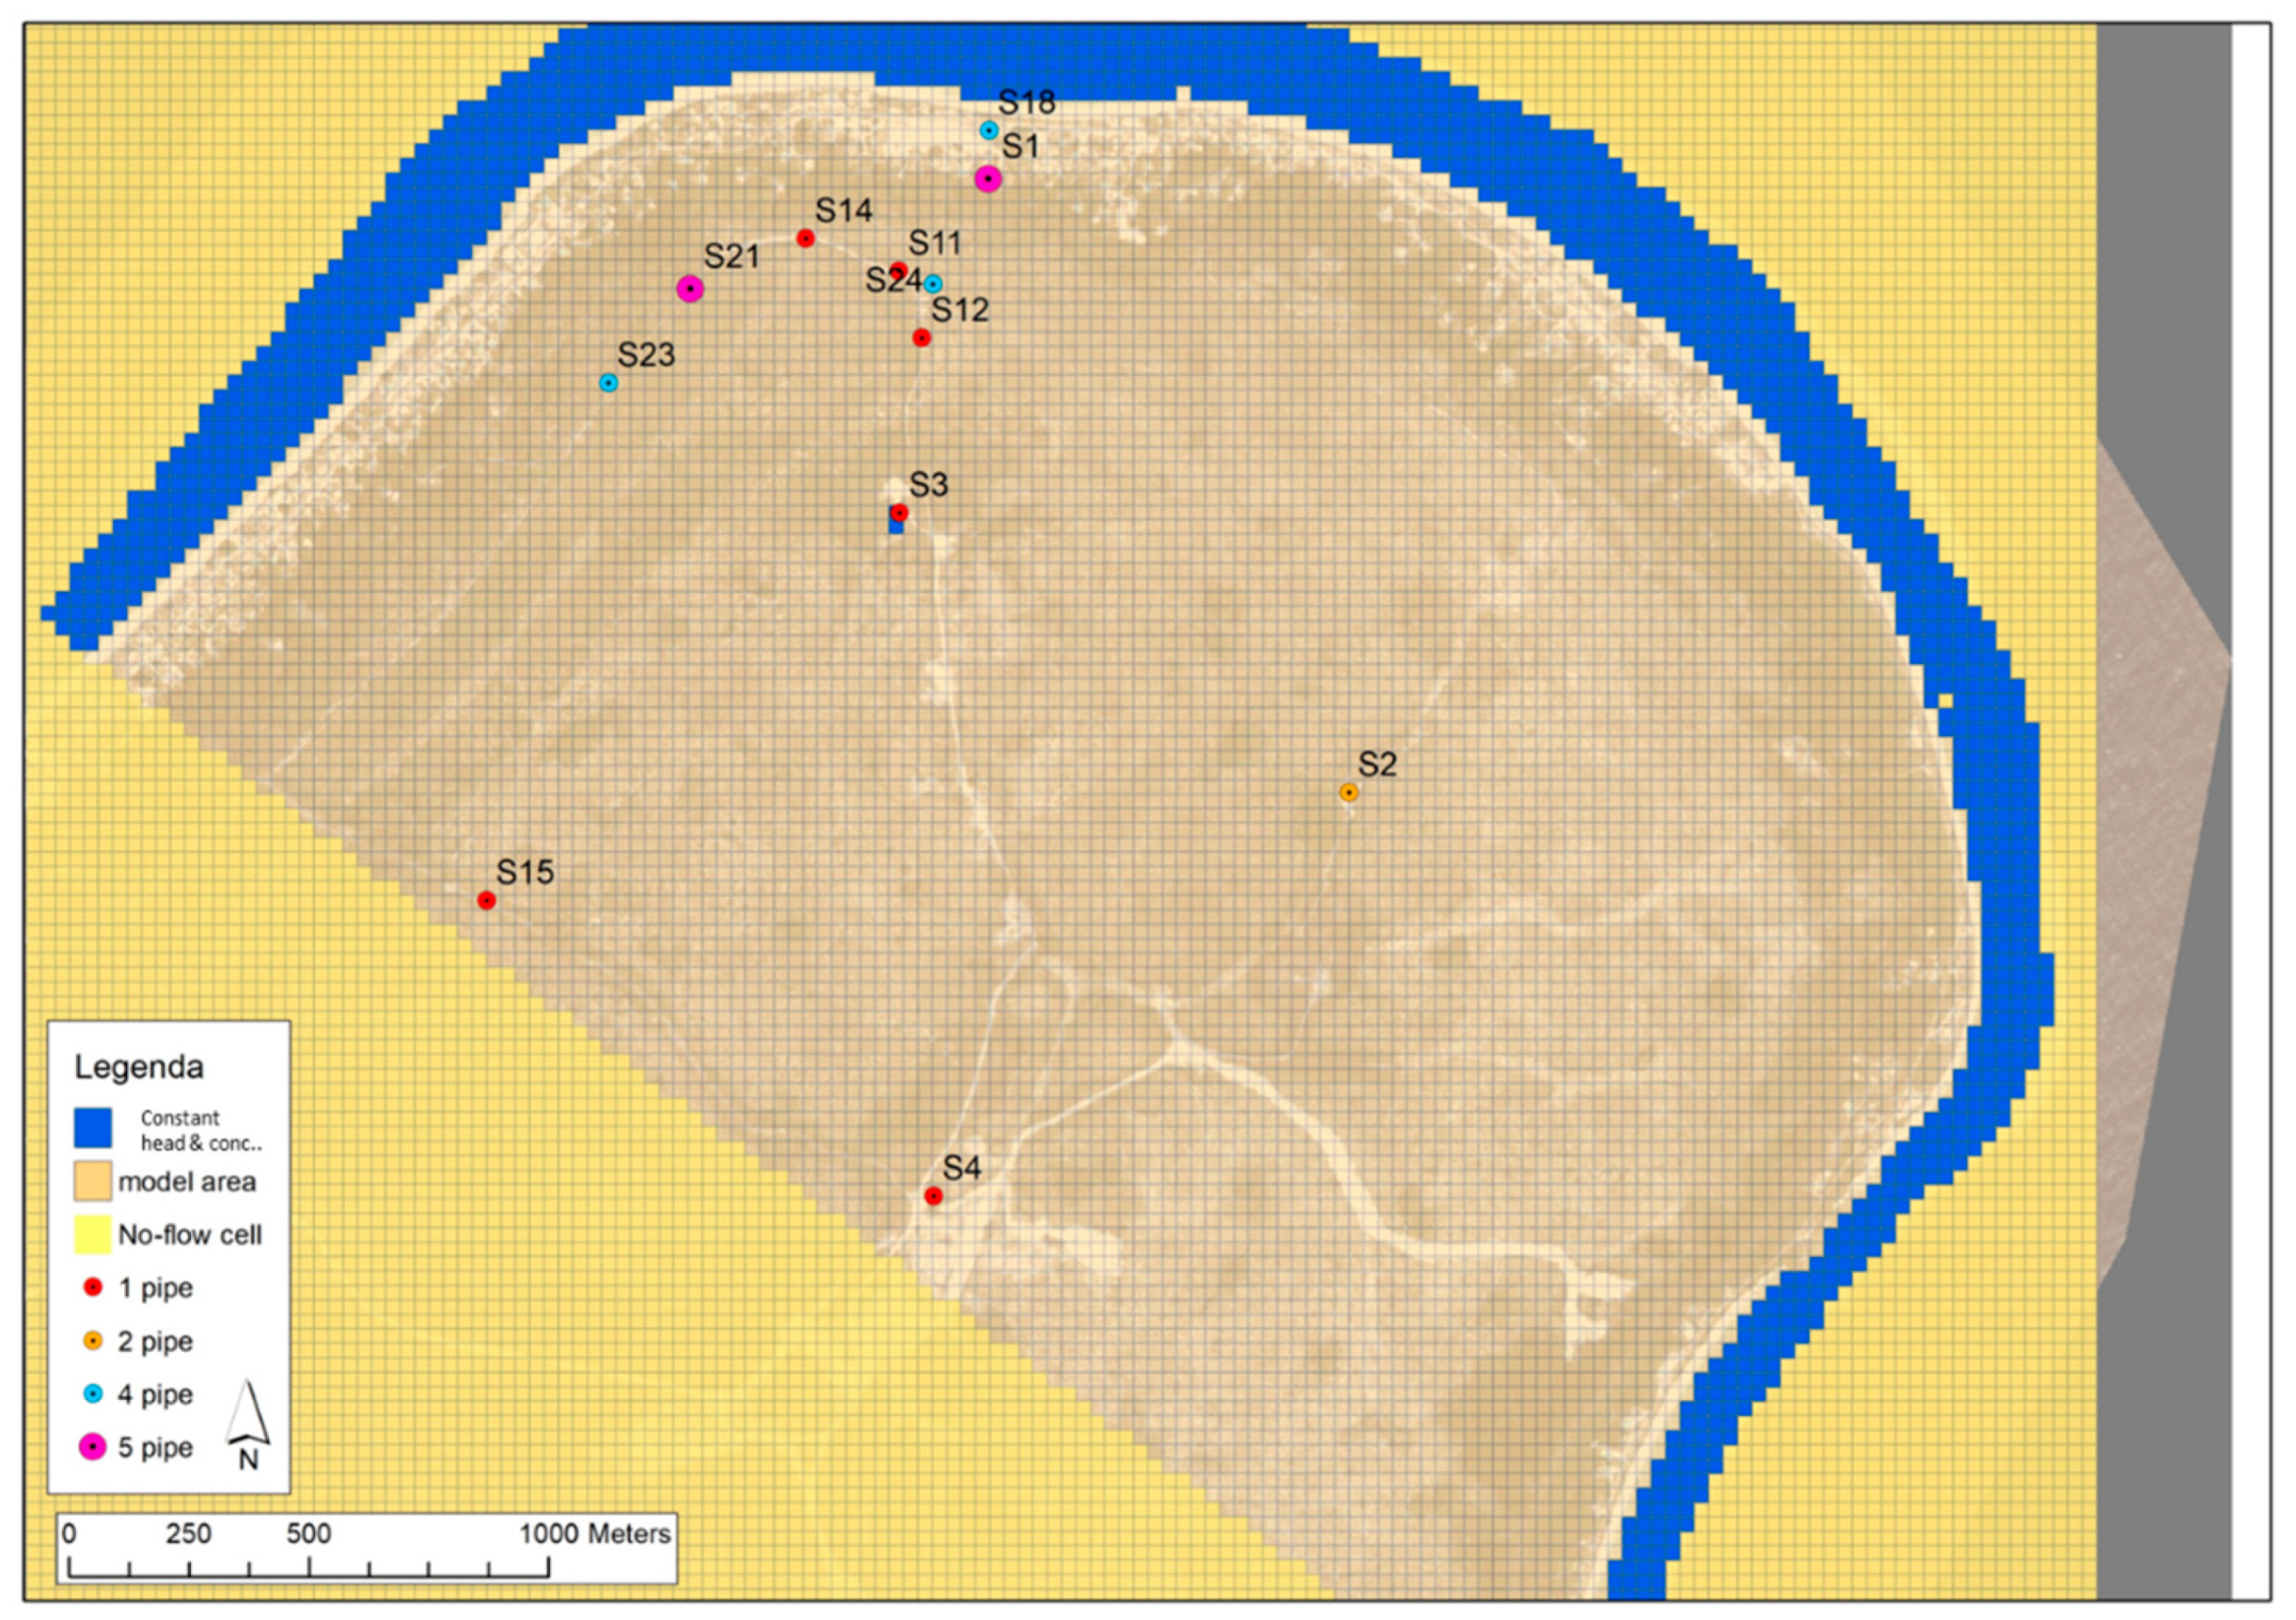
Clearly, for each simulation, the recharge value was updated considering the specific period of simulation. The calibration process followed a trial-and-error approach using 29 concentration and heads data collected at different depths in 12 monitoring wells shown in Figure 7. Among these monitoring wells, 5 are multipipe (S1, S2, S18, S21, and S23) and allow to detect the concentration at different aquifer depths.
The first phase (model n.1) provided a calibration of the hydraulic conductivity and dispersivity parameters for a quasi-steady state simulation: a long transient simulation (100 years) with the aim to recreate the heads and initial total dissolved solids (TDS) concentration distribution observed in the model area during the November 2009 survey (provided by CNR).
For model n.1, a recharge value slightly different from Ghassemi et al. [49] was used: 590 mm/year instead of 540 mm/year was calculated for the Topside (Thornthwaite method) considering the total precipitation (2000 mm) and temperatures measured by Nauru Government from December 2008 to November 2009. In the coastal zone, where the large part of the population lives, the value was increased by 11% (reaching 657 mm/year). This because Nauru’s villages are not equipped with sewer systems, and the habitants dispose the used freshwater into sinkholes, which directly leak in groundwater. This additional term of recharge is constituted both by the desalted water and the rainwater stored in the harvesting systems the houses are usually equipped with. The study carried out by Bouchet and Sinclair [41] highlighted that the population with access to a pumping well used averagely about 114 l/d/pc of water (Table 3). However, in Anetan and Ewa districts (the ones included in the model domain), only the 36% of the population has the access to a well. For the remaining habitants, an average water consumption of about 88 l/d/pc was estimated, supplied by domestic rainwater harvesting and the desalting plant.
Part of this water, disposed in leaking sinkholes, represents an additional recharge for the coastal aquifer system. From the data reported by SOPAC [41], 20 l/d/pc of water was considered for food purposes. Consequently, the remaining and 68 l/d/pc was evaluated to potentially infiltrate in the subsoil, respectively, for people with access to the well and without access. The additional recharge rate (91 m3/d) was assessed considering the number of inhabitants (i.e., 1180) of Ewa and Anetan and the percentage of people with/without well access. With the urbanised area in the model domain comprising about 300,000 m2, a maximum additional recharge of about 111 mm/year was assessed. During the calibration process, this value was considered as the upper limit because few houses discharge waste waters directly into the sea, and the rainwater collected through the harvesting systems is partially subtracted to the natural meteoric recharge. Finally, the calibrated value was 67 mm/year and was applied to the entire urbanized part of the Bottomside.
Once the numerical model n.1 satisfactorily reproduced the measured hydraulic heads and concentration distributions, a 22-month unsteady-state simulation (model n.2) was run to reproduce the TDS concentration variation and compare results with the TDS distribution measured through 6 characterization surveys carried out from December 2009 to September 2011 (Figure S3). The model was implemented using 22 stress periods with 10 time steps each and a multiplier of 1.2. The sea boundary condition was changed, assigning to each SP the head value corresponding the average sea level in each specific month, while the TDS concentration remained the same. The recharge was updated using rainfall and temperature daily collected by the Nauru Rehabilitation Company. Along the Bottomside, the same average additional recharge was maintained to consider house water infiltration. In this second phase, the calibration process mainly focused on storage parameters (Sy and Ss) to which the saline intrusion was shown to be more sensitive. Further, an update of the previously determined hydraulic conductivity was needed, and because of this, the transient model n.1 was run again.
Finally, the calibrated model resulting from the second step of the calibration (Figure S4) process was applied for a 2-day unsteady-state simulation (model n.3) with the aim to prove the model capacity in reproducing the tidal signal recorded during the 4–5 October 2011 survey [15]. In this case, there were no rainy events during groundwater and sea level collection; consequently, the adopted recharge was null except for the Bottomside, where only the additional recharge was maintained. Differently, as the sea level fluctuated during the simulation, the head of the boundary condition representing the sea was changed using a time variant constant head (Figure S5). Hence, hourly stress periods were adopted (total 48 SP) with 5 time steps each and a multiplier of 1.2. The boundary concentration was maintained 35.7 kg/m3. In this modelling phase, the calibration process mainly focused on specific yield values; nevertheless, some small changes of the previously determined parameters were needed, and this meant to modify transient model n.2 to match again the salinity distribution in the aquifer.
At the end of the calibration process achieved through the 3 models, the hydrogeological parameters adopted are reported in Table 4.
3. Results
The assessment of the freshwater thickness was completed through two steps. Initially, thanks the characterization activities (hydrogeological and geophysical surveys) focused on the northern side of Nauru, the freshwater volume present under the Capelle area was estimated.
Then, by means of the calibrated model, the freshwater thickness in a more extended area surrounding the Capelle area (i.e., Ewa and Anetan districts) and in general in the northern side of the island was evaluated.
3.1. Freshwater Thikness in Capelle Area
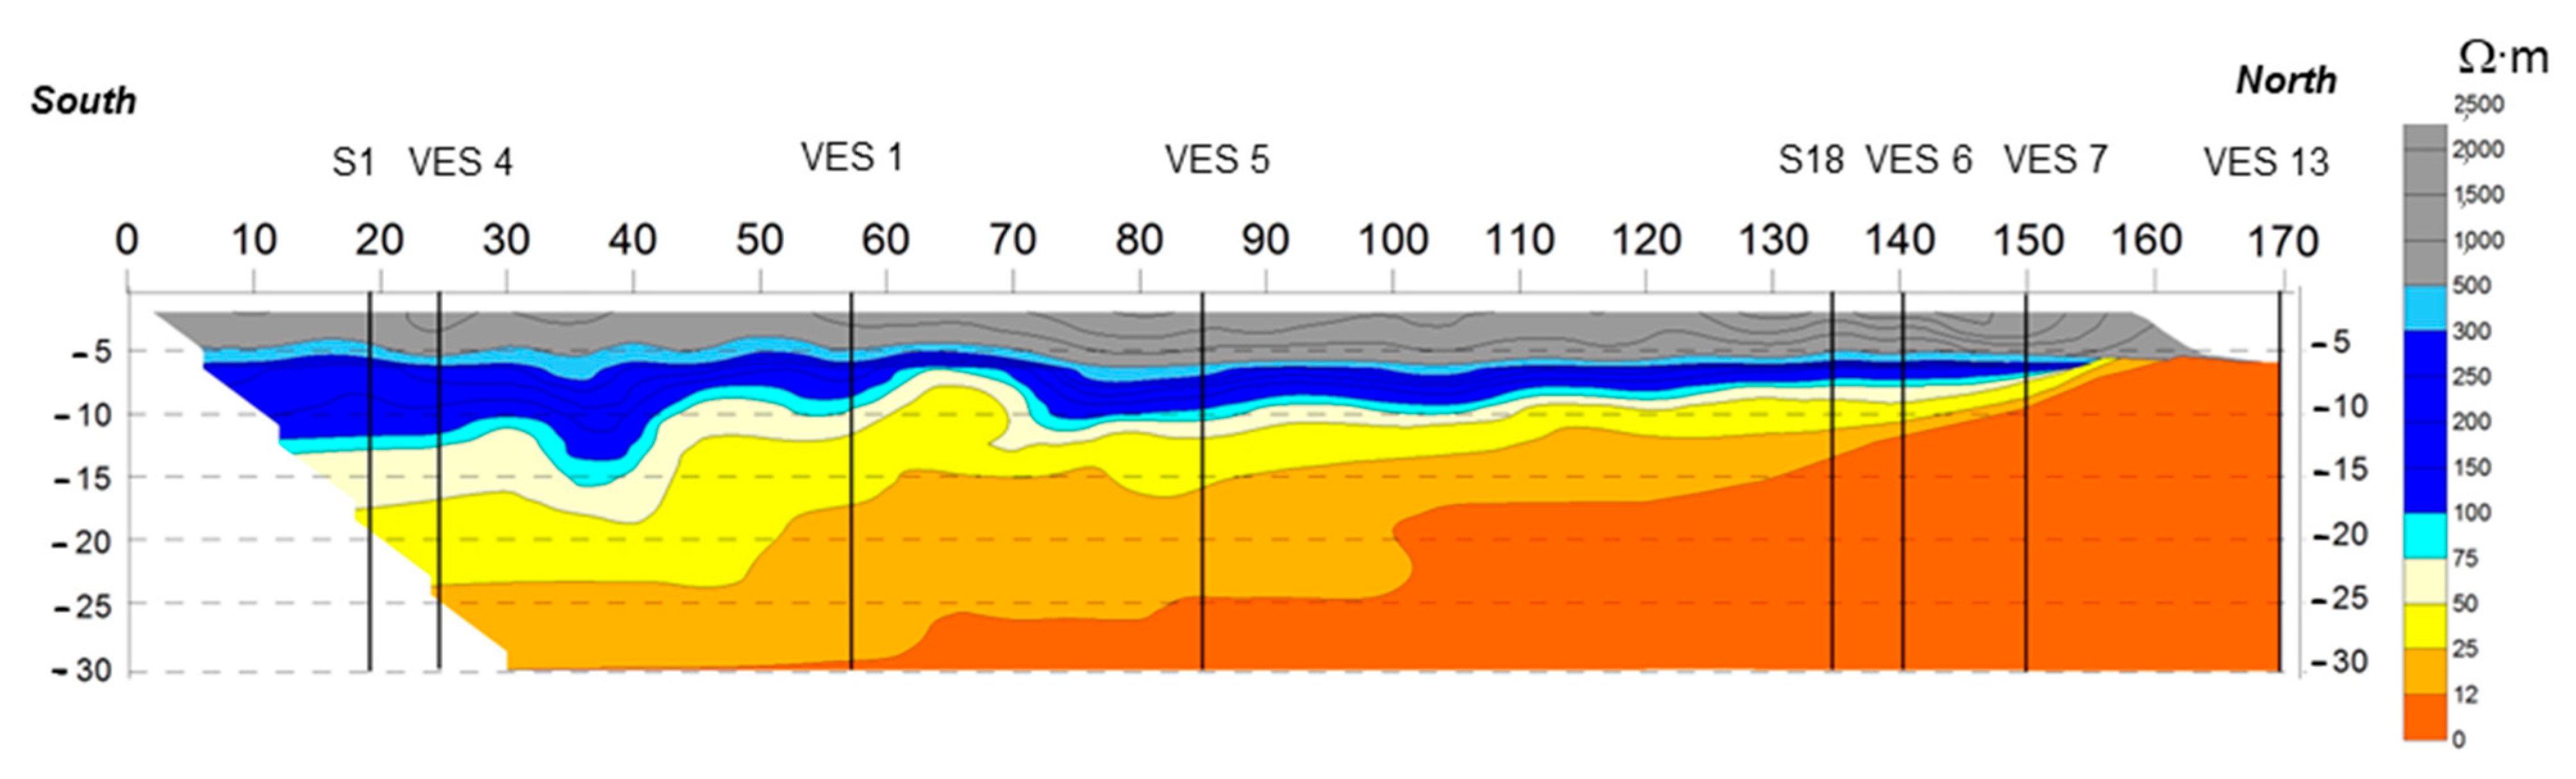
The analysis of the collected data (VES, ERT, and hydrogeological data) allowed to evaluate the thickness and extension of the freshwater lens present in the Capelle area. Ten VESs and eight ERTs (Figure 8) were performed in this zone and compared with the collected hydrogeological data (EC and wells stratigraphic logs). The result of this analysis showed a constant freshwater thickness from west to east, whereas it lessened northward because of the presence of the saltwater edge. For instance, ERT 7 (Figure 9) indicates fresh-brackish transition) showed the thickness decrease of freshwater moving from the cliff toward the sea: from south to north, the thickness reduced from an average value of 6 m to 0 m. The west-east ERT (N° 5, 6, and 8) showed a more constant thickness of freshwater (Figures S6 and S7), for which the average values range from 1–2 m in the western part to 5 m on the eastern side close to the cliff, where it seems to deepen. The maximum thickness (12 m) was detected near well S1 (ERT N° 1, 2, 7 and VES 3, 4).
From the ERT, it also resulted that the wells used by the population in this area do not substantially affect the freshwater distribution in the subsoil: the electrical data do not show up-coning phenomena related to wells activity. Unfortunately, the four VES performed on the Topside did not result as useful for this analysis because the thickness of the unsaturated aquifer (about 30 m) and the limestone resistivity value (30,000 Ω∙m) were too high for the instruments used for the survey.
Finally, the combined analysis of VES, ERT, and hydrogeological data collected in monitoring wells allowed to determine the volume of freshwater in subsoil. The scarp was chosen as southern limit (given that the VESs on the Topside are not usable), and the coastline was defined as the northern limit. Based on the EC values detected in the monitoring wells, for the geoelectric investigations, a resistivity value of 75 Ω∙m was considered as the fresh-brackish water transition.
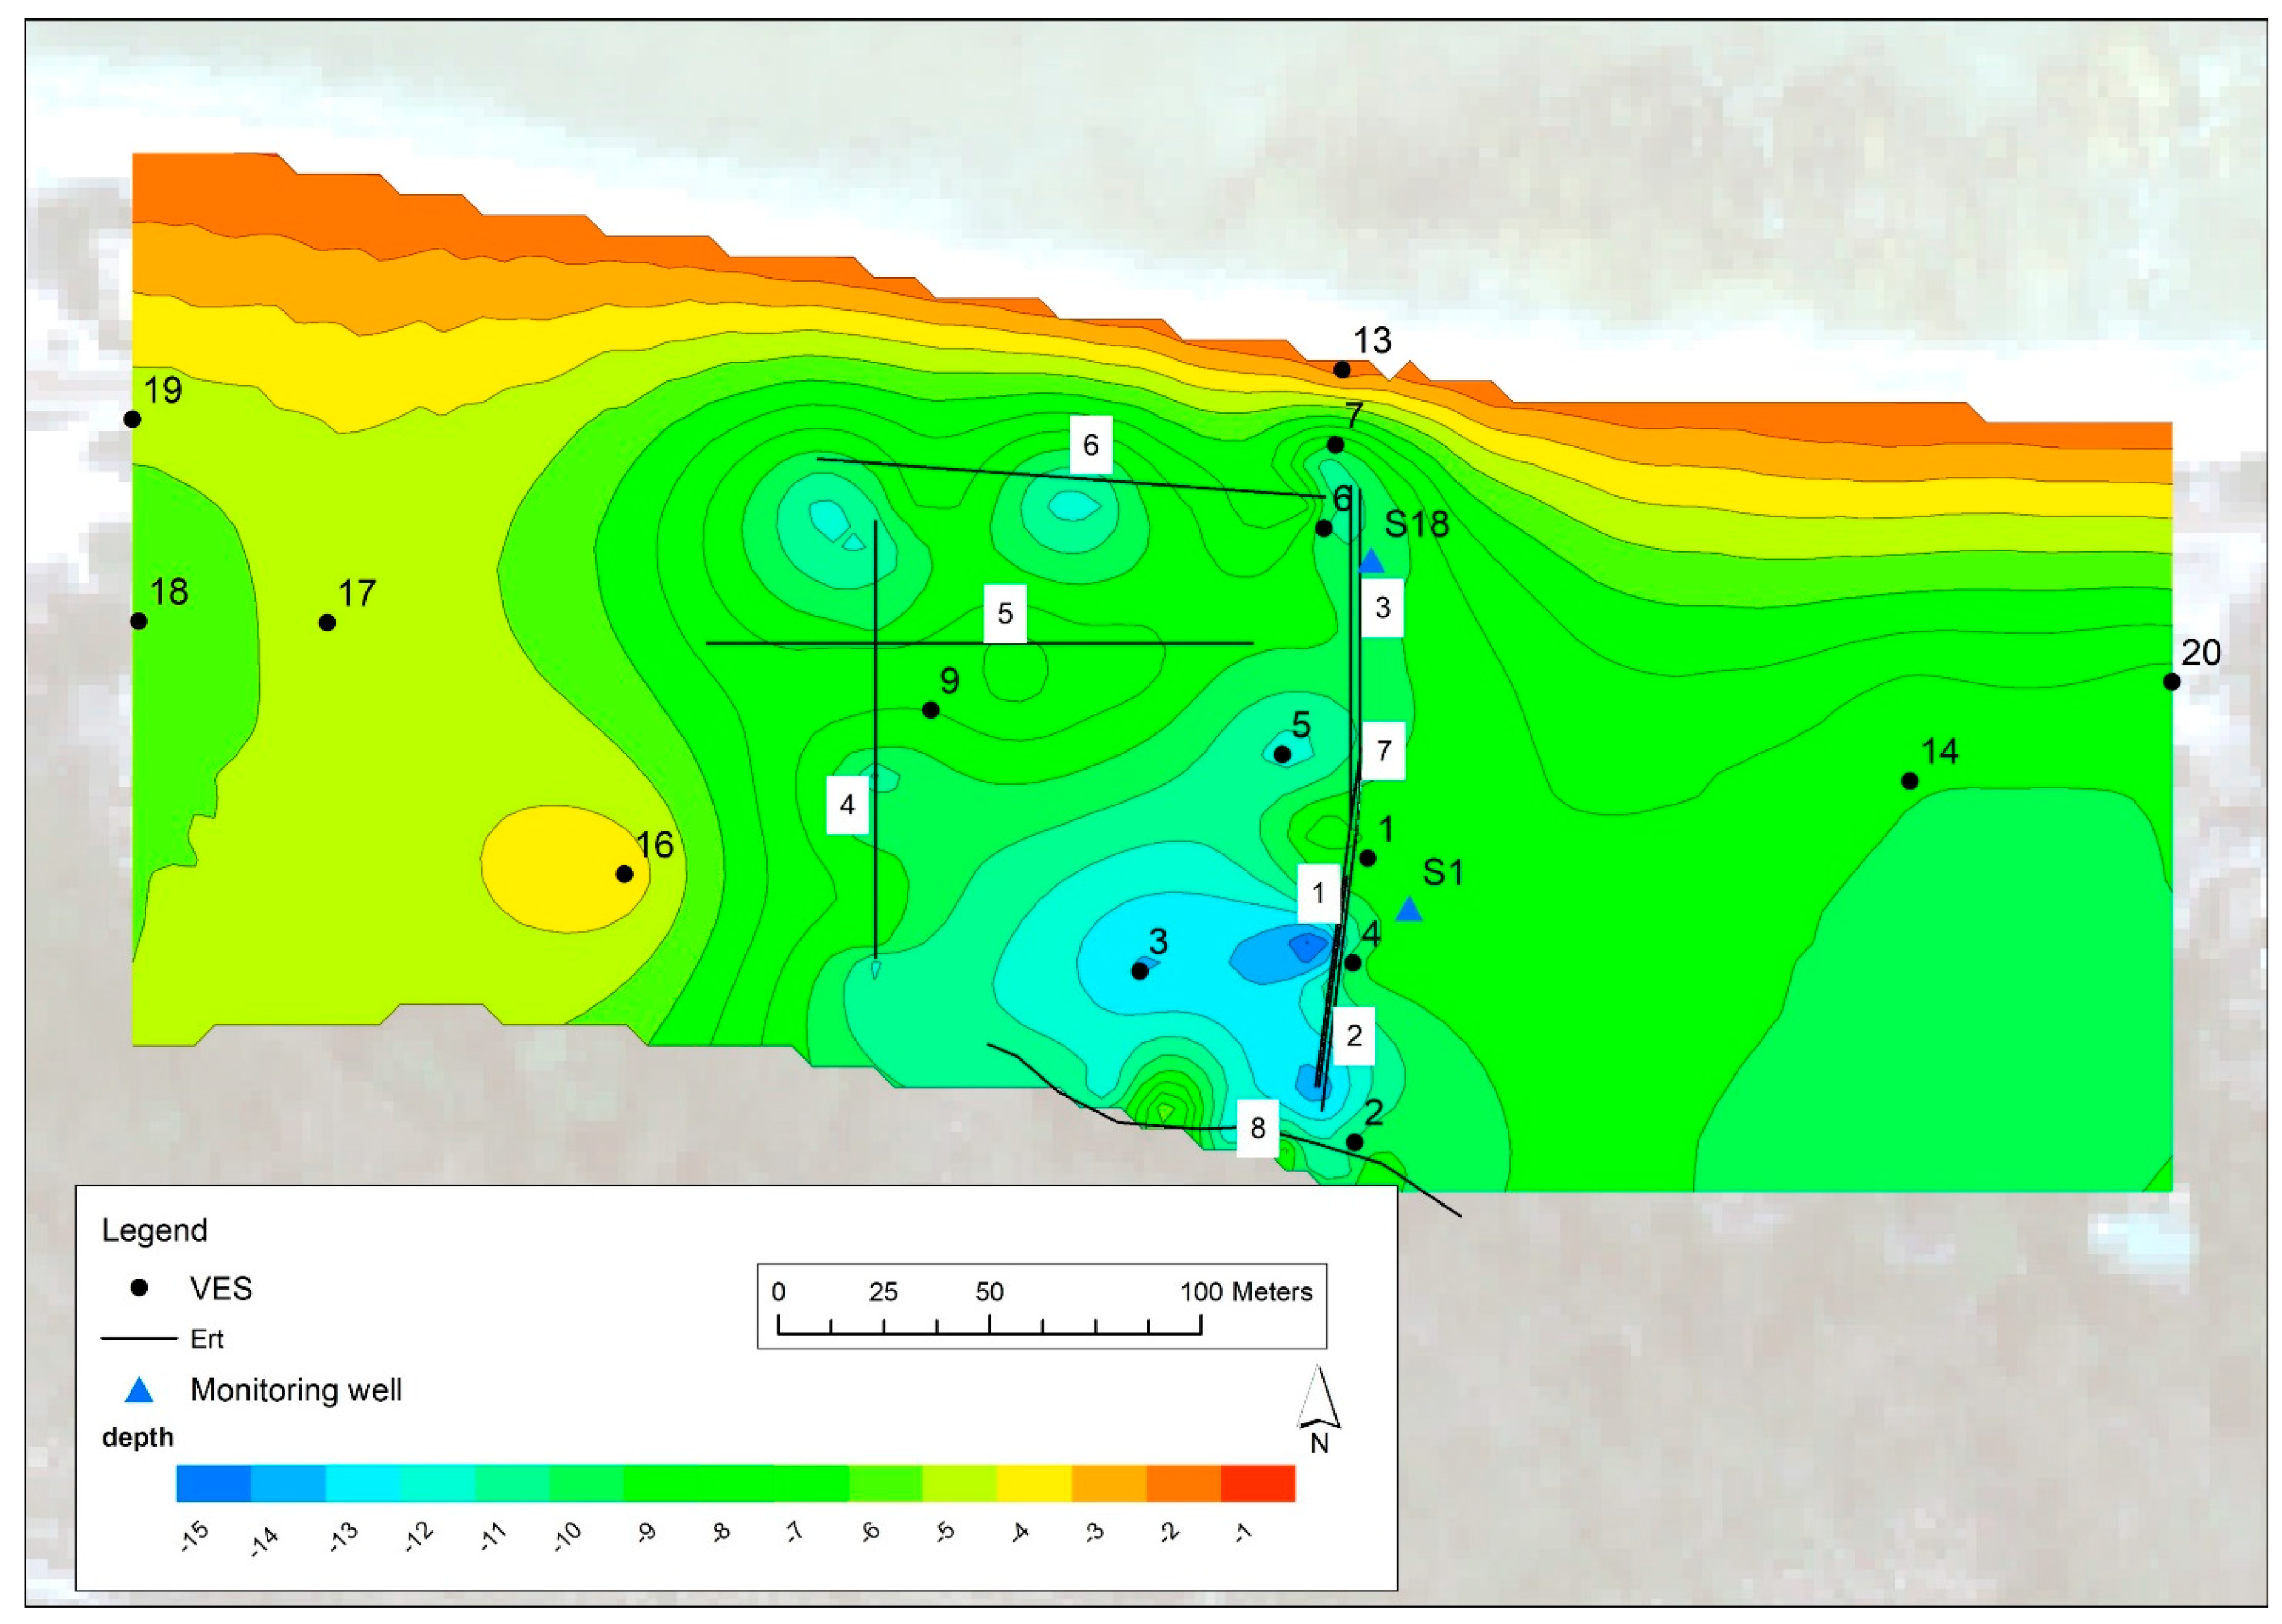
Figure 9 shows the freshwater bottom in the Capelle area. The depth where this surface lays is significantly reduced moving westward (VES 17-18-19), while it reaches the maximum depth close to VES 3 and 4. Moving eastwards, the freshwater thickness increases (Figure S7), but the available data did not allow to identify if and where the freshwater lens pinchouts.
For the evaluation of freshwater volume in the area, the hydraulic head measured in multipipe monitoring well S1 and S18 (the only one where the tube elevation was known) was used. Through the difference between the piezometric surface and the bottom of freshwater, a lens volume equal to 300,000 m3 was evaluated: it led to a value of 45,000 m3 of freshwater considering an effective porosity of 15%.
3.2. Numerical Model Results
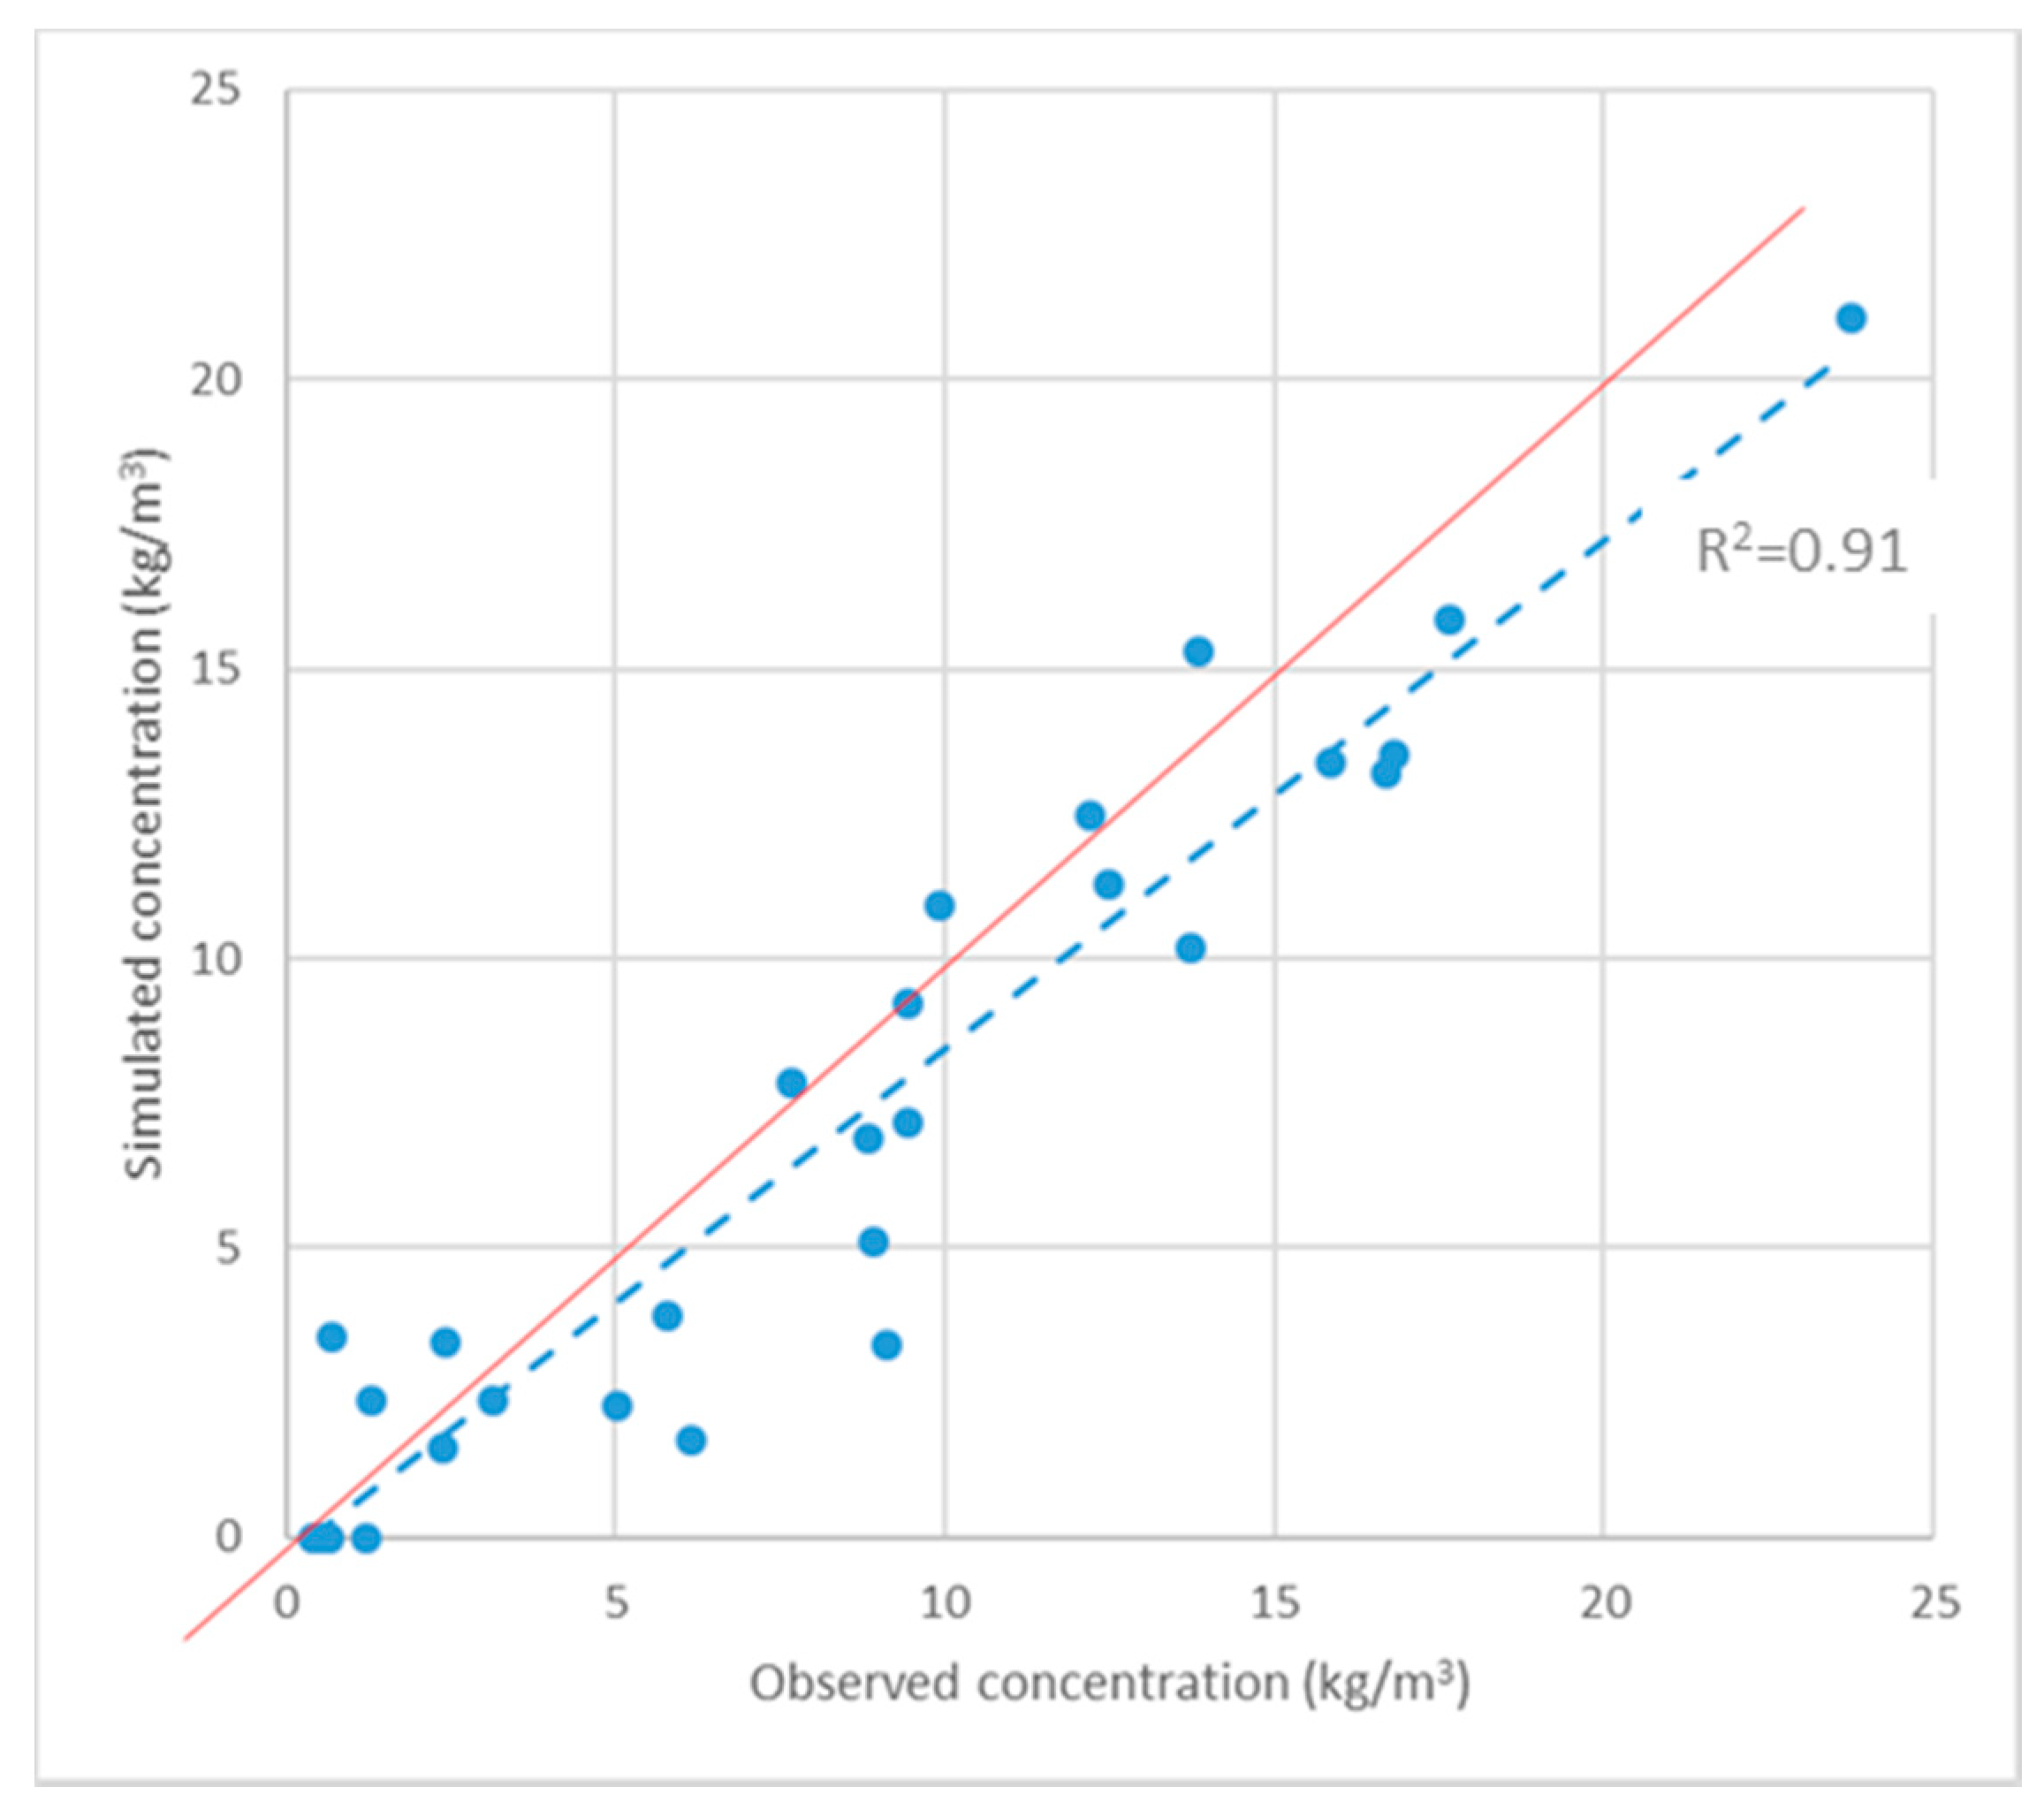
Figure 10 and Figure 11 and Table 5 report concentration results for model n.1 (Figure S8): the simulated concentration values are similar to the measured ones during the survey of November 2009, with an absolute concentration mean of residuals equal to 1.87 kg/m3, corresponding to a 5% error (i.e., standardized RMSE).
The observed vs. simulated graph (Figure 11) shows a good alignment of the points on the 45° line with a slight tendency to underestimate the concentrations and a R2 coefficient of 0.90 for the trend line (Figure 11). The 3D saltwater distribution simulated by the calibrated model is shown in Figure S9, where along the coast, a freshwater lens (deep blue colour) is almost present everywhere. This lens in the Capelle area (Figure S9b) reaches an average thickness of 6 m, confirming the results of EC and geophysical investigations. Importing the model results in the Leapfrog software, a fresh groundwater volume stored in November 2009 under the Capelle area was approximately evaluated equal to 120,500 m3.
While the model n.1 results represent an instantaneous picture (November 2009) of the saltwater concentrations, the model n.2 allowed to understand how the concentrations change over the time under different recharge patters. The results confirmed the hints presented in the previous work [15]: they demonstrated that the freshwater can also be stored on Topside during wet periods, but it suddenly disappears (Figure S10). This is because it mixes with deeper salt waters and at the same time rapidly flows towards the ocean by means of the high hydraulic conductivity of the limestone. Consequently, a few months after the rainy period, the groundwater on the Topside becomes salty with concentrations greater than 6 g/L from a depth greater than 2 m from the water table (Figure S11 in Supplementary Materials, S23pipe2). Differently, the freshwater remains stored in a strip located almost all along the entire coastline (Figure S11, S1pipe3). Along the coast of the Anibare district (eastern coast), the lens is narrower and sometime almost disappears because of the reduced width and thickness of the sand deposits (Figure S10). Only between the Anetan and Anabar districts is the lens completely absent due to the presence of a limestone outcrop that did not allow the deposition of sand.
The ability of the model in simulating the Nauru’s groundwater system and the saltwater intrusion behaviour is also demonstrated by the results of model n.3. In Figure S12, at the Topside and Bottomside monitoring wells, the comparison between measured and simulated groundwater levels during a two-day transient simulation is shown. The tide influence is evident, with a faster and higher groundwater heads variation on Bottomside and a slower and more contained one on Topside. The model, on both sides, is able to correctly simulate the groundwater levels variation (i.e., efficiency of the tide) and the tidal lag [15].
4. Discussion
In Nauru, there are three main water supply sources: (1) groundwater, which supplies the not-potable water needs for the population having access to a well (about the 36% of the total population); (2) rainwater harvesting in tanks placed on house roofs, which furnish the population with water used for potable and not-potable purposes; and (3) desalination, which provides high-quality drinking water. Past experiences in Nauru demonstrated that the current supply of drinking water is not able to meet the population needs when extended droughts periods overlap with RO plant failures or power shortage. Due to the island’s economic fragility, economic crises are frequent, and during these events, the government cannot adequately maintain the RO plant or buy the necessary fuel for its operation. In the past, such issues caused frequent water scarcity (e.g., in the period 2000–2010), considerably increasing the reliance on groundwater for the water supply. From this comes the need to properly assess the fresh groundwater resource on the island in order to increase Nauru’s resilience to climate change effects.
The results of previous investigation [15] highlighted in the Nauru aquifer the existence of freshwater lenses stored close to the coastline that can be exploited sustainably. The present study demonstrates that it is possible to quantify the freshwater stored underground by properly combining hydrogeological investigations and density-dependent numerical modelling. A general hydrogeological characterization of the island [15] and a more detailed investigation in a smaller area, by means of geophysical and EC survey, allowed to properly calibrate the numerical model in quasi-steady-state conditions (model n.1) and in unsteady-state conditions (model n.2 and n.3). This led to obtain a general evaluation of groundwater resources for the northern part of Nauru and a good assessment of the freshwater stored in the Capelle area.
The fresh groundwater present in the subsoil of Capelle was assessed by means of the model n.2 to range between 190,000 and 88,300 m3, respectively, in April 2010 (SP5) and April 2011 (SP17), corresponding to the end of a rainy period and of a dry period (Figure S13). At the end of the simulation (SP22), after few rainy months (1086 mm in 6 months), the volume was the same (83,400 m3). The assessment is in compliance with the geophysical investigations results that provided 45,000 m3 in April 2013 after a relative dry period (885 mm in the previous 6 months). The difference is linked to three aspects: (a) before April 2013, the rain was 20% less; (b) the model is unable to simulate the reduced thickness west of Capelle probably due to some pumping well where the pumping rate is unknown; and (c) as shown above, the model is inclined to underestimate the salt concentrations.
Nevertheless, these results demonstrate that the model is an appropriate tool to obtain a good first assessment of the fresh groundwater resource in Nauru, but once the suitable areas are individuated, a detailed hydrogeological investigation is always necessary to improve the model simulation capacity and to correctly design the water abstraction system.
In addition to the estimation achieved for Capelle, an assessment for the remaining of the Bottomside and for the Topside represented in the model can be evaluated. The total fresh groundwater stored along the Bottomside from April 2010 to September 2011 changed between 1,208,100 and 510,390 m3, with a decrease of about 58% during a drought period of 1.5 years. This result is similar to the Capelle area, where the decrease was 56%. Differently, in the same period, on the Topside, the decrease was about 99%, with a variation from 5,040,500 to 570 m3, confirming the complete disappearance of freshwater in 18 months.
The amount of fresh groundwater present under the Capelle area could be sustainably exploited to redistribute the water resource to satisfy the population demand in the surrounding Anetan and Ewa districts and/or reduce the RO plants operation. From the SOPAC report [41], the water usage estimated in Nauru for the population having access to a private well (about the 36% of the total population) ranges from 88 l/d/pc to 141 l/d/pc (Table 3). Actually, groundwater supplies not-potable water needs, whereas the RO plant and domestic rainwater harvesting provide the needed amount of drinking water (estimated volume equal to 20 l/d/pc in Table 3). The inhabitants of the Ewa and Anetan districts are approximately 1180 (i.e., 12% of the population of the entire island). Keeping a conservative point of view, it is possible to assume an amount of 45,000 m3 for the fresh groundwater lens present in Capelle area and to hypothesize it to entirely satisfy the Ewa and Anetan water demand. Assuming a groundwater consumption pro-capita equal to 68 or 121 l/d, the calculations estimated, respectively, the depletion time of the groundwater resource in approximately 1.5 or 1 years in case of complete absence of rainfall for that period. Differently, considering a low-recharge period and a volume of 83,000 m3, the maximum depletion time would, respectively, increase up to 1.6 and 2.8 years.
The reported example is a simple calculation with the aim to show that even if a strong groundwater abstraction is unsustainable in a long-term perspective, the groundwater lenses stored along the Bottomside can play an important role in the case of emergency. However, in greater generality, groundwater should be considered among the available water resources in Nauru in order to implement a new water management system able to increase the island’s resilience to climate change effects.
However, the water derived from the freshwater lenses has lower quality than the desalted water or the rainwater because of the leakage from domestic sewage pits into the subsoil and of the salt concentration increase, therefore potentially leading to the worsening of health and environmental issues. For this reason, alternative strategies for a possible sustainable use of fresh groundwater must be accompanied by sewage infrastructure design, monitoring activities [50], and wellhead protection area definition.
Furthermore, fresh groundwater usage in a coastal area is a difficult issue, and an accurate infrastructure design is needed to avoid the worsening of groundwater due to the saltwater intrusion phenomenon. Because of their small extension and low elevation above the sea level, the oceanic atolls are particularly vulnerable to saltwater intrusion, which can be worsened in the future by the expected sea level rise due to the climate change. Groundwater exploitation in small limestone atoll islands occurs generally through hand-dug wells, which are about 1 m deeper than the groundwater level. This kind of wells is used just for domestic purposes and usually has very modest pumping rates [6]. On the other side, the groundwater extraction using vertical pumping wells in small islands could lead to saltwater up-coning, causing the deterioration of groundwater quality. Therefore, alternative infrastructures such as scavenger wells or infiltration galleries need to be developed in such fragile environments, and density-dependent modelling represents a useful tool for their design.
5. Conclusions and Future Perspectives
In small islands, groundwater can represent an important resource of freshwater. However, fresh groundwater should not be exploited without a proper management, especially in those systems where aquifer vulnerability is high, such as small islands’ aquifers, consisting of shallow and thin groundwater lenses. In these contexts, uncontrolled saltwater intrusion phenomena and the depletion of the groundwater lenses due to a potential overexploitation of the resource necessitate a proper water management supported by monitoring activities, a detailed study of the aquifer system behaviour, and an accurate estimation of groundwater availability. In the present study, these objectives were fulfilled through hydrogeological/geophysical investigations and numerical modelling.
Nauru is a very small island located in the Pacific Ocean, and the single use of groundwater as freshwater supply is not adequate to satisfy the population demand. The Nauru Water Plan suggested an integration of groundwater with other water sources: currently, rainwater and desalted water in Nauru are used to satisfy the drinkable water demand, whereas the groundwater is mainly used for non-potable purposes because it is often contaminated. Improving the use of this last resource is essential for Nauru island to guarantee future water security even during drought occurrences or in case of desalination plant failure.
Previous studies investigated the groundwater system in the island, also considering possible future issues such as climatic variations, potential sea level risings, and the increase of extreme climate conditions. Nevertheless, a thorough understanding of the hydrogeological system behaviour and the definition of groundwater availability in Nauru was still required. This study confirms the conceptual model proposed by Alberti L. et al. [15]: fresh groundwater lenses are hosted into the sandy sediments of the coastal zone close to the seashore, which is a result in contrast with the previous studies that had identified freshwater lenses in the limestone, forming the internal part of the island. This conceptual site model has been verified through three unsteady-state, 3D, density-dependent numerical models, which allowed to understand the system behaviour: low hydraulic conductivity of sand makes the flow of groundwater slow down toward the sea, thus allowing freshwater storage where salt water is expected to penetrate more easily. Furthermore, the collected data and model results confirmed the resilience of those lenses in drought conditions.
In particular this study pointed out the presence, in the Bottomside of the northern part of the island, of a fresh groundwater lens that could potentially represent a sustainable solution in meeting the Nauru population’s water demand. The hydrogeological investigations allowed the assessment of the freshwater volume stored in this part of the island, and this led to suggest some possible use of this resource. The unsteady-state, 3D, density-dependent model represents a useful tool available to assess the possible sustainable fresh groundwater exploitation to prevent saltwater up-coning occurrences. The implemented model has the capability to provide key information regarding the design and optimization of new suitable groundwater abstraction systems, also assessing their impacts on fresh groundwater availability and quality under different climate conditions. This ability allows to perform an optimal design of the infrastructures by considering several parameters (i.e., number, position, depth, and pumping rates) and supporting public decision makers to set up actions and plans to fulfil the goal of a sustainable groundwater management.
Future research developments should mainly concern two aspects: (a) the extension of the survey and modelling activities to the southern part of Nauru to reach a full assessment of freshwater resources in the island and (b) the extension of a similar survey approach to other smaller islands to find confirmation that even in different hydrogeological conditions, freshwater can accumulate not only in the centre of the islands but in areas where the hydrogeological properties promote a slow groundwater flow and a reduced saltwater mixing process.
Supplementary Materials
The following are available online at https://www.mdpi.com/article/10.3390/w14203201/s1, Figure S1: Hydrogeological section profile of Nauru island, Figure S2: Plan and 3D representation of the hydraulic conductivity distribution in the numerical model, Figure S3: Recharge values (m/d) adopted in the model n.2 for each monthly Stress Period and the 6 monitoring campaigns (red lines), Figure S4: Measured hydraulic heads compared with simulated hydraulic heads after calibration process, Figure S5: Sea levels (RL) attributed at the boundary condition for the model n.3 in order to reproduce the sea level variations, Figure S6: 3D representation of resistivity values detected trough geoelectrical investigations at Capelle area, Figure S7: Freshwater thickness distribution in Capelle area considering 75 m as separation limit between fresh and brackish water, Figure S8: Observed concentration values compared with simulated ones, Figure S9: Model n.1, 3D representation of salt concentrations in groundwater in November 2009 (a) in the model domain and (b) along a cross section passing through Capelle area, Figure S10: Model n.2, 3D concentration representation (g/l for unsteady-state simulation run from December 2009 (SP1) to September 2011 (SP22), Figure S11: Model n.2, simulated versus observed concentrations from December 2009 to September 2011 in (a) S1 and (b) S23 monitoring wells/respectively Bottomside and Topside, Figure S12: Observed and simulated groundwater levels (RL) resulting from the 2 days simulations in monitoring wells S1 (a) and S3 (b), Figure S13: Representation through Leapfrog of the model n.2 unsteady state results, in blue the fresh groundwater body along the Bottomside and in green under the Topside; the view is from the bottom of the model and 1.5 Kg/m3 is the represented concentration surface that shows the shrinking of the fresh groundwater in 1.5 years.
Author Contributions
Conceptualization, L.A.; methodology, G.O.; software M.A. and G.O.; validation, I.L.L. and G.O.; investigation, L.A. and G.O.; data curation, M.A. and I.L; writing—original draft preparation, I.L.L., P.M. and G.O.; writing—review and editing, L.A. and M.A.; visualization, M.A. and P.M.; supervision, M.A.; project administration, L.A.; funding acquisition, L.A. All authors have read and agreed to the published version of the manuscript.
Funding
This study was supported by the Nauru Project (2010–2015), which was funded by Milano Municipality and related to EXPO 2015. Authors did not receive funds for covering the costs to publish in open access.
Institutional Review Board Statement
Not applicable.
Informed Consent Statement
Not applicable.
Acknowledgments
The authors thank the Nauru Rehabilitation Company (NRC) and the technicians of Ministry of Commerce, Industry, and Environment (CIE), for carrying out the field activities in Nauru Island in collaboration with the researchers of Politecnico di Milano. The authors would like to thank Daniel Feinstein (U.S. Geological Survey—Wisconsin) for his help and his assistance in the model implementation and run. Finally, the authors would like to thank Alfredo Lozej (CNR) for his help during geophysical surveys and Louis Bouchet for being the connection between the researchers of Politecnico di Milano and Nauru Island.
Conflicts of Interest
The authors declare no conflict of interest.
Nomenclature
| CSM | Conceptual site model |
| CNR | National research council |
| EC | Electrical conductivity |
| ERT | Electrical resistivity tomography |
| RL | Reduced level |
| RO | Reverse osmosis |
| SP | Stress periods |
| TDS | Total dissolved solids |
| VES | Vertical electrical sounding |
References
- Sharan, A.; Lal, A.; Datta, B. A review of groundwater sustainability crisis in the Pacific Island countries: Challenges and solutions. J. Hydrol. 2021, 603, 127165. [Google Scholar] [CrossRef]
- Leoni, B.; Zanotti, C.; Nava, V.; Rotiroti, M.; Stefania, G.A.; Fallati, L.; Soler, V.; Fumagalli, L.; Savini, A.; Galli, P.; et al. Freshwater system of coral inhabited island: Availability and vulnerability (Magoodhoo Island of Faafu Atoll—Maldives). Sci. Total Environ. 2021, 785, 147313. [Google Scholar] [CrossRef]
- Eissa, M.A.; Thomas, J.M.; Pohll, G.; Shouakar-Stash, O.; Hershey, R.L.; Dawoud, M. Groundwater recharge and salinization in the arid coastal plain aquifer of the Wadi Watir delta, Sinai, Egypt. Appl. Geochem. 2016, 71, 48–62. [Google Scholar] [CrossRef]
- Yaqoob, A.A.; Parveen, T.; Umar, K.; Ibrahim, M.N.M. Role of nanomaterials in the treatment of wastewater: A review. Water 2020, 12, 495. [Google Scholar] [CrossRef] [Green Version]
- Balzan, M.V.; Potschin-Young, M.; Haines-Young, R. Island ecosystem services: Insights from a literature review on case-study island ecosystem services and future prospects. Int. J. Biodivers. Sci. Ecosyst. Serv. Manag. 2018, 14, 71–90. [Google Scholar] [CrossRef]
- White, I.; Falkland, T. Management of freshwater lenses on small Pacific islands. Hydrogeol. J. 2010, 18, 227–246. [Google Scholar] [CrossRef]
- Wheatcraft, S.W.; Buddemeier, R.W. Atoll Island Hydrology. Groundwater 1981, 19, 311–320. [Google Scholar] [CrossRef]
- Falkland, A.C.; Custodio, E.; Diaz Arenas, A.; Simler, L. Hydrology and Water Resources of Small Islands: A Practical Guide. In Studies and Reports in Hydrology; Unesco: Paris, France, 1991; Volume 49, ISBN 9231027530. [Google Scholar]
- Vacher, H.L.; Quinn, T.M. Geology and Hydrogeology of Carbonate Islands; Elsevier: Amsterdam, The Netherlands, 2004; Volume 54, ISBN 0-444-51644-1. [Google Scholar]
- Falkland, A.C. Hydrology and Water Management on Small Tropical Islands. 1993. Available online: https://iahs.info/uploads/dms/iahs_216_0263.pdf (accessed on 5 September 2022).
- Mastrocicco, M. Studies on water resources salinization along the Italian coast: 30 years of work. Acque Sotter.—Ital. J. Groundw. 2021, 10, 7–13. [Google Scholar] [CrossRef]
- Licata, I.L.; Langevin, C.D.; Dausman, A.M.; Alberti, L. Effect of tidal fluctuations on transient dispersion of simulated contaminant concentrations in coastal aquifers. Hydrogeol. J. 2011, 19, 1313–1322. [Google Scholar] [CrossRef]
- Mulligan, A.E.; Langevin, C.; Post, V.E. Tidal Boundary Conditions in SEAWAT. Ground Water 2011, 49, 866–879. [Google Scholar] [CrossRef]
- Buddemeier, R.W.; Oberdorfer, J.A. Internal Hydrology and Geochemistry of Coral Reefs and Atoll Islands: Key to Diagenetic Variations. In Reef Diagenesis; Schroeder, J.H., Purser, B.H., Eds.; Springer: Berlin/Heidelberg, Germany, 1986; pp. 91–111. [Google Scholar]
- Alberti, L.; Licata, I.L.; Cantone, M. Saltwater Intrusion and Freshwater Storage in Sand Sediments along the Coastline: Hydrogeological Investigations and Groundwater Modeling of Nauru Island. Water 2017, 9, 788. [Google Scholar] [CrossRef] [Green Version]
- Nakada, S.; Umezawa, Y.; Taniguchi, M.; Yamano, H. Groundwater Dynamics of Fongafale Islet, Funafuti Atoll, Tuvalu. Ground Water 2012, 50, 639–644. [Google Scholar] [CrossRef]
- Gingerich, S.B.; Voss, C.I.; Johnson, A.G. Seawater-flooding events and impact on freshwater lenses of low-lying islands: Controlling factors, basic management and mitigation. J. Hydrol. 2017, 551, 676–688. [Google Scholar] [CrossRef]
- Werner, A.D.; Sharp, H.K.; Galvis, S.C.; Post, V.E.A.; Sinclair, P. Hydrogeology and management of freshwater lenses on atoll islands: Review of current knowledge and research needs. J. Hydrol. 2017, 551, 819–844. [Google Scholar] [CrossRef]
- Oberle, F.K.J.; Swarzenski, P.W.; Storlazzi, C.D. Atoll groundwater movement and its response to climatic and sea-level fluctuations. Water 2017, 9, 650. [Google Scholar] [CrossRef] [Green Version]
- Lentini, A.; De Caterini, G.; Cima, E.; Manni, R.; Ventura, G. Della Resilience toclimate change: Adaptation strategies for the water supply system of Formia and Gaeta (Province of Latina, Central Italy). Acque Sotter.—Ital. J. Groundw. 2021, 10, 35–46. [Google Scholar] [CrossRef]
- Karatzas, G.P.; Dokou, Z. Optimal management of saltwater intrusion in the coastal aquifer of Malia, Crete (Greece), using particle swarm optimization. Hydrogeol. J. 2015, 23, 1181–1194. [Google Scholar] [CrossRef]
- Thiéry, D. Saltwater Intrusion Modelling with an Efficient Multiphase Approach: Theory and Several Field Applications. In 18th Salt Water Intrusion Meeting: 18 SWIM; Instituto Geologico y Minero de España: Madrid, Spain, 2004. [Google Scholar]
- Colombo, L.; Alberti, L.; Mazzon, P.; Antelmi, M. Null-Space Monte Carlo Particle Backtracking to Identify Groundwater Tetrachloroethylene Sources. Front. Environ. Sci. 2020, 8, 142. [Google Scholar] [CrossRef]
- Antelmi, M.; Renoldi, F.; Alberti, L. Analytical and numerical methods for a preliminary assessment of the remediation time of pump and treat systems. Water 2020, 12, 2850. [Google Scholar] [CrossRef]
- Antelmi, M.; Mazzon, P.; Höhener, P.; Marchesi, M.; Alberti, L. Evaluation of mna in a chlorinated solvents-contaminated aquifer using reactive transport modeling coupled with isotopic fractionation analysis. Water 2021, 13, 2945. [Google Scholar] [CrossRef]
- Alberti, L.; Francani, V.; La Licata, I. Characterization of salt-water intrusion in the lower Esino Valley, Italy using a three-dimensional numerical model. Hydrogeol. J. 2009, 17, 1791–1804. [Google Scholar] [CrossRef]
- Underwood, M.R.; Peterson, F.L.; Clifford, I.V. Groundwater Lens Dynamics of Atoll Islands. Water Resour. Res. 1992, 28, 2889–2902. [Google Scholar] [CrossRef]
- Bailey, R.T.; Jenson, J.W.; Olsen, A.E. Numerical Modeling of Atoll Island Hydrogeology. Groundwater 2009, 47, 184–196. [Google Scholar] [CrossRef]
- Babu, R.; Park, N.; Yoon, S.; Kula, T. Sharp interface approach for regional andwell scale modeling of small island freshwater lens: Tongatapu island. Water 2018, 10, 1636. [Google Scholar] [CrossRef] [Green Version]
- Coulon, C.; Pryet, A.; Lemieux, J.M.; Yrro, B.J.F.; Bouchedda, A.; Gloaguen, E.; Comte, J.C.; Dupuis, J.C.; Banton, O. A framework for parameter estimation using sharp-interface seawater intrusion models. J. Hydrol. 2021, 600, 126509. [Google Scholar] [CrossRef]
- Coulon, C.; Lemieux, J.; Pryet, A.; Bayer, P.; Young, N.L.; Molson, J. Pumping Optimization under Uncertainty in an Island Freshwater Lens Using a Sharp-Interface Seawater Intrusion Model Water Resources Research. Water Resour. Res. 2022, 58, 1–18. [Google Scholar] [CrossRef]
- Houghton, J.T.; Ding, Y.; Griggs, D.J.; Noguer, M.; van der Linden, P.J.; Dai, X.; Maskell, K.; Johnson, C.A. IPCC Climate Change 2001: The Scientific Basis; The Press Syndacate of the University of Cambridge: Cambridge, UK, 2001. [Google Scholar]
- Nurse, L.; Moore, R. Adaptation to Global Climate Change: An Urgent Requirement for Small Island Developing States. Rev. Eur. Community Int. Environ. Law 2005, 14, 100–107. [Google Scholar] [CrossRef]
- Birawida, A.B.; Ibrahim, E.; Mallongi, A.; Rasyidi, A.A.A.; Thamrin, Y.; Gunawan, N.A. Clean water supply vulnerability model for improving the quality of public health (environmental health perspective): A case in Spermonde islands, Makassar Indonesia. Gac. Sanit. 2021, 35, S601–S603. [Google Scholar] [CrossRef]
- Doorga, J.R.S. Climate change and the fate of small islands: The case of Mauritius. Environ. Sci. Policy 2022, 136, 282–290. [Google Scholar] [CrossRef]
- Boojhawon, A.; Surroop, D. Impact of climate change on vulnerability of freshwater resources: A case study of Mauritius. Environ. Dev. Sustain. 2021, 23, 195–223. [Google Scholar] [CrossRef]
- Falkland, A. Nauru Water Management Visit Report 28th Oct–1st Nov 2002; Ecowise Environmental; Australian Agency for International Development: Canberra, Australia, 2002; 48p. [Google Scholar]
- Nauru Project. Available online: http://nauru.como.polimi.it (accessed on 19 March 2022).
- Jacobson, G.; Hill, P.J. Hydogeology and groundwater resources of Nauru Island, Central Pacific Ocean. Groundwater 1988, 12, 85. [Google Scholar]
- Alberti, L.; Cantone, M.; Oberto, G.; Sampietro, D. GNSS Static Suvey Report. Published by Politecnico di Milano (DIIAR Department) for Nauru Project. Available online: http://nauru.como.polimi.it/activities-report-november-2010/gnss-nauru-survey-report-oct-2011 (accessed on 19 March 2022).
- Bouchet, L.; Sinclair, P. Assessing the Vulnerability of Shallow Domestic Wells in Nauru; SOPAC Technical Report 435; SOPAC Secretariat: South Orange, NJ, USA, 2010. [Google Scholar]
- Jacobson, G.; Hill, P.J.; Ghassemi, F. Geology and Hydrogeology of Nauru Island. In Geology and Hydrogeology of Carbonate Islands; Vacher, H.L., Quinn, T.M., Eds.; Elsevier: Amsterdam, The Netherlands, 1997; pp. 707–742. ISBN 0444815201. [Google Scholar]
- Bouwer, H.; Rice, R.C. A slug test method for determining hydraulic conductivity of unconfined aquifers with completely or partially penetrating wells. Water Resour. Res. 1976, 12, 423–428. [Google Scholar] [CrossRef] [Green Version]
- Neuman, S.P. Effect of partial penetration on flow in unconfined aquifers considering delayed gravity response. Water Resour. Res. 1974, 10, 303–312. [Google Scholar] [CrossRef]
- Falkland, T. Water resources issues of small island developing states. Nat. Resour. Forum 1999, 23, 245–260. [Google Scholar] [CrossRef]
- Falkland, A.C. Vaipeka Water Gallery Extension Project, Aitutaki, Cook Islands; Australian Agency for International Development: Canberra, Australia, 1995. [Google Scholar]
- Harbaugh, A.W. MODFLOW-2005, The U.S. Geological Survey Modular Ground-Water Model—The Ground-Water Flow Process; US Department of the Interior, US Geological Survey: Reston, VA, USA, 2005; p. 253. [Google Scholar] [CrossRef] [Green Version]
- Langevin, C.D.; Guo, W. MODFLOW/MT3DMS-based simulation of variable-density ground water flow and transport. Ground Water 2006, 44, 339–351. [Google Scholar] [CrossRef] [PubMed]
- Ghassemi, F.; Jakeman, A.J.; Jacobson, G.; Howard, K.W.F. Simulation of seawater intrusion with 2D and 3D models: Nauru Island case study. Hydrogeol. J. 1996, 4, 4–22. [Google Scholar] [CrossRef]
- Kim, Y.; Yoon, H.; Lee, S.H. Freshwater-salt water interface dynamics during pumping tests. Acque Sotter.—Ital. J. Groundw. 2019, 8, 35–39. [Google Scholar] [CrossRef]
Figure 1.
Nauru position at 0°32′ S and 166°56′ E and aerial photo of the island in 2009 with its districts.
Figure 1.
Nauru position at 0°32′ S and 166°56′ E and aerial photo of the island in 2009 with its districts.

Figure 2.
EC values over the depth of the following monitoring wells: (a) well S1, (b) well S18, (c) well S21, and (d) well S23.
Figure 2.
EC values over the depth of the following monitoring wells: (a) well S1, (b) well S18, (c) well S21, and (d) well S23.

Figure 3.
VES (blue points in map) and ERT (black lines) carried out in the Capelle area located in the northern part of Nauru island at the border between Anetan and Ewa districts.
Figure 3.
VES (blue points in map) and ERT (black lines) carried out in the Capelle area located in the northern part of Nauru island at the border between Anetan and Ewa districts.

Figure 4.
Modelling domain of the density-dependent 3D numerical model.

Figure 5.
(a) Vertical discretization of the model domain (black cells are no-flow boundary conditions) and (b) zoom on the Bottomside area, where blue cells are Dirichlet boundary conditions having the same head and concentration values; the first seven thin layers were used to represent the sea bottom deepening and the shallow lagoon.

Figure 6.
Diagram scheme of the numerical modelling calibration phases.

Figure 7.
Available target points location for the model calibration.

Figure 8.
Depth distribution of the freshwater lens in Capelle area based on the geophysical survey results.
Figure 8.
Depth distribution of the freshwater lens in Capelle area based on the geophysical survey results.

Figure 9.
ERT n.7 section interpretation with VES monitoring wells positions; the 75 Ω∙m value (light blue) indicates fresh-brackish transition.
Figure 9.
ERT n.7 section interpretation with VES monitoring wells positions; the 75 Ω∙m value (light blue) indicates fresh-brackish transition.

Figure 10.
Comparison between observed (red profiles) and simulated (blue profiles) concentration in the targets of the model n.1.
Figure 10.
Comparison between observed (red profiles) and simulated (blue profiles) concentration in the targets of the model n.1.

Figure 11.
Observed vs. simulated concentrations for model n.1.


Table 1.
Hydraulic conductivity value measured through slug tests.
| Slug Test On | Depth (m) | Hydraulic Conductivity (m/d) |
|---|---|---|
| S18 | 10.2–13 | 0.4 |
| S18 | 13.1–15 | 7.1 |
| Near to S18 | 4.8–5.1 | 12.0 |
| S1 | 6.7–7.7 | 3.5 |
| S1 | 7.9–9.7 | 32.0 |
| S1 | 9.8–11.2 | 12.6 |
| S1 | 11.3–13.6 | 12.3 |
| S1 | 13.8–15 | 30.0 |
| S21 | 33.08–35.11 | 26.0 |
| S21 | 35.11–36.98 | 42.5 |
| S21 | 36.98–39.17 | 37.7 |
| S21 | 39.17–46.08 | 14.0 |
| Average value | 19.2 | |
| Median value | 13.3 | |
| Std. deviation | 13.8 |
Table 2.
Hydrogeological parameters initially assigned to the 2D models [15].
Table 2.
Hydrogeological parameters initially assigned to the 2D models [15].
| Hydrogeological Parameter | Value | |
|---|---|---|
| Hydraulic conductivity (m/d)—horizontal and vertical | 800 for limestone (zone 1) 40 for sand (zone 1) | 80 for limestone (zone 1) 4 for sand (zone 1) |
| Porosity | 0.3 | |
| Specific storage (1/m) | 0.0003 | |
| Specific yield | 0.3 | |
| Longitudinal dispersivity (m) | 50 for limestone 2 for sand | |
| Transverse dispersivity (m) | 5 for limestone 0.2 for sand | |
| Vertical dispersivity (m) | 0.2 for limestone 0.008 for sand | |
| Recharge (mm/y) | 540 | |
| Molecular diffusion (m2/d) | 8.64 × 10⁻⁶ | |
| Sea water TDS concentration | 35.7 kg/m3 | |
Table 3.
Water usage estimates 2010 for people in Nauru.
| Parameter | Minimum (l/d/pc) | Maximum (l/d/pc) | Average (l/d/pc) |
|---|---|---|---|
| Groundwater | 68 | 121 | 94 |
| Drinkable water (desalination or rainwater) | 20 | 20 | 20 |
| Total water needs | 88 | 141 | 114 |
Table 4.
Hydrogeological parameters after the calibration processes.
| Hydrogeological Parameter | Topside | Bottomside |
|---|---|---|
| Hydraulic conductivity (m/d) | 800 | 10–15 |
| Effective porosity (-) | 0.02 | 0.15 |
| Specific yield (-) | 0.02 | 0.15 |
| Specific storage (1/m) | 1 × 10⁻⁵ | 3 × 10⁻⁴ |
| Longitudinal dispersivity (m) | 80 | 2 |
| Transverse dispersivity (m) | 5 | 0.2 |
| Vertical dispersivity (m) | 0.2 | 0.008 |
| Recharge (mm/year) | 590 | 657 |
| Molecular diffusion (m2/d) | 8.64 × 10⁻⁶ | 8.64 × 10⁻⁶ |
Table 5.
Model n.1: statistical parameters between observed and simulated concentration data.
| Statistic | Value |
|---|---|
| Residual mean (kg/m3) | 1.34 |
| Absolute residual mean (kg/m3) | 1.87 |
| Residual standard deviation (kg/m3) | 1.94 |
| RMSE | 1.15 |
Publisher’s Note: MDPI stays neutral with regard to jurisdictional claims in published maps and institutional affiliations. |
© 2022 by the authors. Licensee MDPI, Basel, Switzerland. This article is an open access article distributed under the terms and conditions of the Creative Commons Attribution (CC BY) license (https://creativecommons.org/licenses/by/4.0/).
Share and Cite
MDPI and ACS Style
Alberti, L.; Antelmi, M.; Oberto, G.; La Licata, I.; Mazzon, P. Evaluation of Fresh Groundwater Lens Volume and Its Possible Use in Nauru Island. Water 2022, 14, 3201. https://doi.org/10.3390/w14203201
AMA Style
Alberti L, Antelmi M, Oberto G, La Licata I, Mazzon P. Evaluation of Fresh Groundwater Lens Volume and Its Possible Use in Nauru Island. Water. 2022; 14(20):3201. https://doi.org/10.3390/w14203201
Chicago/Turabian StyleAlberti, Luca, Matteo Antelmi, Gabriele Oberto, Ivana La Licata, and Pietro Mazzon. 2022. "Evaluation of Fresh Groundwater Lens Volume and Its Possible Use in Nauru Island" Water 14, no. 20: 3201. https://doi.org/10.3390/w14203201
Note that from the first issue of 2016, this journal uses article numbers instead of page numbers. See further details here.