
Experimental Investigation on Water Seepage through Transparent Synthetic Rough-Walled Fractures

1
Faculty of Civil Engineering, K.N. Toosi University of Technology, Tehran 19967-15433, Iran
2
Department of Physics and Earth Sciences, University of Ferrara, Via Saragat 1, 44122 Ferrara, Italy
3
Department of Civil, Environmental and Structural Engineering and Chemistry (DICATECh), Polytechnic of Bari, via E. Orabona 4, 70125 Bari, Italy
*
Author to whom correspondence should be addressed.
Water 2022, 14(20), 3199; https://doi.org/10.3390/w14203199
Submission received: 8 September 2022
/
Revised: 3 October 2022
/
Accepted: 5 October 2022
/
Published: 11 October 2022
(This article belongs to the Special Issue Groundwater Management in a Changing World: Challenges and Endeavors)
Abstract
:One of the impacts of climate changes nowadays is the increase in the frequency of high-intensity rainfall events alternating with extreme dry periods, which affect the components of the hydrologic cycle, such as runoff, infiltration, and aquifer recharge. Several experimental investigations and theoretical studies have demonstrated that infiltration flow in fractured media can develop along preferential pathways. However, the prediction of infiltration phenomena in fractured media still remains an open issue. This, together with erratic rainfall patterns due to climate changes, affects the prediction of aquifer recharge and contaminant transport in fractured aquifers. The present work contributes to reducing this research gap by means of experimental investigation and forecast analysis, with a focus on the geometrical properties of single fractures and their influence on flow patterns. Several fracture surfaces based on different fractal dimensions, standard deviations, and mismatch lengths were designed using the SynFrac model and were generated by 3D printing technology. The results revealed that the fracture’s fractal dimension has a significant impact on the number of flow paths, while the fracture inclination only increases the number of intermediate preferential channels, and, hence, modifies the flow rate distribution over the fracture outlet. Additionally, the change in the inclination angle of the dry fracture from 55 to 65 degrees resulted in an 8% reduction in the mean width of first flow path. A sensitivity analysis using an M5 tree indicates that there is a linear relationship between flow rate and the exponential form of the fractal dimension. The location of flow channels is a function of fracture fractal dimension, and the influence of mismatch length on their location is negligible. Finally, an accurate prediction algorithm with a Nash value of 0.81 was developed using Wavelet transform in order to estimate the time series of periodic flow rates over the fracture outlet.
1. Introduction
Climate change has a strong impact on renewable groundwater resources; altered rainfall patterns due to climate change can reduce the ability to predict infiltration phenomena in soil and rock formations, giving rise to an erratic estimation of aquifer recharge and contaminant transport [1]. This can have serious implications on groundwater supplies, food production, and storm water runoff, as well as biodiversity and ecosystems.
Hirmas et al. [2] showed that macropores in which water infiltrates mainly by the influence of gravity play an important role in the total water infiltration, affecting regional and global water cycle.
According to Salve et al. [3] in semi-arid climate regimes, where a soil mantle covers the underlying rock, precipitation saturates the overlying soil before infiltration into the bed rock commences. This can take several weeks to months. Moreover, recent observations and predictions of extreme rainfall events associated with climate changes suggest the inevitability of prolonged flooding and, subsequently, infiltration events that can continue for months.
In fractured rocks, a variety of processes may affect infiltration and, thus, aquifer recharge, including gravity, capillarity, surface tension, viscosity, entrapped air, and biological activity [4]. Thus, the prediction of the flow rate and the pathways in rough fractures with different geometries is of great importance [5,6].
The simplest model of flow through a rock fracture is the parallel plate model [7,8]. This theory depicts the system as two parallel surfaces separated by a constant aperture; hence, the flow between the two surfaces is laminar [9]. Nevertheless, fluid flow in a real rock fracture bounded by two irregular surfaces is complex even under a laminar flow regime. The major factor causing deviation of predicted fracture flow behavior from the ideal parallel plate theory is the nature of non-parallel and non-smooth geometry of fracture surfaces [10]. Snow [7] found that neglecting the impact of roughness in parallel plate theory caused a significant overestimation of flow quantity through self-affine fractures.
Although a real fracture surface has a complex aperture and roughness, extensive studies have attempted to simulate the fracture geometry by means of statistical distributions and effective parameters. Generally, these studies used cubic law theory [11] based on the Reynolds equation to simulate single phase flow between two parallel plates.
Kishida et al. [12] suggested that the applicability of the Reynolds equation is limited to low Re conditions and smooth fracture walls, so that the flow rate and local velocity components perpendicular to the nominal fracture plane are sufficiently low. In order to solve this problem, some researchers [13,14,15] have investigated the role of the aperture length and its spatial variation on the distribution of flow rates along the fracture. They reported that the characterization of fracture geometry, such as mismatch length and fractal dimension, led to the change in flow rates within the fracture, which can be visualized using a transparent fracture. Moreover, many numerical studies investigated the influence of tortuosity and roughness of rough-walled fractures on preferential flow pathways. Javadi et al. [16] evaluated the effect of roughness on the distribution of the Reynolds number over the fracture. Liu et al. [14] highlighted the main importance of fractal dimensions on equivalent permeability of a fracture, where neglecting it results in a 17.64–19.51% error in the predicted flow rates. Zou et al. [17] simulated velocity vectors in a rock fracture using COMSOL software, and showed that the equivalent permeability of rough-walled fractures for small values of Reynolds numbers depends on the local distribution of apertures. Their results state the significant impact of fractal dimensions on transmissivity as reported by Crandall et al. [13]. Zhang et al. [18] predicted a linear regression model between the permeability of rough walled fractures and fluid velocity, considering a high constant head between fracture inlet and outlet. They found that the heterogeneous behavior of preferential channels under normal distribution of the aperture is a function of aperture heterogeneity. Due to the complexity in experimental tests setup and implementation, general numerical methods were used to analyze the impact of fracture geometry on fluid flow [19,20]. They indicated the significant influence of fracture roughness on fracture permeability.
Extensive experimental studies have also attempted to visualize the flow seepage process in rough-walled fractures using a transparent replica. Su et al. [21] conducted the first experimental study of fracture inclinations on preferential flow pathways in transparent plates of natural granite. They highlighted the great influence of fracture angles and fracture geometries on capillary region and preferential flow path locations, respectively. Watanabe et al. [22] performed a numerical model and experimental test of fracture permeability and preferential flow under different confining pressures on granite samples. Their results illustrate the occupancy of preferential flow pathways for different value of fracture pressures. Noiriel et al. [9] numerically estimated a relationship between fracture dimensions and preferential flow channels during dissolution where fracture geometry varies through time. Several studies also experimentally visualized the influence of the aperture network on seepage flow in natural fractures [23,24,25,26]. Their results generally indicated that flow transport in an unaltered granite surface is mostly impacted by the aperture distribution.
Some recent studies implemented reconstructions of fracture surfaces with different fractal dimensions via 3D printing. Philips et al. [27] examined the effect of roughness on fluid flow properties by 3D printing seven self-affine fractures, each with controlled roughness distributions akin to natural fractures. They found that fracture contact area is a better permeability predictor than roughness when the mechanical aperture is below ~20 μm.
Suzuki et al. [28] realized a complex fracture network by using a 3D printer. They obtained a tracer response curve from the flow experiment and applied a computational fluid dynamics (CFD) simulation based on the Navier–Stokes equations to model it, which showed consistency with the experimental result. In 2022 [29] they conducted thermal flow experiments using a 3D printed fracture network with known structural and physical properties. They estimated the flow channel surface area with an approximate Bayesian uncertainty quantification method. The estimated uncertainty bounds were in good agreement with the design of the 3D printed sample.
Yang et al. [30] designed and constructed physical models of fracture-vug media through 3D printing technology. By combining the LED (light-emitting diode) backlight visualization method (BVM) and the particle image velocimetry (PIV) technique, they carried out experiments of multiphase flow (i.e., oil–water and gas–oil) through the printed fracture-vug medium.
Yin et al. [31] experimentally investigated non-linear fluid flow through rough fractures. They employed 3D printing techniques and fractal theory to produce fractured specimens with desirable roughness. They found that the hydraulic aperture decreases with the fractal dimension and standard deviation, and that the surface roughness imposes an important impact on the nonlinear characteristics of fluid flow through fractures. Review of the previous literature reveals that most studies attempted to (1) evaluate preferential flow path distribution on a replica of a natural rock fracture with specified aperture geometry or (2) used 3D printing techniques to conduct flow or thermal experiments.
Though the 3D printing method has already been applied recently to prepare rock-like material-based specimens with different geometries, few studies up to now have focused on experiments to investigate and forecast infiltration phenomena in synthetic fractures, both in wet and dry conditions.
In this study, several fractures with different fractal dimensions, standard deviations, and mismatch lengths have been designed and printed using 3D printing technology. The influence of these parameters, together with fracture inclination on infiltration in both wet and dry fractures, has been investigated, specifically the outlet flow rates and preferential flow paths. Finally, the temporal variation in flow rate in five outlets from the beginning until the end of the experiment, as well as the total fracture flow rate, were predicted. The inflow from the tank and outflow in the outlets for every minute of the experiment are used as training data for this machine learning predictive model.
2. Materials and Methods
2.1. Parameters Affecting Fracture Flow
Natural fractures are extremely complicated systems, and there are many factors which must be correctly assessed upon parameter value selection. According to Brown [32], a simple mathematical model of rough-walled fractures requires the specification of only three main parameters: the fractal dimension, the roughness at a reference length scale, and a length scale describing the degree of mismatch between two fracture surfaces.
The mismatch length is a measure of rock fracture surface correlation. Correlation wavelengths describe the level of interaction/correlation between two fracture surfaces. A small wavelength indicates zero correlation; an increase in wavelength, therefore, relates to increases in correlation until a maximum degree of correlation is reached [33]. This correlation is often referred to as matching, which does not indicate a perfect fit between two fractures, as this is not indicative of a real situation. Brown [32] recognized this and renamed matching to a “mismatch length,” above which the fractures were “matched” and below which the fractures behaved independently of each other.
Numerous researchers have reported on the fact that fracture surfaces are self-similar and can be analyzed by fractal geometry [34]. Since Mandelbrot’s study [35], fractal geometry has been extensively applied to characterize the roughness of fracture surfaces and to correlate it with mechanical properties.
The surface roughness plays an important role and can lead to a significant departure from the parallel plate model. However, the measurement of the roughness of the fracture surface should include a description of both the topography of the individual surfaces and their degree of mismatch. The fractal dimension describes the scale dependence of fracture roughness.
Surface roughness can be defined as geometrical irregularities on a smooth reference surface. The classic definition of roughness, R, is given by the ratio of the real surface area, AR, to the projected area, A0 (smooth reference surface), which can be expressed as:
Fractal geometry can be applied to describe roughness because the real area of fracture surfaces has fractal characteristics, such as the fractal dimension, Df and the fractional part of the fractal dimension, D*. The following theoretical relationship between R and D* has been proposed by Mandelbrot [35]:
where η is a non-dimensional parameter that equals less than one and is related to the size of the ruler used to measure the length (or area). The fractional part of the fractal dimension, D*, is defined as the fractal dimension, Df, minus the value two of the Euclidian dimension of a smooth surface [36]. Fractal dimension as the representative of the geometric variation of fractures can also be expressed as:
where is the variance of fracture increments, is the distance from the base point and represents the surface fractal dimension. The standard deviation is the mean-square value of the fracture surface deflections from the mean plane, and is a measure of roughness deviation with respect to the parallel plate model.
The fractal dimension for each fracture surface is a value between two and three, which predetermines the roughness of the fracture surface. Several studies have also attempted to correlate mechanical properties with the fractal dimension, among which was that of Charkaluk et al. [34], who presented experimental data showing positive, negative, and no correlation between fracture roughness and fractal dimension. Nagahama [37] deduced theoretically that a positive or negative correlation is possible, depending on some microstructural parameters.
Therefore, roughness, fractal dimension, and mismatch of fracture surfaces (walls) are key hydromechanical rock properties that influence (or control) the ways in which fluids permeate the structure.
According to experimental evidence, water infiltrates within the inclined single fracture, generating a flow channel network. The shape and evolution of the channel network are governed by the interplay between capillary, viscous, and gravitational forces, respectively. Thus, the distribution of flow paths across the fracture is function of the relative magnitude of these forces, which can be characterized by the Bond number and the Capillary number [21]. The Bond number (Bo) is the ratio of the gravity force to the capillary force:
where Δρ (ML−3) is the density difference between the infiltrated water and air, e (L) is the fracture aperture, g (LT−2) is the gravity acceleration, β is the fracture inclination, σ (MT−2) is the water surface tension, and γ is the contact angle.
The Capillary number (Ca) is the ratio between the viscosity force and the capillary force:
where µ (ML−2T) is the fluid viscosity and u (LT−1) is the fluid velocity.
As Bo and Ca increase, gravitational and viscous forces may become comparable with the capillary forces. Preferential flow paths and, thus, the relative permeability may vary.
The equivalent permeability k (L2) of the preferential pathways along the single fracture can be related to the fractal dimension Df [38] and the mismatch length λ [39]. Eker and Akin [38] indicate that the relation between , and can be described as:
where a and b are constant values.
Zambrano et al. [39] found that the permeability is proportional to the minimum mismatch length following a power–law relationship (depending on the fractal dimension).
where are constant values. In other words, higher values of fractal dimension imply a higher permeability for similar mismatch values.
Therefore, the effective permeability of a fracture is function of and which can be determined using a pick-wise linear regression corresponding to different ranges of fracture inclinations (), as written below:
2.2. Synthetic Fracture Designing
SynFrac software enables the numerical synthesis of fracture surfaces and apertures within prescribed parameters [40]. Synthetic fractures with the same basic geometry but with different physical topographies were generated using SynFrac software. The following parameters of rock fractures were varied to create synthetic fractures: (1) mismatch length (λ), (2) standard deviation of surface heights (σ), (3) fractal dimension of fracture surface (Df), as detailed in Table 1.
data sets for generating self-affine rough fractures with physical size were realized. Four fractures using different mismatch lengths and fractal dimensions and the same standard deviations were generated. The statistical indexes of printed fractures are presented in Table 1.
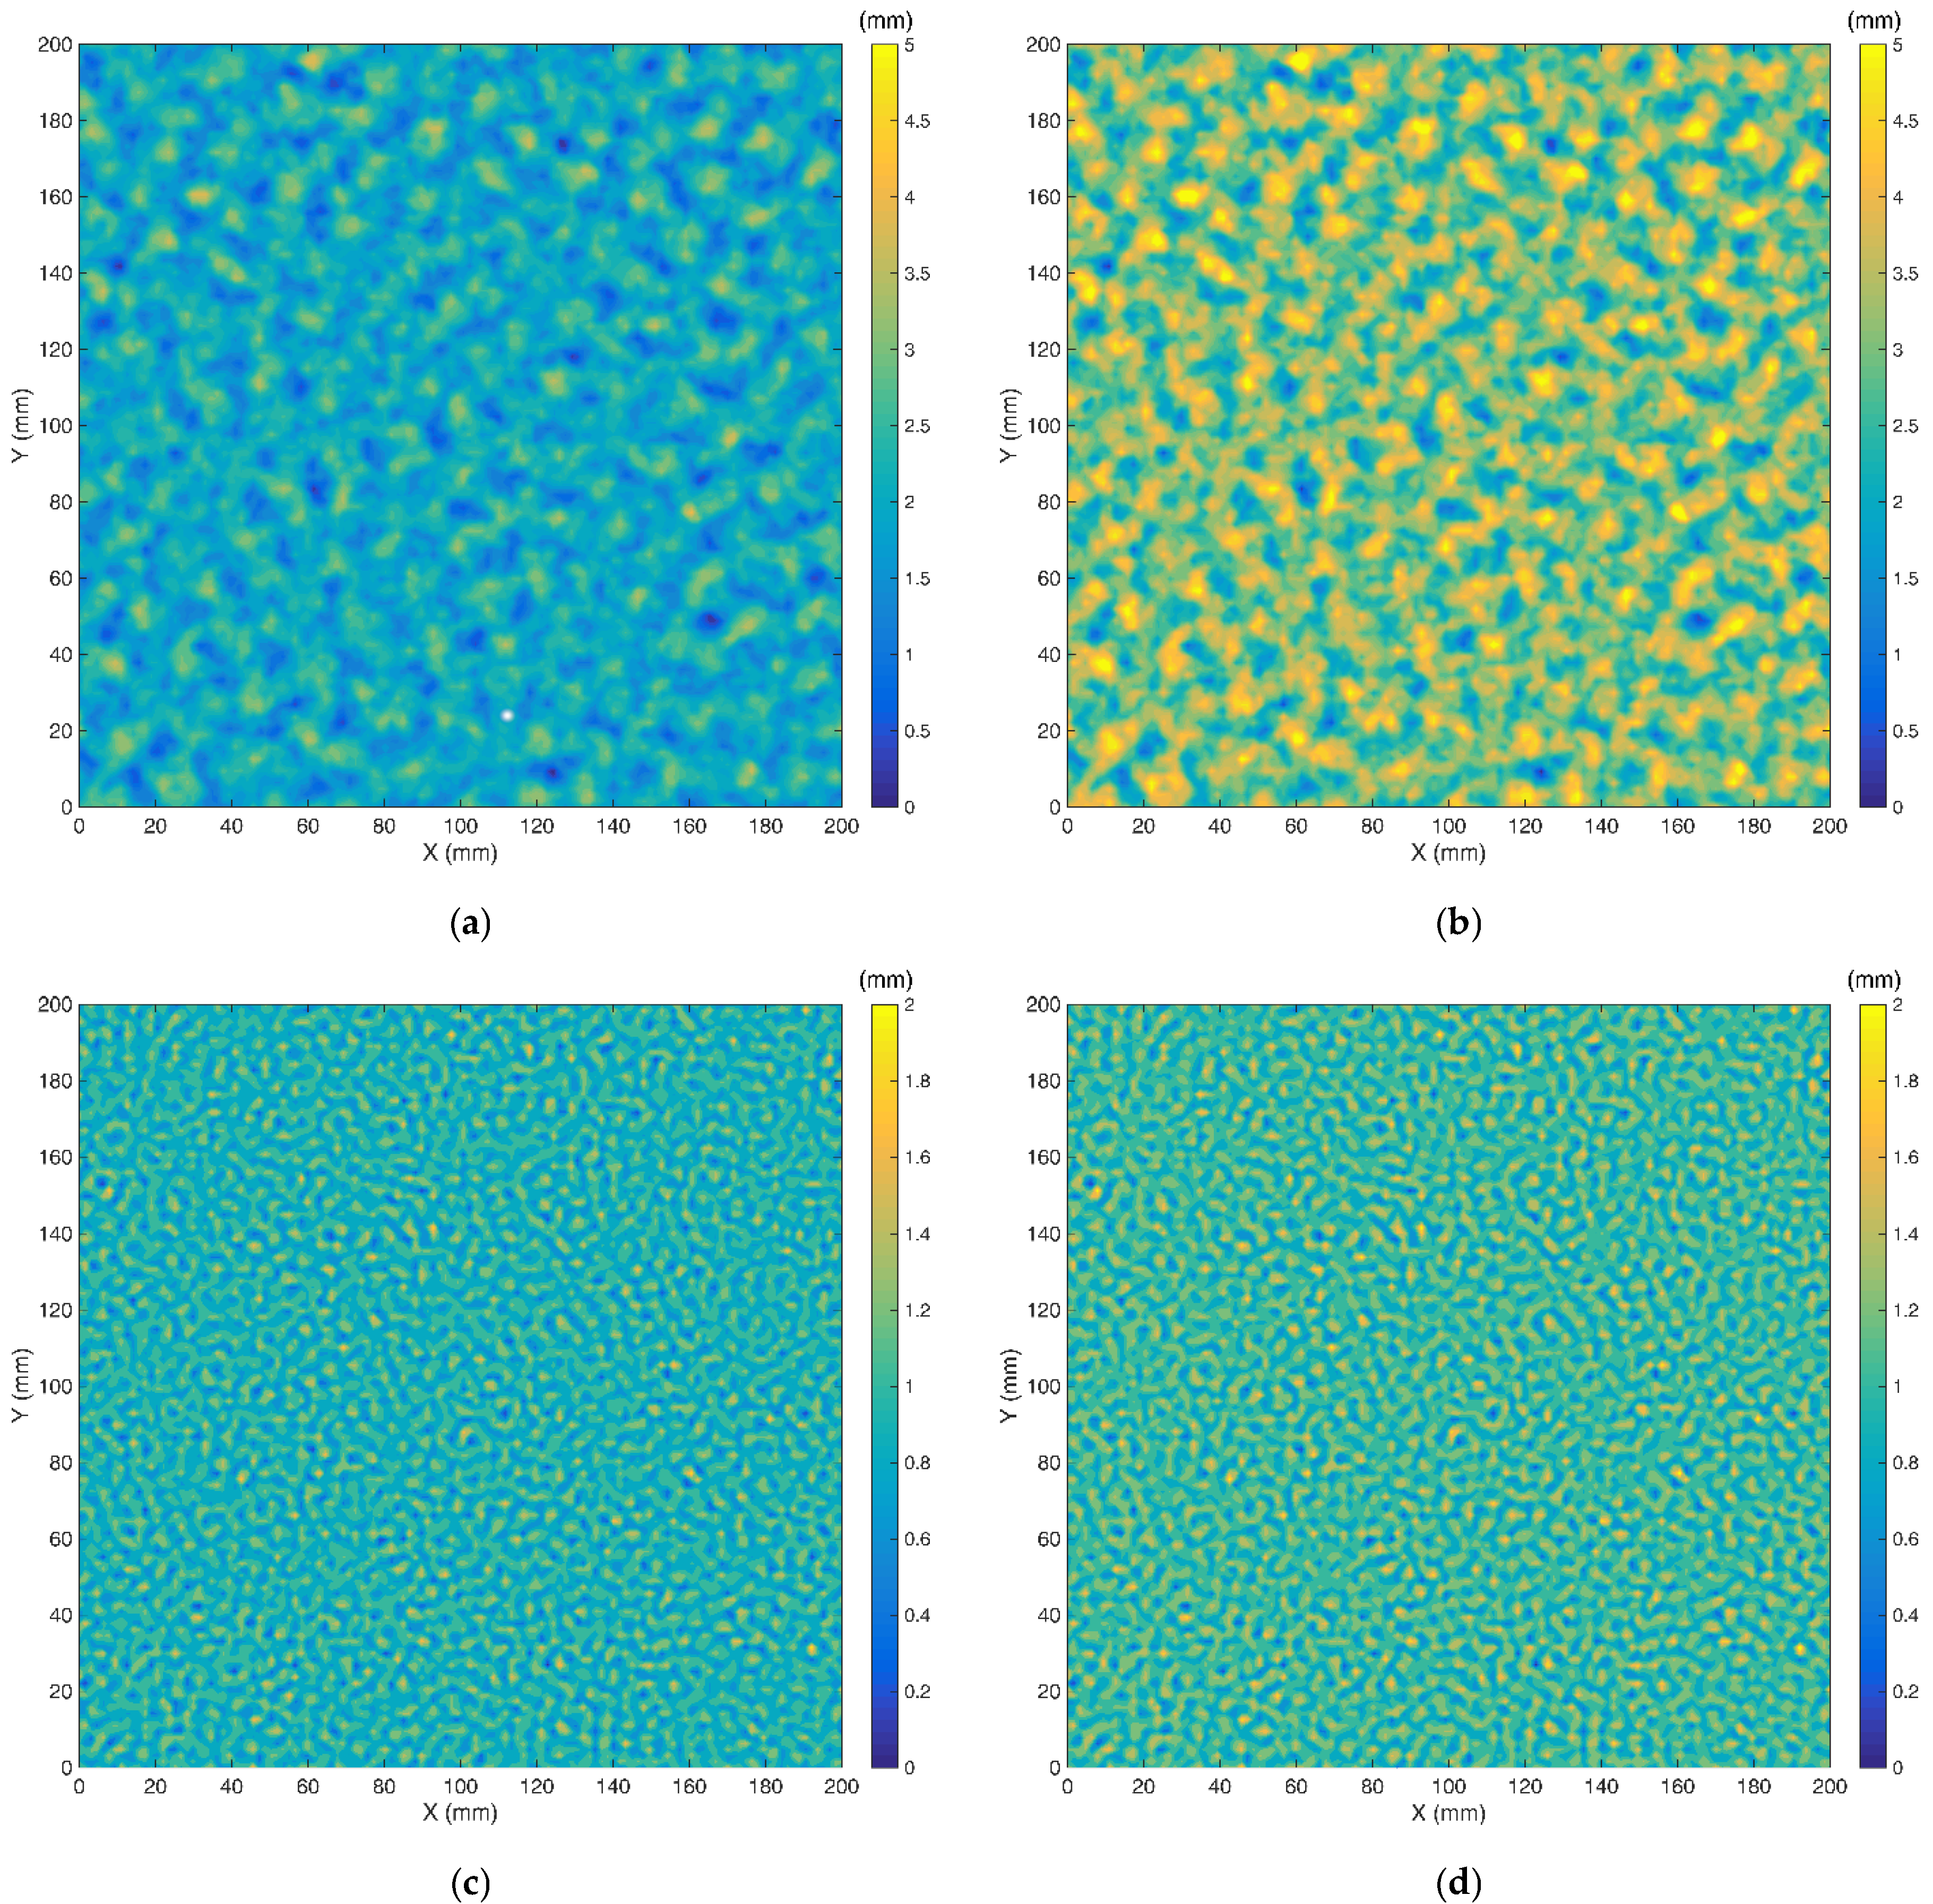
Figure 1 illustrates the geometry and aperture distributions of different synthetic fractures generated by Synfrac. For all fractures, the dimensions of the top and bottom increments are different, and there is no zero-aperture area. Moreover, the aperture distribution follows a Gaussian function, and the mean value of the aperture length along the cross section remains constant.
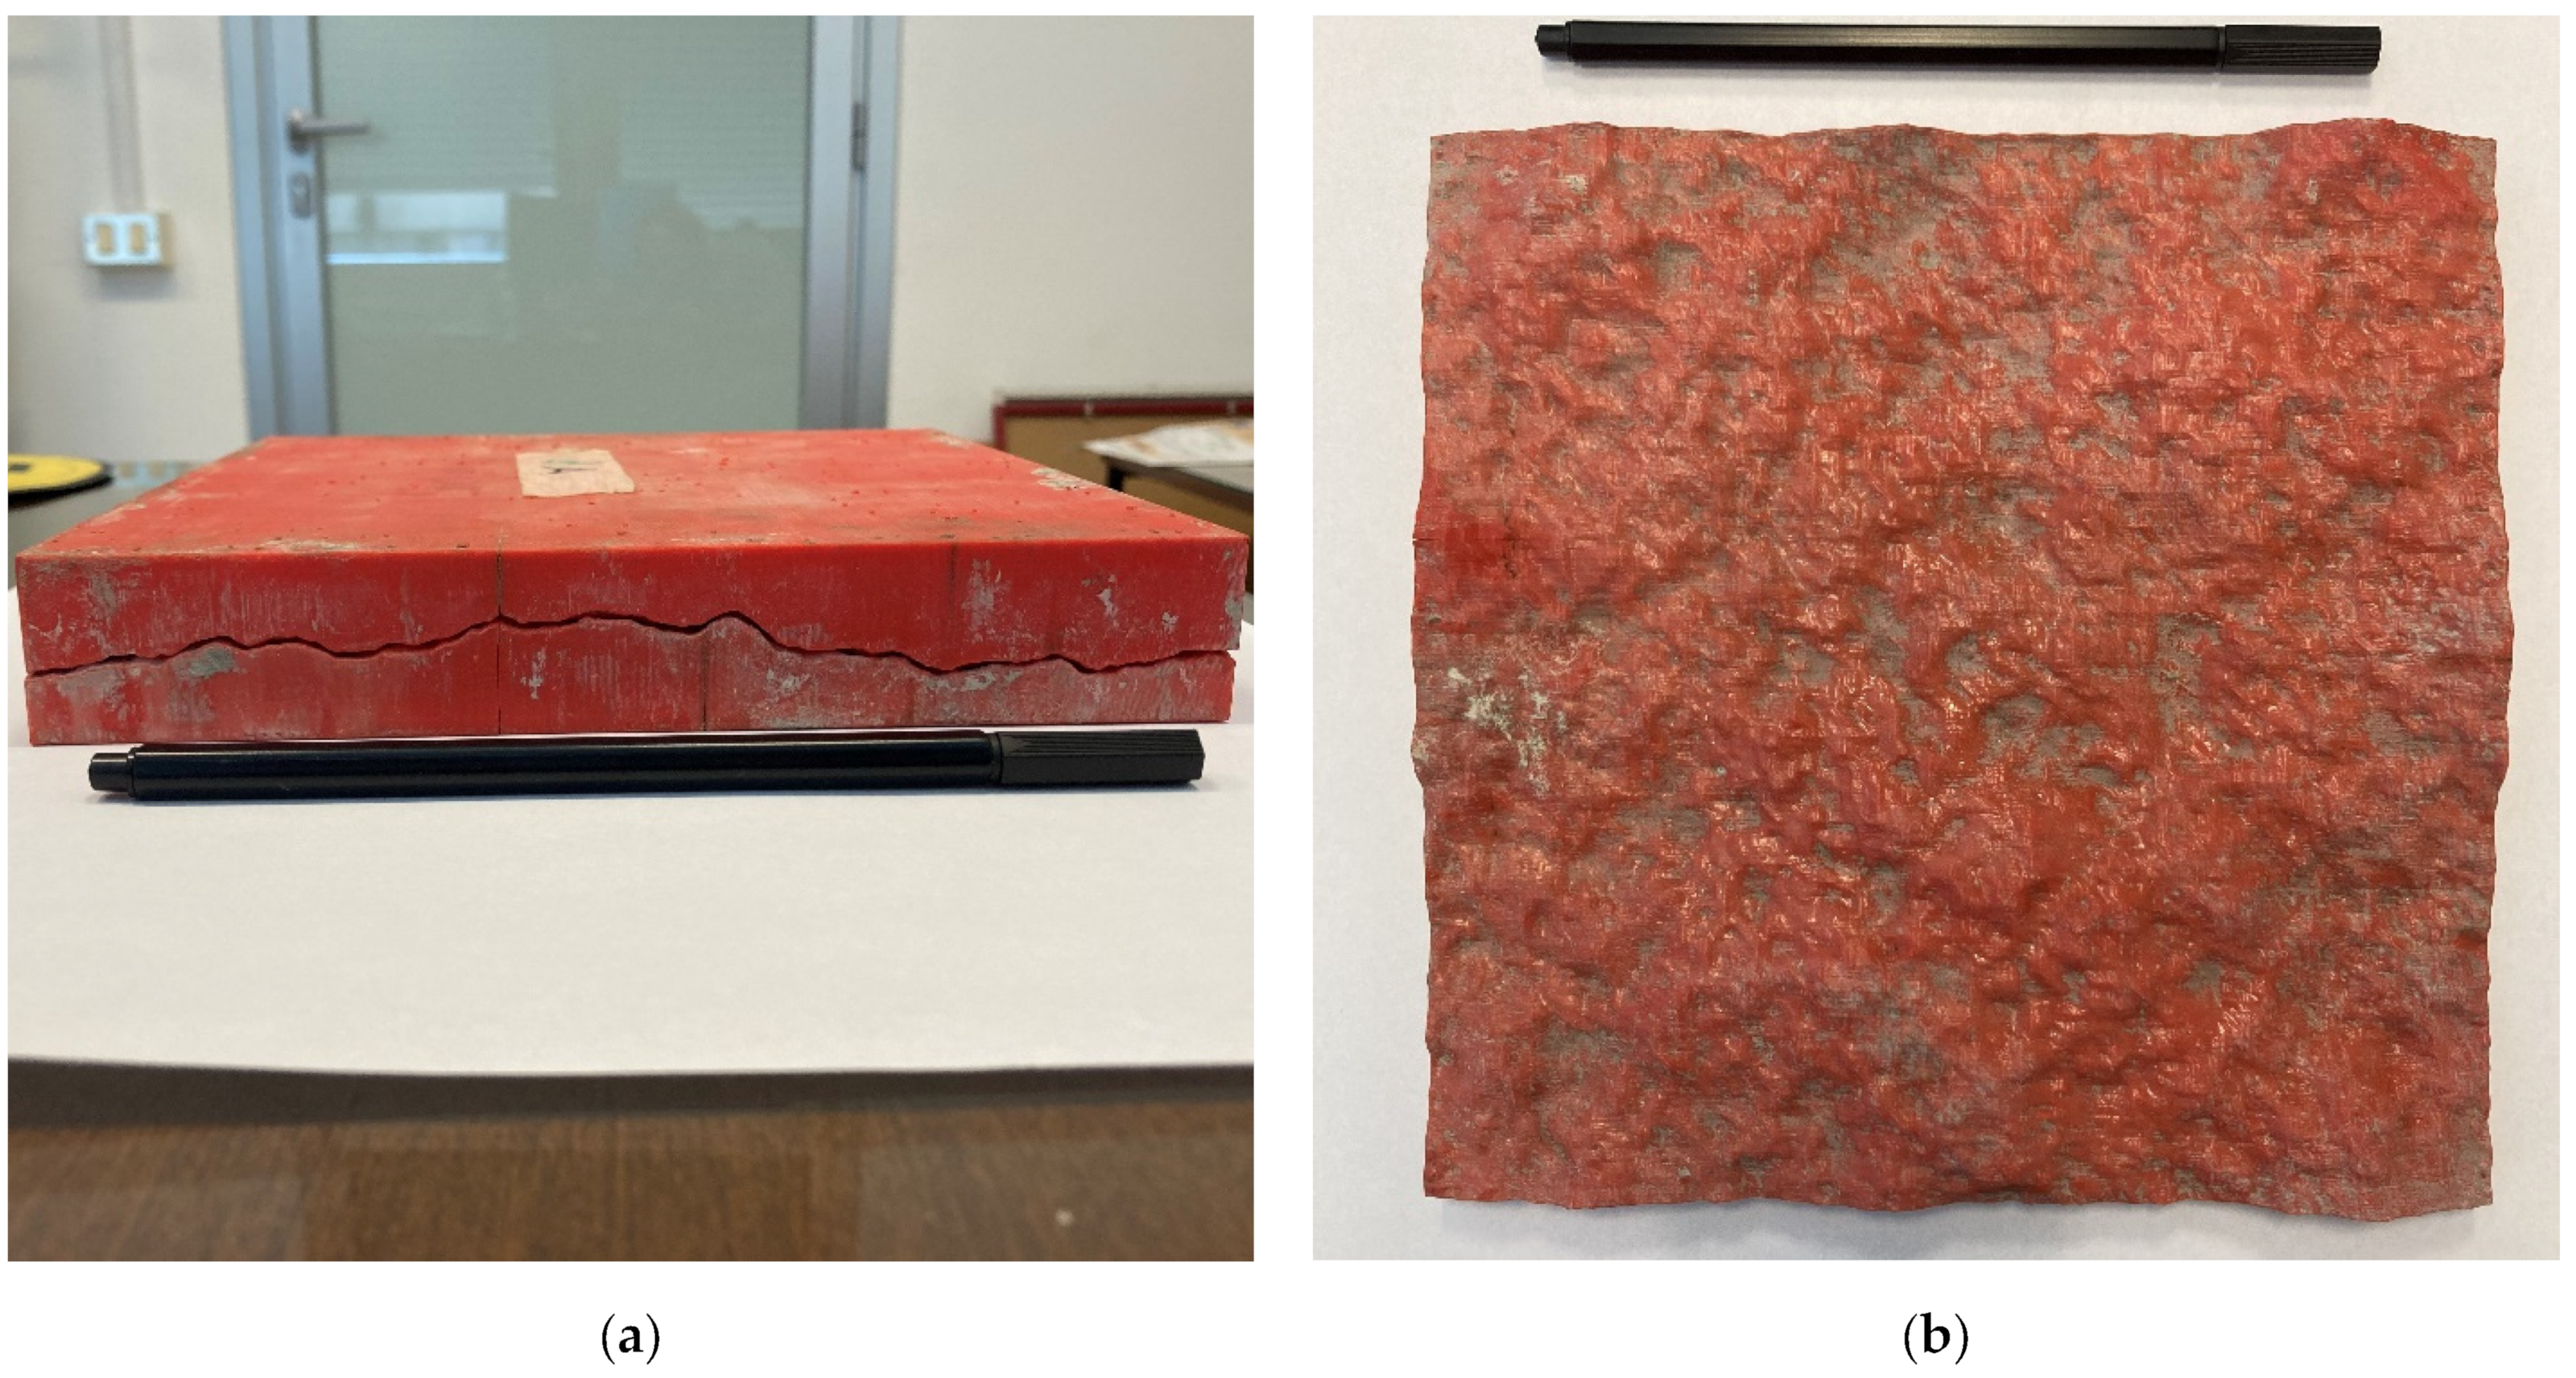
For each synthetic fracture generated, the fractured planes were built with a physical size of . A 3D printer has been used to construct these profiles on two plastic sheets in order to represent the two fracture planes (Figure 2). The thickness of printed fractures was 0.05 mm larger than the largest aperture, which reduced computational cost. The 3D printed fracture planes were then placed into formwork molds, whereby transparent epoxy resin was poured in order to create a transparent epoxy resin block with a single fracture. Upon setting of the resin, the two fracture surfaces were positioned together and sealed, watertight, down both sides.
2.3. Experimental Setup
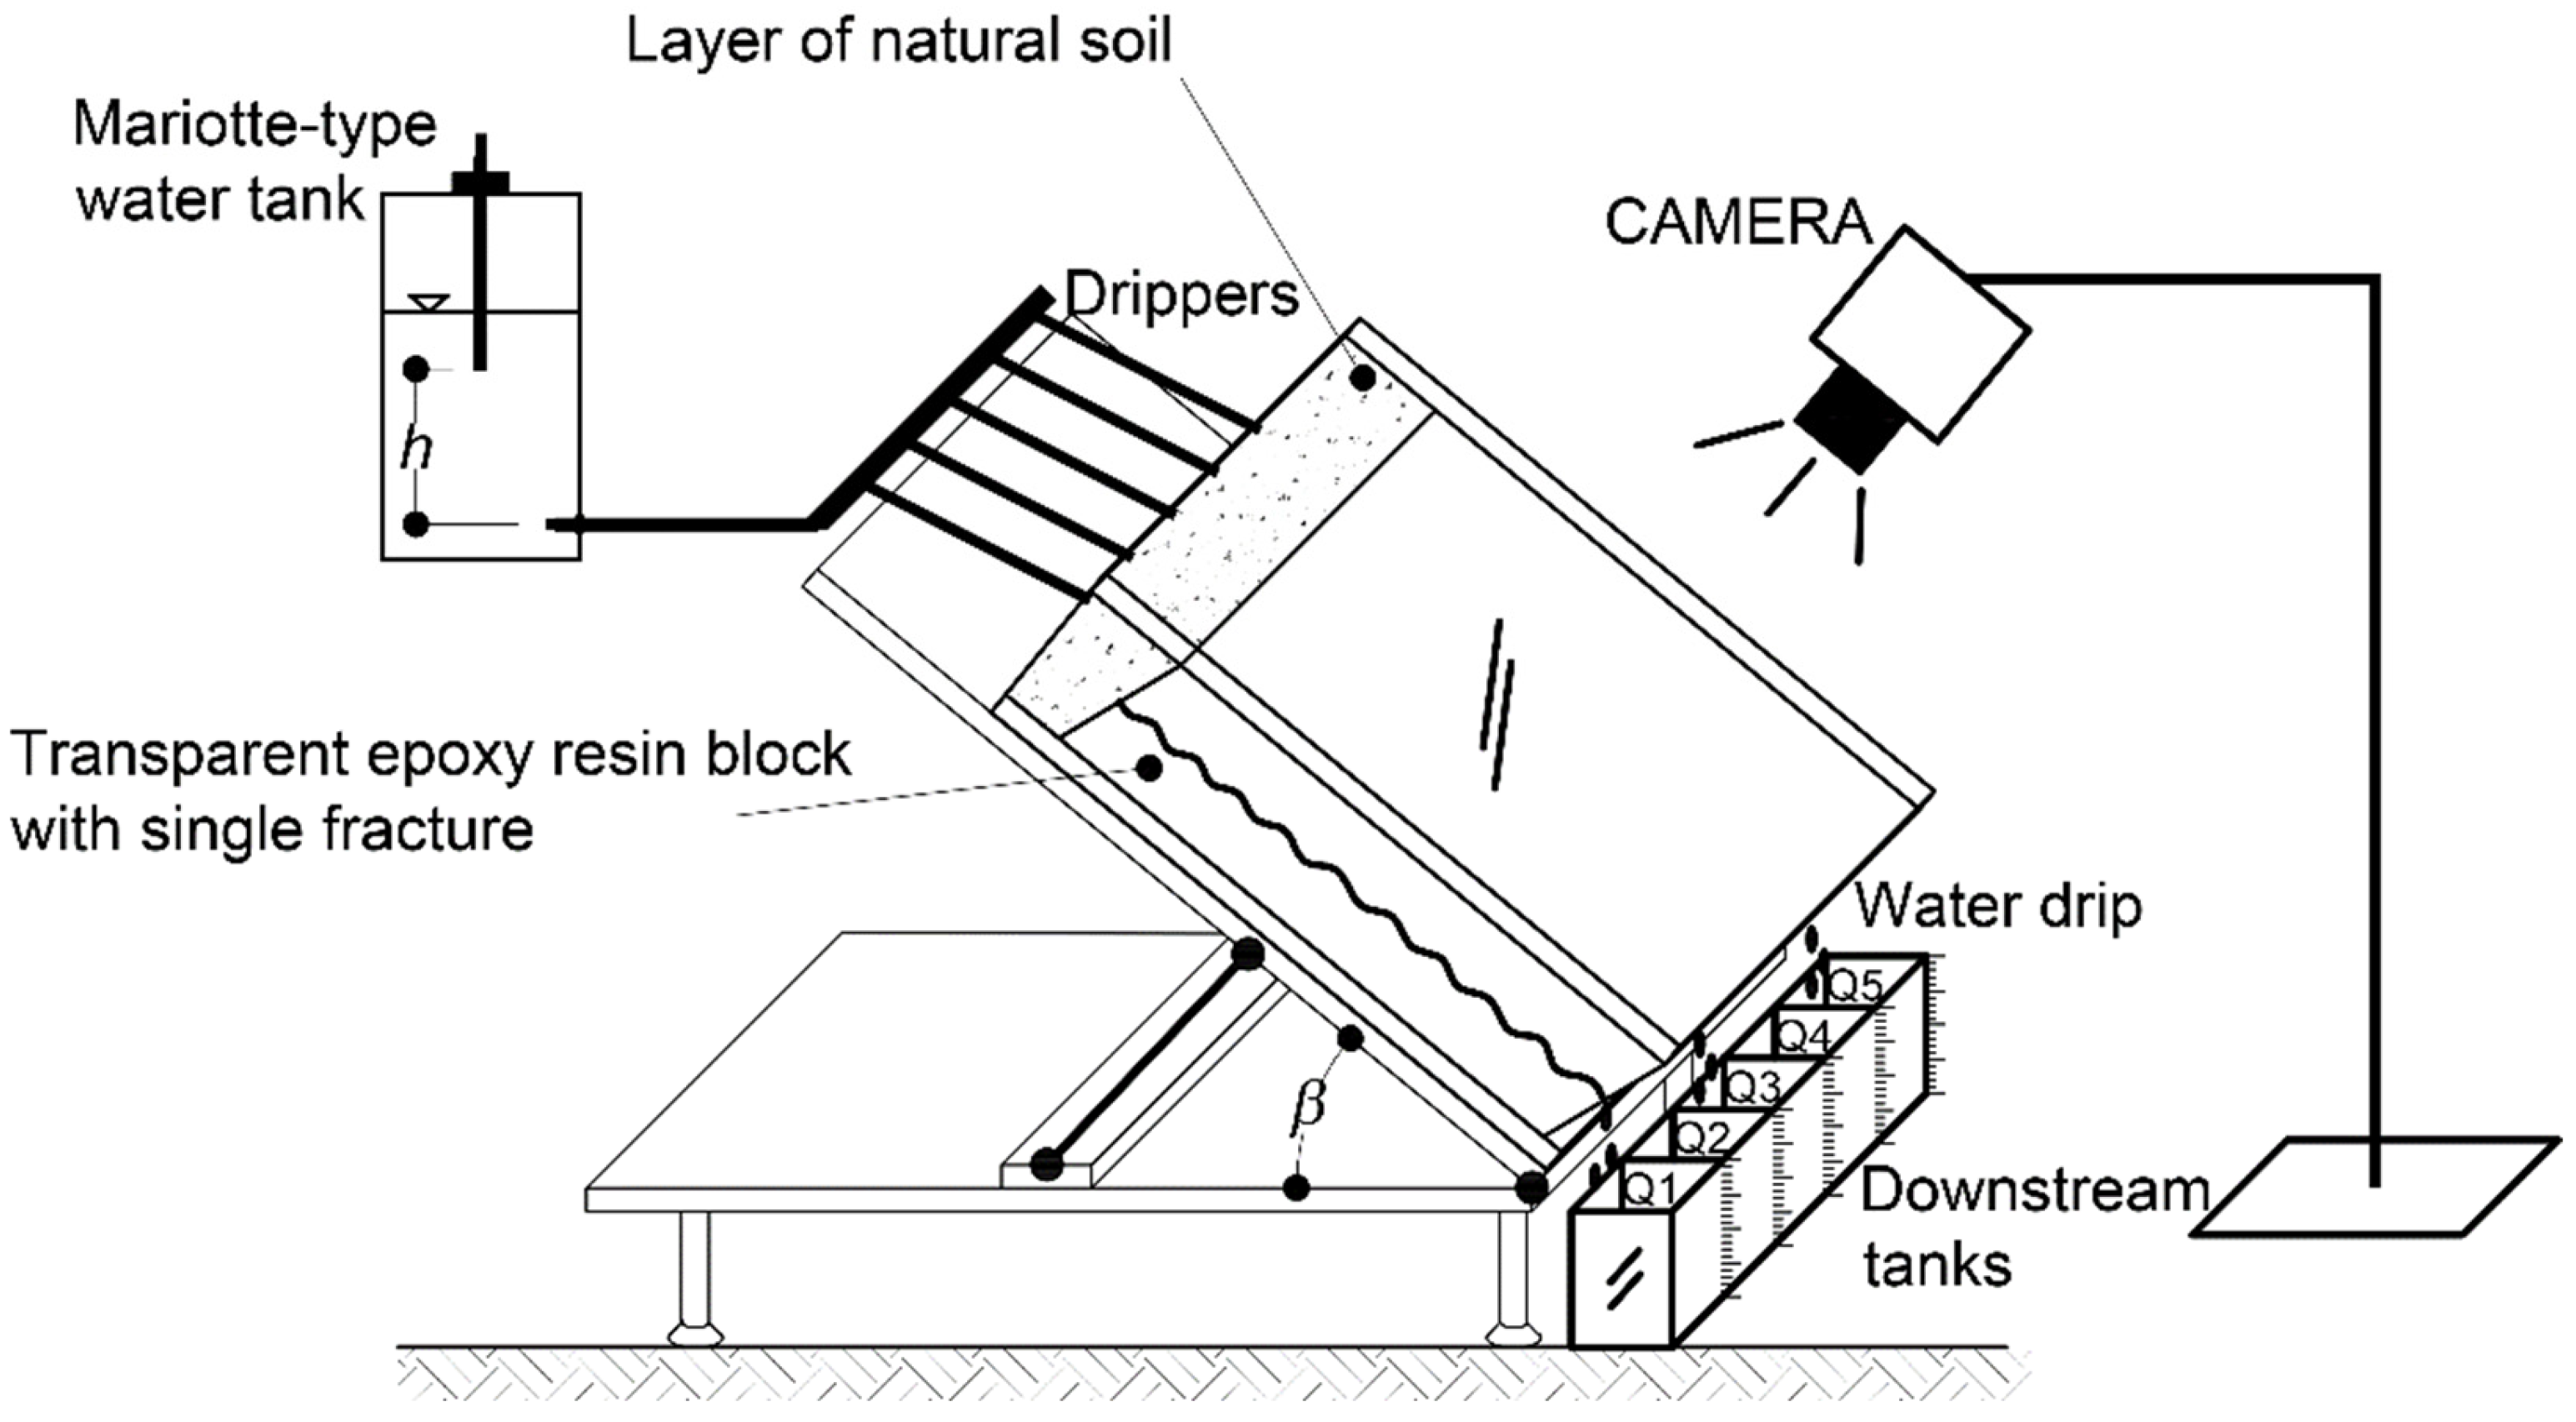
The flow experiment consists of letting water flow through each single fracture by means of a hydraulic system, which is composed of an upstream and a downstream tank. The upstream tank supplying water is a Mariotte-type water tank, which gives a flow rate at a pressure depending on the difference in height (h) between the inlet and the outlet of the syphon, and will allow the head to remain constant as the water level in the bottle drops. Moreover, it allows the inlet pressure to be varied by adjusting the height (h) of the Mariotte bottle. The 20-litre Mariotte-type water tank contains dyed water, which traces the flow paths through the fracture. For the visualization of preferential flow paths through fractures, a normal digital camera was used to record videos of the experiments.
The fracture inclinations (β) in the experimental set up were set as 45°, 55°, and 65° (Figure 3). The flow experiment was performed in both wet and dry fracture conditions.
The downstream tank is divided into five different sections by means of graduated rulers, in order to measure the hydraulic head variation. The flow volume in the five outlets was measured using one-minute time steps. The experiment was maintained until one of the outlet sections was filled with water. The upper part of the synthetic fracture was overlaid by a layer of natural soil mixed with gravel of 0.1 m thickness. Water flowed through this upper layer by means of five drippers, and then from the soil layer distributed to the fracture. In order to trace water movement in the dry condition, two molded resin blocks were dried about 50 min before the experiment. Then, the experiment was performed in wet conditions, in which the resin surface was washed in water. First, the surfaces angles were set at 45° for about 60 min, then the surfaces were dried and the experiment was repeated at 55° and 65°.
In order to trace the temporal location of dyed water, about sixty photos were taken by a digital camera for each inclined fracture, in both dry and wet initial conditions. An image processing technique was performed using the edge function with a “canny” filter built-in MATLAB to extract the region of dyed water from the recorded images.
2.4. Flow Rate Prediction
The relation between many independent inputs and outputs can be described using a machine learning algorithm. Among the different data mining algorithms, the tree algorithms are novel techniques which have been used to predict nonlinear processes [41]. The tree model partitions a complex problem into many sub-spaces and assigns regression relationships to them. In the tree model, nodes and leaves denote a selection and a decision, respectively. Among the tree algorithms, the M5 tree has been an efficient technique for the estimation of experimental results [42]. The M5 tree generates many linear relationships for different ranges of input data by dividing the input space into many sub-spaces.
The aim of the M5 tree is minimizing the cumulative error from the top to the leaf of the tree. The dividing process is terminated if the value of SDR varies slightly [41]:
where is a set of instances of node , is the new instance after dividing the node, and is the standard deviation.
After constructing the tree, a linear relationship is fitted to each leaf. In order to avoid the overfitting of the tree for unseen data, the tree is pruned from bottom to root [43]. In this study, the M5 tree in WEKA [44] software is trained with experimental data to analyze the sensitivity of the flow rate along the fracture outlet to the fracture parameters. The input parameters are time, fracture inclination, fractal dimension, and mismatch length of aperture distribution. The sensitivity of different inputs to the flow rate is determined using the aforementioned analytical model.
Wavelet analyses have been used to forecast the time series of different natural processes. The Wavelet uses a series of periodic functions to split time series into many scales, as written:
where, is a Wavelet function, is time, and and are the scale parameter and position, respectively.
The coefficients of the input determined by using the can be expressed as [44]:
where, is a continuous function. The temporal variation of flow rate over the fracture outlet is non-continuous, and hence, a discrete function was defined as [45,46]:
where is a constant value.
In this study, a Wavelet transform model was developed in MATLAB to predict the flow rate time series along the fracture outlet. The Laplacian operator for predicting the flow rate in the fracture is selected as a capable function [46]:
where , and is a constant value determined by trial and error.
The performance of the developed Wavelet algorithm is judged using the Nash–Sutcliffe index, as expressed [47]:
where represents the observed value of flow rate using experiment results, is the average value of flow rate predicted by the Wavelet algorithm, is the predicted value of the Wavelet algorithm, and is the sample number. Additionally, in order to measure the error between observed and predicted values, the root mean squared error (RMSE) is utilized:
3. Results and Discussion
3.1. Flow Rate along the Fracture Outlets
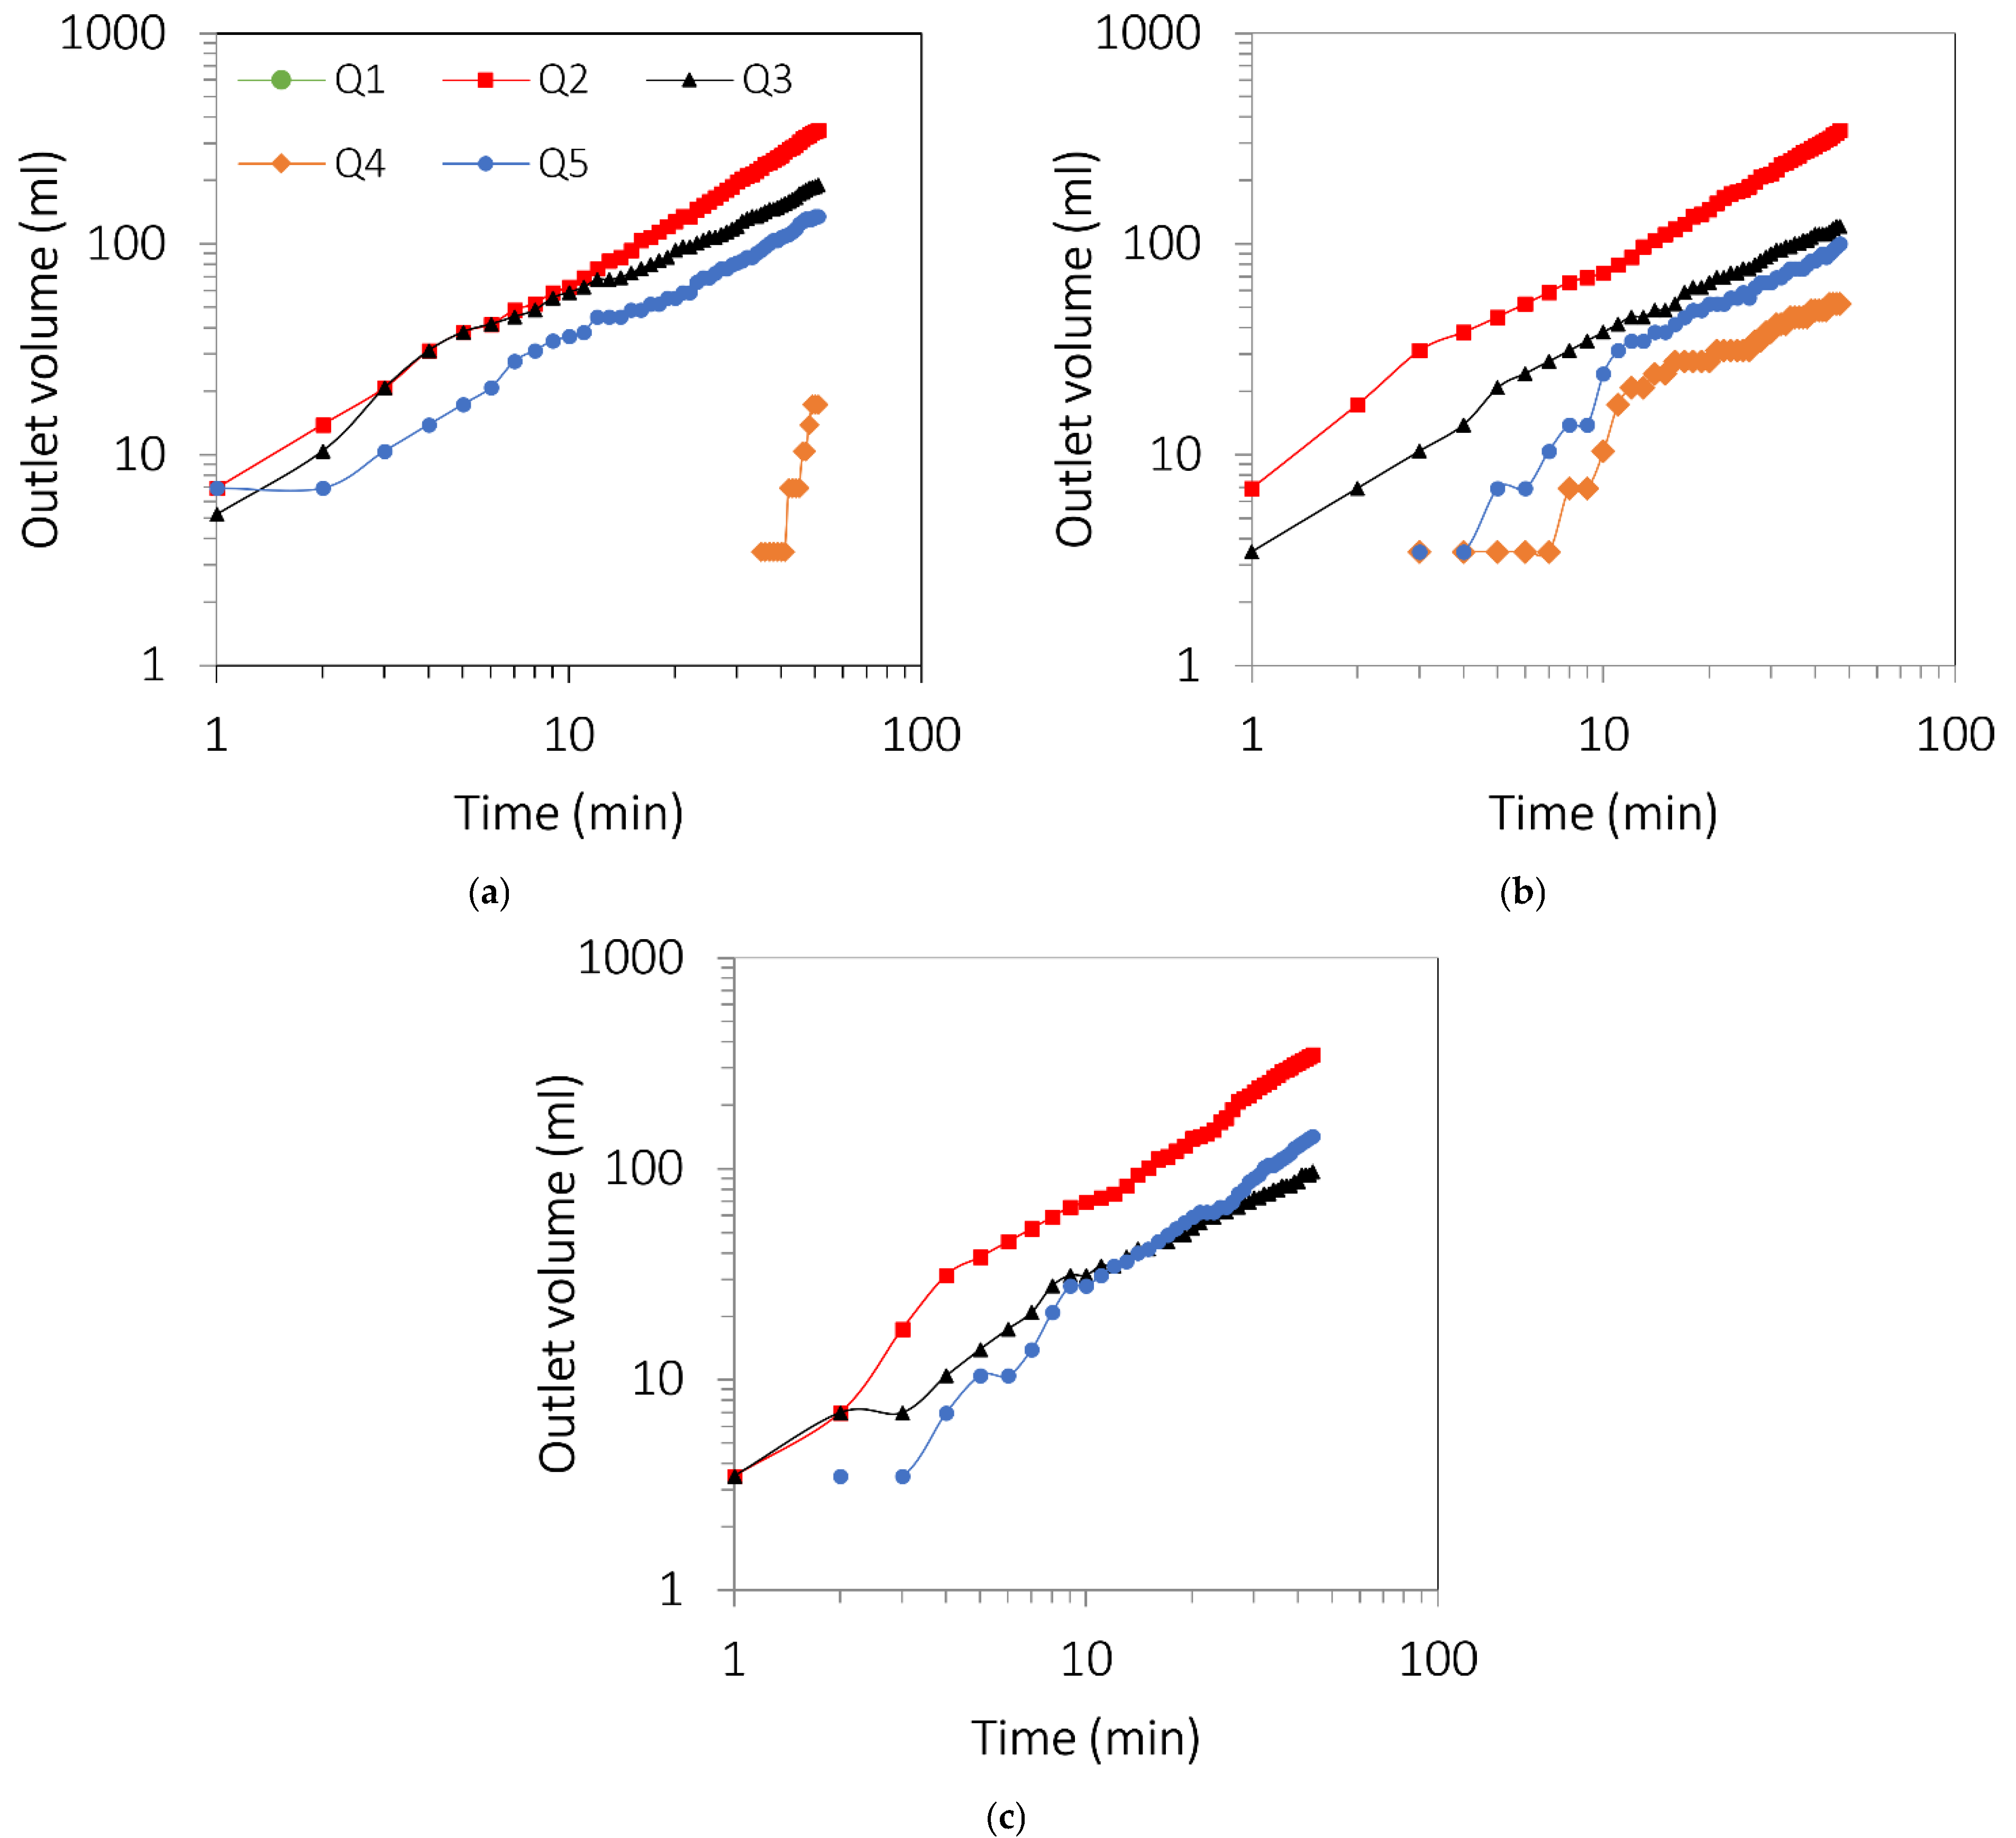
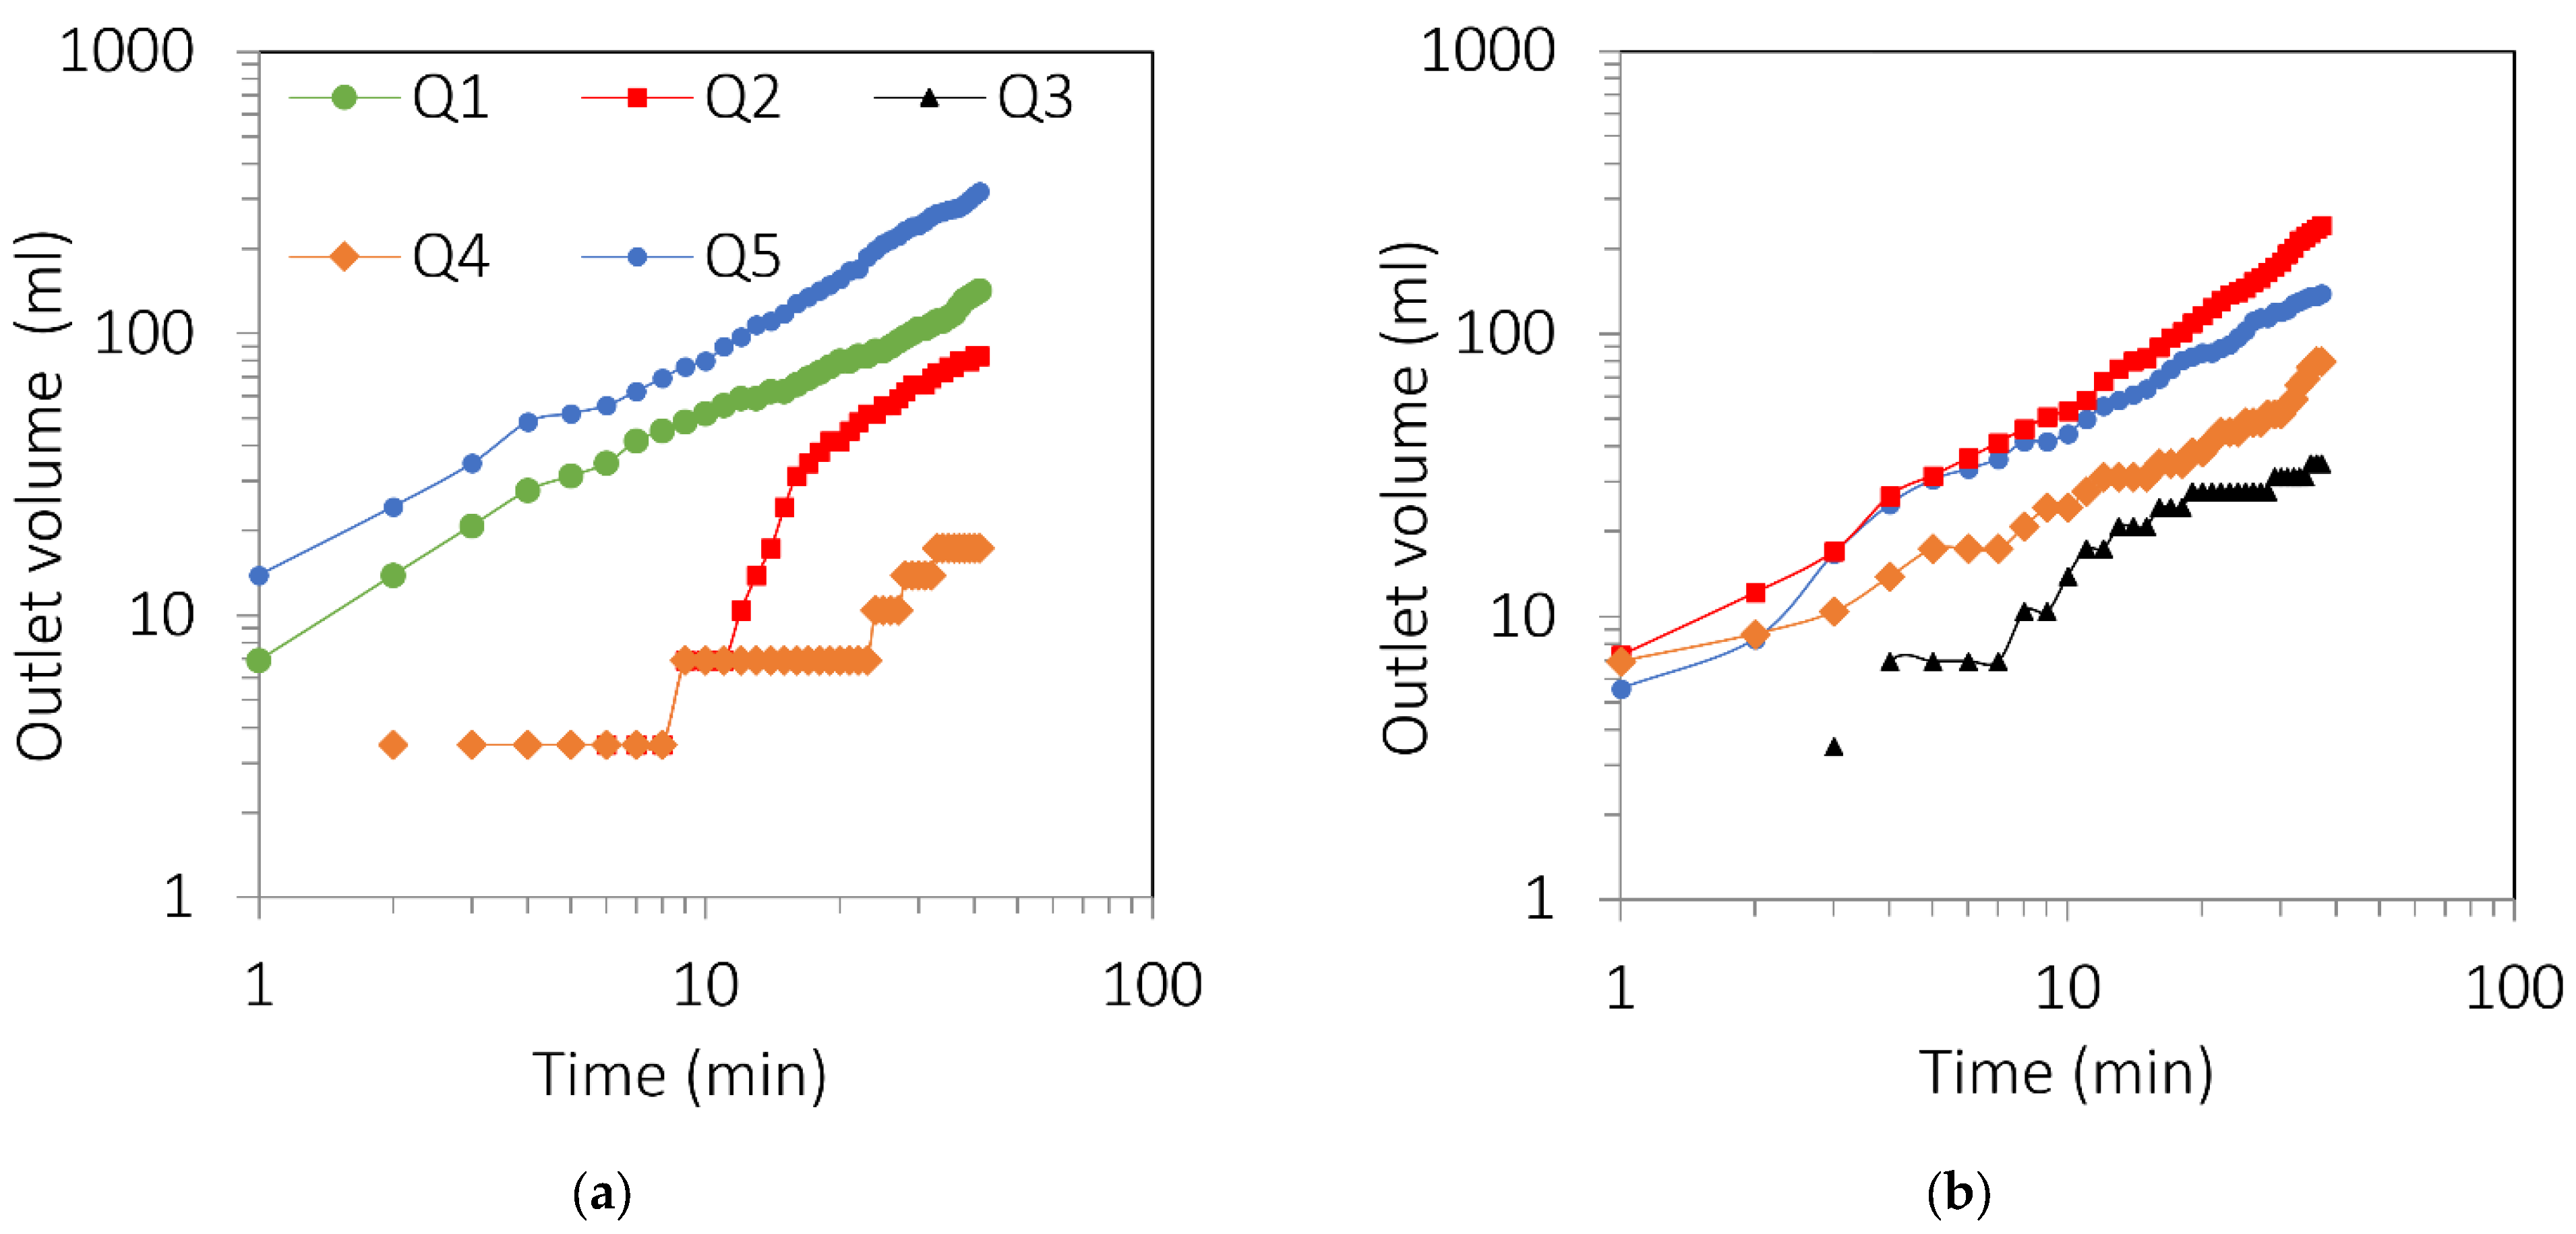
In order to evaluate how fracture geometry and inclination affect flow distribution, the total flow volumes in each of the five sections of the downstream outlet tank were measured. The volume of discharged water from Fracture-1 for different inclinations is illustrated in Figure 4.
As shown in Figure 4a, the second section (Q2) has the maximum discharge rate. The first section (Q1) is empty. A similar trend is observed for inclinations 55° and 65° (see Figure 4b,c).
Although the influence of fracture inclination on Q1 and Q2 is negligible, the values of Q5 and Q3 become closer with increasing inclination angles. Additionally, Q4 does not show a clear trend regarding inclination. This variation in flow rates can be attributed to the diversity of preferential flow paths corresponding to large gravity forces for high inclination angles. However, there is no direct relationship between the inclination angles and the total time to fill section Q5. This can be attributed to the change in discharge rates of all five sections. Many preferential flow paths were created and subsequently disappeared during the experiment; hence, the discharge rate in the outlets is not uniform and has a nonlinear trend with time.
The effect of fractal dimension on the outlet volume can be analyzed by comparing Fracture-1 (Figure 4a) and Fracture-2 (Figure 5a) with the same inclination angle (β = 45°) and mismatch length (λ = 30 mm). The increase in fractal dimension from 2.2 to 2.4 affects the outlet flow rate distribution. This is highlighted in Figure 5a, where section Q5 presents the maximum flow rate, while in this case section Q3 remains empty. A comparison between Figure 4a and Figure 5a indicates that the increase in fractal dimension results in a 77% increase in mean flow rates of Q5.
The distribution of flow rates over the outlet sections is more sensitive to the change in fractal dimension than the fracture inclination angle. This can be justified by the fact that the fractal dimension, as a representative parameter of fracture aperture geometric distribution, changed preferential flow paths significantly, whereas the variation of inclination angle changed the values of the discharge rates.
The effect of mismatch length on the outlet volume can be analyzed by comparing Fracture-1 (Figure 4a) and Fracture-4 (Figure 5b) with the same inclination angle (45°) and fractal dimension ( and different mismatch length values. According to Figure 4a and Figure 5b, section Q2 presents the maximum flow rates for each of two different mismatch lengths. In addition, the mean value of Q2 decreased by about 12%. A similar trend could be observed for all outlet sections except Q4. This was confirmed by the fact that a reduction in mismatch length led to the decrease in mean aperture and corresponding fracture equivalent permeability, whereas the preferential channel locations remain constant.
The results of the flow rate distribution through the five sections confirm the findings of Li et al. [15], who carried out investigations of flow paths in concrete self-affine fractures.
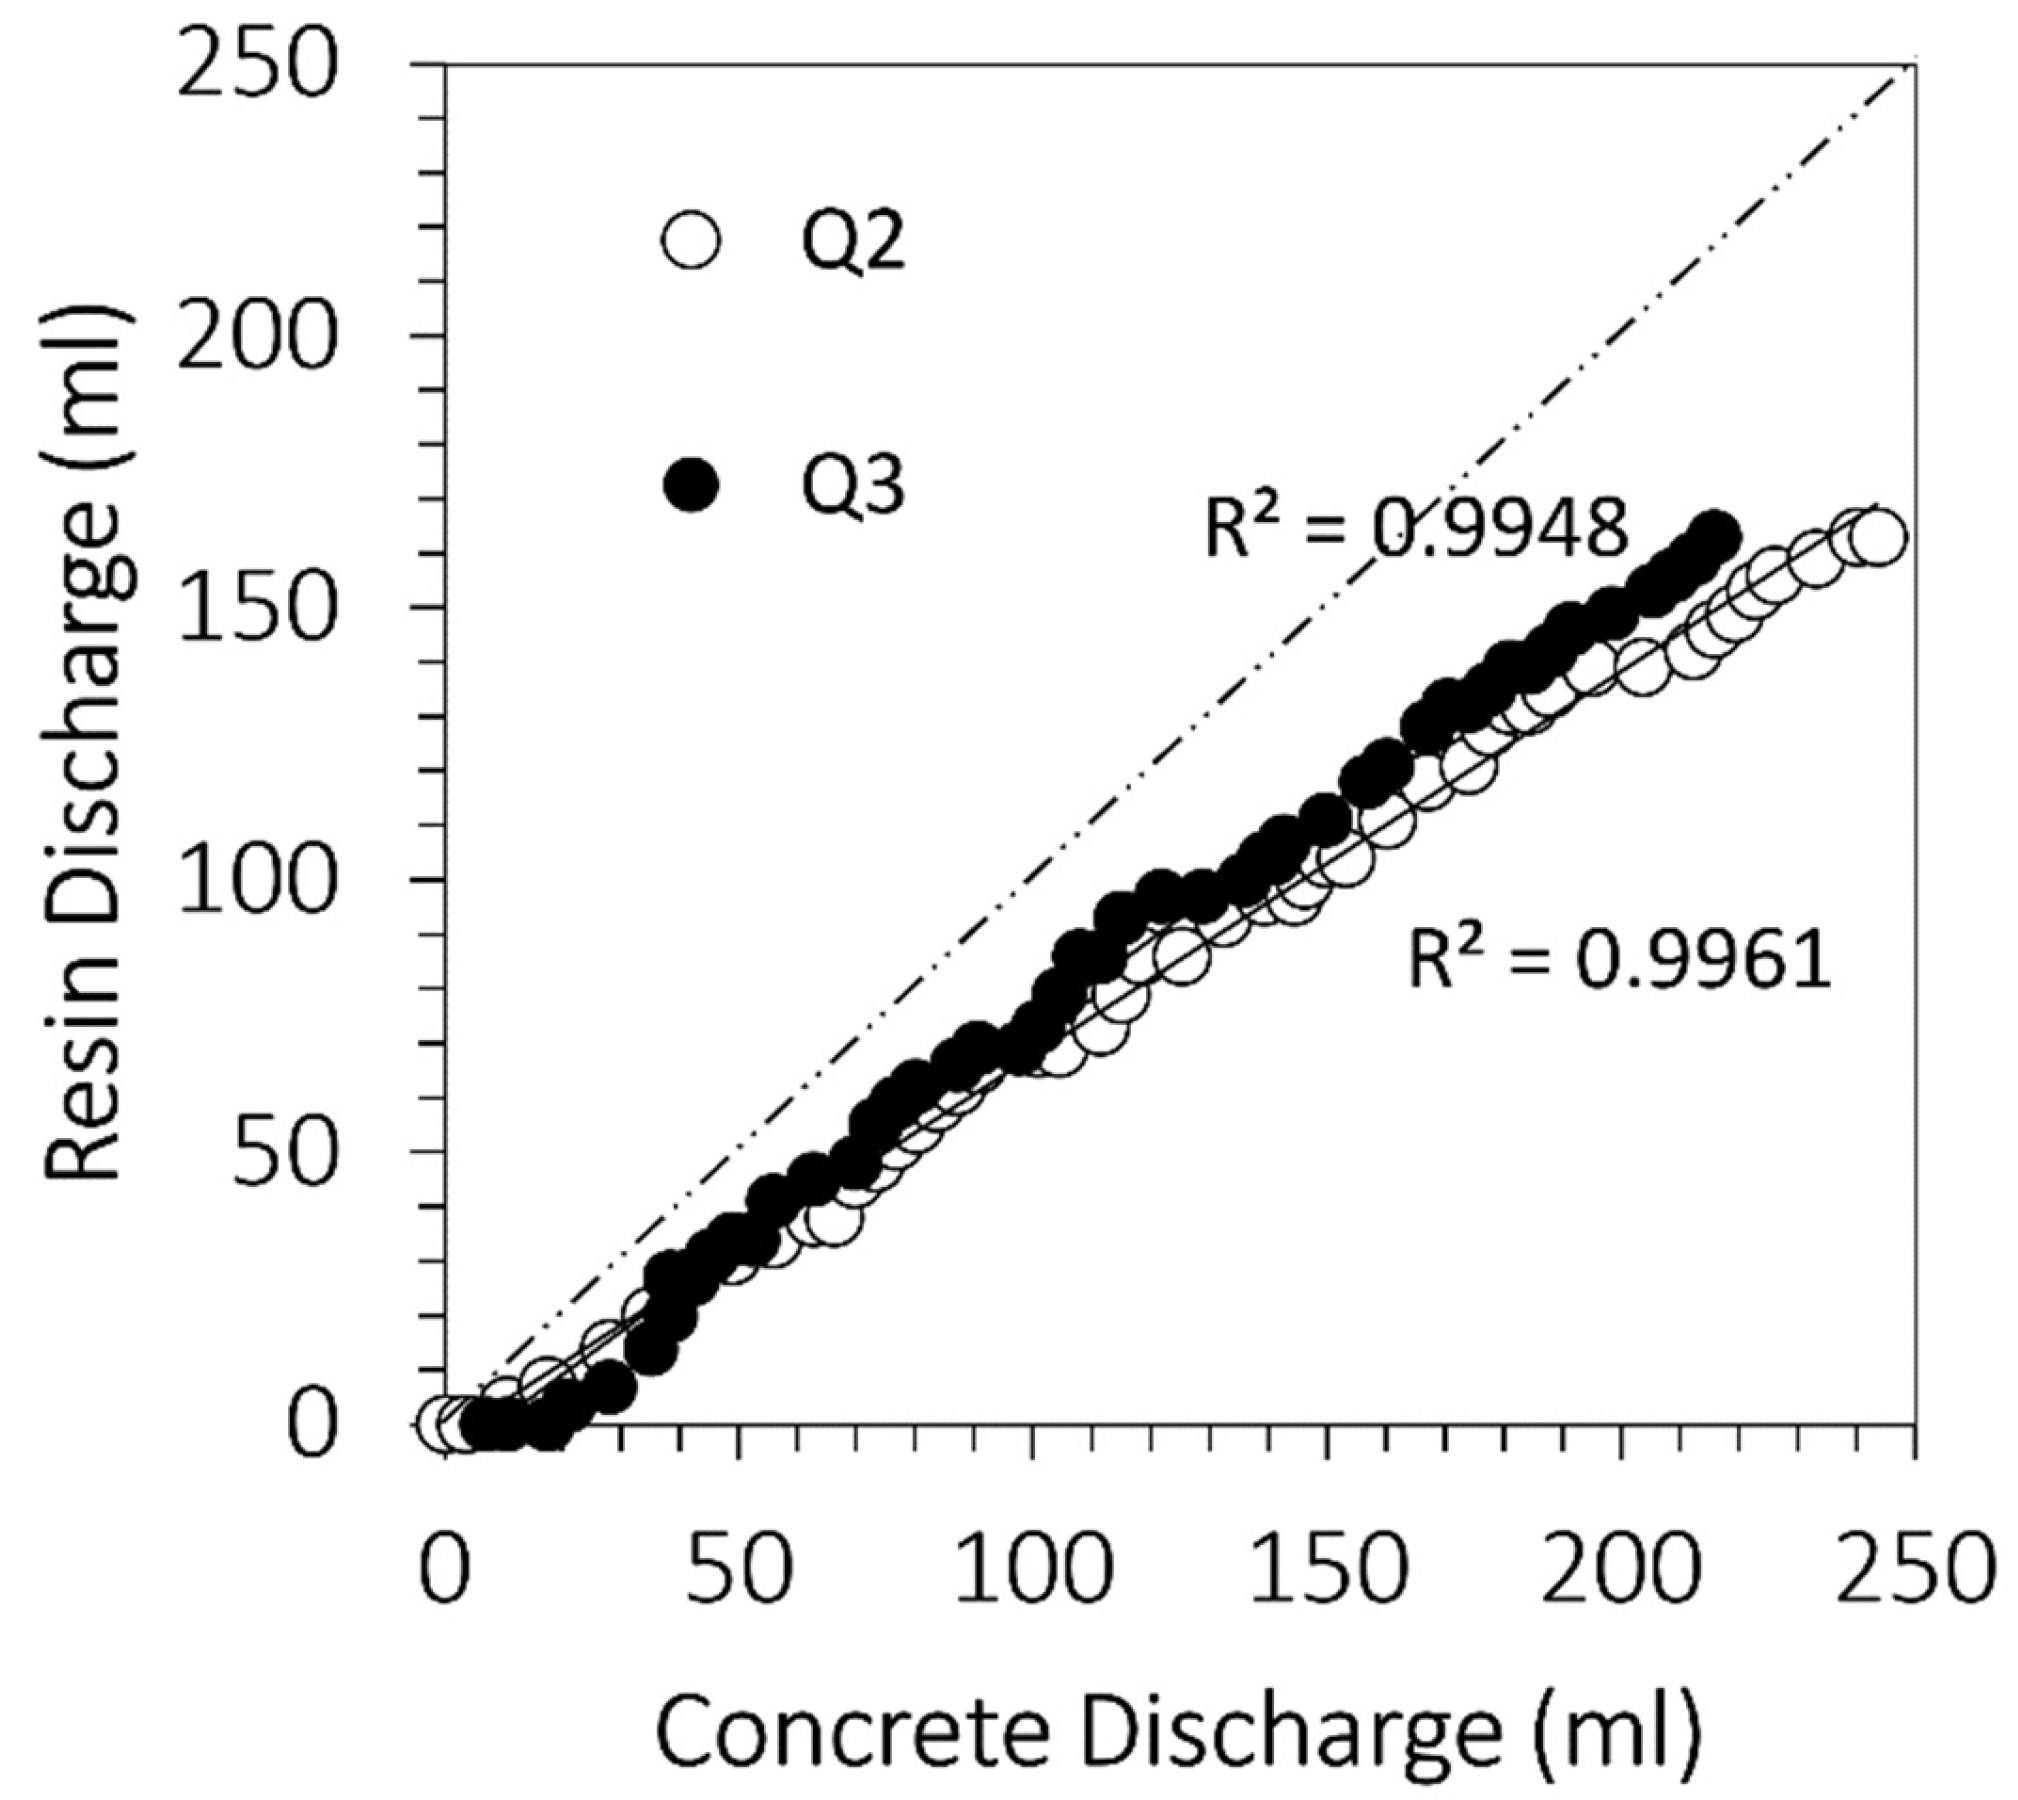
Figure 6 shows a comparison of the maximum discharge rates (Q2 and Q3) between two samples of Fracture-1. Though there is a high correlation (R > 0.9) between the two samples, the expected error is high (RMSE = 38.65), especially at high discharge rates. It is clear from Figure 6 that the epoxy resin samples tend to underestimate maximum discharge rates. The viscosity of epoxy resin is lower than the viscosity of concrete, and hence, the surface is more consistent with plastic mold geometry.
Additionally, according to the difference in properties of resin and concrete, the surface tension and corresponding capillary forces are different.
3.2. Preferential Flow Paths in Dry Fractures
In this section, the flow movement of four inclined single fractures was traced and analyzed.
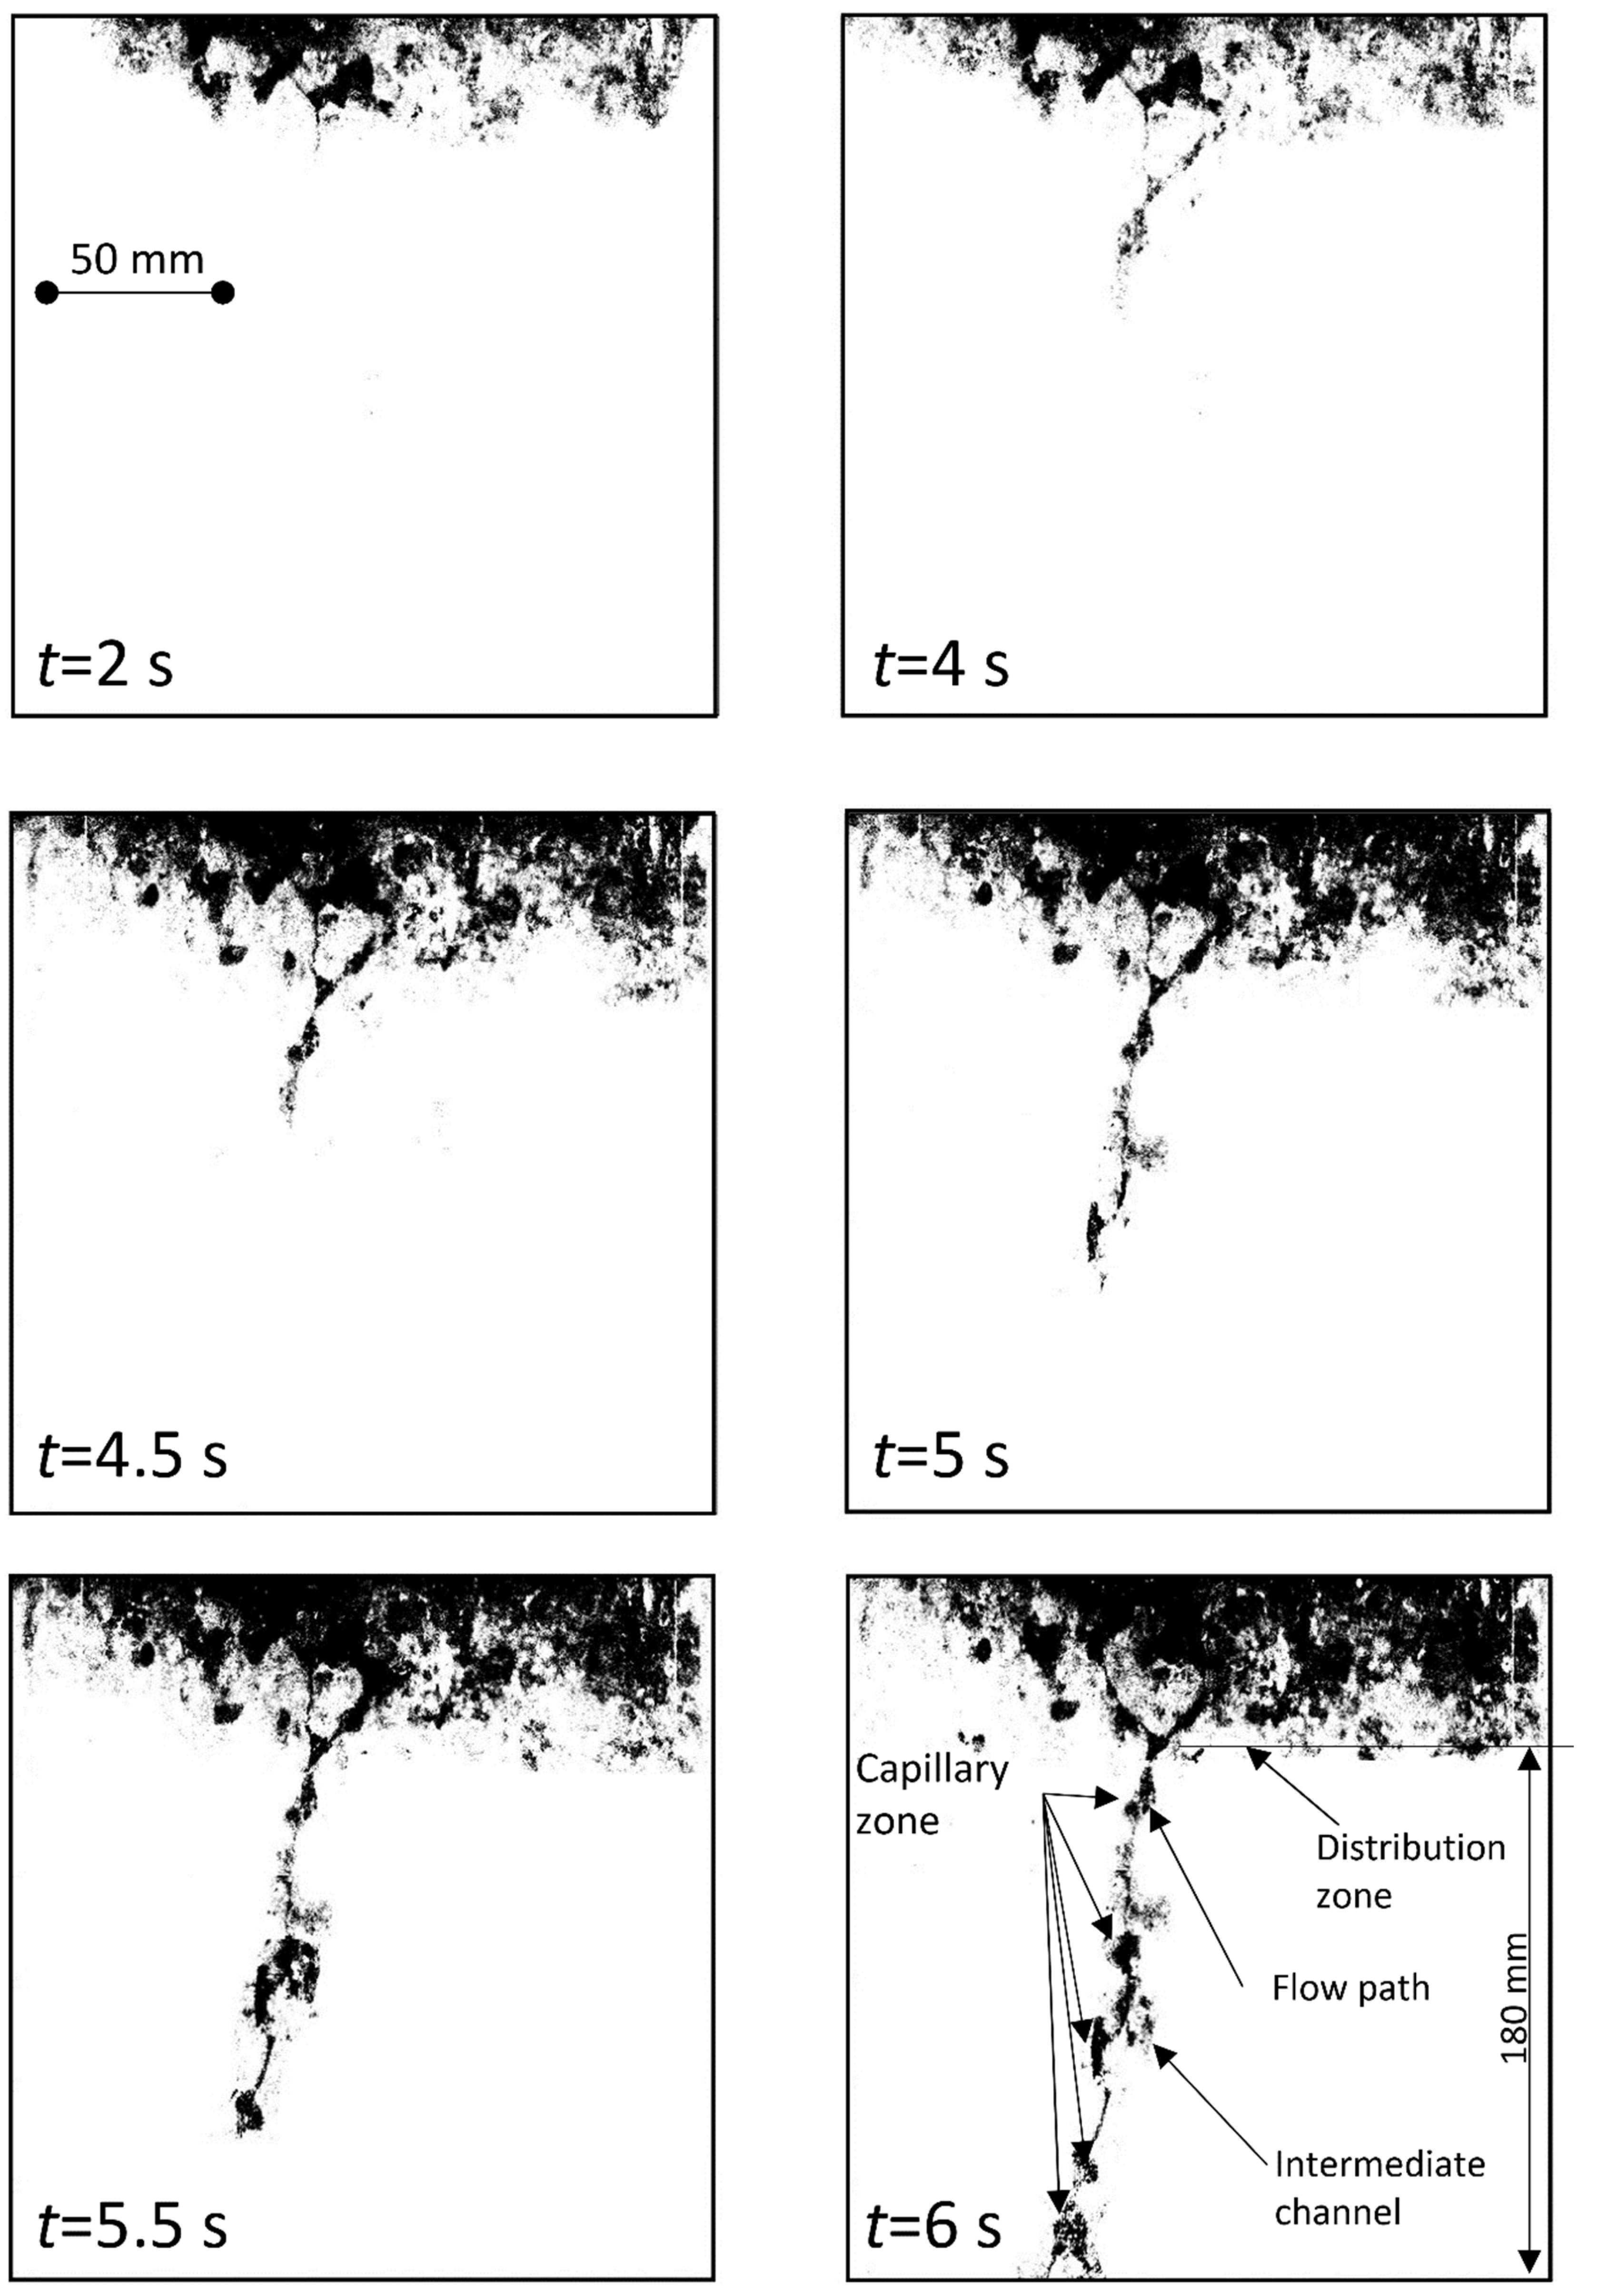
The image of the first finger in the unsaturated Fracture-1 for is shown in Figure 7. As seen in the figure, water first starts to distribute near the inlets, and then (after 4 s), a capillary zone forms and the first flow path is created. The first channel in Figure 7 includes five capillary zones and several small intermediate channels. The travel time and travel distance of the first finger to reach the outlet of the fracture are 6 and 180 , respectively. Thus, the mean velocity of finger in the unsaturated Fracture-1 is about 30 mm/s.
A comparison between the flow path in the dry fracture and the aperture distribution indicates that the first capillary zones are distributed around the area with apertures less than 1.8 . In these areas, capillary forces are enough to overcome the gravitational force, whereas the thin flow channels are observed near the largest apertures. Thus, the width of these capillary zones is influenced by the ratio of gravity force to capillary force, which is a function of fracture inclination. The Bond number (Bo) corresponding to the ratio of gravity force to capillary force, considering the epoxy resin surface tension (0.066 ), contact angle (63°), viscosity of dyed water (), and fracture inclination angle (β = 45°) is approximately 0.7488.
In order to reach the steady condition in flow paths, an experiment was performed for 1 h with a constant head; the results show that the variation of thin preferential channels remains generally unsteady. Many thin preferential paths were created during the first 10 min of the experiment, and then disappeared in the next 10 min. This creation of preferential channels during the first hour of the experiment is periodic, and has an effect on the volume of the five outlets (Figure 4).
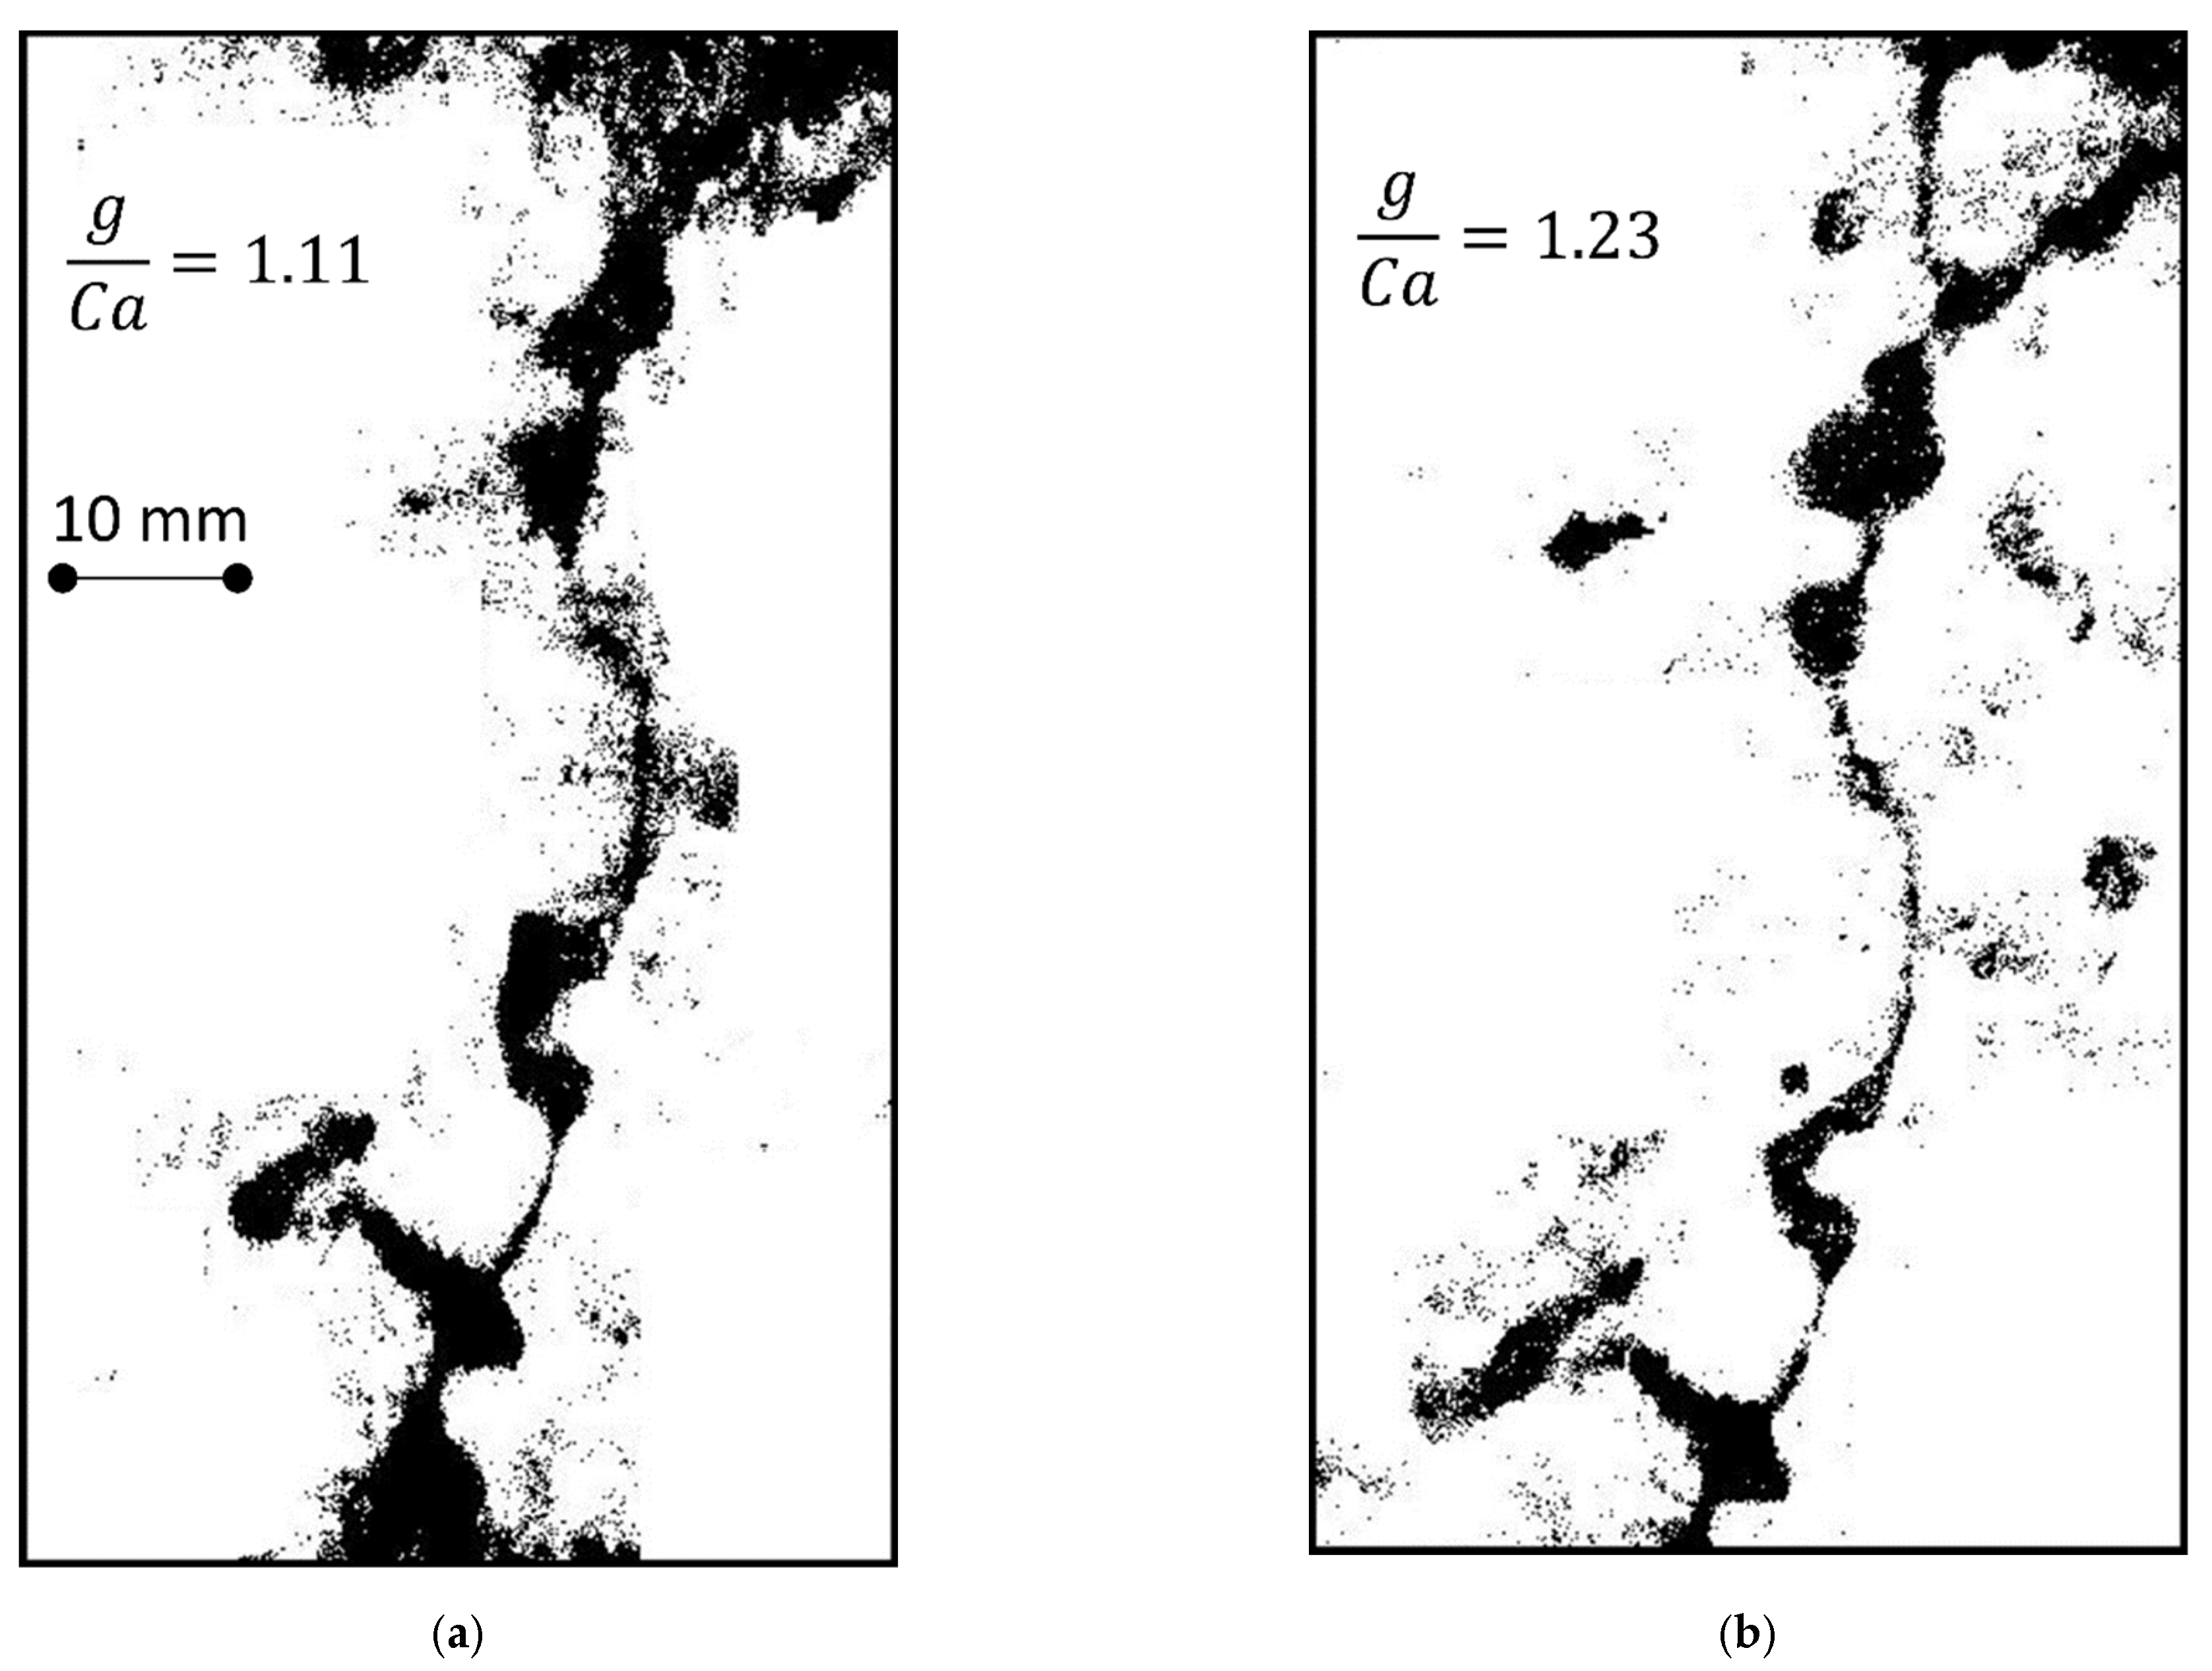
The image of the first flow path for different fracture angles when the water flow has reached the outlet is illustrated in Figure 8. A pixel-by-pixel comparison is performed in order to evaluate the impact of fracture inclination on the shape and travel time of the first flow path.
As highlighted in Figure 8, the variation in inclination angle from 55° to 65° results in an 8% reduction in the mean width of the first flow path, whereas the number of thin preferential channels increases. As shown in Figure 8, the total area of capillary zone is reduced by about 7.5%, while the reduction in width of the thin channels is insignificant.
The reduction in the capillary area corresponds to a 28% increase in the ratio of gravity to capillary force. Moreover, the flow path is divided into two small channels near the outlet. This variation in flow path confirms the change in outlet’s volume by an increasing inclination angle, as demonstrated in Figure 3. Therefore, the flow rate of outlet-2 is split between outlet-2 and outlet-3.
3.3. Effect of Fractal Dimension and Mismatch Length on Preferential Flow Path
In this section, preferential flow pathways in the fractures with different fractal dimensions, different mismatch lengths, and a constant inclination angle (β = 45°) under wet initial conditions are investigated, and the temporal variation of the flow paths is measured.
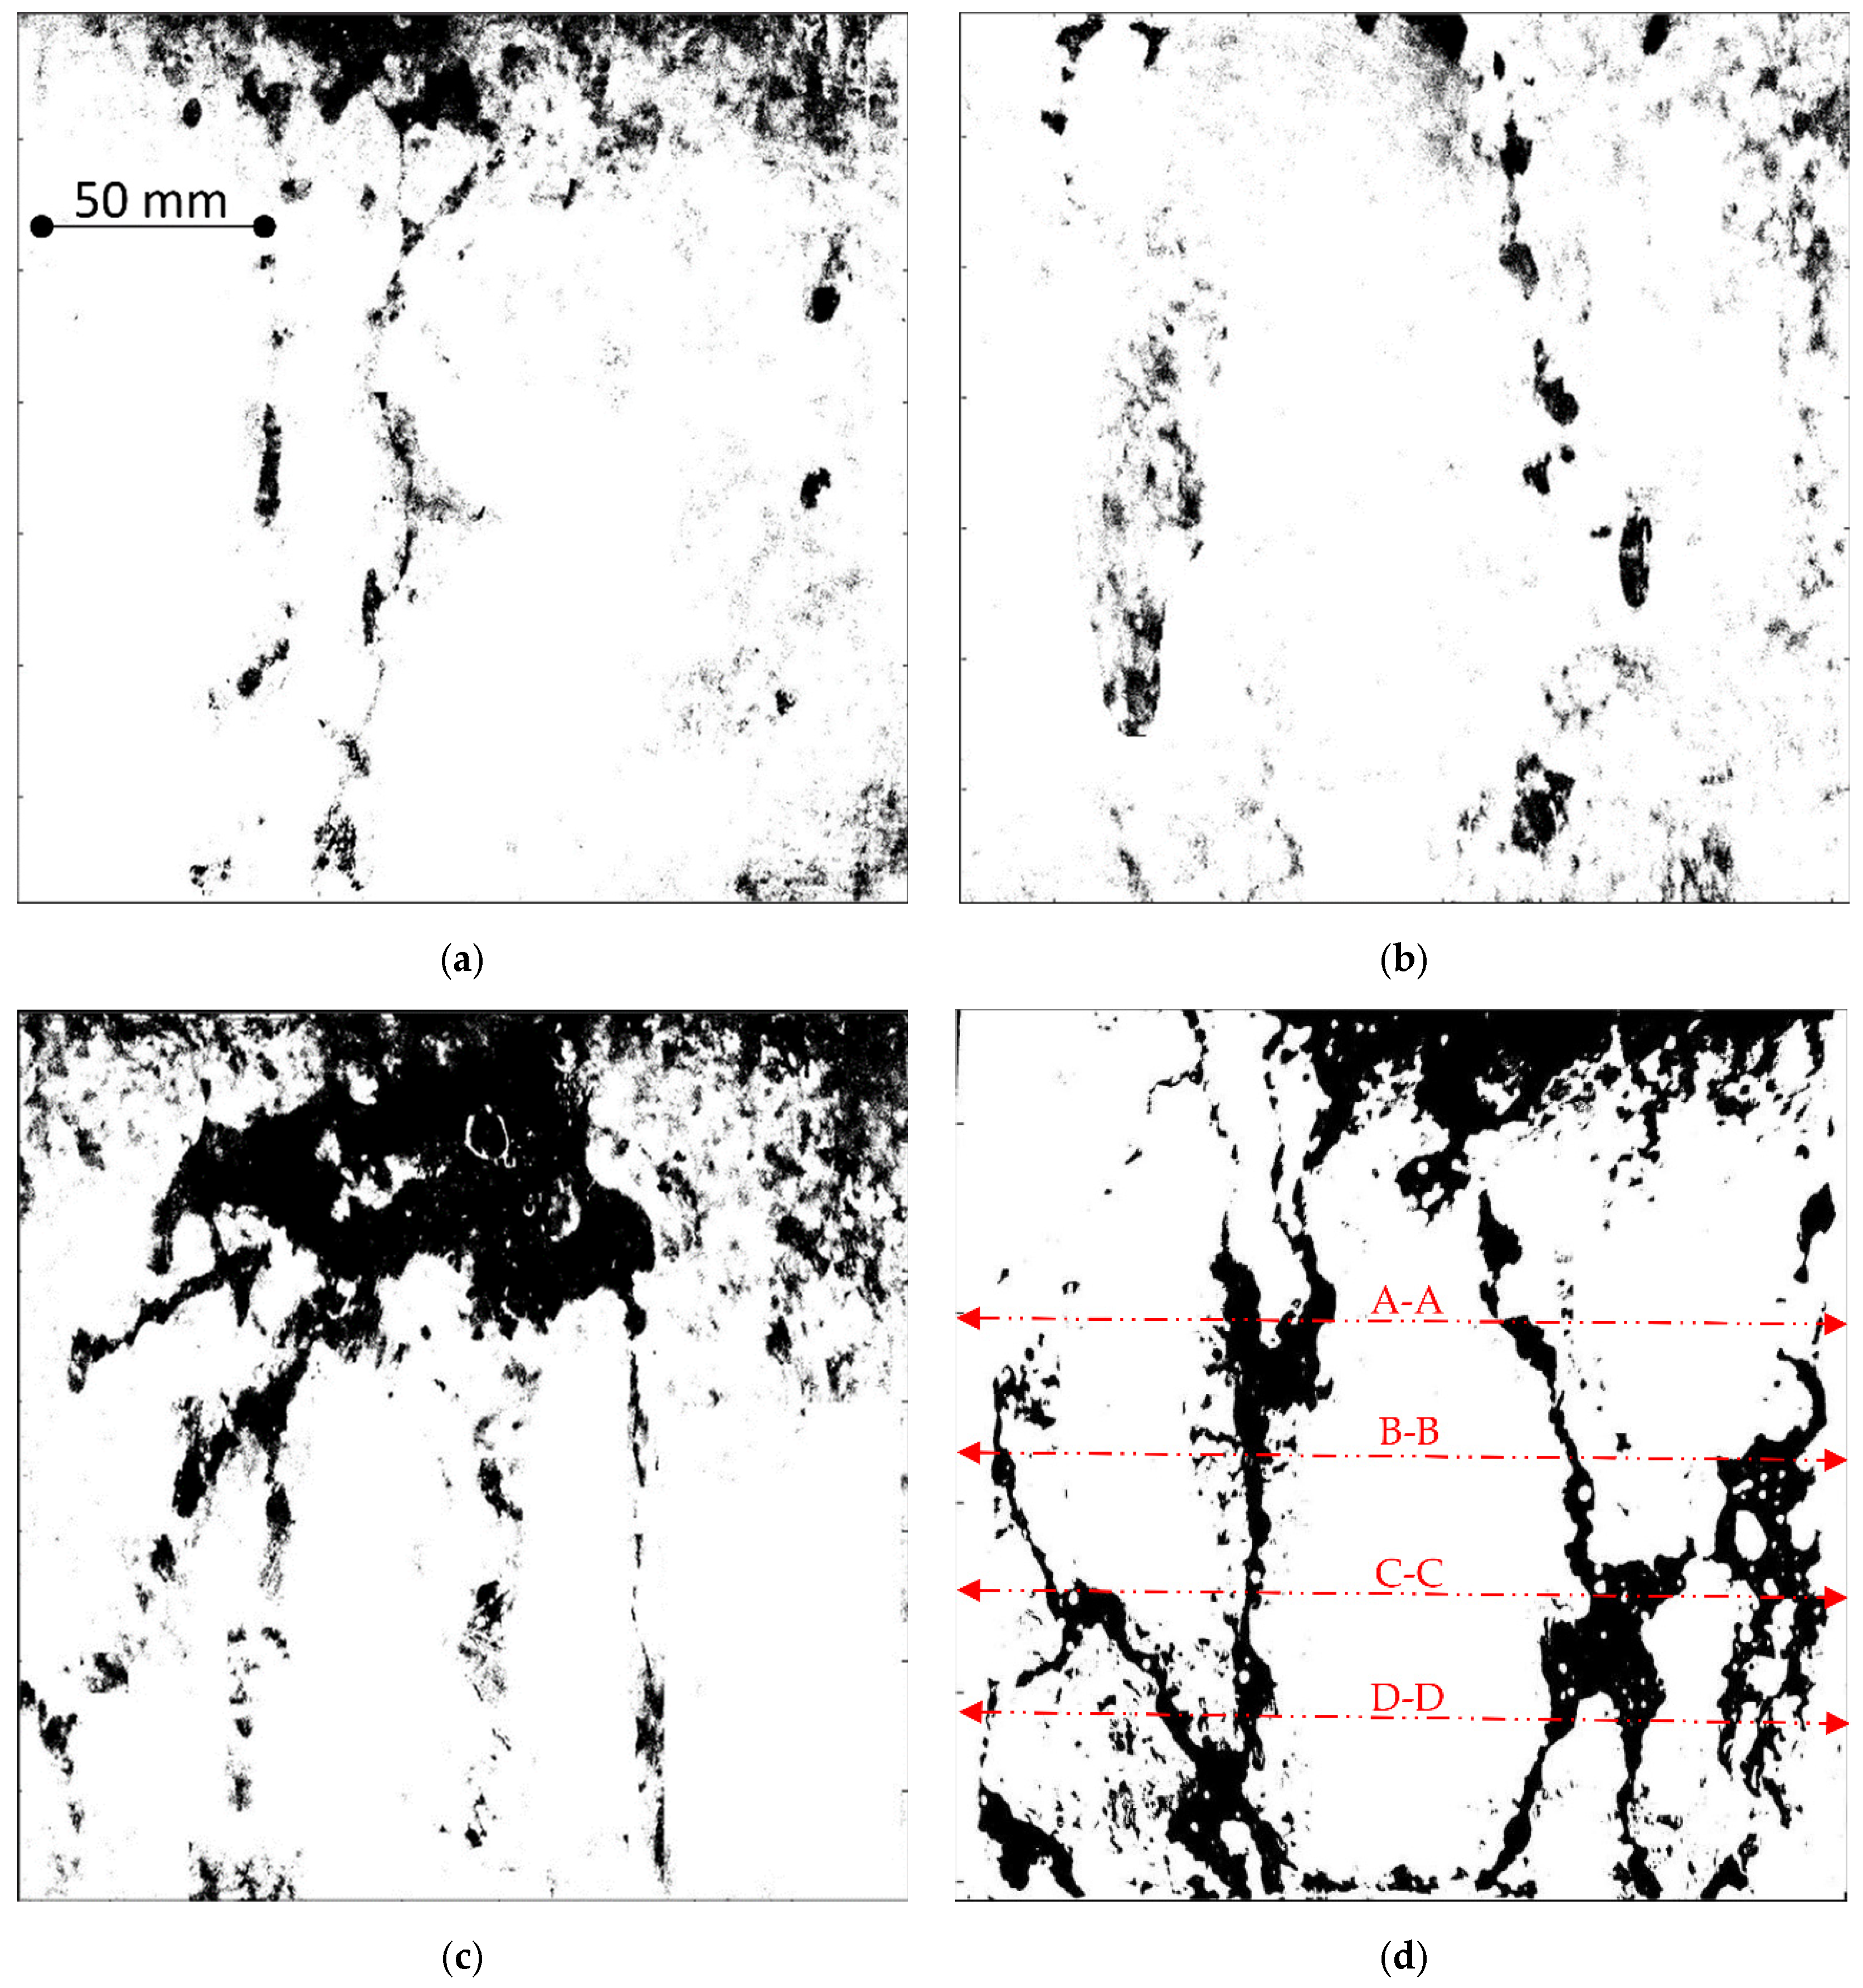
In Fracture-1, about 20 s after the occurrence of the first flow path, two new flow paths occur at the left and right sides (Figure 9a). For Fracture-2, there are many separated preferential flow paths trapped in the wide aperture region (Figure 9b). In Fracture-3, a capillary zone is formed in the presence of small aperture areas at the top and middle parts of the fracture. Successively, about 5 s after the formation of the first flow path, three additional flow paths start to form (Figure 9c). In Fracture-4, the distribution of flow paths is relatively heterogeneous and the flow paths are divided into many thin channels (Figure 9d).
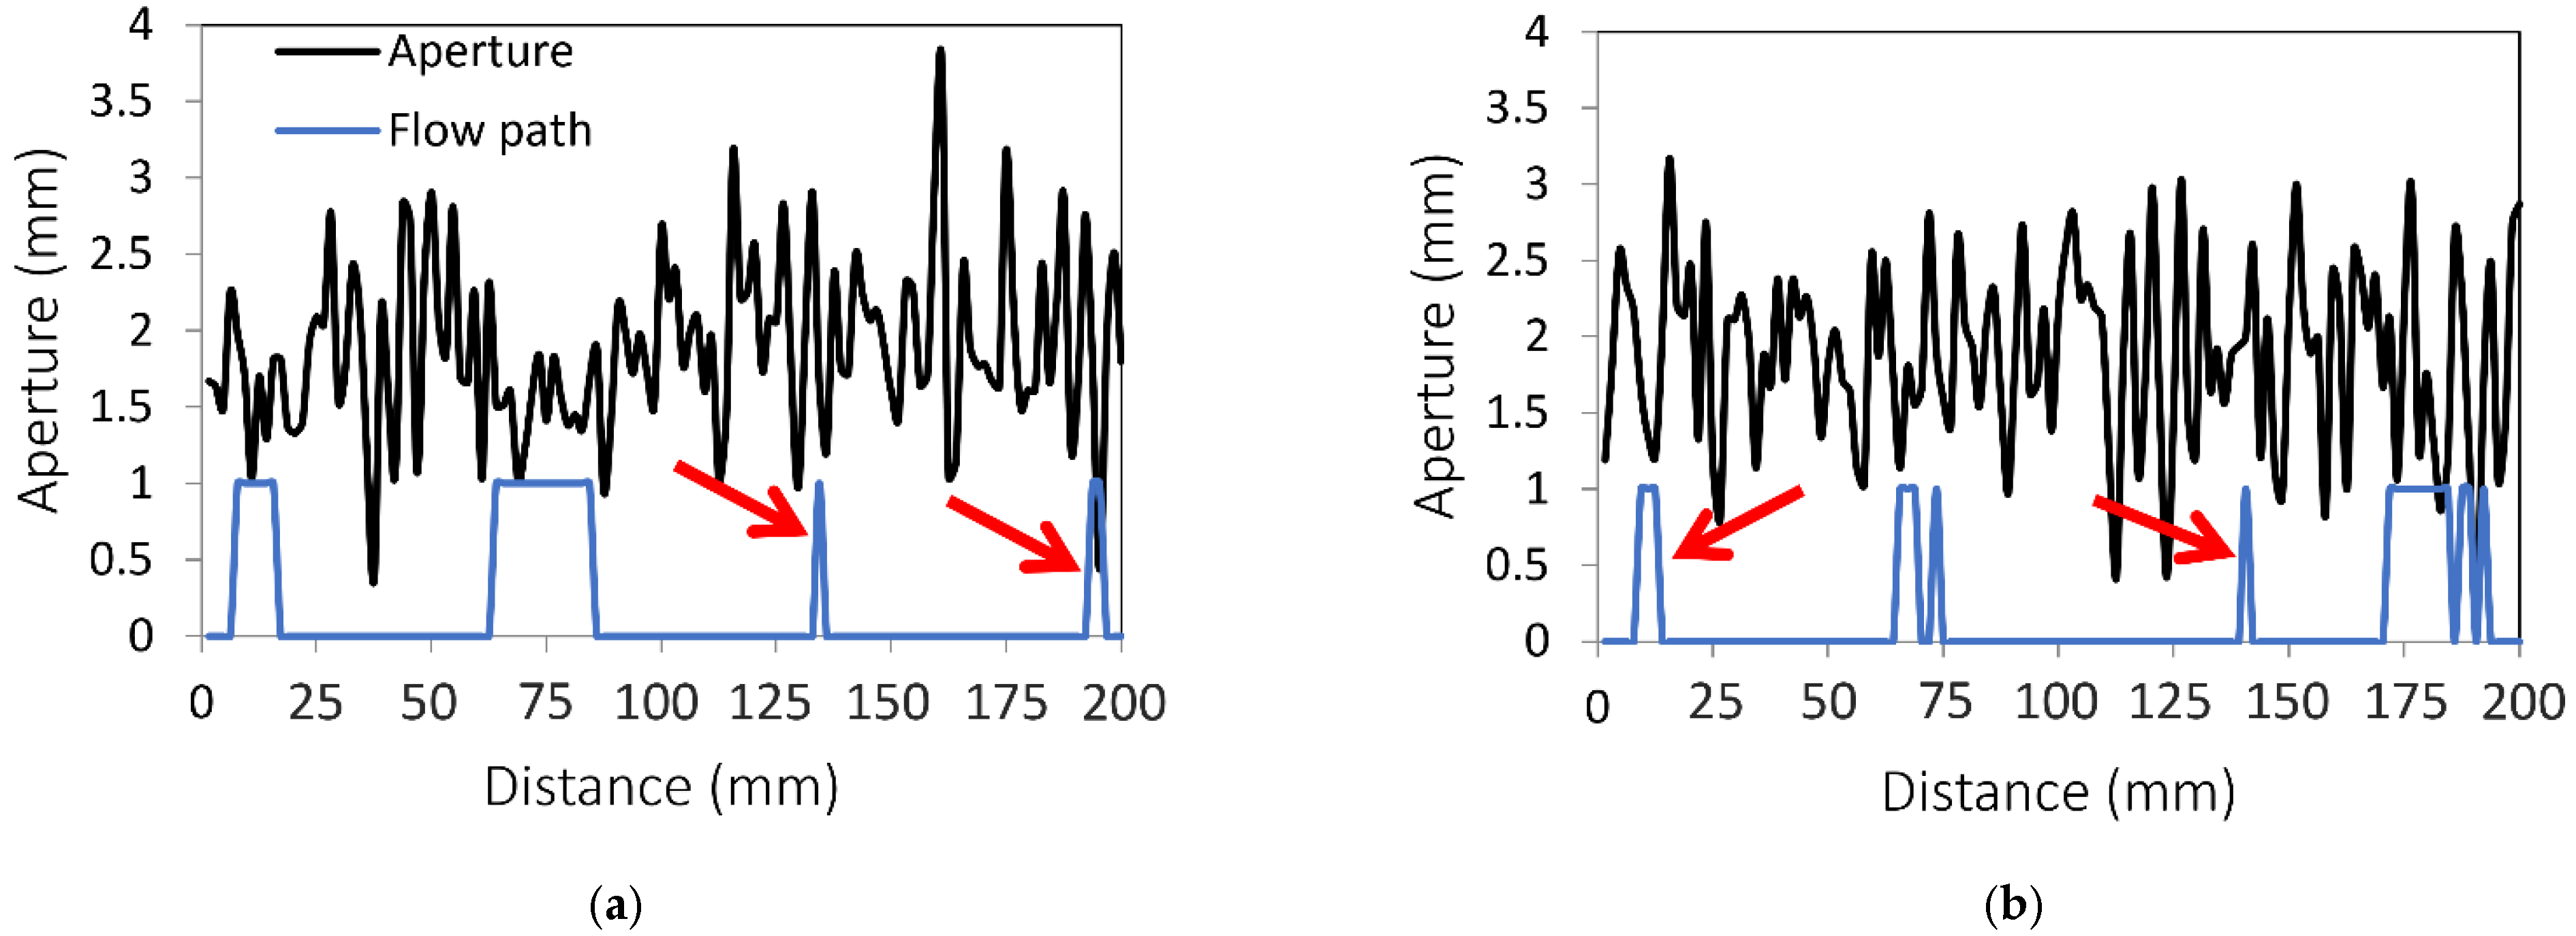
As is shown, the flow path distribution for large values of fractal dimension is homogenous; nevertheless, the width of the flow paths and preferential islands can be related to aperture dimension. Figure 10 shows the flow path along Fracture-4 for different cross sections highlighted in Figure 9d. The maximum and minimum width of the flow path occur near the smallest and largest apertures, respectively. Nevertheless, the maximum value of the flow rate is observed in the portion of the flow path close to the largest apertures (red arrow).
Corresponding to large apertures, flow separation occurs; hence, the width of the flow path is small. The thin preferential channels show generally unsteady characteristics. Table 2 indicates the number of flow paths and intermediate channels about 3 min after the first flow entered the fracture. Although the mean aperture values in Fracture-2 and Fracture-3 are approximately equal, the number of flow paths is significantly influenced by the change in fractal dimension; moreover, fracture inclination has a negligible effect on the number of original flow paths, while the inclination effect on intermediate channels is significant.
A comparison of flow paths at different times (see Table 3) indicates that the number of intermediate channels increased through time, and that the flow rate distribution changed through five outlets. The variation in flow rate is observed in Figure 4, where the slope of the straight lines related to the volume of discharged water varies with the inclinations.
The temporal variation of the intermediate channels (increase or decrease) between 10 and 60 min for different fractures and inclinations is presented in Table 4. It clearly illustrates that, by increasing the fracture inclination and fractal dimension, the number of intermediate flow paths increases and the effect of fractal dimension (see Figure 5) is less than that of inclination (Table 4). Thus, the temporal variation of the flow rate over the fracture outlet is nonlinear, and, hence, predicted by a nonlinear regression algorithm.
3.4. Prediction of Total Flow Rate
The input samples which were used for training the M5 tree are fractal dimension, standard deviation, and mismatch length of the fracture with different inclinations. These parameters are used to predict the temporal variation of flow rate in five outlets as outputs of the M5 tree. In order to remove the scale impact, non-dimensional forms of these inputs were considered for the construction of the M5 tree (see Table 5). As demonstrated in Equation (8), permeability of the preferential channels as well as their location are functions of and , respectively. The M5 tree was generated using 75% of the experimental dataset, and was validated by 25% of samples. Due to the small number of training samples, the hold out technique was used to split the testing and training database [48]. The range of parameters used for training the M5 tree is presented in Table 4. Several types of parameters are tested, and the matched formula with experiment results is selected.
The generated linear relations for the pruned tree by two nodes and three leaves (see Table 5) indicate that by increasing the fractal dimension, the total flow volume increases. RMSE index 3.54 mL/min suggests that the relations generated by the tree model are the most accurate. The sensitivity analyses of the impact of on the total flow volume of the fracture () showed that there is a meaningful relation between and and that the influence of the other parameters is negligible. as a function of fractal dimension, is the most significant characterization of fracture geometry affecting in all three relations. The minimum variation in through time corresponds to .
3.5. Prediction of Flow Rate Time Series
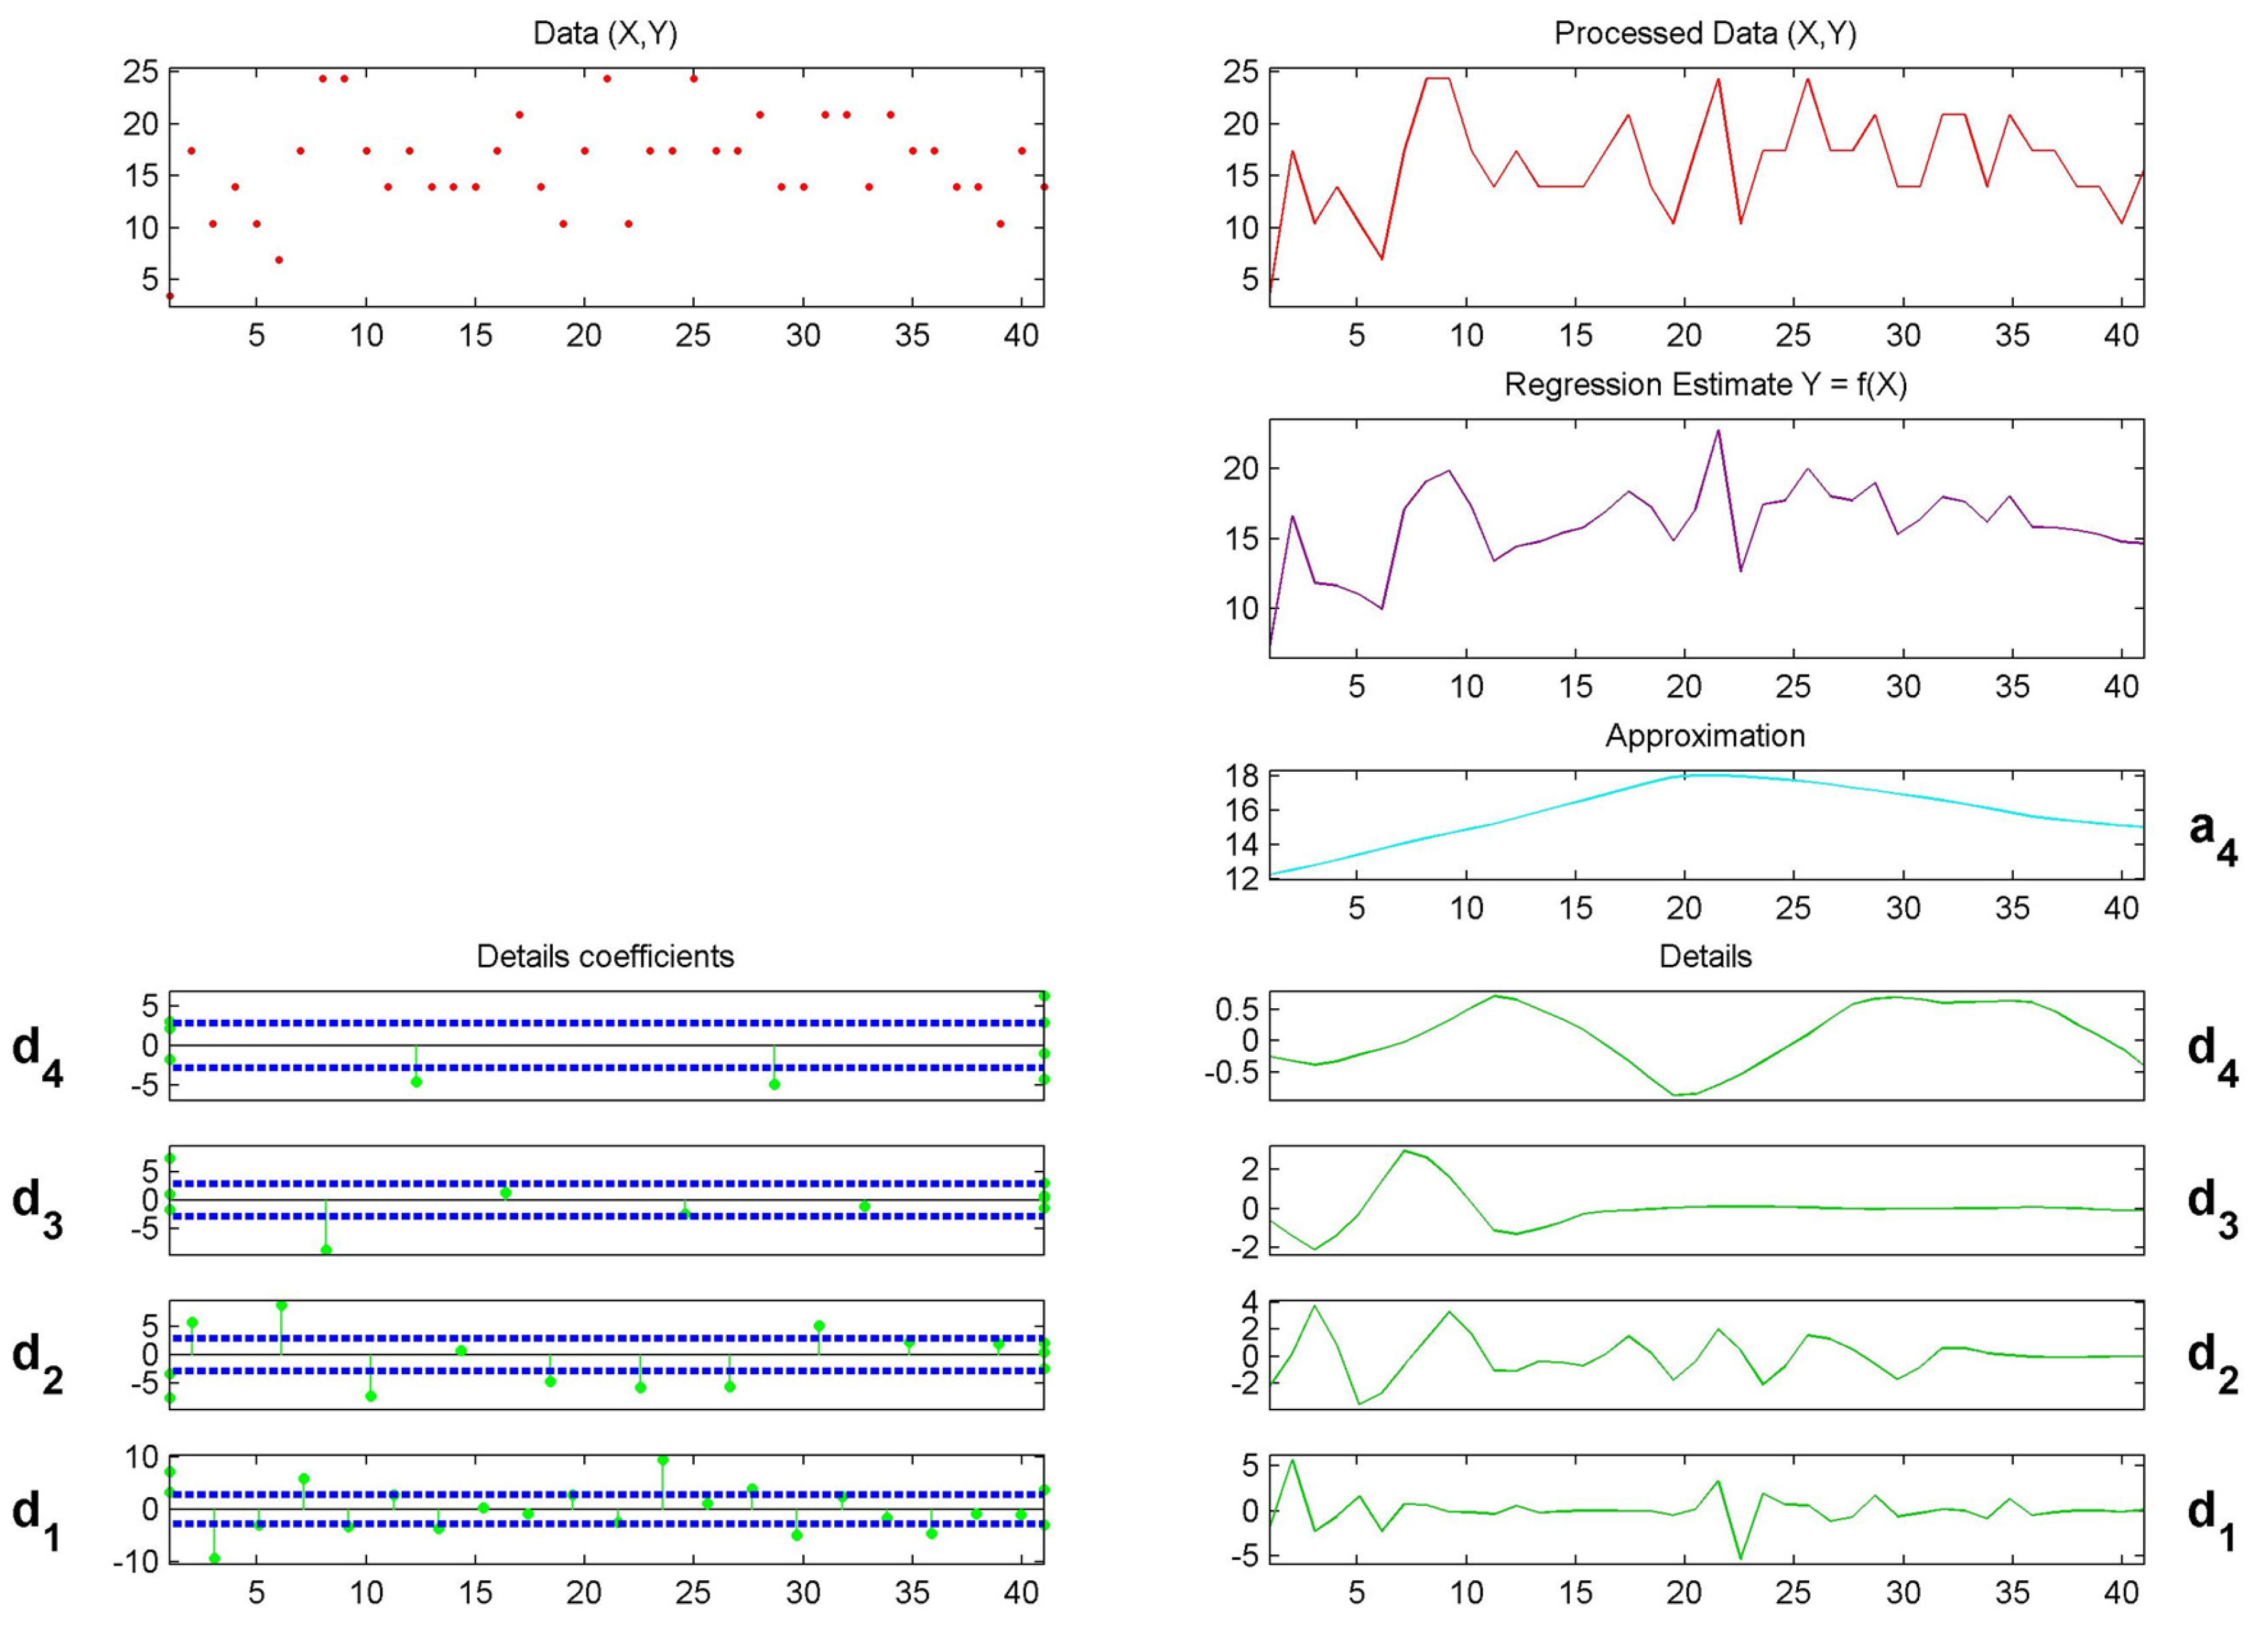
In order to find the best performance of the Wavelet model, different Wavelet functions were analyzed, and finally, the Laplacian operator function was selected. The Wavelet algorithm was trained with the flow rate time series of Fracture-1, Fracture-2, and Fracture-3, and was validated with Fracture-4. The optimal value of neurons was computed by trial and error as four neurons. The training data of the flow rate with second-long time steps were decomposed using four layers, including and (see Figure 11). At the decomposition step, an unscaled noise structure with a heuristic threshold technique was selected.
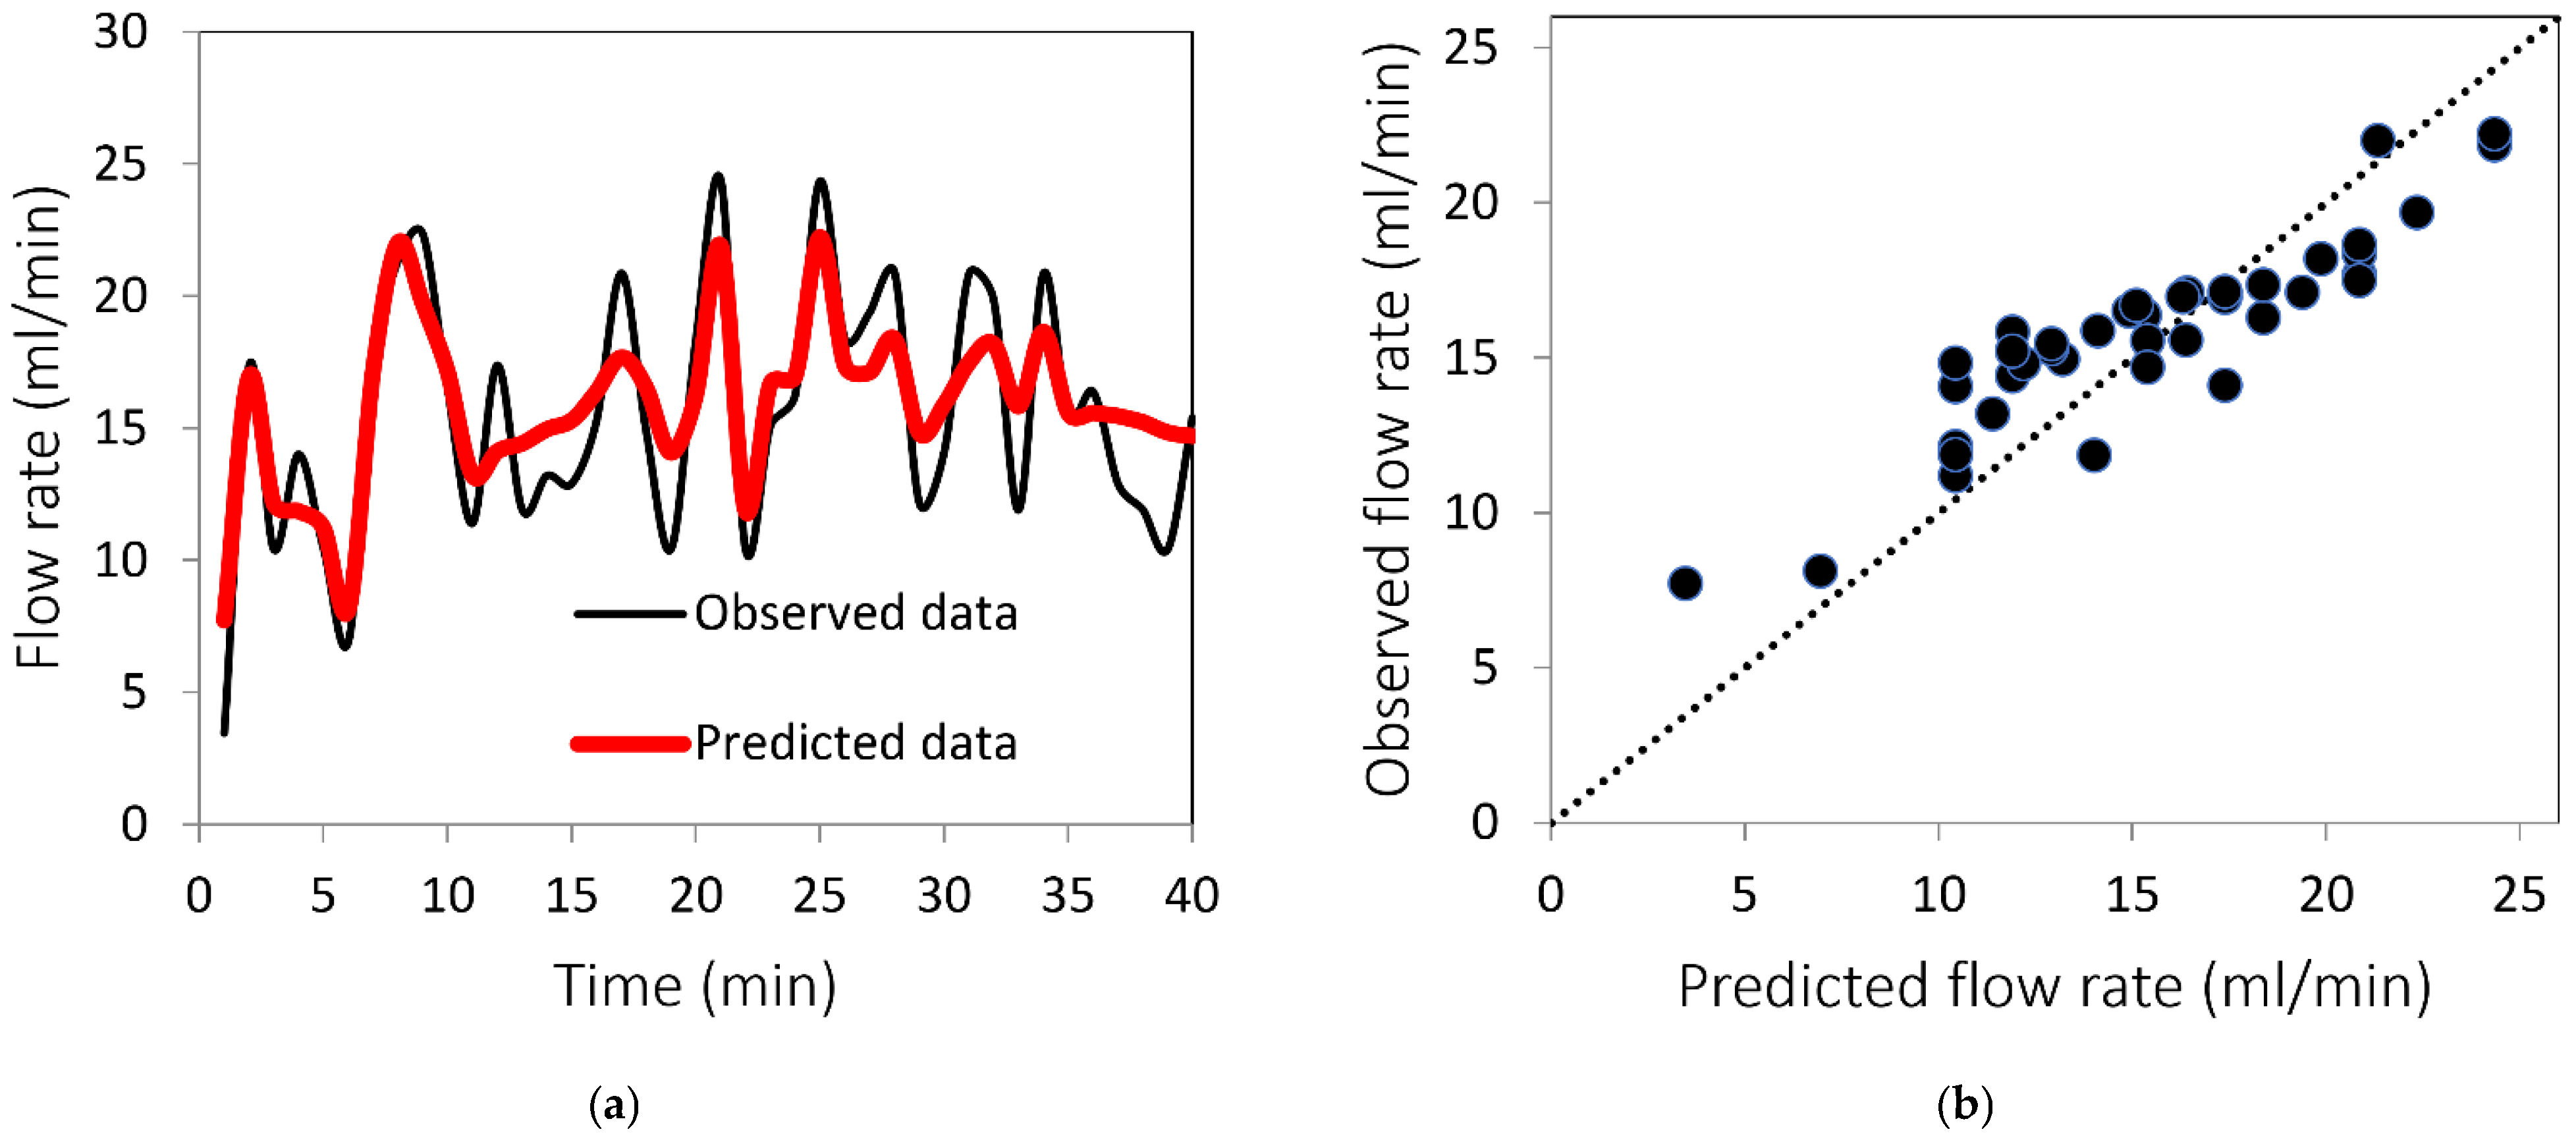
The time series of the predicted flow rate by Wavelet analysis and observed experimental data in the validation step (about 25% of samples) is illustrated in Figure 12. As shown in Figure 12, the estimated values of the Wavelet model, with a Nash value of 0.81 and RMSE = 3.21, are concentrated near the best-fitting line for the observed data (R = 1). Although the negative value of the mean error (−3.72) indicates that the predicted values are relatively underestimated (see Figure 12), the error between the predicted peak flow rate and observed peak value is negligible. This underestimation of the flow rate can be attributed to the impact of fractal dimension and mismatch length, which was neglected in the training of the Wavelet model. As mentioned above, the Wavelet model was trained using the flow rate time series of the three fractures, and was then implemented for the prediction of Fracture-4. Thus, the periodic fluctuations of flow rate time series over the fracture outlet can be estimated with an optimal Wavelet model.
4. Conclusions
Analyzing infiltration patterns in fractured rock is crucial for the understanding of recharge processes in fractured rock aquifers.
In this study, experiments on preferential flow paths over inclined fractures were conducted under different geometric characteristics of synthetic fractures, such as fractal dimension, standard deviation, and mismatch length. The results indicated that a variation in the inclination angle of dry fracture from 55° to 65° resulted in an 8% reduction in the mean width of the first flow path. This reduction occurred mostly in the capillary regions, whereas the number of thin preferential channels near the outlet increased. The reduction in the capillary area corresponded to a 28% increase in the ratio of gravity to capillary force.
Moreover, there is a direct relationship between the fracture inclination angle and the number of preferential channels near the outlet. The assessment of flow pathways in the saturated fracture reveals that the number of flow paths and their locations is a function of fractal dimension values, while a change in mismatch length only changes the flow rate. However, no linear relationship has been found between the number of flow paths and the magnitude of fractal dimension. By means of a sensitivity analysis, a linear relation has been detected between the flow rate and the exponential form of the fractal dimension. In addition, the influence of mismatch length on the flow pathways has been found to be negligible.
The results also demonstrate that the maximum width of the preferential channels belongs to the area with the smallest aperture, whereas flow separates near the largest aperture. Moreover, the variation in these thin preferential channels near the fracture outlet is generally unsteady, which results in a nonlinear flow rate in each outlet. Finally, an efficient Wavelet algorithm calibrated across experimental data predicted the time series of the flow rate with a Nash value of 0.81.
Laboratory-scale fracture flow experiments fill critical knowledge gaps by providing direct observations and measurements of fracture geometry and flow under controlled conditions that cannot be obtained in the field. However, the conducted experimental investigations on infiltration dynamics in a single fracture should be viewed as proof-of-concept analysis, and they are not to be considered exhaustive. Future research on fracture flow can be directed towards prediction uncertainty of flow rates at the fracture outlet, due to different realizations of fracture apertures. For this purpose, it will be necessary to link the Wavelet algorithm with a numerical model calibrated with the experimental data.
Author Contributions
Conceptualization, A.R., C.C. and N.P.; Methodology, C.C. and N.P.; Validation, C.C. and N.P.; Resources, A.R. and C.C.; Data Curation, C.C. and N.P.; Writing—Original Draft Preparation, A.R.; Writing—Review and Editing, C.C., N.P.; Supervision, C.C. and N.P.; Project Administration, C.C.; Funding Acquisition, C.C. All authors have read and agreed to the published version of the manuscript.
Funding
The work is funded by the Start Up Grant awarded by The University of Queensland (Australia).
Institutional Review Board Statement
Not applicable.
Informed Consent Statement
Not applicable.
Data Availability Statement
Not applicable.
Conflicts of Interest
The authors declare no conflict of interest.
References
- Caplan, J.S.; Giménez, D.; Hirmas, D.R.; Brunsell, N.A.; Blair, J.M.; Knapp, A.K. Decadal-scale shifts in soil hydraulic properties as induced by altered precipitation. Sci. Adv. 2019, 5, eaau6635. [Google Scholar] [CrossRef] [PubMed] [Green Version]
- Hirmas, D.R.; Giménez, D.; Nemes, A.; Kerry, R.; Brunsell, N.; Wilson, C.J. Climate-induced changes in continental-scale soil macroporosity may intensify water cycle. Nature 2018, 561, 100–103. [Google Scholar] [CrossRef] [PubMed]
- Salve, R.; Ghezzehei, T.A.; Jones, R. Infiltration into fractured bedrock. Water Resour. Res. 2008, 44, W01434. [Google Scholar] [CrossRef] [Green Version]
- Faybishenko, B.; Bodvarsson, G.S.; Salve, R. On the physics of unstable infiltration, seepage, and gravity drainage in partially saturated tuffs. J. Contam. Hydrol. 2003, 62–63, 63–87. [Google Scholar] [CrossRef] [Green Version]
- Cherubini, C.; Giasi, C.I.; Pastore, N. Bench scale laboratory tests to analyze non-linear flow in fractured media. Hydrol. Earth Syst. Sci. 2012, 16, 2511–2522. [Google Scholar] [CrossRef] [Green Version]
- Ishibashi, T.; Watanabe, N.; Hirano, N.; Okamoto, A.; Tsuchiya, N. GeoFlow: A novel model simulator for prediction of the 3-D channeling flow in a rock fracture network. Water Resour. Res. 2012, 48, W07601. [Google Scholar] [CrossRef]
- Snow, D.T. A Parallel Plate Model of Fractured Permeable Media. Ph.D. Thesis, University of California, Berkeley, CA, USA, 1965. [Google Scholar]
- Huitt, J.L. Fluid Flow in Simulated Fractures. Am. Inst. Chem. Eng. J. 1955, 2, 259–264. [Google Scholar] [CrossRef]
- Noiriel, C.; Gouze, P.; Madé, B. 3D analysis of geometry and flow changes in a limestone fracture during dissolution. J. Hydrol. 2013, 486, 211–223. [Google Scholar] [CrossRef]
- Ge, S. A governing equation for fluid flow in rough fractures. Water Resour. Res. 1997, 33, 53–61. [Google Scholar] [CrossRef]
- Zimmerman, R.W.; Yeo, I.-W. Fluid flow in rock fractures: From the Navier-Stokes equations to the cubic law. Geophys. Monogr.-Am. Geophys. Union 2000, 122, 213–224. [Google Scholar]
- Kishida, K.; Sawada, A.; Yasuhara, H.; Hosoda, T. Estimation of fracture flow considering the inhomogeneous structure of single rock fractures. Soils Found. 2013, 53, 105–116. [Google Scholar] [CrossRef]
- Crandall, D.; Bromhal, G.; Karpyn, Z.T. Numerical simulations examining the relationship between wall-roughness and fluid flow in rock fractures. Int. J. Rock Mech. Min. Sci. 2010, 47, 784–796. [Google Scholar] [CrossRef]
- Liu, R.; Jiang, Y.; Li, B.; Wang, X. A fractal model for characterizing fluid flow in fractured rock masses based on randomly distributed rock fracture networks. Comput. Geotech. 2015, 65, 45–55. [Google Scholar] [CrossRef] [Green Version]
- Li, J.; Cherubini, C.; Torres, S.A.G.; Li, Z.; Pastore, N.; Li, L. Laboratory Investigation of Flow Paths in 3D Self-Affine Fractures with Lattice Boltzmann Simulations. Energies 2018, 11, 168. [Google Scholar] [CrossRef] [Green Version]
- Javadi, M.; Sharifzadeh, M.; Shahriar, K.; Mitani, Y. Critical Reynolds number for nonlinear flow through rough-walled fractures: The role of shear processes. Water Resour. Res. 2014, 50, 1789–1804. [Google Scholar] [CrossRef] [Green Version]
- Zou, L.; Jing, L.; Cvetkovic, V. Shear-enhanced nonlinear flow in rough-walled rock fractures. Int. J. Rock Mech. Min. Sci. 2017, 97, 33–45. [Google Scholar] [CrossRef] [Green Version]
- Zhang, W.; Dai, B.; Liu, Z.; Zhou, C. A pore-scale numerical model for non-Darcy fluid flow through rough-walled fractures. Comput. Geotech. 2017, 87, 139–148. [Google Scholar] [CrossRef]
- Wang, L.; Cardenas, M.B. Non-Fickian transport through two-dimensional rough fractures: Assessment and prediction. Water Resour. Res. 2014, 50, 871–884. [Google Scholar] [CrossRef]
- Chen, Y.-F.; Guo, N.; Wu, D.-S.; Hu, R. Numerical investigation on immiscible displacement in 3D rough fracture: Comparison with experiments and the role of viscous and capillary forces. Adv. Water Resour. 2018, 118, 39–48. [Google Scholar] [CrossRef]
- Su, G.W.; Geller, J.T.; Pruess, K.; Wen, F. Experimental studies of water seepage and intermittent flow in unsaturated, rough-walled fractures. Water Resour. Res. 1999, 35, 1019–1037. [Google Scholar] [CrossRef]
- Watanabe, N.; Hirano, N.; Tsuchiya, N. Determination of aperture structure and fluid flow in a rock fracture by high-resolution numerical modeling on the basis of a flow-through experiment under confining pressure. Water Resour. Res. 2008, 44, W06412. [Google Scholar] [CrossRef]
- Khan, F.; Enzmann, F.; Kersten, M. Beam-hardening correction by a surface fitting and phase classification by a least square support vector machine approach for tomography images of geological samples. Solid Earth Discuss. 2015, 7, 3383–3408. [Google Scholar]
- Schill, E.; Genter, A.; Cuenot, N.; Kohl, T. Hydraulic performance history at the Soultz EGS reservoirs from stimulation and long-term circulation tests. Geothermics 2017, 70, 110–124. [Google Scholar] [CrossRef]
- Stoll, M.; Huber, F.; Trumm, M.; Enzmann, F.; Meinel, D.; Wenka, A.; Schill, E.; Schäfer, T. Experimental and numerical investigations on the effect of fracture geometry and fracture aperture distribution on flow and solute transport in natural fractures. J. Contam. Hydrol. 2018, 221, 82–97. [Google Scholar] [CrossRef]
- Ghezzehei, T.A.; Or, D. Liquid fragmentation and intermittent flow regimes in unsaturated fractured media. Water Resour. Res. 2005, 41, W12406. [Google Scholar] [CrossRef] [Green Version]
- Phillips, T.; Bultreys, T.; Bisdom, K.; Kampman, N.; Van Offenwert, S.; Mascini, A.; Cnudde, V.; Busch, A. A Systematic Investigation Into the Control of Roughness on the Flow Properties of 3D-Printed Fractures. Water Resour. Res. 2021, 57, ewrcr-25233. [Google Scholar] [CrossRef]
- Suzuki, A.; Minto, J.M.; Watanabe, N.; Li, K.; Horne, R.N. Contributions of 3D Printed Fracture Networks to Development of Flow and Transport Models. Transp. Porous Media 2018, 129, 485–500. [Google Scholar] [CrossRef] [Green Version]
- Suzuki, A.; Bjarkason, E.K.; Yamaguchi, A.; Hawkins, A.J.; Hashida, T. Estimation of flow-channel structures with uncertainty quantification: Validation by 3D-printed fractures and field application. Geothermics 2022, 105, 102480. [Google Scholar] [CrossRef]
- Yang, W.; Zhang, D.; Lei, G. Experimental study on multiphase flow in fracture-vug medium using 3D printing technology and visualization techniques. J. Pet. Sci. Eng. 2020, 193, 107394. [Google Scholar] [CrossRef]
- Yin, P.; Zhao, C.; Ma, J.; Yan, C.; Huang, L. Experimental study of non-linear fluid flow though rough fracture based on fractal theory and 3D printing technique. Int. J. Rock Mech. Min. Sci. 2020, 129, 104293. [Google Scholar] [CrossRef]
- Brown, S.R. Simple mathematical model of a rough fracture. J. Geophys. Res. Earth Surf. 1995, 100, 5941–5952.7. [Google Scholar] [CrossRef]
- Brown, S.R. A note on the description of surface roughness using fractal dimension. Geophys. Res. Lett. 1987, 14, 1095–1098. [Google Scholar] [CrossRef]
- Charkaluk, E.; Bigerelle, M.; Iost, A. Fractals and fracture. Eng. Fract. Mech. 1998, 61, 119–139. [Google Scholar] [CrossRef]
- Mandelbrot, B.B. The Fractal Geometry of Nature, 3rd ed.; W.H. Freeman and Company: New York, NY, USA, 1983; p. 468. [Google Scholar]
- Santos, S.F.D.; Rodrigues, J.D.A. Correlation between fracture toughness, work of fracture and fractal dimensions of Alumina-mullite-zirconia composites. Mater. Res. 2003, 6, 219–226. [Google Scholar] [CrossRef]
- Nagahama, H. A fractal criterion for ductile and brittle fracture. J. Appl. Phys. 1994, 75, 3220–3222. [Google Scholar] [CrossRef]
- Eker, E.; Akin, S. Lattice Boltzmann Simulation of Fluid Flow in Synthetic Fractures. Transp. Porous Media 2006, 65, 363–384. [Google Scholar] [CrossRef] [Green Version]
- Zambrano, M.; Pitts, A.D.; Salama, A.; Volatili, T.; Giorgioni, M.; Tondi, E. Analysis of Fracture Roughness Control on Permeability Using SfM and Fluid Flow Simulations: Implications for Carbonate Reservoir Characterization. Geofluids 2019, 2019, 4132386. [Google Scholar] [CrossRef] [Green Version]
- Ogilvie, S.R.; Isakov, E.; Glover, P.W. Fluid flow through rough fractures. II: A new matching model for rough rock fractures. Earth Planet. Sci. Lett. 2006, 241, 454–465. [Google Scholar] [CrossRef]
- Wang, Y.; Witten, I.H. Induction of Model Trees for Predicting Continuous Classes; (Working Paper 96/23); University of Waikato, Department of Computer Science: Hamilton, New Zealand, 1996. [Google Scholar]
- Goyal, M.K. Modeling of Sediment Yield Prediction Using M5 Model Tree Algorithm and Wavelet Regression. Water Resour. Manag. 2014, 28, 1991–2003. [Google Scholar] [CrossRef]
- Etemad-Shahidi, A.; Mahjoobi, J. Comparison between M5′ model tree and neural networks for prediction of significant wave height in Lake Superior. Ocean Eng. 2009, 36, 1175–1181. [Google Scholar] [CrossRef]
- Hall, M.; Frank, E.; Holmes, G.; Pfahringer, B.; Reutemann, P.; Witten, I.H. The WEKA data mining software: An update. ACM SIGKDD Explor. Newsl. 2009, 11, 10–18. [Google Scholar] [CrossRef]
- Mallat, S. A Wavelet Tour of Signal Processing; Elsevier: Amsterdam, The Netherlands, 1999. [Google Scholar]
- Zhang, J.; Li, Y.; Zhao, Y.; Hong, Y. Wavelet-cointegration prediction of irrigation water in the irrigation district. J. Hydrol. 2017, 544, 343–351. [Google Scholar] [CrossRef]
- McCuen, R.H.; Knight, Z.; Cutter, A.G. Evaluation of the Nash–Sutcliffe Efficiency Index. J. Hydrol. Eng. 2006, 11, 597–602. [Google Scholar] [CrossRef]
- Perlich, C.; Świrszcz, G. On cross-validation and stacking: Building seemingly predictive models on random data. ACM SIGKDD Explor. Newsl. 2011, 12, 11–15. [Google Scholar] [CrossRef]
Figure 1.
Aperture distribution of: (a) Fracture-1; (b) Fracture-2; (c) Fracture-3; (d) Fracture-4.

Figure 2.
Realization of the synthetic fracture (a) 3D printed fracture mold; (b) synthetic fracture bottom surface. The length of the pen in figure is 165 mm.
Figure 2.
Realization of the synthetic fracture (a) 3D printed fracture mold; (b) synthetic fracture bottom surface. The length of the pen in figure is 165 mm.

Figure 3.
Experimental setup.

Figure 4.
Outlet volume (mL) vs. time (min) at different test sections for Fracture-1, with an inclination of (a) 45°; (b) 55°; (c) 65°.
Figure 4.
Outlet volume (mL) vs. time (min) at different test sections for Fracture-1, with an inclination of (a) 45°; (b) 55°; (c) 65°.

Figure 5.
Outlet volume (mL) vs. time (min) at different test sections for (a) Fracture-2 with a fracture inclination of 45°; (b) Fracture-4 with a fracture inclination of 45°.
Figure 5.
Outlet volume (mL) vs. time (min) at different test sections for (a) Fracture-2 with a fracture inclination of 45°; (b) Fracture-4 with a fracture inclination of 45°.

Figure 6.
Comparison between the discharge rates along the outlet sections Q2 and Q3, obtained from experiments conducted on concrete and resin fracture surfaces.
Figure 6.
Comparison between the discharge rates along the outlet sections Q2 and Q3, obtained from experiments conducted on concrete and resin fracture surfaces.

Figure 7.
Flow movement through Fracture-1 for an inclination angle of 45°, under dry initial conditions.
Figure 7.
Flow movement through Fracture-1 for an inclination angle of 45°, under dry initial conditions.

Figure 8.
Shape of the first flow path in Fracture-1 under dry initial condition at varying the inclination angle; (a) β = 55°; (b) β = 65°.
Figure 8.
Shape of the first flow path in Fracture-1 under dry initial condition at varying the inclination angle; (a) β = 55°; (b) β = 65°.

Figure 9.
Preferential flow paths in the fractures with different fractal dimensions and mismatch lengths for inclination angle of α = 45°, 10 min after the start of the infiltration processes in the fracture: (a) Fracture-1; (b) Fracture-2; (c) Fracture-3; (d) Fracture-4.
Figure 9.
Preferential flow paths in the fractures with different fractal dimensions and mismatch lengths for inclination angle of α = 45°, 10 min after the start of the infiltration processes in the fracture: (a) Fracture-1; (b) Fracture-2; (c) Fracture-3; (d) Fracture-4.

Figure 10.
Flow paths along the aperture over cross sections: (a) A–A; (b) B–B; (c) C–C; (d) D–D. Red arrows indicate the flow paths with the maximum flow rate.
Figure 10.
Flow paths along the aperture over cross sections: (a) A–A; (b) B–B; (c) C–C; (d) D–D. Red arrows indicate the flow paths with the maximum flow rate.


Figure 11.
Details of coefficients of the flow rate time series in the Wavelet algorithm. The d1 d2, d3 and d4 are the Wavelet coefficients.
Figure 11.
Details of coefficients of the flow rate time series in the Wavelet algorithm. The d1 d2, d3 and d4 are the Wavelet coefficients.

Figure 12.
Prediction of flow rate time series: (a) comparison between observed and predicted flow rate over time; (b) scatter plot of predicted flow rate versus observed flow rate.
Figure 12.
Prediction of flow rate time series: (a) comparison between observed and predicted flow rate over time; (b) scatter plot of predicted flow rate versus observed flow rate.


Table 1.
Fracture parameters generated by SynFrac.
| Fracture Name | Physical Size (mm2) | Fractal Dimension Df | Mismatch Length (mm) | Standard Deviation (mm) | Mean Aperture (mm) |
|---|---|---|---|---|---|
| Fracture-1 | 200 × 200 | 2.2 | 30 | 2 | 2.04 |
| Fracture-2 | 2.4 | 30 | 2 | 3.07 | |
| Fracture-3 | 2.3 | 10 | 2 | 0.94 | |
| Fracture-4 | 2.2 | 10 | 3 | 0.70 |
Table 2.
The mean number of flow paths and intermediate channels for different fractures and inclinations.
Table 2.
The mean number of flow paths and intermediate channels for different fractures and inclinations.
| Fracture | Flow and Intermediate Flow | α = 45° | α = 55° | α = 65° |
|---|---|---|---|---|
| 1 | flow path | 1 | 1 | 1 |
| 1 | Intermediate channel | 3 | 3 | 4 |
| 2 | flow path | 1 | 2 | 2 |
| 2 | Intermediate channel | 2 | 2 | 3 |
| 3 | flow path | 2 | 2 | 2 |
| 3 | Intermediate channel | 3 | 3 | 4 |
| 4 | flow path | 3 | 4 | 4 |
| 4 | Intermediate channel | 4 | 3 | 6 |
Table 3.
The number of intermediate flows of different inclinations through time.
| t | F-1 α = 45° | F-1 α = 55° | F-1 α = 65° | F-2 α = 45° | F-2 α = 55° | F-2 α = 65° | F-3 α = 45° | F-3 α = 55° | F-3 α = 65° | F-4 α = 45° | F-4 α = 55° | F-4 α = 65° |
|---|---|---|---|---|---|---|---|---|---|---|---|---|
| 10 | 3 | 3 | 4 | 2 | 2 | 3 | 3 | 3 | 4 | 4 | 4 | 5 |
| 20 | 3 | 4 | 4 | 3 | 4 | 4 | 4 | 5 | 5 | 4 | 5 | 5 |
| 30 | 3 | 4 | 5 | 4 | 5 | 5 | 5 | 5 | 6 | 5 | 5 | 5 |
| 40 | 4 | 5 | 6 | 5 | 6 | 6 | 5 | 6 | 6 | 6 | 6 | 6 |
| 50 | 6 | 6 | 7 | - | - | - | - | - | - | 5 | 6 | 6 |
| 60 | 6 | 6 | 6 | - | - | - | - | - | - | - | - | - |
Table 4.
The range of variation of the parameters used for training of the M5 tree.
| Parameters | Minimum Value | Maximum Value |
|---|---|---|
| 8.96 | 10.94 | |
| 10 | 30 | |
| 0.707 | 0.906 |
Table 5.
The regression relationships proposed by the M5 tree.
| Linear Model Number | Logical Condition | Linear Relation |
|---|---|---|
| 0 | ||
Publisher’s Note: MDPI stays neutral with regard to jurisdictional claims in published maps and institutional affiliations. |
© 2022 by the authors. Licensee MDPI, Basel, Switzerland. This article is an open access article distributed under the terms and conditions of the Creative Commons Attribution (CC BY) license (https://creativecommons.org/licenses/by/4.0/).
Share and Cite
MDPI and ACS Style
Ranjbar, A.; Cherubini, C.; Pastore, N. Experimental Investigation on Water Seepage through Transparent Synthetic Rough-Walled Fractures. Water 2022, 14, 3199. https://doi.org/10.3390/w14203199
AMA Style
Ranjbar A, Cherubini C, Pastore N. Experimental Investigation on Water Seepage through Transparent Synthetic Rough-Walled Fractures. Water. 2022; 14(20):3199. https://doi.org/10.3390/w14203199
Chicago/Turabian StyleRanjbar, Ali, Claudia Cherubini, and Nicola Pastore. 2022. "Experimental Investigation on Water Seepage through Transparent Synthetic Rough-Walled Fractures" Water 14, no. 20: 3199. https://doi.org/10.3390/w14203199
Note that from the first issue of 2016, this journal uses article numbers instead of page numbers. See further details here.