
Spatial Analysis of Groundwater Abstraction and Land Subsidence for Planning the Piped Water Supply in Jakarta, Indonesia


Department of Urban Engineering, Graduate School of Engineering, The University of Tokyo, Bunkyo-Ku, Tokyo 113-8654, Japan
*
Author to whom correspondence should be addressed.
Water 2022, 14(20), 3197; https://doi.org/10.3390/w14203197
Submission received: 10 September 2022
/
Revised: 3 October 2022
/
Accepted: 8 October 2022
/
Published: 11 October 2022
(This article belongs to the Section Urban Water Management)
Abstract
:Although the special region of Jakarta Province (DKI Jakarta), Indonesia, has a large population of 10.9 million, piped water coverage remains at only 64%. Therefore, excessive groundwater abstraction has caused serious land subsidence over the last few decades. This study proposed the priority areas for piped water supply extension to alleviate the adverse effects of groundwater over-abstraction in DKI Jakarta. Water consumption and multilayer analyses (e.g., geology, groundwater abstraction, groundwater level, piped water coverage, and groundwater quality) were carried out to determine the priority areas for piped water development. Based on three parameters, namely the water demand–supply gap, land subsidence, and groundwater quality, the northern and western regions of Jakarta were selected as the priority areas for piped water development, followed by the southern and eastern regions. The demand for piped water by the population in the abovementioned priority areas is estimated to be 462,211 m3/d, while the total water demand of Jakarta is 1,878,899 m3/d, which is greater than the supply capacity of 1,747,440 m3/d from the existing water treatment plants. Therefore, the areas for controlled groundwater abstraction were also selected to augment the shortfall of the piped water supply capacity.
1. Introduction
The achievement of universal and equitable access to safe and affordable drinking water for all has been mandated in Goal 6 of the Sustainable Development Goals (SDGs) [1]. Groundwater accounts for 33% of the total water withdrawals worldwide, and over two billion people rely on groundwater as their primary water source [2]. The global population and economic growth will further increase groundwater demand, resulting in groundwater depletion [3]. Uncontrolled use of groundwater has caused land subsidence. In some regions of Tokyo, Japan, the land level has sunk to below sea level due to the over-abstraction of groundwater since the 1910s [4]. In Houston, Texas, approximately 4–6 m of subsidence occurred between 1940 and 1960 [5]. In the Mekong Delta, Vietnam, land subsidence was reported at 1–4 cm/year in 2006–2010 [6]. Through the use of data on groundwater table drawdown, well location and pumping rates, and geological layers, groundwater management needs to be implemented to minimize land subsidence [7].
The rapid development of cities with high population growth rates has increased their dependence on groundwater sources. In the last three decades, the urban development of Jakarta and its surroundings has grown very rapidly, which has led to extensive land use conversion, groundwater over-exploitation, and the disruption of the main ecological function of the water catchment areas for groundwater recharge [8,9,10]. In 1948, the built-up area of Jakarta was 20,000 ha with a population of about 2 million, which increased to 65,400 ha with a population of 6.5 million in 1965 [11] and over 10 million in 2019 [12]. The population density has reached about 16,700 persons/km2, which makes Jakarta the most densely populated region in Indonesia.
The 2020 National Socio-Economic Survey reported that Indonesia had achieved 90.2% access to safe drinking water [13]. However, the low coverage and/or poor performance of the piped water supply, combined with a lack of permit enforcement, leads to many industries and housing estates using deep groundwater [14]. Therefore, it is necessary to develop piped water in urban areas to supply safe drinking water and to regulate excessive groundwater abstraction [8].
Excessive groundwater abstraction in Jakarta is also closely related to the limited coverage of the piped water supply. The piped water in Jakarta is supplied by the water utility of Daerah Khusus Ibukota (DKI) Jakarta Province (Perusahaan Air Minum (PAM) Jaya) in cooperation with two private operators, namely PT. AETRA and PT. PALYJA. The privatization agreement between PAM Jaya and its two operators was signed in 1997 and will end in 2023. The initial service coverage in 1998 was 44.5%, which had increased by only 19.5% to 64.0% in Jakarta in 2020 [15].
Due to the low coverage of piped water, many people in Jakarta use groundwater to meet their needs. It was reported that excessive groundwater abstraction caused land subsidence between 1982 and 1991, with a maximum rate of about 8 cm/year, which increased to 26 cm/year between 1991 and 1997 [16] and to 1–31.9 cm/year between 1997 and 2005 [17,18]. During these periods, the greatest land subsidence occurred in the northwest region of Jakarta. In 2000, groundwater abstraction was recorded at 21,849,031 m3/year, which increased to 22,629,468 m3/year in 2008 then decreased to 6,014,240 m3/year in 2020 [19,20] due to the groundwater abstraction tax imposed by the Provincial Government of DKI Jakarta in 2009. However, it has been reported that land levels have been still subsiding, even after 2009 [21].
Land subsidence due to a large amount of groundwater abstraction depends on the type of hydrogeology and the geological environment [22]. The regional cone of depression in the confined aquifer system is a consequence of low aquifer permeability in the sedimentary basin fill [23,24]. Recharge to the confined part of the system occurs mainly in the hilly area south of Jakarta [23,25]. The groundwater recharge area in Jakarta decreased considerably from 33,467 hectares (29%) in 2007 to only about 10,008 hectares (9%) in 2013 [26] and could continue to decrease if urban development is not controlled properly.
Groundwater abstraction without adequate groundwater recharge has led to seawater intrusion in the northern region of Jakarta, which is proven by the fact that 80.1% of water samples from the observation wells in northern Jakarta’s groundwater basins are unfit for consumption due to high salinity [27]. In addition, raw water sources have also been polluted due to anthropogenic pollutants that enter water bodies [28,29] because only 4% of the population has access to sewerage [30]. This condition indicates that groundwater in Jakarta is mostly unsafe for drinking, and the development of piped water is needed to achieve SDG Target 6.1 by 2030.
Many studies on groundwater abstraction and land subsidence have been conducted; among them, recent studies have used GIS and spatial analysis to find the relationship between groundwater abstraction and land subsidence [22,31,32,33,34], the relationship between the geological environment and land subsidence [33,34,35,36], the potential for groundwater abstraction, and suitability for drinking [25,37,38,39]. However, the relationship between piped water coverage and land subsidence caused by groundwater over-abstraction has not yet been reported.
Therefore, this study aimed to propose the priority areas for piped water supply extension to alleviate the adverse effects of groundwater over-abstraction, based on groundwater abstraction by non-registered consumers estimated by GIS and spatial analysis. To achieve these objectives, the groundwater levels, land subsidence, groundwater quality, and piped water coverage in each district of Jakarta were analyzed using spatial data and analysis tools. Areas for controlled groundwater abstraction were also identified using layers representing the geology and groundwater levels to augment the current supply capacity of piped water.
2. Materials and Methods
2.1. Study Area
The administrative hierarchy in Indonesia is the national government, followed by provinces, cities/regencies, districts, and sub-districts. The special region of Jakarta (DKI Jakarta) is a province and the capital city of Indonesia. The Jakarta Province consists of five administrative cities on the mainland and one regency, i.e., the Thousand Islands Regency (Table 1). This study focused only on the five administrative cities on the mainland, hereafter called Jakarta in this study, because groundwater abstraction and land subsidence are crucial issues in mainland Jakarta.
The area of Jakarta is relatively flat with topographical slopes ranging between 0° and 2° in the northern and central region, respectively, and up to 5° in the southern region. The southernmost region has an altitude of about 50 m above the mean sea level and increases towards the south to the volcanic areas in the Bogor region, West Java province [16]. Jakarta is located on the Jakarta Groundwater Basin. The basin fill consists of marine Pliocene and Quaternary sand and delta sediments up to 300 m in thickness. Individual sand horizons are typically 1–5 m thick and comprise only 20% of the total fill deposits. Silts and clays separate these horizons. Fine sand and silt are the major water-bearing components of these aquifers. The Quaternary deposits may be conveniently divided into three aquifer systems on the basis of their hydraulic characteristics and depths; these are: (1) the phreatic aquifer system (0–40 m), (2) the upper confined aquifer system (40–140 m), and (3) the lower confined aquifer system (>140 m) [17,40]. A map of the recharge and discharge area of the Jakarta groundwater was developed by Yosua et al. (2019) [41] based on ten cross sections from previous studies. They selected three groundwater recharge areas: one in the northeast and two in the south of Jakarta, where groundwater levels were significantly higher than in other locations. In addition, due to the emergence of the depression cones, the vertical infiltration of shallow groundwater to deep aquifers is also taking place in the central area of Jakarta [41,42]. Karunia and Faisi Ikhwali [43] estimated the water balance in DKI Jakarta based on the population projection, land use change, and the water demand from 2010 to 2030. They found that there was a large deficit in the water balance at 747,700 m3/d in 2018, which will increase to 864,000 m3/d in 2030, causing a significant decrease in the groundwater stored in the aquifers below DKI Jakarta.
There are four different causes of land subsidence that could occur in Jakarta, namely subsidence due to the settlement of highly compressible soil, the natural consolidation of the soil, and geotectonic subsidence, which are caused by groundwater abstraction, and the load of construction [44,45]. Among these, the main cause of land subsidence in Jakarta is thought to be soil settlement due to groundwater over-abstraction [18]. Excessive groundwater abstraction will lead to the lowering of groundwater levels (piezometric head), which, in turn, will cause land subsidence as well as seawater intrusion in some areas [46,47]. The present shape of the regional cone of depression in the confined aquifer system in Jakarta is a consequence of low aquifer permeability in the sedimentary basin fill.
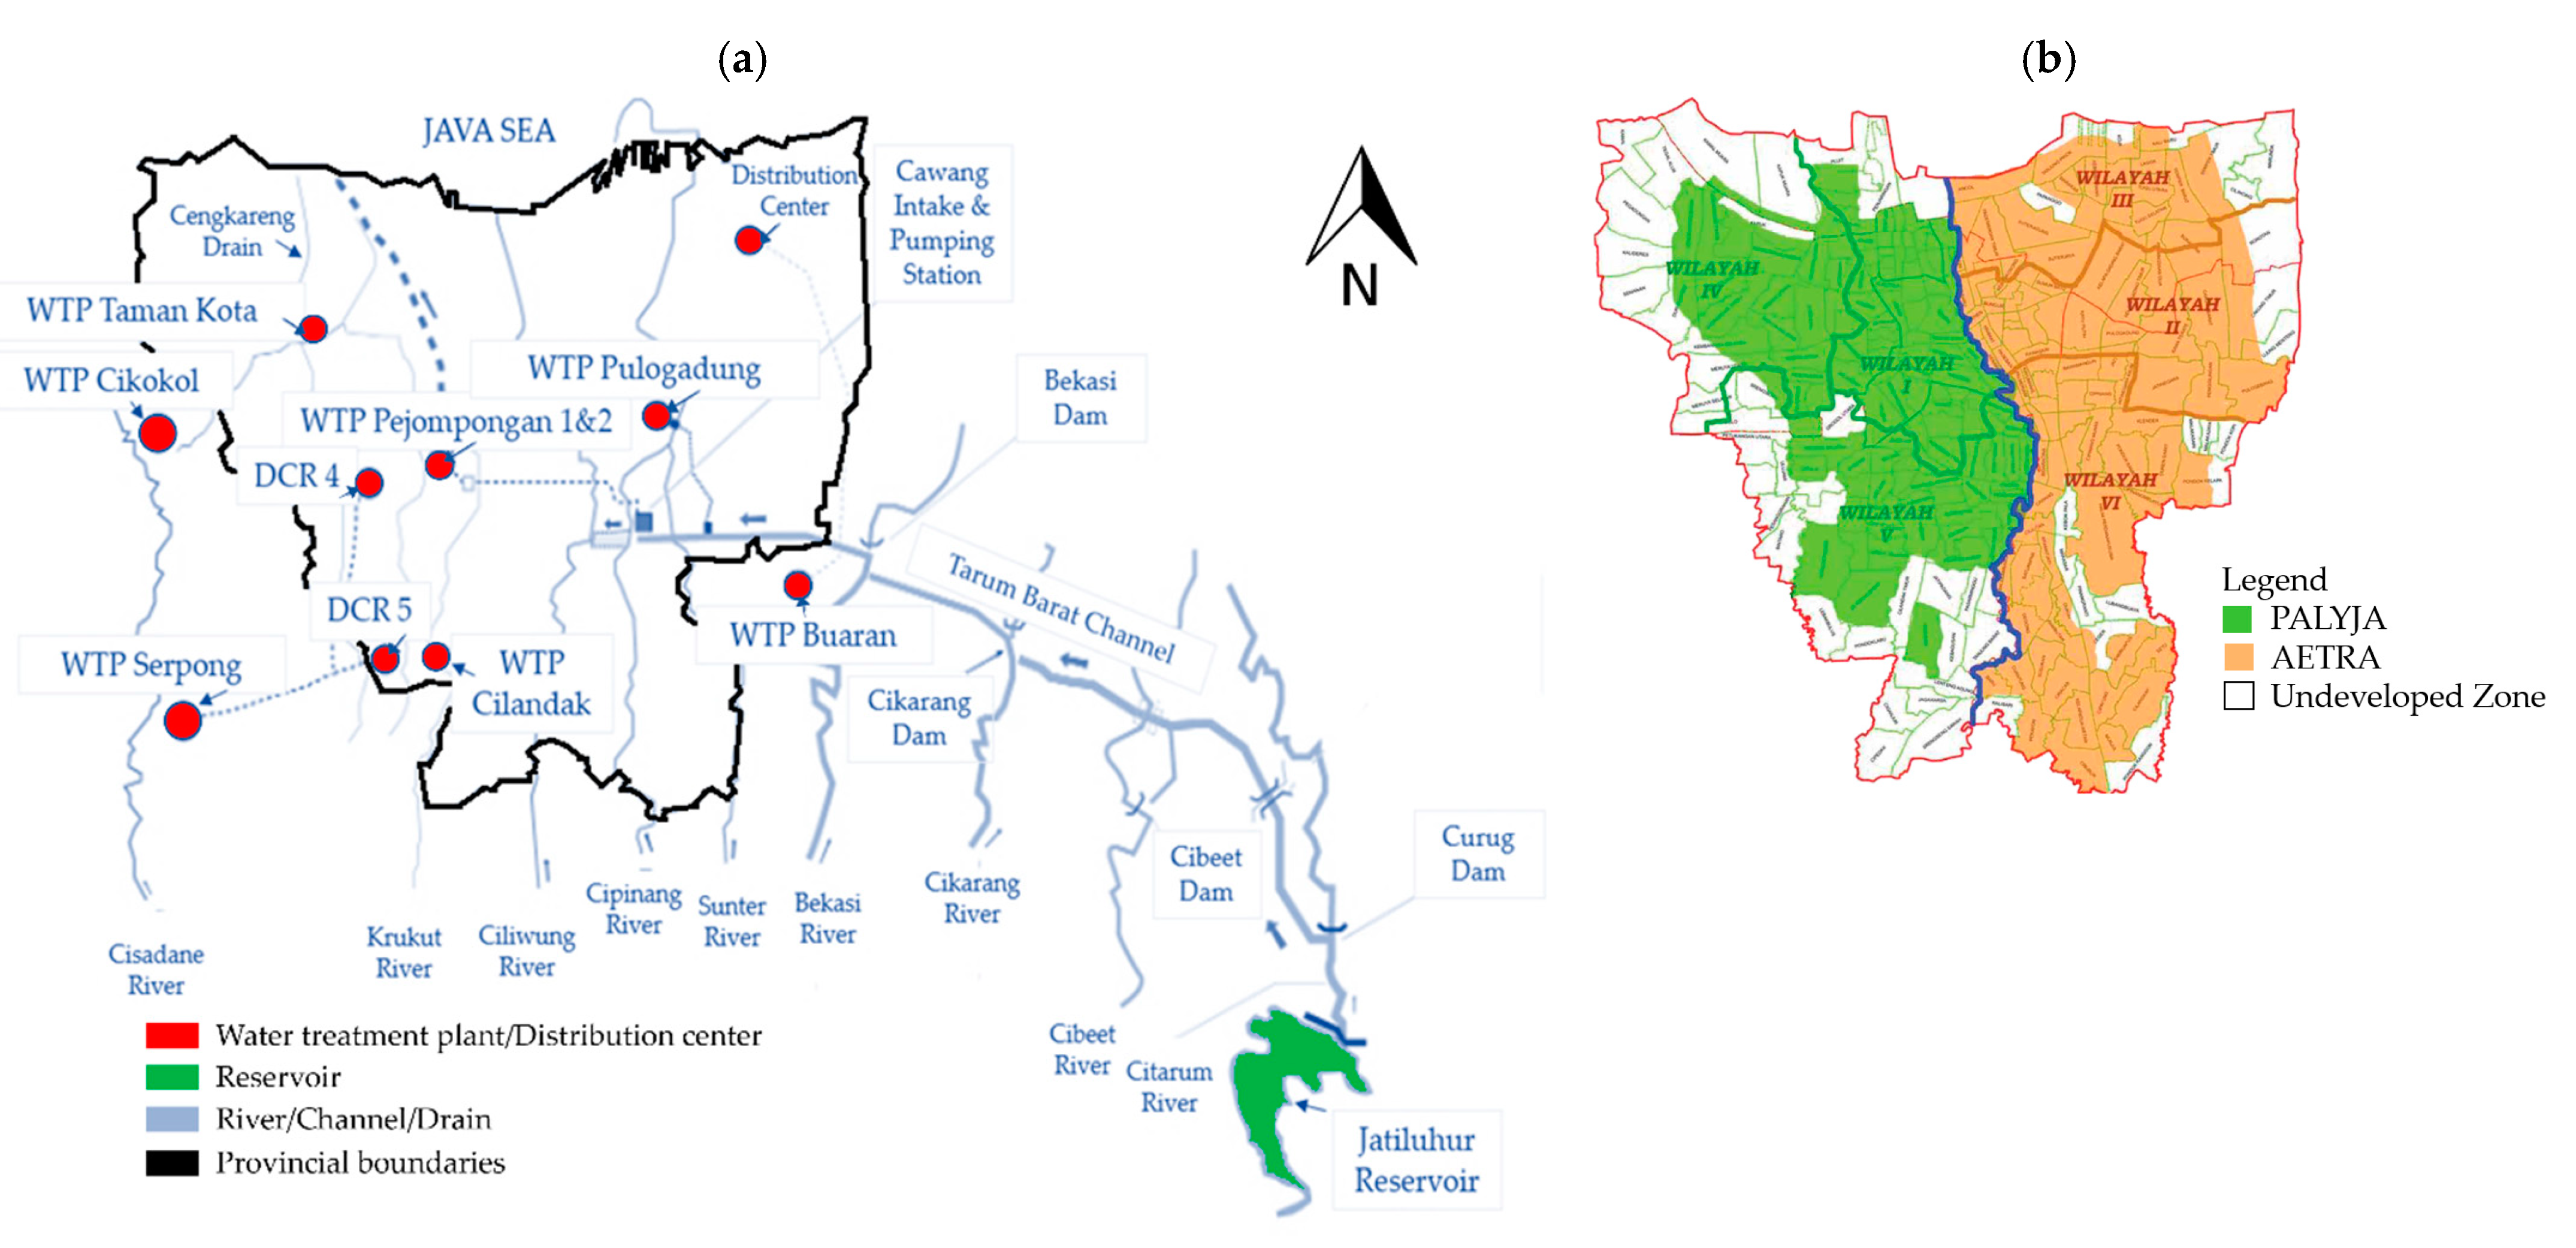
The piped water source for Jakarta is mainly the Tarum Barat Channel, which comes from the Jatiluhur Reservoir of the Citarum River and from other areas outside Jakarta (Figure 1a), while the second water source option is groundwater [48]. Currently, PALYJA supplies piped water with a total volume of 840,240 m3/day to the western region of Jakarta, and AETRA supplies 907,200 m3/day to the western region (Figure 1b, Table 2). The Jatiluhur Reservoir supplies all of AETRA’s raw water and 62.6% of PALYJA’s raw water, while the rest of the raw water is obtained from the Serpong Water Treatment Plant (WTP) in South Tangerang City (31%), along with treated water from the Cikokol WTP in Tangerang City (0.8%); only a small part is sourced within Jakarta, namely from the Krukut River and the Cengkareng drain.
2.2. Data Collection
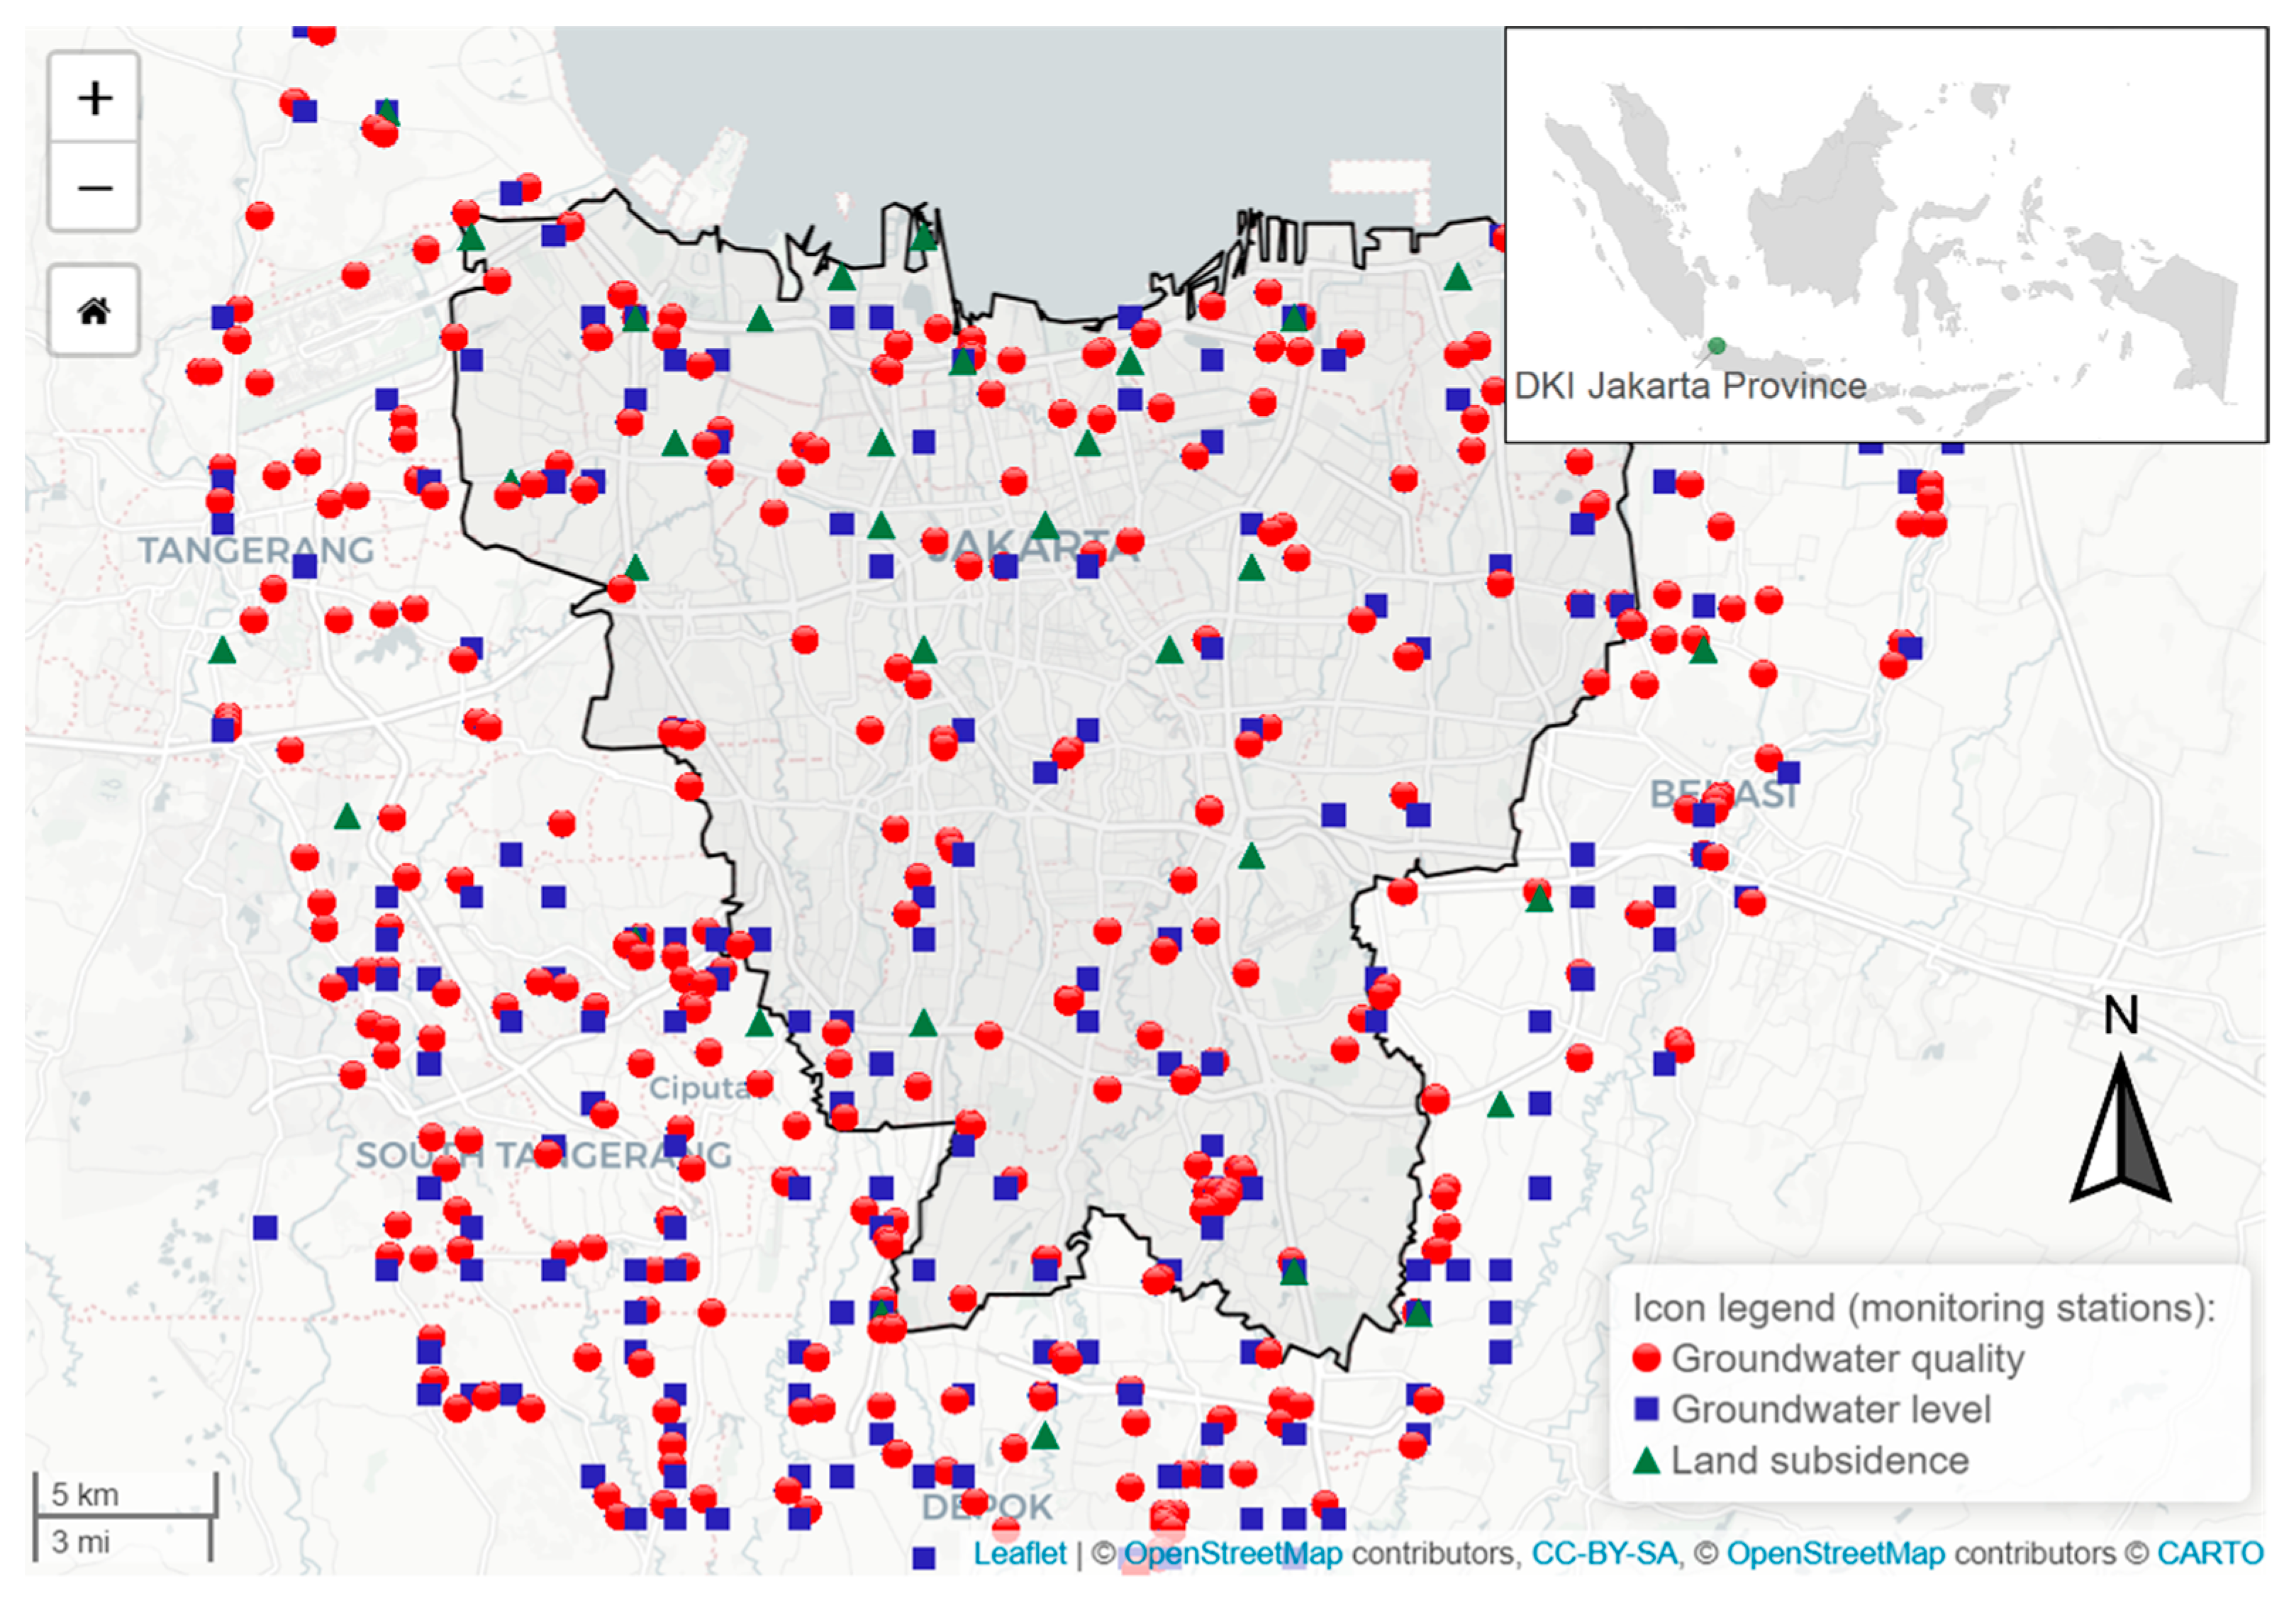
The Ministry of Mineral Resources and Energy established the groundwater conservation center in 2013, and since then, they have monitored groundwater levels and land subsidence. There are 63 geodetic GPS stations and 403 monitoring wells scattered in the Jakarta metropolitan area, i.e., DKI Jakarta and surroundings, which took records from 2015 to 2018. These data were obtained from the website [20] by web scraping with Python in 2021. The spatial distribution of the monitoring stations is shown in Figure 2.
The data on the water treatment plants’ capacities, groundwater abstraction, and piped water supply volumes were obtained from the DKI Jakarta Provincial Government. The total capacity of the water treatment plant is approximately 1.75 million m3/d (Table 2), and registered groundwater abstraction is approximately 22,000 m3/day [19]. Meanwhile, the population data were obtained from the Central Statistical Agency in 2019 [12].
A field survey was conducted in August–September 2021 to verify the data obtained by web scraping and to discuss with the relevant agencies to expand the data and information as well as to discuss the current issues. The GIS map data (shapefile) of the Jakarta administrative area and the attribute data were obtained from the geospatial portal [49], which was established by the Indonesian Government to connect various ministries, institutions, provinces, and regions that are connecting partners in the National Geospatial Information Network.
2.3. Data Analysis
The collected data were analyzed using R version 4.0.3 run on R Studio v.1.4.1103. The population density and piped water service coverage were calculated for each district to estimate the groundwater and piped water consumption per district, groundwater consumption in the areas that are not served by piped water, and factors causing a large amount of groundwater abstraction in the areas that have been served by piped water.
To estimate the water supply and consumption in each district in Jakarta, the water treatment plants’ capacity was compared with the registered and estimated groundwater abstraction and piped water consumption. The yearly piped water consumption in 2019 was 362,626,303 m3/year, and the daily piped water consumption was 993,497 m3/day. Based on data on piped water coverage per district (as shown in Section 3.2), the estimated population connected to piped water is 5,703,643. Thus, the per capita water consumption is estimated to be 174.2 L per capita per day (LPCD). The water consumption per capita was then used to estimate the water demand of the total population, which includes both connected and non-connected consumers. Meanwhile, the groundwater abstraction by non-registered consumers was estimated on the basis of water consumption per capita multiplied by the population not connected to piped water [50,51].
The screen depths of the registered wells are 65–243 m [20], and they are used by the commercial and industrial sectors. Therefore, it was necessary to estimate the groundwater abstraction by non-registered residential/domestic consumers based on their water consumption, which was estimated by multiplying the per capita water consumption by the population not connected to the piped water. The registered and estimated groundwater abstraction in each district was plotted on a map superimposed by the piped water service coverage areas to analyze the relationship between piped water coverage and groundwater abstraction. In addition, the groundwater levels and the rates of land subsidence were also visualized on a map to study the relationship between the cones of groundwater depression and land subsidence.
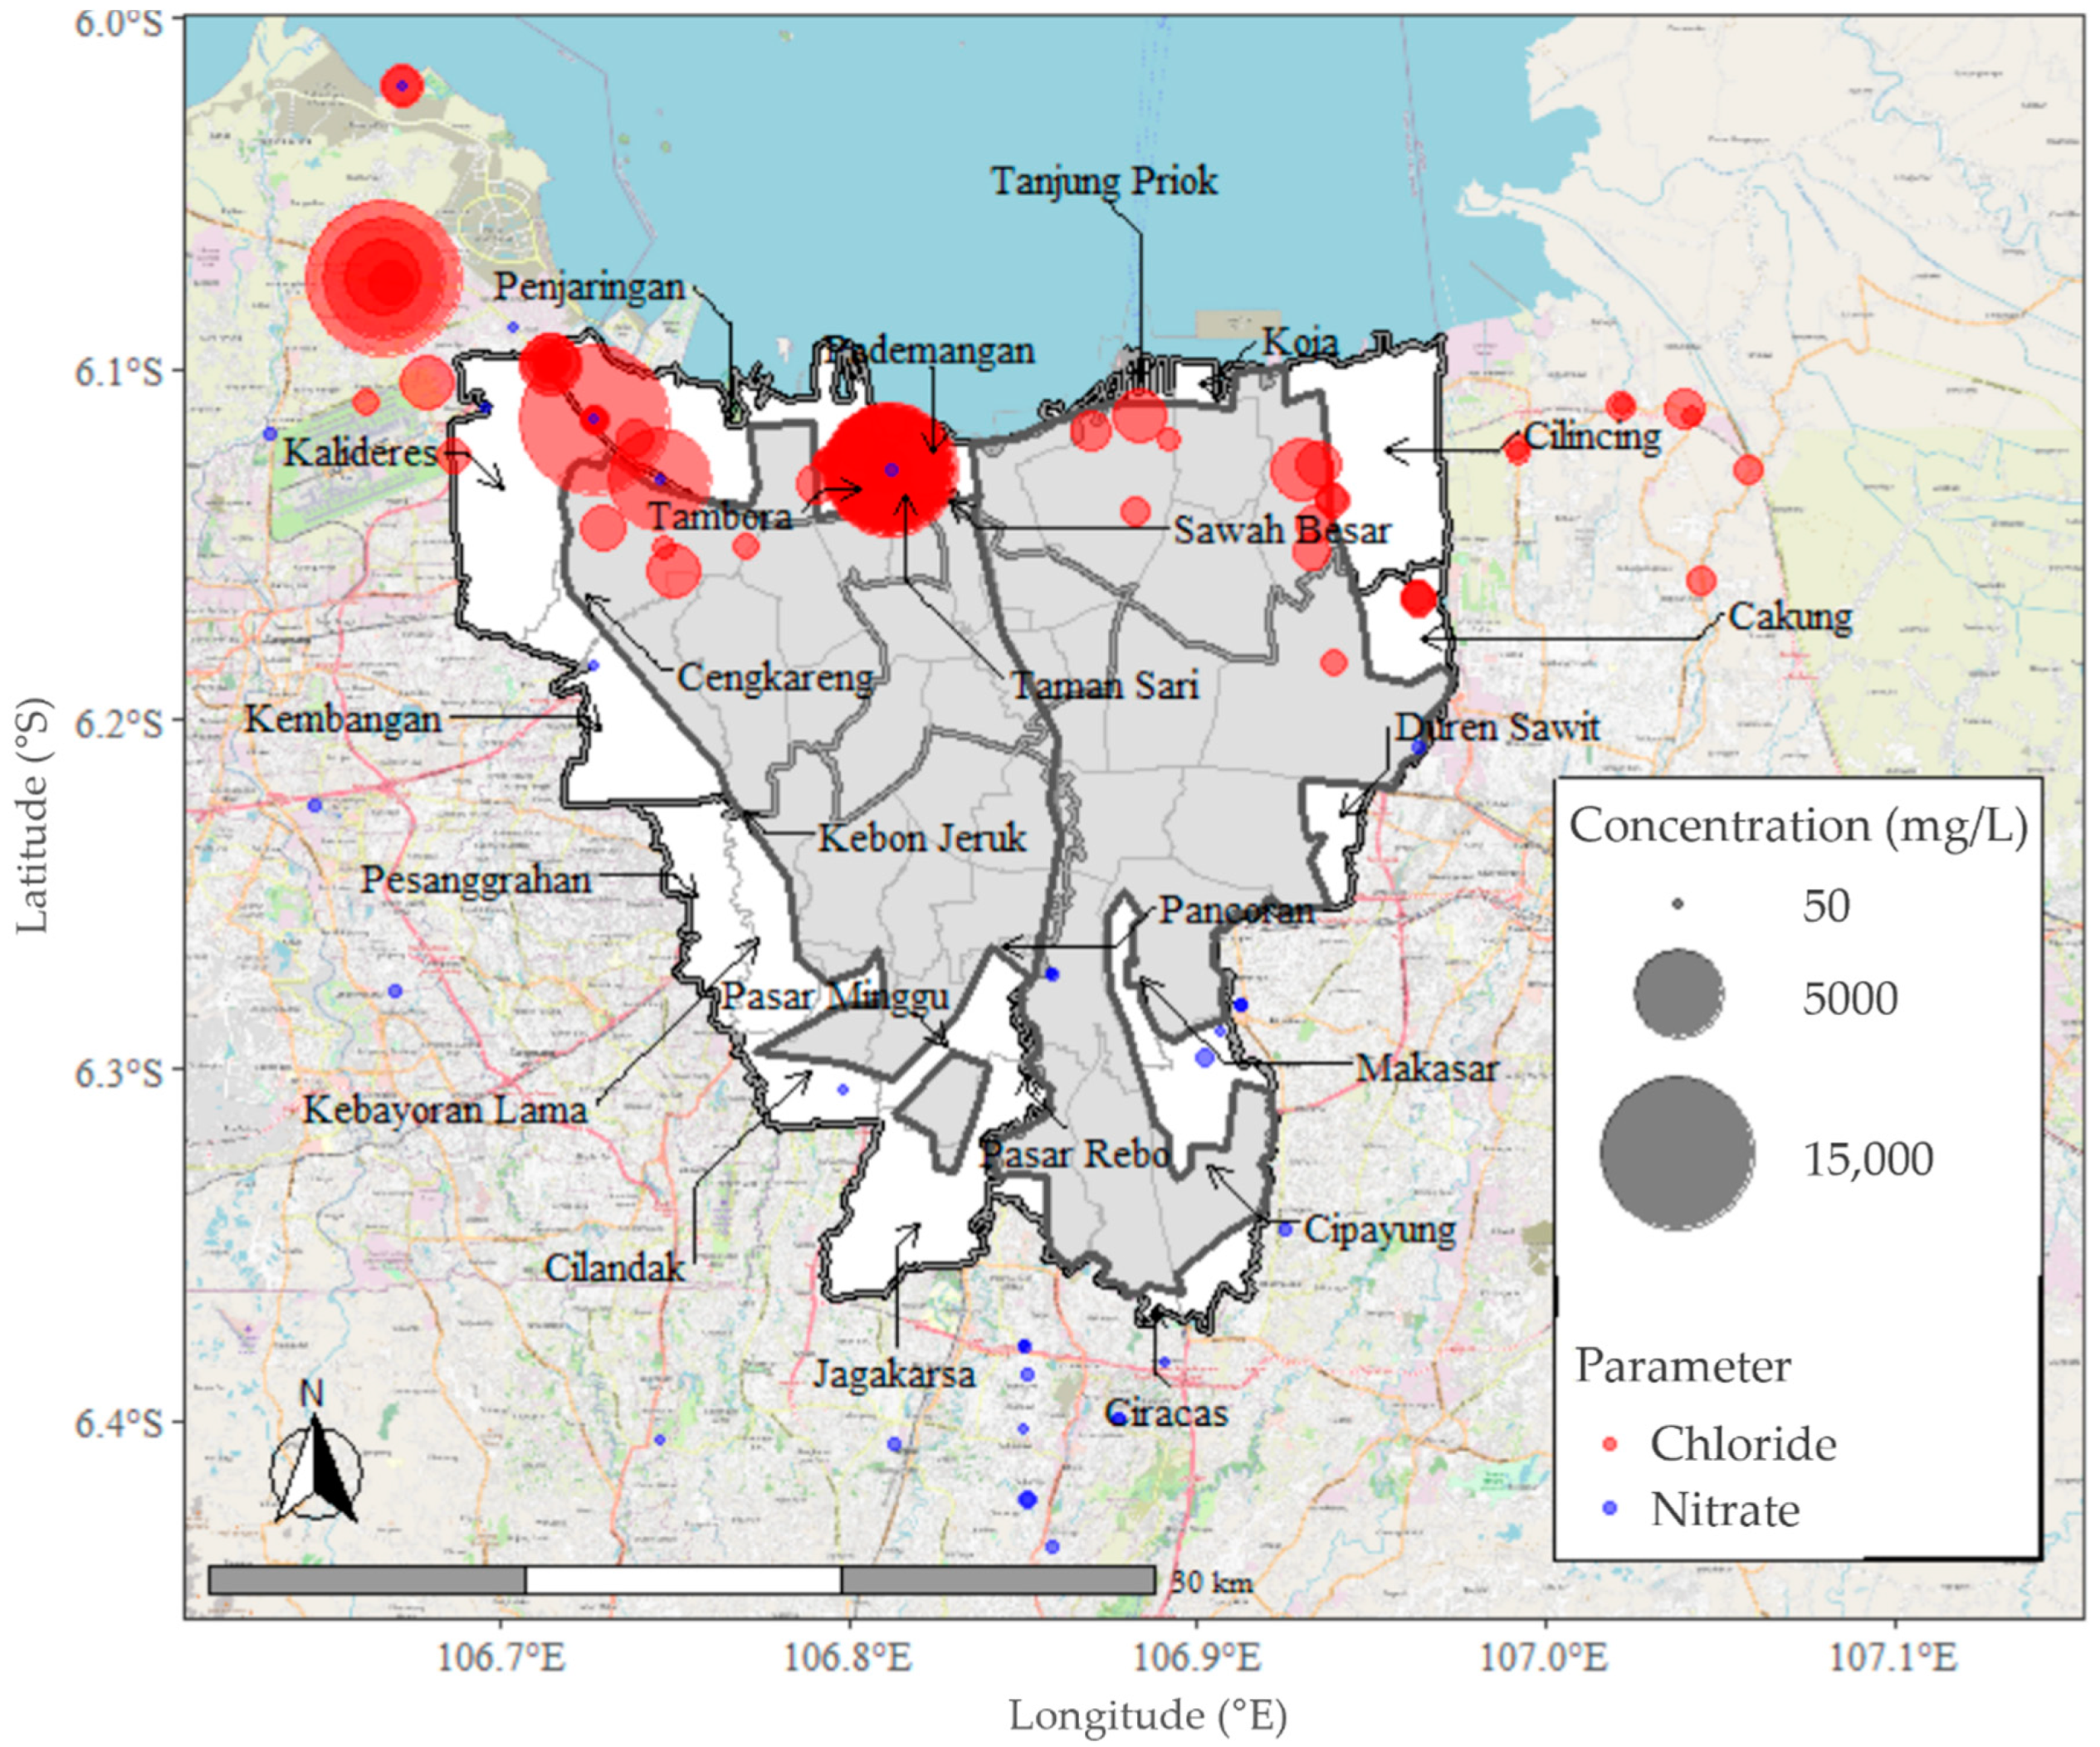
Monitoring anions in groundwater is useful for detecting contamination, as they are conservative in aquifers [52]. Chloride is an indicator of seawater intrusion, considering that seawater is the main source of chloride in groundwater samples taken from coastal areas, while both chloride and nitrate occur together in groundwater contaminated by sewage effluent [25]. In addition, fertilizers used for agriculture could increase the nitrate concentrations in groundwater [25,53,54]. Therefore, groundwater quality was visualized on a map to select the priority areas for piped water supply development.
The drinking water quality guidelines, namely Minister of Health Regulation No. 492/MENKES/PER/IV/2010 issued in 2010 [55], contain 26 mandatory and 73 additional water quality parameters. The water suppliers must abide by the mandatory parameters, while the additional parameters are selected and determined by local governments depending on the local environmental quality. Among the 26 mandatory parameters, there are 12 parameters related to the results of groundwater quality monitoring (Table A1). In this study, chloride and nitrate were selected as indicators of groundwater contamination to determine the priority zones for the piped water supply.
3. Results
3.1. Groundwater Abstraction and Land Subsidence
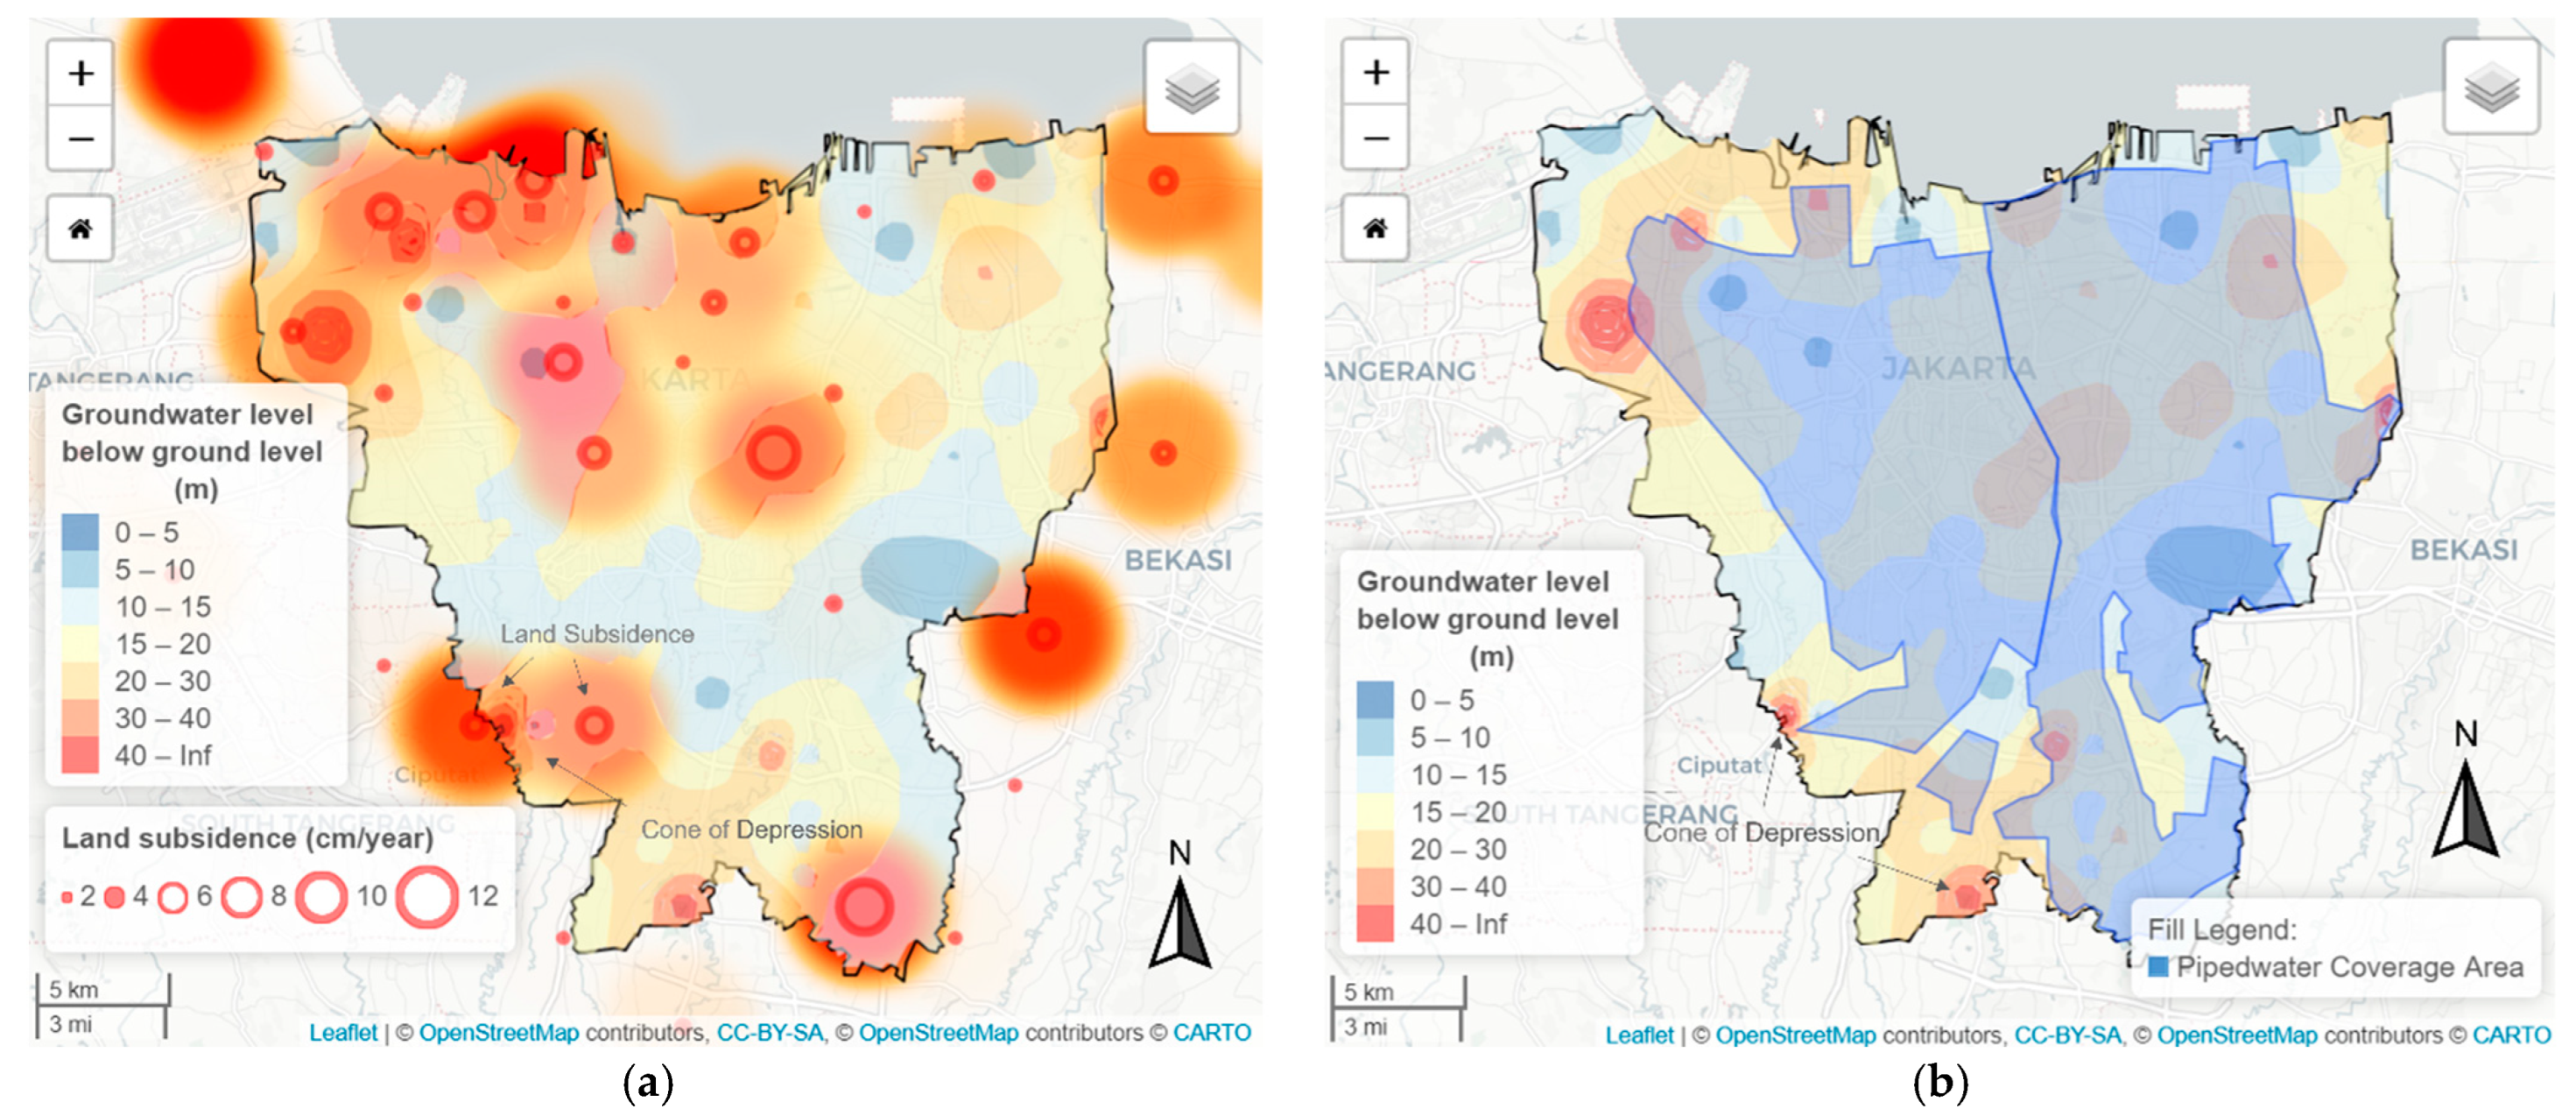
Although the groundwater levels are commonly measured from the mean sea level of the adjacent bays, the raster map of the groundwater levels from the mean sea level from Jakarta Bay (Figure A1) drawn based on the monitoring well data was too coarse to identify the local depression cones of the groundwater levels. Therefore, we drew a map of the groundwater levels measured from the ground levels, i.e., the altitude (Figure 3a), and found that the groundwater level contour and the locations of land subsidence were in good agreement. In the northwest region of Jakarta, the groundwater table drawdown to depths lower than 30 m from the land surface is widespread, and the cone of depression is quite large; this has caused land subsidence in these areas. Meanwhile, in the central region, the areas with a groundwater table less than 15 m deep are widespread, while there are some areas with groundwater depths of 20–30 m, where land subsidence also appears in the cone of depression. Figure 3b shows that the areas with low groundwater levels appear in areas that are not served by piped water, such as in the northwest, causing land subsidence in that region (Figure 3a).
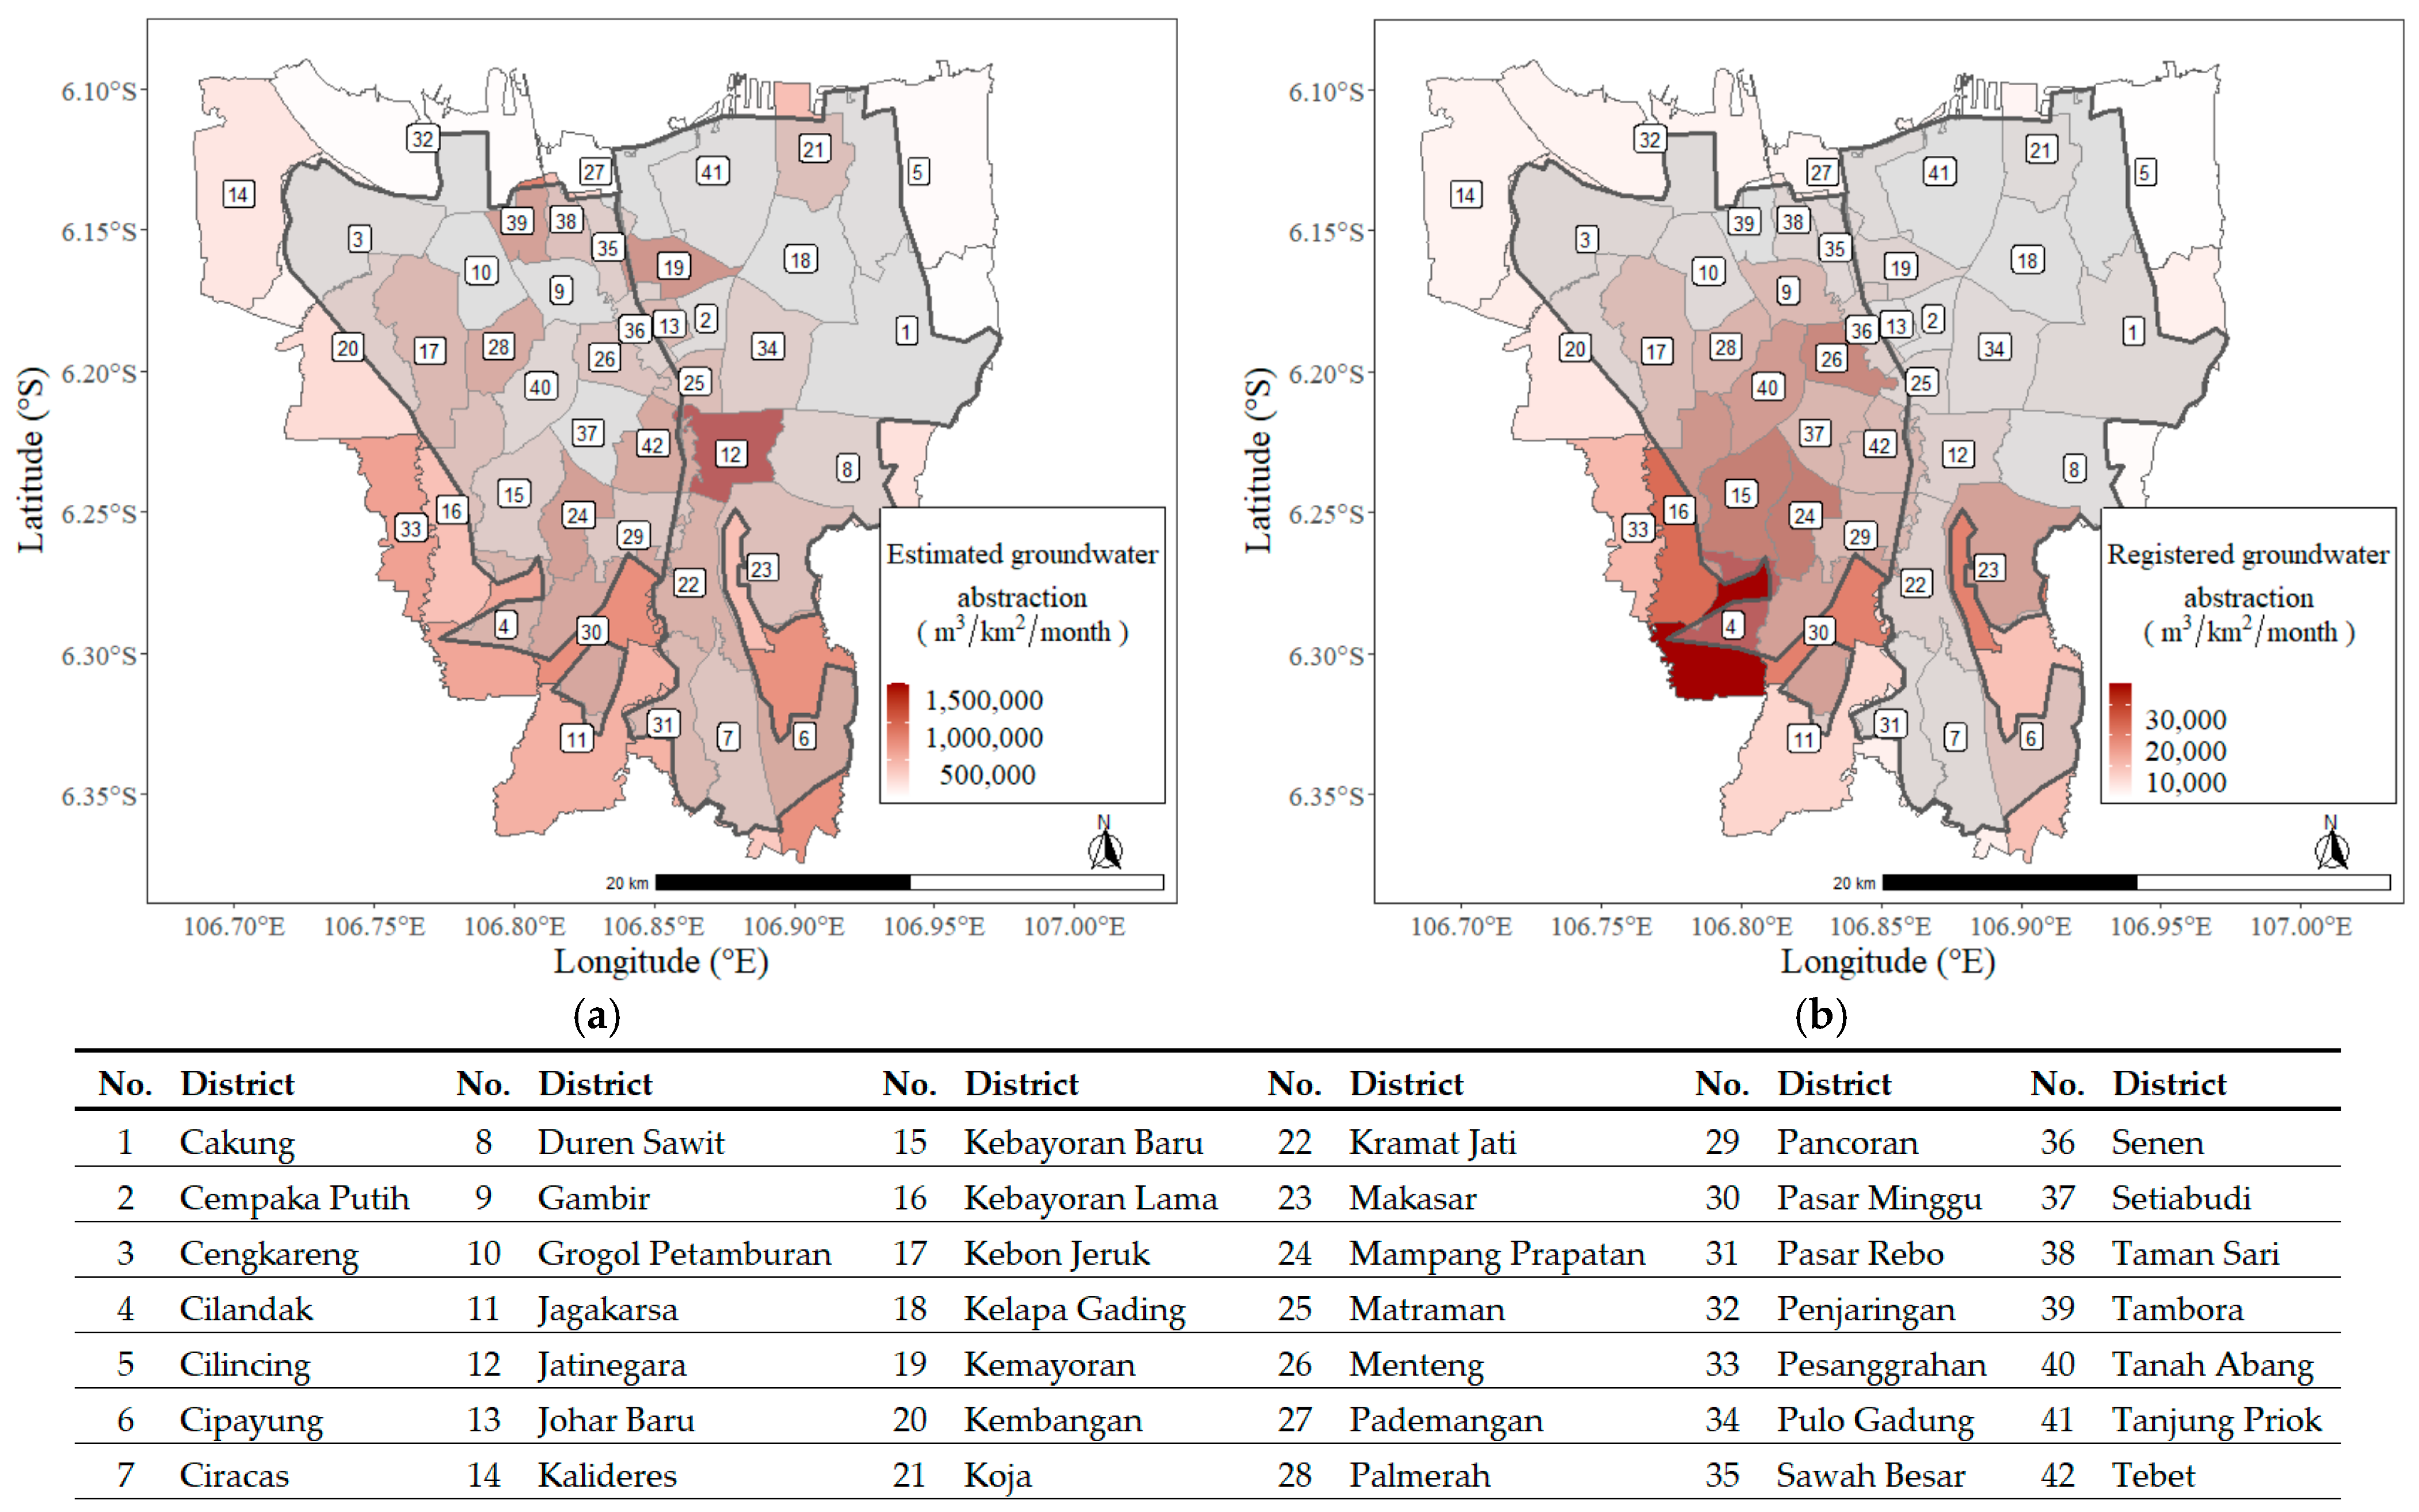
Meanwhile, the current amounts of estimated and registered groundwater abstraction (Figure 4a and 4b, respectively) in the northwest are not too large, indicating the possibility that large amounts of groundwater abstraction occurred in the past before the regulations on groundwater abstraction were imposed. Changes in land use due to rapid urban development without a piped water supply might have resulted in a lack of groundwater recharge, causing the groundwater to decline or cones of depression to appear due to groundwater abstraction, resulting in land subsidence, such as in the central and northwest regions.
The spatial visualization of the estimated groundwater abstraction per area in each district (Figure 4a) shows that the Jatinegara district, with the darkest brown color, has the highest estimated groundwater abstraction per area, even though the area has been served by piped water. In addition to the possibility of partial/zero customers, the presence of large slum areas along the Ciliwung River may be the cause of large groundwater abstraction in the Jatinegara district because the inhabitants in the slum areas do not have access to piped water [56].
The estimated groundwater abstraction in the south of Jakarta is generally moderate to high (1,000,000 m3/km2/month) because the groundwater quality in the southern region is considered good compared with the northern region, as there is no influence of seawater intrusion. Meanwhile, registered groundwater abstraction (Figure 4b) is accumulated and extensive in the southwest region of Jakarta, which indicates that in recent years there has been rapid development in the region and high amounts of groundwater abstraction due to a lack of piped water development.
Geological layers may also affect the occurrence of land subsidence; Figure 5a shows that the central to northern region of Jakarta is covered by a sedimentary layer, and land subsidence occurs in these areas, as shown in Figure 3a. This is because in the sedimentary layer fine material is also carried away at the time of groundwater abstraction, causing cavities in the soil. Furthermore, widespread land subsidence is caused by the pressure depression in the aquifers, which is represented by the groundwater level contour in the central and north regions of Jakarta (Figure 3a). However, in the southern region, the location of land subsidence is not extensive, possibly due to the dominance of volcanic layers (Figure 5a), which is also represented by the groundwater level contour (Figure 3a).
The urban development in the southern region of Jakarta before the extension of piped water services has resulted in a large amount of registered groundwater abstraction. This has caused the emergence of a cone of depression and land subsidence at the southern end of Jakarta (small arrows in Figure 3a,b), although the geological layer in the south is dominated by volcanic ash layers.
The use of groundwater in urban activities cannot be eliminated; however, its use can be better managed by considering the geological conditions and groundwater levels to avoid land subsidence. Figure 5b shows the potential areas of controlled groundwater abstraction based on the multilayer analysis of the geological layers and groundwater levels up to 10 m below the ground level. The areas colored dark and light blue indicate the areas where the groundwater table ranges across 0–5 m and 5–10 m, respectively, below the ground surface and are located in rock and solidified lava pieces (volcanic layer). The use of controlled groundwater, taking the geology, groundwater levels, and groundwater quality into account, could improve the deficiency of the piped water supply to supply piped water to those living in the priority areas proposed in this study.
3.2. Water Supply and Demand
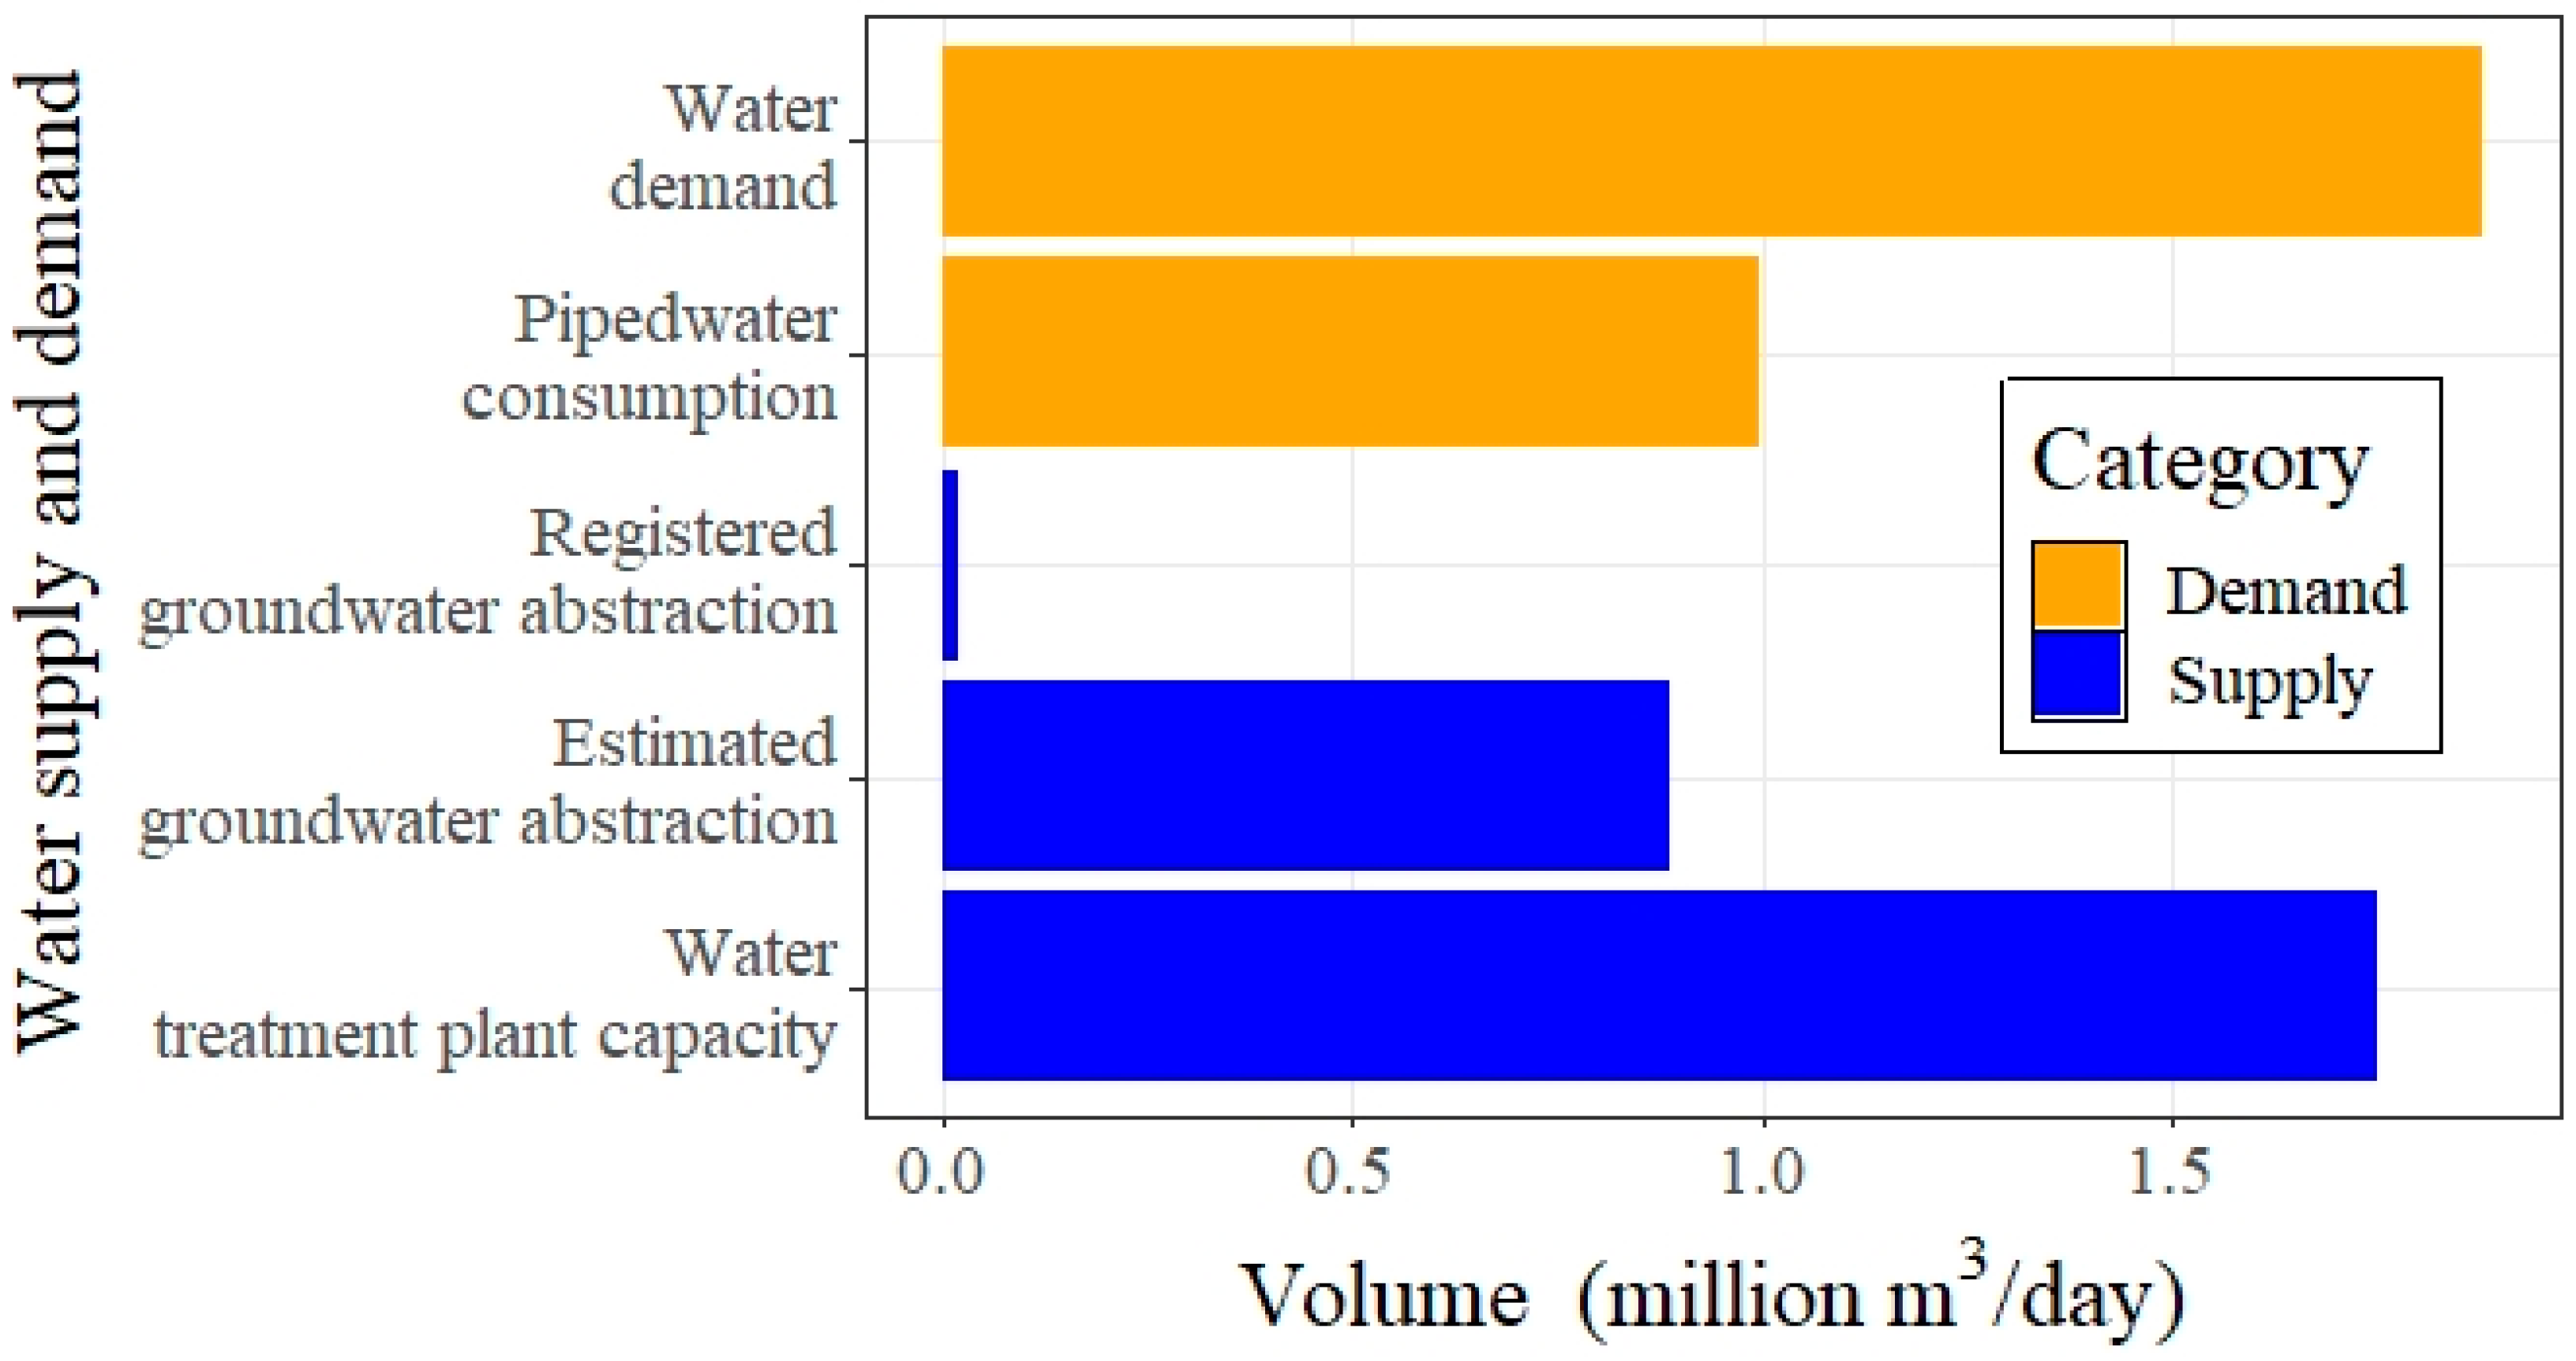
The total piped water consumption is estimated to be 993,497 m3/d, which is much less than the total supply capacity of 1,747,440 m3/d due to high water loss [57], limited supply volume below the capacity, and the presence of zero customers (Figure 6). Therefore, it is estimated that the water suppliers might have extra capacity to supply water to more consumers living both inside and outside the present supply areas if the water loss is reduced. The average per capita piped water consumption is estimated to be 174.2 LPCD, which was used to estimate the groundwater abstraction by non-connected consumers, namely 886,465 m3/d. Thus, the total water demand in Jakarta, including both connected and non-connected consumers, is 1,878,899 m3/d. This figure is higher than the total water treatment plant capacity of 1,747,440 m3/d by 131,459 m3/d without considering water losses. Therefore, it is necessary to develop additional surface water sources for piped water to meet the total water demand, which can also function as a groundwater recharge area through infiltration wells, such as in the southern area of Jakarta [10]. Alternatively, the controlled use of groundwater in the areas where the groundwater table is high and the risk of land subsidence is low can fill the gap between water demand and piped water supply, as outlined in Section 3.1.
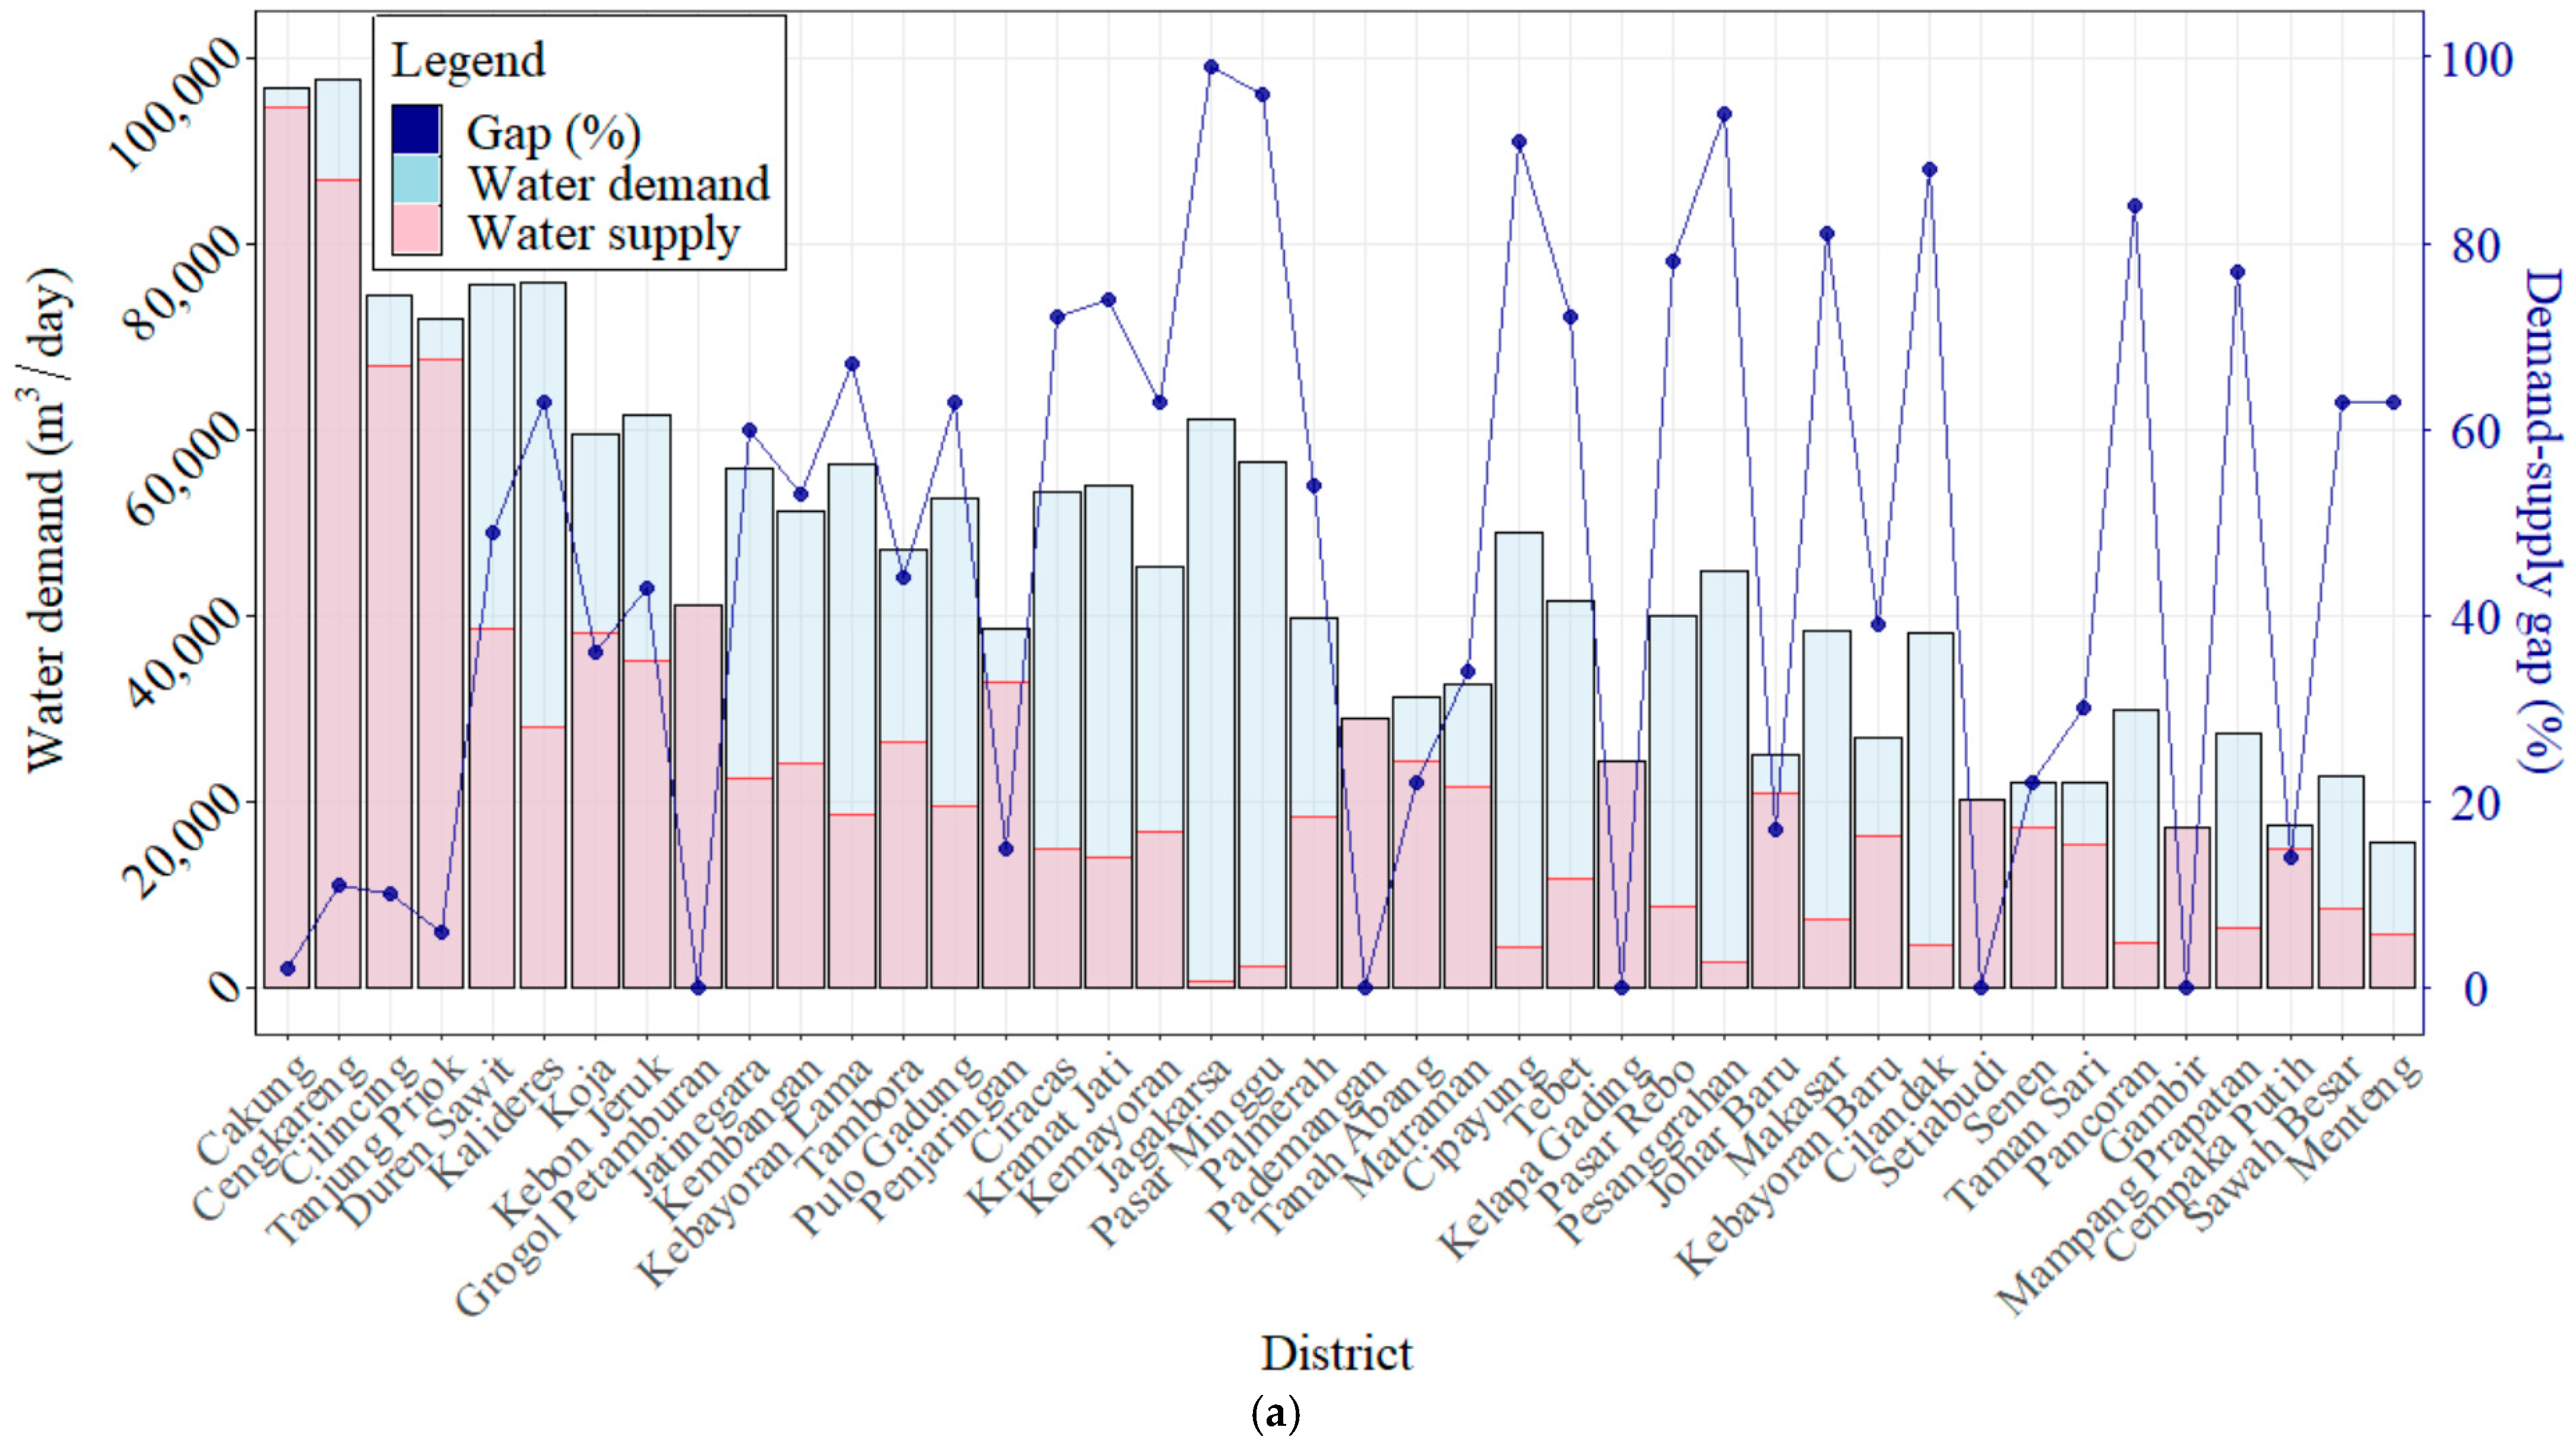
Furthermore, the water demand and supply and the demand–supply gap, (i.e., (demand–supply)/demand, as a percentage) in each district were analyzed to obtain more detailed information on piped water coverage. Figure 7a shows that water demand and supply are significantly different among the districts, namely two districts (Cakung and Cengkareng) have high water demands of more than 900,000 m3/d and very low demand–supply gaps of less than 10%, whereas three districts (Gambir, Cempaka Putih, and Menteng) have very low water demands of less than 20,000 m3/d. The demand–supply gaps, represented by blue dots, show that there are 22 districts with large gaps of more than 50%, and the demand–supply gap is the largest in Jagakarsa district in South Jakarta (Figure 4a and Figure 7b).
3.3. Groundwater Quality
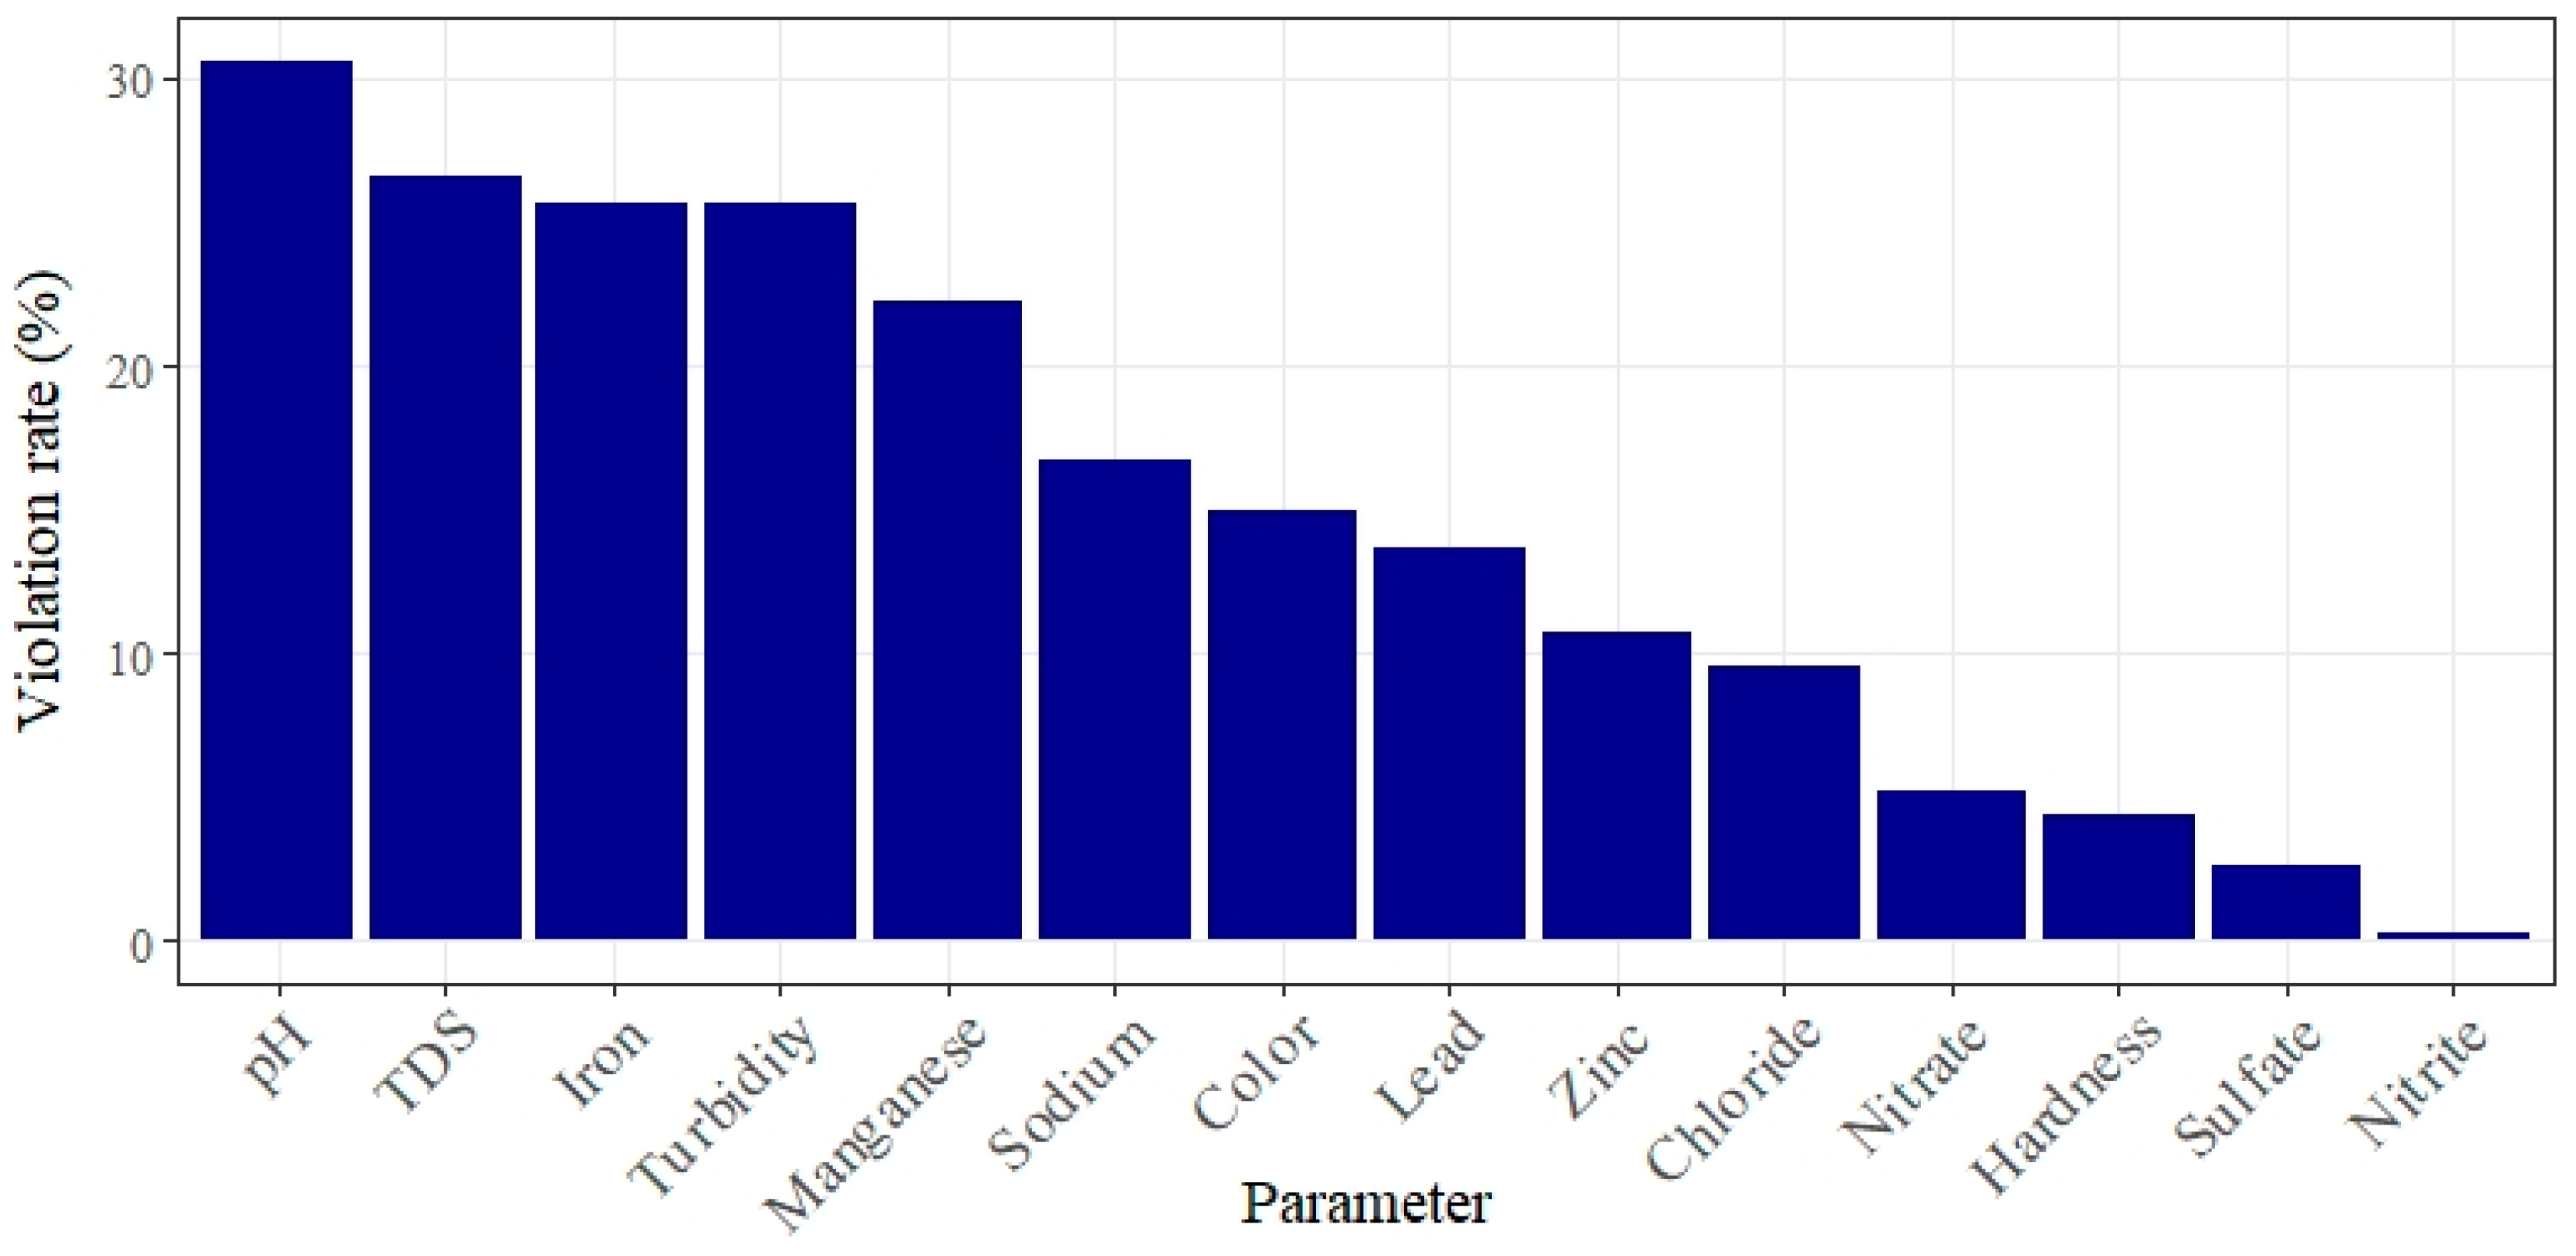
The Groundwater Conservation Center reported the monitoring results of 14 water quality parameters that did not meet the guidelines of the Ministry of Health [55] (Figure 8). The highest rates of water quality violations were found for pH (30.6%; guideline values: pH 6.5–8), followed by TDS (26.58%; 500 mg/L), iron (25.66%; 0.3 mg/L), and turbidity (25.66%; 5 NTU). Of these 14 parameters, chloride and nitrate were used as parameters to determine the piped water development zone. Although the violation rates of chloride and nitrate were not so high, 9.58% and 5.26%, respectively, the highest concentrations were 15,632 mg/L and 182 mg/L, respectively, which are significantly higher than the standards of 250 mg/L for chloride and 50 mg/L for nitrate.
We selected chloride and nitrate as indicators of sea water intrusion and anthropogenic contamination, such as fertilizer use and wastewater intrusion, respectively, because these anions are conservative in groundwater, and high concentrations of these anions make groundwater unsuitable for drinking. The spatial distribution of chloride and nitrate concentrations above the water quality standards is shown in Figure 9. High chloride concentrations were found only in the northern region along the coastal area, which indicates seawater intrusion in the north, such as in the districts of Penjaringan, Pademangan, Tanjung Priok, Cilincing, and Kalideres; this intrusion is spreading to the south in the eastern region of Jakarta, such as Cakung and Duren Sawit Districts. The northwestern region has very high chloride concentrations, which correspond to a depression cone in the same region (Figure 3a). High nitrate concentrations in the groundwater were detected in East Jakarta (Cipayung and Makasar Districts) and the southern region of Jakarta, which may be caused by agricultural fertilizers and/or the improper disposal of human/animal waste.
3.4. Piped Water Development Plan
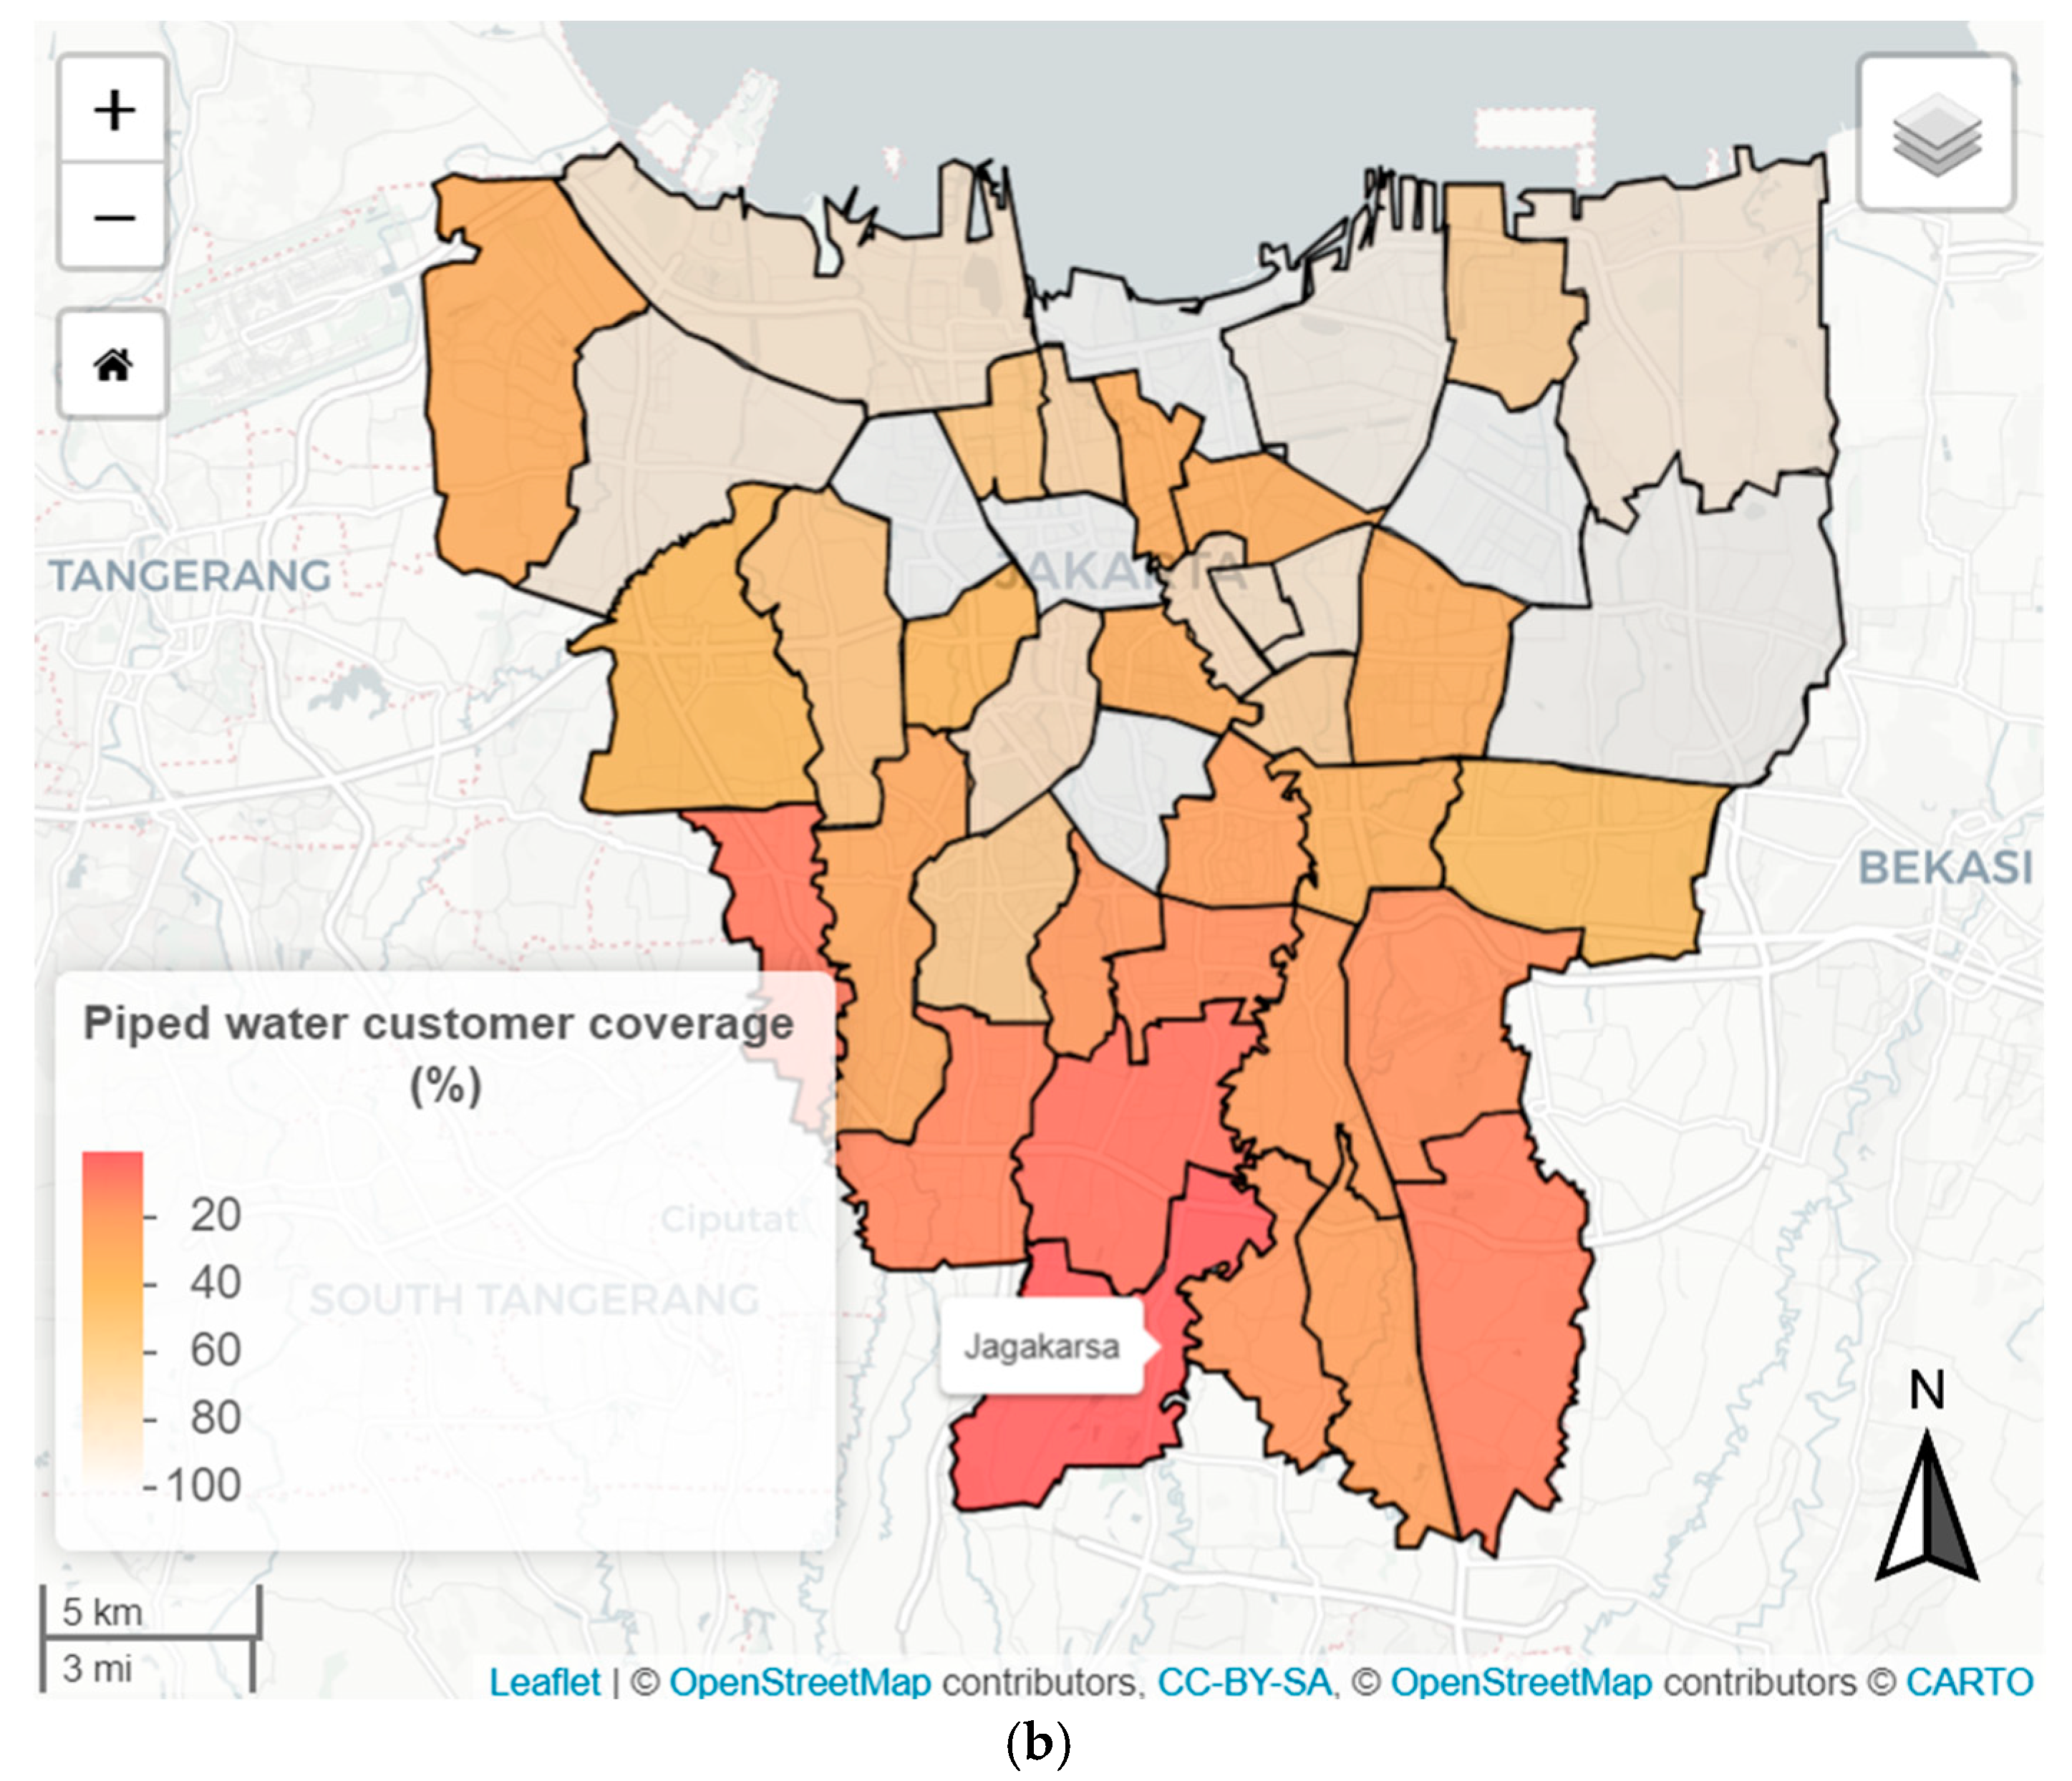
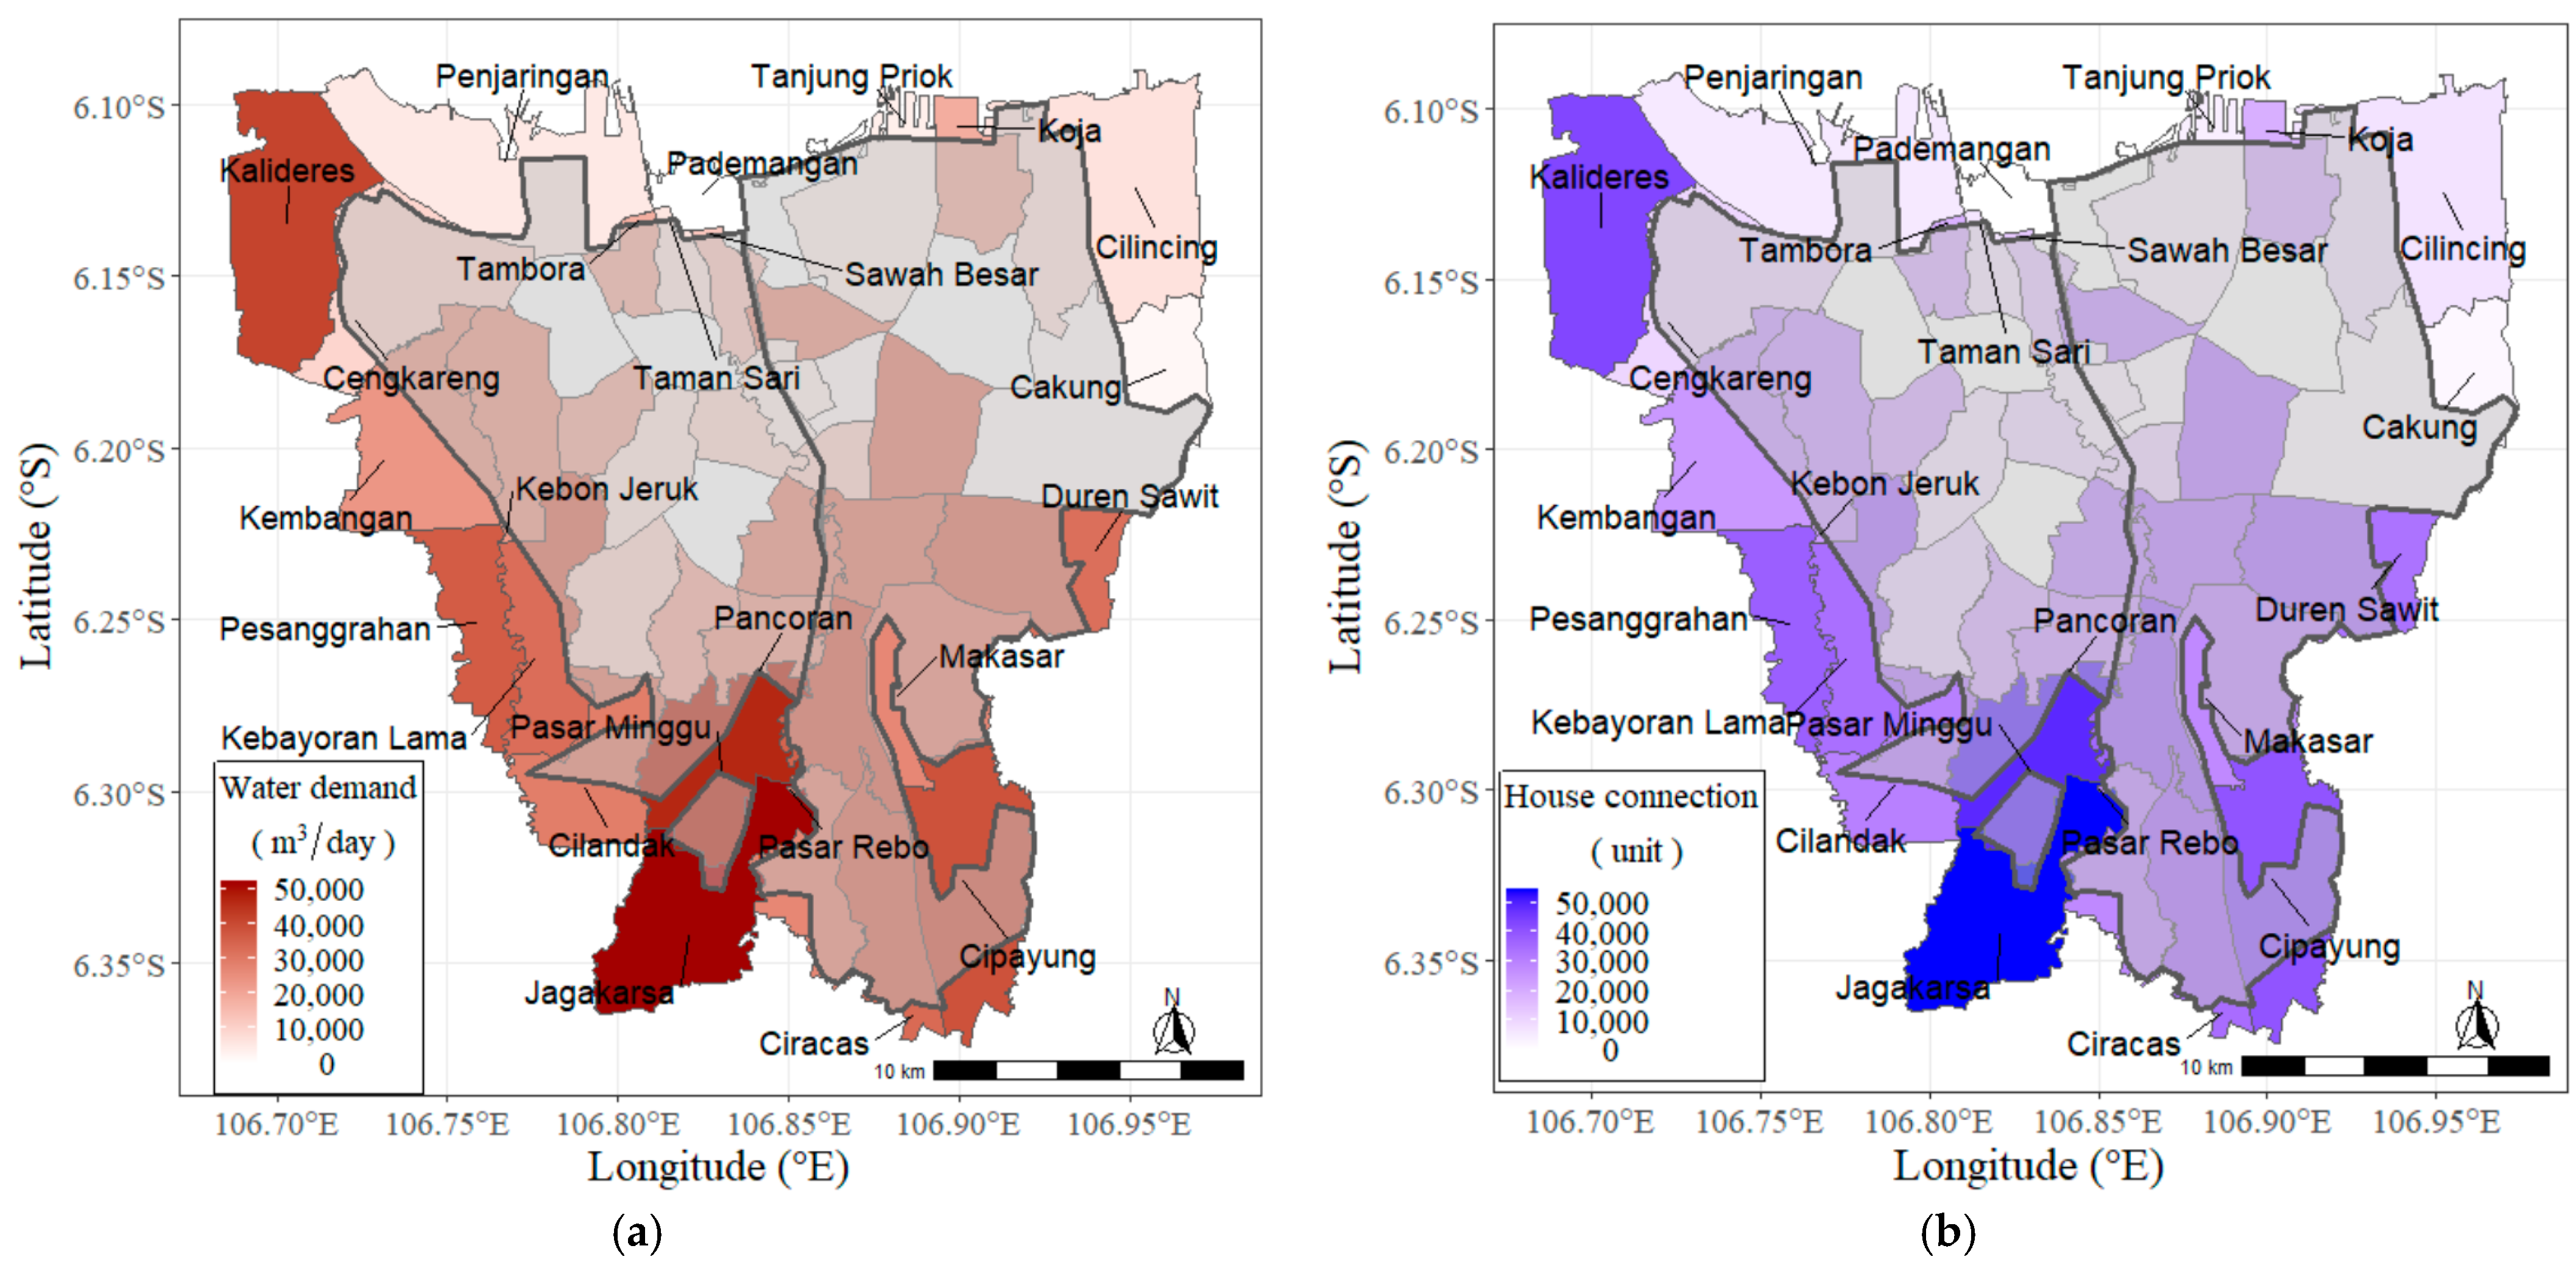
The water demand of the non-connected population per district (Figure 10a) was used to determine the priority zones for piped water development by analyzing the spatial maps of water demand, house connections, districts, and piped water coverage. On the basis of the results of the water demand analysis, the number of house connections to be developed per district was estimated (Figure 10b). The largest number was in Jagakarsa District in the south, followed by Kalideras District in the northwest.
After we had accounted for the various analysis results that have been discussed, the parameters used to select the priority areas for developing piped water service coverage were summarized (Table A2). To prevent land subsidence due to groundwater abstraction, most of the northern region of Jakarta and some of western Jakarta are areas that require piped water supply because only small regions in these areas are covered by piped water, which has resulted in the appearance of extensive and deep depression cones (Figure 3a). The southern region also needs piped water to be developed because there is a depression cone that indicates the potential of extensive land subsidence in the future if groundwater use is not controlled and switched to piped water.
The districts where seawater intrusion has been taking place can also be considered for piped water development. Most of the northern coastal area districts have experienced seawater intrusion, as indicated by the high chloride concentrations in the monitoring wells (Figure 9). Seawater intrusion has also reached the central districts of Jakarta, such as Cakung District in East Jakarta and Kalideres and Cengkareng in West Jakarta, while high nitrate concentrations indicate groundwater contamination by agricultural fertilizers and/or domestic wastewater.
Table 3 shows a summary of the water demand and house connections in the three districts with the highest, median, and lowest water demand as examples. According to these results, the highest demand for piped water development is Jagakarsa District in the south of Jakarta City with the largest number of house connections (54,167), and the area with the smallest number is Cakung District in the east of Jakarta City with 1732 house connections.
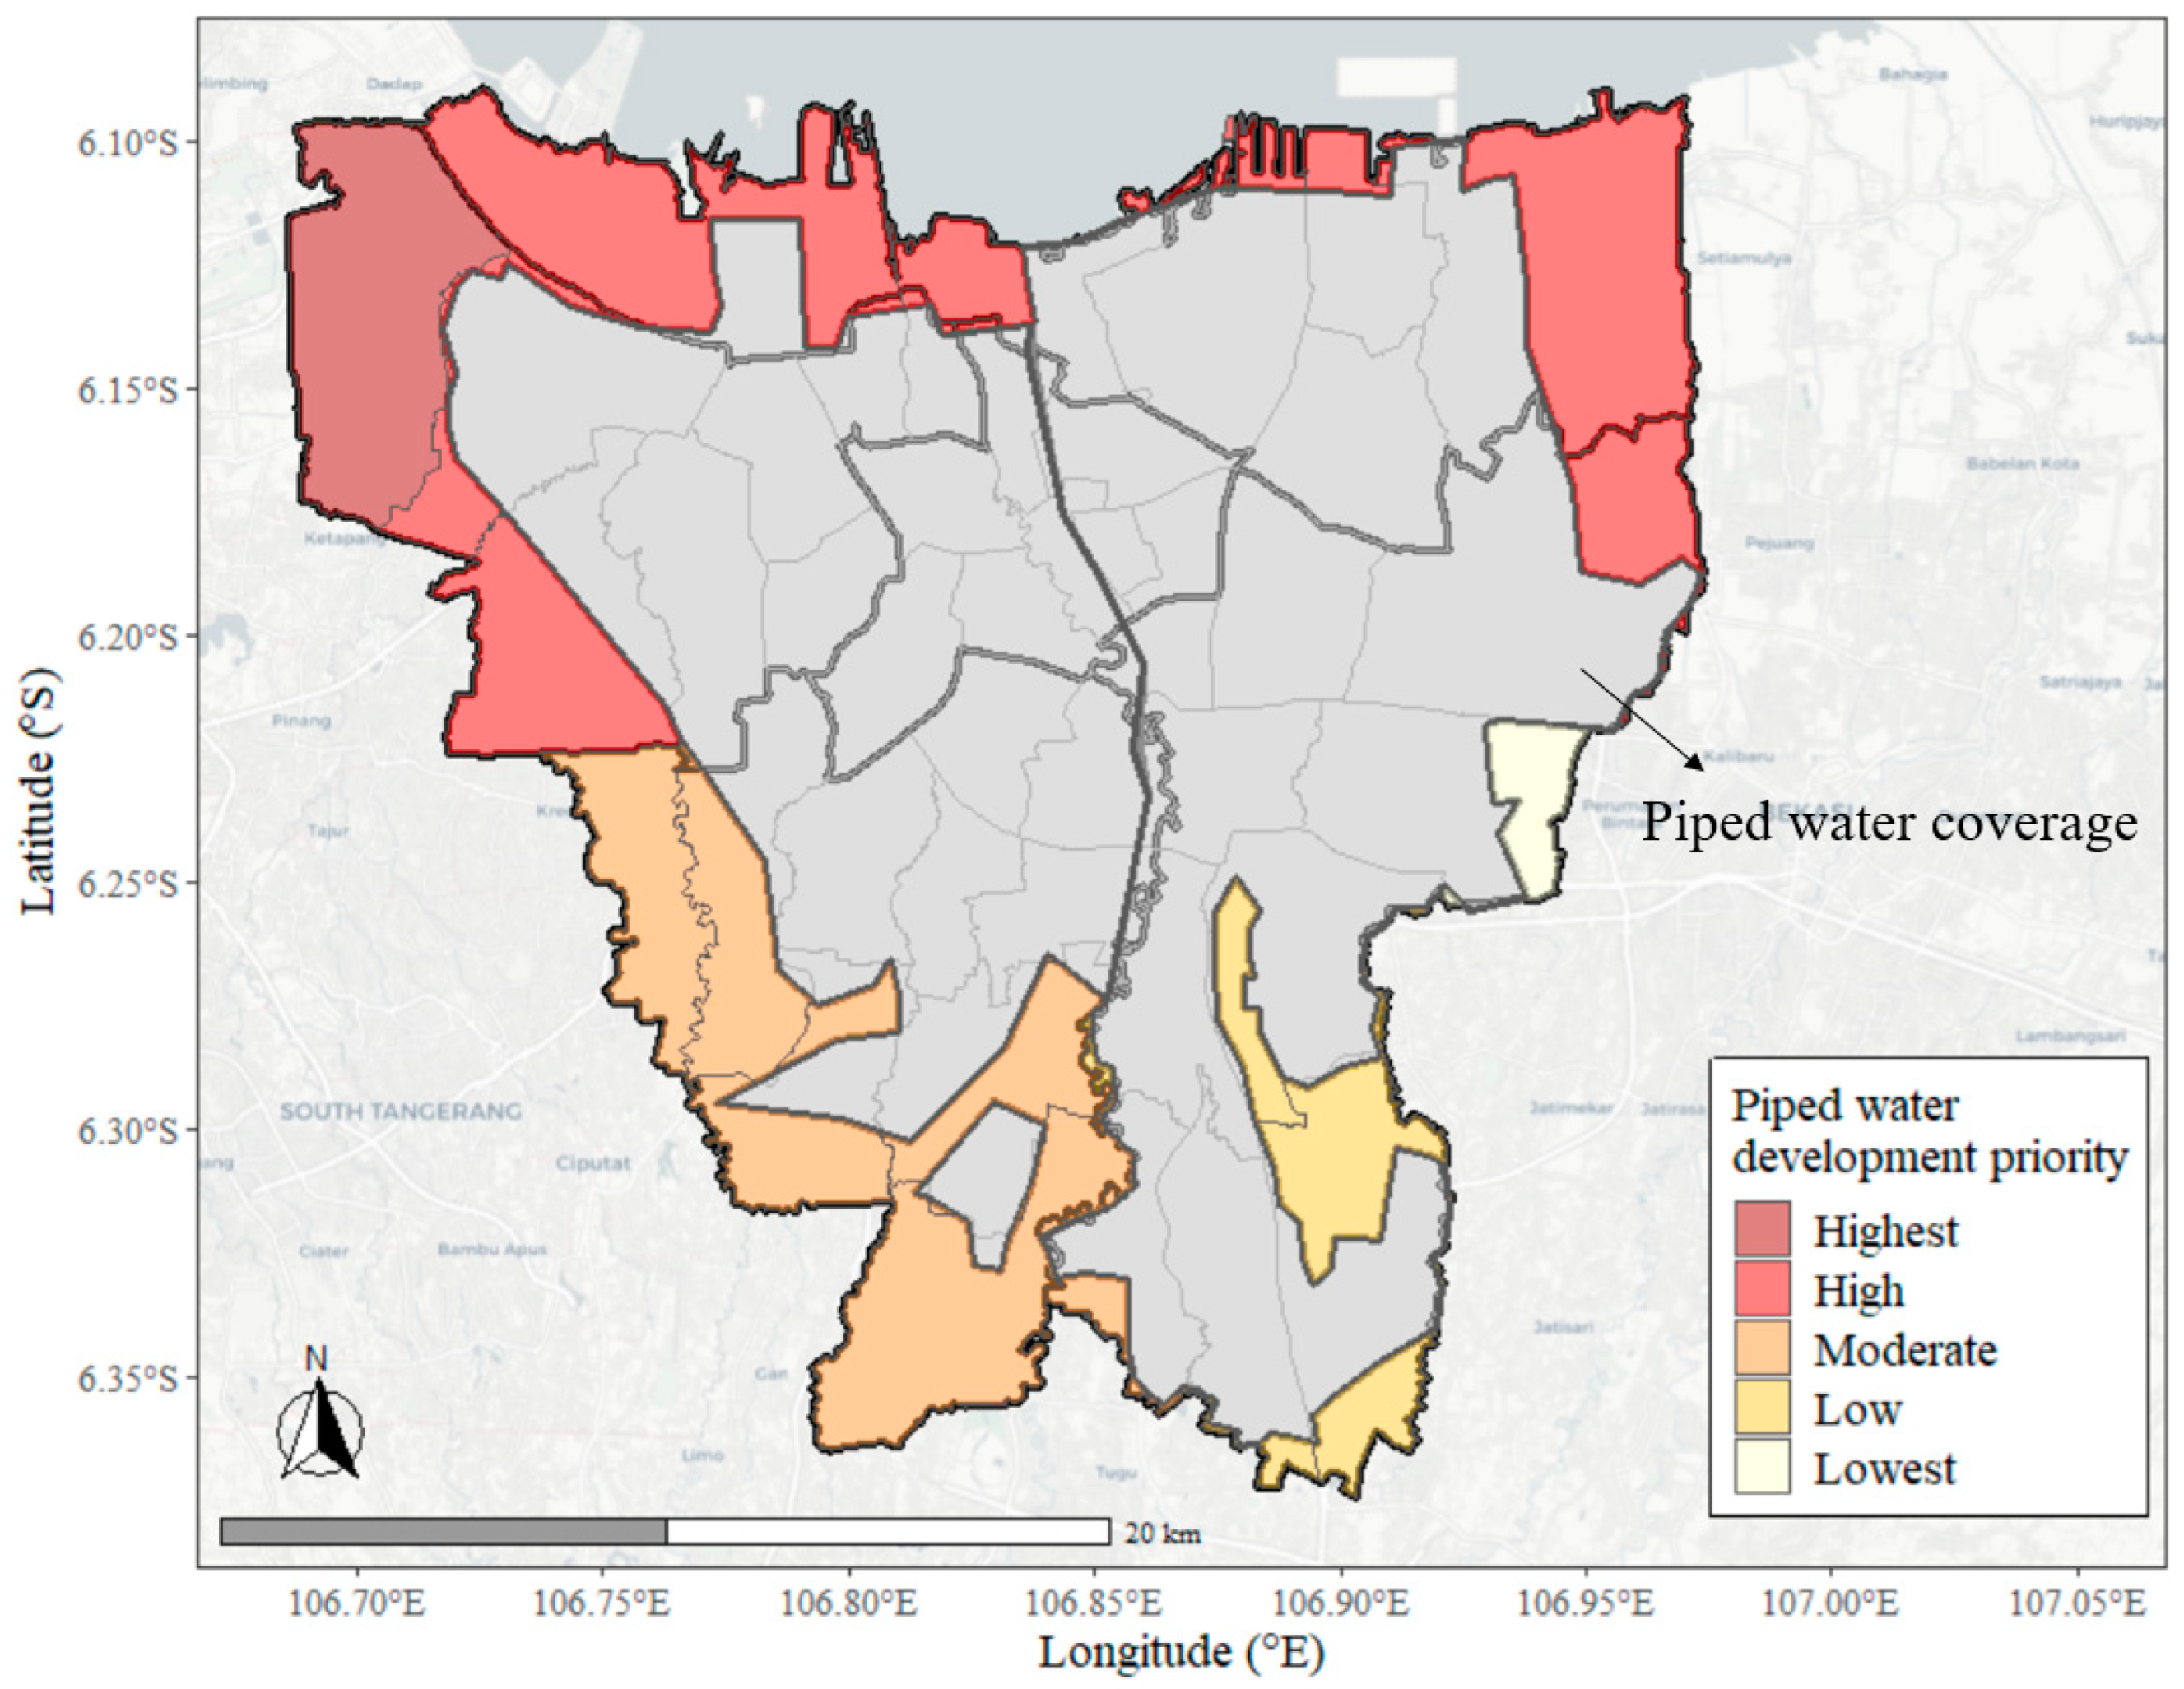
Figure 11 shows the priority map of the piped water development plan. Based on the groundwater quality, land subsidence, groundwater levels, and water demand (Table A2), the first priority for piped water development is the northern coastal regions because, although groundwater abstraction is low, the cone of depression in the north is deep and wide, which has caused extensive land subsidence (Figure 3). In addition, the groundwater in the northern area is salty due to seawater intrusion (Figure 9) and thus cannot be the source of safe drinking water for the people living in the area. Throughout the northern coastal region, the water demand is low, except for Kalideres District (Figure 10). Therefore, Kalideres District is the top priority for piped water development, followed by the other districts in northern Jakarta.
The next priority for piped water development is in the southern region, followed by the eastern regions of Jakarta because the water demand in this area is very high (Figure 10), causing a cone of depression to appear due to the over-abstraction of groundwater (Figure 3), which would cause land subsidence in the future.
4. Discussion
This study assumed that the water consumption of the non-connected consumers is the same as that of the consumers connected to piped water or that their water consumption will be the same as that of connected consumers when they are connected. Although there is no information on the amount of groundwater consumed by households and small-scale commercial consumers, they might use more water than the consumers connected to piped water because they do not have to pay the water tariff, except for the electricity tariff for pumps. However, it is considered reasonable to assume that they would use the same amounts of piped water once they are connected. In addition, it was assumed that all of the large-scale consumers of groundwater are registered and only private households and small-scale commercial and industrial consumers use groundwater without registration. This is also considered to be reasonable because Jakarta implemented regulations requiring large-scale groundwater wells to be registered in 2009 in accordance with Governor Decree No. 37 issued in 2009 regarding the groundwater abstraction tax (Peraturan Gubernur Provinsi Daerah Khusus Ibu Kota Jakarta Nomor 37 Tahun 2009).
Although the additional supply potential was estimated on the basis of the water production capacity of the water treatment plants, their actual supply capacities and the water loss in the distribution systems were not taken into consideration. The proportion of non-revenue water could be as high as 46%, caused by physical water loss, meter inaccuracies, incorrect data entry, and illegal connections [57], which must be brought down in the future to meet the increasing water demand. It was also assumed that the consumers will be willing to connect to the piped water supply systems once they are made accessible. However, it is known that there are so-called zero customers in Jakarta who are not satisfied with the current services of the piped water supply [58]. The connection fee could also be a potential barrier to low-income households connecting to the piped water supply. Thus, it is necessary to overcome these constraints to ensure non-connected households become connected to reduce their groundwater abstraction.
Although the whole area of Jakarta should be covered with piped water supply in the near future to meet all water demands, the controlled use of groundwater, combined with an extension of the piped water supply could be also an inevitable coping strategy to fill the gap between water demand and supply volume. The use of groundwater in a developing city cannot be terminated; however, it can be better managed by considering the geological conditions, groundwater levels, and water quality to alleviate land subsidence. Thus, this study proposed the controlled abstraction of groundwater in a small part of eastern Jakarta, where volcanic layers are dominant (Figure 5b) and groundwater levels are high (Figure 3). The controlled use of groundwater, taking the groundwater quality, geological layers, and groundwater recharge into account, can improve access to drinking water in Jakarta. Groundwater use in volcanic layers is less likely to cause land subsidence than in the areas with sedimentary layers.
More than 90% of the raw water sources for piped water are located outside of the Jakarta area (Figure 1), indicating Jakarta’s high dependence on other provinces providing raw water. In addition, the high water demand and the limited capacity of the water treatment plants have caused a supply shortage of 131,459 m3/d, without taking water loss into account. The development of piped water service coverage takes time, and groundwater use is unavoidable in a growing city such as Jakarta; therefore, in an effort to provide access to safe drinking water, it is necessary to apply groundwater management measures while taking health and the environmental issues into account.
The contributions of this study are as follows: First, this study revealed that the gaps between water demand and supply varied extensively among the 42 districts in Jakarta (Figure 7a), which indicated that access to piped water is not evenly distributed. Thus, this needs to be taken into consideration for controlled groundwater use and piped water development. The need to develop house connections for each district, which was obtained from the results of the water demand of the non-connected population, can be also used to estimate the required investment to expand the coverage area of piped water.
The second contribution of this study is that the spatial analysis method applied in this study enabled us to establish the priority districts for piped water supply coverage. Various parameters, i.e., the water demand, present connection rate to piped water, groundwater abstraction, land subsidence, and groundwater quality, were quantified and taken into consideration for identifying priority districts. The comparative importance of these parameters should be determined by the stakeholders; in this study, water demand, land subsidence, and groundwater quality were selected to set the priority for piped water development because of the urgency to meet the water demand of the population of this area.
The third contribution of this study is that the required amounts of additional piped water supply were quantified for future piped water supply development. However, there are some factors that were not included in this study, such as the investment costs and the time required to extend the piped water, which must also be taken into consideration for the actual piped water plan. Therefore, the steps to be taken in future studies are to update the dataset used in this study to improve the accuracy of the estimated water demand, non-connected population, groundwater abstraction, and groundwater quality. In addition, updating the dataset of groundwater level contours and increasing the numbers of monitoring locations and groundwater quality parameters will improve the accuracy in identifying the areas for controlled groundwater abstraction as an alternative to piped water.
5. Conclusions
Although Jakarta has experienced serious land subsidence for many years, the over-abstraction of groundwater continues due to the limited supply and low service levels of piped water. This study delineated the relationship between the deficiencies in piped water supply and groundwater over-abstraction using GIS and spatial analysis. The correlations between groundwater abstraction and the drawdown of groundwater tables and between groundwater abstraction and land subsidence are clearly shown in the GIS maps. Based on the quantitative data on the piped water consumption per capita, the additional volume of piped water for groundwater consumers in each district was estimated. In addition, from the data on the piped water supply capacity, the gap between water demand and piped water supply, groundwater levels, land subsidence, and groundwater quality, the priority districts for early piped water supply extension were selected, and the total amount of additional piped water supply was estimated. As a result, it was found that the existing water treatment plants could supply more water to meet most of the increased demand for piped water, provided that the water utilities could reduce their water loss and improve their water supply efficiency. The results of this study demonstrated the importance of setting priorities for extending and improving piped water supply services. For this purpose, the methods presented in this study enabled the consolidation of various data on GIS maps, and they would be useful, not only for Jakarta but also other cities where groundwater over-abstraction is prevailing, to make plans for the extension of piped water services to regulate groundwater over-abstraction.
Author Contributions
Conceptualization, R.T., S.K. and S.T.; methodology, R.T. and S.T.; software, R.T. and S.T.; validation, S.K. and S.T.; formal analysis, R.T. and S.T.; investigation, R.T. and S.T.; resources, R.T.; data curation, R.T. and S.T.; writing—original draft preparation, R.T.; writing—review and editing, S.K. and S.T.; visualization, R.T.; supervision, S.K. and S.T.; project administration, S.K. and S.T.; funding acquisition, S.K. and S.T. All authors have read and agreed to the published version of the manuscript.
Funding
This research was supported by the Japan International Cooperation Agency (JICA) through the collaborative program with the University of Tokyo and the scholarship provided to Riza Taftazani for his graduate studies. This study was also funded by a grant-in-aid for scientific research (No. 22H01621) provided by the Japan Society for the Promotion of Sciences (JSPS).
Data Availability Statement
The data used in this study are available from the sources mentioned in the manuscript or would be available upon request.
Acknowledgments
The authors would like to express their gratitude to the Ministry of Public Works and Housing (Kementerian Pekerjaan Umum dan Perumahan Rakyat), the Ministry of Energy and Mineral Resources (Kementerian Energi dan Sumber Daya Mineral), the Groundwater Conservation Agency (Balai Konservasi Air Tanah), the Water Resources Agency of Jakarta (Dinas Sumber Daya Air Provinsi DKI Jakarta), and the Water Utility of Jakarta (PAM JAYA).
Conflicts of Interest
The authors declare no conflict of interest.
Appendix A

Table A1.
Drinking water quality standards 1 related to groundwater.
| No. | Parameter | Maximum Amount Allowed | Remarks (Parameter) |
|---|---|---|---|
| 1 | Chloride | 250 mg/L | Mandatory |
| 2 | Nitrate | 50 mg/L | Mandatory |
| 3 | Sodium | 200 mg/L | Additional |
| 4 | TDS | 500 mg/L | Mandatory |
| 5 | Hardness | 500 mg/L | Mandatory |
| 6 | Sulfate | 250 mg/L | Mandatory |
| 7 | Zinc | 3 mg/L | Mandatory |
| 8 | Nitrite | 3 mg/L | Mandatory |
| 9 | Lead | 0.01 mg/L | Additional |
| 10 | Iron | 0.3 mg/L | Mandatory |
| 11 | Manganese | 0.4 mg/L | Mandatory |
| 12 | pH | 6.5–8.5 | Mandatory |
| 13 | Turbidity | 5 NTU | Mandatory |
| 14 | Color | 15 TCU | Mandatory |
Note: 1 Minister of Health Regulation No. 492/MENKES/PER/IV/2010.
Table A2.
Summary of issues for piped water development.
| No. | District | City | Water Demand and House Connection | Groundwater and Land Subsidence | Chloride | Nitrate |
|---|---|---|---|---|---|---|
| 1 | Cakung | East Jakarta | √ | √ | ||
| 2 | Cipayung | East Jakarta | √ | √ | √ | |
| 3 | Jatinegara | East Jakarta | √ | |||
| 5 | Kramat Jati | East Jakarta | √ | |||
| 6 | Penjaringan | North Jakarta | √ | √ | √ | |
| 7 | Cilincing | North Jakarta | √ | √ | ||
| 8 | Pademangan | North Jakarta | √ | √ | √ | |
| 9 | Tanjung Priok | North Jakarta | √ | √ | √ | |
| 10 | Jagakarsa | South Jakarta | √ | √ | ||
| 11 | Cilandak | South Jakarta | √ | √ | √ | |
| 12 | Mampang Prapatan | South Jakarta | √ | |||
| 13 | Cengkareng | West Jakarta | √ | √ | ||
| 14 | Kalideres | West Jakarta | √ | √ | √ | √ |
| 15 | Kembangan | West Jakarta | √ |
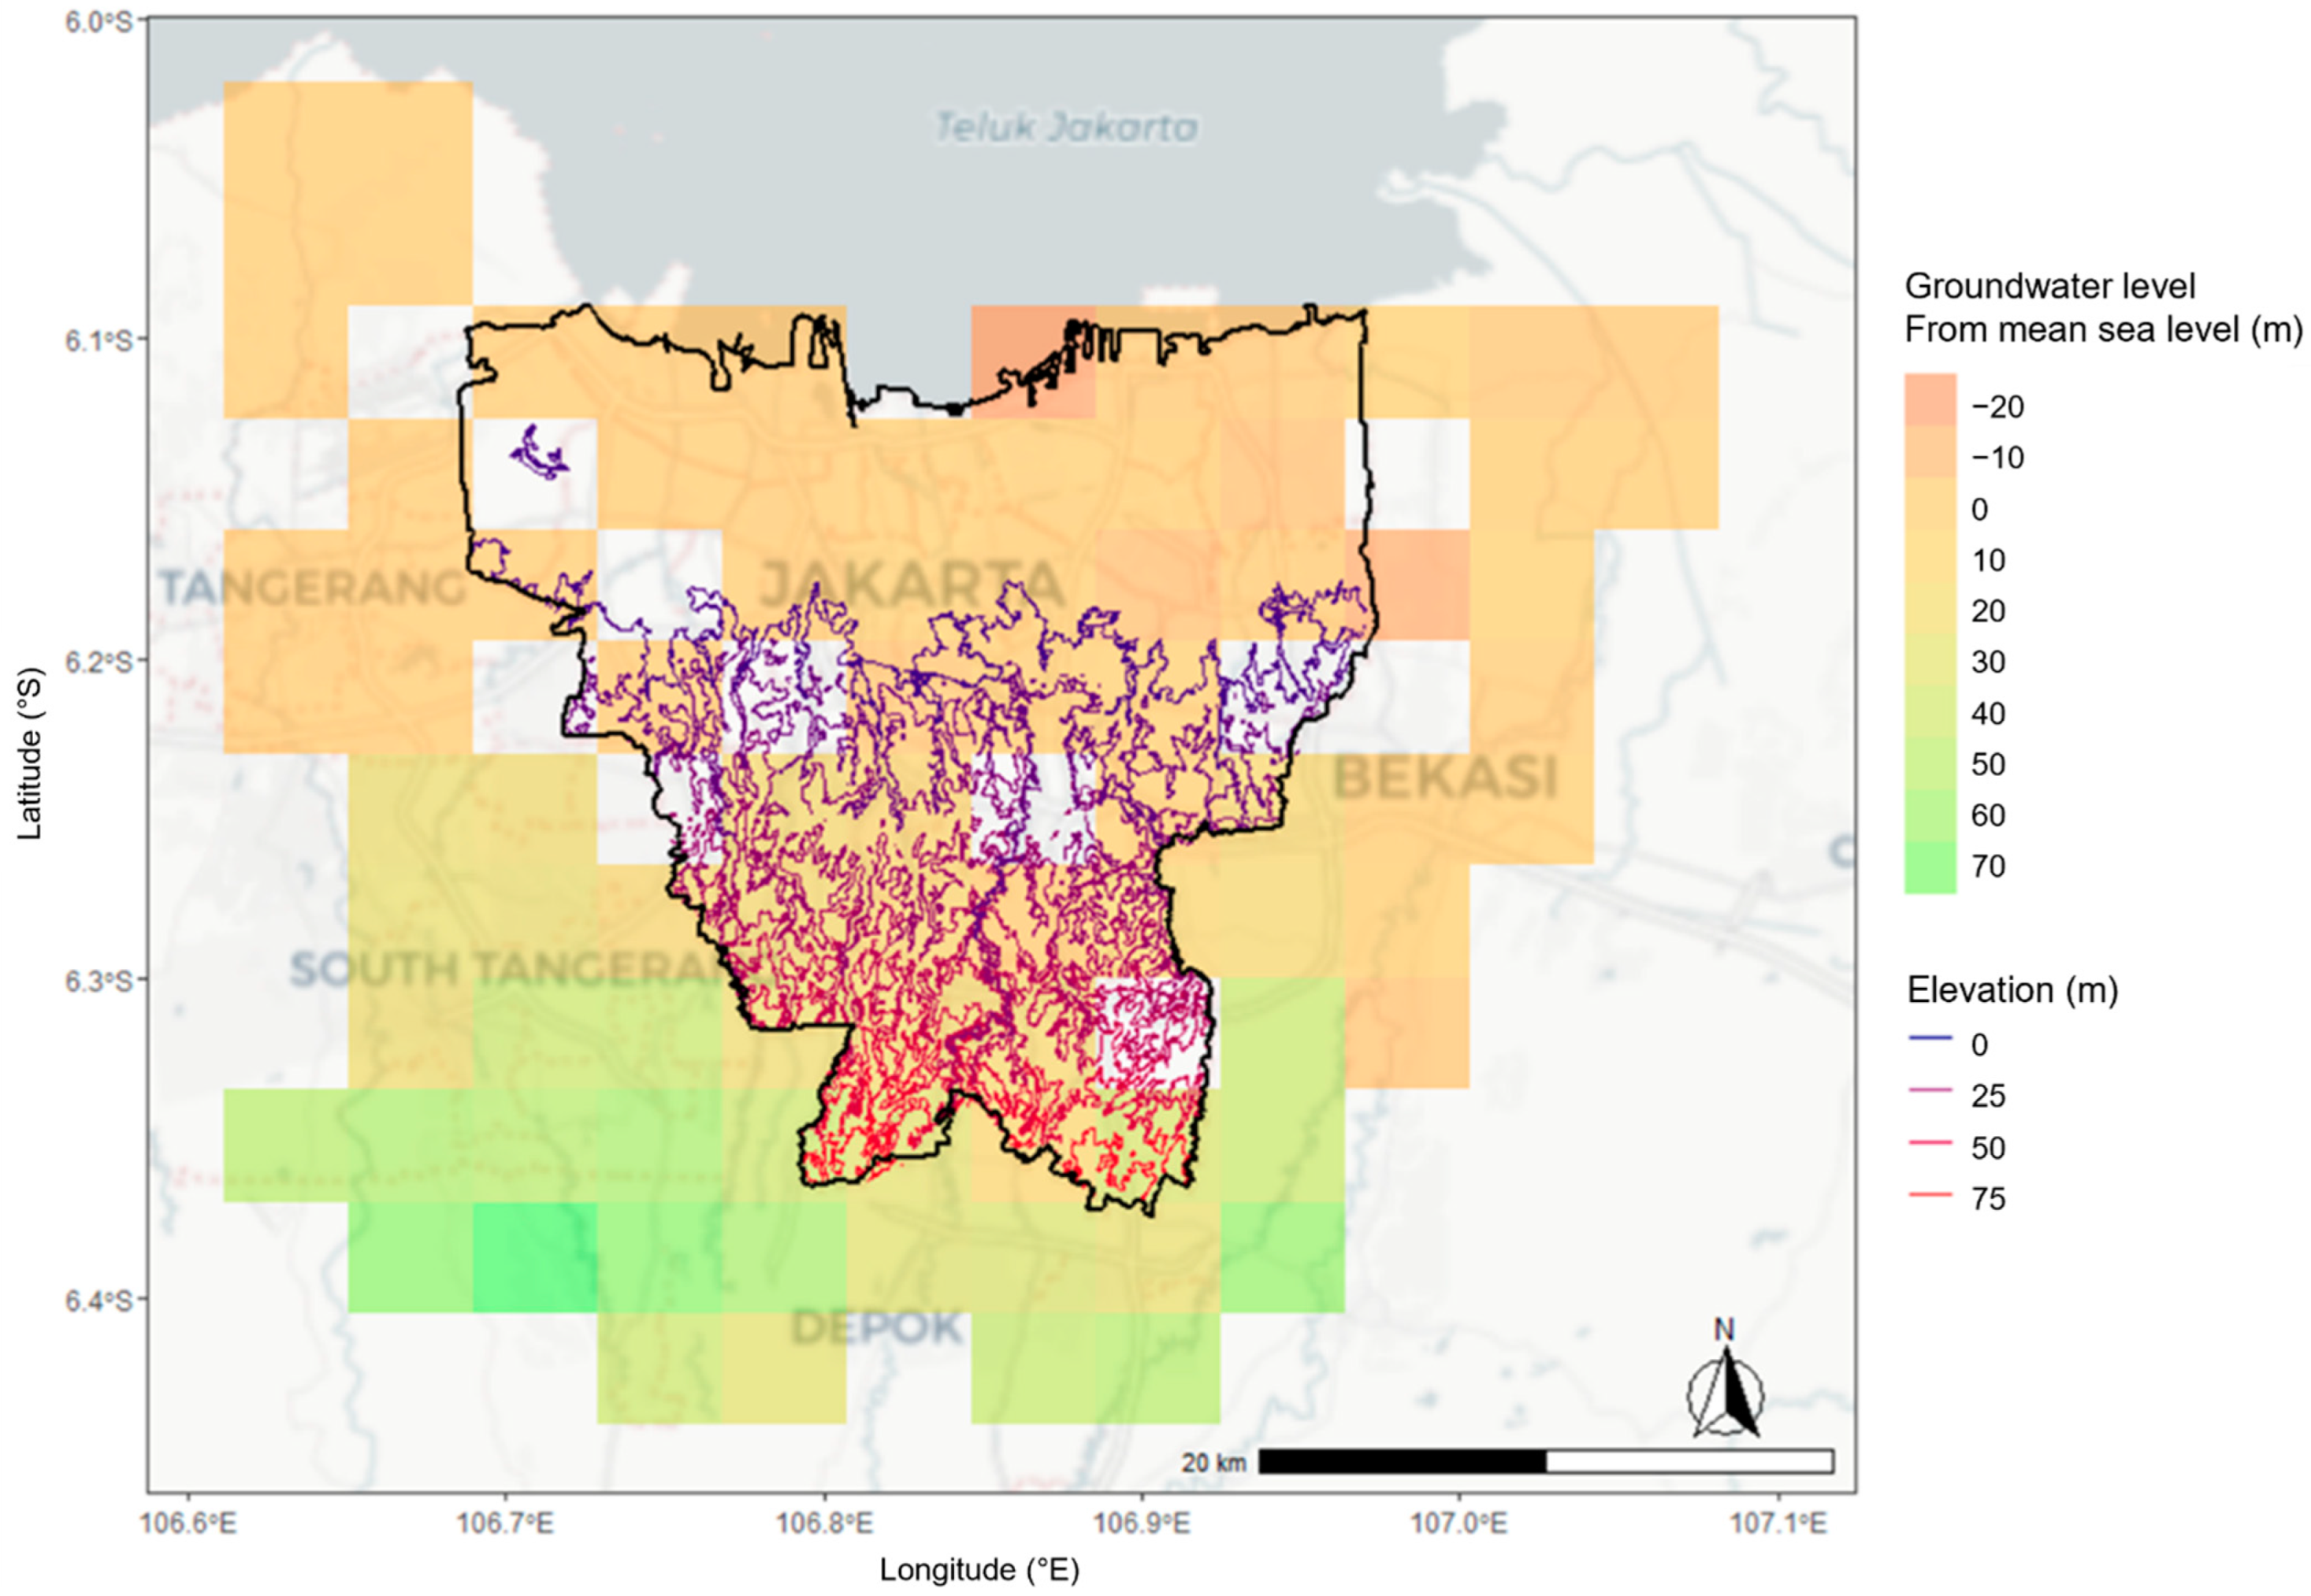
Figure A1.
Raster map of groundwater levels above the mean sea level of Jakarta Bay plotted with the altitude contours in the Jakarta region.
Figure A1.
Raster map of groundwater levels above the mean sea level of Jakarta Bay plotted with the altitude contours in the Jakarta region.

References
- World Bank. Improving Service Levels and Impact on the Poor: A Diagnostic of Water Supply, Sanitation, Hygiene, and Poverty in Indonesia; World Bank: Washington, DC, USA, 2017. [Google Scholar]
- Famiglietti, J.S. The global groundwater crisis. Nat. Clim. Chang. 2014, 4, 945–948. [Google Scholar] [CrossRef] [Green Version]
- Herrera-García, G.; Ezquerro, P.; Tomás, R.; Béjar-Pizarro, M.; López-Vinielles, J.; Rossi, M.; Mateos, R.; Carreón-Freyre, D.; Lambert, J.; Teatini, P.; et al. Mapping the global threat of land subsidence. Science 2021, 371, 34–36. [Google Scholar] [CrossRef] [PubMed]
- Furuno, K.; Kagawa, A.; Kazaoka, O.; Kusuda, T.; Nirei, H. Groundwater management based on monitoring of land subsidence and groundwater levels in the Kanto Groundwater Basin, Central Japan. Proc. IAHS 2015, 372, 53–57. [Google Scholar] [CrossRef] [Green Version]
- Kearns, T.; Wang, G.; Bao, Y.; Jiang, J.; Lee, D. Current land subsidence and groundwater level changes in the Houston Metropolitan Area (2005–2012). J. Surv. Eng. 2015, 141, 4. [Google Scholar] [CrossRef]
- Minderhoud, P.S.J.; Erkens, G.; Pham, V.H.; Vuong, B.T.; Stouthamer, E. Assessing the potential of the multi-aquifer subsurface of the Mekong Delta (Vietnam) for land subsidence due to groundwater extraction. Proc. IAHS 2015, 372, 73–76. [Google Scholar] [CrossRef] [Green Version]
- Calderhead, A.; Martel, R.; Garfias, J.; Rivera, A.; Therrien, R. Sustainable Management for Minimizing Land Subsidence of an Over-Pumped Volcanic Aquifer System: Tools for Policy Design. Water Resour. Manag. 2012, 26, 1847–1864. [Google Scholar] [CrossRef]
- Asian Development Bank. Indonesia Country Water Assessment, 2016. Available online: https://www.adb.org (accessed on 23 March 2022).
- Abidin, H.Z.; Andreas, H.; Gumilar, I.; Gamal, M.; Fukuda, Y.; Deguchi, T. Land Subsidence and Urban Development in Jakarta (Indonesia). In Proceedings of the 7th FIG Regional Conference Spatial Data Serving People: Land Governance and the Environment–Building the Capacity, Hanoi, Vietnam, 19–22 October 2009. [Google Scholar]
- Yosua, H.; Soeryantono, H.; Marthanty, D.R. Jakarta Groundwater Basin Recharge—Discharge Boundary Area Map: A Preliminary Study. In IOP Conference Series: Materials Science and Engineering; IOP Publishing: Seoul, Korea, 2019; Volume 690. [Google Scholar]
- Lo, F.C.; Yeung, Y.M. Emerging World Cities in Pacific Asia; United Nations University Press: Tokyo, Japan, 1995; ISBN 9280809075. [Google Scholar]
- Central Statistical Agency (BPS). Population in Jakarta. Available online: https://jakarta.bps.go.id (accessed on 23 March 2021).
- National Development Planning Agency (BAPPENAS). Available online: https://www.bappenas.go.id (accessed on 30 April 2022).
- World Bank Group. Reducing Inequalities in Water Supply, Sanitation, and Hygiene in the Era of the Sustainable Development Goals; World Bank: Washington, DC, USA, 2017. [Google Scholar]
- Jakarta Water Utility (PAM Jaya). Coverage and Production Data. Available online: https://www.pamjaya.co.id (accessed on 27 April 2022).
- Abidin, H.Z.; Djaja, R.; Darmawan, D.; Hadi, S.; Akbar, A.; Rajiyowiryono, H.; Sudibyo, Y.; Meilano, I.; Kasuma, M.A.; Kahar, J.; et al. Land Subsidence of Jakarta (Indonesia) and its Geodetic Monitoring System. Natural Hazards; Kluwer Academic Publishers: Dordrecht, The Netherlands, 2001; pp. 365–387. [Google Scholar] [CrossRef]
- Djaja, R.; Rais, J.; Abidin, H.Z.; Wedyanto, K. Land subsidence of Jakarta Metropolitan Area. In Proceedings of the 3rd FIG regional conference, Jakarta, Indonesia, 3–7 October 2004. [Google Scholar]
- Abidin, H.Z.; Andreas, H.; Djaja, R.; Darmawan, D.; Gamal, M. Land subsidence characteristics of Jakarta between 1997 and 2005, as estimated using GPS surveys. Gps Solut. 2008, 12, 23–32. [Google Scholar] [CrossRef]
- DKI Jakarta Provincial Government: Open Data. Available online: https://data.jakarta.go.id (accessed on 26 April 2022).
- Energy and Mineral Resources Agency of Jakarta: Groundwater Monitoring and Subsidence of the Jakarta Groundwater. Available online: https://bkat.esdm.go.id (accessed on 15 March 2021).
- Bott, L.; Schone, T.; Illigner, J.; Haghighi, M.H.; Gisevius, K.; Braun, B. Land Subsidence in Jakarta and Semarang Bay—The Relationship between physical processes, risk perception, and household adaptation. Ocean. Coast. Manag. 2021, 211, 105775. [Google Scholar] [CrossRef]
- Phi, T.H.; Strokova, L.A. Prediction maps of land subsidence caused by groundwater exploitation in Hanoi, Vietnam. Resour.-Effic. Technol. 2015, 1, 80–89. [Google Scholar] [CrossRef]
- Schmidt, G.; Soefner, B.; Soekardi, O. Possibilities for Groundwater Development for the City of Jakarta, Indonesia; IAHS Publ., International Association of Hydrological Sciences: Wallingford, England, 1990; pp. 233–242. Available online: https://bkat.esdm.go.id/sites/default/files/referensi/Sukardi_0.pdf (accessed on 15 March 2021).
- Babel, M.S.; Gupta, A.D.; Domingo, N.D.S. Land Subsidence: A consequence of groundwater over-exploitation in Bangkok, Thailand. Int. Rev. Environ. Strateg. 2006, 6, 307–327. [Google Scholar]
- Kagabu, M.; Delinom, R.M.; Lubis, R.F.; Shimada, J.; Taniguchi, M. Groundwater characteristics in Jakarta Area, Indonesia. RISET Geol. Dan Pertamb. 2010, 20, 69–79. [Google Scholar] [CrossRef] [Green Version]
- Apip; Sagala, S.A.H.; Pingping, L. Overview of Jakarta water-related environmental challenges. In Water and Urban Initiatives Working Paper Series; United Nations University Institute for the Advanced Study of Sustainability: Tokyo, Japan, 2015. [Google Scholar]
- Prayogi, T.E.; Abdillah, F.; Nasution, E.M.; Nababan, J.R.; Memed, M.W.; Daryanto, A. Groundwater quality assessment of unconfined aquifer system for suitable drinking determination at Northern Jakarta groundwater basin. In IOP Conference Series: Earth and Environmental Science; IOP Publishing: Bristol, UK, 2015. [Google Scholar]
- Sidabutar, N.V.; Hartono, D.M.; Soesilo, T.E.B.; Hutapea, R.C. The Quality of raw water for drinking water unit in Jakarta-Indonesia. In AIP Conference Proceedings; AIP Publishing LLC: Melville, NY, USA, 2017. [Google Scholar] [CrossRef] [Green Version]
- Vollaard, A.M.; Ali, S.; Smet, J.; Asten, H.V.; Widjaja, S.; Visser, L.G.; Surjadi, C.; Dissel, J.T.V. A survey of the supply and bacteriologic quality of drinking water and sanitation in Jakarta, Indonesia. In Southeast Asian J Trop Med Public Health: Typhoid and Paratyphoid Fever in Jakarta, Indonesia; National Library of Medicine: Bethesda, MD, USA, 2005. Available online: https://pubmed.ncbi.nlm.nih.gov (accessed on 22 April 2022).
- Luo, P.; Kang, S.; Apip; Zhou, M.; Lyu, J.; Aisyah, S.; Binaya, M.; Regmi, R.K.; Nover, D. Water quality trend assessment in Jakarta: A rapidly growing Asian megacity. PLoS ONE 2019, 14, e0219009. [Google Scholar] [CrossRef] [PubMed] [Green Version]
- Kakar, N.; Kakar, D.M.; Barrech, S. Land subsidence caused by groundwater exploitation in Quetta and surrounding region, Pakistan. Proc. Int. Assoc. Hydrol. Sci. 2020, 382, 595–607. [Google Scholar] [CrossRef]
- Chu, H.; Hsiao, C.; Chang, L. Optimizing groundwater supply with land subsidence limit. In Proceedings of the World Environmental and Water Resources Congress 2007: Restoring Our Natural Habitat, Tampa, FL, USA, 15–19 May 2007; American Society of Civil Engineers: Reston, VA, USA, 2007. [Google Scholar] [CrossRef]
- Tomas, R.; Herrera, G.; Lopez-Sanchez, J.M.; Vicente, F.; Cuenca, A.; Mallorqui, J.J. Study of the land subsidence in Orihuela city (SE Spain) using PSI data: Distribution, evolution and correlation with conditioning and triggering factors. Eng. Geol. 2010, 115, 105–121. [Google Scholar] [CrossRef]
- Tzampoglou, P.; Loupasakis, C. Evaluating geological and geotechnical data for the study of land subsidence phenomena at the perimeter of the Amyntaio coalmine, Greece. Int. J. Min. Sci. Technol. 2017, 28, 601–612. [Google Scholar] [CrossRef]
- Navarro-Hernandez, M.I.; Tomas, R.; Lopez-Sanchez, J.M.; Cardenas-Tristan, A.; Mallorqui, J.J. Spatial Analysis of Land Subsidence in the San Luis Potosi Valley Induced by Aquifer Overexploitation Using the Coherent Pixels Technique (CPT) and Sentinel-1 InSAR Observation. Remote Sens. 2020, 12, 3822. [Google Scholar] [CrossRef]
- Zhu, L.; Gong, H.; Li, X.; Wang, R.; Chen, B.; Dai, Z.; Teatini, P. Land subsidence due to groundwater withdrawal in the northern Beijin plain, China. Eng. Geol. 2015, 193, 243–255. [Google Scholar] [CrossRef]
- Mallik, S.; Mishra, U.; Paul, N. Groundwater suitability analysis for drinking using GIS based fuzzy logic. Ecol. Indic. 2021, 121, 107179. [Google Scholar] [CrossRef]
- Farid, H.U.; Mahmood-Khan, Z.; Ali, A.; Mubeen, M.; Anjum, M.N. Site-specific aquifer characterization and identification of potential groundwater areas in Pakistan. Pol. J. Environ. Stud. 2016, 26. [Google Scholar] [CrossRef]
- Kindie, A.T.; Enku, T.; Moges, M.A.; Geremew, B.S.; Atinkut, H.B. Spatial Analysis of Groundwater Potential Using GIS Based Multi Criteria Decision Analysis Method in Lake Tana Basin, Ethiopia. In International Conference on Advances of Science and Technology; Springer: Cham, Switzerland, 2020. [Google Scholar]
- Lubis, R.F. Urban Hydrogeology in Indonesia: A Highlight from Jakarta. In IOP Conference Series: Earth and Environmental Science; IOP Publishing: Bandung, Indonesia, 2018. [Google Scholar]
- Yosua, H.; Soeryantono, H.; Marthanty, D.R. Jakarta groundwater basin recharge—Discharge Boundary Area Map: A Preliminary Study. IOP Conf. Ser. Mater. Sci. Eng. 2019, 690, 012008. [Google Scholar] [CrossRef] [Green Version]
- Onodeta, S.; Saito, M.; Hosono, T.; Taniguchi, M.; Shimada, J.; Umegawa, Y.; Lubis, R.F.; Buapeng, S.; Delinnom, R. Effects of intensive urbanization on the intrusion of shallow groundwater into deep groundwater: Examples from Bangkok and Jakarta. Sci. Total. Environ. 2008, 404, 401–410. [Google Scholar] [CrossRef] [PubMed]
- Karunia, T.U.; Faisi Ikhwali, F. Effects of population and land-use change on water balance in DKI Jakarta. IOP Conf. Ser. Earth Environ. Sci. 2021, 622, 012045. [Google Scholar] [CrossRef]
- Murdohardono, D.; Sudarsono, U. Land subsidence monitoring system in Jakarta. In Proceedings of the Symposium on Japan—Indonesia IDNDR Project: Volcanology, Tectonics, Flood and Sediment Hazard, Bandung, Indonesia, 21–23 September 1998; pp. 243–256. [Google Scholar]
- Rismianto, D.; Mak, W. Environmental aspects of groundwater extraction in DKI Jakarta: Changing views. In Proceedings of the 22nd Annual Convention of the Indonesian Association of Geologists, Bandung, Indonesia, 6–9 December 1993; pp. 327–345. [Google Scholar]
- Seizarwati, W.; Prasetya, D.; Syahidah, M.; Rengganis, H. Groundwater Flow Simulation of Jakarta with Some Scenarios Using IMOD. 2018. Available online: https://doi.org/10.32679/jsda.v14i2.459 (accessed on 10 April 2022).
- Phien-wej, N.; Giao, P.H.; Nutalaya, P. Land Subsidence in Bangkok, Thailand. Eng. Geol. 2006, 82, 187–201. [Google Scholar] [CrossRef]
- Delinom, R.M. Groundwater management issues in the Greater Jakarta area. Indonesia, 2007. In Proceedings of the International Workshop on Integrated Watershed Management for Sustainable Water Use in a Humid Tropical Region, JSPS-DGHE Joint Research Project, Tsukuba, Japan, 31 October 2007. [Google Scholar]
- Indonesia Geospatial Portal. Available online: https://tanahair.indonesia.go.id/portal-web (accessed on 22 March 2021).
- American Waterworks Association. Forecasting Urban Water Demand, 2nd ed.; American Water Works Association: Denver, CO, USA, 2008; ISBN 978158321537. Available online: https://engage.awwa.org (accessed on 8 October 2022).
- Hashimoto, R.; Kazama, S.; Hashimoto, T.; Oguma, K.; Takizawa, S. Planning method for conjunctive use of urban water resources based on quantitative water demand estimation models and groundwater regulation index in Yangon City, Myanmar. J. Clean. Prod. 2022, 367, 133123. [Google Scholar] [CrossRef]
- Ostovari, Y.; Zare, S.; Harchegani, H.B.; Asgari, K. Effects of geological formation on groundwater quality in Lordegan Region, Chahar-mahal-va-Bakhtiyari, Iran. Int. J. Agric. Crop Sci. 2013, 5, 1983–1992. [Google Scholar]
- Nair, I.S.; Renganayaki, S.P.; Elango, L. Identification of seawater intrusion by Cl/Br ratio and mitigation through managed aquifer recharge in aquifers north of Chennai, India. J. Groundw. Res. 2013, 2, 19. [Google Scholar]
- Panjaitan, D.; Tarigan, J.; Rauf, A.; Nababan, E.S.M. Determining sea water intrusion in shallow aquifer using Chloride Bicarbonate Ratio Method. In IOP Conference Series: Earth and Environmental Science; IOP Publishing: Medan, Indonesia, 2018; Available online: https://iopscience.iop.org (accessed on 25 April 2022).
- Minister of Health Regulation No. 492/MENKES/PER/IV/2010 Regarding Drinking Water Quality Standards. Available online: https://www.regulasip.id (accessed on 13 March 2022).
- Maharani, A.M.; Evawani, E. Utilization of residual space on Ciliwung riverbank. IOP Conf. Ser. Earth Environ. Sci. 2019, 248, 012072. [Google Scholar]
- Tempo: PAM Jaya Aims to Suppress Water Pipe Leakage Down to 24% in 2023. Available online: https://en.tempo.co (accessed on 21 May 2022).
- Ismowati, M. Profile of PAM Jaya and Private Partners in Clean Water Supply Jakarta (Case Study Year 1998–2012). KnE Soc. Sci. 2018, 3, 481–493. [Google Scholar] [CrossRef]
Figure 1.
(a) Water sources and water treatment plants (modified from PAM Jaya) [15]. (b) Water supply areas of the two operators: PALYJA and AETRA (modified from PAM Jaya) [15].

Figure 2.
GPS stations and monitoring wells retrieved by web scraping [20].
Figure 2.
GPS stations and monitoring wells retrieved by web scraping [20].

Figure 3.
(a) Groundwater level below ground level and land subsidence rates and (b) groundwater level below ground level and piped water service area. Note: the areas indicated by the light blue color are the service areas of piped water.
Figure 3.
(a) Groundwater level below ground level and land subsidence rates and (b) groundwater level below ground level and piped water service area. Note: the areas indicated by the light blue color are the service areas of piped water.

Figure 4.
(a) Estimated groundwater abstraction per month in each district. (b) Registered groundwater abstraction per month in each district.
Figure 4.
(a) Estimated groundwater abstraction per month in each district. (b) Registered groundwater abstraction per month in each district.

Figure 5.
(a) Geological layers in Jakarta’s groundwater basin. (b) Areas of controlled groundwater abstraction.
Figure 5.
(a) Geological layers in Jakarta’s groundwater basin. (b) Areas of controlled groundwater abstraction.

Figure 6.
Water demand and supply in Jakarta.

Figure 7.
(a) Water demand and supply and the demand–supply gap per district. (b) Percentage of the population served by piped water per district.
Figure 7.
(a) Water demand and supply and the demand–supply gap per district. (b) Percentage of the population served by piped water per district.


Figure 8.
Violation rates of the groundwater quality standards in Jakarta.

Figure 9.
Chloride and nitrate concentrations in groundwater monitoring wells.

Figure 10.
(a) Water demand of the non-connected population per district. (b) Number of piped water connections to be developed in each district.
Figure 10.
(a) Water demand of the non-connected population per district. (b) Number of piped water connections to be developed in each district.

Figure 11.
Priority areas for piped water development.

Table 1.
Administrative city/regency and population in the province of DKI Jakarta.
| No. | Administrative City/Regency | Population 1 |
|---|---|---|
| 1 | Central Jakarta | 1,127,593 |
| 2 | East Jakarta | 3,146,725 |
| 3 | North Jakarta | 1,797,871 |
| 4 | South Jakarta | 2,309,643 |
| 5 | West Jakarta | 2,505,315 |
| 6 | Thousand Islands | 28,716 |
| Total | 10,915,863 |
Note: 1 Census, Central Statistical Agency (2019).
Table 2.
Water treatment plants in Jakarta.
| Region | Water Treatment Plant 2 | Capacity (m3/d) | Total (m3/d) |
|---|---|---|---|
| PALYJA | Pejompongan 1 and 2 | 544,320 | 840,240 |
| Cilandak | 34,560 | ||
| Distribution Central Reservoir (DCR 4 and 5)–Tangerang Water Utility | 241,920 | ||
| Taman Kota | 12,960 | ||
| Cikokol | 6480 | ||
| AETRA | Buaran 1 and 2 | 518,400 | 907,200 |
| Pulo Gadung | 388,800 | ||
| Grand Total | 1,747,440 |
Note: 2 Jakarta Water Utility (PAM Jaya) [15].
Table 3.
Maximum, median, and minimum water demand.
| No. | District | Population | Water Demand (m3/day) | House Connections (Units) | Remarks |
|---|---|---|---|---|---|
| 1 | Jagakarsa | 351,039 | 60,470 | 54,167 | Highest |
| 2 | Pancoran | 171,845 | 25,117 | 22,499 | Median |
| 3 | Cakung | 555,511 | 1933 | 1732 | Lowest |
Publisher’s Note: MDPI stays neutral with regard to jurisdictional claims in published maps and institutional affiliations. |
© 2022 by the authors. Licensee MDPI, Basel, Switzerland. This article is an open access article distributed under the terms and conditions of the Creative Commons Attribution (CC BY) license (https://creativecommons.org/licenses/by/4.0/).
Share and Cite
MDPI and ACS Style
Taftazani, R.; Kazama, S.; Takizawa, S. Spatial Analysis of Groundwater Abstraction and Land Subsidence for Planning the Piped Water Supply in Jakarta, Indonesia. Water 2022, 14, 3197. https://doi.org/10.3390/w14203197
AMA Style
Taftazani R, Kazama S, Takizawa S. Spatial Analysis of Groundwater Abstraction and Land Subsidence for Planning the Piped Water Supply in Jakarta, Indonesia. Water. 2022; 14(20):3197. https://doi.org/10.3390/w14203197
Chicago/Turabian StyleTaftazani, Riza, Shinobu Kazama, and Satoshi Takizawa. 2022. "Spatial Analysis of Groundwater Abstraction and Land Subsidence for Planning the Piped Water Supply in Jakarta, Indonesia" Water 14, no. 20: 3197. https://doi.org/10.3390/w14203197
Note that from the first issue of 2016, this journal uses article numbers instead of page numbers. See further details here.