
N2O Emission from Partial Nitrification and Full Nitrification in Domestic Wastewater Treatment Process
1
Department of Municipal Engineering, Yancheng Institute of Technology, Yancheng 224051, China
2
Engineering Laboratory for Advanced Municipal Wastewater Treatment and Reuse Technology, Engineering Research Center of Beijing, Beijing University of Technology, Beijing 100124, China
*
Author to whom correspondence should be addressed.
Water 2022, 14(20), 3195; https://doi.org/10.3390/w14203195
Submission received: 29 August 2022
/
Revised: 2 October 2022
/
Accepted: 8 October 2022
/
Published: 11 October 2022
(This article belongs to the Special Issue Biological Treatment of Sewage and Resource Utilization of Sludge)
Abstract
:Using actual domestic wastewater as the research object, nitrogen compounds and their combinations were added to different nitrification (partial nitrification, full nitrification) processes to investigate nitrous oxide (N2O) emission and its nitrification mechanisms. The presence of influent NH4+ was the driving force of N2O emission during nitrification. Compared with full nitrification, NO2− in partial nitrification more readily generated N2O by denitrification. Under the proportional gradient of NH4+-N:NO2−-N/NO3−-N, 30:0, 20:10, 10:20, and 0:30, total N2O emissions during partial nitrification were 2.81, 11.30, 65.20, and 11.67 times greater than the total N2O emissions during full nitrification. Full nitrification was more beneficial to N2O emission reduction. This provides a control strategy for N2O emission reduction in wastewater treatment processes under the background of reducing the production of greenhouse gases.
1. Introduction
Nitrous oxide (N2O) is a potent greenhouse gas whose greenhouse effect exceeds CO2 by ~300 times [1]. N2O is also a potential ozone depleting substance (ODS) [2]. Wastewater biological treatment is an anthropogenic source of N2O emissions, and both nitrification and denitrification processes produce N2O [3,4,5,6]. Full nitrification involves two steps: NH4+ oxidization to NO2− via NH2OH utilizing Ammonia Oxidizing Bacteria (AOB) followed by subsequent oxidation of NH2OH to NO2− by AOB (the energy generation step); Secondly, NO2− is further oxidized to NO3− using Nitrite Oxidizing Bacteria (NOB). In this process, ammonia mono-plus oxidase (AMO) catalyzes the oxidation of NH3 to NH2OH and O2 acts as the electron acceptor [7]. Hydroxylamine oxidase (HAO) catalyzes the oxidation of NH2OH to NO2− and O2 acts as the main electron acceptor [8]. In the nitrification process, there are two possible pathways for N2O emission as a byproduct: (1) N2O is produced during autotrophic denitrification by AOB, NO2− acts as an electron acceptor, and is converted into N2O via NO using nitrite reductase and nitric oxide reductase [9,10]; (2) N2O is produced by the incomplete oxidation of NH2OH [11,12,13].
A few studies have reported some operational control factors related to N2O emission regarding full nitrification, such as dissolved oxygen (DO), temperature, pH, Sludge Retention Time (SRT), salinity, and toxic substances [14,15,16,17,18,19,20,21]. However, fewer studies on N2O emission during partial nitrification have been published. Most studies were conducted using culture medium and artificial wastewater, which does not accurately simulate the complex actual nitrification.
In this study, a Sequencing Batch Reactor (SBR) and specific test rules explored N2O emission and some nitrification mechanisms using partial and full nitrification of sludge cultivated with actual domestic wastewater. These results provide a theoretical basis for the control of N2O emission in wastewater treatment.
2. Methods
2.1. Sludge and Wastewater
Two 12L SBRs were used for cultivation of partial and full nitrification sludge and the index of domestic wastewater inflow is shown in Table 1. The traditional full nitrification operation mode was as follows. The average operational cycle was 420 min, which included feeding (30 min), aeration (240 min), anoxic denitrification (120 min), and settling (30 min), 3 cycles per day, with the DO was 2 mg/L and Mixed Liquid Suspended Solids (MLSS) remaining at about 3000 mg/L. SRT was 20 days, and the rate of nitrate accumulation during full nitrification was about 99%. The partial nitrification operation mode was similar to that for full nitrification, except the DO was 1 mg/L and running temperature was 30 °C, SRT was 11 days; the rate of nitrite accumulation during partial nitrification was about 98%. After anoxic denitrification, the effluent’s composition, consisting of NH4+-N, NO2−-N, and NO3−-N were all below 1 mg/L. The full nitrification and partial nitrification sludge taken from the SBRs was aerated for 12 h, then washed 3 times with deionized water repeatedly, for batch testing. The effluent’s COD was less than 50 mg/L and could not be oxidized for longer.
2.2. Batch Test Rules
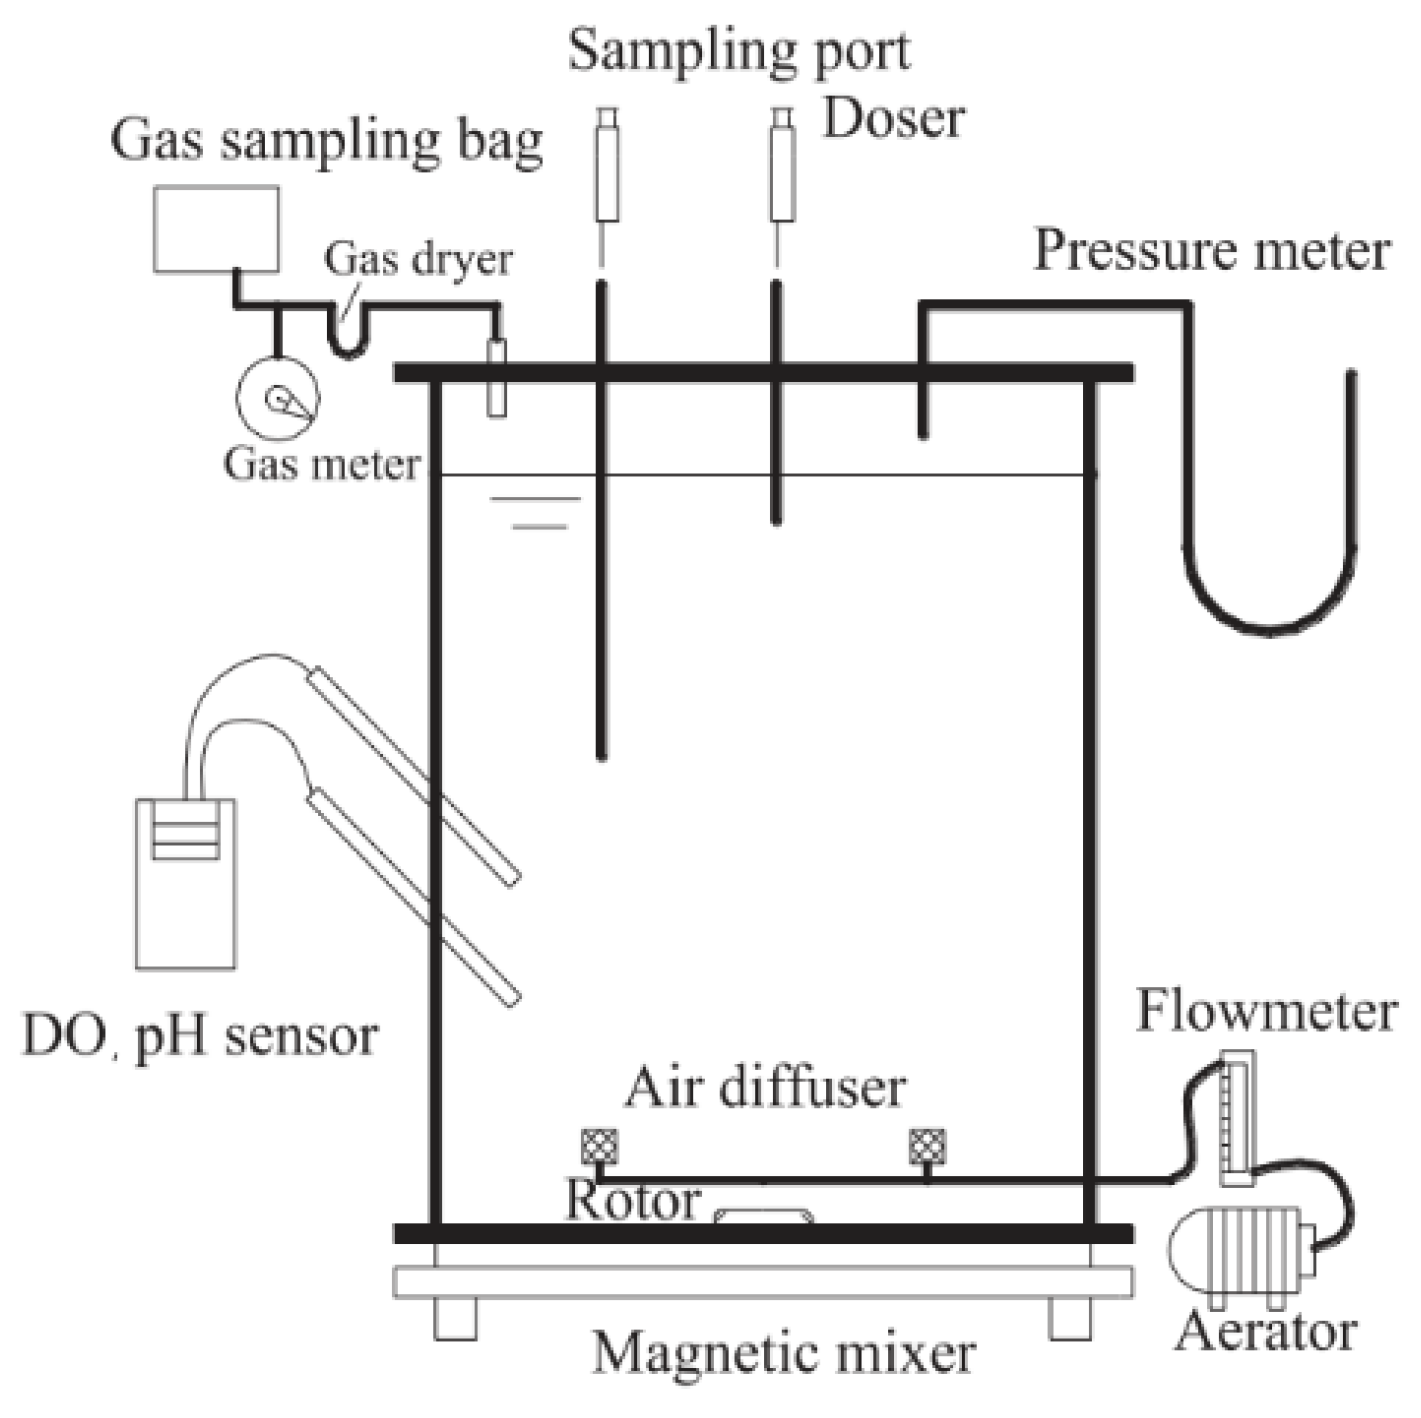
The experimental batch test reactor is shown in Figure 1. The effective volume of the reactor was 3 L. At the beginning of each batch test, 1 L of concentrated full nitrification and partial nitrification sludge was added into the reactor, followed by 2 L of wastewater, and the MLSS were controlled at 3000 mg/L. Nitrogen compounds, DO and pH levels were then adjusted for the batch set upon commencing operation (Table 2). The running time for batch tests was 180 min.
2.3. Detection Method
COD, NH4+-N, NO2−-N, NO3−-N were measured according to methods previously described [22]. DO, pH, T were measured by an oxygen, pH and temperature meter (WTW 340i, WTW Company, Munich, Germany). The Mixed Liquid Suspended Solids concentration was measured at the beginning and at the end of each test to obtain an average value, which was used for the calculation of the NH4+-N oxidation rate, NOx−-N production rate and N2O emission rate. The total N2O production consists of the N2O emitted in the gaseous phase (emission-gas N2O) and the N2O dissolved in the mixed liquid phase (dissolved N2O). The N2O concentrations in gas samples were analyzed in triplicate using a gas chromatograph (Agilent 6890N, Santa Clara, CA, USA). The overhead space method was used to analyze the dissolved N2O. Water and N2O samples were taken at 30-min intervals.
3. Results and Discussion
3.1. N2O Emission in Partial Nitrification Process
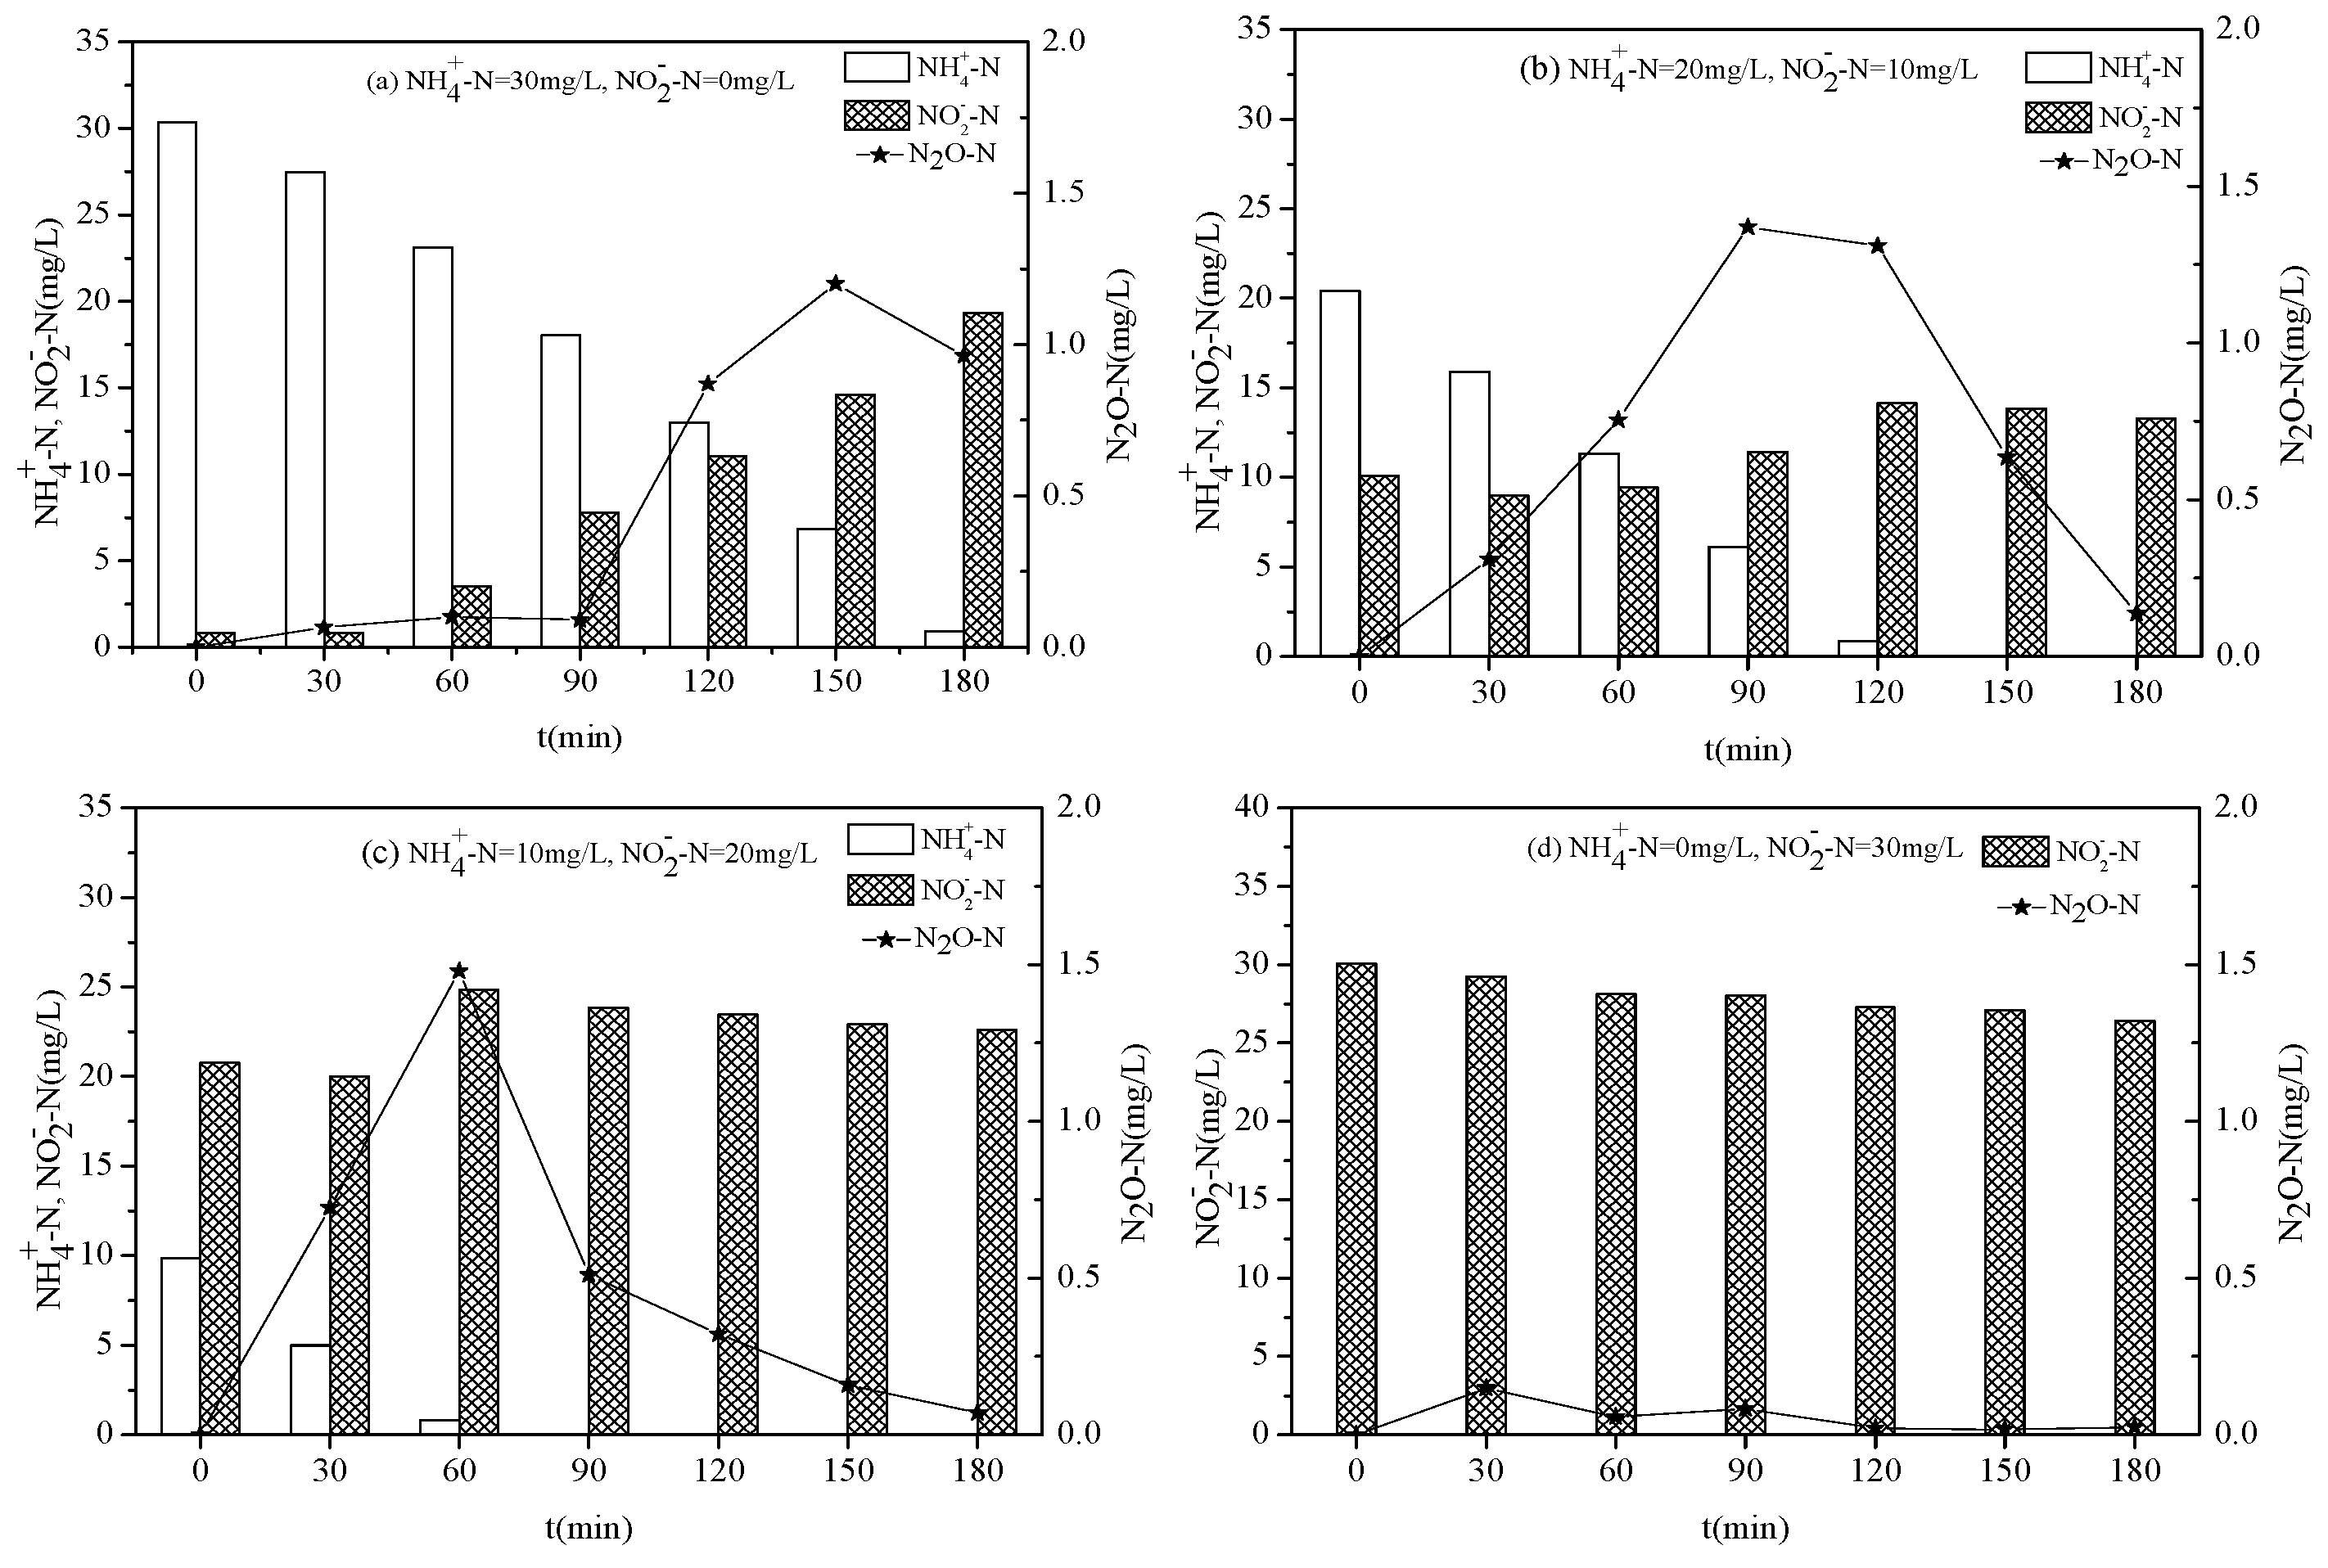
Figure 2 shows the variations of N2O emissions under different NH4+-N and NO2−-N ratios during partial nitrification (partial nitrification’s effluent +NH4Cl/NaNO2). As shown in Figure 2a–c, the maximum N2O emission occurred when NH4+-N was about to be oxidized completely, and its maximum value was 1.20 mg/L, 1.37 mg/L, and 1.48 mg/L. When the ratios of NH4+-N to NO2−-N were 30:0, 20:10, and 10:20, the time for N2O to reach its highest level decreased, and the N2O emission rates increased; they were 0.16, 0.30, and 0.49, respectively (in mgN/(gMLSS·L·h). This indicated that the initial emission rate of N2O increased with added NO2− in the presence of NH4+-N. This was due to the electrons provided by the NH4+ oxidation process being used for autotrophic denitrification of AOB in the partial nitrification process.
When NH4+ oxidation provided electrons, higher concentrations of electron acceptor NO2− led to increased autotrophic denitrification of AOB. As shown in Figure 2b,c, NO2− concentrations decreased with NH4+ oxidation in the first 30 min of the reaction. However, in the absence of NH4+, as shown in Figure 2d, even a NO2− concentration of 30 mgN/L did not result in N2O emission above 0.15 mg/L. This reaction resulted in denitrification of only 3.5 mgN/L of NO2−. The lack of BOD (effluent) suggested its electron source might be internal organic matter (PHB) stored in AOB sludge [23,24], hydrogen, and pyruvate [25]. In addition, under four different ratios of NH4+-N and NO2−-N, the total production of N2O was 3.29, 4.52, 3.26, and 0.35 mgN/L, respectively. N2O production was maximized when NH4+-N and NO2−-N ratios were 20:10. This was due to the presence of electron acceptor NO2− (10 mgN/L), and contrasted with the minimal levels observed with the ratio of 30:0 (Figure 2b). Compared with 10:20, the reaction in Figure 2b had more electron donors from NH4+.
3.2. N2O Emission in Full Nitrification Process
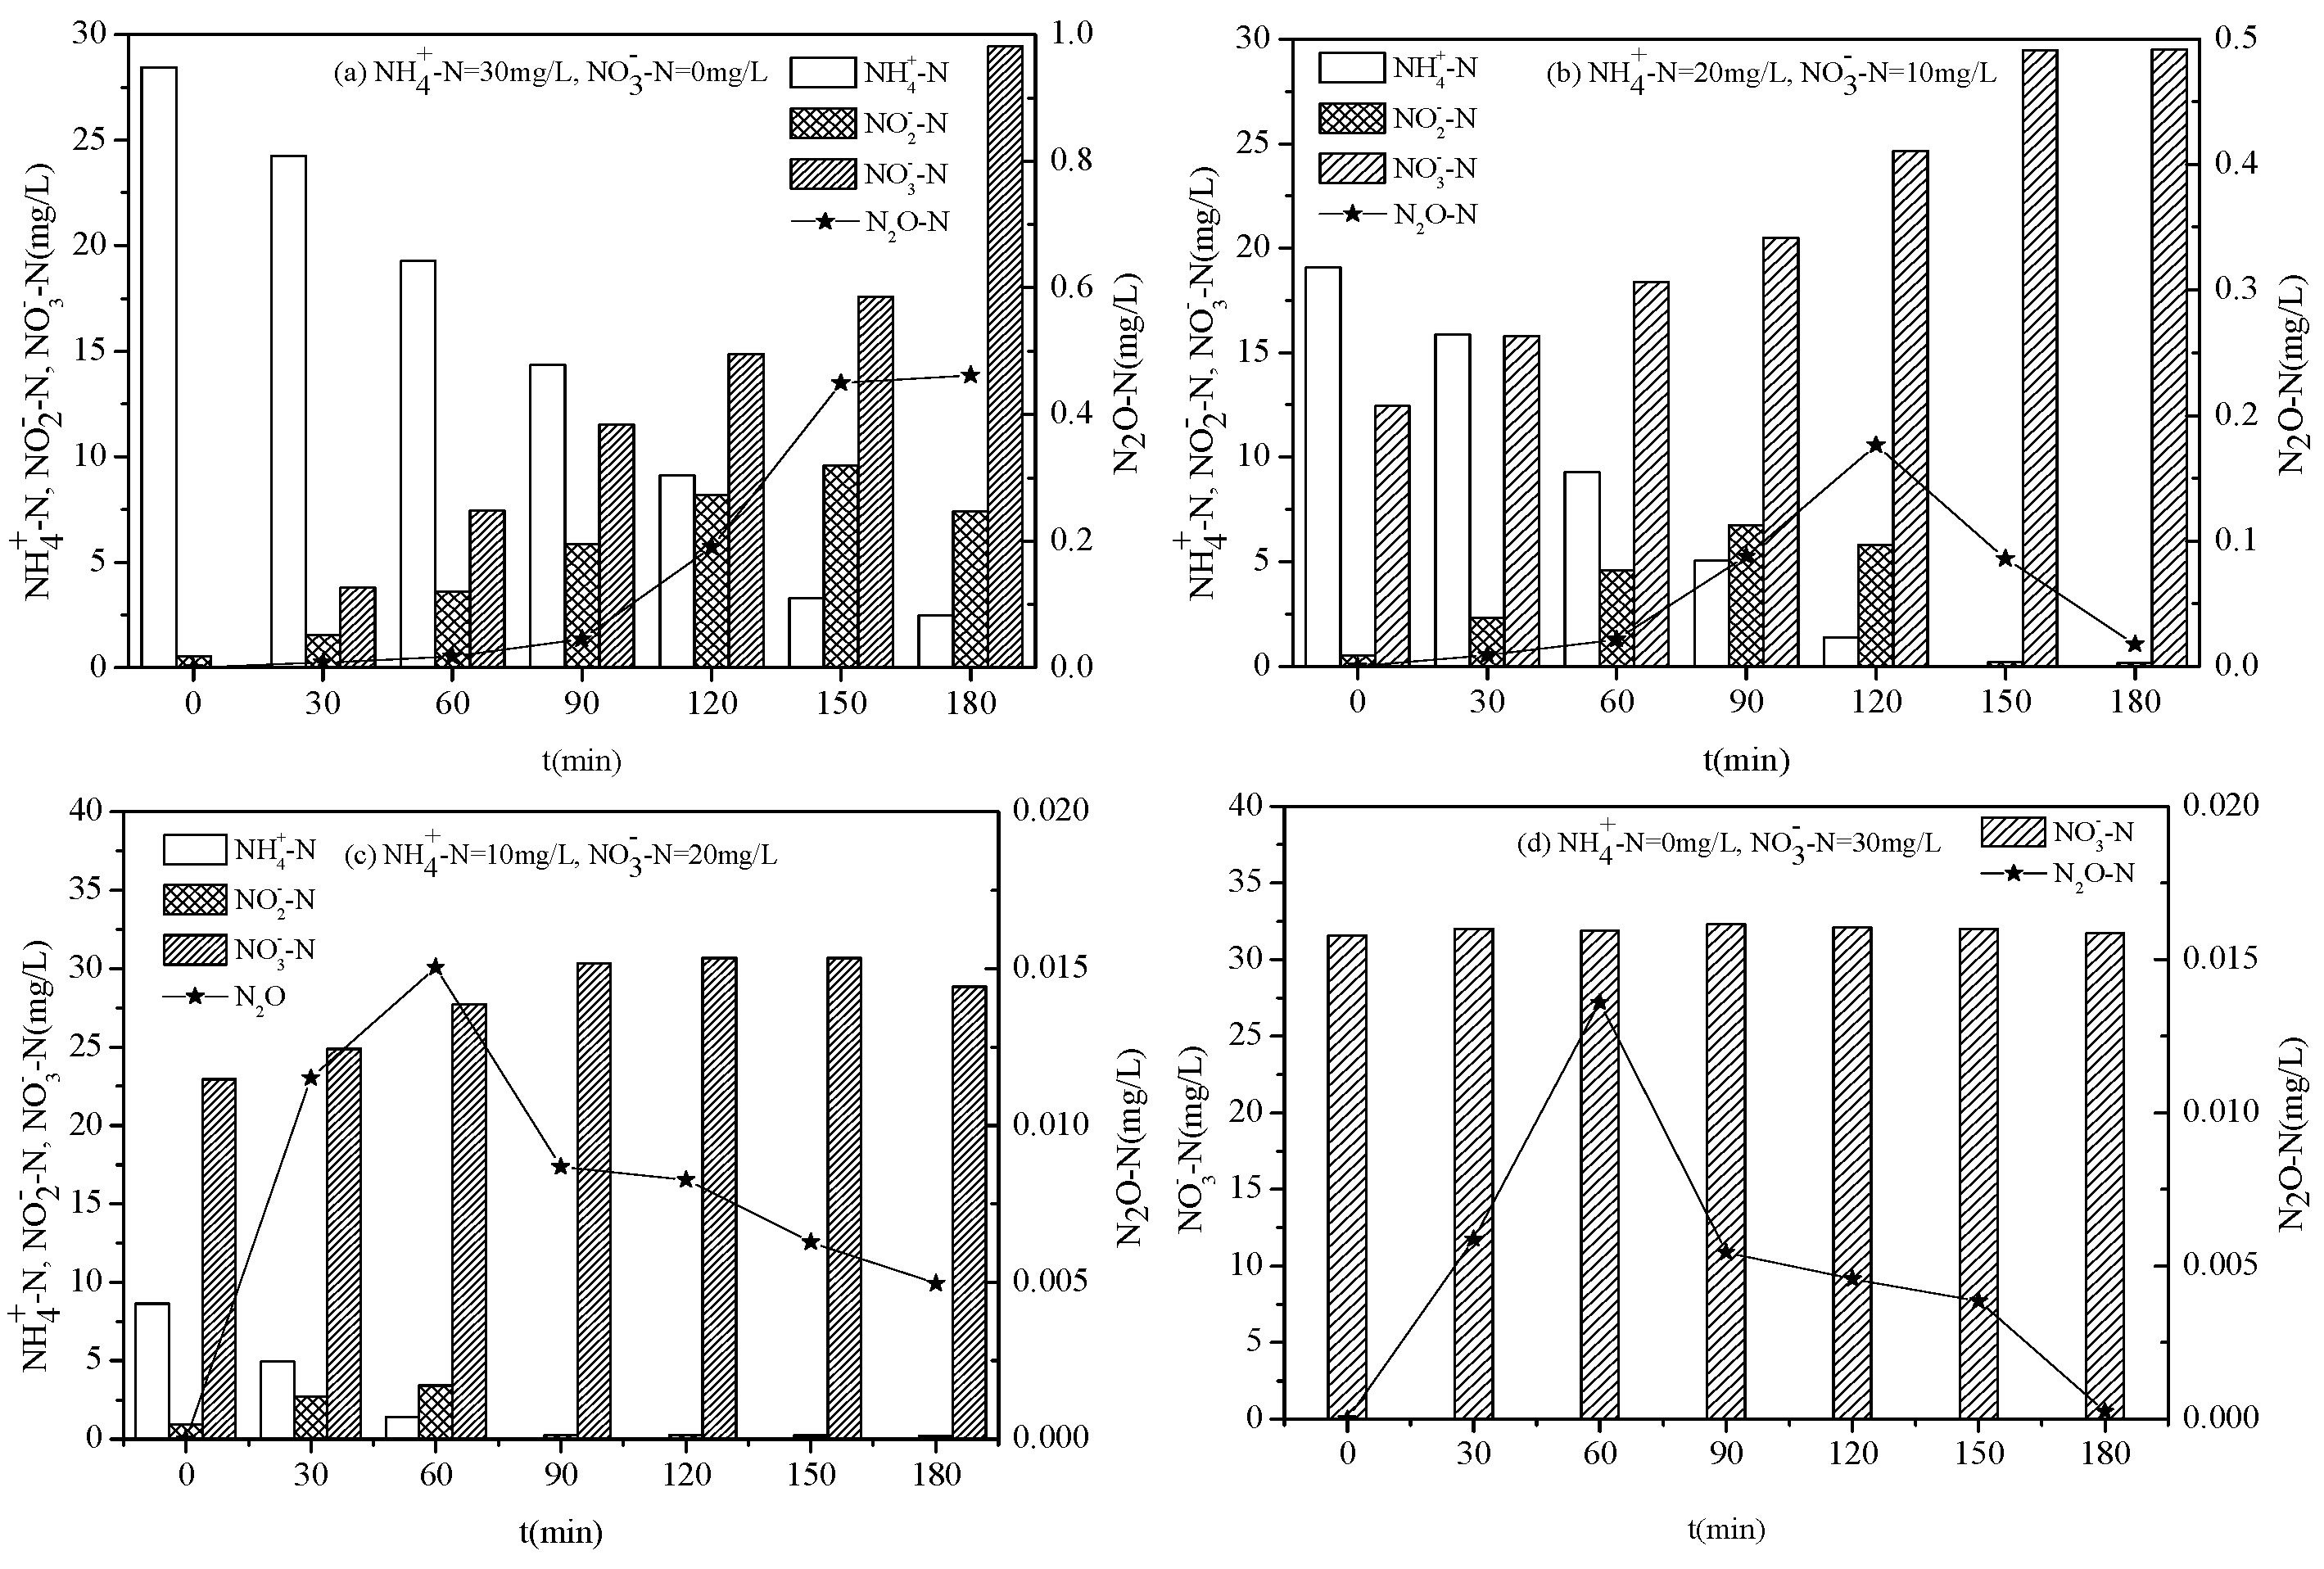
Figure 3 shows the variation of N2O emission during full nitrification (full nitrification effluent +NH4Cl/NaNO2) under different NH4+-N and NO3−-N ratios. As shown in Figure 3a–c, with decreasing NH4+-N and increasing NO3−-N, the time it took for N2O to maximize decreased; however, the N2O emission rates also decreased (0.051, 0.029, and 0.005, mgN/(gMLSS·L·h)). When the ratios of NH4+-N to NO3−-N were 30:0, 20:10, and 10:20, the maximum yields of N2O were 0.46, 0.18, and 0.02 mgN/L, respectively. As shown in Figure 3a–c, the maximum production of N2O occurred as NH4+-N was oxidized, which was the same as for the N2O emissions in the AOB enrichment system. Figure 3 also shows that under the four proportional gradients, the total N2O production was 1.17, 0.40, 0.05, and 0.03 (mgN/L), which indicated that with full nitrification (where AOB and NOB co-exist), the production of N2O mainly depended on the initial concentration of NH4+, rather than the concentration of NO3−. In addition, as shown in Figure 3d, in the absence of COD, a very small amount of N2O was still generated when NO3− was added to the system, which may be caused by the denitrification of using internal organic matter in sludge.
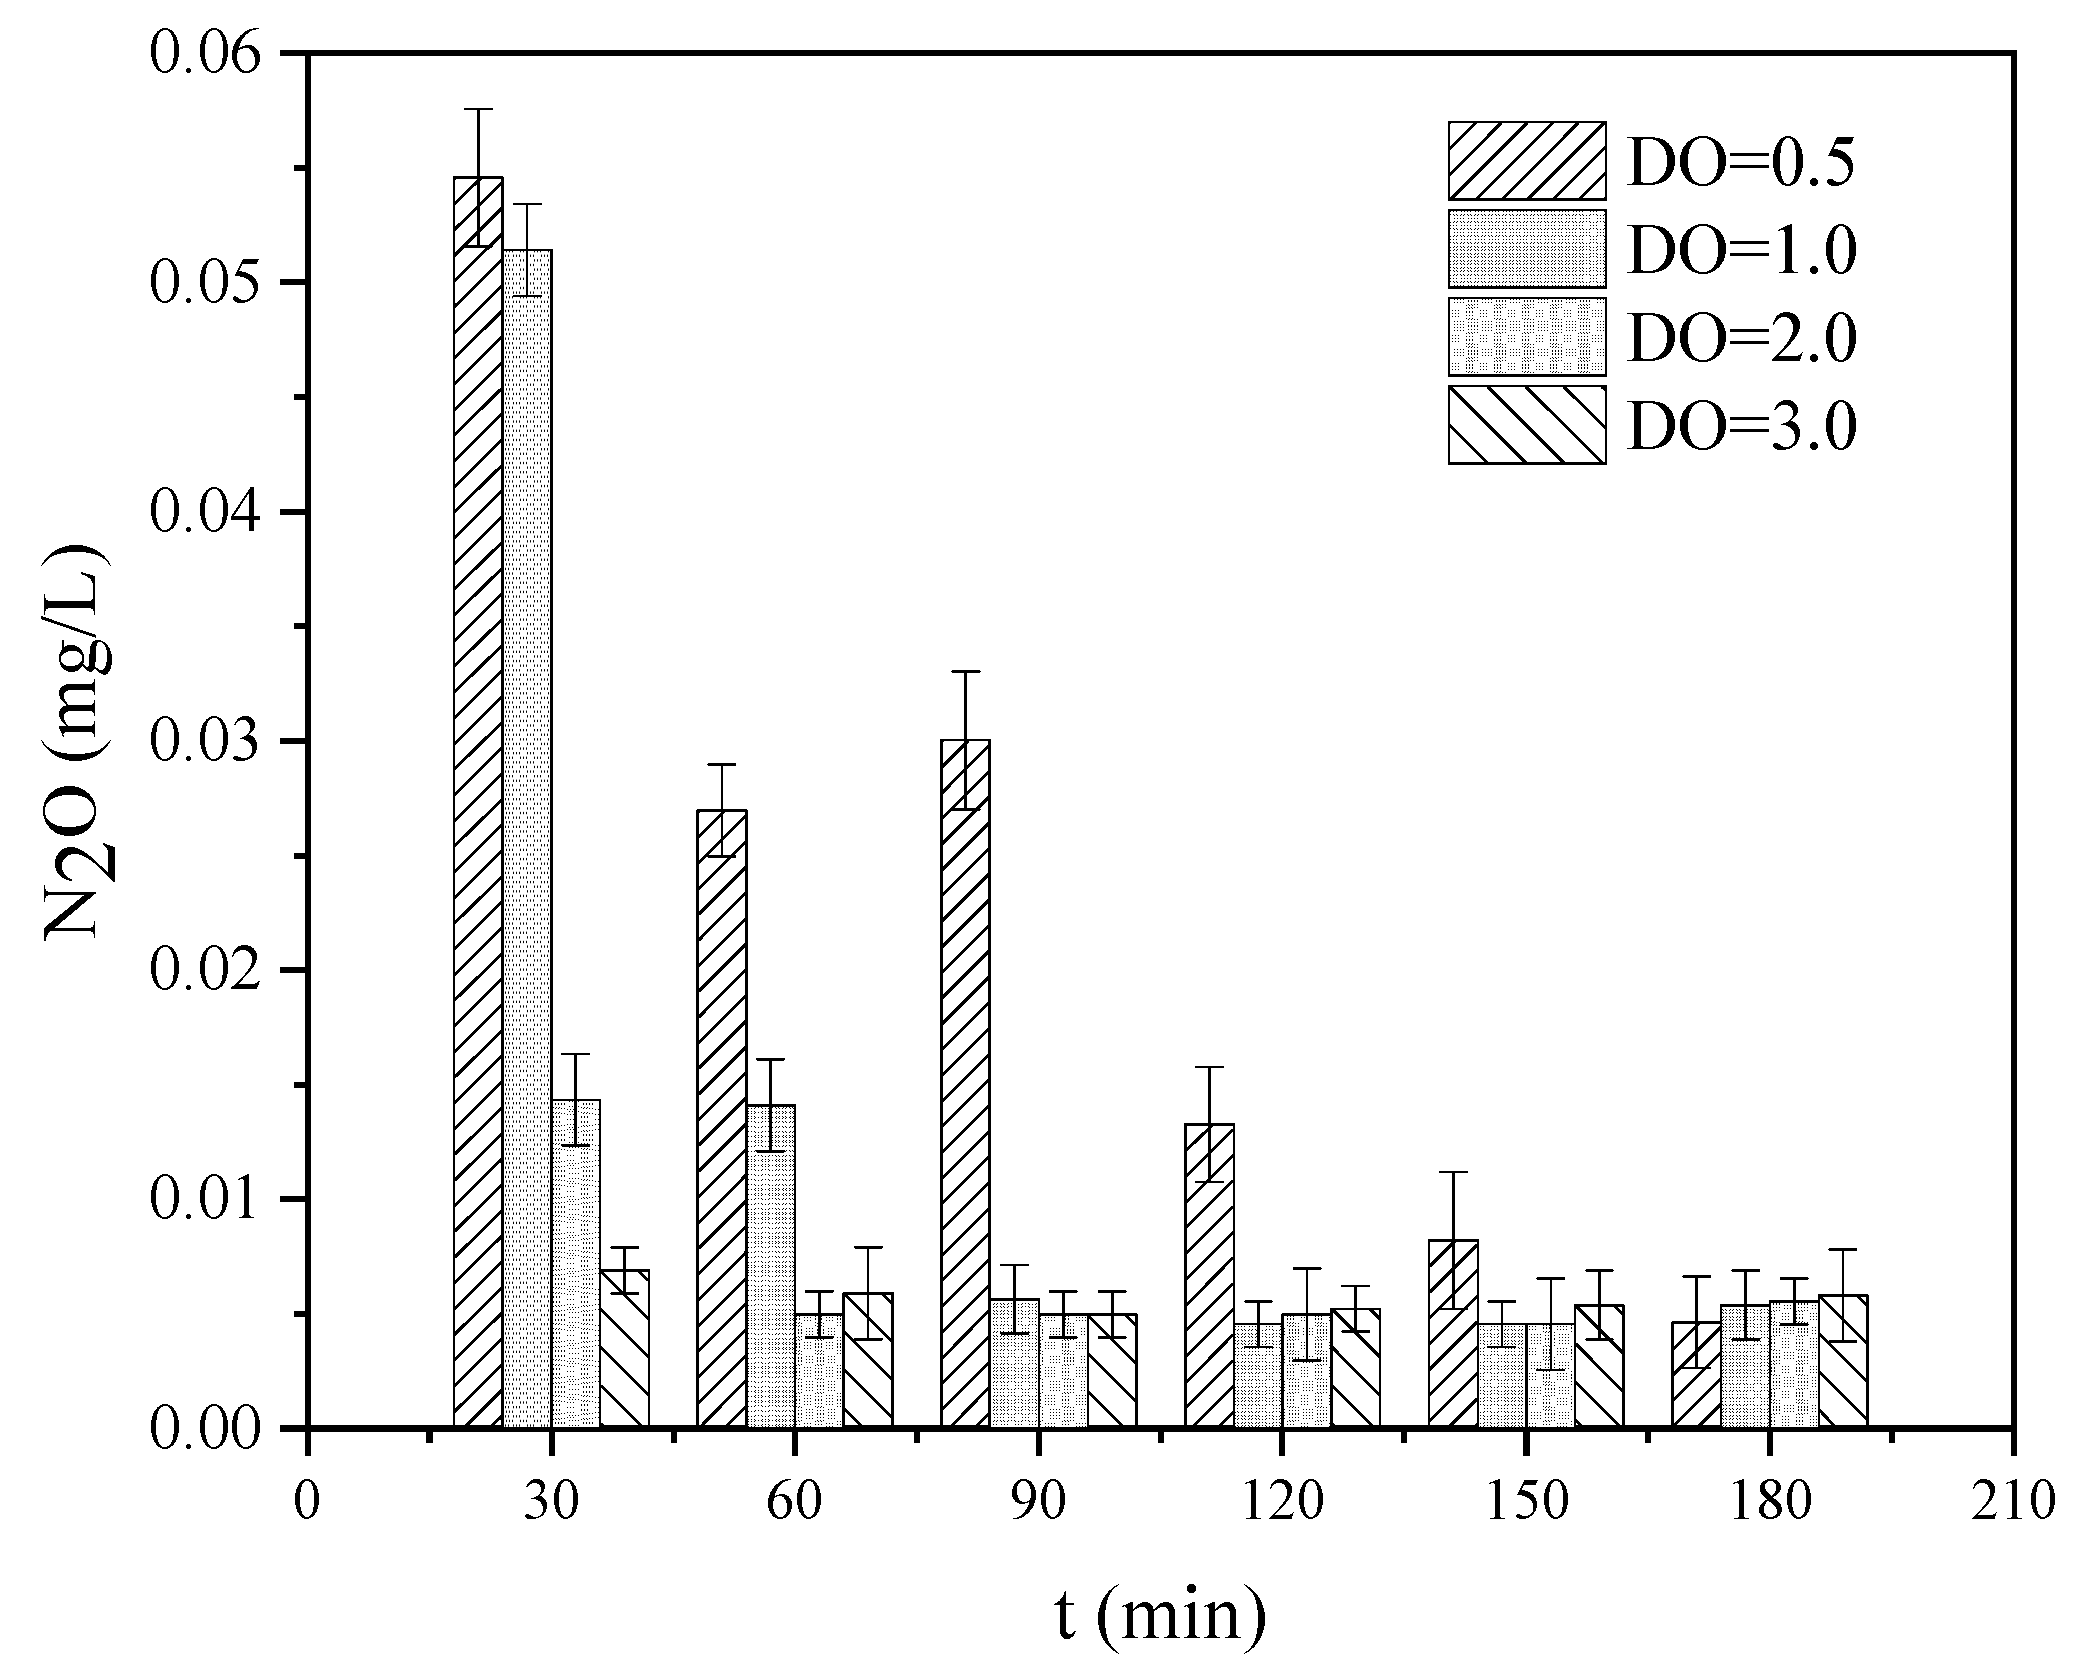
Figure 4 shows the variation of N2O emissions during full nitrification (full nitrification effluent +NaNO2 20 mgN/L). This batch test added 20 mgN/L NaNO2 to the nitrification system effluent and investigated the oxidation of NO2− by NOB to produce N2O under different DO concentrations. As shown in this figure, N2O reached its maximum value after 30 min, and its maximum production decreased with increasing DO, with values of 0.054 mg/L, 0.051 mg/L, 0.014 mg/L, and 0.007 mg/L. The NO2− oxidized to NO3− within 60 min. After 60 min, no NO2− remained in the system (data not shown), but the production of N2O was not 0, which indicated that during full nitrification, there was still N2O production during NO2− oxidation to NO3− by NOB. Although the amount was very small, this N2O may come from microorganisms using endogenous substances to provide electrons for denitrification. During the reaction, the total production of N2O was 0.14 mg/L, 0.09 mg/L, 0.04 mg/L, and 0.03 mg/L for the four different DO gradients, and the proportion of N2O in influent NO2−-N was 0.70%, 0.45%, 0.20%, and 0.15%. The percentage was smaller than N2O production in an AOB enriched system (Figure 2d), which was 1.17% (when DO = 0.5 mg/L) and indicated that NO2− in an AOB enriched system was more readily denitrified than with full nitrification.
As shown in Figure 2 and Figure 3, under the same ratio of NH4+-N to NO2−-N and NO3−-N (DO = 0.5 mg/L), and under four proportional gradients, in the AOB system with NO2−, the total N2O emissions were 2.81, 11.30, 65.20, and 11.67 times greater than the total N2O emission during full nitrification, which indicated that under the same conditions of influent NH4+-N, partial nitrification produced more N2O than full nitrification. During partial nitrification, NO2− was more involved in autotrophic denitrification of AOB as a product, while during full nitrification, NO3− would not participate in autotrophic denitrification as a nitrification product. Moreover, NO2− further oxidized to NO3− by NOB as an intermediate product of full nitrification; therefore, only a small amount of NO2− was involved in autotrophic denitrification by AOB.
4. Conclusions
The N2O emission in partial and full nitrification of actual domestic wastewater was investigated under specific conditions and yielded the following conclusions:
(1) The presence of influent NH4+ was the driving force of N2O emissions in full and partial nitrification processes.
(2) Compared with full nitrification, NO2− was more likely to participate in denitrification during partial nitrification to produce N2O.
(3) Under four proportional gradients, the total production of N2O during partial nitrification was 2.81, 11.30, 65.20, and 11.67 times greater than the total N2O production during full nitrification.
Author Contributions
P.L.: Investigation, Sampling, Data curation, Writing – original draft; Y.L.: review & editing; P.L.: Investigation, Sampling, Data curation, Writing – original draft; Y.L.: review & editing; S.W.: Resources, Funding acquisition; Y.P.: Supervision, Visualization. S.W.: Resources, Funding acquisition; Y.P.: Supervision, Visualization. All authors have read and agreed to the published version of the manuscript.
Funding
This research project was financially supported by National Key R&D Program of China (Grant No. 2021YFC3200601) and Yancheng Institute of Technology’s Start-up Research Fund.
Data Availability Statement
The original data is backed up on my computer, ready for investigation.
Conflicts of Interest
The authors declare that they have no known competing financial interests or personal relationships that could have appeared to influence the work reported in this paper.
References
- Masson-Delmotte, V.; Zhai, P.; Pirani, A.; Connors, S.L.; Péan, C.; Berger, S.; Zhou, B. IPCC Sixth Assessment Report, Climate Change 2021: The Physical Science Basis; Cambridge University Press: Cambridge, UK, 2021. [Google Scholar]
- Ying, L.I.; Niu, S.L.; Wang, Y.Z.; Han, K.H.; Zhou, W.B.; Jun, W. Mechanism of N2O reduction by biomass gasification gas reburning. J. Fuel Chem. Technol. 2021, 49, 1435–1443. [Google Scholar]
- Desloover, J.; Vlaeminck, S.E.; Clauwaert, P.; Verstraete, W.; Boon, N. Strategies to mitigate N2O emissions from biological nitrogen removal systems 2012 Current Opinion in Biotechnology. Curr. Opin. Biotechnol. 2012, 23, 474–482. [Google Scholar] [CrossRef]
- Law, Y.; Ye, L.; Pan, Y.; Yuan, Z. Nitrous oxide emissions from wastewater treatment processes. Philos. Trans. Soft Heroyal Soc. B-Biol. 2012, 367, 1265–1277. [Google Scholar] [CrossRef] [Green Version]
- Kampschreur, M.J.; Temmink, H.; Kleerebezem, R.; Jetten, M.S.; van Loosdrecht, M.C. Nitrous oxide emission during wastewater treatment. Water Res. 2009, 43, 4093–4103. [Google Scholar] [CrossRef]
- Ahn, J.H.; Kim, S.P.; Park, H.K.; Rahm, B.; Pagilla, K.; Chandran, K. N2O Emissions from activated sludge processes, 2008–2009: Results of a national monitoring survey in the United States. Environ. Sci. Technol. 2010, 44, 4505–4511. [Google Scholar] [CrossRef]
- Arp, D.J.; Stein, L.Y. Metabolism of inorganic N compounds by ammonia-oxidizing bacteria. Crit. Rev. Biochem. Mol. Biol. 2003, 38, 471–495. [Google Scholar] [CrossRef] [PubMed]
- Hooper, A.B.; Vannelli, T.; Bergmann, D.J.; Arciero, D.M. Enzymology of the oxidation of ammonia to nitrite by bacteria. Antonie Van Leeuwenhoek 1997, 71, 59–67. [Google Scholar] [CrossRef] [PubMed]
- Kim, S.W.; Miyahara, M.; Fushinobu, S.; Wakagi, T.; Shoun, H. Nitrous oxide emission from nitrifying activated sludge dependent on denitrification by ammonia-oxidizing bacteria. Bioresour. Technol. 2010, 101, 3958–3963. [Google Scholar] [CrossRef]
- Chandran, K.; Stein, L.Y.; Klotz, M.G.; van Loosdrecht, M.C. Nitrous oxide production by lithotrophic ammonia-oxidizing bacteria and implications for engineered nitrogen-removal systems. Biochem. Soc. Trans. 2011, 39, 1832–1837. [Google Scholar] [CrossRef] [PubMed]
- Ni, B.J.; Peng, L.; Law, Y.; Guo, J.; Yuan, Z. Modeling of Nitrous Oxide Production by Autotrophic Ammonia-Oxidizing Bacteria with Multiple Production Pathways. Environ. Sci. Technol. 2014, 48, 3916–3924. [Google Scholar] [CrossRef] [PubMed]
- Wunderlin, P.; Mohn, J.; Joss, A.; Emmenegger, L.; Siegrist, H. Mechanisms of N2O production in biological wastewater treatment under nitrifying and denitrifying conditions. Water Res. 2012, 46, 1027–1037. [Google Scholar] [CrossRef]
- Yang, Q.; Liu, X.; Peng, C.; Wang, S.; Sun, H.; Peng, Y. N2O production during nitrogen removal via nitrite from domestic wastewater: Main sources and control method. Environ. Sci. Technol. 2009, 43, 9400–9406. [Google Scholar] [CrossRef]
- Pan, Y.; Ni, B.J.; Bond, P.L.; Ye, L.; Yuan, Z. Electron competition among nitrogen oxides reduction during methanol-utilizing denitrification in wastewater treatment. Water Res. 2013, 47, 3273–3281. [Google Scholar] [CrossRef]
- Kampschreur, M.J.; Tan, N.C.G.; Kleerebezem, R.; Picioreanu, C.; Jetten, M.S.M.; van Loosdrecht, M.C.M. Effect of dynamic process conditions on nitrogen oxides emission from a nitrifying culture. Environ. Sci. Technol. 2008, 42, 429–435. [Google Scholar] [CrossRef]
- Ding, R.W.; Xu, X.; Ji, R.P. Study on the integrated Suspended Filler Bed-Artificial Wetland for rural sewage treatment. Technol. Water Treat. 2020, 46, 110–115 + 120. [Google Scholar]
- Gong, Y.K.; Feng, H.; Ren, L.F.; Li, M.L.; Sun, H.W. Utilization of pH to Regulate the PAOs-GAOs Competition and N2O Release in Denitrification Phosphorus Removal Process. Environ. Sci. Technol. 2021, 44, 145–153. [Google Scholar]
- Masuda, S.; Sano, I.; Hojo, T.; Li, Y.Y.; Nishimura, O. The comparison of greenhouse gas emissions in sewage treatment plants with different treatment processes. Chemosphere 2018, 193, 581–590. [Google Scholar] [CrossRef]
- Li, K.; Duan, H.; Liu, L.; Qiu, R.; van den Akker, B.; Ni, B.J.; Ye, L. An Integrated First Principal and Deep Learning Approach for Modeling Nitrous Oxide Emissions from Wastewater Treatment Plants. Environ. Sci. Technol. 2022, 56, 2816–2826. [Google Scholar] [CrossRef] [PubMed]
- Rassamee, V.; Sattayatewa, C.; Pagilla, K.; Chandran, K. Effect of oxic and anoxic conditions on nitrous oxide emissions from nitrification and denitrification. Biotechnol. Bioeng. 2011, 108, 2036–2045. [Google Scholar] [CrossRef]
- Pan, Y.T.; Ye, L.; Yuan, Z.G. Effect of H2S on N2O Reduction and Accumulation during Denitrification by Methanol Utilizing Denitrifies. Environ. Sci. Technol. 2013, 47, 8408–8415. [Google Scholar]
- APHA. Standard Methods for the Examination of Water and Wastewater; Port City Press: Baltimore, MD, USA, 1998. [Google Scholar]
- Zhao, W.; Wang, Y.; Liu, S.; Pan, M.; Yang, J.; Chen, S. Denitrification activities and N2O production under salt stress with varying COD/N ratios and terminal electron acceptors. Chem. Eng. J. 2013, 215–216, 252–260. [Google Scholar] [CrossRef]
- Quan, X.; Zhang, M.; Lawlor, P.G.; Yang, Z.; Zhan, X. Nitrous oxide emission and nutrient removal in aerobic granular sludge sequencing batch reactors. Water Res. 2012, 46, 4981–4990. [Google Scholar] [CrossRef] [PubMed]
- Yu, R.; Kampschreur, M.J.; van Loosdrecht, M.C.M.; Chandran, K. Mechanisms and specific directionality of autotrophic nitrous oxide and nitric oxide generation during transient anoxia. Environ. Sci. Technol. 2010, 44, 1313–1319. [Google Scholar] [CrossRef] [PubMed]
Figure 1.
N2O emission during partial nitrification (partial nitrification effluent +NH4Cl-N/NaNO2-N, DO = 0.5 mg/L).
Figure 1.
N2O emission during partial nitrification (partial nitrification effluent +NH4Cl-N/NaNO2-N, DO = 0.5 mg/L).

Figure 2.
N2O emission during partial nitrification (partial nitrification effluent +NH4Cl-N/NaNO2-N, DO = 0.5 mg/L).
Figure 2.
N2O emission during partial nitrification (partial nitrification effluent +NH4Cl-N/NaNO2-N, DO = 0.5 mg/L).

Figure 3.
N2O emission during full nitrification (full nitrification effluent +NH4Cl-N/NaNO2-N, DO = 0.5 mg/L).
Figure 3.
N2O emission during full nitrification (full nitrification effluent +NH4Cl-N/NaNO2-N, DO = 0.5 mg/L).

Figure 4.
N2O emission during full nitrification (full nitrification effluent +NaNO2-N 20 mgN/L).


Table 1.
The quality of real domestic wastewater.
| COD (mg/L) | NH4+-N (mg/L) | NO2−-N (mg/L) | NO3−-N (mg/L) | TN (mg/L) | pH | Alkalinity | |
|---|---|---|---|---|---|---|---|
| minimum | 88 | 39.6 | 0 | 0 | 56.4 | 6.9 | 262 |
| maximum | 276 | 91.2 | 2.8 | 1.2 | 98.5 | 7.7 | 343 |
| average | 182 | 65.4 | 1.4 | 0.6 | 77.4 | 7.3 | 303 |
Table 2.
Batch test rules.
| Batch Test Number | Sludge—Water Mixture Type | Initial pH | Reaction Time (h) | NH4+-N (mg/L) | NO2−-N (mg/L) | NO3−-N (mg/L) | DO (mg/L) |
|---|---|---|---|---|---|---|---|
| 1 | partial nitrification sludge + effluent | 7.5 | 3 | 30 | 0 | 0.5 | |
| partial nitrification sludge + effluent | 7.5 | 3 | 20 | 10 | 0.5 | ||
| partial nitrification sludge + effluent | 7.5 | 3 | 10 | 20 | 0.5 | ||
| partial nitrification sludge + effluent | 7.5 | 3 | 0 | 30 | 0.5 | ||
| 2 | full nitrification sludge + effluent | 7.5 | 3 | 30 | 0 | 0.5 | |
| full nitrification sludge + effluent | 7.5 | 3 | 20 | 10 | 0.5 | ||
| full nitrification sludge + effluent | 7.5 | 3 | 10 | 20 | 0.5 | ||
| full nitrification sludge + effluent | 7.5 | 3 | 0 | 30 | 0.5 | ||
| 3 | full nitrification sludge + effluent | 7.5 | 3 | 20 | 0.5 | ||
| full nitrification sludge + effluent | 7.5 | 3 | 20 | 1 | |||
| full nitrification sludge + effluent | 7.5 | 3 | 20 | 2 | |||
| full nitrification sludge + effluent | 7.5 | 3 | 20 | 3 |
Publisher’s Note: MDPI stays neutral with regard to jurisdictional claims in published maps and institutional affiliations. |
© 2022 by the authors. Licensee MDPI, Basel, Switzerland. This article is an open access article distributed under the terms and conditions of the Creative Commons Attribution (CC BY) license (https://creativecommons.org/licenses/by/4.0/).
Share and Cite
MDPI and ACS Style
Li, P.; Peng, Y.; Wang, S.; Liu, Y. N2O Emission from Partial Nitrification and Full Nitrification in Domestic Wastewater Treatment Process. Water 2022, 14, 3195. https://doi.org/10.3390/w14203195
AMA Style
Li P, Peng Y, Wang S, Liu Y. N2O Emission from Partial Nitrification and Full Nitrification in Domestic Wastewater Treatment Process. Water. 2022; 14(20):3195. https://doi.org/10.3390/w14203195
Chicago/Turabian StyleLi, Pengzhang, Yongzhen Peng, Shuying Wang, and Yue Liu. 2022. "N2O Emission from Partial Nitrification and Full Nitrification in Domestic Wastewater Treatment Process" Water 14, no. 20: 3195. https://doi.org/10.3390/w14203195
Note that from the first issue of 2016, this journal uses article numbers instead of page numbers. See further details here.