
Online Storage Technology of the Separate Sewage System: Demonstration Study in a Typical Plain River Network City
by
 ,
,
Xiaohu Dai
1,
Guozhong Xu
1,2,*,
Yongwei Ding
2,
Siyu Zeng
3,
Lan You
4,
Jianjun Jiang
4 and
Hao Zhang
2 1
College of Environmental Science and Engineering, Tongji University, Shanghai 200092, China
2
Suzhou Water Group Co., Ltd., Suzhou 215132, China
3
School of Environment, Tsinghua University, Beijing 100084, China
4
Suzhou Drainage Co., Ltd., Suzhou 215006, China
*
Author to whom correspondence should be addressed.
Water 2022, 14(20), 3194; https://doi.org/10.3390/w14203194
Submission received: 30 August 2022
/
Revised: 6 October 2022
/
Accepted: 8 October 2022
/
Published: 11 October 2022
(This article belongs to the Special Issue Sustainable Governance for Resilient Water and Sanitation Service)
Abstract
:Due to the high underground water level, frequent rainfall, and large amounts of infiltration and inflow (I/I) into the sewage system, a city in the plain river network region had to face a series of problems caused by the high water-level operation of the drainage system. Suzhou, a city in the Yangtze River Delta region of China, can be a representative of cities in plain river networks, where this research was carried out. The amount of I/I into the sewage system was evaluated, and the storm water management model (SWMM) was used to further calculate the sewer water storage capacity under dry and wet weather with multi-year average rainfall. Based on the offline model calculation and artificial experiences, the rule-based online regulation and storage real-time control strategy (RTC) is verified, and the online regulation and storage intelligent scheduling demonstration is carried out in the central-city district of Suzhou. The results showed that the infiltration in dry weather accounted for about 20–25% of the total collected wastewater; in wet weather (36 mm precipitation), the extraneous water induced by I/I peaked at 73.64%. The collaborative control of regional multi-stage pumping stations through RTC of the sewage system can effectively avoid the high water-level operation caused by peak sewage flows on dry days. In combination with rainfall forecasting, the coordinated control of plants and pumping stations to pre-empty the sewer pipelines prior to rainfall can, to some extent (up to 35 mm of rainfall in this study), cope with the increase in I/I induced by rainfall.
1. Introduction
Urban sewage infrastructures are a systematic network composed of sewage pipelines, pumping stations, wastewater treatment plants, and other facilities, which undertake functions of sewage collection, reliable conveyance, and efficient treatment [1]. In the sewage system, in addition to sanitary sewage, there is infiltration and inflow (I/I) that comes from sources like groundwater and rainwater. I/I does take up more space than the sanitary sewage flow in many places, which results in additional pumping and treatment as well as other negative effects, including greater chances of basement flooding and combined or separate sewer overflows [2]. The levels of I/I vary much from place to place depending on, e.g., rain intensity and system design, ranging from 30 to 75%, at a global and annual scale [3,4,5,6,7,8,9].
In the eastern and southern cities of China, with frequent rainfall and high groundwater level, the I/I that originates from excessive canal water, rainwater, or groundwater becomes a prominent problem in the field of urban sewage management. To accommodate the excessive non-sewage water, the high water-level operation of sewage pipelines is relatively common in those areas [10,11]. The high water-level operation of sewer pipelines will bring about severe problems. To be specific, first, poor drainage conditions in low-lying areas or low-level drainage households would result in deliberate or destructive artificial mixing of rain and sewage pipes. Second, the long-term sustained high water level would result in a reduced sewage flow rate in the pipelines. A large number of solids in sewage would deposit and then block the pipelines. Third, the storage capacity of sewer pipes is undermined, inducing the sewage that is designed to discharge into the sewage system could not be smoothly discharged and even cause sewage overflow. These problems are interlinked and mutually restrictive, forming a vicious circle.
Therefore, facilities renovation and operation-control optimization to reduce the operating water level of sewage pipes are the current main tasks of urban sewage management to improve sewage collection as well as treatment. However, infrastructure renovation of sewage systems requires extensive capital investment and long-term manual and labor input, making this option unpractical in many cities [12]. Recently optimization-based real-time control (RTC) has become a hot spot in the operation optimization of the drainage and sewage system, which aims to optimally utilize the actuators, e.g., pumps and gates, to achieve a particular objective or multiple objectives in real-time and shows great potential in reducing sewer overflow and energy reduction [12,13,14,15,16,17]. For sewage pumping station control, the research content mainly focuses on the control of a single-stage pumping station and the coordinated control of multi-stage pumping stations to achieve energy saving and/or sewage-overflow reduction.
In terms of optimal control of single-stage pumping stations, Xu et al. [18] developed a fuzzy control strategy by taking the current water level, the predicted water level, and the level difference between adjacent sewage pumping stations as inputs of the fuzzy controller. The output revealed whether to increase or decrease the number of pumps. The simulation results showed that this method could minimize sewage overflow and can effectively reduce energy consumption. Hou et al. [19] proposed a control strategy based on pump performance. Based on the typical topological structure of an urban drainage system, the equations of inflow, outflow, and water storage of sewage pumping stations were established; and the outflow of relevant pumping stations was dynamically optimized. Fuzzy control was applied to the pumping-station control and compared with the control performance with a process identification (PID) controller [20]. It showed that the water level under fuzzy control was more stable and consumed less energy. The relationship between flow, head, power, and efficiency by an in-depth study of the patterns of pump speed and inflow was obtained for the first time in 2018, and a mixed integer optimization model was established by using these equations [21]. Furthermore, the model was demonstrated with an actual drainage system, in which the energy consumption of the pumping stations was effectively reduced through the proposed optimal control [21].
As for the pumping-station cooperative control, scholars have endeavored numerous algorithms and control strategies to achieve certain or multiple objectives. Huang [22] explored an optimal scheduling control strategy by solving the equations of the relationship between the inflow and discharge of each pump station through an in-depth analysis. Wang [23] applied the fuzzy control theory to the optimal scheduling strategy of pump stations and combined the colored Petri net theory to establish a pumping-station optimal scheduling counter propagation network (CPN) model. Chen and Xia [24] applied the least squares to support the vector machine method to real-time runoff prediction and used a flow predictable scheduling optimal control algorithm to track real-time flow and control discharge. Zhuan and Xia [25] transformed the optimal scheduling problem of multi-pump stations into a dynamic planning problem. An extended reduced dynamic planning algorithm (RDPA) was proposed, in which both energy and maintenance costs were considered in the performance function of the optimization problem. Through simulation, the extended RDPA significantly reduced the cost of pumping stations compared with the traditional dynamic programing (DP) algorithm. Zhang [26] deeply analyzed the relationship between outflow, pump head and water pond volume in a drainage system; and put forward a wastewater pumping station control model using genetic algorithm. By optimizing the flow distribution, the operating cost of the pumping station was significantly reduced.
Although many algorithms have been successfully applied to the optimal operation control of pumping stations, such as genetic algorithms, fuzzy control algorithms, PID algorithms, etc., and achieved relatively satisfactory optimization results. However, most of the research is still mainly restricted in theoretical research and their corresponding optimal control results are mostly based on simulation; few have been applied to an actual system. This paper is dedicated to designing a simple and easy-to-use cooperative control algorithm for regional pumping stations and applying it to the sewage system in Suzhou for a long time. Its outcomes and effects are evaluated through long-term data monitoring. In addition, in the previous studies, for a separate sewage system, more attention is paid to the scheduling control of sewage pumping stations in dry weather. In this paper, based on the research of the designed operation control of pumping stations in dry weather, the storage capacity of each pumping station area is evaluated with a hydrodynamic model (in this research, i.e., stormwater management model, SWMM for short) and incorporated model results into the decision-making process of the operation control, i.e., the online storage control of sewage pumping stations in wet weather. In such a way, this research is divided into three sections: (1) quantify the amount of I/I; (2) based on the I/I quantification result, evaluate the storage capacity of each pumping area with the SWMM model; (3) design the online storage control algorithm with the former outcomes, then apply and evaluate the designed online regulation and storage technology.
2. Methodology
2.1. Site Description
The study site is the central-city district of Suzhou, located in the Yangtze River Delta region, with a plain topography. The average altitude of Suzhou is 4 m above sea level. The average annual precipitation (1956~2012) is 1112 mm with uneven distribution [27], among which the minimum and maximum annual precipitation was 578.2 mm and 1554 mm in 1978 and 1957, respectively. The total selected study area is about 85 km2, with a water area of 9.6 km2 and a water surface ratio of approximately 11.3%. The dense network of rivers forms a unique landscape of “small bridges, flowing water and homes” [1], as shown in Figure 1.
As a typical representative of the plain river network cities in the Yangtze River Delta region, the central-city district of Suzhou faces special geographical conditions of frequent rainfall, dense river network, and high groundwater level. The water amount induced by infiltration and inflow (I/I) of the separate sewage system has exceeded the design value, resulting in high water levels in the sewage pipes under peak drainage periods of dry weather and medium to heavy rainfalls.
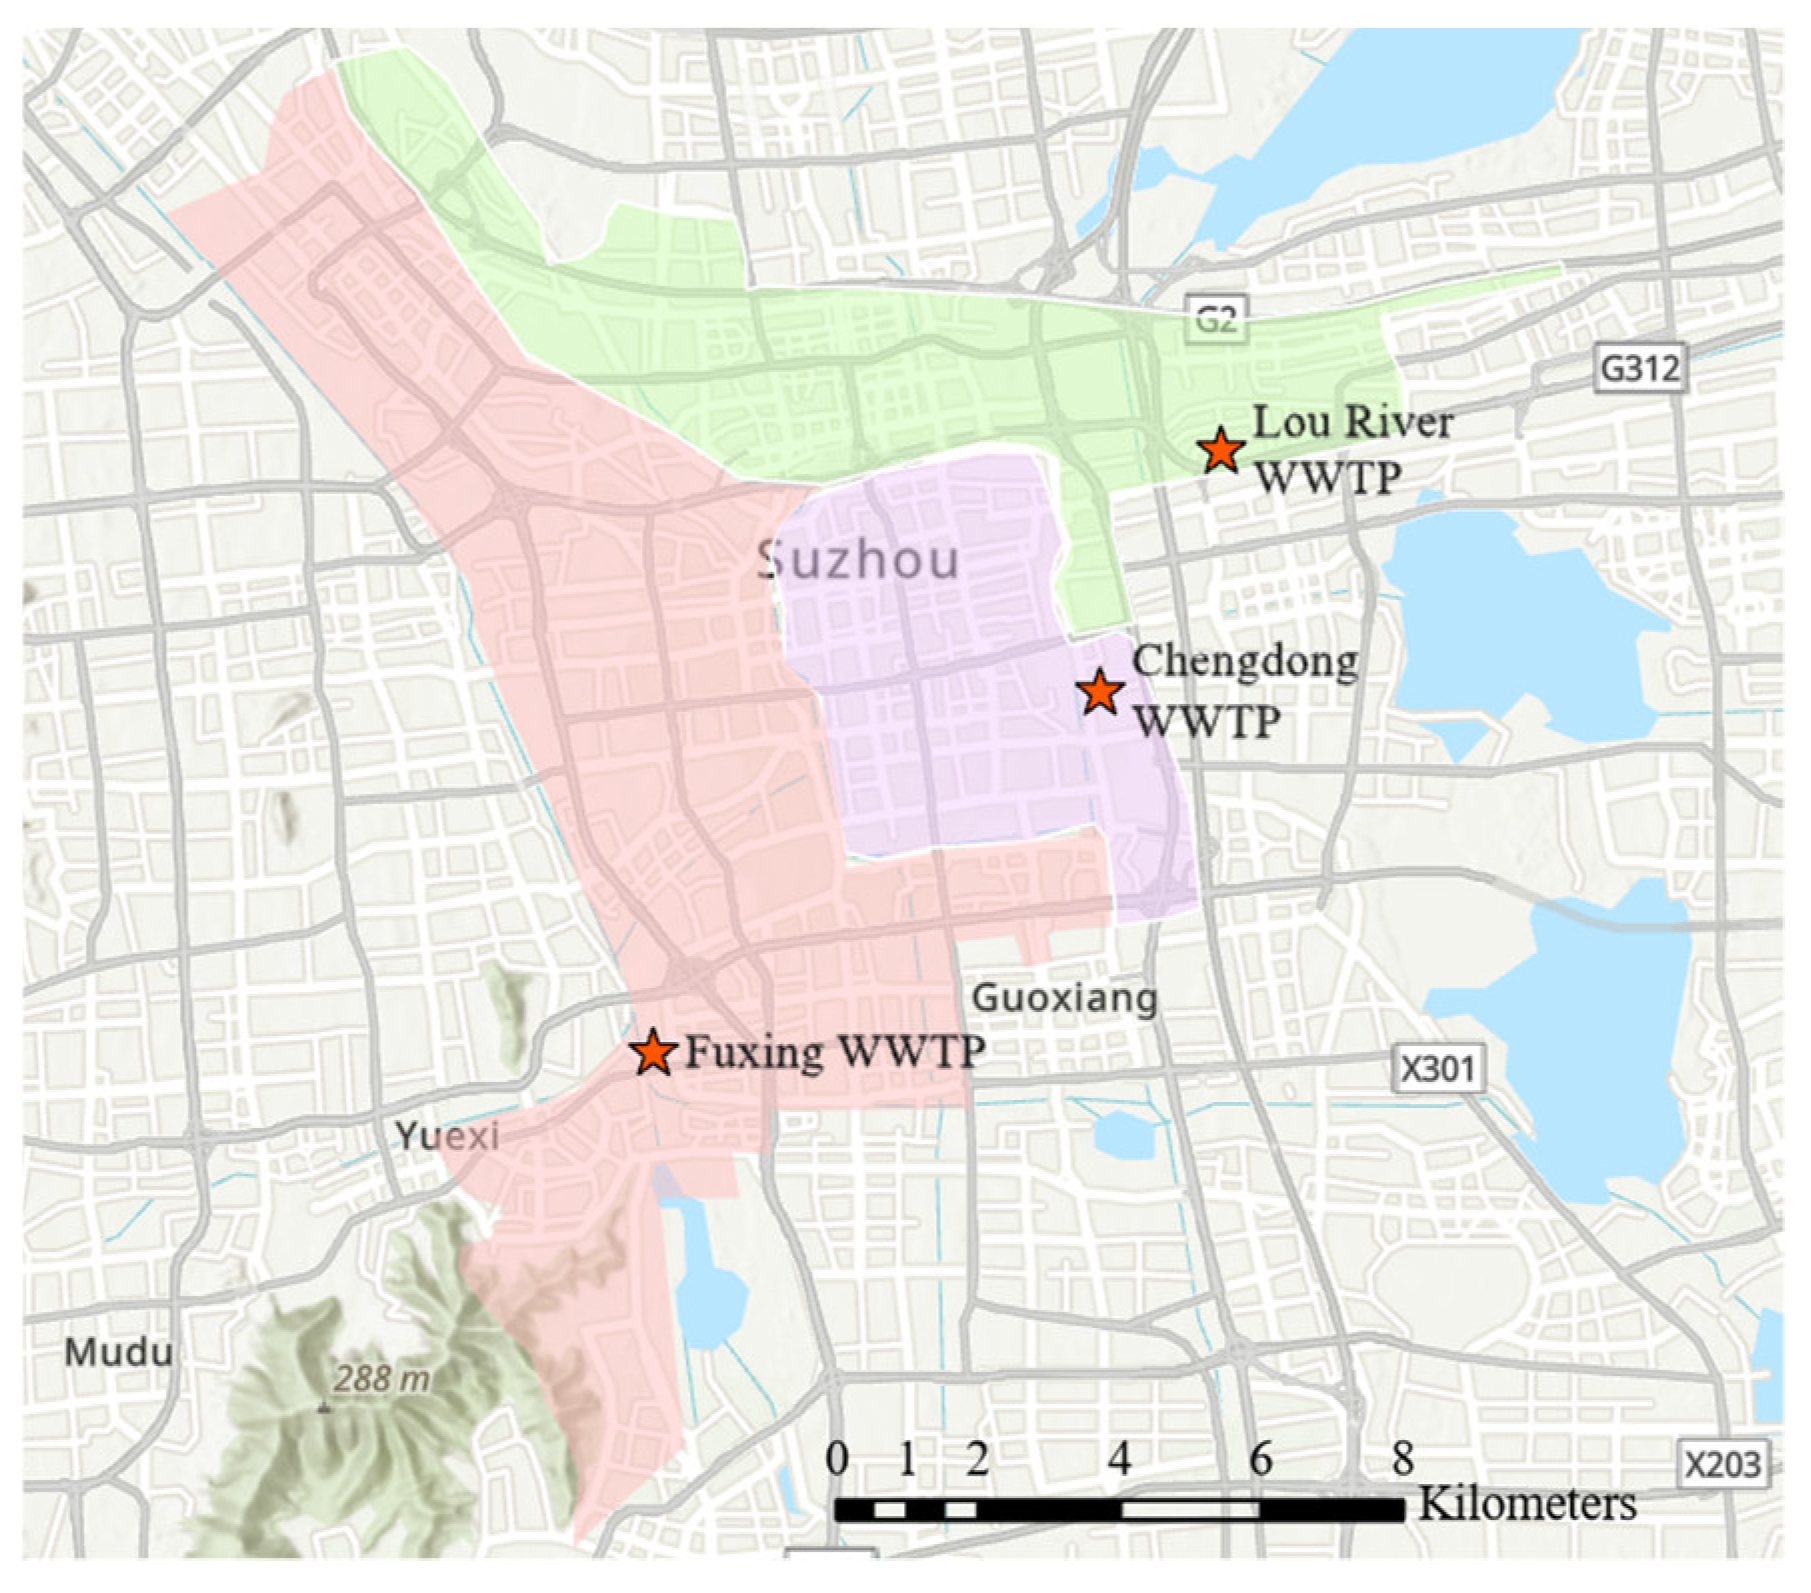
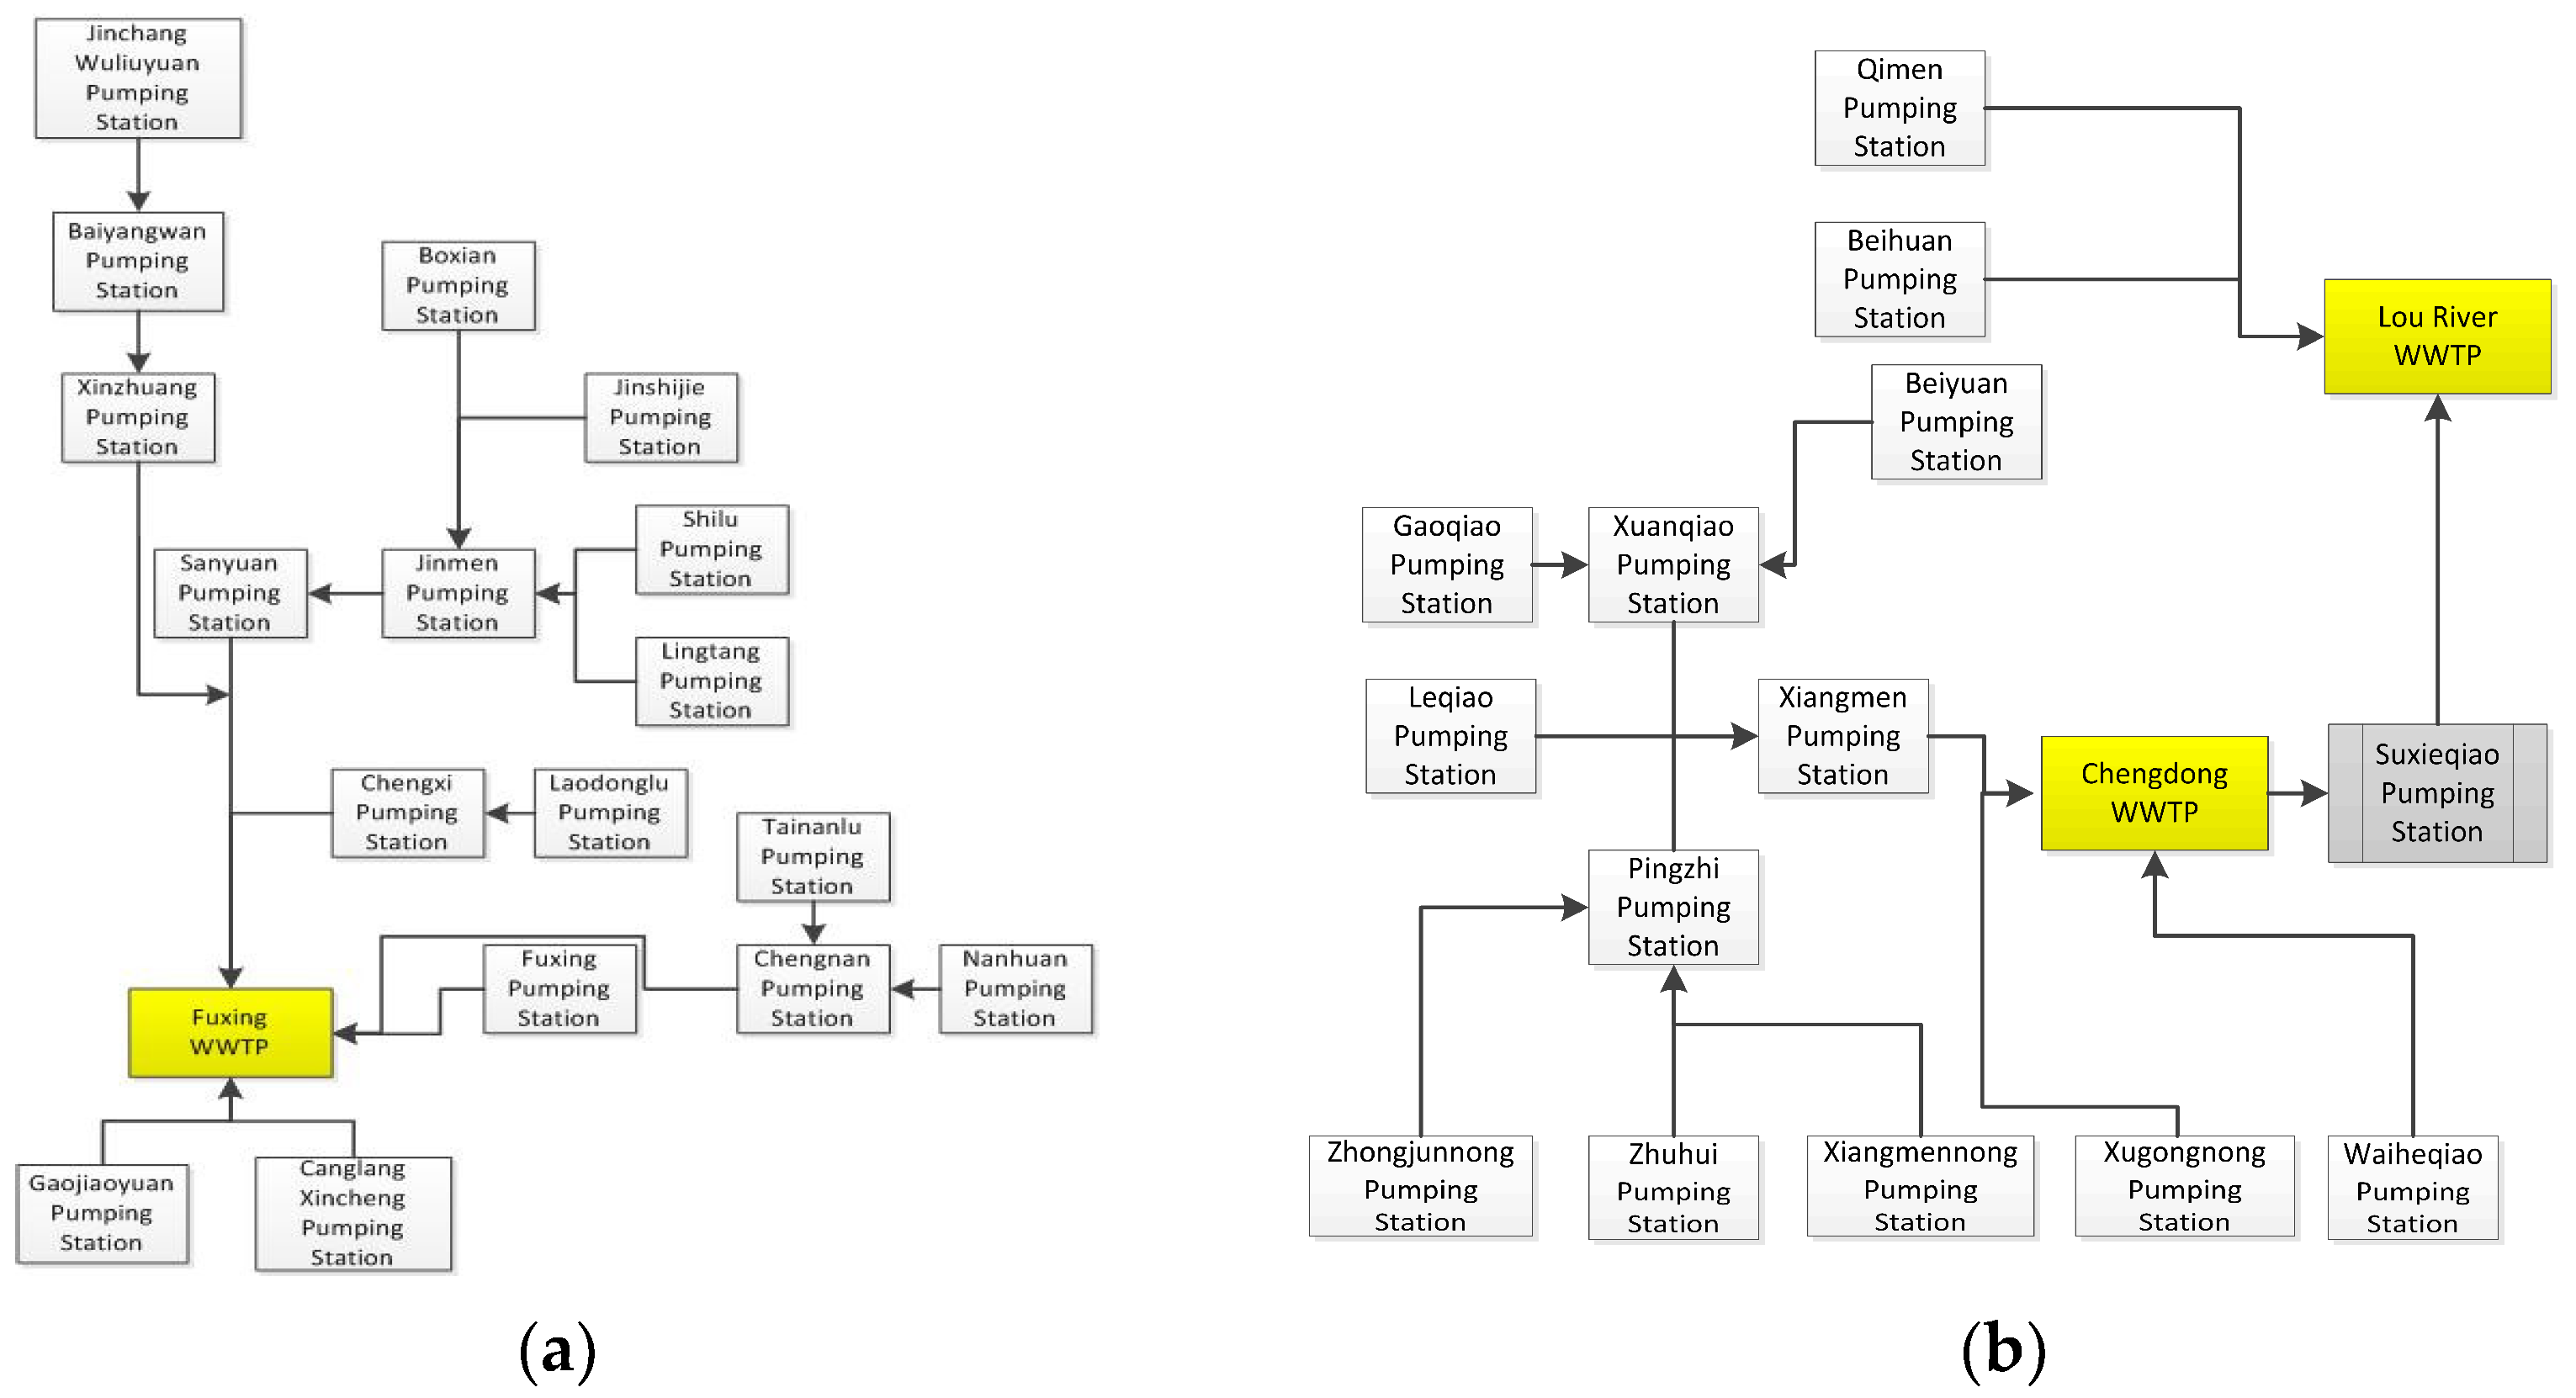
The central-city district of Suzhou started the separation of rain and sewage system project in the 1980s. By the end of 2018, rainwater and sewage separation was confirmed, completed, and achieved rain and sewage separation at sources in the whole study site. The total current sewage treatment capacity is 360,000 tons/day and is divided into three sewage treatment systems, as shown in Figure 2. The first system is the Fuxing sewage system located in the southwest with a newly built separate sewage system. The design treatment capacity of the Fuxing wastewater treatment plant is 180,000 tons/day. The second is the Chengdong sewage system, located in the ancient-city area, with a treatment capacity of 100,000 tons/day. The third is the Lou River sewage system in the northeast, a newly built area with a separate sewage system. The design treatment capacity (Lou River wastewater treatment plant) is 80 million tons/day. Furthermore, the three sewage systems are subdivided into several sub-systems, which collected sewage in pieces and were conveyed into the wastewater treatment plant (WWTP) at multiple levels, as shown in Figure 3. These pumping stations are divided into two categories. One is the source collection pumping station, which is only responsible for collecting gravity-discharge sewage within its service area; the other is the conveying pumping station, which undertakes both the gravity-discharge sewage within its service area and the conveyance of sewage from pumping stations in the upstream areas.
2.2. I/I Quantification
Continuous 24-h sampling on typical dry and rainy days was carried out on typical plots, pumping-station service areas, and wastewater-plant service areas using the water balance and water quality balance methods. Some geochemical indicators, such as total nitrogen (TN), electric conductivity, and stable isotope (18O and 2H) are selected to quantify and identify I/I patterns under typical dry days and rainfall conditions at an hourly and minutely scale. The equations for I/I quantification were based on water balance and mass balance [28]. Besides, the water balance and mass balance equations are different in dry weather and wet weather, as shown in Equation (1) to Equation (4).
Dry weather:
Wet weather:
where, cout—concentration of tracer at the outlet; the unit is determined according to the specific tracer, such as TN and other conventional pollutants, mg/L; pharmaceuticals ng/L; conductivity, μS/cm; 18O and 2H, ‰;
cbase—concentration of tracer at a residential outlet, the unit is the same with cout;
cinfil—concentration of tracer in groundwater or canal, the unit is the same with cout;
cinflow—concentration of tracer of rainfall runoff, the unit is the same with cout;
Qout—flow rate of sewage at the outlet, m3/s;
Qbase—flow rate of base sewage from households, m3/s;
Qinfil—flow rate of infiltration into the sewer, m3/s;
Qinflow—flow rate of inflow into the sewer, m3/s.
According to Equations (1)–(4), The infiltration ratio(Xinfil) and Qinfil in dry weather are expressed in Equation (5) and Equation (6).
In wet weather, two water quality factors are needed for equation solving. The infiltration ratio(Xinfil), inflow ratio(Xinflow), Qinfil, and Qinflow are shown in Equations (7)–(10).
where,
Xinfil—infiltration ratio, the ratio of infiltrated water to the total collected sewage, %;
Xinflow—inflow ratio, the ratio of inflow in wet weather to the total collected sewage, %;
cinfil,1, cinfil,2—concentration of water quality factor 1 and factor 2 of infiltrated water in wet weather, respectively, the unit is determined according to the specific factor;
cinflow1, cinflow,2—concentration of water quality factor 1 and factor 2 of inflow in wet weather, respectively, the unit is determined according to the specific factor.
The required data include the concentration of sewage discharged from residents and industries, the concentration of infiltrated groundwater, the concentration of inflow (in such case, i.e., rainfall runoff), and the outflow and concentration of sewage network outlet. For sewage water quality data discharged from residents and productive service, it is necessary to combine manual sampling with laboratory analytical testing. On dry weather day, 12 samples (one every 2 h for 24 h) were taken. Each time 500 mL sample was taken to analyze the concentration of selected water quality characteristic factors (i.e., TN and conductivity) and 50 mL sample was used for analyzing the relative abundance of stable isotopes (i.e., 18O and 2H). To ensure the test results can accurately reflect the true concentration level of water quality at that sampling moment, the samples should be sealed, protected from light, stored at low temperature, and sent to the laboratory for testing as soon as possible. TN was determined according to the standard method [29]. For stable isotope determination, the samples were taken with low-temperature vacuum extraction and followed with spectroscopy for isotope analysis [30]. Portable (HACH HQ2100) or online (MEACOM) conductivity monitoring instrument was employed for on-site determination of the electrical conductivity.
For the infiltrated groundwater quality, manual sampling, and laboratory testing were carried out for shallow groundwater below the ground level of 0–5 m, while deeper groundwater was basically impossible to enter the sewage pipelines due to its poor mobility and being under the sewage pipeline. The groundwater monitor wells at different locations in the study area were selected. In the morning, noon, and evening of typical dry days, 500 mL and 50 mL samples were collected, respectively, for the analysis of the concentration of water quality factors and the relative abundance of stable isotopes. Water sample storage and determination methods are the same as above.
For the inflow water quality, it is necessary to conduct manual sampling of rainfall runoff from different subsurfaces under rainfall conditions. For the roof subsurface, we collected rainwater from typical residential building rainfall-pipe outlets; for the road subsurface, we collected rainwater under viaducts where it is easy to sample; for residential and commercial subsurface, we selected comprehensive plots and collected rainwater from rain pipe outlets. Samples were collected every 15 min during the flow production period. Likewise, 500 mL of samples were collected each time to analyze the concentration of conventional pollutants and 50 mL of samples to analyze the relative abundance of stable isotopes. The portable conductivity meter was used to conduct field tests on conductivity. The storage and laboratory testing requirements were the as above.
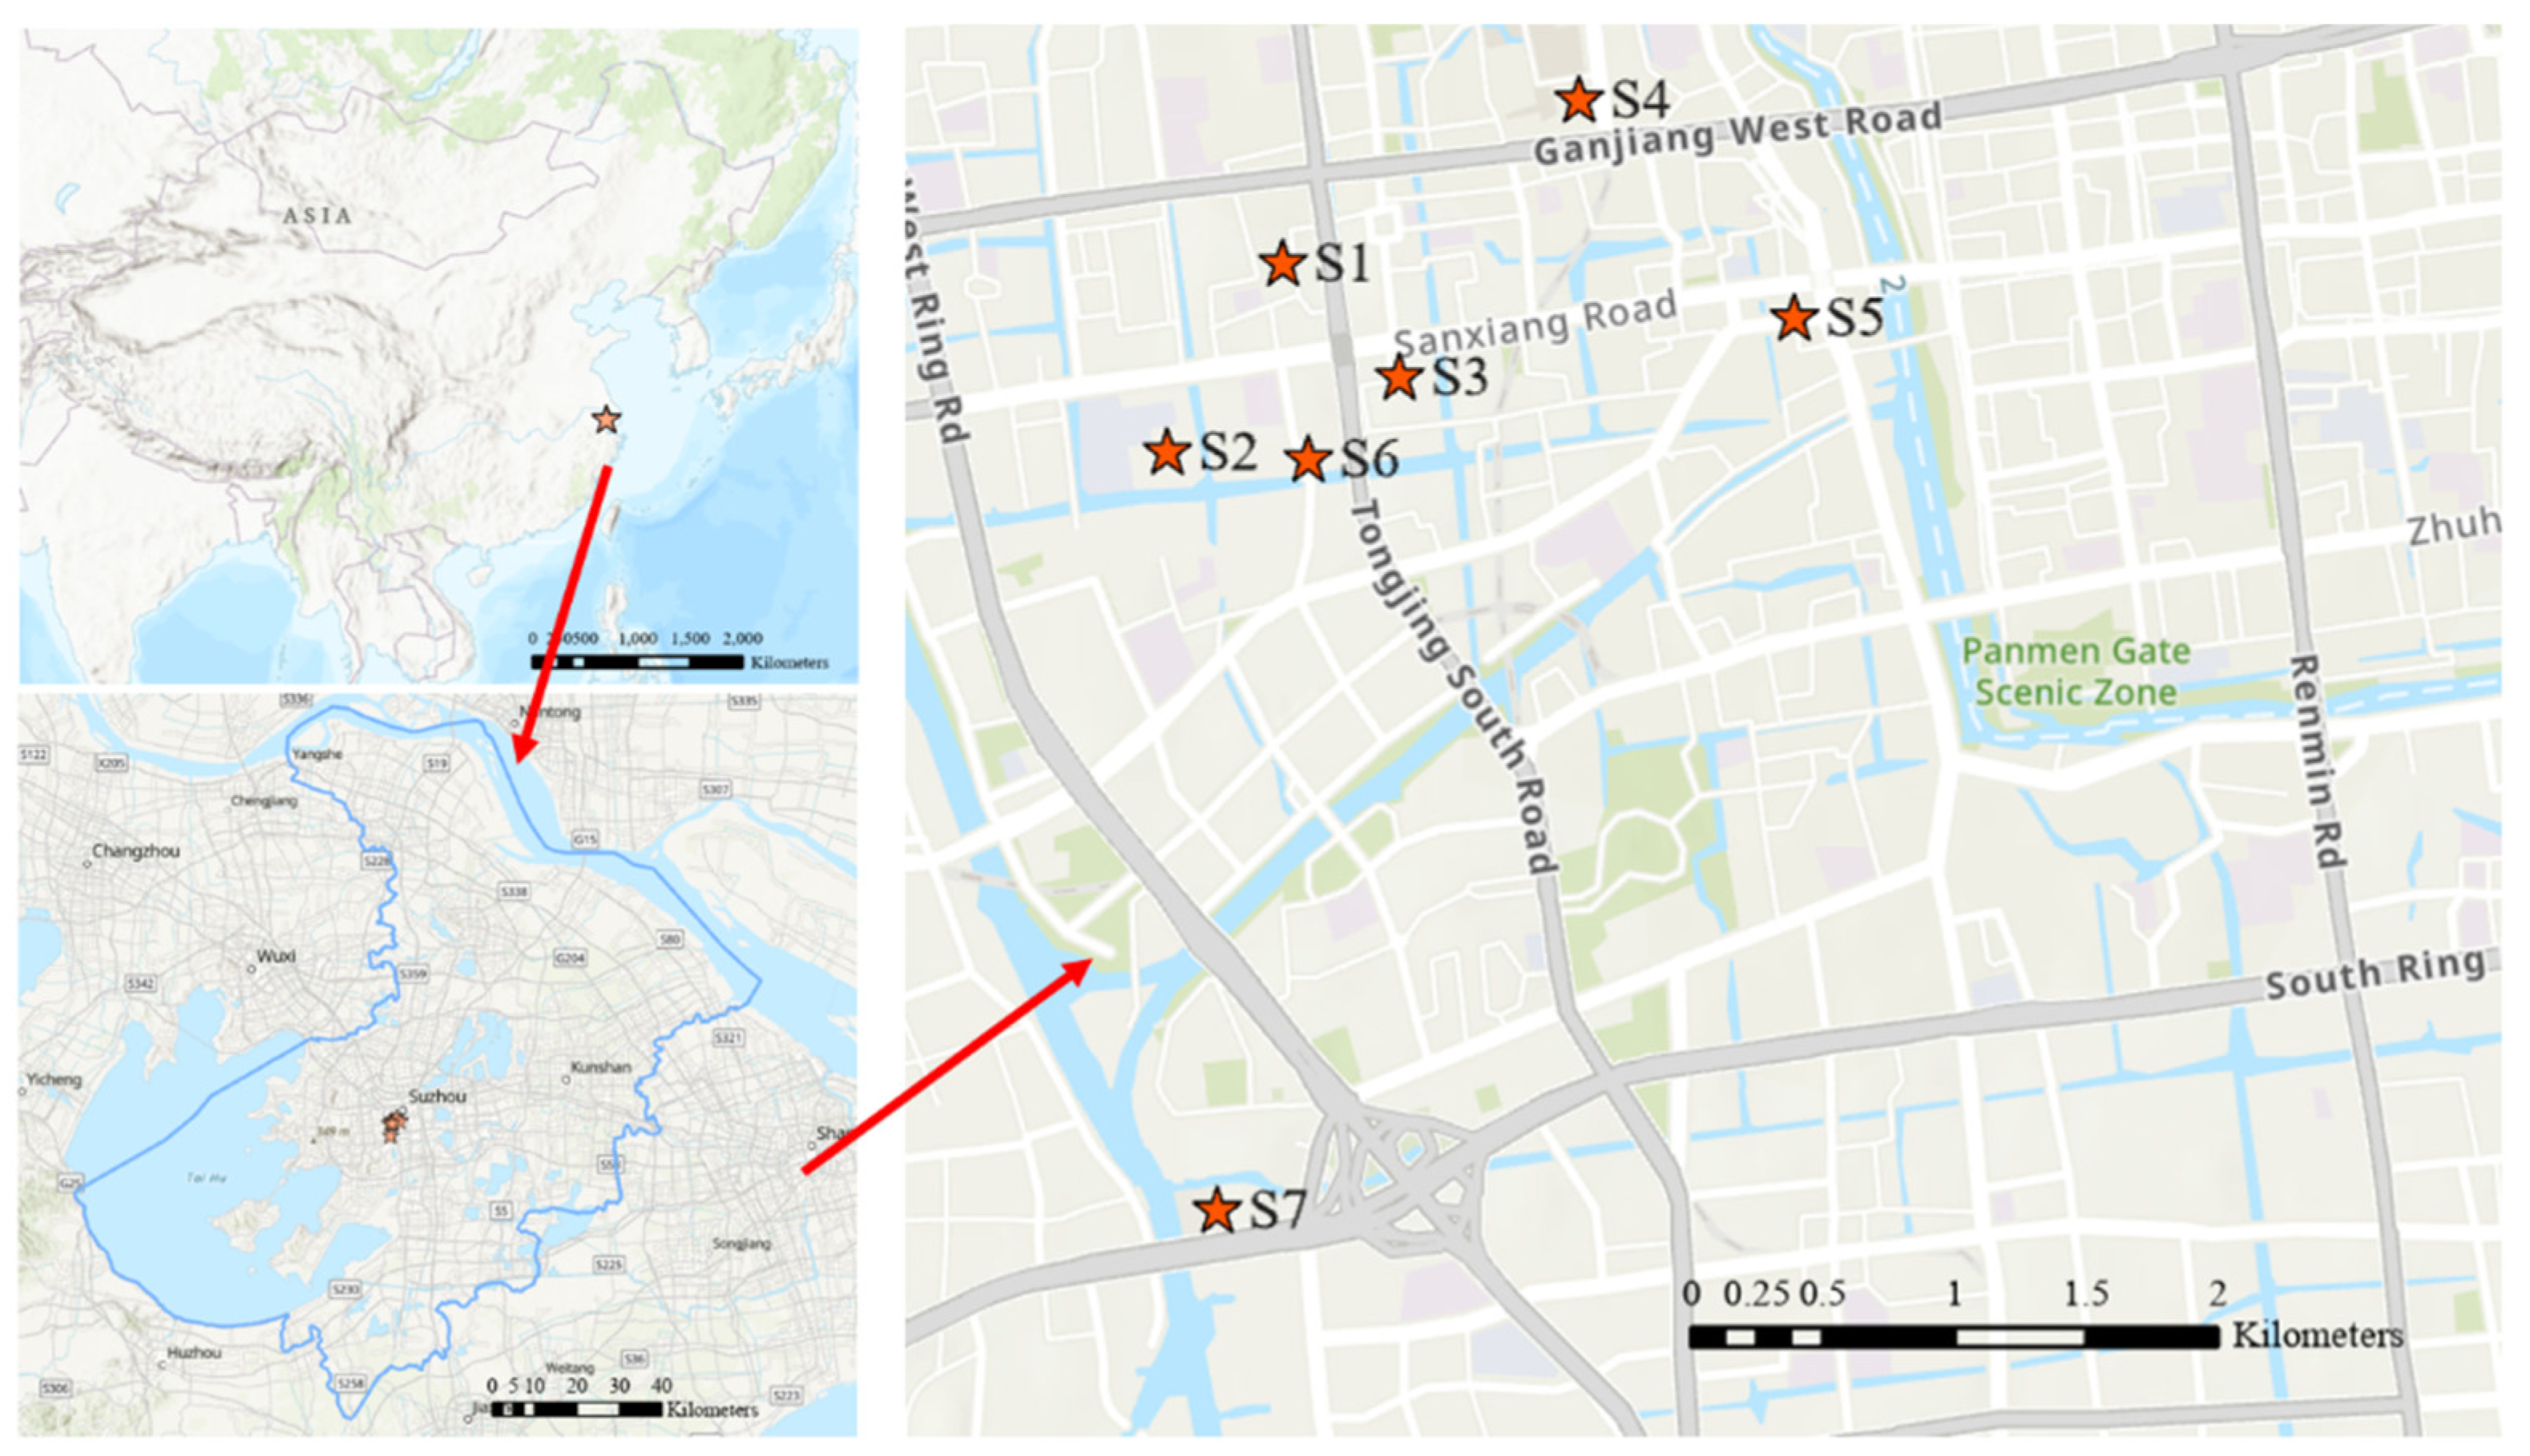
In this study, several dry weather days were selected for monitoring in August and October 2018. The sampling locations are shown in Figure 4. S1 and S2 were selected for household sewage sampling, and S4 was selected for productive sewage sampling, which in all constituted the concentration from the sewage source.
For the outlet, water flow and water quality monitoring points at different spatial levels were selected within the Fuxing WWTP service area. As shown in Figure 4, S1, S2, and S3 were selected at the plot level; S5 and S6 were selected at the pumping station level (the former is the upstream pumping station of the latter); the inlet of the Fuxing wastewater plant was selected as S7, which all constituted the concentration of regional outlet at different levels (Cout at different spatial scale). The water quality data are all 24 h continuous data (2 h time interval) on dry days. For groundwater quality, samples were collected in the morning, midday, and evening on dry weather days with the same sampling period as the sewage source sampling, which gave the concentration of infiltration water
For wet weather days, this study conducted water quality monitoring of the sewer outlet of a typical plot (S1) on 17 August and 22 August 2018, respectively. The sampling frequency was the same as that of dry weather days, except that the rainfall runoff was sampled every 15 min. The rainfall amount reached 36 mm during the sampling period (about 4 h) on 17 August and 7 mm during the sampling period (about 3.5 h) on 22 August.
2.3. SWMM-Based Analysis of Storage Capacity
- (1)
- Base Model-Hydraulic Module
First, the model was constructed by sorting out the connection relationships between the sewage facilities of the sewage network system based on the pipeline topological data, in which the upstream and downstream connection relationships of each pumping station and sewage plant are shown in Figure 3. Then, when generalizing the sewage network, considering the model as a tool for evaluating the storage capacity of the sewage network, there is no need to model each of the branch pipes inside the service area. Besides that, due to the enormous number of branch pipes, the calculation efficiency of the model would be impaired. Therefore, only the municipal pipes greater than or equal to DN300 are generalized in this study.
- (2)
- Infiltration Module
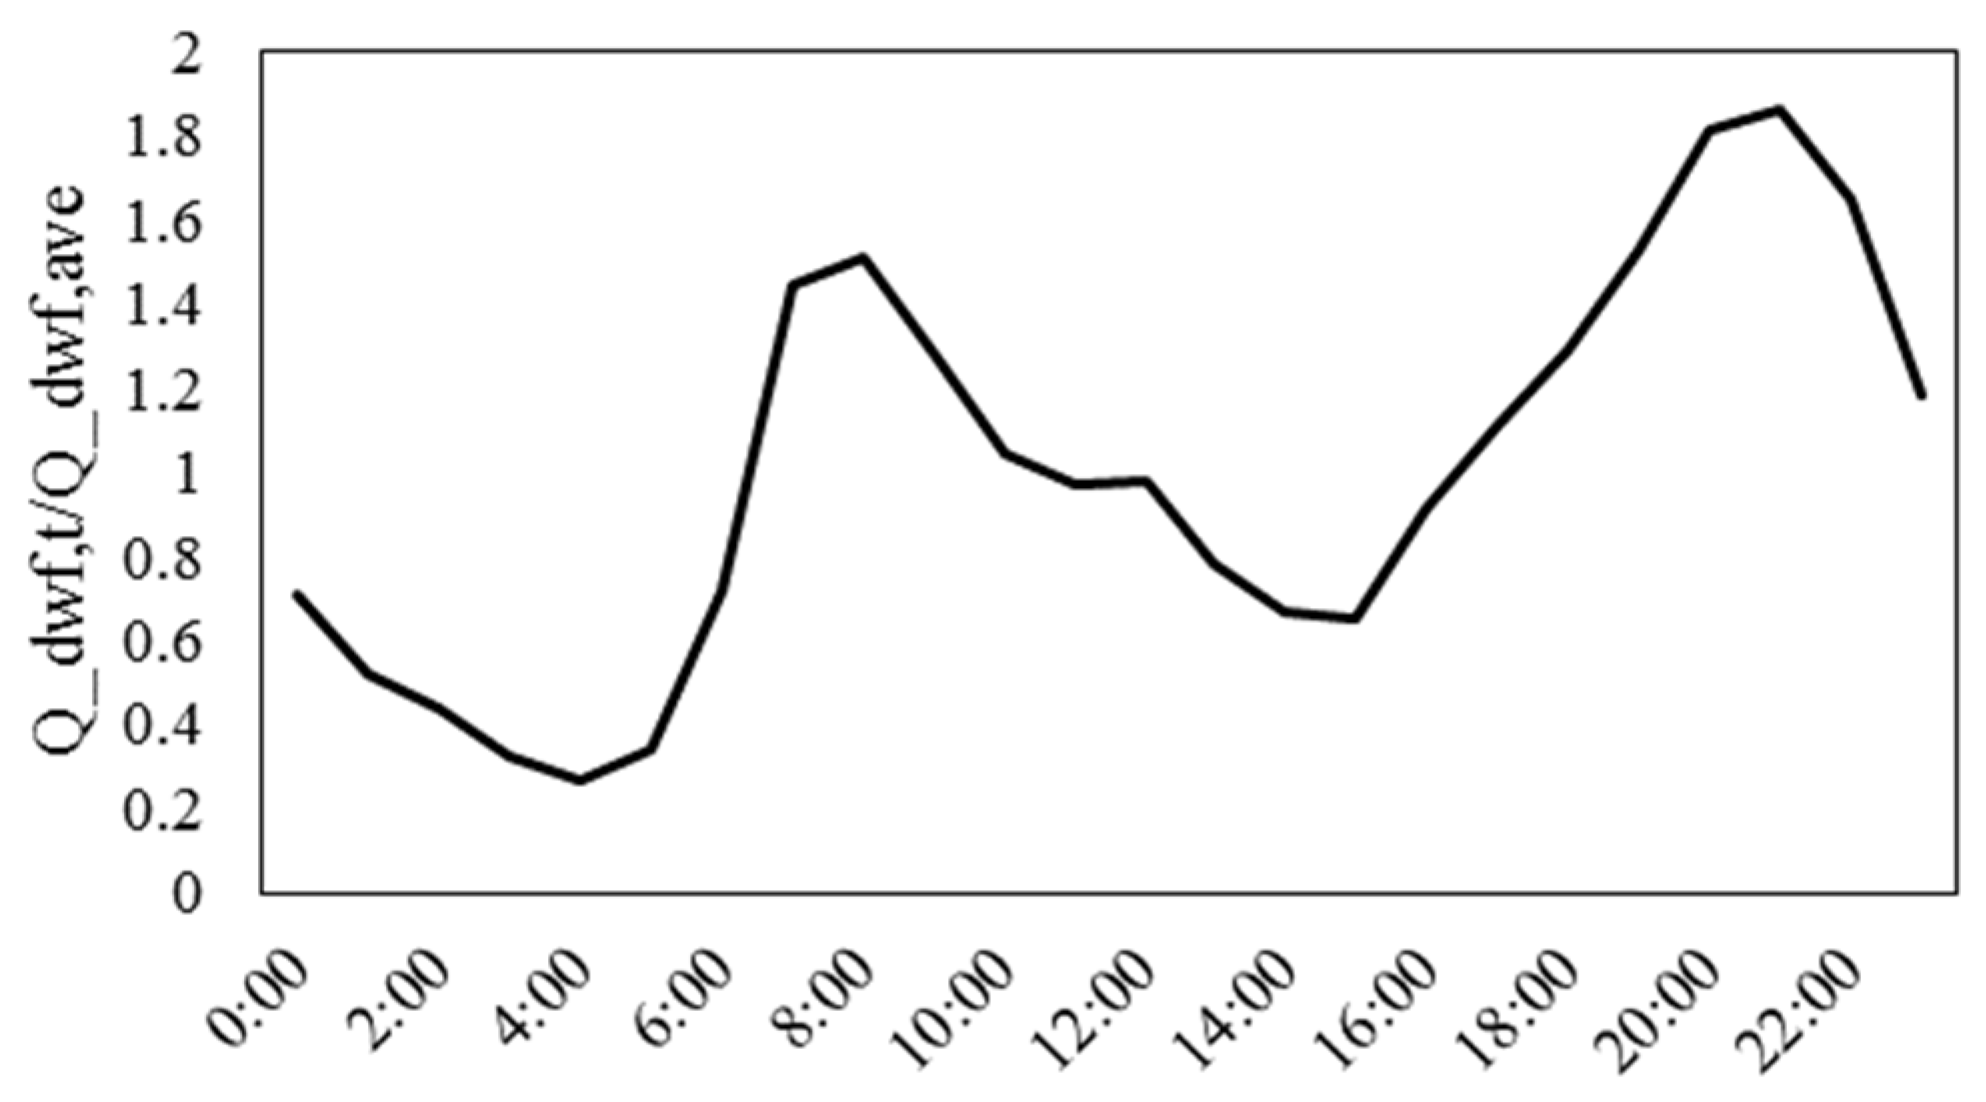
For infiltration, the nodal equiproportional constant model was employed, using infiltration as an equiproportional constant and allocating the infiltration according to the information of each nodal plot within the 17 pumping-station areas and the corresponding amount of residential domestic sewage. Residential domestic sewage and infiltration together form the dry weather flow (DWF) of the nodes. A typical dry-weather flow variation line was obtained by continuously monitoring the water amount at the typical plot outlet in Section 2.2, as shown in Figure 5, with two daily peak flows at 8:00 and 20:00. On this basis, the time series distribution of the dry weather inflow at each node over a 24 h dry weather period was obtained; thus, the construction of the infiltration module was completed.
- (3)
- Inflow module
For inflow, the most likely mathematical relationship between I/I induced by rainfall is the form of a power function, i.e., Qinflow = aRb. Based on historical rainfall conditions of the sewage network inflow and the corresponding rainfall data, the power function relationship between the two is regressed to model the inflow under rainfall conditions. In this above equation, the unit of R (rainfall) is mm/d and the unit of inflow is ten thousand m3/d. For the value of parameters a and b, the HSY algorithm is used for determination, taking into account the influence of parameter uncertainty on the prediction results.
The inflow module is used as input to the Inflows section of the upstream drainage nodes to extend the simulation. The inflow modeling formula are used to obtain corresponding time-series inflow in each pumping station service area with time-series precipitation data.
- (4)
- Storage capacity evaluation
With the completed SWMM model after the former three steps, the storage capacity on dry weather days and wet weather days (under multi-year average precipitation) was evaluated. With the storage capacity evaluation on dry weather and wet weather days, the storage capacity of each pumping station area would be precisely quantified and provide guidance for sewage pumping-station operation control. This result would also be the basis for the final objective of this study—online storage technology.
2.4. Rule-Based Control Strategy for Online Storage Scheduling
In order to optimize the control of pumping stations, this research adopted an experience-based manual control mode in practice with the following basic instructions.
- The pumping stations are classified according to their importance of the service area and ground elevation. Commercial, residential areas, and areas with low ground elevation (prone to flooding) are listed as critical protection areas; industrial areas away from the city center, logistics areas, and areas with high ground elevation are listed as general areas.
- When there is an increase in the I/I induced by rainfall, priority is given to ensuring the normal operation of pumping stations in critical areas, increasing the conveying amount of water and avoiding sewage overflow in these areas. For general areas, reduce the conveying amount of water from pumping stations, alleviating the pressure of their water load on pumping stations in downstream critical areas.
- The pre-emptying rule before rainfall. Suppose the weather forecast indicates that a rainfall event will occur. In that case, the sewage plant and the pumping station intake can be increased in advance for pre-emptying of the pipe network to cope with the upcoming rainfall event.
- Water-level balancing rules of lateral pumping stations under rainfall. Under rainfall, a pumping station (called “pumping station A”) exceeds its critical water level, in addition to flow restriction upstream, the water-level balance of lateral pumping stations (other pumping stations that converge to the same downstream pumping station) can also be carried out. Suppose the water level of the lateral pumping station B is below the critical level. In that case, the flow of pumping station B can be reduced (using the storage room of the pipeline system when the critical level has not been reached). In contrast, the flow of pumping station A can be increased to ensure that the total flow is relatively stable to better achieve the level balance between pumping stations A and B, making full use of the storage room of different pumping stations.
- Limit water-level protection rules. Set the limit levels (including the minimum and maximum values) for each pumping station. When the level is lower than the minimum value, all pumps must be forced off; a pump (or multiple pumps) must be forced on when the level is higher than the maximum value.
- Flow restoration rules after rainfall. After rainfall, if all other downstream pumping stations and the front pond of the sewage plant have returned to their normal level range, the pumping station can be released from the rain flow restriction and return to dry-season level control mode. Executing judgment on individual pumping stations allows all pumping stations to gradually return to the dry-season control mode. However, it should be noted that in order to avoid unstable pumping station operation, when cutting back to dry-season control mode, instead of starting multiple pumps (not including those previously switched on), only one pump should be switched on for a certain period of time, followed by the next pump.
- In accordance with the above principles, changes in water levels at the pumping stations and complaints of sewage overflow in their service areas are monitored during rainfall, and the operation of pumping stations is scheduled based on manual experiences and storage capacities evaluated from Section 2.3.
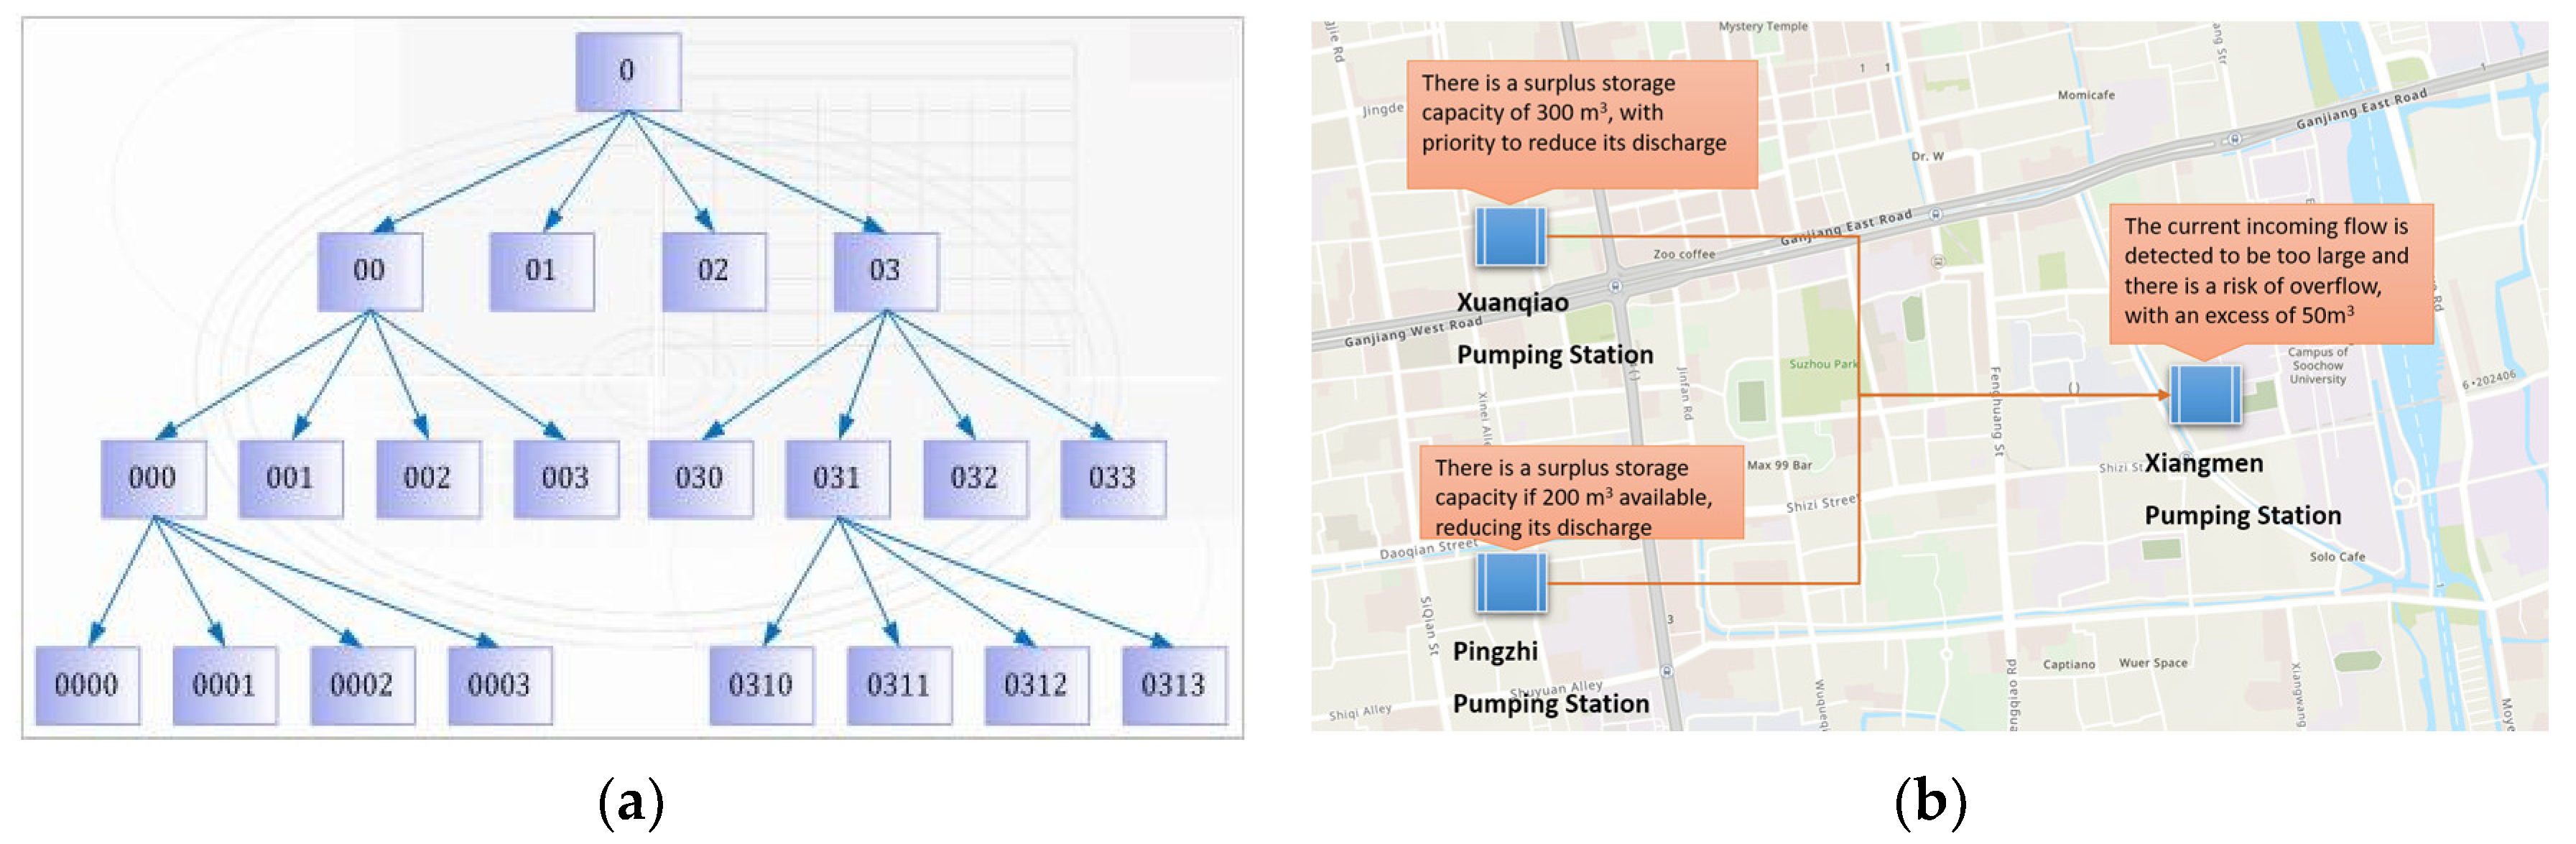
According to the upstream and downstream location relationship, importance, structural characteristics, and basic pump information between pumping stations, the relationship between water level and the flow of the pumping station could be established for the control platform. The platform mainly adopts the multi-tree model of cascade pumping stations (as shown in Figure 6a). The Breadth First Search (BFS) algorithm is used to ensure the execution order of scheduling calculation [31]. Finally, the regional water allocation and water level control algorithm are realized, and the storage capacity of the pumping station is optimized. A demonstration study of rule-based feedback control (RBC) was carried out in the sewage areas of three pumping stations at two grades—Xuanqiao, Pingzhi, and Xiangmen—with the following control rules shown in the logic schematic in Figure 6b. The control rules are as follows:
- (1)
- If the rising rate and duration of water level at the Xiangmen pumping station exceed a specific value, indicating the flow amount of influent is large. According to particular rules, the pump-control water level is increased up to the maximum limit to maximize online storage capacity at this level.
- (2)
- At the same time, calculate and assess the storage capacities of the two upstream pumping stations of Xuanqiao and Pingzhi and their corresponding pipes in their service areas. Prioritize the reduction of water conveyance from the Xuanqiao pumping station in accordance with its importance and storage capacity to reduce the pressure of rising water levels at the downstream Xiangmen pumping station.
- (3)
- If the water level of the Xiangmen pumping station is still rising, reduce the amount of water conveyed from the Pingzhi pumping station. Conversely, when the peak flow has passed and the water level at Xiangmen pumping station tends to be normal, the pumping stations will gradually return to their original operating state in order.
3. Results and Discussion
3.1. I/I Quantification
The laboratory testing results of samples taken on dry weather days are shown in Table 1. From the monitoring data, it can be seen that, compared with the two stable isotopes, there was no obvious difference in conductivity in each type of water. Besides, the coefficient of variation of TN concentration in the mixed sewage (both upstream and downstream) was larger than that of the sewage source, indicating TN was not stable enough. According to the I/I quantification theory, neither conductivity nor TN was the suitable indicator for I/I quantification of the sewer network in this study. The stable isotope analysis report showed that the instrumental measurement error of 2H was generally greater than that of 18O. Therefore, the stable isotope 18O was the most suitable water quality indicator for the quantification of I/I in our research.
For I/I quantification on wet weather days, we need two types of water-quality indicators. However, the chemical analysis results showed that the stable isotopes of the mixed sewage were below the detection limit under the two rainfall scenarios (7 mm and 36 mm precipitation, respectively), thus, the I/I calculations could not be carried out. This may be due to the large deviation of isotopic abundance in the rainwater. Therefore, electric conductivity and TN indicators were used for the calculation of infiltration and inflow rates during rainfall periods.
Based on the laboratory chemical analysis data, the I/I quantification results are shown in Table 2 and Figure 7. The average water amount induced by I/I in dry weather accounts for 20–25% of the total collected wastewater. Under typical rainfall (36 mm rainfall) conditions, the water amount induced by inflow and infiltration is 2.19 and 0.61 times of the sewage discharged, accounting for 57.66 and 15.98% of the total wastewater collected by the pipes, respectively, with a total combined share of 73.64%.
3.2. SWMM Model and Storage Capacity Evaluation
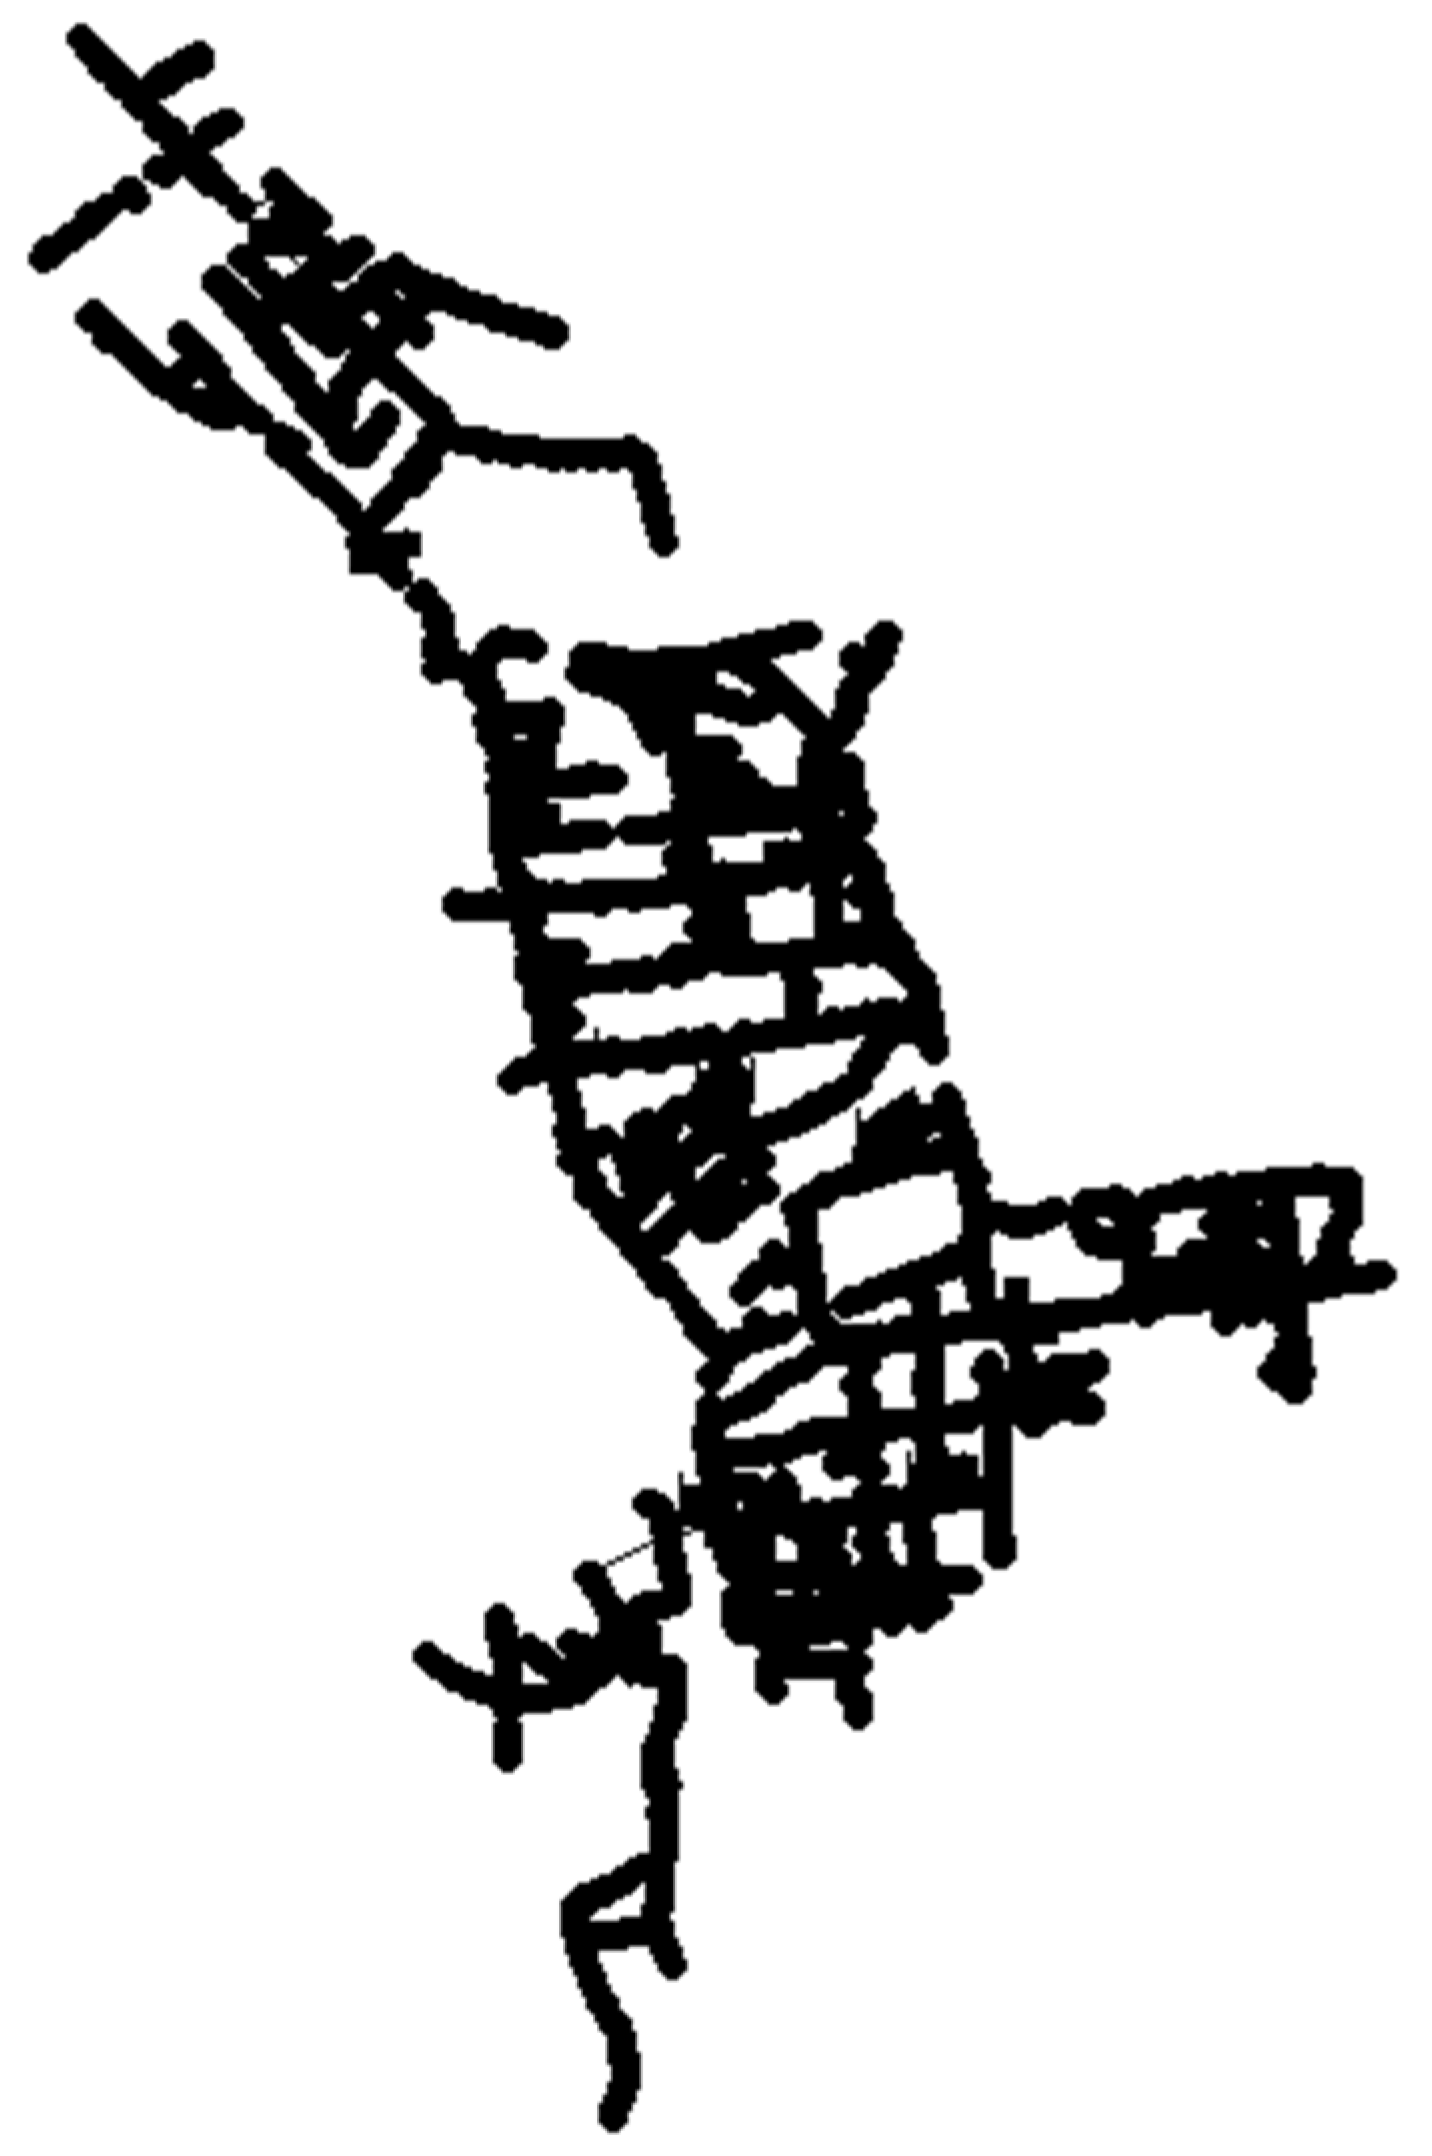
The SWMM model has 5032 nodes, 5011 pipes, and 17 pumping-station service areas, as shown in Figure 8. Besides, the parameters of the I/I model put forward in Section 2.3 is partly shown in Table 3.
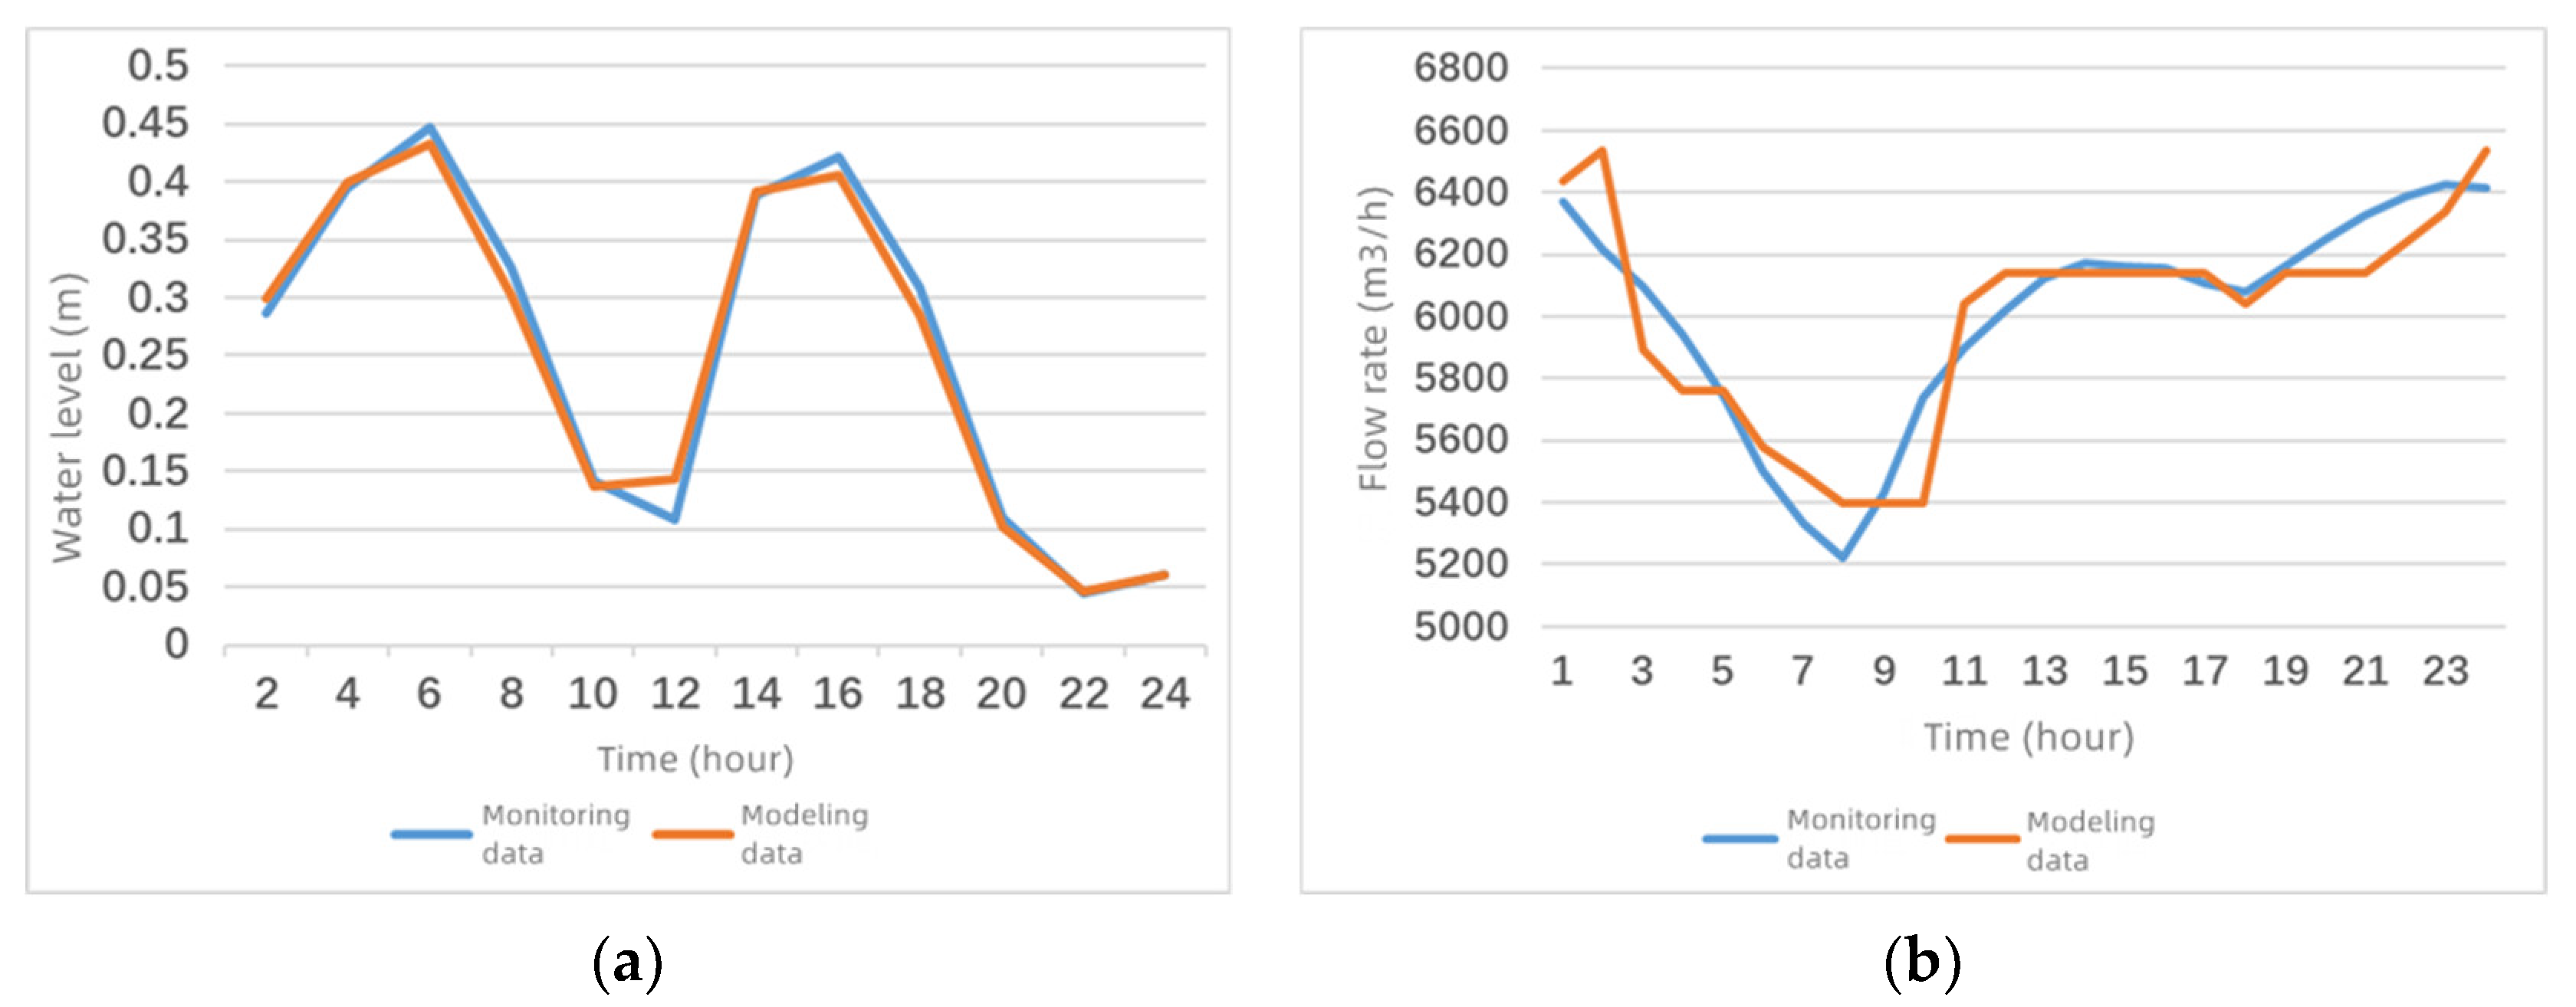
According to the water quantity and quality monitoring data, the parameters of wastewater generation and infiltration of the dry weather day were calibrated. The result of calibration is shown in Figure 9a, using the water level at the outlet of the area as the calibration data, which exhibits good results with the Nash efficiency coefficient reaching above 0.9.
Furthermore, hydrological parameters such as pipe Manning roughness coefficient and pipe network inflow and infiltration coefficient were calibrated according to the monitoring data of sewage plant influent and each pumping station inlet and outlet flow rate. After calibration, the dry-weather sewage plant inflow revealed good simulation with the Nash efficiency coefficient reaching about 0.8, as shown in Figure 9b.
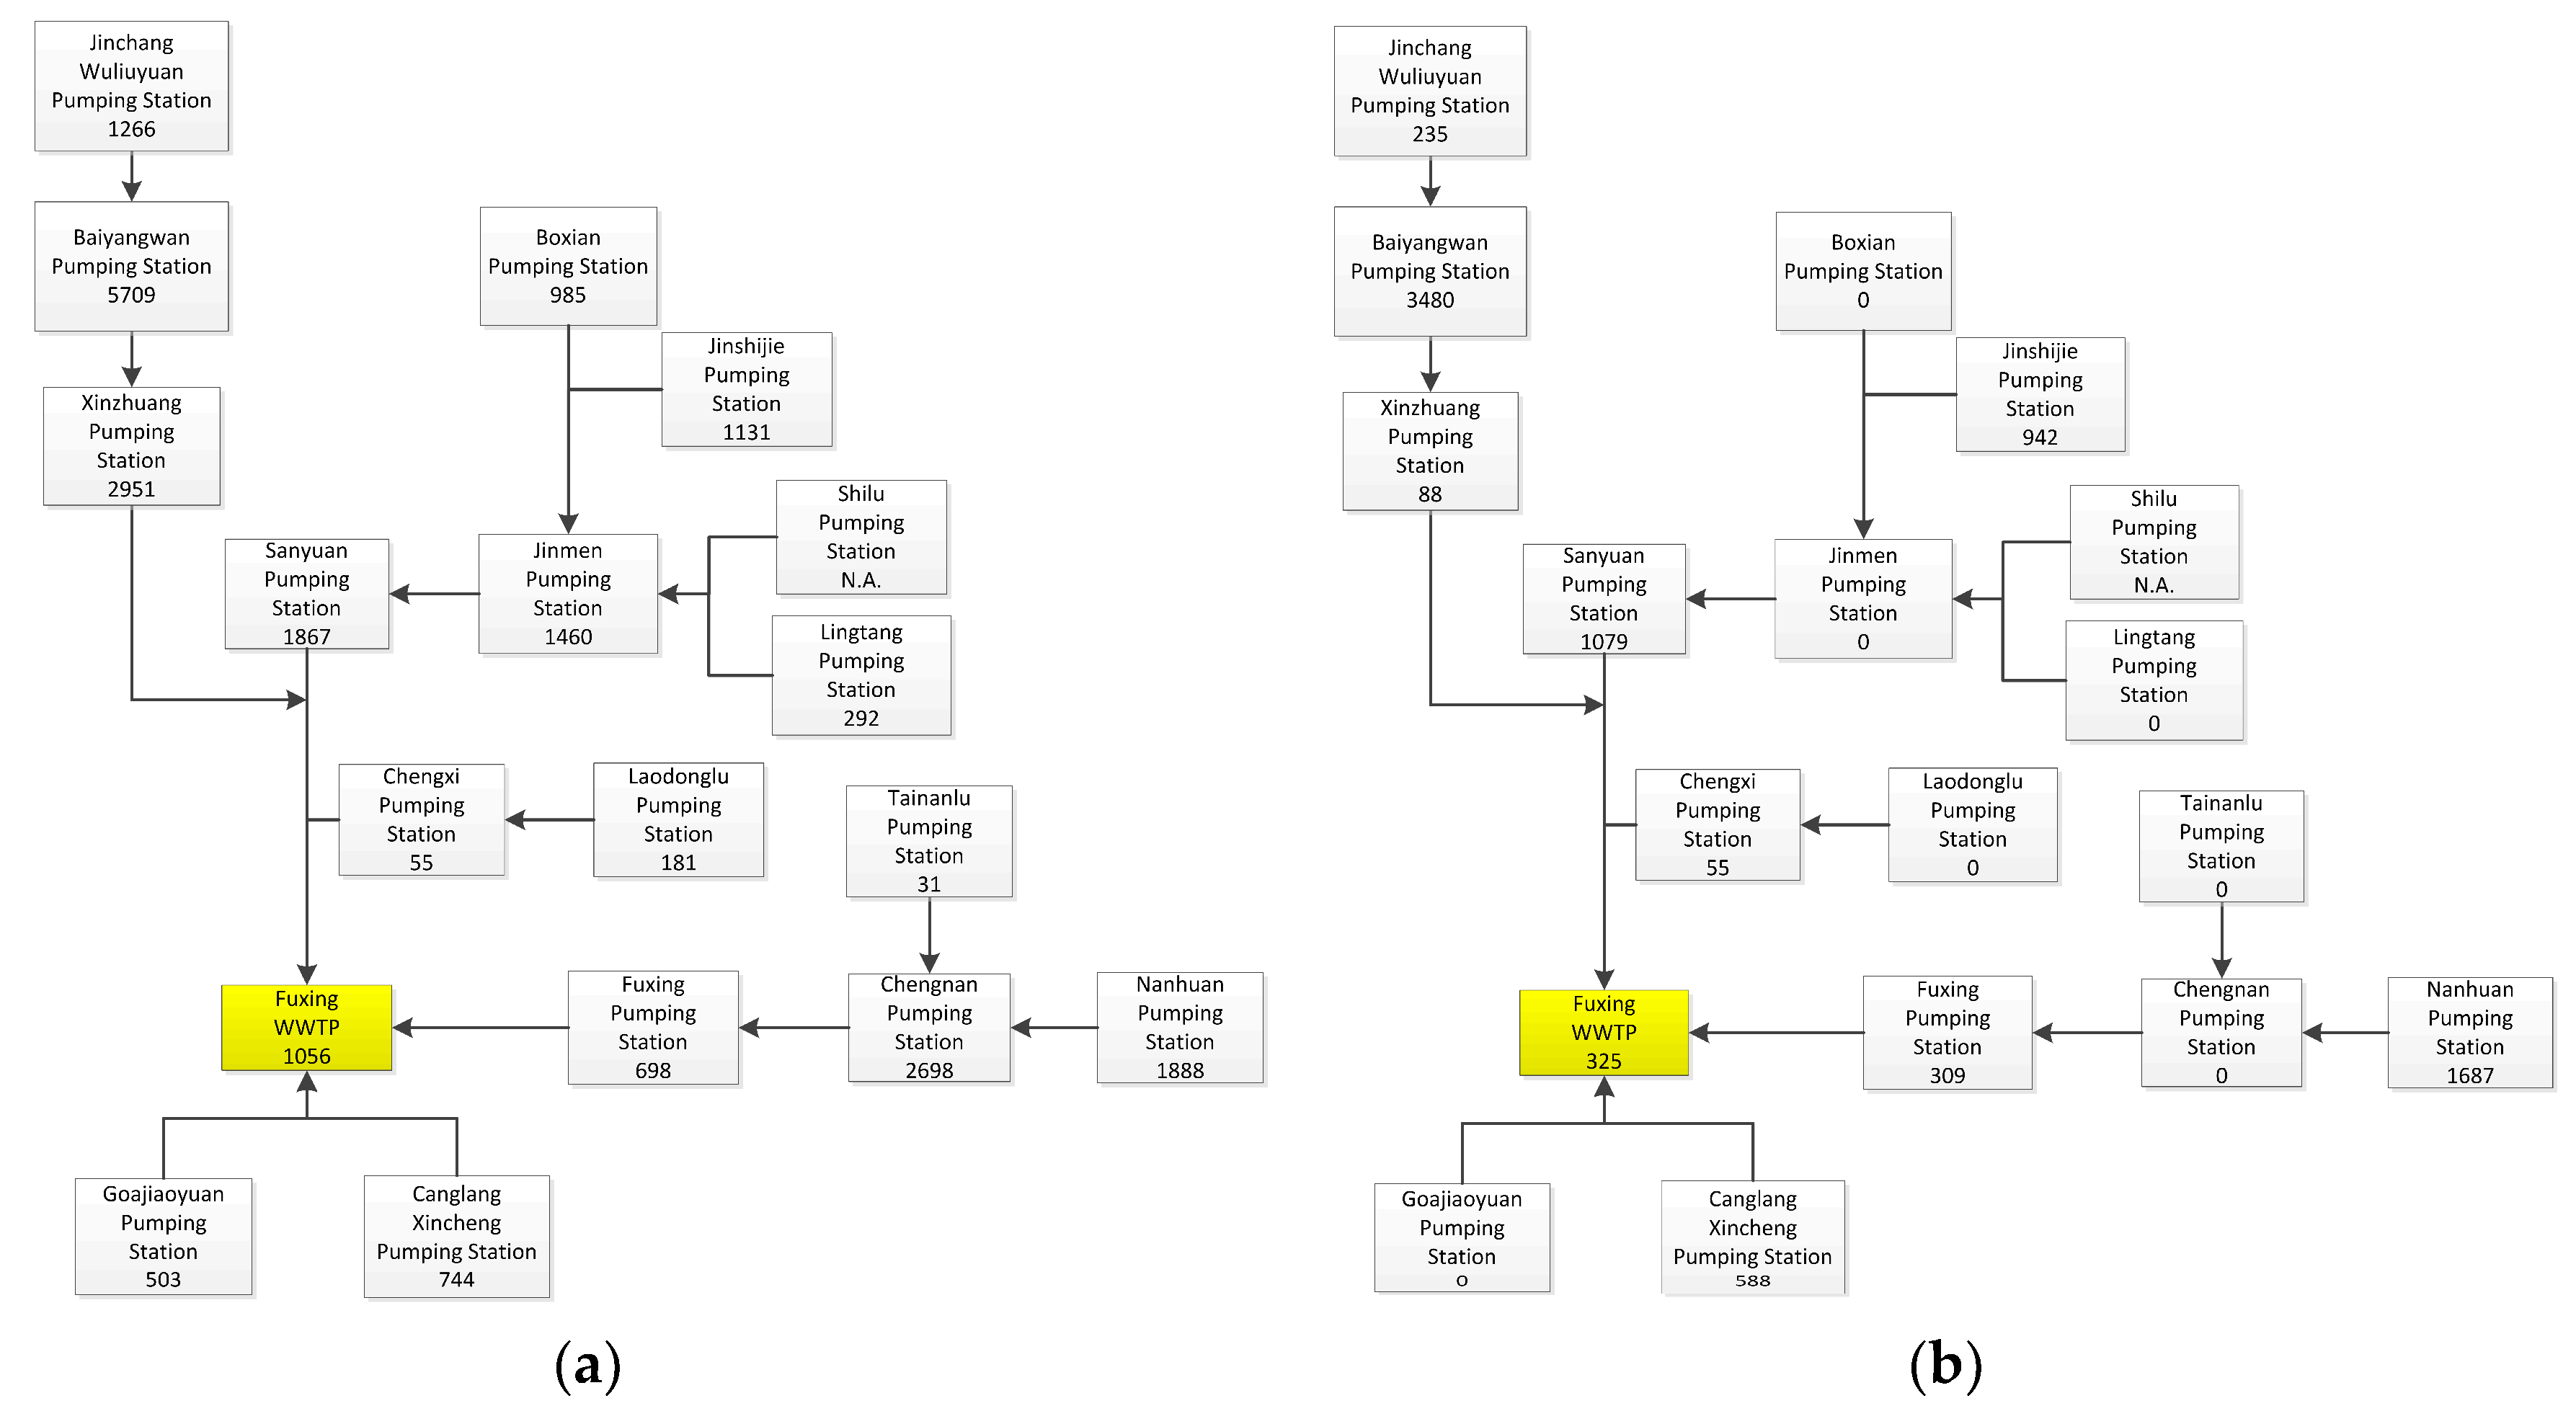
The storage capacity was evaluated through the built SWMM model, as shown in Figure 10a,b. The simulation results show that under the dry weather scenario, the remaining storage of the overall sewage pipe network accounts for more than 50% of the total storage room (excluding inspection wells), in which the storage capacity of the pipe network in the areas of Boxian Road, Jinmen, and the front area of the treatment plant is approaching their maximum capacities, with less than 20% remaining storage of the pipe network during the hydraulic peak hours. In the multi-year average rainfall scenario, the remaining storage room of the pipe network as a whole accounts for more than 30% of the total storage. Pumping stations such as Baiyangwan, Canglang, Fuxing, Jinshi Street, Nanhuan, Sanyuan, and Tainan Road have a higher scheduling potential, with more than 50% storage room during peak hydraulic hours.
3.3. Effects of Rule-Based Control Strategy
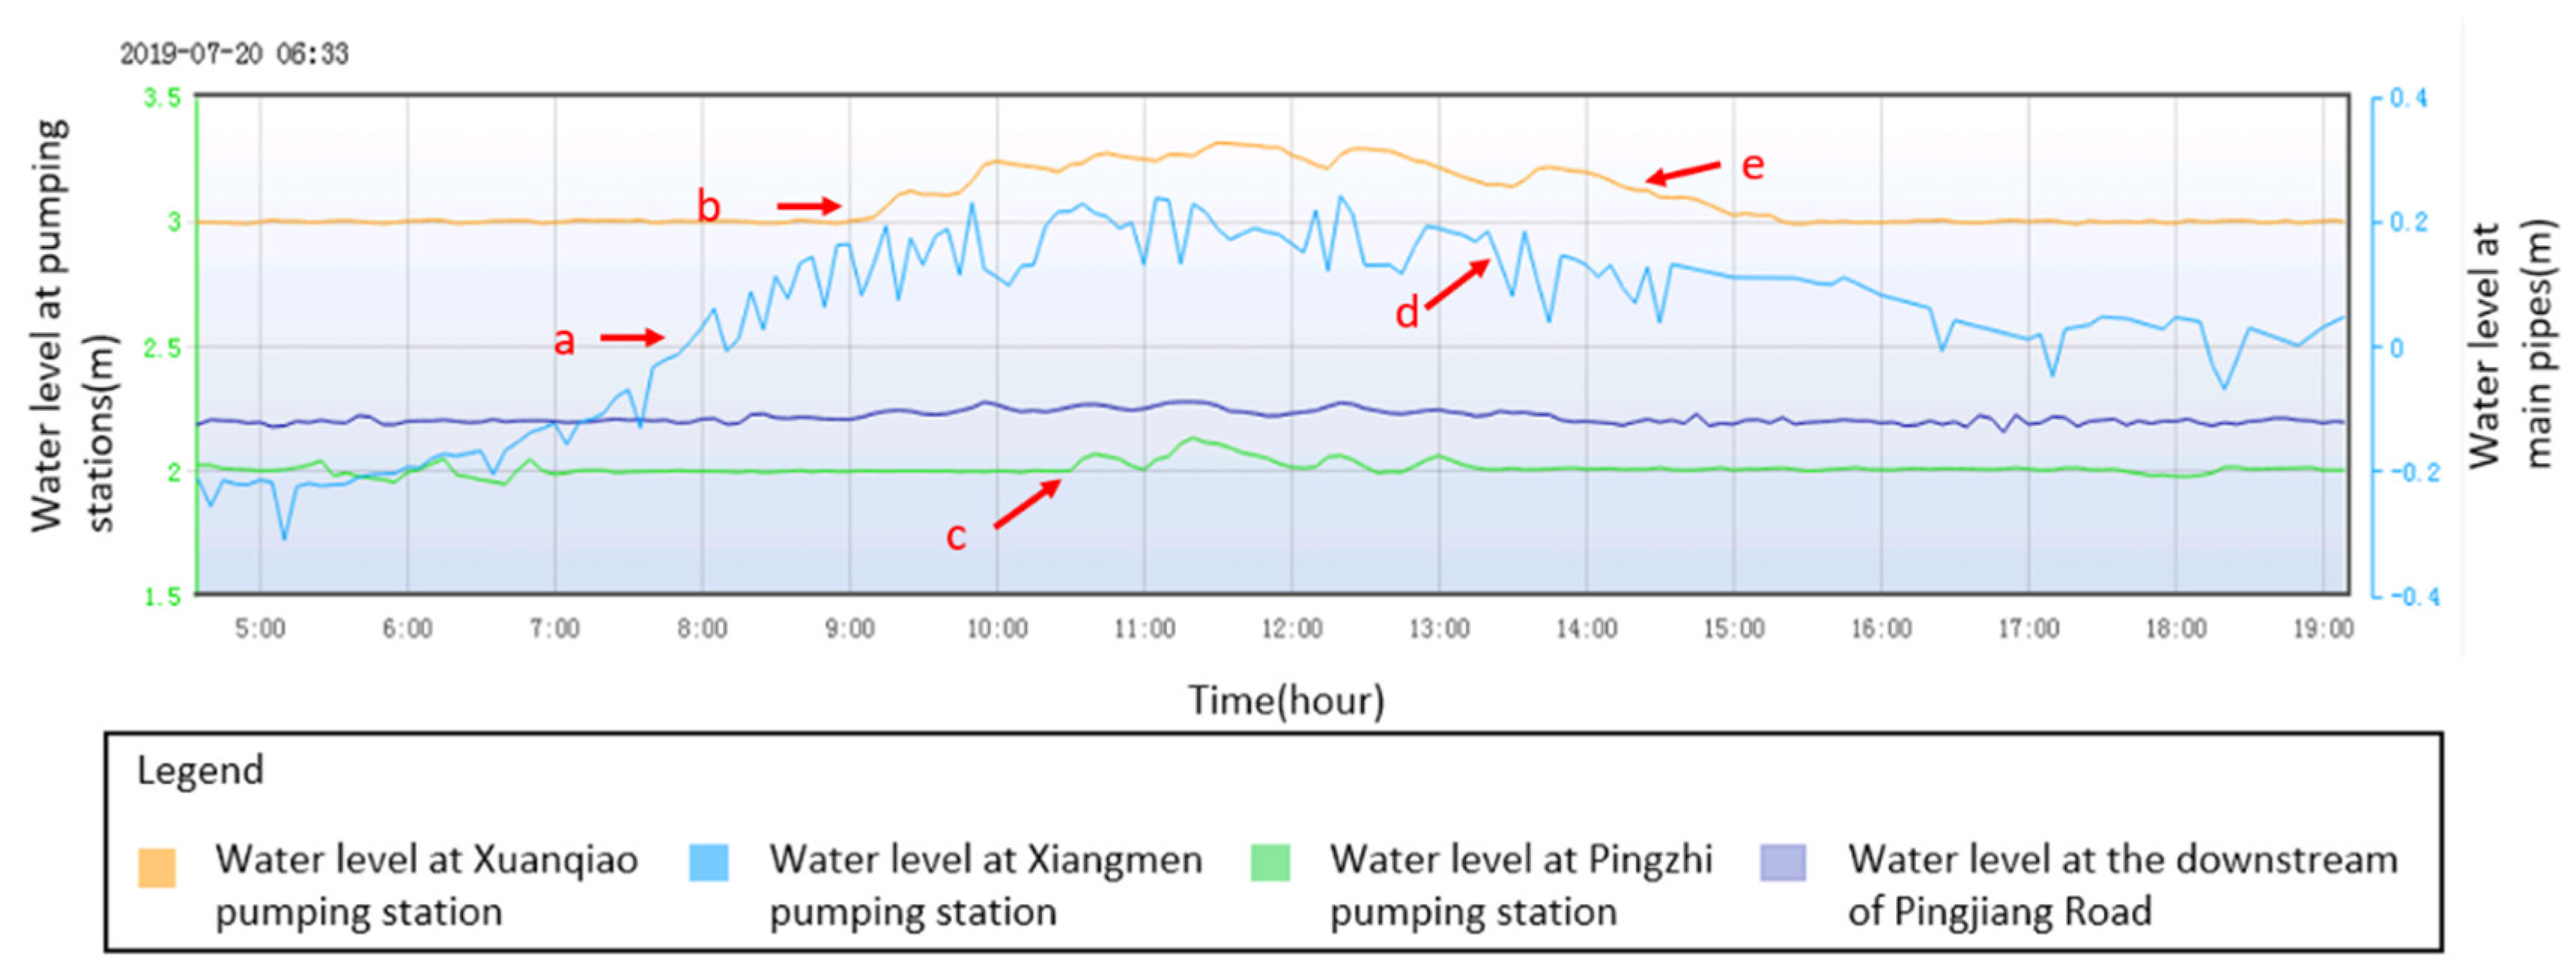
Firstly, the rule-based control strategy was applied to the three pumping stations in two grades in Section 2.4 as an example to illustrate the water-level control effects, as shown in Figure 11. It can be seen the cooperative control strategy through upstream and downstream pumping station operation control (synergistic control of regional pumping station) gives better play to the online storage scheduling of the sewage pipeline and reduces peak water levels. When the water level of Xiangmen Pumping Station shows a rising trend at “a” point, a high water-level risk is detected. As a result, the Xiangmen Pumping Station starts to turn into a full-operation status. If the rising trend does not stop and even continues, the corresponding upstream pumping stations start to decrease their outflow based on their regional importance of service area and available storage capacity. At “b” point, the upstream Xuanqiao Pumping Station begins to raise its regional water level and decrease its outflow. At “c” point, another upstream pumping station, Pingzhi Pumping Station also starts to decrease its outflow, due to the water level of Xiangmen Pumping Station does not decrease. As both upstream pumping stations decrease their outflow, the water level of Xiangmen Pumping Station starts to drop at “d” point. When the peak flow has passed and the water level of the Xiangmen pumping station tends to be normal, the upstream pumping stations will gradually return to the original operation in order, such as the “e” point.
The cooperative control of online storage scheduling was completed and put into operation in May 2021 for all service regions of the Fuxing wastewater plant. The trial operation continued until early 2022. From the feedback from the pumping station operation apartment, five aspects have achieved observable results in terms of peak-time water level and duration, storage capacity scheduling, frequent start and stop of pumps, unit energy consumption of pumping stations, and sewage plant influent flow fluctuations.
- The peak-time water level and duration are significantly reduced. Compared with 2020, the average duration of peak hours during daytime is reduced by 3 h, and the highest water level is reduced by 56 cm. The average duration of peak hours at night is reduced by 1 h, and the highest level is reduced by 55 cm. The design cooperative control mode reduces the duration of peak hours and the highest level and fully guarantees the safety of the pipe network operation.
- The storage capacity of the pipe network has increased significantly. After implementation, the storage capacity was increased by 198 and 293% during the day and night, separately.
- The number of pump starts and stops was reduced by 96%. The number of frequent starts and stops before commissioning was 15.8 times/day; after commissioning, the number of frequent starts and stops was 0.6 times/day, an overall decrease of 96% compared to the same period in the previous year. The number of frequent starts and stops of the sewage pumping station has been significantly reduced, which has a positive effect on the pump-life extension and the reduction of energy consumption of the pumping station.
- In terms of energy consumption per unit in the pumping stations, the average unit consumption before was 0.037 kWh/m3 and after was 0.032 kWh/m3, a 12.2% overall decrease compared to the same period in 2020.
- Inflow fluctuations of the sewage plant were reduced by 30%. Through pre-drainage during the usual period, staggered conveyance and discharge during the peak period utilizing full use of the sewage network storage room make the influent flow to plants water relatively balanced, ensuring a stable sewage plant operation and effluent quality.
With regard to the research outcome, regional cooperative control has achieved satisfactory results in terms of the number of frequent pump starts and stops, peak water level and duration, unit energy consumption, and WWTP inflow fluctuations have all exhibit observable drop, which only decreases the operation cost but also extends pump life expectancy, ensuring a more stable and economic sewage system. Furthermore, the hidden storage capacity of the current sewage system has been explored through the cooperative control mode. In such a way, the storage capacity has been increased two to three times than the former operation mode without any infrastructure mode, which further highlights the real-time control benefits in sewage or even drainage systems.
4. Conclusions
For a typical city on a plain river network region, the water amount of I/I of the central-city district of Suzhou’s separate sewerage system has exceeded its design values. The designed cooperative control strategy of the sewage system provides a collaborative operation mode of the regional multi-stage pumping stations, which can effectively avoid the high water-level operation of the sewage system caused by the peak sewage on dry days. Besides, the storage capacity has increased two to three times based on offline model calculations and manual rule-based control strategies. Furthermore, combined with rainfall forecasting, the pre-drainage of sewer pipes in conjunction with wastewater treatment plants and sewage pumping stations before rainfall can, to a certain extent (in this study under 35 mm rainfall), cope with the increase in I/I induced by rainfall, with vital practical significance and application value.
Author Contributions
Conceptualization, Y.D. and H.Z.; Visualization, S.Z., L.Y. and J.J.; Writing—original draft, G.X.; Writing—review & editing, X.D. All authors have read and agreed to the published version of the manuscript.
Funding
This work was funded by the National Key Research and Development Program of China (2021YFC3201504).
Conflicts of Interest
The authors declare no conflict of interest.
References
- Liang, S.; Liu, Y.; Dong, X. Evaluation of the current drainage system in China and some policy advice. Water Wastewater Engineering 2018, 44, 132–140. [Google Scholar]
- Jenssen Sola, K.; Bjerkholt, J.T.; Lindholm, O.G.; Ratnaweera, H. Infiltration and Inflow (I/I) to wastewater systems in Norway, Sweden, Denmark, and Finland. Water 2018, 10, 1696. [Google Scholar] [CrossRef] [Green Version]
- Xu, Z.; Wang, L.; Yi, H.; Li, H. Quantification of Groundwater Infiltration into Urban Drainage Networks Based on Marker Species Approach. J. Tongji Univ. (Nat. Sci.) 2016, 44, 593–599. [Google Scholar]
- Weiss, G.; Brombach, H.; Haller, B. Infiltration and inflow in combined sewer systems: Long-term analysis. Water Sci. Technol. 2002, 45, 11–19. [Google Scholar] [CrossRef]
- Ertl, T.; Spazierer, G.; Wildt, S. Estimating groundwater infiltration into sewerages by using the moving minimum method—A survey in Austria. In Proceedings of the 11th International Conference on Urban Drainage, Edinburgh, UK, 31 August–5 September 2008. [Google Scholar]
- Gasperi, J.; Cladière, M.; Rocher, V.; Moilleron, R. Combined sewer overflow quality and EU Water Framework Directive. Urban Waters 2009, 1, 124–128. [Google Scholar]
- Council, D.C.; Council, D.L.C.; Council, F.C.; Council, K.C.; Council, M.C.; Council, W.C. Greater Dublin Strategic Drainage Study. Dublin. New Development Policy–Technical Guidance Document. 2005; pp. 1–5.
- Kracht, O.; Gujer, W. Quantification of infiltration into sewers based on time series of pollutant loads. Water Sci. Technol. 2005, 52, 209–218. [Google Scholar] [CrossRef] [PubMed]
- Bareš, V.; Krejčí, P.; Stránský, D.; Sýkora, P. Long-term monitoring of infiltration/inflow based on diurnal variation of pollutant mass flux. In Proceedings of the 11th International Conference on Urban Drainage, Edinburgh, UK, 31 August–5 September 2008. [Google Scholar]
- Liu, X.H.; Zhang, J.S.; Goulven, I. Groundwater Infiltration in Shenzhen Drainage System. China Water Wastewater 2013, 29, 77–79. [Google Scholar]
- Tian, L.; Zhang, S.F.; Shi, Z.B. Evaluation on Ground Water Infiltration Capacity into Shanghai Sewerage System. China Water Wastewater 2013, 19, 12–15. [Google Scholar]
- García, L.; Barreiro-Gomez, J.; Escobar, E.; Téllez, D.; Quijano, N.; Ocampo-Martínez, C. Modeling and real-time control of urban drainage systems: A review. Adv. Water Resour. 2015, 85, 120–132. [Google Scholar] [CrossRef] [Green Version]
- Garofalo, G.; Giordano, A.; Piro, P.; Spezzano, G.; Vinci, A. A distributed real-time approach for mitigating CSO and flooding in urban drainage systems. J. Netw. Comput. Appl. 2017, 78, 30–42. [Google Scholar] [CrossRef]
- Lund, N.S.V.; Borup, M.; Madsen, H.; Mark, O.; Mikkelsen, P.S. CSO Reduction by Integrated Model Predictive Control of Stormwater Inflows: A Simulated Proof of Concept Using Linear Surrogate Models. Water Resour. Res. 2020, 56, e2019WR026272. [Google Scholar] [CrossRef]
- Lund, N.S.V.; Falk, A.K.V.; Borup, M.; Madsen, H.; Steen Mikkelsen, P. Model predictive control of urban drainage systems: A review and perspective towards smart real-time water management. Crit. Rev. Environ. Sci. Technol. 2018, 48, 279–339. [Google Scholar] [CrossRef]
- Mullapudi, A.; Lewis, M.J.; Gruden, C.L.; Kerkez, B. Deep reinforcement learning for the real time control of stormwater systems. Adv. Water Resour. 2020, 140, 103600. [Google Scholar] [CrossRef]
- Saliba, S.M.; Bowes, B.D.; Adams, S.; Beling, P.A.; Goodall, J.L. Deep Reinforcement Learning with Uncertain Data for Real-Time Stormwater System Control and Flood Mitigation. Water 2020, 12, 3222. [Google Scholar] [CrossRef]
- Xu, Z.; Wu, L.; Zhang, X.; Xue, A. Fuzzy Optimal Control of Sewage Pumping Station with Flow Concentration. In Proceedings of the International Conference on Computer Science, Environment, Ecoinformatics, and Education, Wuhan, China, 21–22 August 2011; Springer: Berlin/Heidelberg, Germany, 2011; pp. 259–266. [Google Scholar]
- Hou, S.; Li, D.; Xi, Y.; Cen, L. Energy-saving optimization of urban drainage system based on pump performance. In Proceedings of the 27th Chinese Control and Decision Conference (2015 CCDC), Qingdao, China, 23–25 May 2015; pp. 308–313. [Google Scholar]
- Choukri, L.; Lasri, R.; Bouhorma, M. Application of Fuzzy Logic in Energy Efficiency for one Pumping Systems. In Proceedings of Proceedings of the 2nd International Conference on Computing and Wireless Communication Systems, Larache, Morocco, 14–16 November 2017; pp. 1–6. [Google Scholar]
- Fecarotta, O.; Carravetta, A.; Morani, M.C.; Padulano, R. Optimal pump scheduling for urban drainage under variable flow conditions. Resources 2018, 7, 73. [Google Scholar] [CrossRef]
- Huang, M. Strategy Research on Intelligent Optimal Coordinated Discharge of Urban Sewage Based on Flow. Master’s Thesis, Tongji University, Shanghai, China, 2010. [Google Scholar]
- Song, C.F.; Zhou, W.D.; Wang, X.H. Optimal Schedule CPN Model for Regional Drainage Pump Station. Comput. Eng. 2011, 37, 240–244. [Google Scholar]
- Chen, L.L.; Xia, Y.Y.; Wang, X.H. Flow predictable optimal scheduling control of sewage discharge system. Appl. Mech. Mater. 2012, 121, 848–852. [Google Scholar] [CrossRef]
- Zhuan, X.; Xia, X. Optimal operation scheduling of a pumping station with multiple pumps. Appl. Energy 2013, 104, 250–257. [Google Scholar] [CrossRef]
- Zhang, Q. Research on Risk Assessment of Urban Sewage Pipeline and Optimal Operation of Sewage Pumping Station. Master’s Thesis, Hefei University of Technology, Hefei, China, 2019. [Google Scholar]
- Zhang, Q.; Guo, H. Circulation Differences in Anomalous Rainfall over the Yangtze River and Huaihe River Valleys in Summer. Chin. J. Atmos. Sci. 2014, 38, 656–669. [Google Scholar]
- Yao, Y. Performance Assessment of Urban Drainage System based on Quantification of Inflow and Infiltration. Master’s Thesis, Tsinghua University, Beijing, China, 2019. [Google Scholar]
- APHA. Standard Methods for the Examination of Water and Wastewater; American Public Health Association: Washington, DC, USA, 2005. [Google Scholar]
- Zhang, Q.; Luo, Z.; Lu, W.; Harald, Z.; Zhao, Y.; Tang, J. Using water isotopes and hydrogeochemical evidences to characterize groundwater age and recharge rate in the Zhangjiakou area, North China. J. Geogr. Sci. 2020, 30, 935–948. [Google Scholar] [CrossRef]
- Yao, P.; Zheng, L.; Liao, X.; Jin, H.; He, B. An efficient graph accelerator with parallel data conflict management. In Proceedings of the 27th International Conference on Parallel Architectures and Compilation Techniques, Limassol, Cyprus, 1–4 November 2018; pp. 1–12. [Google Scholar]
Figure 1.
A typical picture of “small bridges, flowing water and homes” in central district of Suzhou.
Figure 1.
A typical picture of “small bridges, flowing water and homes” in central district of Suzhou.

Figure 2.
The three sewage systems in the study area and the and the distribution of multi-pump stations in the service area.
Figure 2.
The three sewage systems in the study area and the and the distribution of multi-pump stations in the service area.

Figure 3.
Schematic diagram of the scheduling logic for sewage pumping stations in the study area. (a) Ancient-city district and eastern part of the city; (b) Western part of the city.
Figure 3.
Schematic diagram of the scheduling logic for sewage pumping stations in the study area. (a) Ancient-city district and eastern part of the city; (b) Western part of the city.

Figure 4.
Sampling locations, represented as stars labeled from S1 to S7.

Figure 5.
Flow variation line on typical dry days.

Figure 6.
Schematic diagram of the control logic of a step-pumping station. (a) Schematic diagram of the multinomial tree model for a stepped pumping station. (b) Schematic diagram of the regional linkage control of three pumping stations in two grades.
Figure 6.
Schematic diagram of the control logic of a step-pumping station. (a) Schematic diagram of the multinomial tree model for a stepped pumping station. (b) Schematic diagram of the regional linkage control of three pumping stations in two grades.

Figure 7.
Analysis result of minutely I/I rates of sewage network at a typical site (S1) during rainfall periods. (a) 17 August 2018 (36 mm precipitation). (b) 22 August 2018 (7 mm precipitation).
Figure 7.
Analysis result of minutely I/I rates of sewage network at a typical site (S1) during rainfall periods. (a) 17 August 2018 (36 mm precipitation). (b) 22 August 2018 (7 mm precipitation).

Figure 8.
SWMM model used for evaluation of storage capacity.

Figure 9.
Calibration results. (a) Water level at the outlet of the area. (b) Inflow of the sewage treatment plant.
Figure 9.
Calibration results. (a) Water level at the outlet of the area. (b) Inflow of the sewage treatment plant.

Figure 10.
The storage capacity evaluation result (unit: m3). (a) Storage capacity of each pumping-station service area on a dry weather day. (b) Storage capacity of each pumping station under multi-year average precipitation.
Figure 10.
The storage capacity evaluation result (unit: m3). (a) Storage capacity of each pumping-station service area on a dry weather day. (b) Storage capacity of each pumping station under multi-year average precipitation.

Figure 11.
The effect of implementing the control model for typical two-stage three pumping stations.
Figure 11.
The effect of implementing the control model for typical two-stage three pumping stations.


Table 1.
Laboratory testing results of samples taken on dry days.
| Indicator | Statistical Type | Source of Sewage | Upstream Mixed Sewage | Downstream Mixed Sewage | Infiltration | |||||
|---|---|---|---|---|---|---|---|---|---|---|
| Residents | Productive Service | S1 | S2 | S3 | S5 | S6 | S7 | Groundwater | ||
| TN | Range | 51.9~109.0 | 17.9~31.6 | 4.9~28.0 | 15.7~51.3 | 35.8~99.6 | 8.0~44.0 | 22.4~59.2 | 27.5~58.1 | 1.1~3.5 |
| Average | 69.3 | 23.9 | 13.3 | 27.4 | 60.7 | 17.6 | 37.4 | 43.3 | 2.5 | |
| Standard deviation | 17.0 | 6.0 | 8.2 | 11.6 | 19.4 | 11.6 | 10.2 | 9.9 | 0.8 | |
| Coefficient of variation | 0.25 | 0.25 | 0.62 | 0.42 | 0.32 | 0.66 | 0.27 | 0.23 | 0.31 | |
| Electric conductivity | Range | 756~1743 | 998~1274 | 670~793 | 752~1172 | 790~1229 | 632~1040 | 624~995 | 908~1233 | 690~739 |
| Average | 1156 | 1110 | 728 | 889 | 955 | 778 | 761 | 1012 | 714 | |
| Standard deviation | 242 | 126 | 41 | 132 | 119 | 129 | 122 | 101 | 21 | |
| Coefficient of variation | 0.21 | 0.11 | 0.06 | 0.15 | 0.12 | 0.17 | 0.16 | 0.1 | 0.03 | |
| 18O | Range | −3.55~−3.44 | −3.57~−3.33 | −4.57~−3.74 | −4.05~−3.49 | −4.02~−2.83 | −5.17~−4.20 | −4.74~−4.44 | −4.27~−3.82 | −6.23~−5.31 |
| Average | −3.50 | −3.48 | −4.09 | −3.83 | −3.64 | −4.74 | −4.59 | −4.00 | −5.72 | |
| Standard deviation | 0.04 | 0.12 | 0.25 | 0.17 | 0.32 | 0.31 | 0.09 | 0.13 | 0.38 | |
| Coefficient of variation | 0.01 | 0.03 | 0.06 | 0.04 | 0.09 | 0.06 | 0.02 | 0.03 | 0.07 | |
| 2H | Range | −27.55~−27.05 | −28.02~−26.74 | −33.25~−27.31 | −30.00~−26.67 | −29.44~−20.69 | −38.56~−31.06 | −32.26~−30.50 | −31.79~−29.44 | −40.29~−30.71 |
| Average | −27.29 | −27.47 | −30.31 | −28.56 | −26.40 | −35.55 | −31.14 | −30.51 | −36.05 | |
| Standard deviation | 0.14 | 0.57 | 1.64 | 1.30 | 2.59 | 2.50 | 0.58 | 0.67 | 4.25 | |
| Coefficient of variation | 0.01 | 0.02 | 0.05 | 0.05 | 0.10 | 0.07 | 0.02 | 0.02 | 0.12 | |
Table 2.
Statistics result of sewage network hourly infiltration rate on dry days.
| Spatial Hierarchy | Typical Plots | Service Area of Pumping Station | Service Area of WWTP | |||
|---|---|---|---|---|---|---|
| Monitoring points | S1 | S2 | S3 | S5 | S6 | S7 |
| Hourly average infiltration rate (%) | 27 | 15 | 8 | 55 | 48 | 22 |
| Hourly average infiltration flow (L/s) | 0.63 | 0.65 | 0.20 | 22.14 | 188.55 | 415.31 |
| Maximum hourly infiltration rate and flow | 2.61 | 2.05 | 2.52 | 1.36 | 1.13 | 1.59 |
Note: Infiltration rate is the ratio of infiltrated water in the sewage network to the total water collected in the network.
Table 3.
Parameters of the I/I model for inflow in each sewage area.
| Area Names | Xinzhuang | Sanyuan | Chengxi | Chengnan | Jiaoyuyuan | Fuxing |
|---|---|---|---|---|---|---|
| Parameter a | 0.0663 | 0.0700 | 0.0463 | 0.0997 | 0.0302 | 0.3948 |
| Parameter b | 0.5490 | 0.5266 | 0.6885 | 0.4722 | 0.5197 | 0.4824 |
Publisher’s Note: MDPI stays neutral with regard to jurisdictional claims in published maps and institutional affiliations. |
© 2022 by the authors. Licensee MDPI, Basel, Switzerland. This article is an open access article distributed under the terms and conditions of the Creative Commons Attribution (CC BY) license (https://creativecommons.org/licenses/by/4.0/).
Share and Cite
MDPI and ACS Style
Dai, X.; Xu, G.; Ding, Y.; Zeng, S.; You, L.; Jiang, J.; Zhang, H. Online Storage Technology of the Separate Sewage System: Demonstration Study in a Typical Plain River Network City. Water 2022, 14, 3194. https://doi.org/10.3390/w14203194
AMA Style
Dai X, Xu G, Ding Y, Zeng S, You L, Jiang J, Zhang H. Online Storage Technology of the Separate Sewage System: Demonstration Study in a Typical Plain River Network City. Water. 2022; 14(20):3194. https://doi.org/10.3390/w14203194
Chicago/Turabian StyleDai, Xiaohu, Guozhong Xu, Yongwei Ding, Siyu Zeng, Lan You, Jianjun Jiang, and Hao Zhang. 2022. "Online Storage Technology of the Separate Sewage System: Demonstration Study in a Typical Plain River Network City" Water 14, no. 20: 3194. https://doi.org/10.3390/w14203194
Note that from the first issue of 2016, this journal uses article numbers instead of page numbers. See further details here.