Article

Water Exchange between Deep Basins of the Bransfield Strait

by
Dmitry I. Frey
1,2,*,
Viktor A. Krechik
1,3,
Eugene G. Morozov
1,2,
Ilya D. Drozd
1,4,5,
Alexandra S. Gordey
1,
Alexander A. Latushkin
2,
Olga S. Mekhova
1,6,
Rinat Z. Mukhametianov
1,7,
Svetlana A. Murzina
1,8,
Sofia A. Ostroumova
1,6,
Vladimir I. Ponomarev
9,
Pavel A. Salyuk
9,
Daria A. Smirnova
1,4,
Sergey A. Shutov
2 and
Oleg A. Zuev
1
1
Shirshov Institute of Oceanology, Russian Academy of Sciences, Nakhimovsky 36, 117997 Moscow, Russia
2
Marine Hydrophysical Institute, Russian Academy of Sciences, Kapitanskaya Str. 2, 299011 Sevastopol, Russia
3
Laboratory for Marine Environmental Management, Immanuel Kant Baltic Federal University, Ulitsa Aleksandra Nevskogo 14, 236041 Kaliningrad, Russia
4
Faculty of Geography, Moscow State University, Leninskie Gory 1, 119991 Moscow, Russia
5
Obukhov Institute of Atmospheric Physics, Russian Academy of Sciences, Pyzhevskiy Pereulok 3, 119017 Moscow, Russia
6
Laboratory for Marine Environmental Management, Russian State Hydrometeorological University, Malookhtinskiy Prospekt 98, 195196 St. Petersburg, Russia
7
Moscow Institute of Physics and Technology, Institutsky per. 9, 141700 Dolgoprudny, Russia
8
Institute of Biology of the Karelian Research Centre of the Russian Academy of Sciences, Ulitsa Pushkinskaya 11, 185910 Petrozavodsk, Russia
9
Ilichev Pacific Oceanological Institute, Far Eastern Branch of the Russian Academy of Science, Baltiyskaya Street 43, 690041 Vladivostok, Russia
*
Author to whom correspondence should be addressed.
Water 2022, 14(20), 3193; https://doi.org/10.3390/w14203193
Submission received: 7 August 2022 / Revised: 4 October 2022 / Accepted: 5 October 2022 / Published: 11 October 2022

Abstract

:
The Bransfield Strait is a relatively deep and narrow channel between the South Shetland Islands and the Antarctic Peninsula contributing to the water transport between the Pacific and Atlantic sectors of the Southern Ocean. The strait can be divided into three deep separate basins, namely, the western, central, and eastern basins. The sources of deep waters in the three basins are different, leading to differences in thermohaline properties and water density between the basins. The difference in water density should in turn cause intense deep currents from one basin to another through narrow passages over the sills separating the basins. However, there are still no works dedicated to such possible overflows in the Bransfield Strait. In this study, we report our new CTD and LADCP measurements performed in 2022 over the watersheds between the basins. Quasisimultaneous observations of the main circulation patterns carried out at several sections allowed us to analyze the evolution of thermohaline and kinematic structures along the Bransfield Strait. Volume transports of waters in the strait were estimated on the basis of direct velocity observations. These new data also indicate the existence of intense and variable deep current between the central and eastern basins of the strait. The analysis of historical data shows that the mean flow is directed from the central to the eastern basin. In addition, LADCP data suggest the intensification of the flow in the narrow part of the sill between the basins, and the possible mixing of deep waters at this location.

1. Introduction

The Bransfield Strait (BS) is an important passage for Antarctic waters in the region of the Antarctic Peninsula, which contributes to the zonal water transport between the Pacific and Atlantic sectors of the Southern Ocean. The strait extends over 460 km from the west–southwest to the east–northeast (true direction is 60° relative to the north), and is bounded by the South Shetland Islands from the northwest and the Antarctic Peninsula from the southeast. The BS region is characterized by strong climatic changes [1] that affect the oceanographic, meteorological, glaciological, and biological conditions [2]. The BS region is also important because of its high biological productivity [3]. In particular, the region is a key source of Antarctic krill (Euphausia superba) to the Southern Ocean [4,5,6], and the region is a significant spawning, breeding, and overwinter habitat of E. superba [7,8,9] and another abundant euphausiid in Antarctic waters, Thyssanoessa macrura [10]; the BS is one of the significant regions for commercial krill fishing [11,12,13].
The hydrography of the Bransfield Strait is highly dependent on the complicated bathymetry [1,14]. From a geomorphological point of view, the BS can be considered as a sequence of three basins (Figure 1), namely, the western (WB), central (CB), and eastern (EB) basins [15,16]. Modern bottom topography data GEBCO2021 suggest that the maximal depths of these basins are 1370, 1960, and 2750 m, respectively. The basins are separated by relatively shallow sills. The maximal depth of the sill between the WB and CB is 630 m; the depths of the sill between the CB and EB slightly exceed 1000 m. The WB is connected to the Bellingshausen Sea through the Gerlache Strait and other gaps between Smith, Low, and Hoseason islands, and to the Drake Passage through the Boyd Strait (Figure 1). The EB is open to the Weddell and Scotia seas through relatively shallow sills; their depths do not reach 800 m.
The thermohaline structure of the upper BS layer is formed by two water masses, namely, transitional zonal water with Bellingshausen Sea influence (TBW) and transitional zonal water with Weddell Sea influence (TWW) [18,19]. According to [1], typical characteristics of these waters are θ > 1 °C, S < 34.1 psu (TBW flow) and θ < 1 °C, S > 34.1 psu (TWW flow). TBW waters propagate to the northeast along the South Shetland Islands in the form of a narrow high-velocity jet called the Bransfield Current [19,20,21,22]. Additionally, modified Circumpolar Deep Water (mCDW) with temperatures θ > 1 °C and salinities >34.5 psu is stably observed within the Bransfield Current in a depth range of 200–450 m [23,24]. The maximal velocities of the Bransfield Current are observed at the sea surface and linearly decay towards the bottom [22,25,26]; its transport is approximately 1 Sv on the basis of direct velocity measurements [27]. The authors in [28] showed that the diurnal tide essentially affects the Bransfield Current; the same effect was observed in [29]. The TWW is located in the southern part of the strait and spreads southwestward along the Antarctic Peninsula [23]; the velocities of this flow are much lower than those in the Bransfield Current and usually do not exceed 20–30 cm/s [30]. Further inflows of TWW waters from the BS to the West Antarctic Peninsula slope are caused by wind forcing [31]. TWW and TBW waters are separated by two fronts: the Peninsula Front divides these waters at the sea surface and the Bransfield Front divides them in the deeper layers. The Bransfield Front is located much closer to the South Shetland islands than the Peninsula Front is.
The thermohaline structure of waters within the Bransfield Strait was repeatedly studied on the basis of in situ CTD data [15,24,32,33,34,35,36]. Deep layers of the BS basins are filled with relatively cold, saline, and dense waters from the continental shelf of the western Weddell Sea [32,33]. During the last few decades, the freshening and lightening of these waters have been observed [24,34,37]; their variability is caused by changes in source waters, and negatively correlated with Southern Annular Mode [38]. As the water density in the deep layers differs from one BS basin to another, one might expect that deep overflows can exist over the sills between the basins. However, there are no studies dedicated to direct measurements over the sill points between the WB and CB, and between the CB and EB. Regarding available data, the WOD2018 database contains 27 CTD profiles in the CB and 18 profiles in the EB, but there are no stations near the sill between these basins. The same lack of data is observed in the region of the sill between the WB and CB. LADCP data are even less available than CTD data. Regarding Shipboard ADCP measurements (for example, [27,30]), the maximal depth of such velocity profiles does not exceed 300–400 m, which is not sufficient for the studies of the bottom circulation between the deep basins of the BS. A recent work by [39] also showed that geostrophic velocity calculations based on hydrographic data do not reproduce actual ocean circulation patterns in the strait. This fact emphasizes the importance of direct velocity measurements in the BS. The objective of this paper is to study deep-water exchange between the basins of the BS based on the new data collected in January and February 2022. We used both CTD and LADCP profilers for the synchronous measurements of thermohaline and kinematic structures of currents.
The paper is structured as follows: we describe our in situ CTD and LADCP measurements in Section 2. In Section 3, we analyze the spatial thermohaline and kinematic structure of flows over the sill between the WB and CB (Section 3.1), and between the CB and EB (Section 3.2). The results are discussed in Section 4, followed by conclusions in Section 5.

2. Materials and Methods

This study is focused on the water exchange between the deep basins of the BS. For this purpose, we combined in situ measurements of temperature, salinity, and velocities performed during austral summer in January and February 2022. In this section, we describe our approach for station selection (Section 2.1), and the applied equipment and data processing techniques (Section 2.2).

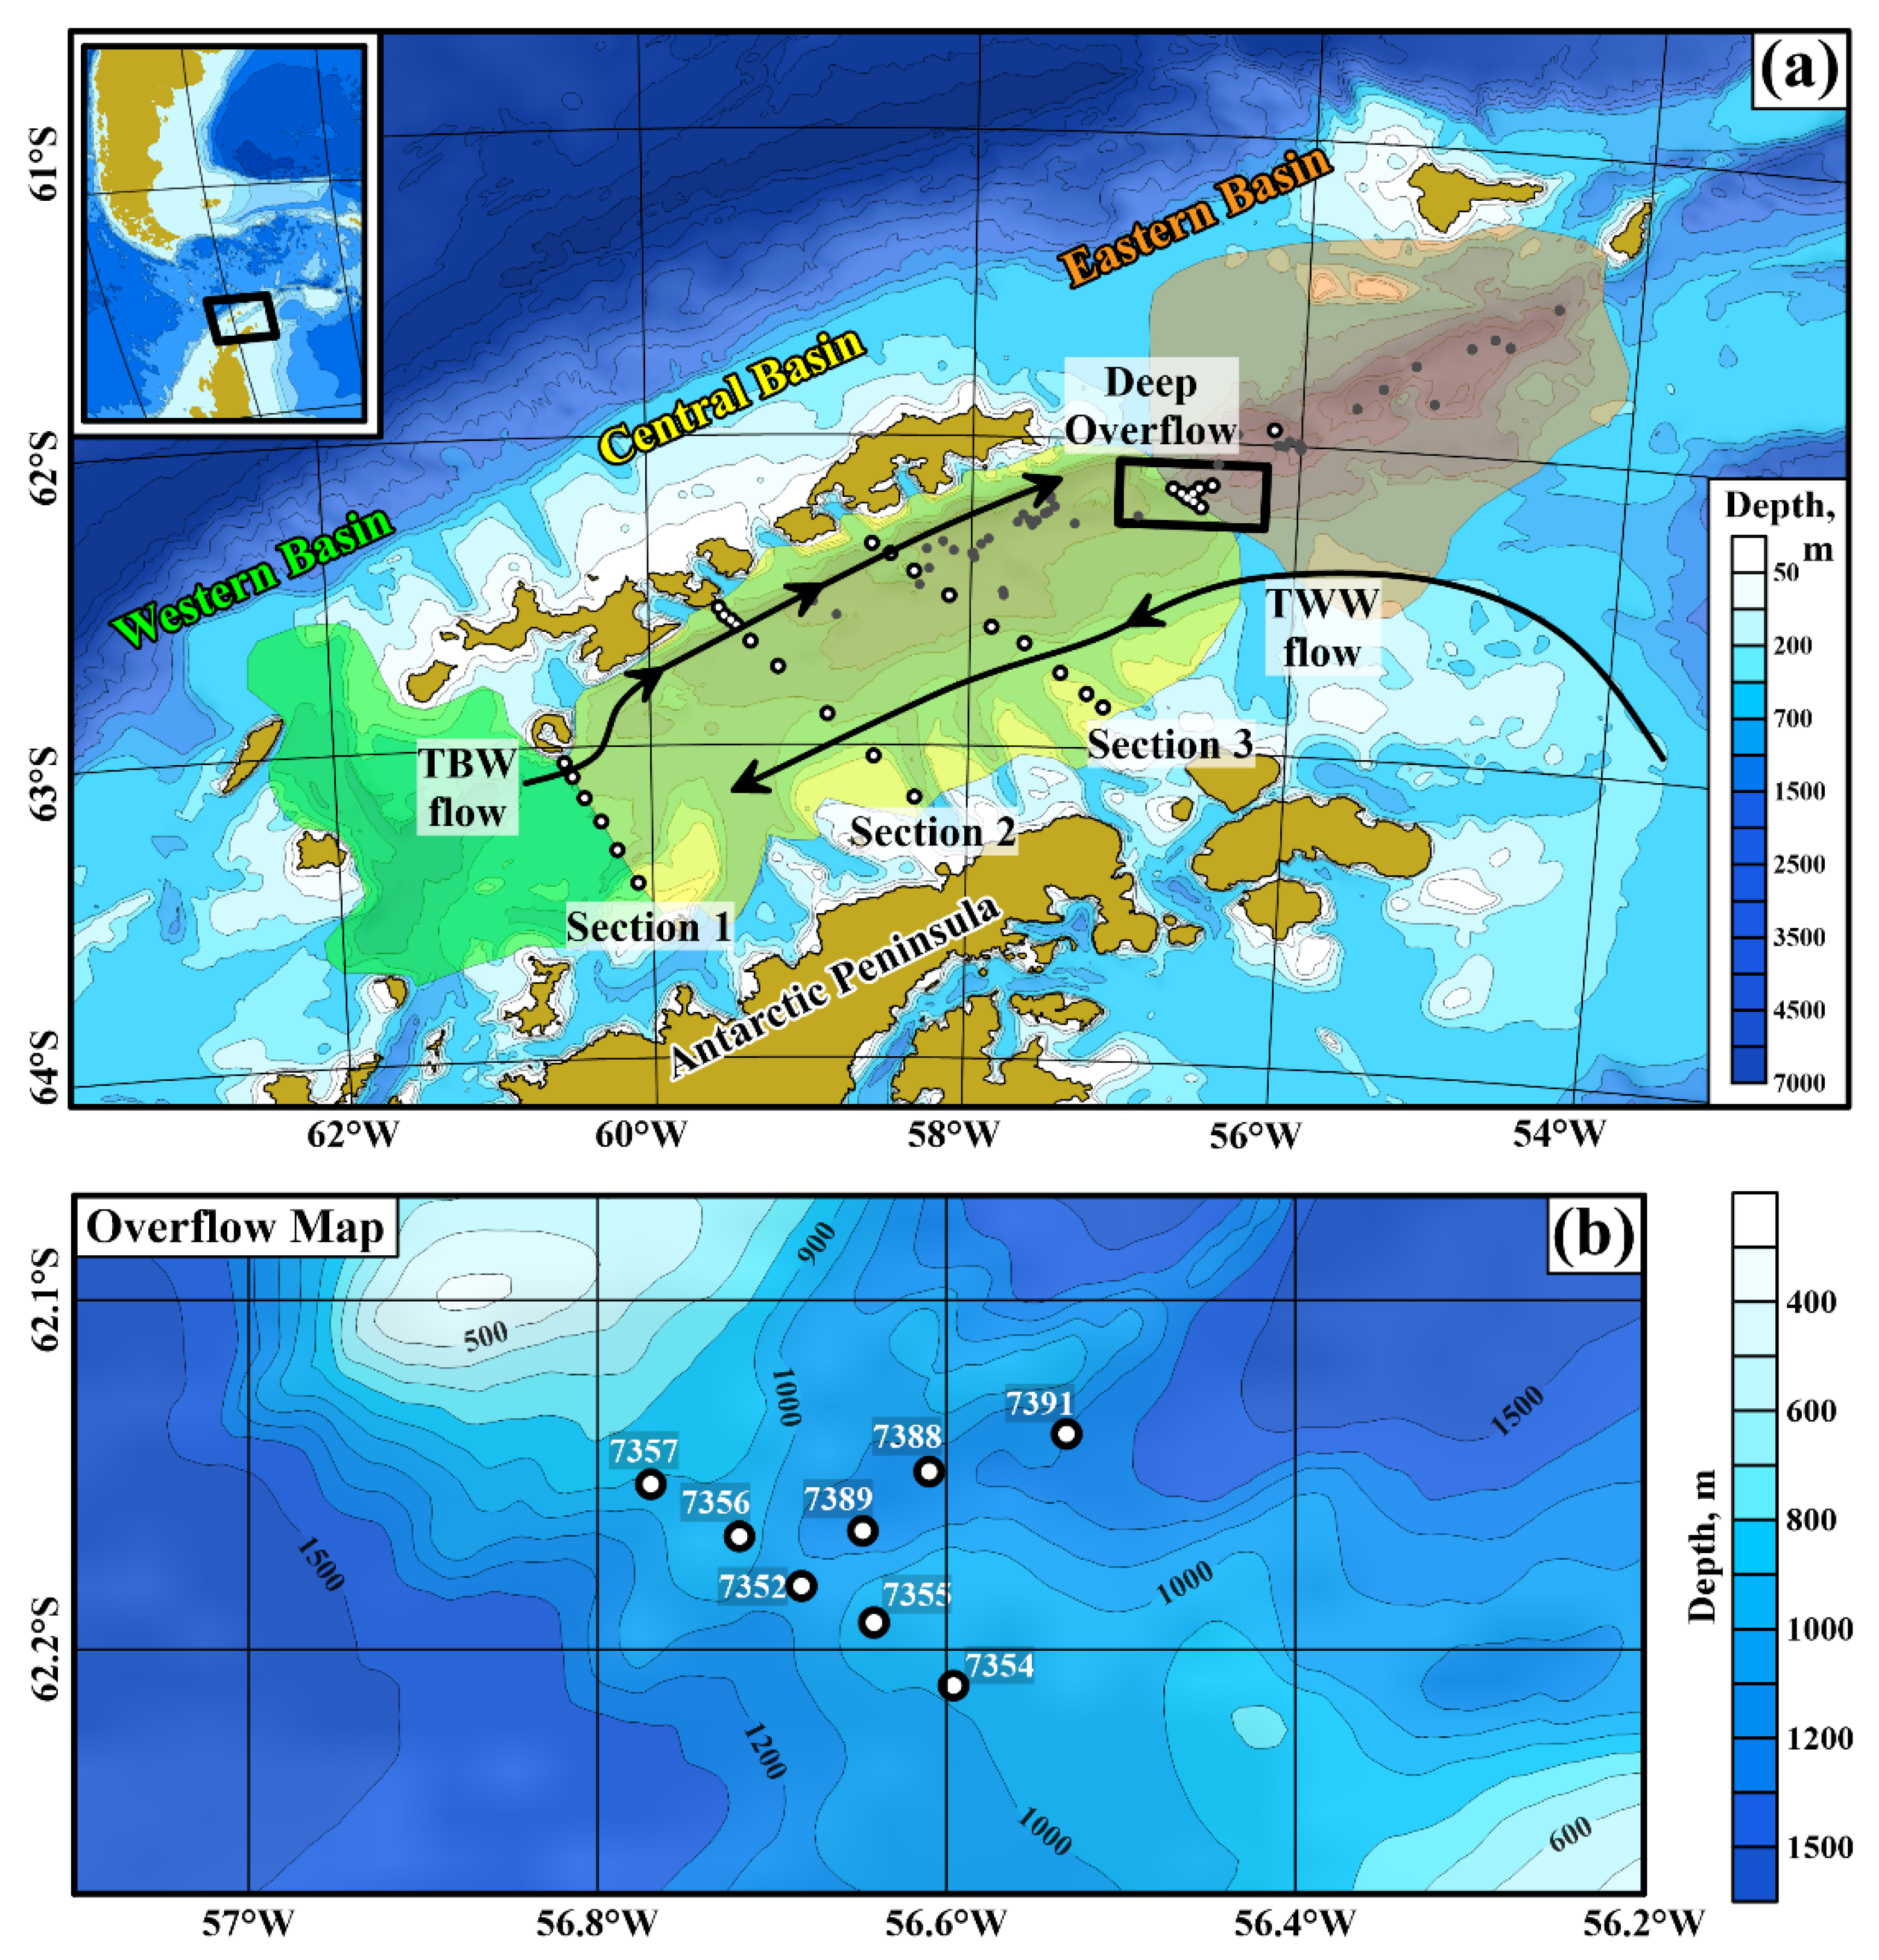
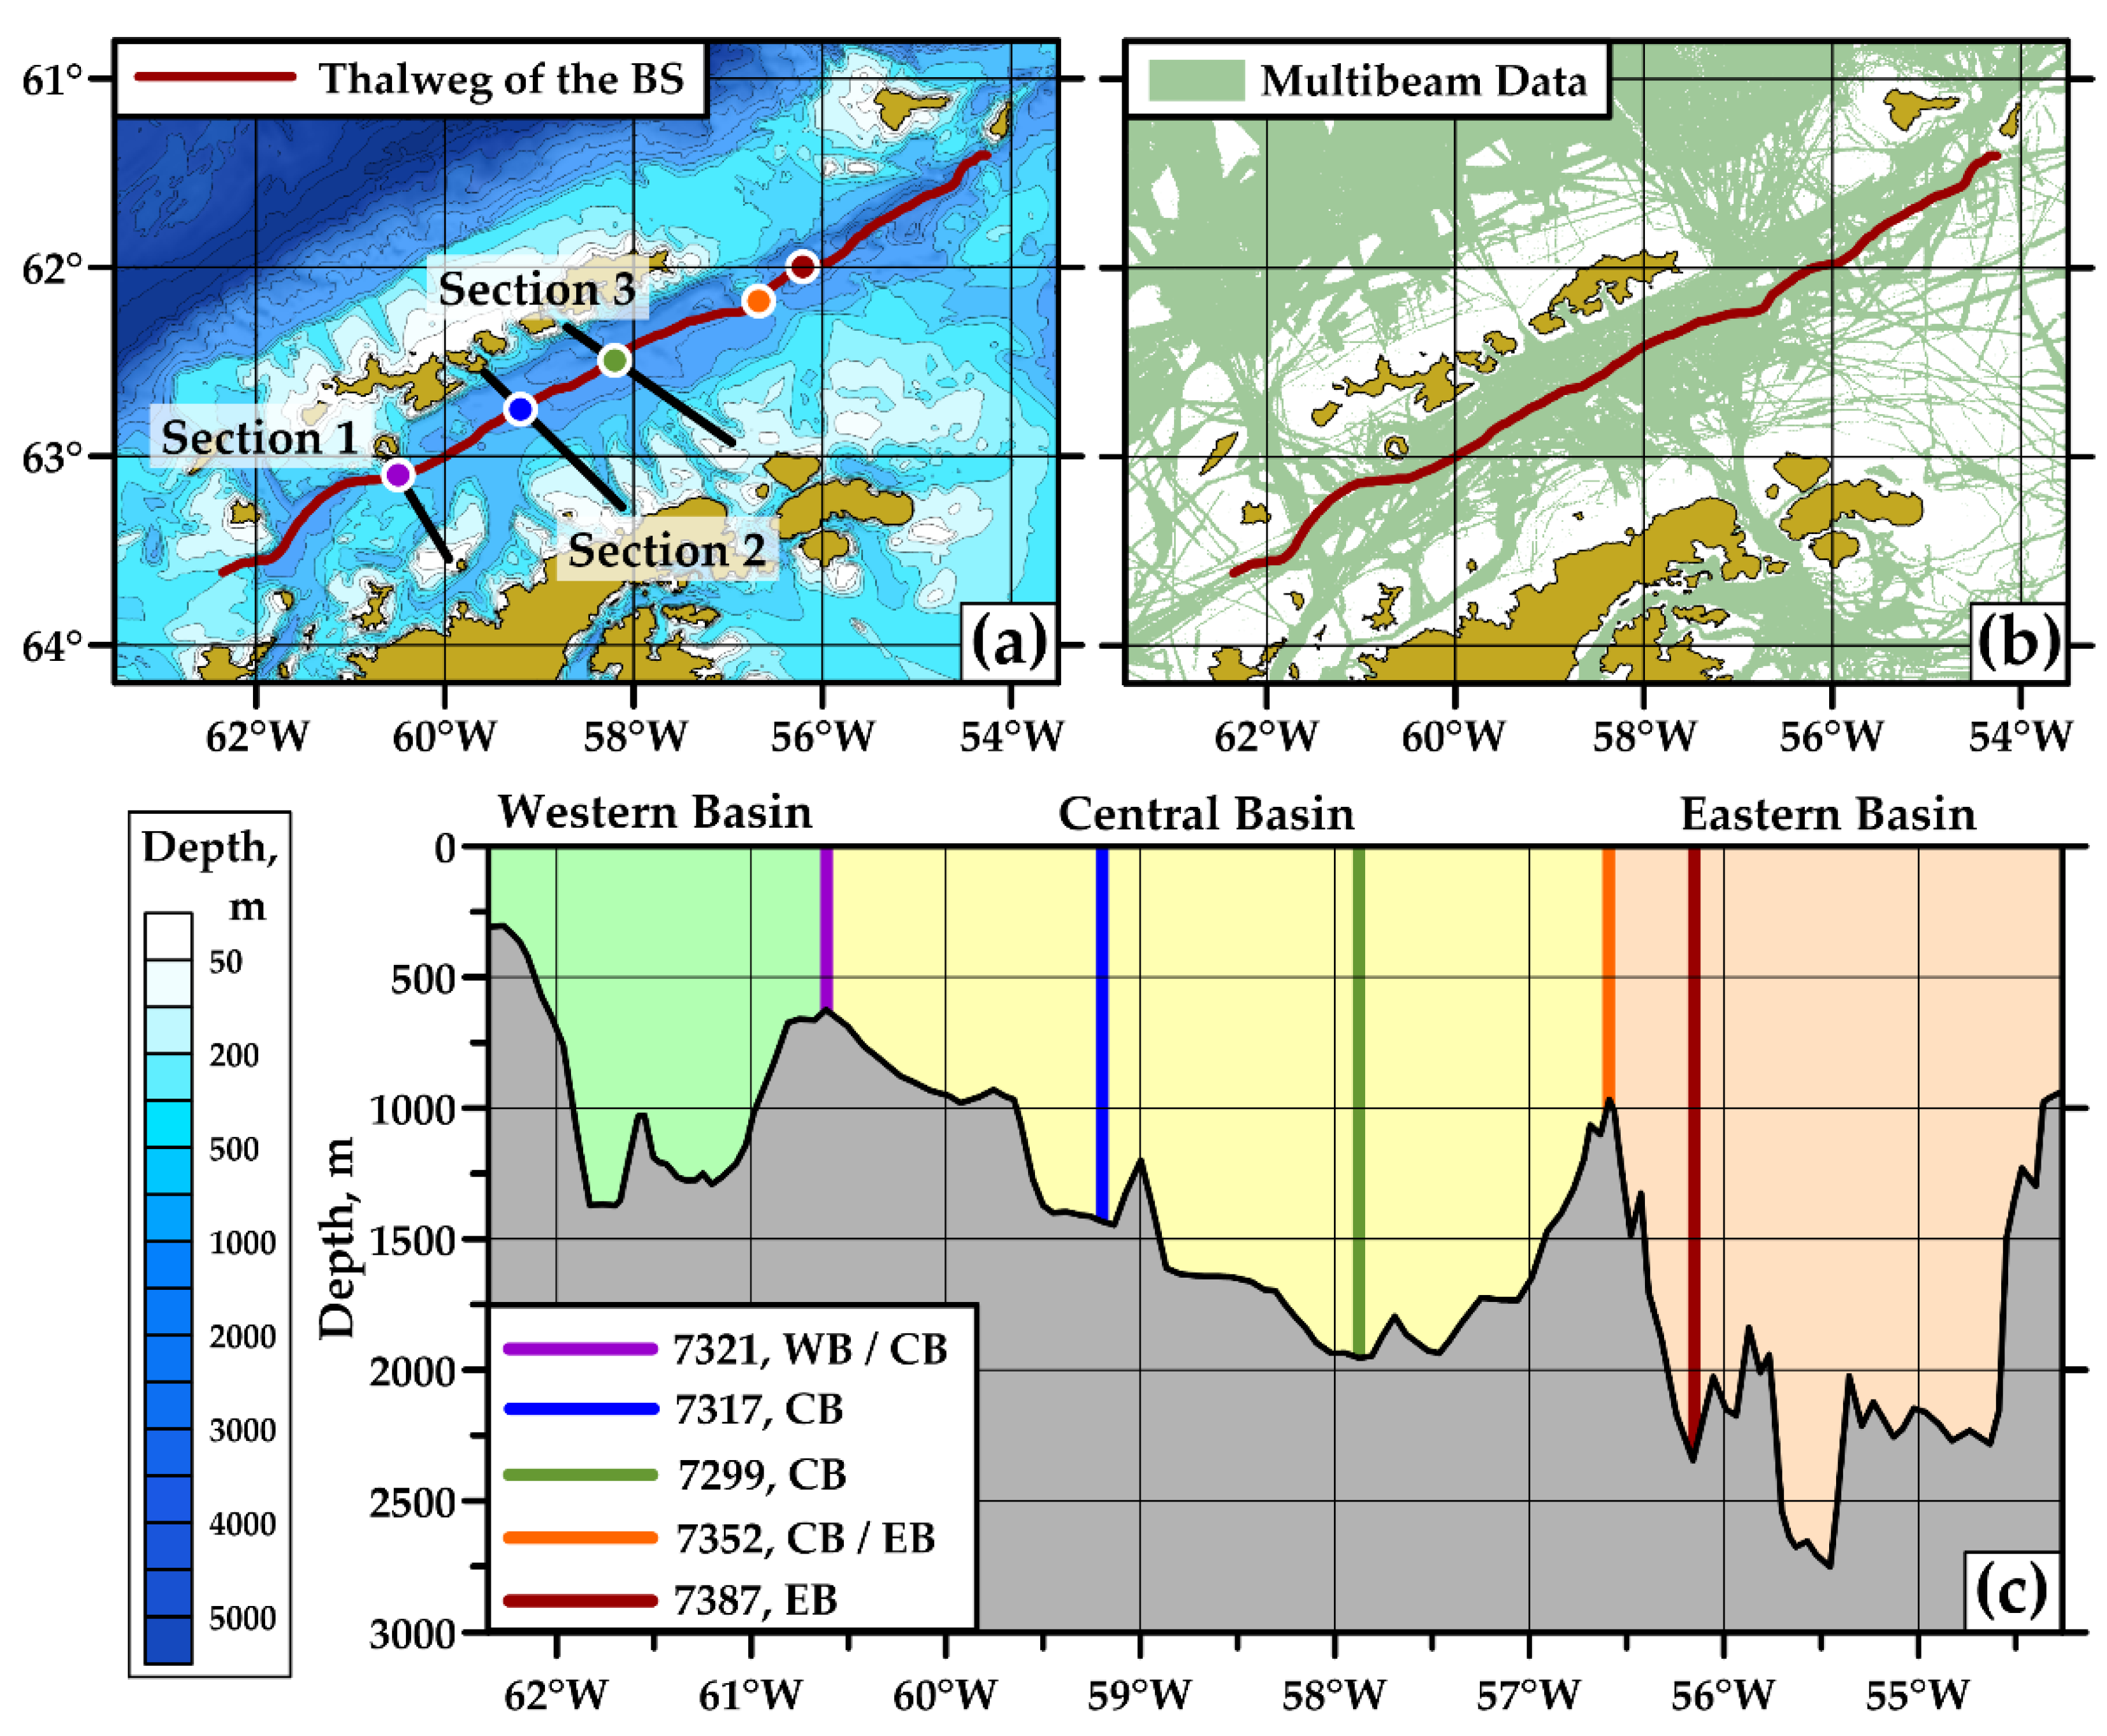
2.1. Sections across the Strait

A total of 34 stations were performed within the BS from 21 January to 14 February 2022 (Table 1) in the 87th cruise of the research vessel Akademik Mstislav Keldysh. The measurements were performed almost at the bottom from the ship that maintained its position at the station with accuracy not worse than 200 m. The stations were organized in three sections, up to nine stations each across the strait (Figure 1); two relatively short but high-resolution sections were located at the sill point between the central and east basins. The GEBCO2021 bathymetry grid of 15″ resolution was used for the selection of the stations. The major part of the BS region has been covered by multibeam echosounder surveys. Their locations are shown with green in the right upper panel of Figure 2 based on the data from GEBCO2021 Type Identifier (TID) grid. Three BS basins are clearly seen along the thalweg of the strait (Figure 2). The first section was located over the ridge between the WB and CB; the second and third sections were located in the CB, allowing for us to trace how water properties change along the strait. Two additional sections were located across and along the sill between the CB and EB. These sections were performed with very high resolution (the distance between stations here was approximately 2 km), which allowed us to study deep overflow between the CB and EB. Because the GEBCO2021 grid contains multibeam echosounder data for the entire strait, the depths of our stations and own single-beam measurements using Kongsberg EA600 echosounder coincided very well with the GEBCO bathymetry.

2.2. In Situ Measurements and Data Processing

The stations were performed using the lowered acoustic Doppler current (LADCP) and conductivity, temperature, depth (CTD) profilers mounted on a General Oceanics GO1018 rosette water sampler. The CTD measurements were performed along all three sections; the LADCP data are available only for Sections 1 and 2 due to technical reasons. Exact information about the type of measurements at each station is presented in Table 1. The water sampler was equipped with a Valeport VA500 altimeter allowing for measurements close to the ocean bottom (3–7 m above the seafloor; see Table 1 for more details). An Idronaut Ocean Seven 320plus CTD probe was used for the measurements together with an MKplus Deck Unit. CTD data were collected using standard package REDAS5 version 5.78. The declared accuracy of CTD measurements is 0.001 °C for temperature, and 0.001 mS/cm for conductivity sensors. The CTD data from the World Ocean Database (WOD2018) were used for addressing potential temperature and salinity variations in the bottom layer of the CB and EB. This database contains 27 CTD profiles in the CB, and 18 profiles in the EB carried out in different years and seasons (only profiles deeper than 1500 m were taken into account). Most stations were performed during the austral summer season. Thus, 18 stations of 27 in the CB, and 14 stations of 18 in the EB were occupied from November to February. The observation period covered the 1980s and 1990s; three stations in the EB were performed in 1975–1976. The LADCP data measured with a TRDI WorkHorse Monitor 300 kHz profiler were processed using programming package LDEO Software version IX.10 [40]. Data from the shipborne acoustic doppler current profiler (SADCP) TRDI Ocean Surveyor 75 kHz were used for more reliable data processing in the upper ocean layer. The accuracy of velocity measurements estimated by the processing program is usually 3–4 cm/s. In the bottom layers, due to the bottom track signals, the errors decreased to 1–2 cm/s. The results of LADCP processing were corrected by subtracting the tidal velocities. The barotropic tide was calculated on the basis of the TPXO 9.1 global inverse tide model [41].

3. Results

We analyzed the spatial kinematic and thermohaline structures of the currents within the BS at several transects across the strait; their locations are presented in Figure 1 and Table 1. The observations included CTD and LADCP stations from the surface to the bottom. The results of these measurements are discussed separately for the western (Section 1) and eastern (Section 2) margins of the CB.

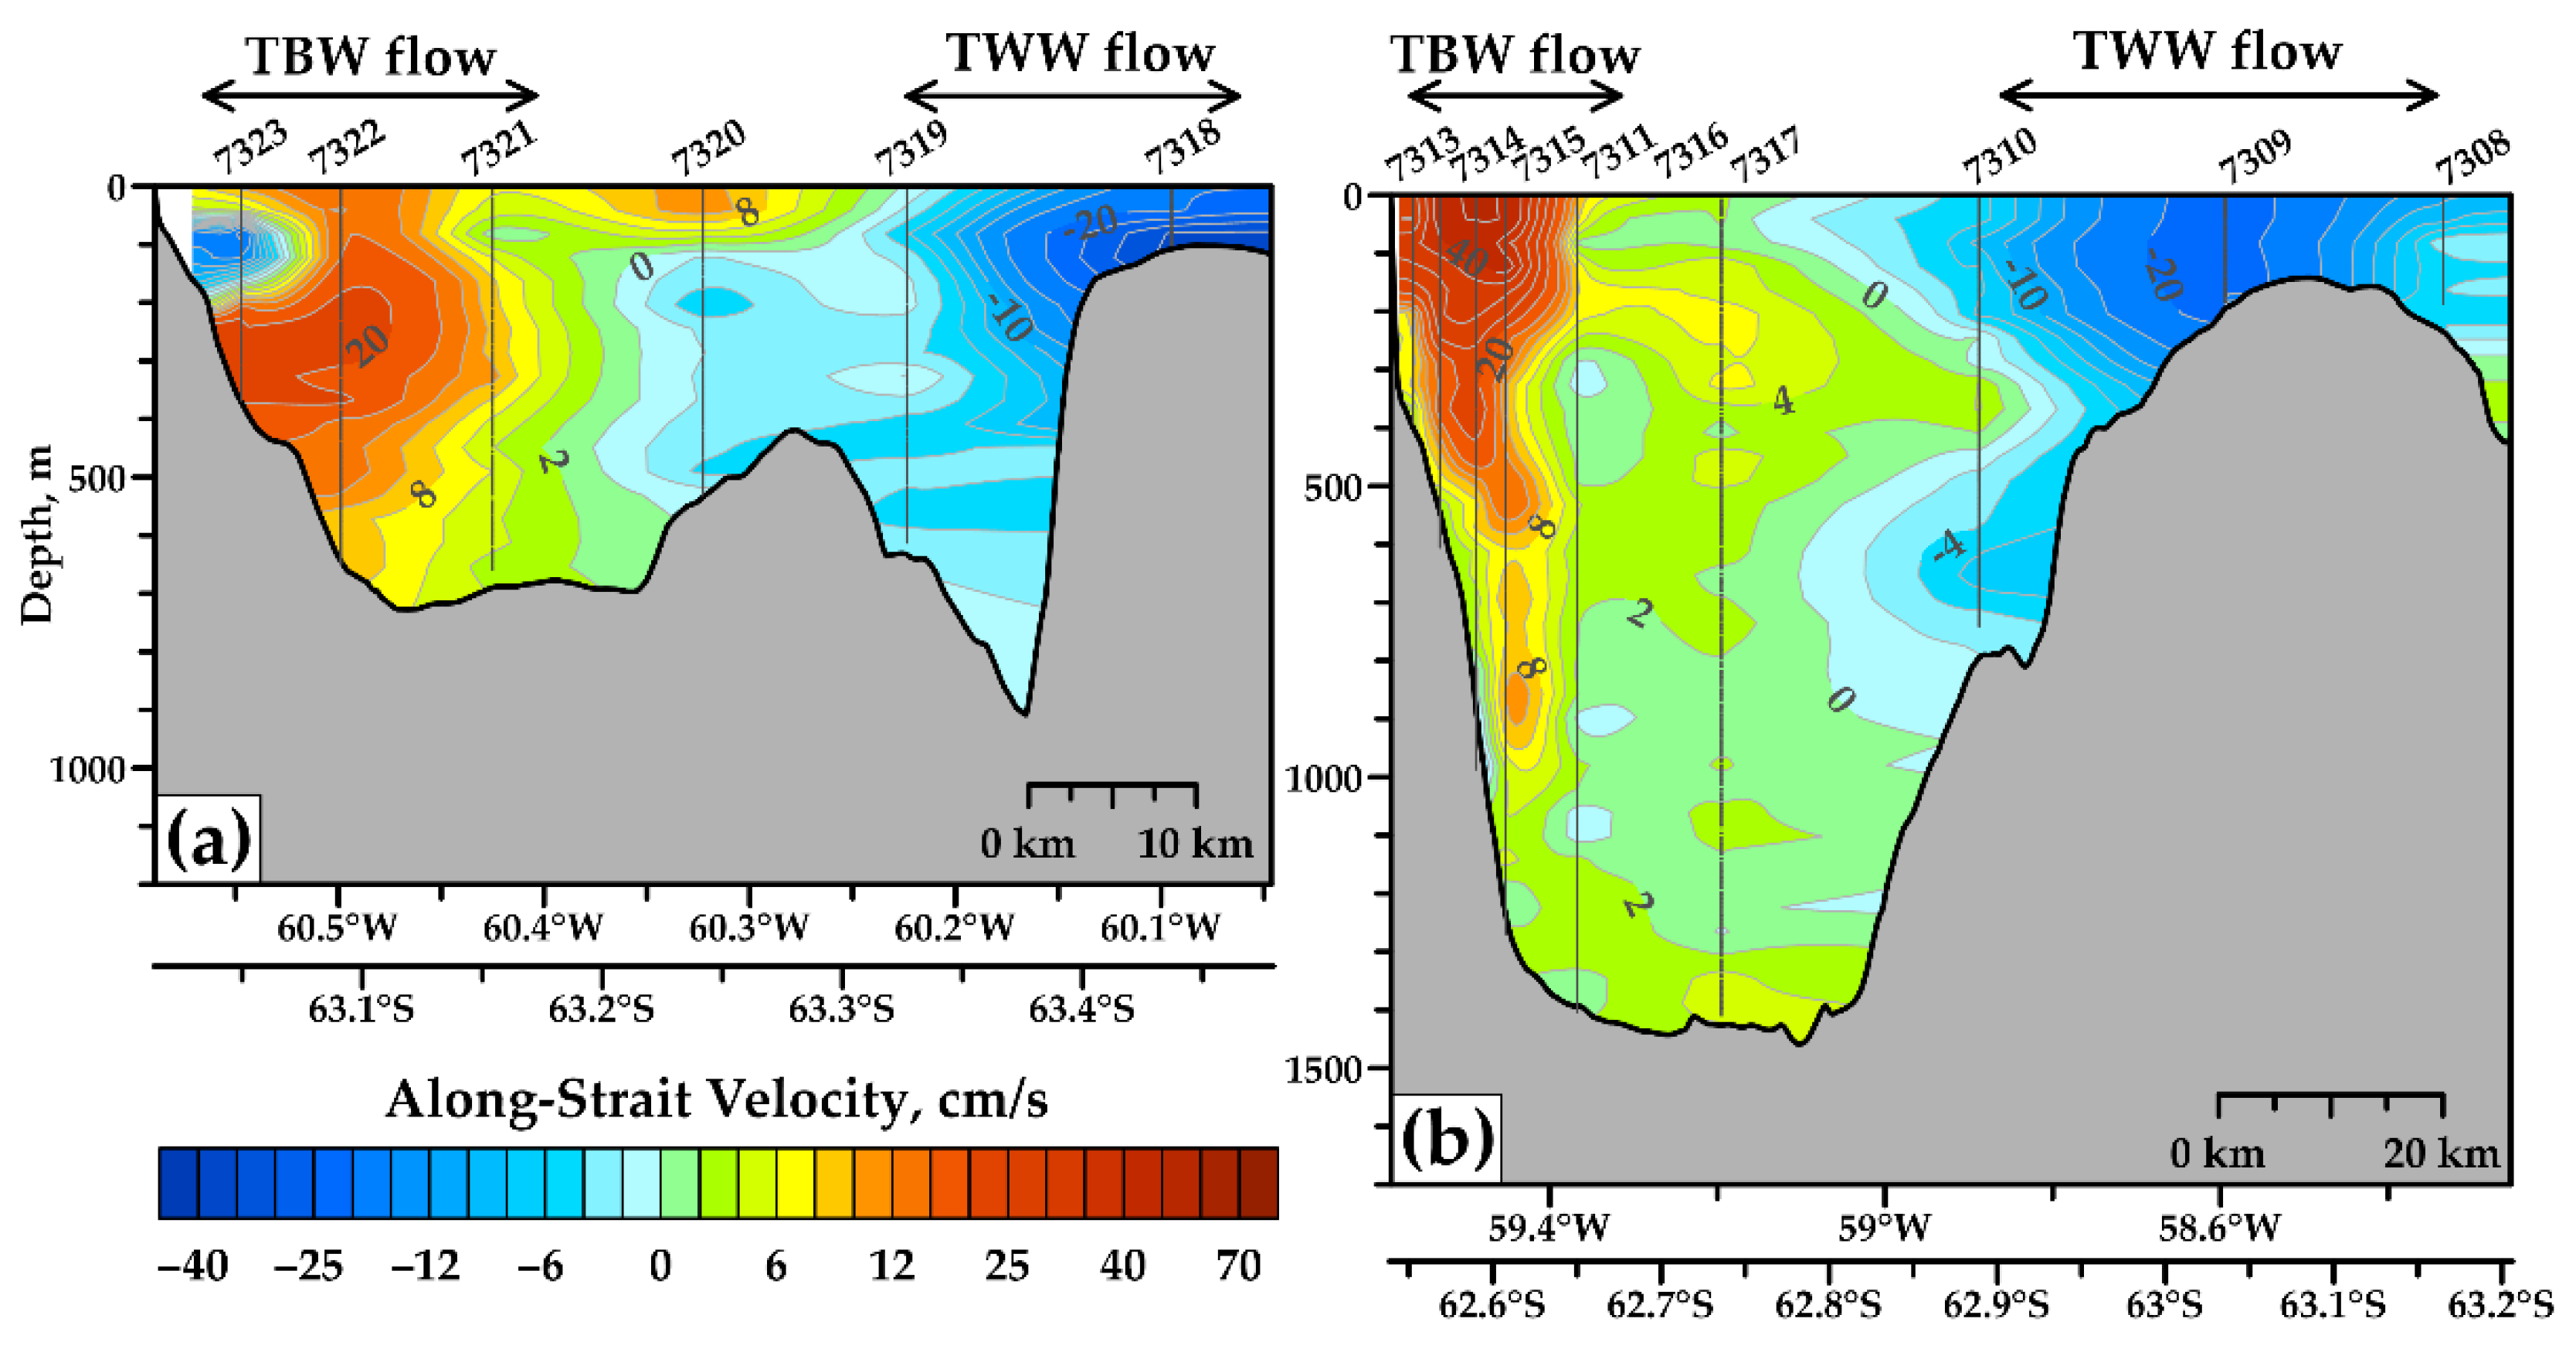
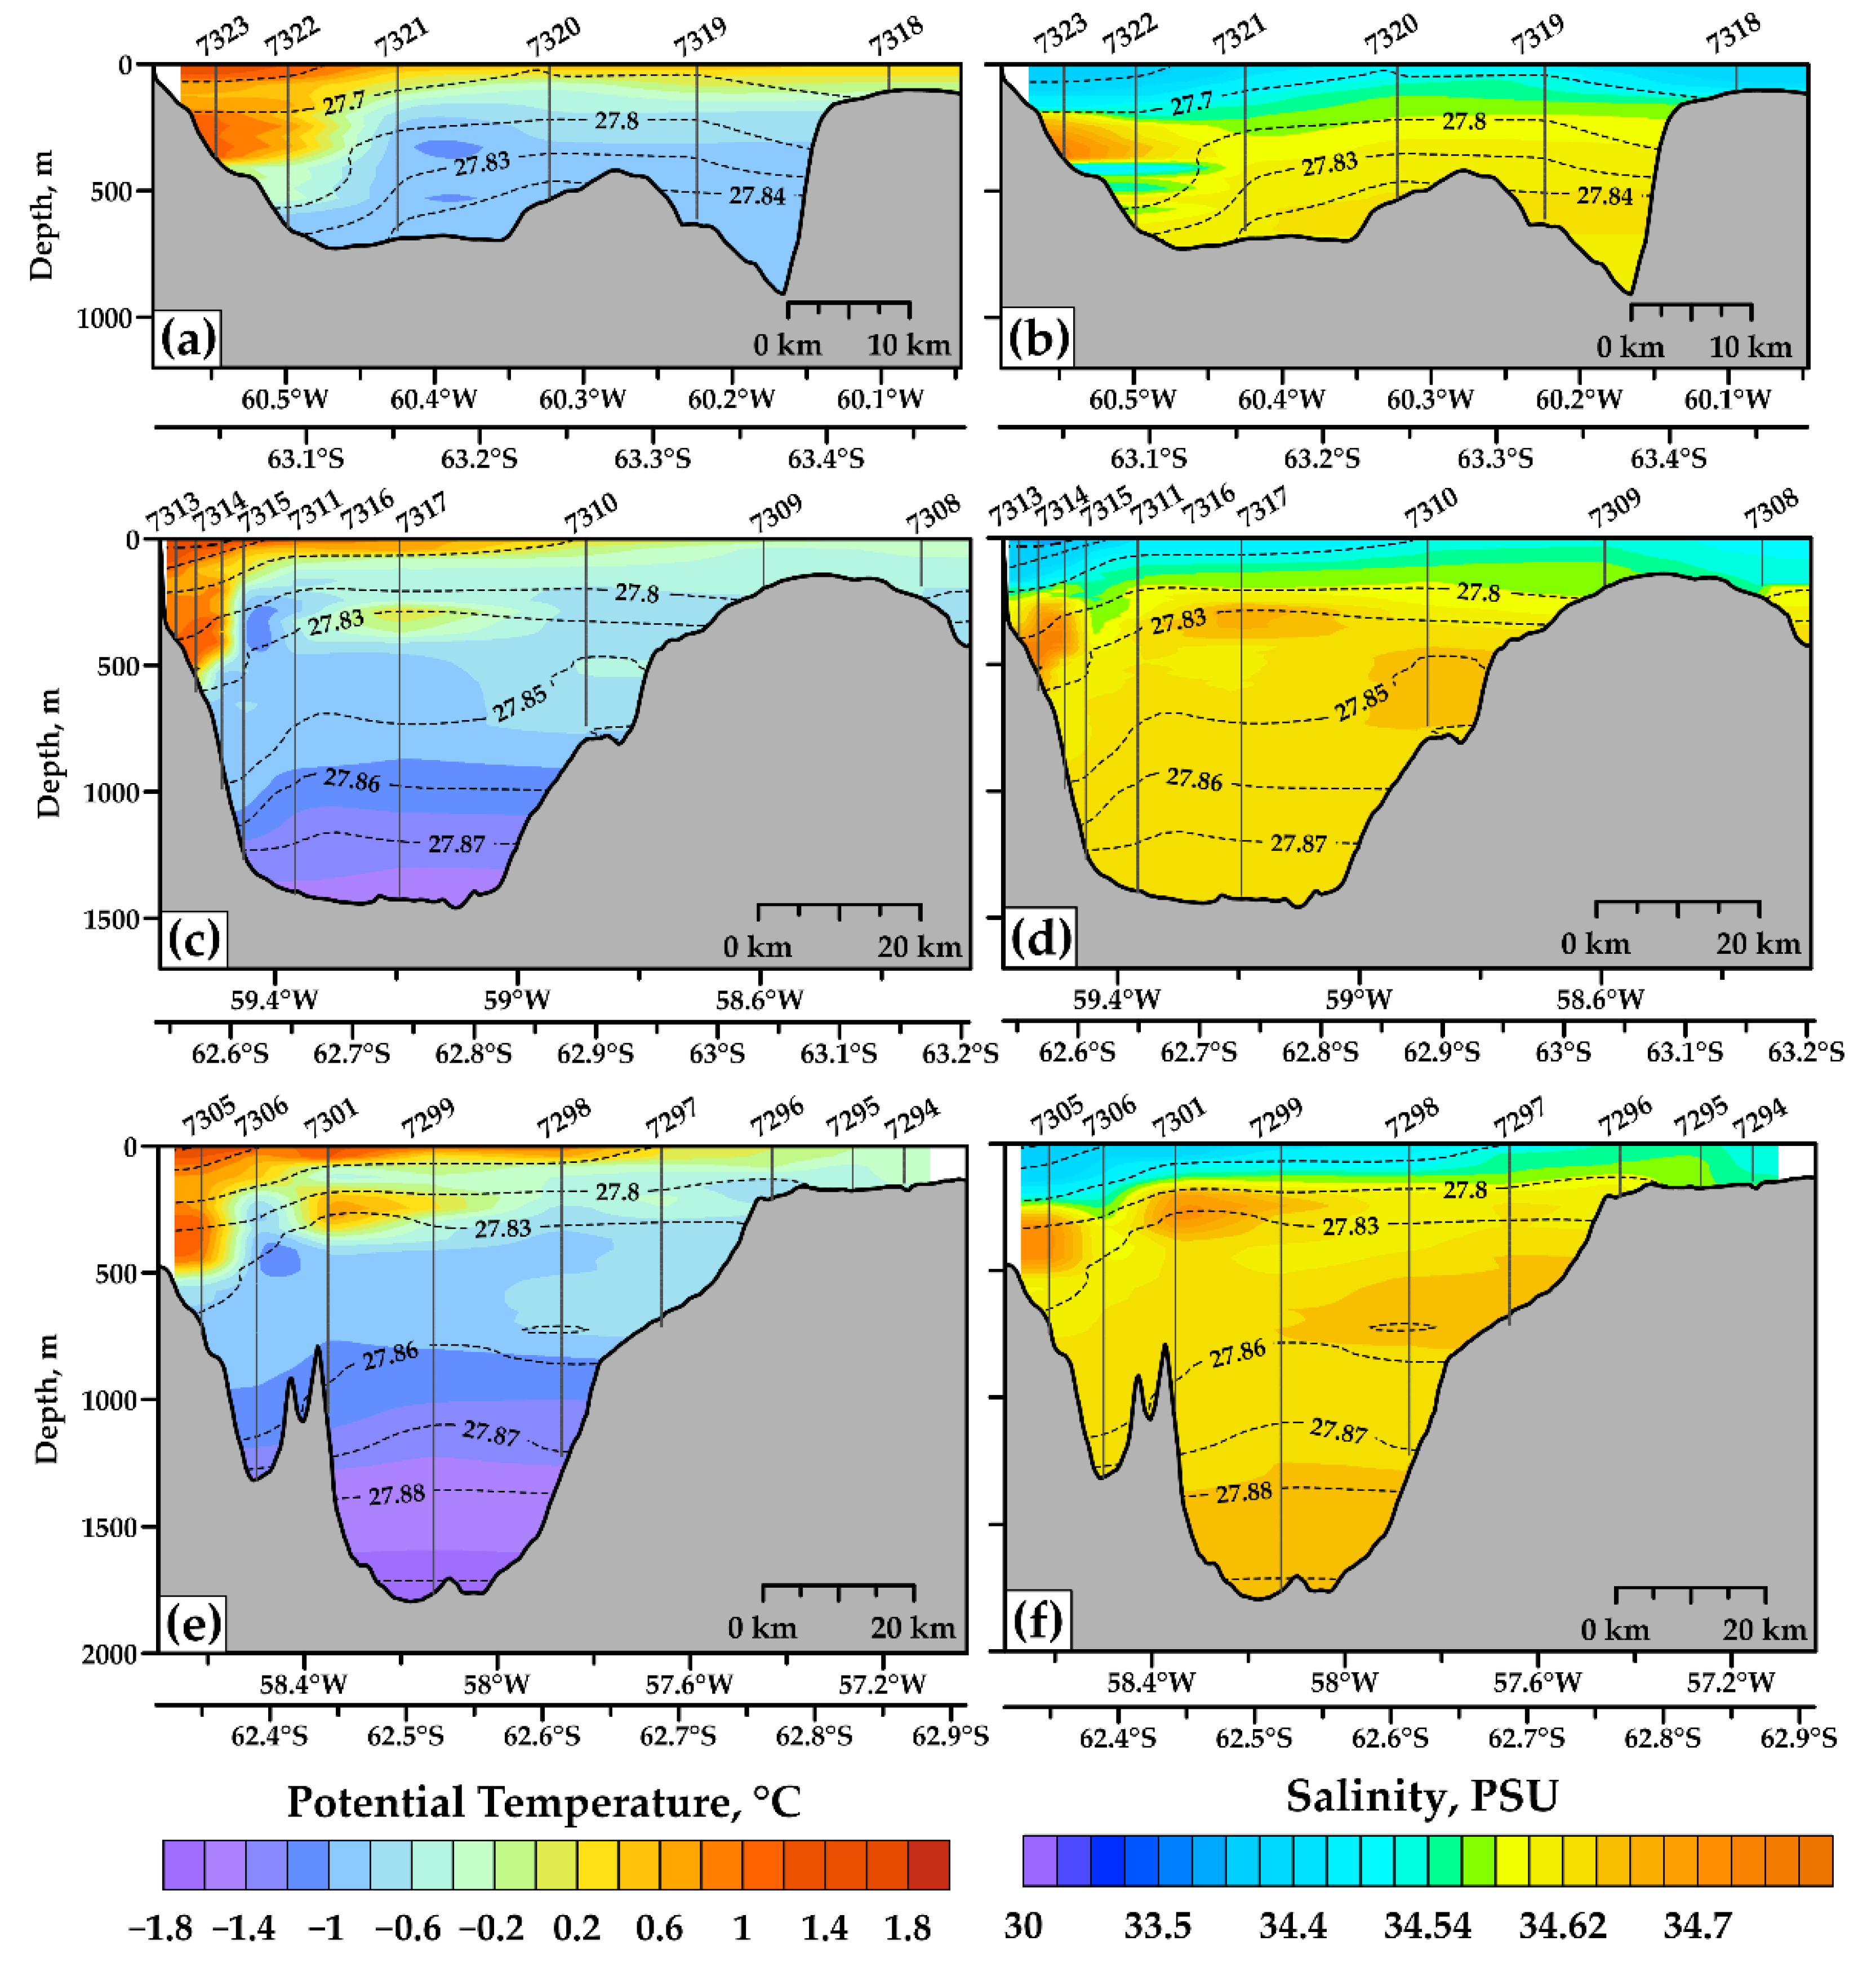
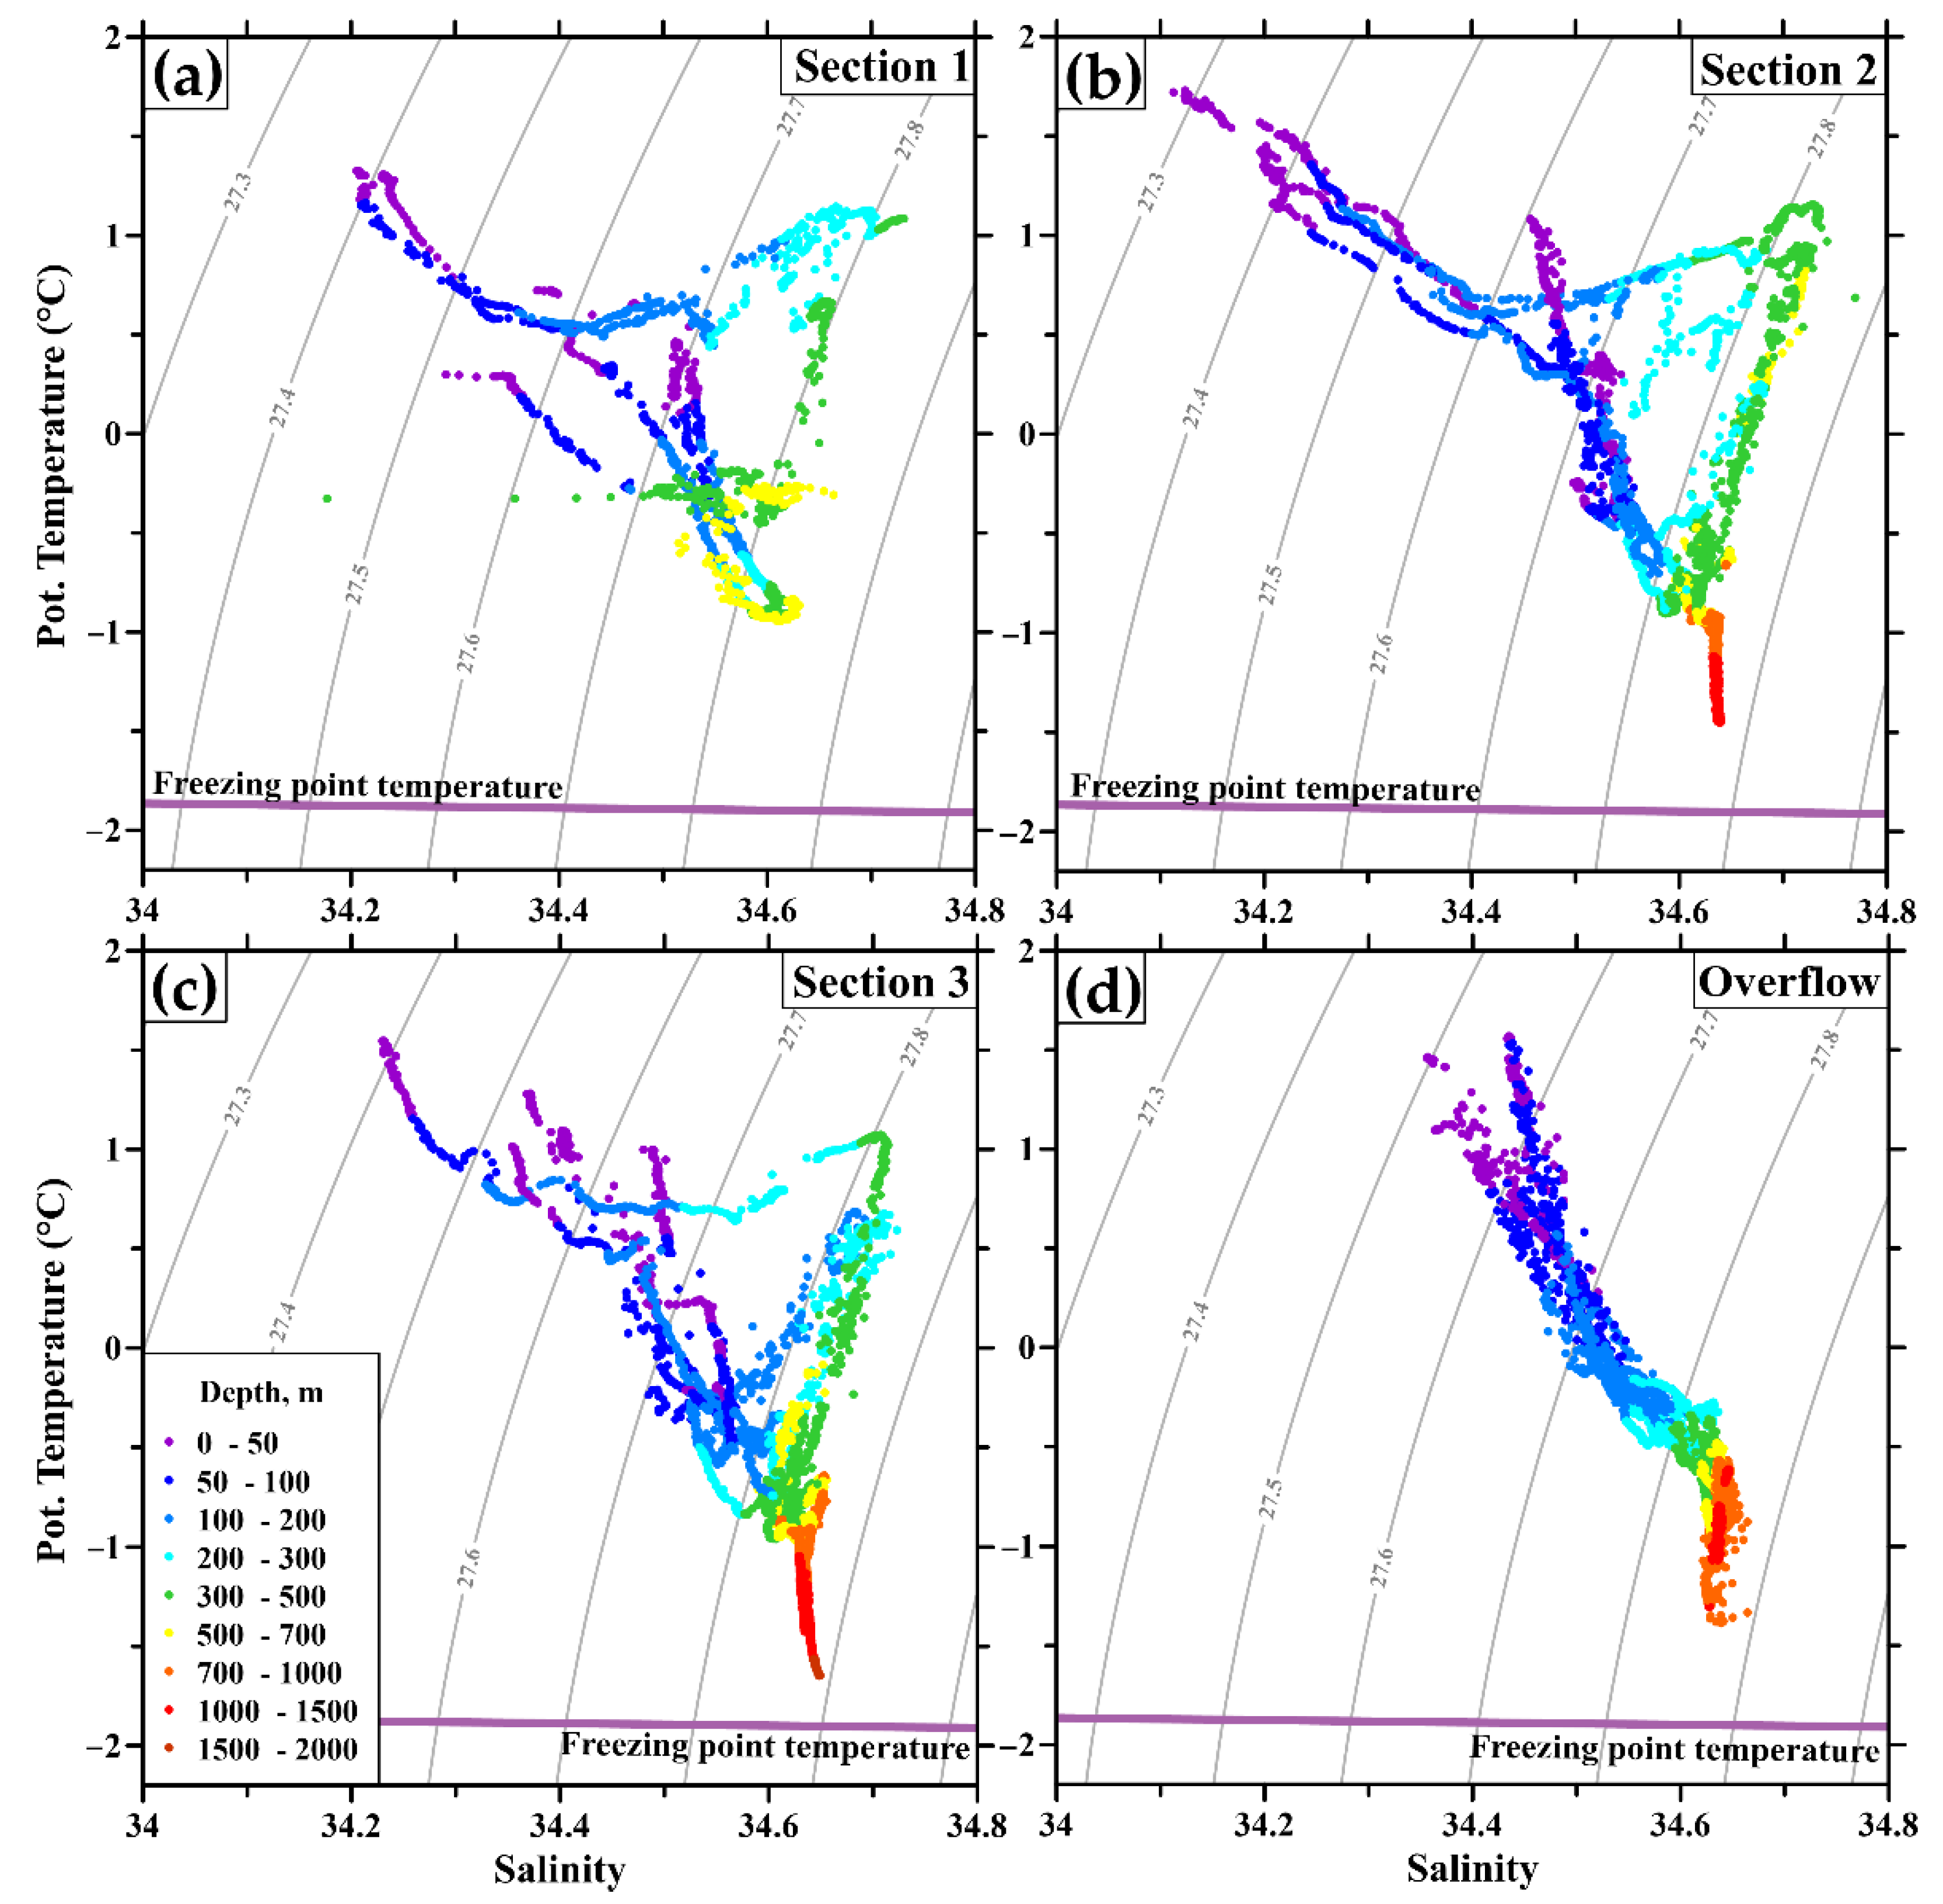
3.1. Water Exchange between Western and Central Basins

The results of our measurements along three sections in the western part of the CB are shown separately on the basis of LADCP (Figure 3) and CTD (Figure 4) data. Previously, such measurements were performed in the CB, and allowed for investigations of the spatial structure of currents [26,27,30,35] and thermohaline properties of waters within the strait [16,23,37,42,43]. Some of these studies were focused on a single transect in different parts of the strait [25,26,35,39]. However, there are no studies focused on the sills between deep basins or where the structure of the TBW and TWW flows were analyzed on the basis of several quasisimultaneous crossings of the strait with synchronous CTD and LADCP measurements. Velocity data were projected to the direction along the strait (true direction is 60°). CTD data are available for all three sections; LADCP measurements were performed only at two western sections (Sections 1 and 2; see Figure 2 for their location). Two major circulation patterns were clearly observed at both sections: the fast and narrow Bransfield Current is located in the northwestern part of the strait, while the flow of waters from the Weddell Sea is observed along the Antarctic Peninsula. The main result is that TWW flow was observed at Section 1, the westernmost. It was previously suggested that TWW flow recirculates within the BS and does not propagate as far to the west through the entire strait [27,42]. The velocities of this flow do not decrease along the TWW path: the maximal velocities are 23 cm/s at Section 2 and 36 cm/s at Section 1. On the other hand, the Bransfield Current that transports TBW waters significantly changes between these sections. The maximal velocities changed from 24 cm/s at Section 1 to 52 cm/s at Section 2. The maximum was located at a 260 m depth at Section 1; at Section 2, the maximal velocities were observed at the sea surface. The total volume transports of TBW waters based on LADCP measurements were 1.19 Sv (Section 1) and 2.54 Sv (Section 2). The corresponding values of TWW transports were 0.77 Sv and 1.82 Sv. No significant currents were observed in the bottom layer of the sill between the WB and CB; the conditions in the bottom layer over the sill between CB and EB were significantly different and are discussed below in more detail.
The CTD data are available for all three sections across the CB of the strait (Figure 4). Potential temperature and salinity distributions showed quite similar structures; at all sections, TBW and TWW flows were clearly distinguished on the basis of different thermohaline properties. The warmest waters were observed within the Bransfield Current; the maximal water temperature changed along the strait from 1.27 °C (Section 1) to 1.56 °C (Section 2) and 1.52 °C (Section 3); the corresponding variations of the minimal salinity were 34.22, 34.14, and 34.24 PSU. At depths of 200–450 m, a core of mCDW waters was observed at all sections; their properties changed along the strait from 1.08 to 1.13 and 1.08 °C, and 34.73 to 34.73 and 34.71 psu. The minimal potential temperature in the upper 200 m was observed near the Antarctic Peninsula within the TWW flow. Along this flow, thermohaline properties changed from −0.73 °C and 34.60 psu (Section 3) to −0.62 °C and 34.57 psu (Section 2), and −0.66 °C and 34.58 psu (Section 1). The minimal potential temperature in the CB, −1.65 °C, was observed at the deepest point of the strait at station 7299; the minimal potential temperature over the watershed between the WB and CB was −0.95 °C (station 7321), confirming the well-known fact that the bottom waters of the CB originated directly from the waters of the Weddell Sea.

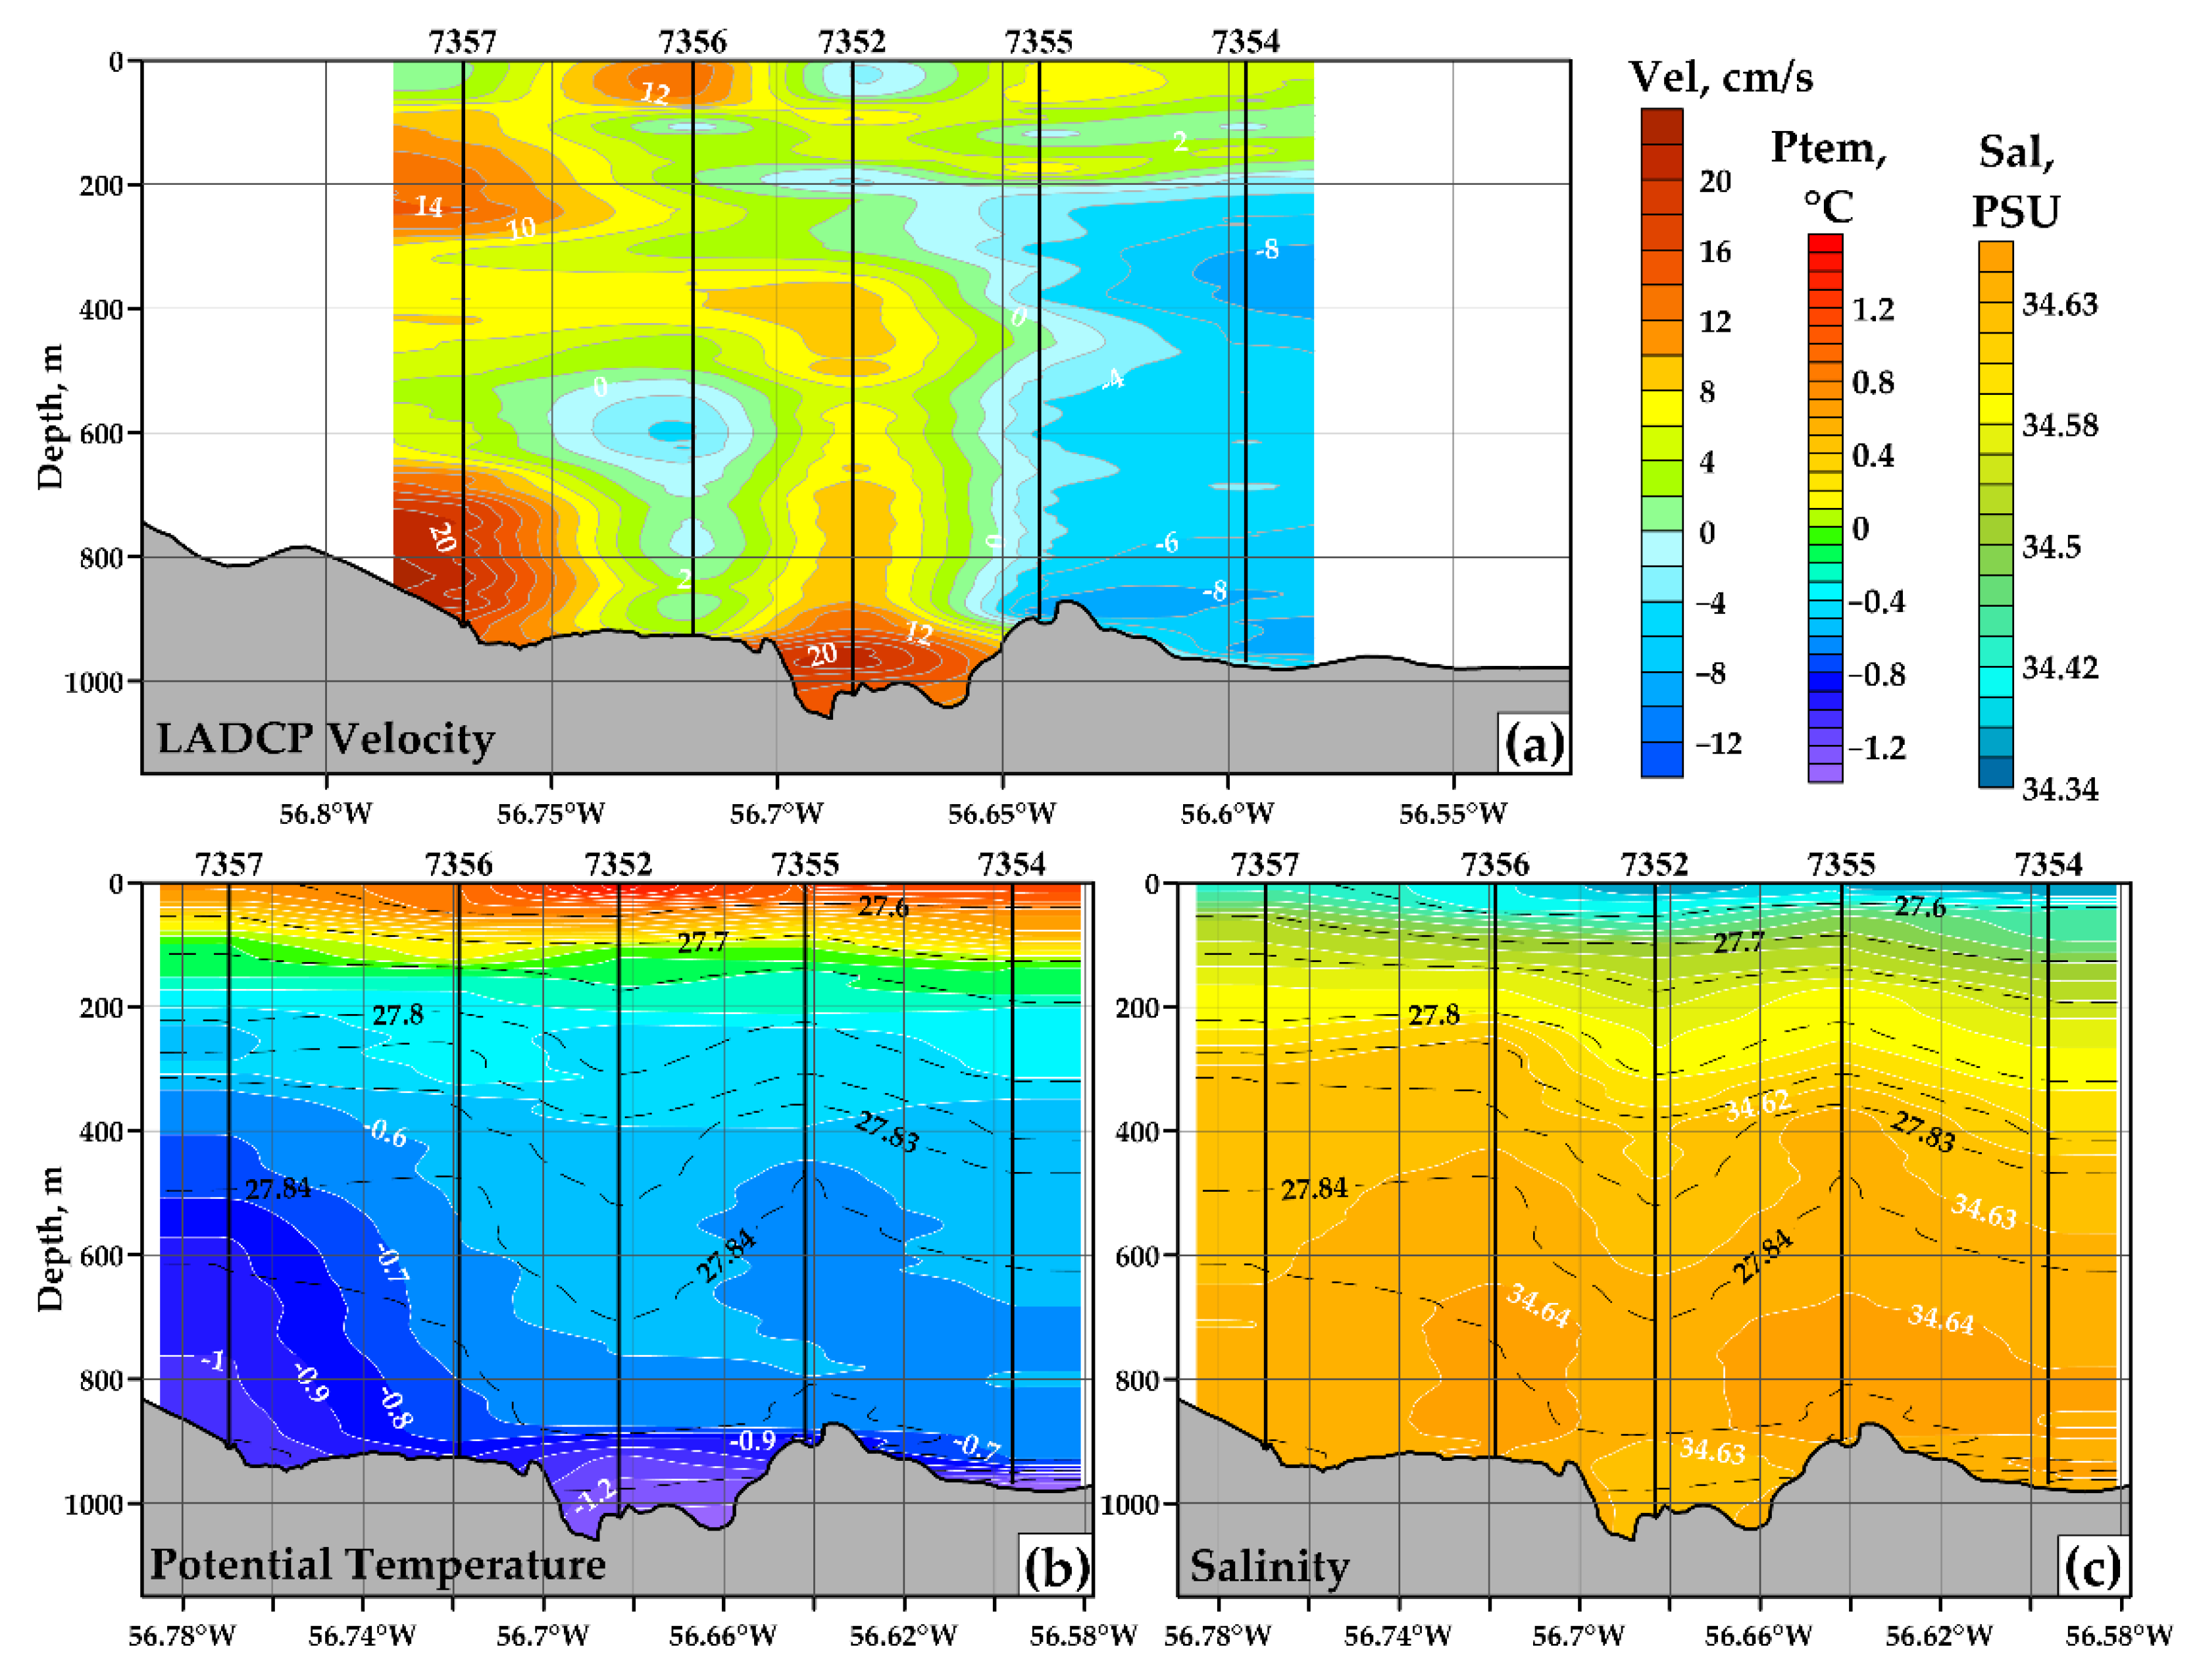
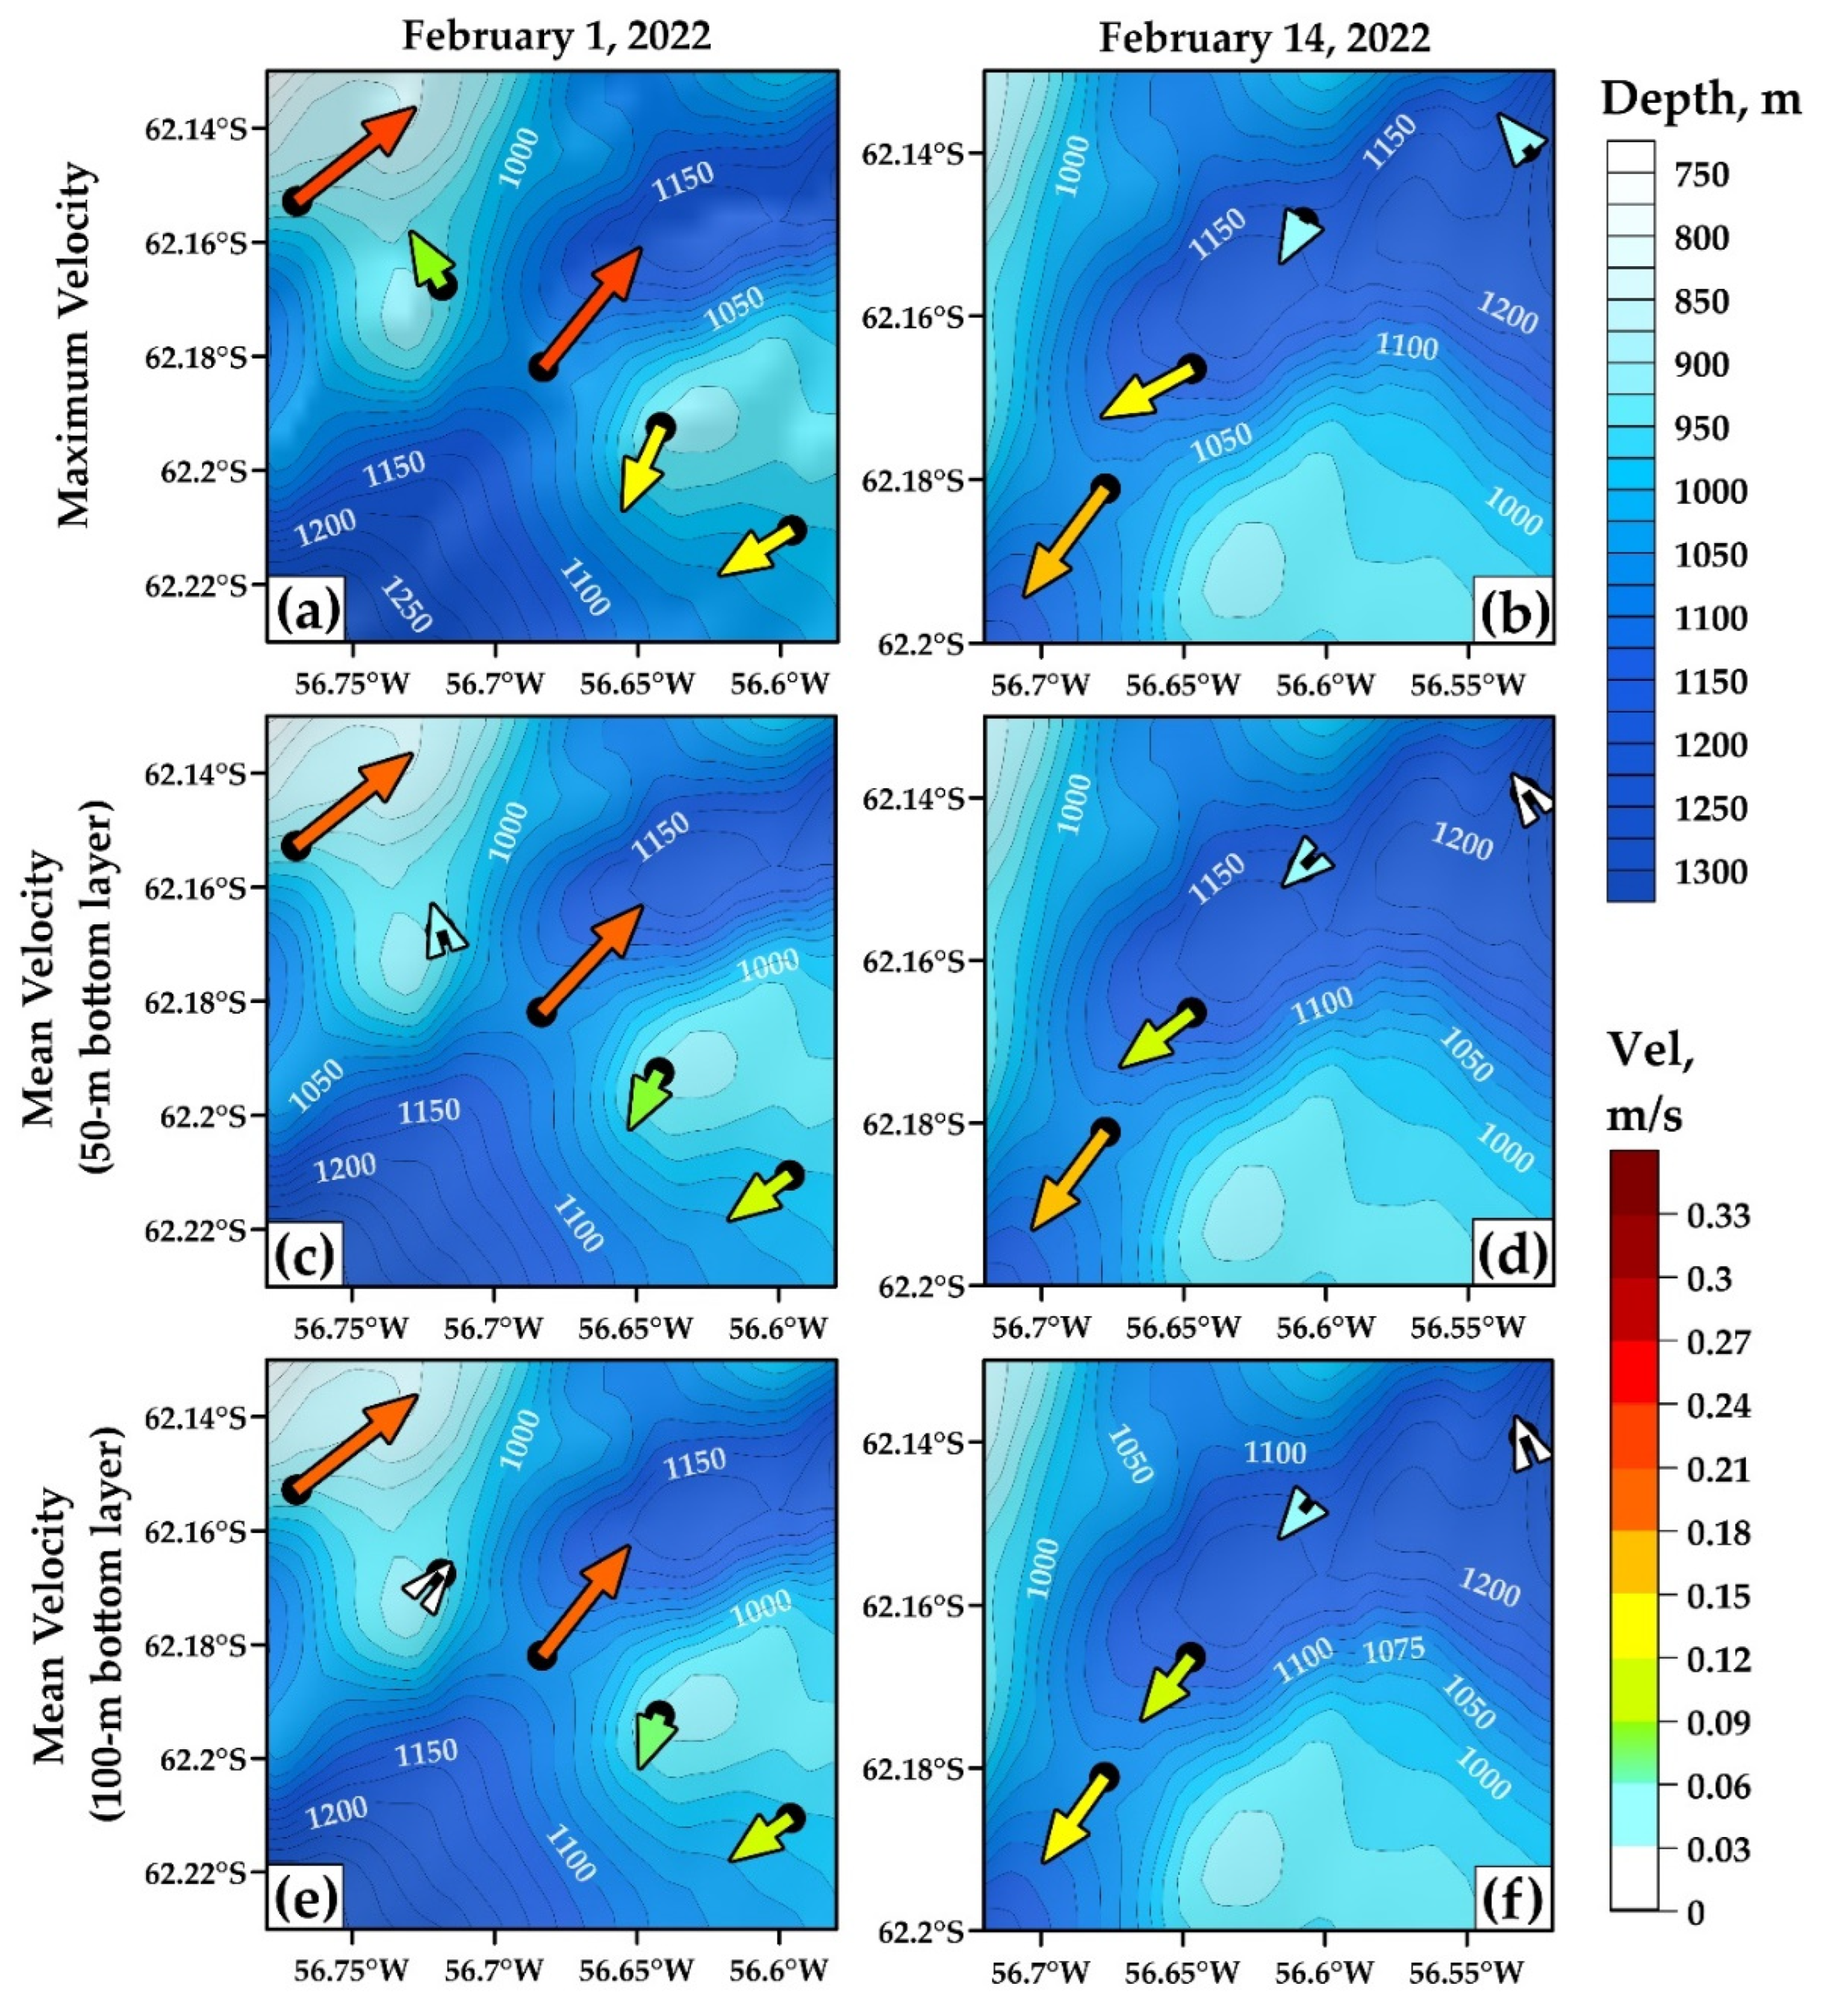
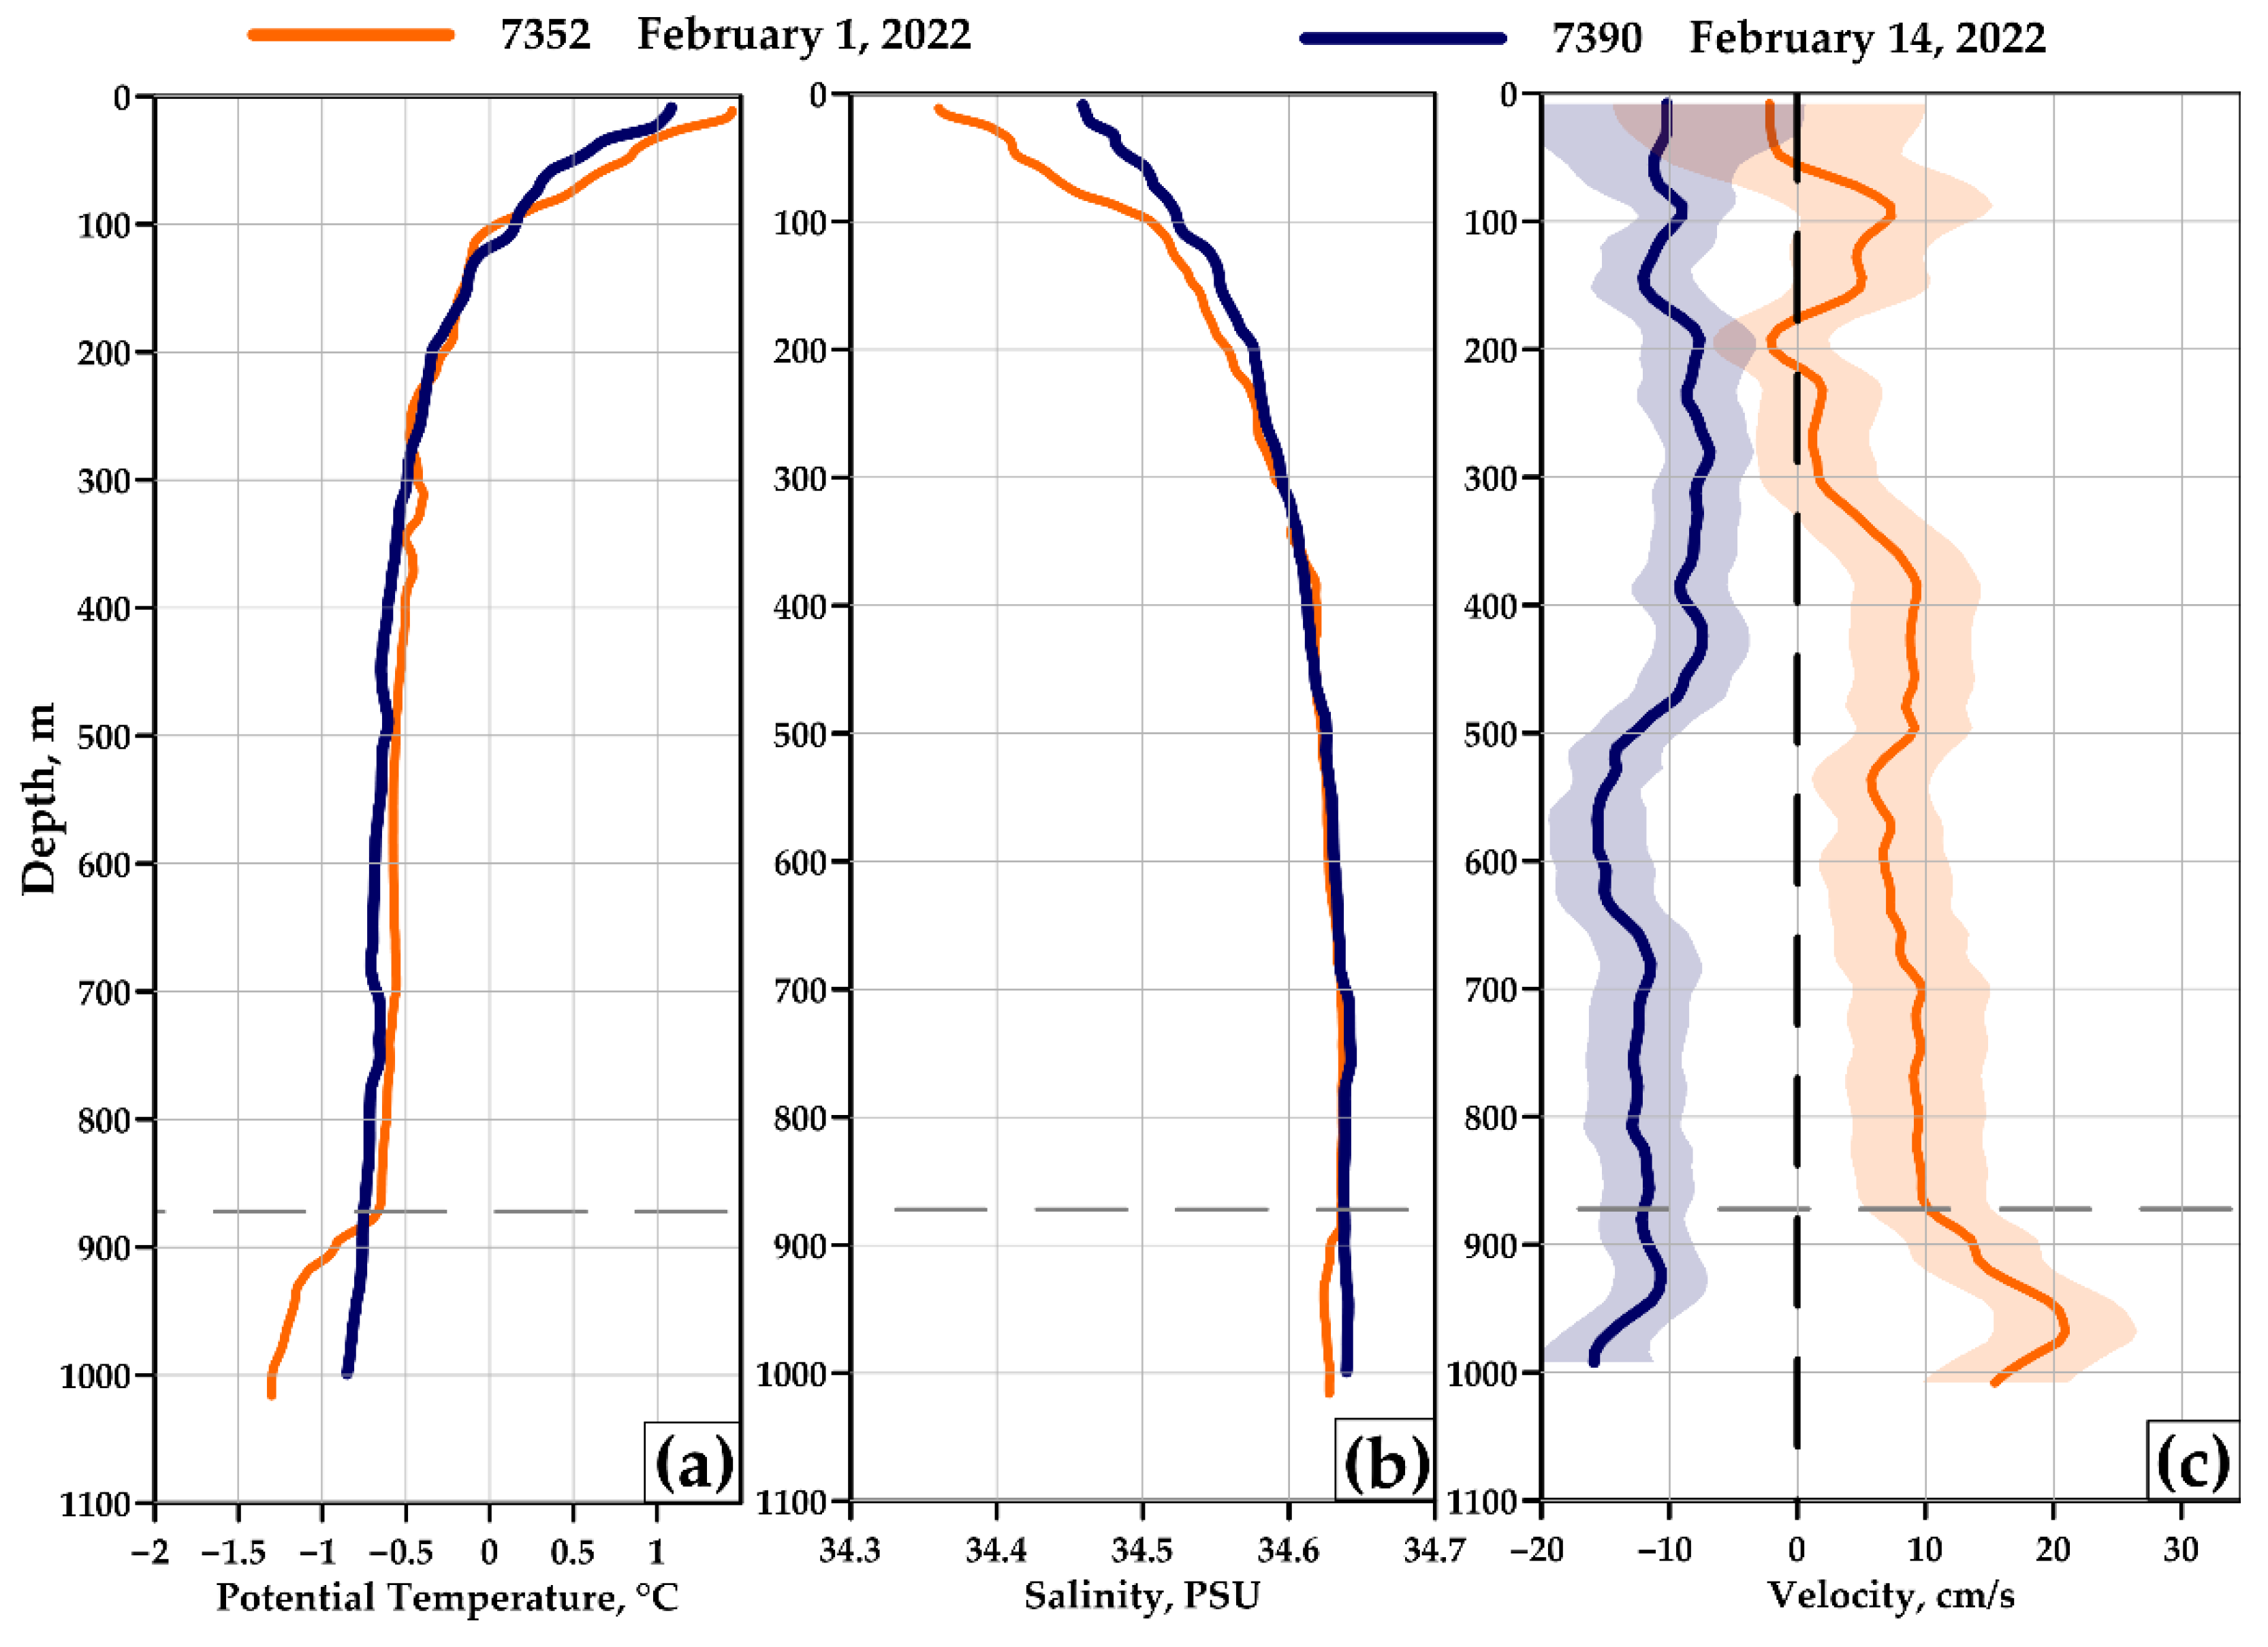
3.2. Deep-Water Overflow between Central and Eastern Basins

The overflow between the CB and EB was studied on the basis of a transect performed over the sill between the basins (Figure 5). The deepest point of the watershed between the basins is 1050 m based on the GEBCO2021 database. The transect included five stations and was oriented across the deep overflow. Along-flow velocity, potential temperature, salinity, and potential density relative to the sea surface are shown in Figure 5. Velocities over entire water column along the section were quite low (less than 10–15 cm/s). TBW and TWW flows are located at some distance away from the transect between two basins; the Bransfield Current was observed north of our stations, closer to the South Shetland Islands, while the inflow of waters from the Weddell Sea is located closer to the Antarctic Peninsula. On the basis of the data of our section, the intensification of currents was observed in the bottom layers. Two separate high-velocity jets were observed at station 7357 and 7352. The first jet with maximal velocity equal to 22 cm/s was located at the deepest point of the section. The coldest (minimal potential temperature was −1.31 °C) and densest (maximal potential density anomaly relative to the sea surface was 27.87 kg/m3) waters were observed at this point. The second jet with the maximal velocity, equal to 21 cm/s, was observed at station 7357. Its location near the steep slope could be caused by the Coriolis force, which displaced the jet to the left in the Southern Hemisphere. A very thin bottom layer of cold waters was also observed at station 7354; this layer was formed by the overflow of cold waters from the central basin.
The measurements in the region of the deep overflow between the CB and EB were performed twice with an interval of two weeks on 1 and 14 February 2022. The first survey included measurements at five stations across the bottom flow; the second survey consisted of four stations along the overflow. The station at the sill point between the basins was performed twice during both surveys. The direction of the deep overflow changed during these two weeks. The LADCP velocities measured in the bottom layer are shown in Figure 6. We present the maximal velocities in the 100 m bottom layer and averaged velocities in the bottom layers with thicknesses of 50 and 100 m. The magnitudes and directions of these velocity vectors were very close. For example, the maximal velocity of the overflow was 22 cm/s, while average velocities were 19 and 18 cm/s for the 50 and 100 m layers, respectively. As for the measurements at the same point performed two weeks later, the flow was directed in the opposite direction, from the EB to CB. The velocities of this opposite flow reached 18 cm/s (maximal value), 16 cm/s (averaged in the 50 m bottom layer), and 14 cm/s (averaged in the 100 m bottom layer). These changes in currents are shown in Figure 7 in more detail. Corresponding changes in the potential temperature and salinity between the measurements over the sill point between the basins were 0.47 °C (from −1.31 to −0.84 °C) and 0.02 psu (from 34.62 to 34.64 psu), respectively. A sharp thermocline was observed at depths of 880–920 m at station 7352; the vertical potential temperature gradient reached 0.01 °C/m (1 °C per 100 m depth). When the current changed direction in two weeks (station 7390), such a strong thermocline was not observed.

4. Discussion

Different properties of waters from the separate BS basins are caused by different pathways of propagation of Weddell Sea waters, which is the source of these waters. Differences in temperature and salinity define the density of deep waters in these basins, which in turn define the dynamics of deep layers within the strait. Temperature–salinity diagrams (Figure 8) were used for the analysis of thermohaline water structure at all studied sections. The densest waters were observed in the deepest part of the CB (Section 3, Figure 8c); the maximal recorded potential density anomaly at station 7299 was 27.89 kg/m3. Such dense waters were not observed at Section 1 (Figure 8a) between the WB and CB, confirming the fact that the deepest layers of the CB are filled by TWW waters from the east. The minimal potential temperature in the bottom layer of the CB was −1.65 °C, which is quite close to the freezing-point temperature (−1.90 °C for waters with 34.65 PSU salinity). This fact indicates the possible importance of the local ice formation effects during austral winter. It is quite possible that cooling and ice formation over the shelves of the BS (which are sufficiently wide in the southern part of the strait near the Antarctic Peninsula) can cause the formation of such dense waters within the CB. More winter measurements are needed for studies of such processes in the strait.
For addressing the temporal variability of thermohaline properties of the deepest waters within the Bransfield Strait, we analyzed the modern World Ocean Database (WOD2018). Temperature–salinity diagrams allowed us to compare the maximal densities of deep waters in the CB (Figure 9a) and EB (Figure 9b).These data show that the deep waters in the CB are colder, saltier, and denser than waters in the EB. The minimal potential temperature in the CB usually reaches −1.75 °C, while waters in the EB are always warmer than −1.42 °C. Salinity in the deep layers of the CB significantly varies, but it is usually greater than that in the EB, which contributes to the observed density differences. The maximal density in the CB reaches 27.89 kg/m3, but it does not exceed 27.82 kg/m3 in the EB. Thus, the mean bottom flow through the studied sill should be directed from the CB to the EB. Continuous observations are required to evaluate the magnitude of the deep overflow, and the question regarding the source of deep water in the central basin requires further studies.
CTD data from several profiles are presented in Figure 10 for a more detailed analysis of water transformation along the strait. Stations 7321, 7317, 7299, 7352, and 7387 were established at the deepest points along the thalweg of the BS. The coldest (−1.65 °C) and densest (27.89 kg/m3) waters were located in the CB (station 7299). Despite the fact that the EB is deeper (2750 against 1960 m in the CB), the waters in the EB are not as cold and dense as those in the CB. This indicates that the bottom water in the EB has not been directly transported from the TWW flow from the Weddell Sea, but appeared there due to the overflow from the CB. During propagation, these waters mix with overlaying warmer and more saline waters leading to the observed decrease in density. Regarding the overflow between the basins (station 7352), the bottom waters there are colder than any waters at these depths in the CB or EB. In fact, a potential temperature isotherm of −1.30 °C was observed at a depth of 1105 m in the CB (station 7299) and at a depth of 1000 at the sill point between the basins (station 7352), indicating that deeper layers of the CB are involved in the studied overflow.
Temporal variability in the flow between the CB and EB needs to be studied in more detail. Our two stations with a time interval of two weeks showed significant variability of currents between the basins. One of the possible reasons of such variability is tides; tidal motions are intensified over underwater ridges such as the watershed between the CB and EB. However, the calculations of tidal velocities at the exact time and positions of stations 7352 and 7390 based on the TPXO9.1 model show that variability cannot be completely explained by tidal motions. Thus, tidal velocities were 8.1 cm/s to the northeast (direction 48° relative to the north) at the time of station 7352, and 7.8 cm/s to the east (direction 88°) at the time of station 7390. The measured LADCP velocities are sufficiently higher. One of the other possible causes of such a variability are internal seiches. Some similar mechanisms were suggested for the variability in the overflow in the Denmark Strait [45]. In any case, further measurements of currents over this sill point are needed for better understanding the properties of the observed overflow, their temporal and spatial variability, and dynamic aspects that drive this intense current in this narrow gap between the basins.

5. Conclusions

Thermohaline structure and water dynamics in the BS during austral summer of 2022 were analyzed on a series of CTD/LADCP sections across the strait. The analysis was focused on the water exchange between the CB and adjacent basins; this exchange significantly differed in the western and eastern margins of the CB. The main result for the western margin is that there is a significant flow of TWW waters along the Antarctic Peninsula that continues up to the western basin. It was previously suggested that all these waters recirculate within the CB as a part of cyclonic circulation in the strait. Our direct velocity measurements show that the TWW flow transports 0.77 Sv to the WB. At the same time, there was no significant overflow of deep and dense waters between the WB and CB due to the relatively shallow sill separating the basins. The situation over the watershed between the CB and EB was completely different. The underwater ridge there was much deeper and reaches a depth of more than 1000 m at the sill point. At that point, a strong intensification of deep currents was observed; the maximal bottom velocities reached 22 cm/s. This bottom flow is very variable and sometimes changes its direction. More direct velocity measurements are needed at this point for the detailed analysis of the bottom overflow and its temporal variability.

Author Contributions

Conceptualization, D.I.F. and E.G.M.; methodology, V.A.K. and D.A.S.; software, A.S.G. and I.D.D.; validation, O.A.Z.; data curation, V.A.K. and S.A.S.; writing—original draft preparation, D.I.F.; writing—review and editing, E.G.M., A.A.L., S.A.M., V.I.P. and P.A.S.; visualization, O.S.M., R.Z.M. and S.A.O.; supervision, E.G.M.; funding acquisition, E.G.M. and D.I.F. All authors have read and agreed to the published version of the manuscript.

Funding

This work was supported by the State Task of Russia FMWE-2022-0001 (ship operations and expenses), 0211-2019-0007 (field studies), and FNNN-2022-0001 (bio-optical measurements). The LADCP data processing and analysis of circulation in the strait were supported with Russian Science Foundation grant 22-77-10004. CTD data processing by DIF was supported by a grant of the President of the Russian Federation for the state support of young Russian scientists—candidates of science, research project MK-1492.2021.1.5.

Institutional Review Board Statement

Not applicable.

Informed Consent Statement

Not applicable.

Data Availability Statement

All experimental data, including CTD and LADCP profiles, used in the publication are available in open access through the Mendeley Data service (http://dx.doi.org/10.17632/69v8599btr.1). GEBCO2021 data are available at the official service https://www.gebco.net/data_and_products/gridded_bathymetry_data/gebco_2021/ (accessed on 4 October 2022).

Conflicts of Interest

The authors declare no conflict of interest.

References

  1. Huneke, W.; Huhn, O.; Schroeder, M. Water masses in the Bransfield Strait and adjacent seas, austral summer 2013. Polar Biol. 2016, 39, 789–798. [Google Scholar] [CrossRef]
  2. Vaughan, D.; Marshall, G.; Connolley, W.; Parkinson, C.; Mulvaney, R.; Hodgson, D.; King, J.; Pudsey, C.; Turner, J. Recent rapid regional climate warming on the Antarctic Peninsula. Clim Chang. 2003, 60, 243–274. [Google Scholar] [CrossRef]
  3. Veit-Köhler, G.; Durst, S.; Schuckenbrock, J.; Hauquier, F.; Durán Suja, L.; Dorschel, B.; Vanreusel, A.; Martínez Arbizu, P. Oceanographic and topographic conditions structure benthic meiofauna communities in the Weddell Sea, Bransfield Strait and Drake Passage (Antarctic). Prog. Oceanogr. 2018, 162, 240–256. [Google Scholar] [CrossRef] [Green Version]
  4. Spiridonov, V. A Scenario of the Late-Pleistocene-Holocene Changes in the Distributional Range of Antarctic Krill (Euphausia superba). Mar. Ecol. 1996, 17, 519–541. [Google Scholar] [CrossRef]
  5. Atkinson, A.; Siegel, V.; Pakhomov, E.; Rothery, P. Long-term decline in krill stock and increase in salps within the Southern Ocean. Nature 2004, 432, 100–103. [Google Scholar] [CrossRef] [PubMed]
  6. Loeb, V.; Hofmann, E.; Klinck, J.; Holm-Hansen, O.; White, W. ENSO and variability of the Antarctic Peninsula pelagic marine ecosystem. Antarct. Sci. 2009, 21, 135–148. [Google Scholar] [CrossRef] [Green Version]
  7. Reiss, C.; Cossio, A.; Santora, J.; Dietrich, K.; Murray, A.; Greg Mitchell, B.; Walsh, J.; Weiss, E.L.; Gimpel, C.; Jones, C.; et al. Overwinter habitat selection by Antarctic krill under varying sea-ice conditions: Implications for top predators and fishery management. Mar. Ecol. Prog. Ser. 2017, 568, 1–16. [Google Scholar] [CrossRef] [Green Version]
  8. Perry, F.; Atkinson, A.; Sailley, S.; Tarling, G.; Hill, S.; Lucas, C.; Mayor, D. Habitat partitioning in Antarctic krill: Spawning hotspots and nursery areas. PLoS ONE 2019, 14, e0219325. [Google Scholar] [CrossRef] [Green Version]
  9. Wang, R.; Song, P.; Li, Y.; Lin, L. An integrated, size-structured stock assessment of Antarctic krill, Euphausia superba. Front. Mar. Sci. 2021, 8, 710544. [Google Scholar] [CrossRef]
  10. Nordhausen, W. Distribution and growth of larval and adult Thysanoessa macrura (Euphausiacea) in the Bransfield Strait Region, Antarctica. Mar. Ecol. Prog. Ser. 1992, 83, 185–196. [Google Scholar] [CrossRef]
  11. Siegel, V. Distribution and population dynamics of Euphausia superba: Summary of recent findings. Polar Biol. 2005, 29, 1–22. [Google Scholar] [CrossRef]
  12. Siegel, V.; Reiss, C.; Dietrich, K.; Haraldsson, M.; Gerhard, R. Distribution and abundance of Antarctic krill (Euphausia superba) along the Antarctic Peninsula. Deep Sea Res. Part I Oceanogr. Res. Pap. 2013, 77, 63–74. [Google Scholar] [CrossRef]
  13. Meyer, B.; Atkinson, A.; Bernard, K.; Brierley, A.; Driscoll, R.; Hill, S.; Marschoff, E.; Maschette, D.; Perry, F.; Reiss, C.; et al. Successful ecosystem-based management of Antarctic krill should address uncertainties in krill recruitment, behavior and ecological adaptation. Commun. Earth Environ. 2020, 1, 28. [Google Scholar] [CrossRef]
  14. Dorschel, B.; Gutt, J.; Huhn, O.; Bracher, A.; Huntemann, M.; Huneke, W.; Gebhardt, C.; Schröder, M.; Herr, H. Environmental information for a marine ecosystem research approach for the northern Antarctic Peninsula (RV Polarstern expedition PS81, ANT-XXIX/3). Polar Biol. 2016, 39, 765–787. [Google Scholar] [CrossRef]
  15. Gordon, A.L.; Nowlin, W.D. The basin waters of the Bransfield Strait. J. Phys. Oceanogr. 1978, 8, 258–264. [Google Scholar] [CrossRef]
  16. López, O.; Garcia, M.; Gomis, D.; Rojas, P.; Sospedra, J.; Sanchez-Arcilla, A. Hydrographic and hydrodynamic characteristics of the eastern basin of the Bransfield Strait (Antarctica). Deep Sea Res. Part I Oceanogr. Res. Pap. 1999, 46, 1755–1778. [Google Scholar] [CrossRef]
  17. Wessel, P.; Smith, W. A global, self-consistent, hierarchical, high-resolution shoreline database. J. Geophys. Res. 1996, 101, 8741–8743. [Google Scholar] [CrossRef] [Green Version]
  18. Tokarczyk, R. Classification of water masses in the Bransfield Strait and Southern part of the Drake Passage using a method of statistical multidimensional analysis. Pol. Polar Res. 1987, 8, 333–336. [Google Scholar]
  19. García, M.; López, O.; Sospedra, J.; Espino, M.; Gràcia, V.; Morrison, G.; Pojas, P.; Figa, J.; Puigdefabregas, J.; Arcilla, A. Mesoscale variability in the Bransfield Strait region (Antarctica) during Austral summer. Ann. Geophys. 1994, 12, 856–867. [Google Scholar] [CrossRef]
  20. Niiler, P.; Amos, A.; Hu, J.-H. Water masses and 200 m relative geostrophic circulation in the western Bransfield Strait region. Deep Sea Res. Part A Oceanogr. Res. Pap. 1991, 38, 943–959. [Google Scholar] [CrossRef]
  21. Zhou, M.; Niiler, P.; Zhu, Y.; Dorly, R. The western boundary current in the Bransfield Strait, Antarctica. Deep Sea Res. Part I Oceanogr. Res. Pap. 2006, 53, 1244–1252. [Google Scholar] [CrossRef]
  22. Poulin, F.; Stegner, A.; Hernández-Arencibia, M.; Marrero-Díaz, A.; Sangrà, P. Steep shelf stabilization of the coastal Bransfield Current: Linear stability analysis. J. Phys. Oceanogr. 2014, 44, 714–732. [Google Scholar] [CrossRef]
  23. Sangrà, P.; Gordo, C.; Hernández-Arencibia, M.; Marrero-Díaz, A.; Rodríguez-Santana, A.; Stegner, A.; Martínez-Marrero, A.; Pelegrí, J.L.; Pichon, T. The Bransfield Current system. Deep Sea Res. Part I Oceanogr. Res. Pap. 2011, 58, 390–402. [Google Scholar] [CrossRef]
  24. Ruiz Barlett, E.; Tosonotto, G.; Piola, A.; Sierra, M.; Mata, M. On the temporal variability of intermediate and deep waters in the Western Basin of the Bransfield Strait. Deep Sea Res. Part II 2017, 149, 31–46. [Google Scholar] [CrossRef]
  25. Morozov, E.; Krechik, V.; Frey, D.; Polukhin, A.; Sapozhnikov, P. Water Masses, Currents, and Phytoplankton in the Bransfield Strait in January 2020. In Antarctic Peninsula Region of the Southern Ocean; Advances in Polar Ecology; Morozov, E., Flint, M., Spiridonov, V., Eds.; Springer: Cham, Switzerland, 2021; Volume 6, pp. 55–64. [Google Scholar]
  26. Polukhin, A.; Morozov, E.; Tishchenko, P.; Frey, D.; Artemiev, V.; Borisenko, G.; Vidnichuk, A.; Marina, E.; Medvedev, E.; Popov, O.; et al. Water Structure in the Bransfield Strait (Antarctica) in January 2020: Hydrophysical, Optical and Hydrochemical Features. Oceanology 2021, 61, 632–644. [Google Scholar] [CrossRef]
  27. Veny, M.; Aguiar-González, B.; Marrero-Díaz, Á.; Rodríguez-Santana, Á. Seasonal circulation and volume transport of the Bransfield Current. Prog. Oceanogr. 2022, 204, 102795. [Google Scholar] [CrossRef]
  28. Zhou, X.; Zhu, G.; Hu, S. Influence of tides on mass transport in the Bransfield Strait and the adjacent areas, Antarctic. Polar Sci. 2020, 23, 100506. [Google Scholar] [CrossRef]
  29. Khimchenko, E.; Frey, D.; Morozov, E.G. Tidal internal waves in the Bransfield Strait, Antarctica. Russ. J. Earth Sci. 2020, 20, ES2006. [Google Scholar] [CrossRef] [Green Version]
  30. Savidge, D.; Amft, J. Circulation on the West Antarctic Peninsula derived from 6 years of shipboard ADCP transects. Deep Sea Res. Part I Oceanogr. Res. Pap. 2009, 56, 1633–1655. [Google Scholar] [CrossRef]
  31. Wang, X.; Moffat, C.; Dinniman, M.; Klinck, J.; Sutherland, D.; Aguiar-González, B. Variability and Dynamics of Along-Shore Exchange on the West Antarctic Peninsula (WAP) Continental Shelf. J. Geophys. Res. 2022, 127, e2021JC017645. [Google Scholar] [CrossRef]
  32. Wilson, C.; Klinkhammer, G.; Chin, C. Hydrography within the central and east basins of the Bransfield Strait, Antarctica. J. Phys. Oceanogr. 1999, 29, 465–479. [Google Scholar] [CrossRef]
  33. Gordon, A.; Mensch, M.; Dong, Z.; Smethie, W.; de Bettencourt, J. Deep and bottom water of the Bransfield Strait eastern and central basins. J. Geophys. Res. Atmos. 2000, 105, 11337–11346. [Google Scholar] [CrossRef]
  34. Dotto, T.; Kerr, R.; Mata, M.; Garcia, A. Multidecadal freshening and lightening in the deep waters of the Bransfield Strait, Antarctica. J. Geophys. Res. 2016, 121, 3741–3756. [Google Scholar] [CrossRef] [Green Version]
  35. Krechik, V.; Frey, D.; Morozov, E. Peculiarities of water circulation in the central part of the Bransfield Strait in January 2020. Dokl. Earth Sci. 2021, 496, 92–95. [Google Scholar] [CrossRef]
  36. Izhitskiy, A.; Romanova, N.; Vorobieva, O.; Frey, D. Impact of Ice Melting on Oceanographic and Hydrobiological Characteristics of Surface Waters in the Powell Basin, Weddell Sea, in January–February 2020. Oceanology 2022, 62, 439–446. [Google Scholar] [CrossRef]
  37. Damini, B.; Kerr, R.; Dotto, T.; Mata, M. Long-term changes on the Bransfield Strait deep water masses: Variability, drivers and connections with the northwestern Weddell Sea. Deep Sea Res. Part I Oceanogr. Res. Pap. 2022, 179, 10367. [Google Scholar] [CrossRef]
  38. Marshall, G.; Stott, P.; Turner, J.; Connolley, W.; King, J.; Lachlan-Cope, T. Causes of exceptional atmospheric circulation changes in the Southern Hemisphere. Geophys. Res. Lett. 2004, 31, L14205. [Google Scholar] [CrossRef]
  39. Mukhametyanov, R.; Frey, D.; Morozov, E. Currents in the Bransfield Strait Based on Geostrophic Calculations and Data of Instrumental Measurements. Izv. Atmos. Ocean. Phys. 2022, 58, 500–506. [Google Scholar] [CrossRef]
  40. Visbeck, M. Deep velocity profiling using Lowered Acoustic Doppler Current Profiler: Bottom track and inverse solution. J. Atmos. Ocean. Technol. 2002, 19, 794–807. [Google Scholar] [CrossRef]
  41. Egbert, G.; Erofeeva, S. Efficient inverse modeling of barotropic ocean tides. J. Atmos. Ocean. Technol. 2002, 19, 183–204. [Google Scholar] [CrossRef]
  42. Sangrà, P.; Stegner, A.; Hernández-Arencibia, M.; Marrero-Díaz, A.; Salinas, C.; Aguiar-González, B. The Bransfield Gravity Current. Deep Sea Res. Part I Oceanogr. Res. Pap. 2017, 119, 1–15. [Google Scholar] [CrossRef]
  43. Morozov, E.; Zuev, O.; Zamshin, V.; Krechik, V.; Ostroumova, S.; Frey, D. Observations of icebergs in Antarctic cruises of the R/V “Akademik Mstislav Keldysh”. Russ. J. Earth. Sci. 2022, 22, ES2001. [Google Scholar] [CrossRef]
  44. Fofonoff, P.; Millard, R. Algorithms for Computation of Fundamental Properties of Seawater; UNESCO Technical Papers in Marine Science; Unesco: Paris, France, 1983; Volume 44, 53p. [Google Scholar]
  45. Morozov, E.; Frey, D.; Gladyshev, S.; Gladyshev, V. Hydrodynamics of bottom water flow from the Arctic to the Atlantic through the Denmark Strait. Izv. Atmos. Ocean. Phys. 2020, 56, 479–487. [Google Scholar] [CrossRef]
Figure 1. (a) Bathymetry of the Bransfield Strait and (b) the region of the overflow between the central and eastern basins. (a) The upper layer circulation schematic is shown by black arrows. Western, central, and eastern basins of the strait are shown with green, yellow, and orange, respectively. CTD/LADCP stations performed in 2022 are shown by white dots; historical CTD stations from World Ocean Database (WOD2018) used in this study are shown by grey dots. The bottom relief is shown according to the GEBCO2021 database; the shoreline is based on the GSHHS data [17]. Station 7390 (not shown) repeats station 7352.
Water 14 03193 g001
Figure 2. Depths along the thalweg of the Bransfield Strait and location of CTD/LADCP measurements. (a) Bottom topography according to the GEBCO2021 database, shoreline is based on GSHHS data [17], thalweg is indicated with dark red solid line, CTD/LADCP sections shown with black solid lines, colored dots show the locations of CTD stations along the thalweg presented in (c). (b) areas with ocean bottom measured with multibeam soundings indicated with green; the data were taken from TID file of GEBCO2021 database. (c) Ocean depth along the thalweg of the BS (shown with gray) and location of CTD stations along the strait; the deepest CTD/LADCP station was selected at each transect. Station numbers correspond to Table 1; colors are indicated in the bottom panel.
Water 14 03193 g002
Figure 3. Along-strait LADCP velocity distributions at two sections across the BS: (a) Section 1 over the watershed between the WB and CB and (b) Section 2 in the CB. Locations of TBW and TWW flows are indicated at the top of each panel; stations are indicated by solid black lines. The bottom relief is shown according to the GEBCO2021 database.
Water 14 03193 g003
Figure 4. (a,c,e) Potential temperature and (bf) salinity distributions at three sections across the Bransfield Strait. Data for (a,b) Section 1, (c,d) Section 2, and (e,f) Section 3. Isolines of potential density anomalies shown with dashed contours. Locations of CTD stations are indicated with solid lines. The bottom relief is shown according the GEBCO2021 database.
Water 14 03193 g004
Figure 5. Structure of the deep overflow between the CB and EB of the strait: distribution of the (a) northeastern velocity (true direction is 45°) based on LADCP data, (b) potential temperature, and (c) salinity based on CTD data. Contours of potential density anomalies are shown with dashed black lines. Positions of stations are indicated with vertical solid lines together with the numbers of the stations.
Water 14 03193 g005
Figure 6. Measured LADCP velocities in the bottom layer over the sill point between the central and eastern basins of the BS. (a,b) Maximal velocities averaged (c,d) in the 50 m bottom layer and ((e,f)) the 100 m bottom layer. (a,c,e) Data measured on 1 February; (bf) measurements performed two weeks later (on 14 February). The magnitude of currents is shown in both the colors and lengths of the arrows; all color and vector scales are the same in all panels. The relief is based on the GEBCO2021 database.
Water 14 03193 g006
Figure 7. (a) Potential temperature, (b) salinity, and (c) along-flow velocity profiles measured at the same location over a sill point between the central and eastern basins on 1 February 2022 (station 7352, orange line) and 14 February 2022 (station 7390, blue line). Horizontal dashed line at a depth of 870 m indicates the upper boundary of the bottom layer with high velocities.
Water 14 03193 g007
Figure 8. Temperature–salinity diagrams including the freezing-point temperature (magenta line) and sigma contours (gray lines) at the hydrographic stations at different sections in the BS. From west to east: (a) Section 1, (b) Section 2, (c) Section 3, (d) section across the deep overflow. The locations of the sections are shown in Figure 1 and Figure 2. The colors of the dots indicate depths of measurements; see color scale in (c). The freezing-point temperature was calculated on the basis of EOS80 equations [44].
Water 14 03193 g008
Figure 9. Temperature–salinity diagrams including the freezing-point temperature (magenta line) and sigma contours (gray lines) at the available hydrographic stations in the WOD2018 database for the (a) central and (b) eastern basins. Only full-depth profiles deeper than 1500 m were selected from the database. The colors of the dots indicate depths of measurements; see color scale in (b). The freezing-point temperature was calculated on the basis of EOS80 equations [44].
Water 14 03193 g009
Figure 10. Potential temperature, salinity, and potential density along the thalweg of the BS: (a) location of stations relative to the basins of the strait, (b) temperature-salinity diagram, (c) profiles of potential temperature, (d) salinity, and (e) potential density. The colors of stations are the same in all panels. All profiles at depths of the overflow (850–1050 m) are shown in the insets in more detail.
Water 14 03193 g010
Table 1. Coordinates of stations carried out in the Bransfield Strait in January and February 2022.
Station NumberDate/
Time (UTC)
CoordinatesCTD Depth, m/Ocean Depth, mType of Measurements
Section 1
731826 January 2022 15:0863°26.4′ S 60°05.7′ W102/110CTD/LADCP
731926 January 2022 17:0963°20.0′ S 60°13.4′ W613/616CTD/LADCP
732026 January 2022 18:5863°14.5′ S 60°19.4′ W531/536CTD/LADCP
732126 January 2022 21:4163°09.9′ S 60°25.5′ W660/666CTD/LADCP
732226 January 2022 23:2063°05.8′ S 60°29.9′ W650/655CTD/LADCP
732327 January 2022 00:4863°03.1′ S 60°32.8′ W368/373CTD/LADCP
Section 2
730824 January 2022 09:1263°10.0′ S 58°20.1′ W186/191CTD/LADCP
730924 January 2022 11:5963°02.2′ S 58°35.7′ W184/190CTD/LADCP
731024 January 2022 14:0062°54.0′ S 58°53.2′ W742/746CTD/LADCP
731124 January 2022 19:2362°36.9′ S 59°27.2′ W1271/1276CTD/LADCP
731325 January 2022 16:5862°33.5′ S 59°33.8′ W392/397CTD/LADCP
731425 January 2022 21:0562°35.0′ S 59°31.8′ W606/612CTD/LADCP
731526 January 2022 00:0462°35.9′ S 59°29.3′ W988/994CTD/LADCP
731626 January 2022 01:5462°40.0′ S 59°22.0′ W1403/1409CTD/LADCP
731726 January 2022 06:2362°44.9′ S 59°11.7′ W1412/1422CTD/LADCP
Section 3
729421 January 2022 11:2962°52.0′ S 57°09.4′ W148/152CTD/LADCP
729521 January 2022 14:0062°49.5′ S 57°15.8′ W167/171CTD
729621 January 2022 15:2662°45.6′ S 57°25.8′ W214/218CTD
729721 January 2022 17:1762°40.0′ S 57°39.6′ W716/720CTD
729821 January 2022 20:5962°37.0′ S 57°52.0′ W1227/1232CTD/LADCP
729921 January 2022 23:2562°31.0′ S 58°08.0′ W1768/1773CTD
730122 January 2022 21:0062°26.4′ S 58°21.1′ W1055/1063CTD
730523 January 2022 15:5562°21.0′ S 58°36.8′ W748/751CTD
730623 January 2022 20:2962°23.0′ S 58°30.0′ W1319/1323CTD
Overflow
735231 January 2022 19:2762°10.9′ S 56°41.0′ W1016/1023CTD/LADCP
735401 February 2022 14:4162°12.6′ S 56°35.8′ W968/972CTD/LADCP
735501 February 2022 16:0162°11.5′ S 56°38.5′ W897/902CTD/LADCP
735601 February 2022 17:1862°10.1′ S 56°43.1′ W925/931CTD/LADCP
735701 February 2022 18:3162°09.2′ S 56°46.2′ W905/911CTD/LADCP
738714 February 2022 05:2661°57.0′ S 56°10.0′ W2373/2379CTD/LADCP
738814 February 2022 09:4662°08.9′ S 56°36.5′ W1160/1165CTD/LADCP
738914 February 2022 11:1662°10.0′ S 56°38.9′ W1135/1139CTD/LADCP
739014 February 2022 12:4862°10.9′ S 56°40.7′ W1000/1006CTD/LADCP
739114 February 2022 14:3762°08.4′ S 56°31.8′ W1206/1212CTD/LADCP
Publisher’s Note: MDPI stays neutral with regard to jurisdictional claims in published maps and institutional affiliations.

