
Characteristics of Bacterial Community in Pelteobagrus fulvidraco Integrated Multi-Trophic Aquaculture System
by
 ,
,
Yu-Xi Zhao
1,2,3 ,
,
Xing-Guo Liu
1,2,*,
Ming Lu
1,2,4,
Run-Feng Zhou
1,2,3,
Zhao-Yun Sun
1,2,5 and
Shu-Wen Xiao
1,2,3 1
Key Laboratory of Aquaculture Facilities Engineering, Ministry of Agriculture and Rural Affairs, 63 Chifeng Road, Shanghai 200092, China
2
Fishery Machinery and Instrument Research Institute, Chinese Academy of Fishery Sciences, 63 Chifeng Road, Shanghai 200092, China
3
College of Fisheries and Life Science, Shanghai Ocean University, 999 Huchenghuan Road, Shanghai 201306, China
4
College of Environment and Architecture, University of Shanghai for Science and Technology, 516 Jungong Road, Shanghai 200093, China
5
Wuxi Fisheries College, Nanjing Agriculture University, 69 Renbin Road, Wuxi 214128, China
*
Author to whom correspondence should be addressed.
Water 2022, 14(20), 3192; https://doi.org/10.3390/w14203192
Submission received: 3 September 2022
/
Revised: 4 October 2022
/
Accepted: 5 October 2022
/
Published: 11 October 2022
(This article belongs to the Section Biodiversity and Functionality of Aquatic Ecosystems)
Abstract
:Pelteobagrus fulvidraco integrated multi-trophic aquaculture system (YPS) is a new ecological culture system of Pelteobagrus fulvidraco. In this manuscript, we used high throughput sequencing technology and the water analysis method to analyze the bacterial community characteristics of YPS and the water environment, respectively. The results showed that the concentration of total nitrogen (1.47~1.84 mg/L) and total phosphorus (0.14~0.18 mg/L) reached the discharge standard of freshwater pond aquaculture water, and the concentrations of ammonia (0.10~0.95 mg/L) and nitrite (3.85~6.68 μg/L) were lower than those in traditional ponds, which was suitable for the growth of Pelteobagrus fulvidraco. At the phylum level, Actinobacteria (35.68%), Firmicutes (24.58%), Proteobacteria (23.49%) and Bacteroidetes (6.59%) were the dominant phyla. The abundance of genus had obvious seasonal variation characteristics. In spring (April), Limnohabitans (8.01%) was the dominant genus; in early summer (June), Exiguobacterium (23.44%), Planococcus (22.27%), Paenisporosarcina (16.81%) and Planomicrobium (5.85%) were the dominant genera; at the end of summer (August), hgcI_clade (21.84%) and CL500_29_marin_group (4.61%) were the dominant genera; compared with the end of summer, the dominant genera Sporichthyaceae (11.31%) and Sediminibacterium (3.32%) were newly added in autumn (October). The dominant genera in different periods were correlated with dissolved oxygen, water temperature and nitrogen nutrients. With the accumulation of nitrogen nutrients in water, the abundance of metabolic pathways in the bacterial community increased, and the abundance of infectious and immune disease pathways increased. This study provides a theoretical basis for the regulation of YPS.
1. Introduction
As the fastest-growing aquaculture species among the famous freshwater fish in China, Pelteobagrus fulvidraco is favored by consumers because of its delicious flavor, lack of intermuscular bones and short culture cycle. Since 2012, the annual output of Pelteobagrus fulvidraco has increased by 16.4% on average, reaching 565,477 tons by 2021 [1]. For a long time, unilateral pursuit of output has resulted in serious pollution, frequent diseases and declined aquaculture quality. Therefore, building a high-efficiency ecological aquaculture system of Pelteobagrus fulvidraco and improving economic and ecological benefits have become a new direction to promote the upgrading and transformation of the industry.
The integrated multi-trophic aquaculture system (IMTA) integrates ecological engineering facilities and ecological engineering systems [2], which include an ecological aquaculture technology that integrates the culturing of fed species, inorganic extractive species (such as hydrophyte) and organic extractive species (such as shellfish) [3]. Compared with traditional aquaculture systems, IMTAs can provide superior culture environment, higher ecological benefits and diversified economic benefits, which have been applied all over the world. The comprehensive IMTA in Sungo Bay [4] and the brackish water IMTA in western Bangladesh [5] can achieve higher economic benefits and ecological service values than traditional monoculture systems, with obvious improvement effects on culture quality, water purification and residual bait removal. In East, Central and South China, an IMTA involving composite wetlands and eco-ditches has been constructed for staple carp, which effectively improves water purification efficiency, regulates plankton and realizes emission reduction (80%) [6]. In saline and alkali areas of Northwest and Central China, an IMTA with alkali drainage and reduction facilities has been constructed for staple carp, white-leg shrimp and Chinese mitten crab, which reduces salinity and alkalinity (25~33%), increases comprehensive benefits (50%) and becomes a new poverty alleviation method [7]. By reasonable polyculture and setting up facilities, IMTAs can solve the problems caused by single feeding habits and ecological niche of cultured organisms in a monoculture system, such as low resource utilization and water pollution. However, there is no report on IMTAs of Pelteobagrus fulvidraco at present.
Microorganisms play an important role in the chemical cycle of aquaculture ecosystems, which transform organic matter and degrade pollutants through physiological metabolism [8,9]. Due to the sensitivity to environmental factors, such as water flow disturbance [10], salinity [11,12], inorganic nutrients [13], organic nutrients [14,15] and plankton [16], microorganisms can be used as indicator organisms. By monitoring and ameliorating the bacterial community structure, it is helpful to achieve the purposes of improving water quality, preventing diseases and maintaining ecosystem stability [17]. Although utilization of microorganisms has great potential, there is a lack of research on bacterial community in Pelteobagrus fulvidraco aquaculture systems, hindering its successful management.
In this study, a Pelteobagrus fulvidraco integrated multi-trophic aquaculture system (YPS) was constructed. We analyzed bacterial community characteristics and differences by high throughput sequencing technology and statistical methods, respectively, so as to provide a theoretical basis for optimizing the aquaculture system.
2. Materials and Methods
2.1. Construction of Aquaculture System
The experiment was carried out in Songjiang culture base (30°95′ N, 121°16′ E), Fishery Machinery and Instrument Research Institute, Chinese Academy of Fishery Sciences, Shanghai, China. The area of YPS was 0.48 ha, and the average water depth was 1.4 m. In order to avoid the interaction between different trophic organisms, the system is divided into Pelteobagrus fulvidraco culture area (CA) and polyculture area (PA), which were connected by a circulating water system. Fry pond 1, fry pond 2 and a juvenile pond 2 were set in parallel in the CA to cultivated Pelteobagrus fulvidraco fry and juvenile fish, respectively, to minimize predation. In order to increase the material utilization efficiency and improve the water purification efficiency, a variety of hydrophytes and animals were cultivated in the PA according to the trophic differences.
In terms of animals, Pelteobagrus fulvidraco fries were stocked in the CA fry pond with an initial weight of 0.375 g and a stocking density of 2.10 ind/m2; Pelteobagrus fulvidraco juveniles were stocked in a juvenile pond with an initial weight of 18.92 g and a stocking density of 0.63 ind/m2; crustaceans, including Macrobrachium nipponense, Procambarus clarkii, Eriocheir sinensis and Bellamya aeruginosa, were stocked in the PA with initial body weights of 1.93 g, 15.66 g, 3.57 g and 2.12 g, respectively, and stocking densities of 1.09 ind/m2, 2.15 ind/m2, 0.21 ind/m2 and 23.16 ind/m2, respectively. In terms of plants, cash crop (Oryza sativa L.) was planted in the PA, with an initial planting density of 10.44 g/m2; hydrophytes were also planted in the PA with an initial planting density of 305.28 g/m2, including Ipomoea aquatica Forsk, Hydrocharis dubia (Bl.) Backer, Cyperus invucratus Rottboll and Vallisneria natans (Lour.) Hara.
2.2. Culture Management
During the experiment, commercial fish feed containing 40% crude protein, 6% crude fiber and 5% lipid (Tongwei Co., Ltd., Wuxi, China) was provided in the CA at 8:00 am and 17:00 pm every day according to the daily feed rate of 2.5%, but no feeding or fertilization was given in the PA. The feeding amount was increased or decreased according to the feeding situation of Pelteobagrus fulvidraco.
2.3. Sample Collection
The experiment lasted for 210 days from April 2021 to October 2021. In the CA, the fry pond 1, fry pond 2 and juvenile pond were three measuring areas, which were numbered Ⅰ, Ⅱ and Ⅲ in turn. In the PA, four rectangles of 48 m × 20 m (length × width) were divided as 4 measuring areas from east to west, which were numbered IV, V, VI and VII in turn. There were 7 measuring areas in the whole pond (n = 7). Sampling was carried out in the spring (April), summer (June, August) and autumn (October). When sampling, 1 L water was collected from 40 cm underwater at the center and four corners of each measuring area by using a 5 L glass water collector. After mixing, 2 L was taken as the water sample of each area and stored for testing. Sample numbers are shown in Table 1. After the samples were precipitated, 600 mL supernatant was filtered with a sterile 0.22 μm microporous filter membrane. Then, the filter membrane was put into a 5 mL sterile centrifuge tube, frozen in liquid nitrogen (5 min) and stored (−80 °C) for testing.
2.4. Water Analysis
YSI ProPlus multi-parameter water quality analyzer (YSI Inc., Yellow Springs, OH, USA) was used at the sampling point to measure water temperature (T) on site. Total nitrogen (TN), ammonia (-N), nitrite (-N), nitrate (-N), total phosphorus (TP), orthophosphate (-P) and dissolved oxygen (DO) in water samples were quantified spectrophotometrically [18].
2.5. 16S rRNA Gene Amplicon Sequencing
Water microbiome genomic DNA was extracted using E.Z.N.A.® soil DNA Kit (Omega Bio-Tek, Norcross, GA, USA) following the manufacturer’s instructions. The quality and concentration of DNA were determined by 1.0% agarose gel electrophoresis and a NanoDrop® ND-2000 spectrophotometer (Thermo Scientific Inc., Waltham, MA, USA) and kept at −80 °C prior to further use. The 16S rRNA genes V3-V4 region was performed using the forward primer 338F (5′-ACTCCTACGGGAGGCAGCA-3′) and the reverse primer 806R (5′-GGACTACNVGGGTWTCTAAT-3′) [19] by an ABI GeneAmp® 9700 PCR thermocycler (ABI, Carlsbad, CA, USA). The PCR reaction mixture contained 5 μL Q5 reaction buffer (5×), 5 μL Q5 High-Fidelity GC buffer (5×), 2 μL dNTPs (2.5 mM), 0.25 μL Q5 DNA Polymerase, 1 μL forward and reverse primer (10 μM), 2 μL DNA Template and 8.75 μL ddH2O. Thermal cycling consisted of initial denaturation at 98 °C (2 min), followed by 25 cycles consisting of denaturation at 98 °C (15 s), annealing at 55 °C (30 s), and extension at 72 °C (30 s), with a final extension at 72 °C (5 min) and end at 10°C. All samples were amplified in triplicate. The PCR product was extracted from 2% agarose gel and purified using the AxyPrep DNA Gel Extraction Kit (Axygen Biosciences, Union City, CA, USA) according to manufacturer’s instructions and quantified using Quantus™ Fluorometer (Promega, Madison, WI, USA). Purified amplicons were pooled in equimolar amounts and paired-end sequenced on an Illumina NovaSeq PE250 platform (Illumina, San Diego, CA, USA) according to the standard protocols by Majorbio Bio-Pharm Technology Co., Ltd. (Shanghai, China). The raw sequencing reads were deposited into the NCBI Sequence Read Archive (SRA) database.
2.6. Sequence Analysis
After demultiplexing, the resulting sequences were quality filtered with fastp (v0.19.6, https://github.com/OpenGene/fastp, accessed on 8 September 2021) [20] and merged with FLASH (v1.2.11, http://www.cbcb.umd.edu/software/flash, accessed on 8 September 2021) [21]. Then, the high-quality sequences were de-noised using DADA2 (https:// github.com/benjjneb/dada2, accessed on 8 September 2021) [22] plugin in the QIIME 2 [23] (v2020.2, https://github.com/QIIME2/q2-feature-classifier, accessed on 8 September 2021) pipeline with recommended parameters, which obtains single nucleotide resolution based on error profiles within samples. DADA2 denoised sequences are usually called amplicon sequence variants (ASVs). The number of sequences from each sample was rarefied to 20,000, which still yielded an average Good’s coverage of 97.90%. Taxonomic assignment of ASVs was performed using the naive Bayes consensus taxonomy classifier implemented in QIIME2 and the SILVA 16S rRNA database (v138).
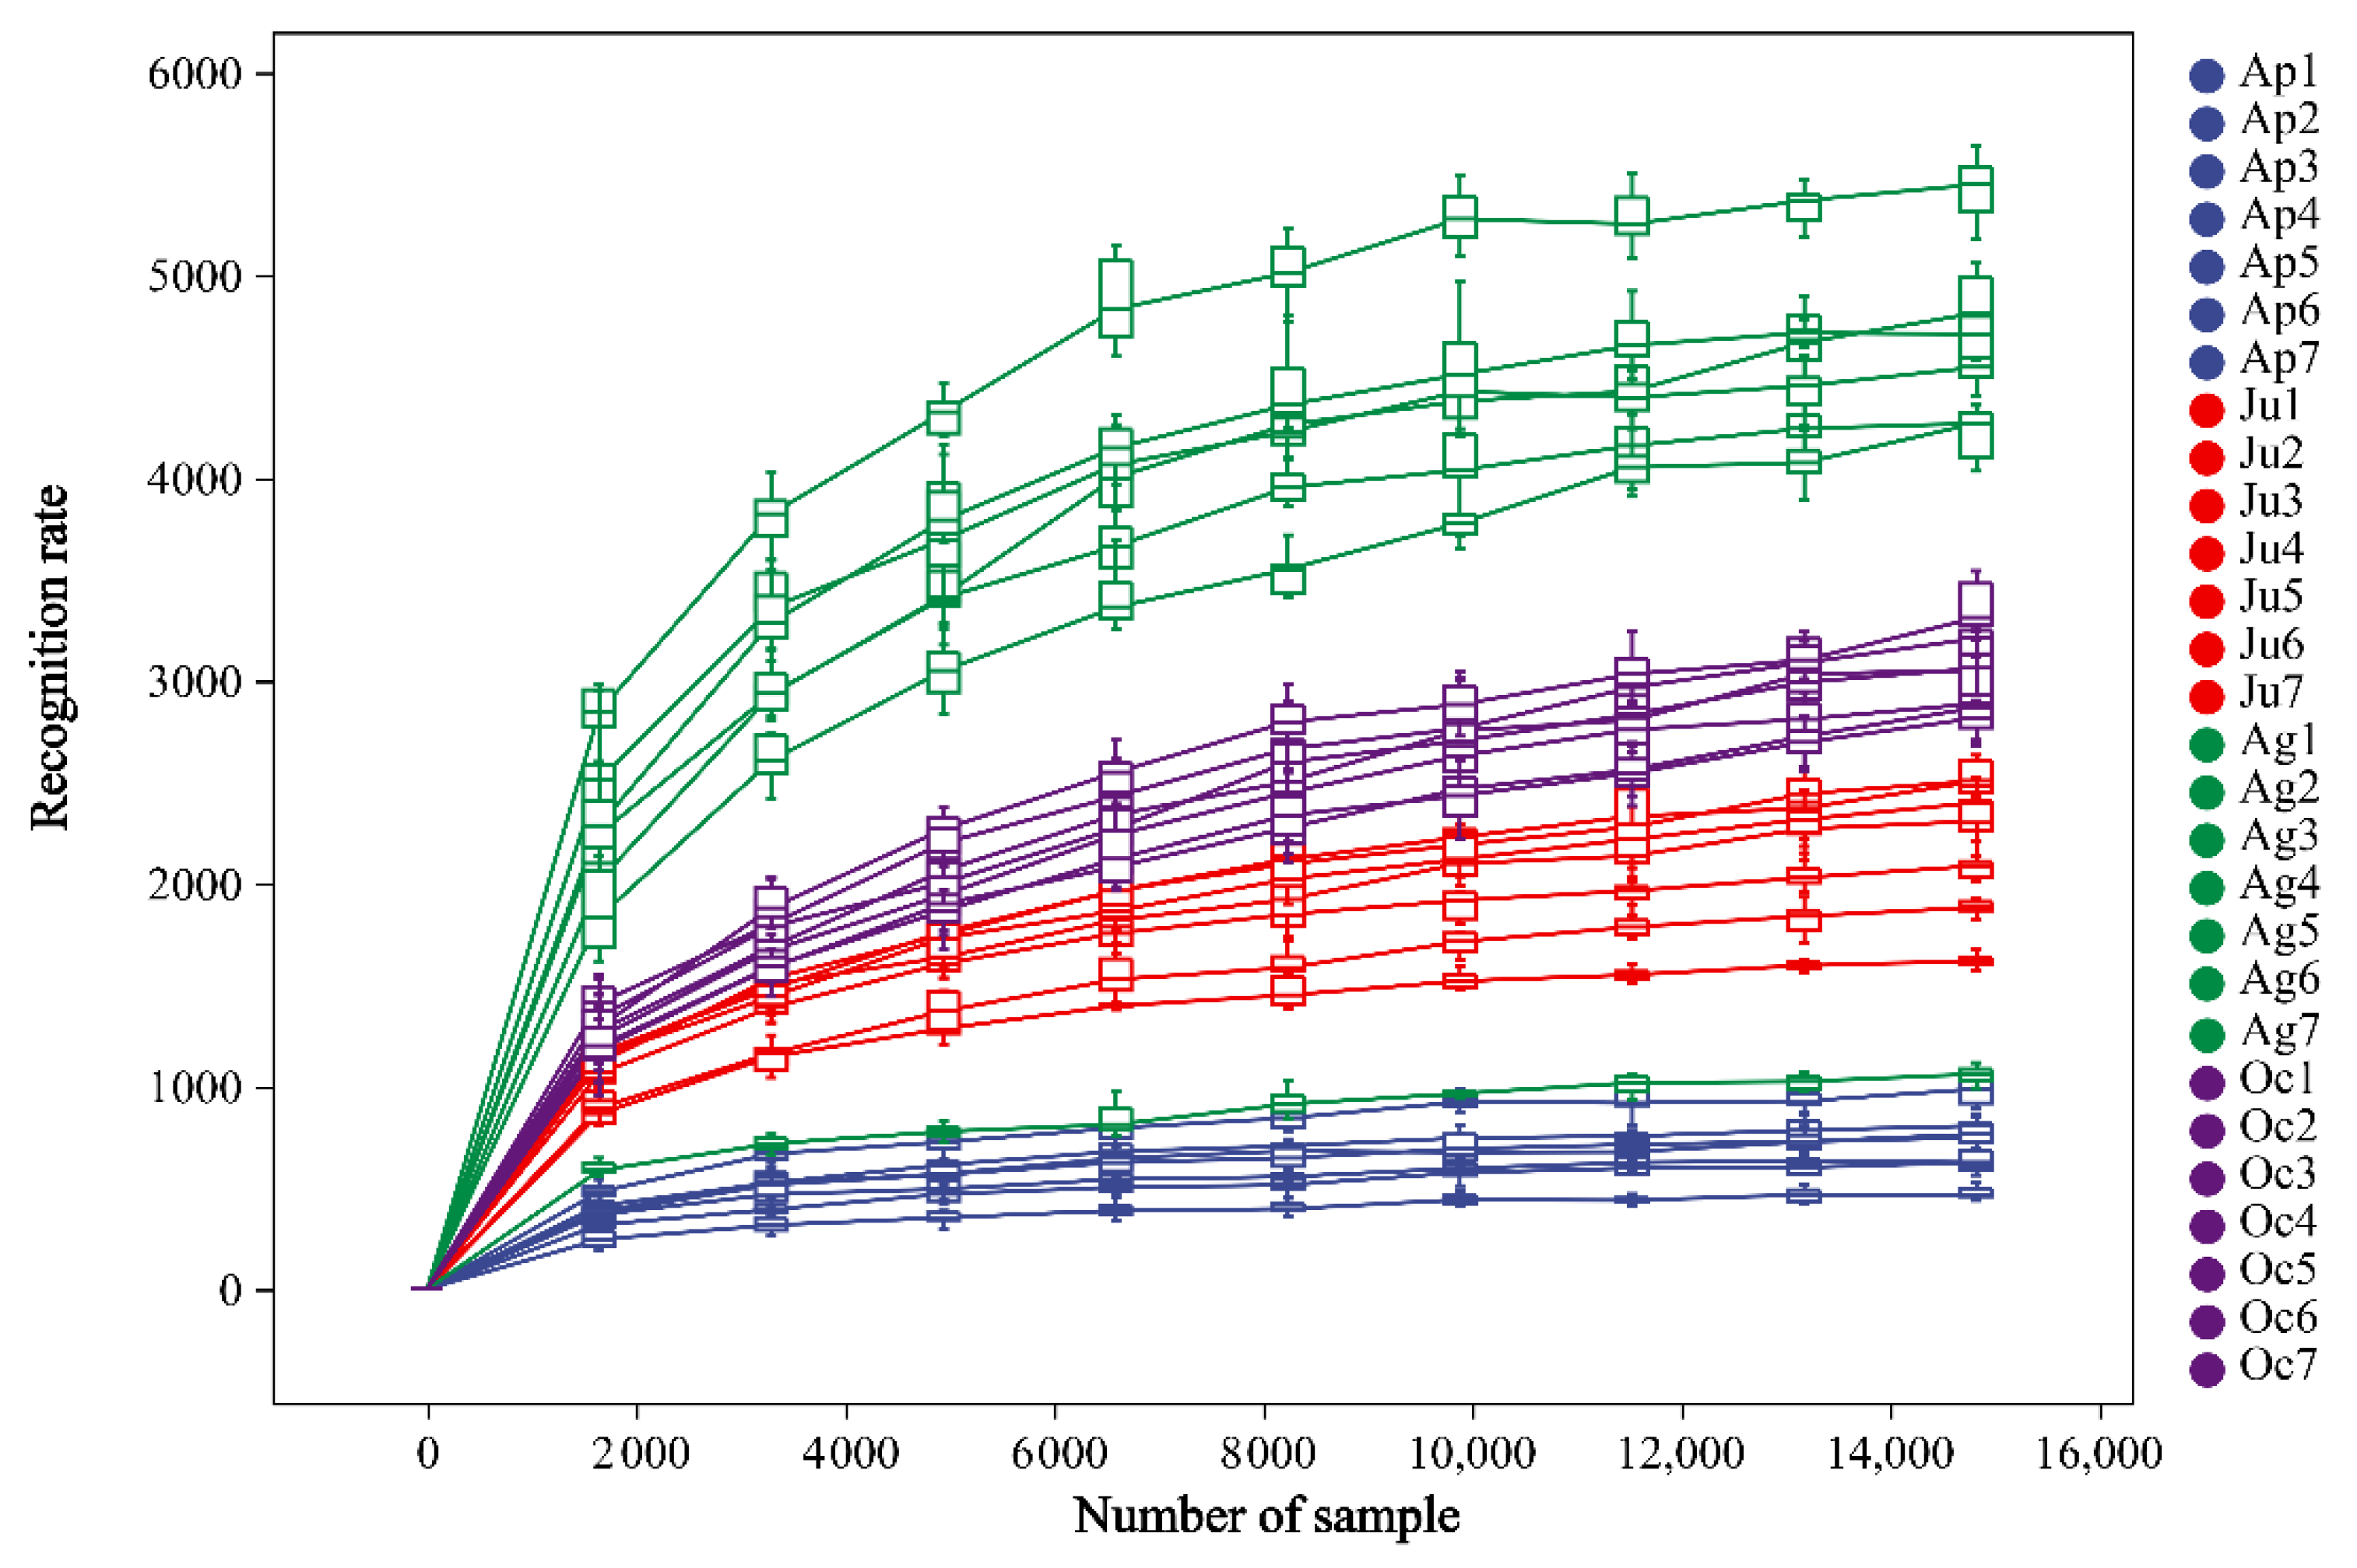
A total of 1,528,091 sequences were obtained by 16S rRNA high-throughput sequencing, including 304,644, 4,512,396, 218,787 and 553,421 sequences in April, June, August and October, respectively, with an average sequence length of 418.38 bp. A total of 33,276 ASVs were identified (97.90% similarity level), with 16,378, 2637, 6260 and 12,113 ASVs in April, June, August and October, respectively, and there were 3455 identical ASVs in 4 months. The ASVs of each group were used to draw a rarefaction curve to evaluate whether the sequencing depth was sufficient (Figure 1). As the number of sample reads increased, the recognition rate of ASVs gradually decreased, and then plateaued, indicating that the sequencing depth was enough to assess the major members of the bacterial community.
2.7. Bioinformatics Analysis
Bioinformatic analysis of the water microbiota was carried out using the Personal Cloud platform (https://www.genescloud.cn/home, accessed on 14 September 2021). Based on the ASVs information, rarefaction curves and alpha diversity indices, including Chao1 richness and Shannon index, were calculated with Mothur v1.30.1 [24]. The Bray–Curtis distance matrix was clustered using the UPGMA algorithm for cluster analysis by default, and the ggtree package was used for visualization. The similarity among the microbial communities in different samples was determined by principal coordinate analysis (PCoA) based on Bray–Curtis dissimilarity using Vegan v2.5-3 package. The PERMANOVA test was used to assess the percentage of variation explained by the treatment along with its statistical significance using Vegan v2.5-3 package. The LDA effect size analysis (LEfSe) [25] (http://huttenhower.sph.harvard.edu/LEfSe, accessed on 14 September 2021) was performed to identify the significantly abundant taxa (phylum and genus) of bacteria among the different groups (LDA threshold > 4, p < 0.05). The redundancy analysis (RDA) was performed using Vegan v2.5-3 package to investigate the effect of water physicochemical factors on bacterial community structure. Linear regression analysis was applied to determine the correlation between major physicochemical factors and microbial alpha diversity indices. The co-occurrence networks were constructed to explore the internal community relationships across the samples [26]. A correlation between two nodes was considered to be statistically robust if the spearman correlation coefficient was over 0.45 or less than −0.45 and the p value < 0.01. The metagenomic function was predicted by PICRUSt2 (Phylogenetic Investigation of Communities by Reconstruction of Unobserved States) [27] based on ASV representative sequences according to protocols of PICRUSt2. MinPath was used to predict gene family profiles and locate into the gene pathways based on PICRUSt2. All data were analyzed on a bio-information cloud computing platform of Personal Biotechnology Co., Ltd. (Shanghai, China).
2.8. Statistic Analysis
The differences of environmental factors and species diversity indexes were analyzed using one-way ANOVA analysis. The analysis was implemented based on SPSS (IBM, Amunk, NY, USA) and R (v26.0.0.0). Corrected p value < 0.05 were considered statistically significant.
3. Results
3.1. Changes in Water Quality
The changes of water quality factors in the YPS are shown in Table 2. During the experiment, the water quality factors changed obviously with seasons. TN and TP concentrations were 1.47 mg/L~1.84 mg/L and 0.14~0.18 mg/L, respectively, which reached the discharge standard of freshwater pond aquaculture water (TP ≤ 1 mg/L, TN ≤ 5 mg/L) [28], indicating the relatively suitable water environment. TP concentration decreased gradually, which led to the gradual increase in N: P in water. The concentration of -N in the CA increased in April (0.95 mg/L) and August (0.94 mg/L), with a range of 0.10~0.95 mg/L. The concentration of -N increased in June (6.68 μg /L) and August (6.39 μg /L), with a range of 3.85~6.68 μg/L. The concentrations of two nitrogen nutrients in the CA were significantly higher than those in the PA (p < 0.05).
3.2. Seasonal Variation of Bacterial Community Richness and Diversity
Table 3 describes the Alpha diversity index of YPS. Chao1 index represents the richness of community. The larger the value is in magnitude, the higher the richness is. Shannon index represents community diversity. The larger the value is in magnitude, the higher the diversity is. During the experiment, the Chao 1 and Shannon values of the PA were higher than those of the CA in the same month (except October), indicating higher richness and diversity of bacterial community in the PA from April to August. The Chao 1 values of the CA and PA in June were 6.87 × 10² and 7.44 × 10², respectively, and the Shannon values of the CA and PA in June were 5.10 and 5.36, respectively, which were lower than those in other months. This result showed that the richness and diversity of bacterial community decreased in June.
3.3. Differences in Microbial Communities
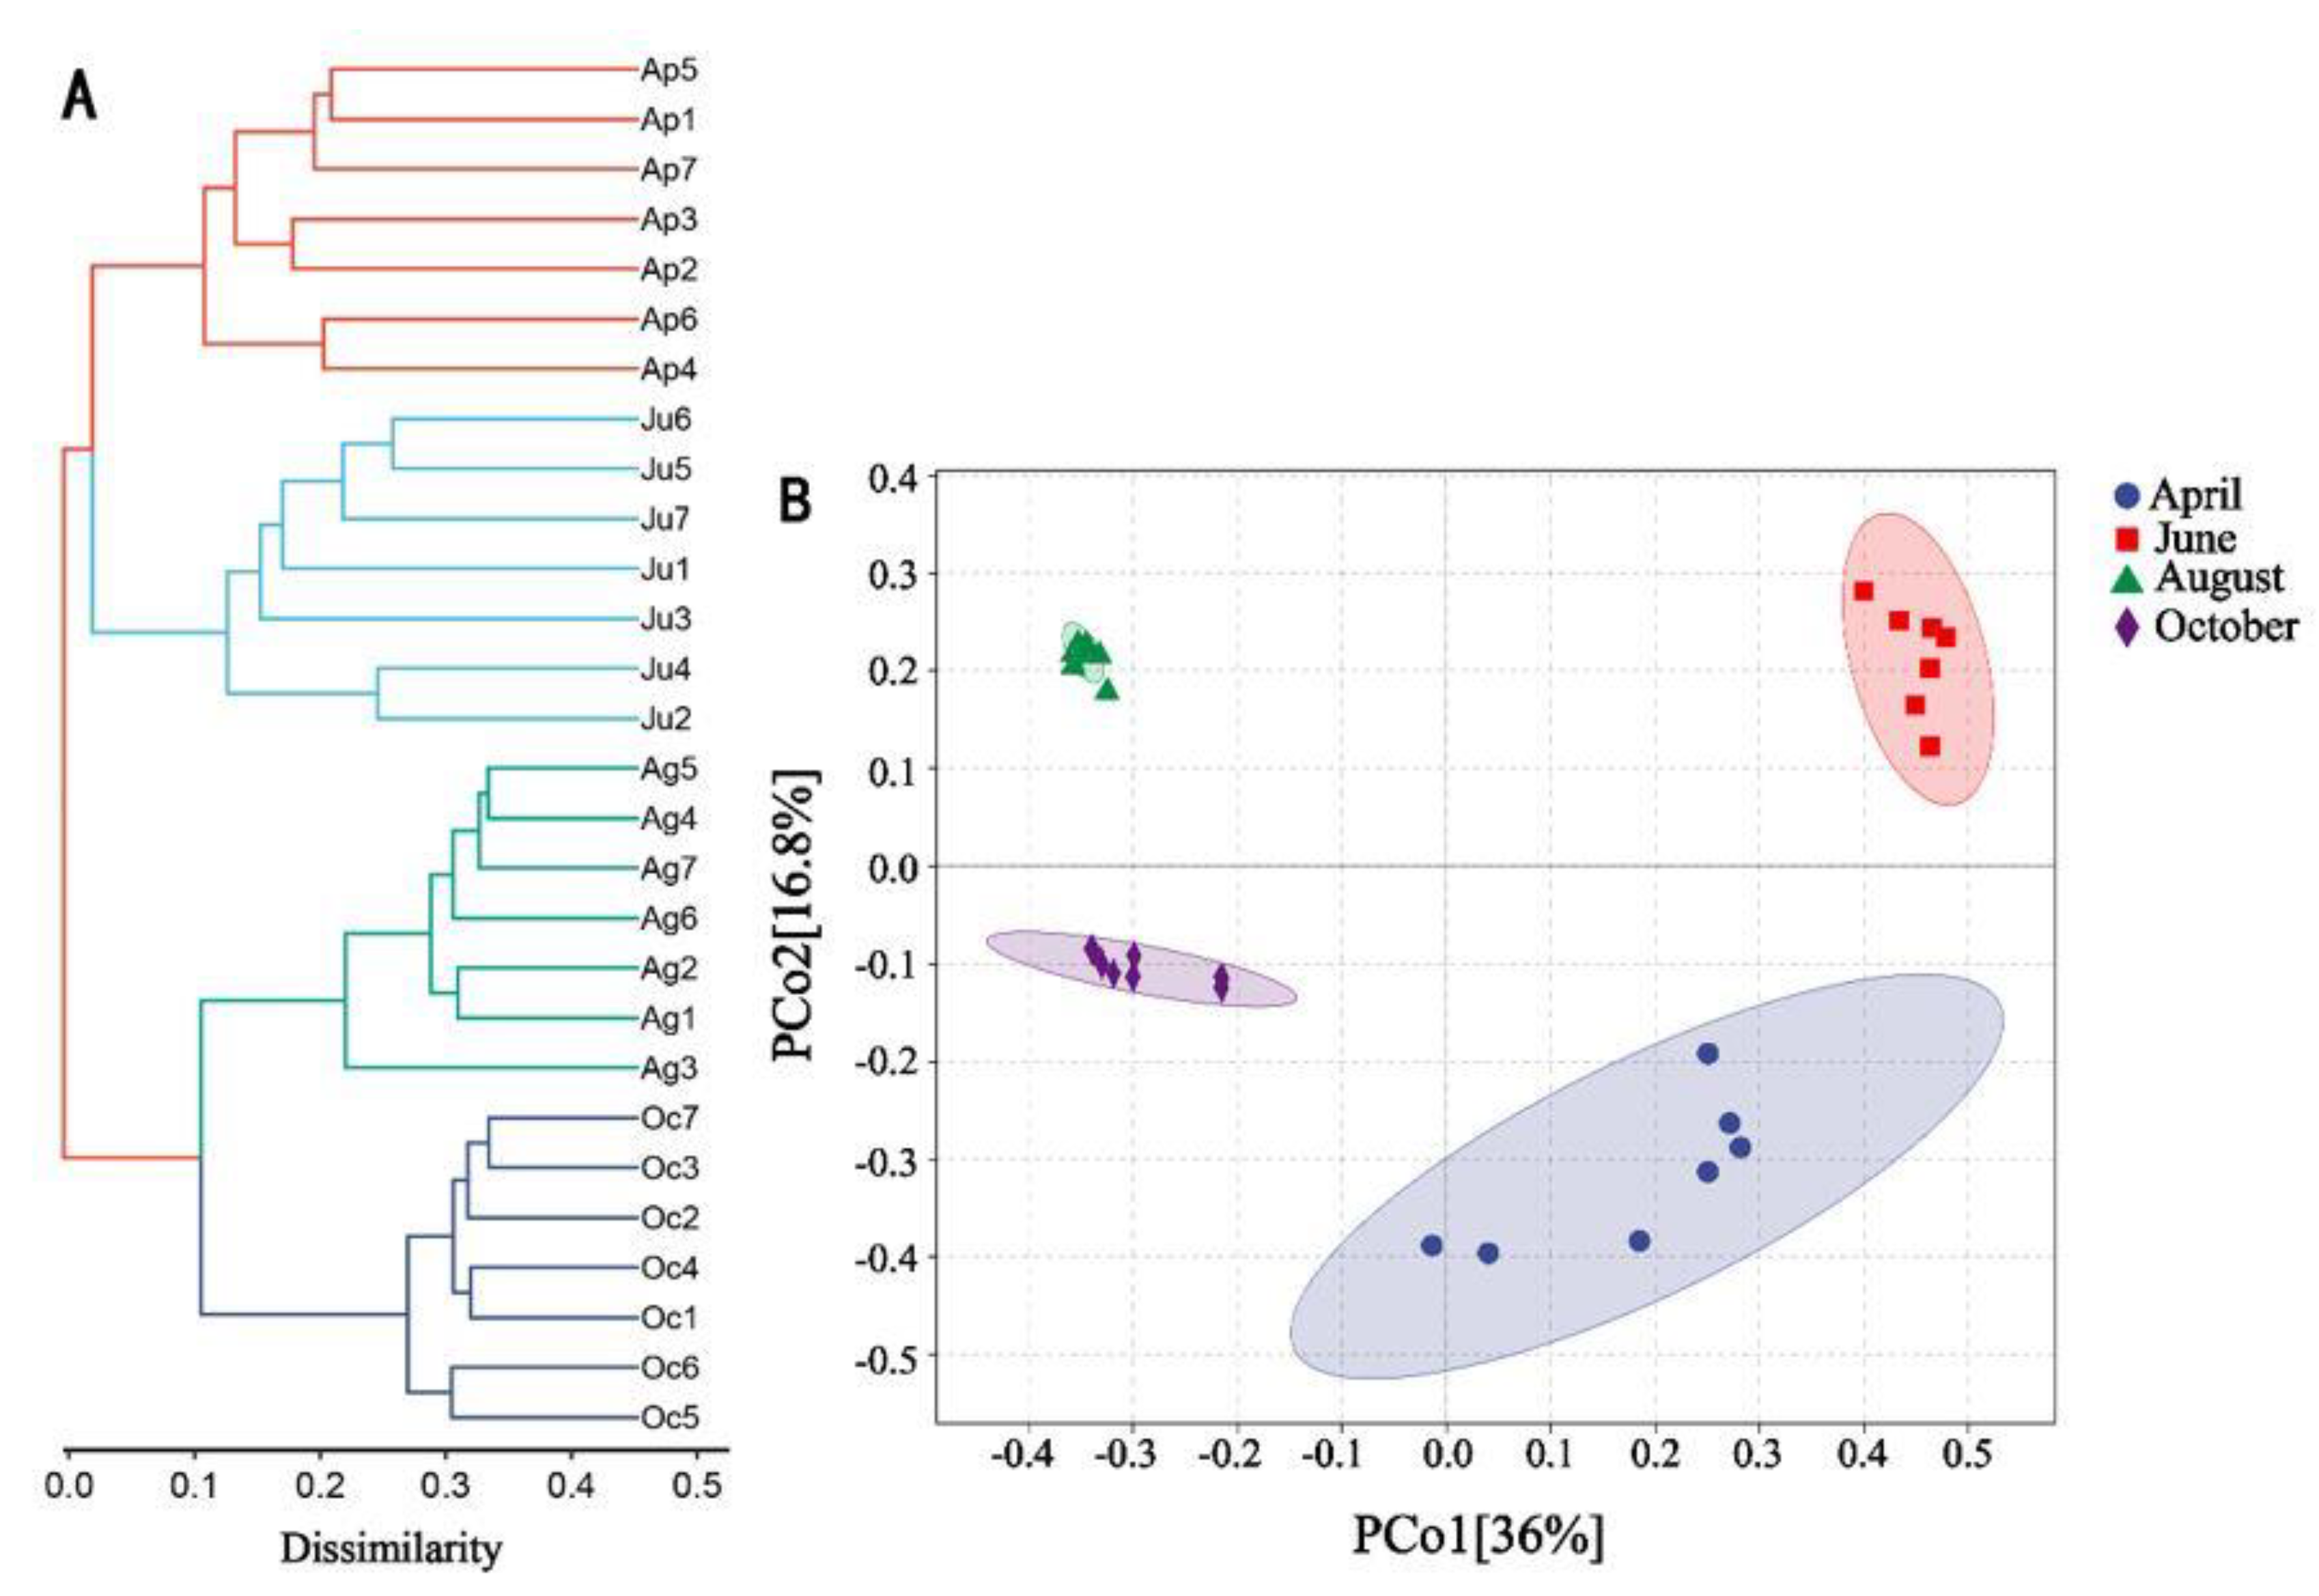
In order to investigate the differences of the bacterial community among different samples, hierarchical clustering analysis was carried out at the genus level (Figure 2A). The results showed that the bacterial community exhibited four main branches at the genus level, and the samples in the same month clustered. There were no obvious composition differences of bacterial community between the CA and PA. The results of PCoA showed that the samples were mainly divided into four similar communities, and the distance between samples in different months was far away, which was consistent with the results of hierarchical clustering analysis. In August and October, the convergence degree of samples in the direction of Pco1 (contribution rate 36%) and Pco2 (contribution rate 16.8%) was high, which indicated the high similarity of bacterial community structure in this period. In April and June, the convergence degree of samples was low, indicating low similarity (Figure 2B).
3.4. Seasonal Variation of Bacterial Community Composition
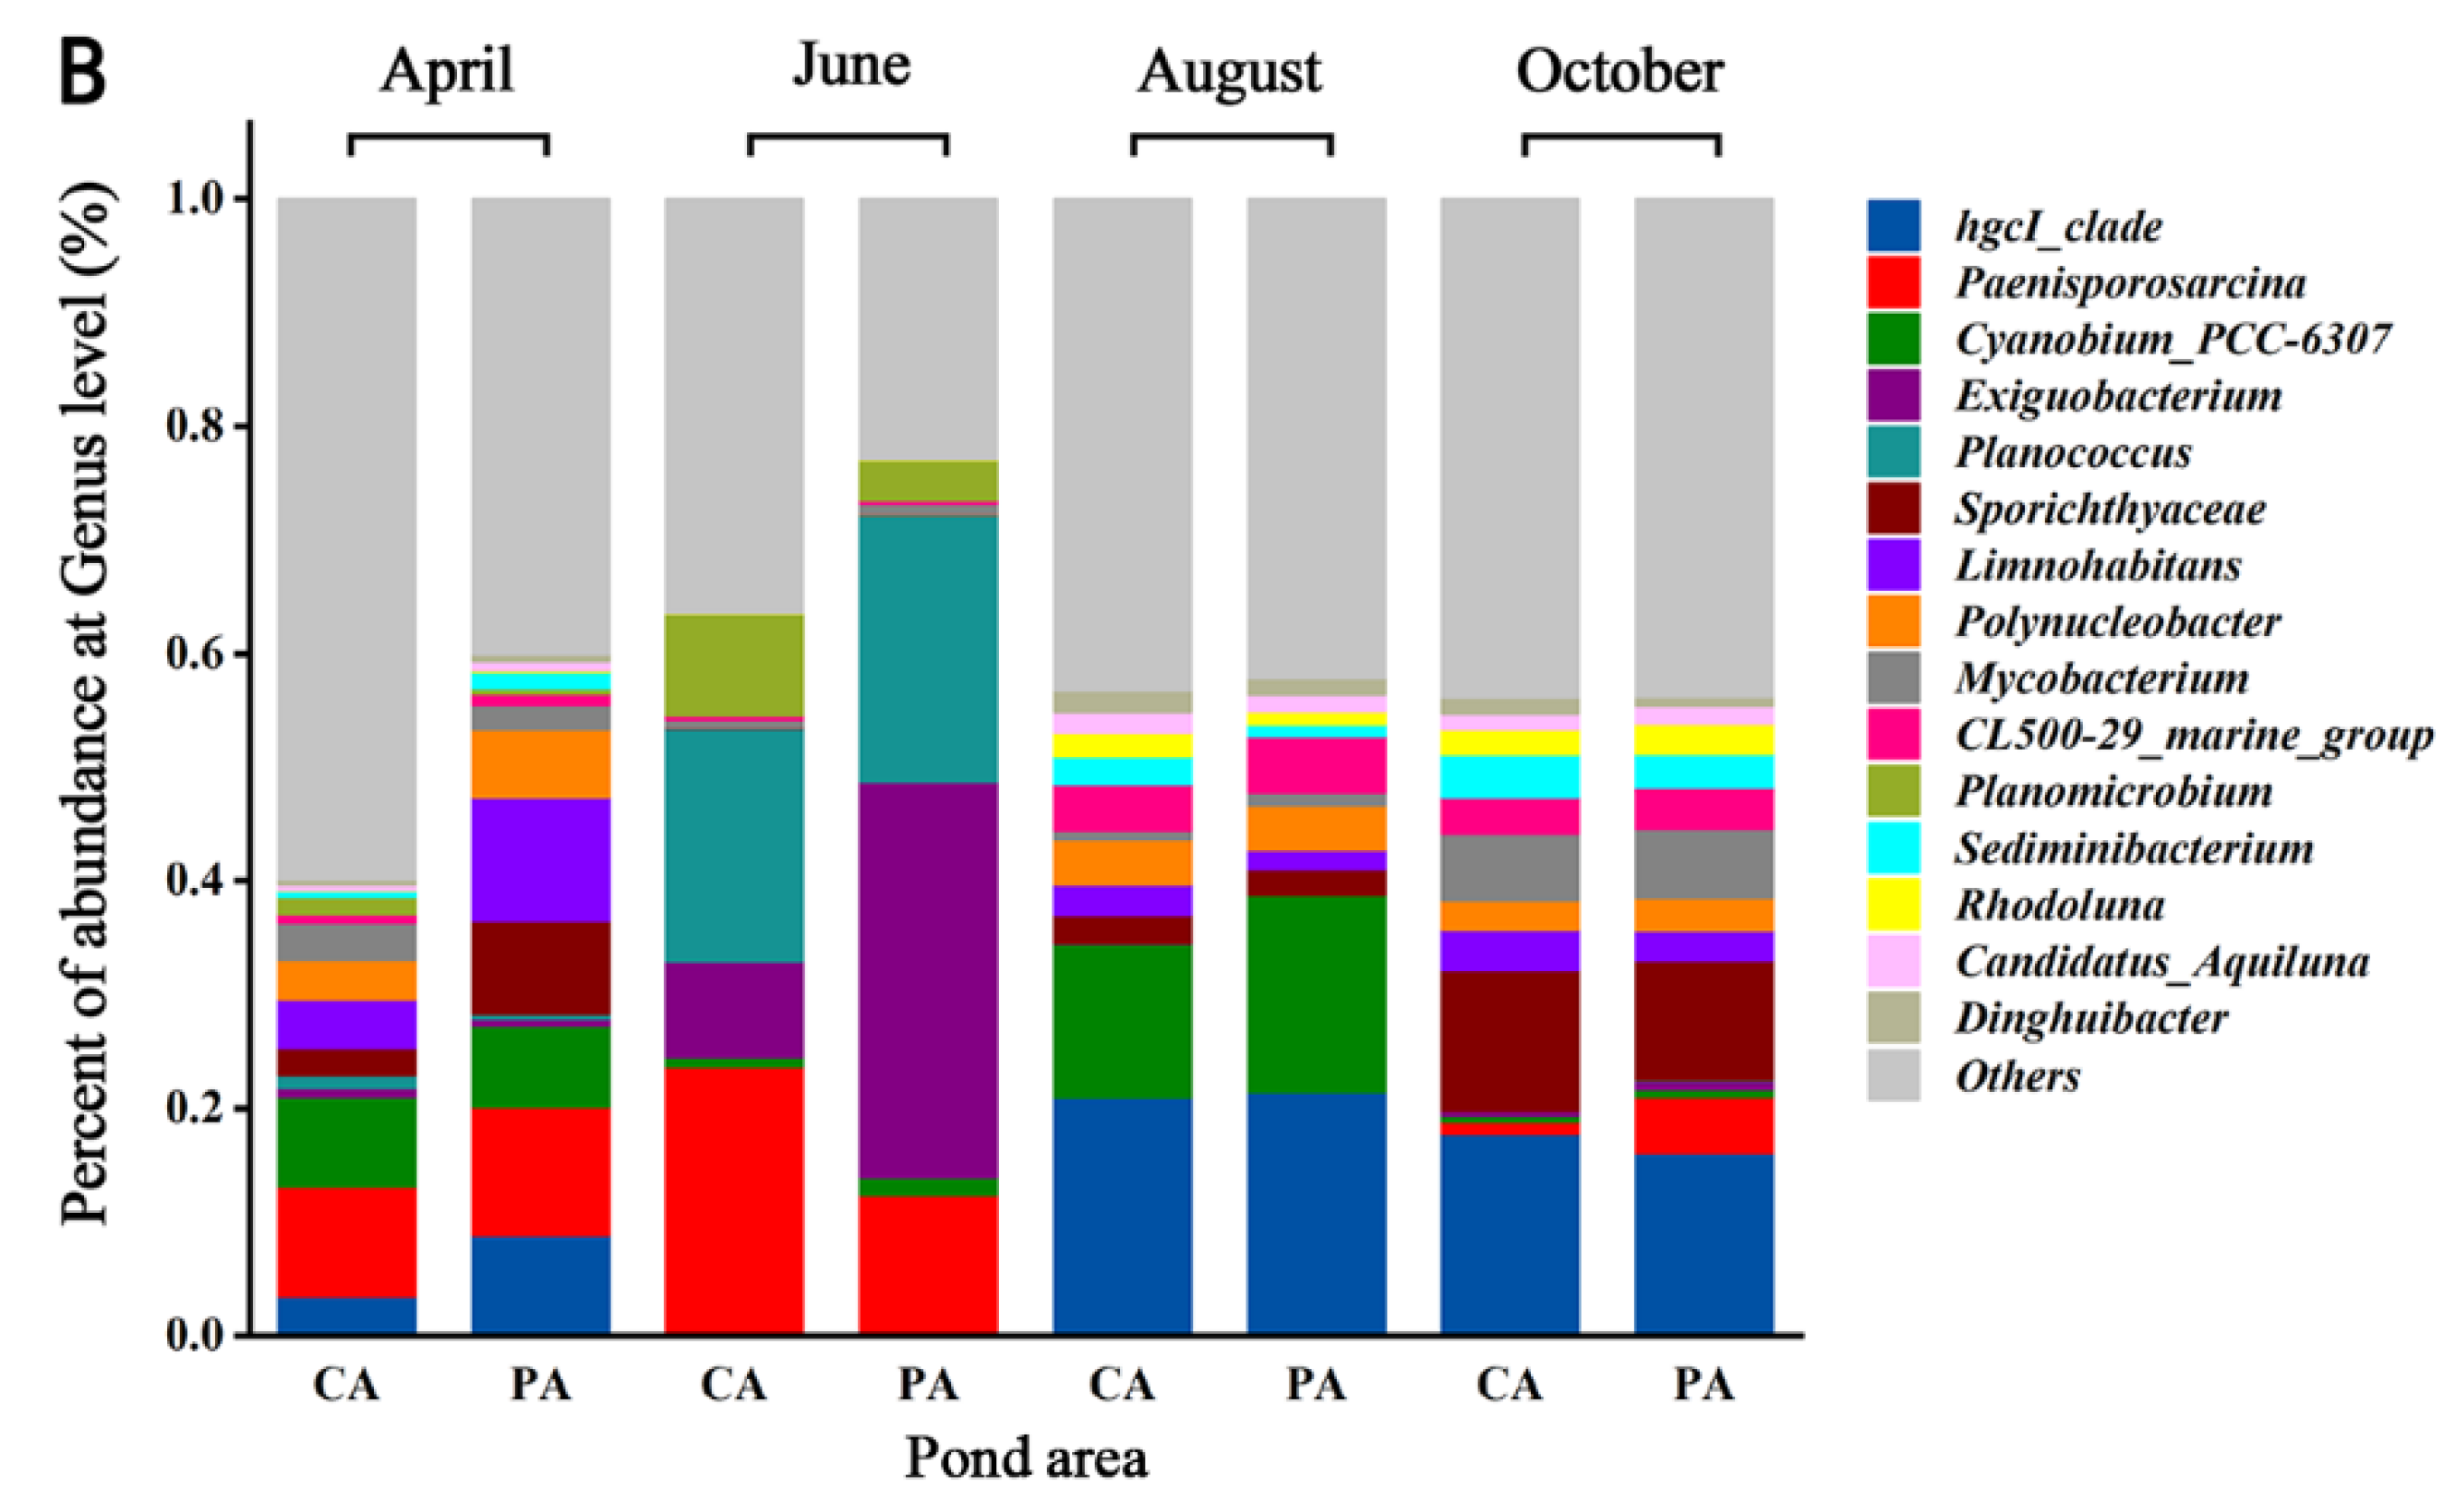
Figure 3 describes the changes in the abundance of bacterial communities in the YPS. The abundance of Actinobacteria (35.68%), Firmicutes (24.58%), Proteobacteria (23.49%) and Bacteroidetes (6.59%) in the CA and PA was relatively high and they were dominant phyla (Figure 3A). At the genus level, the abundance of genus in the two regions changed obviously, and there were seasonal differences in the dominant genera (Figure 3B).
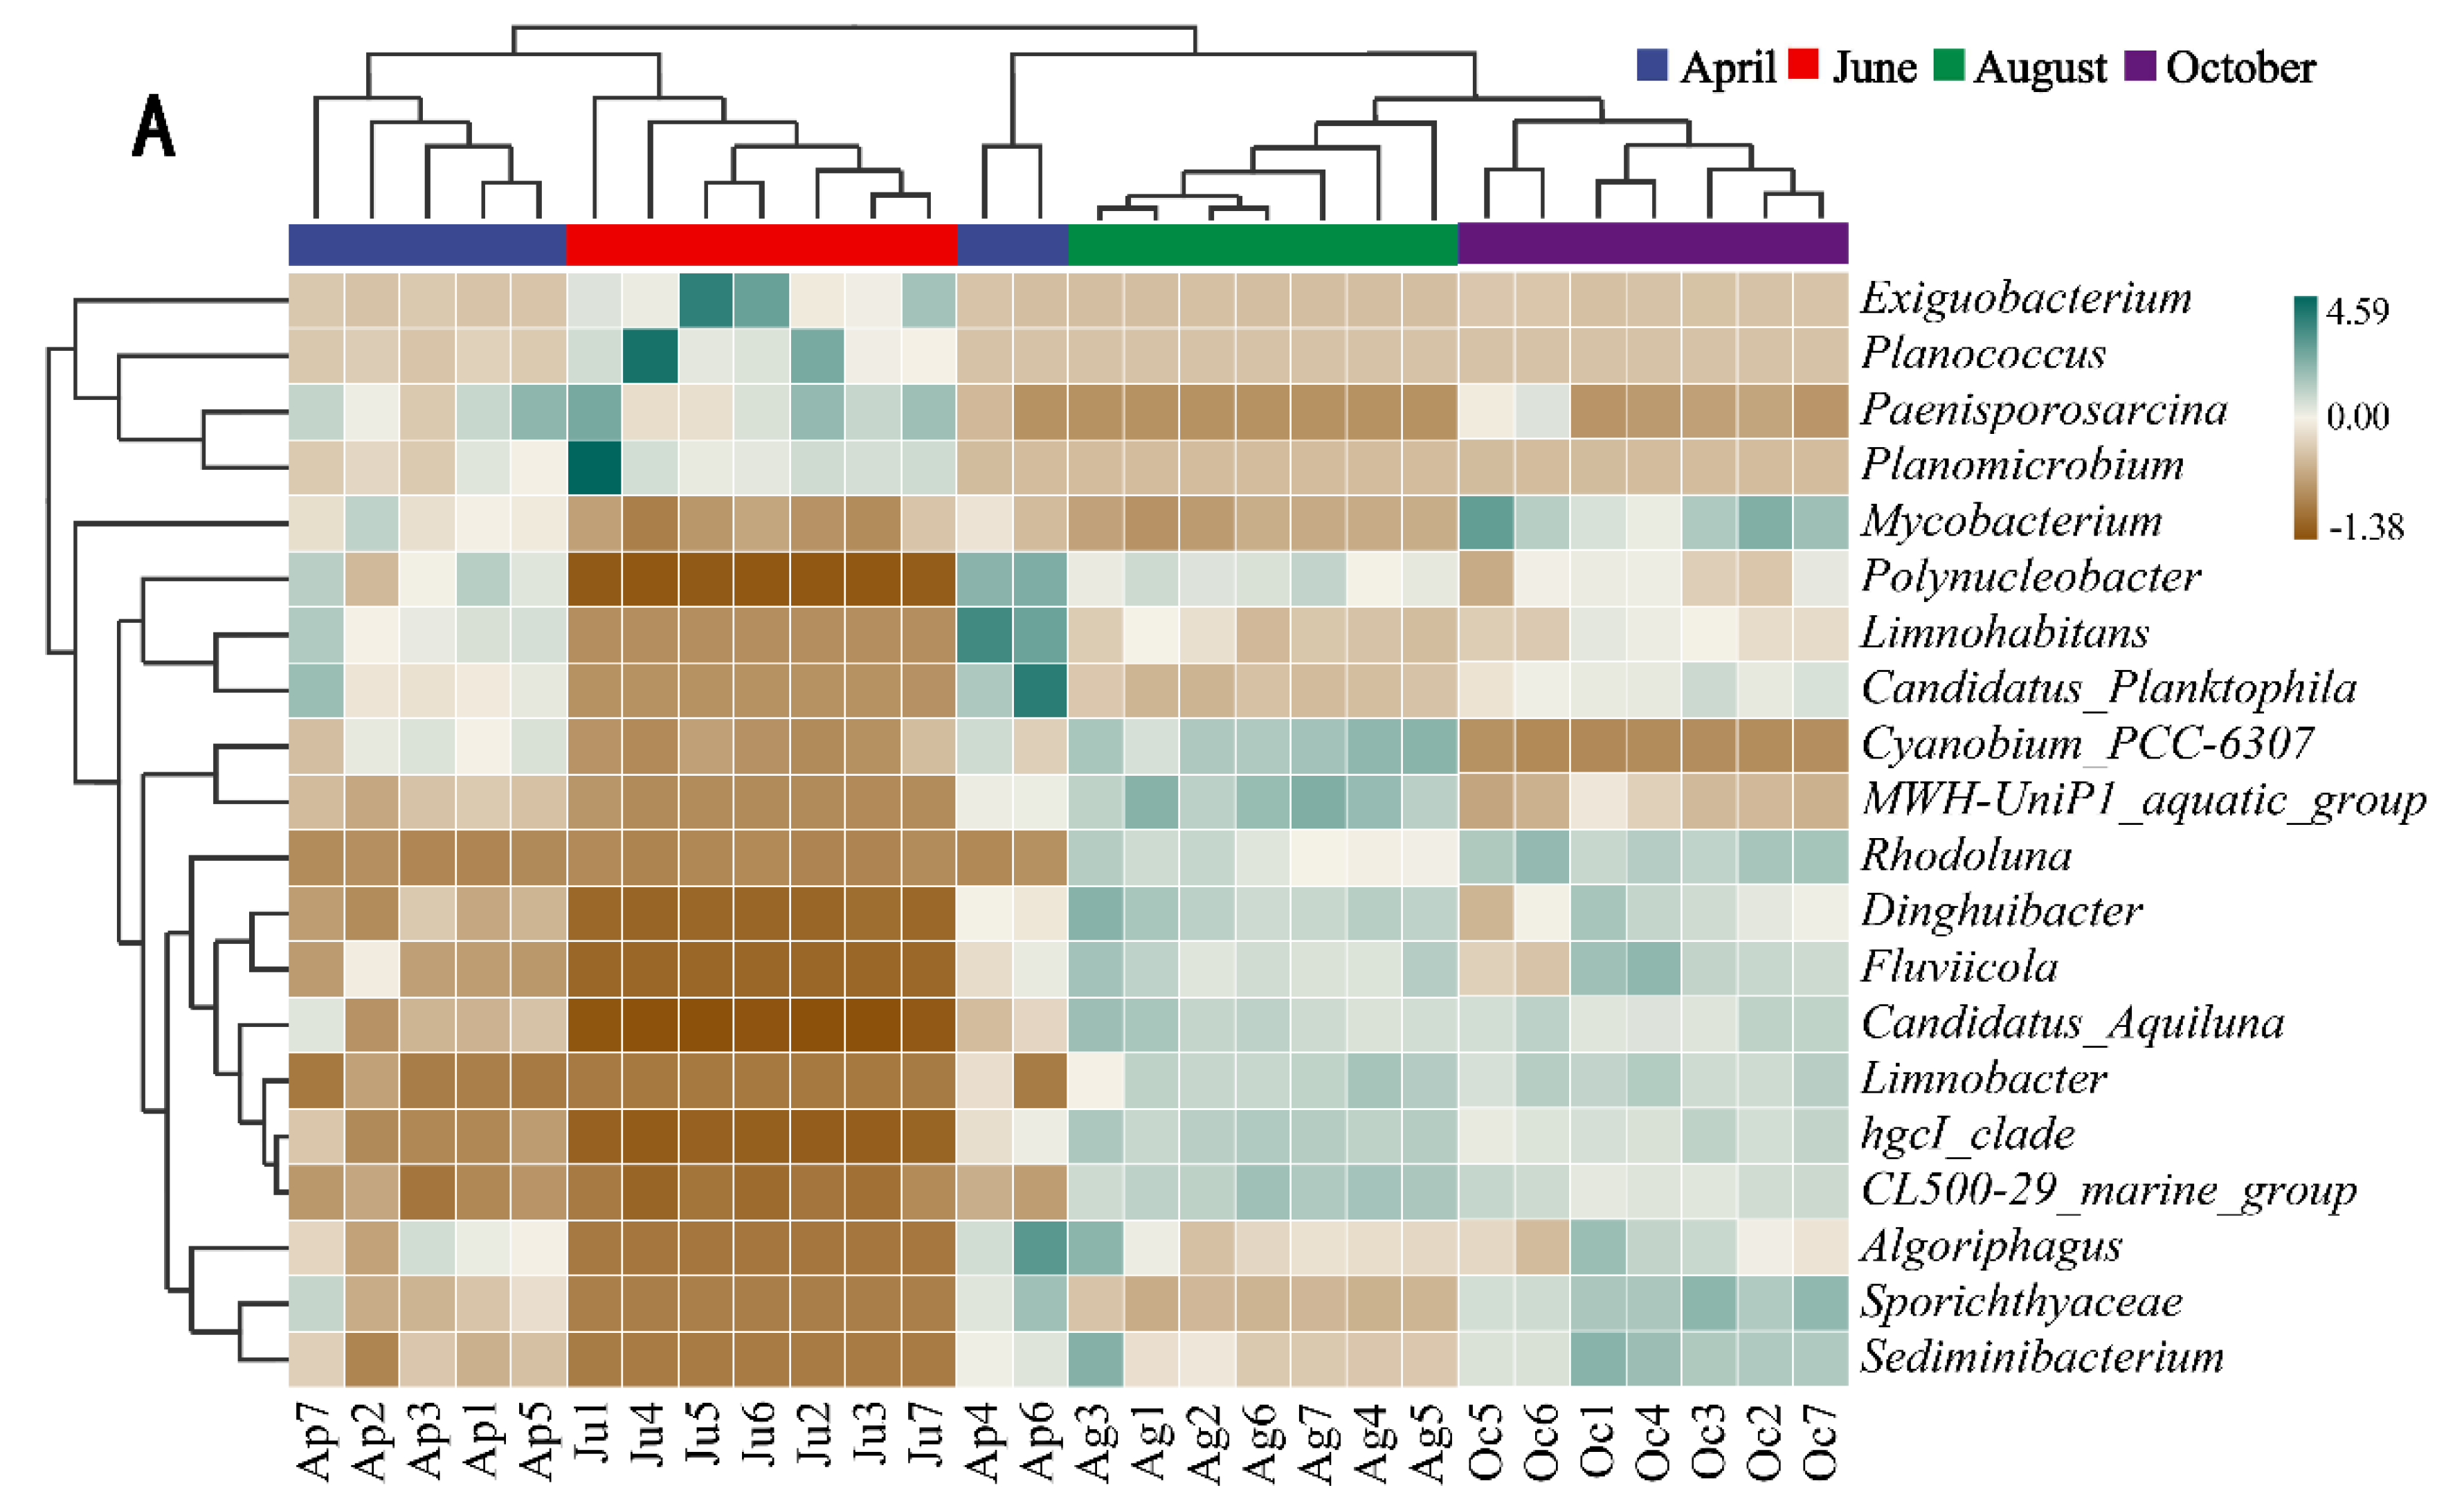
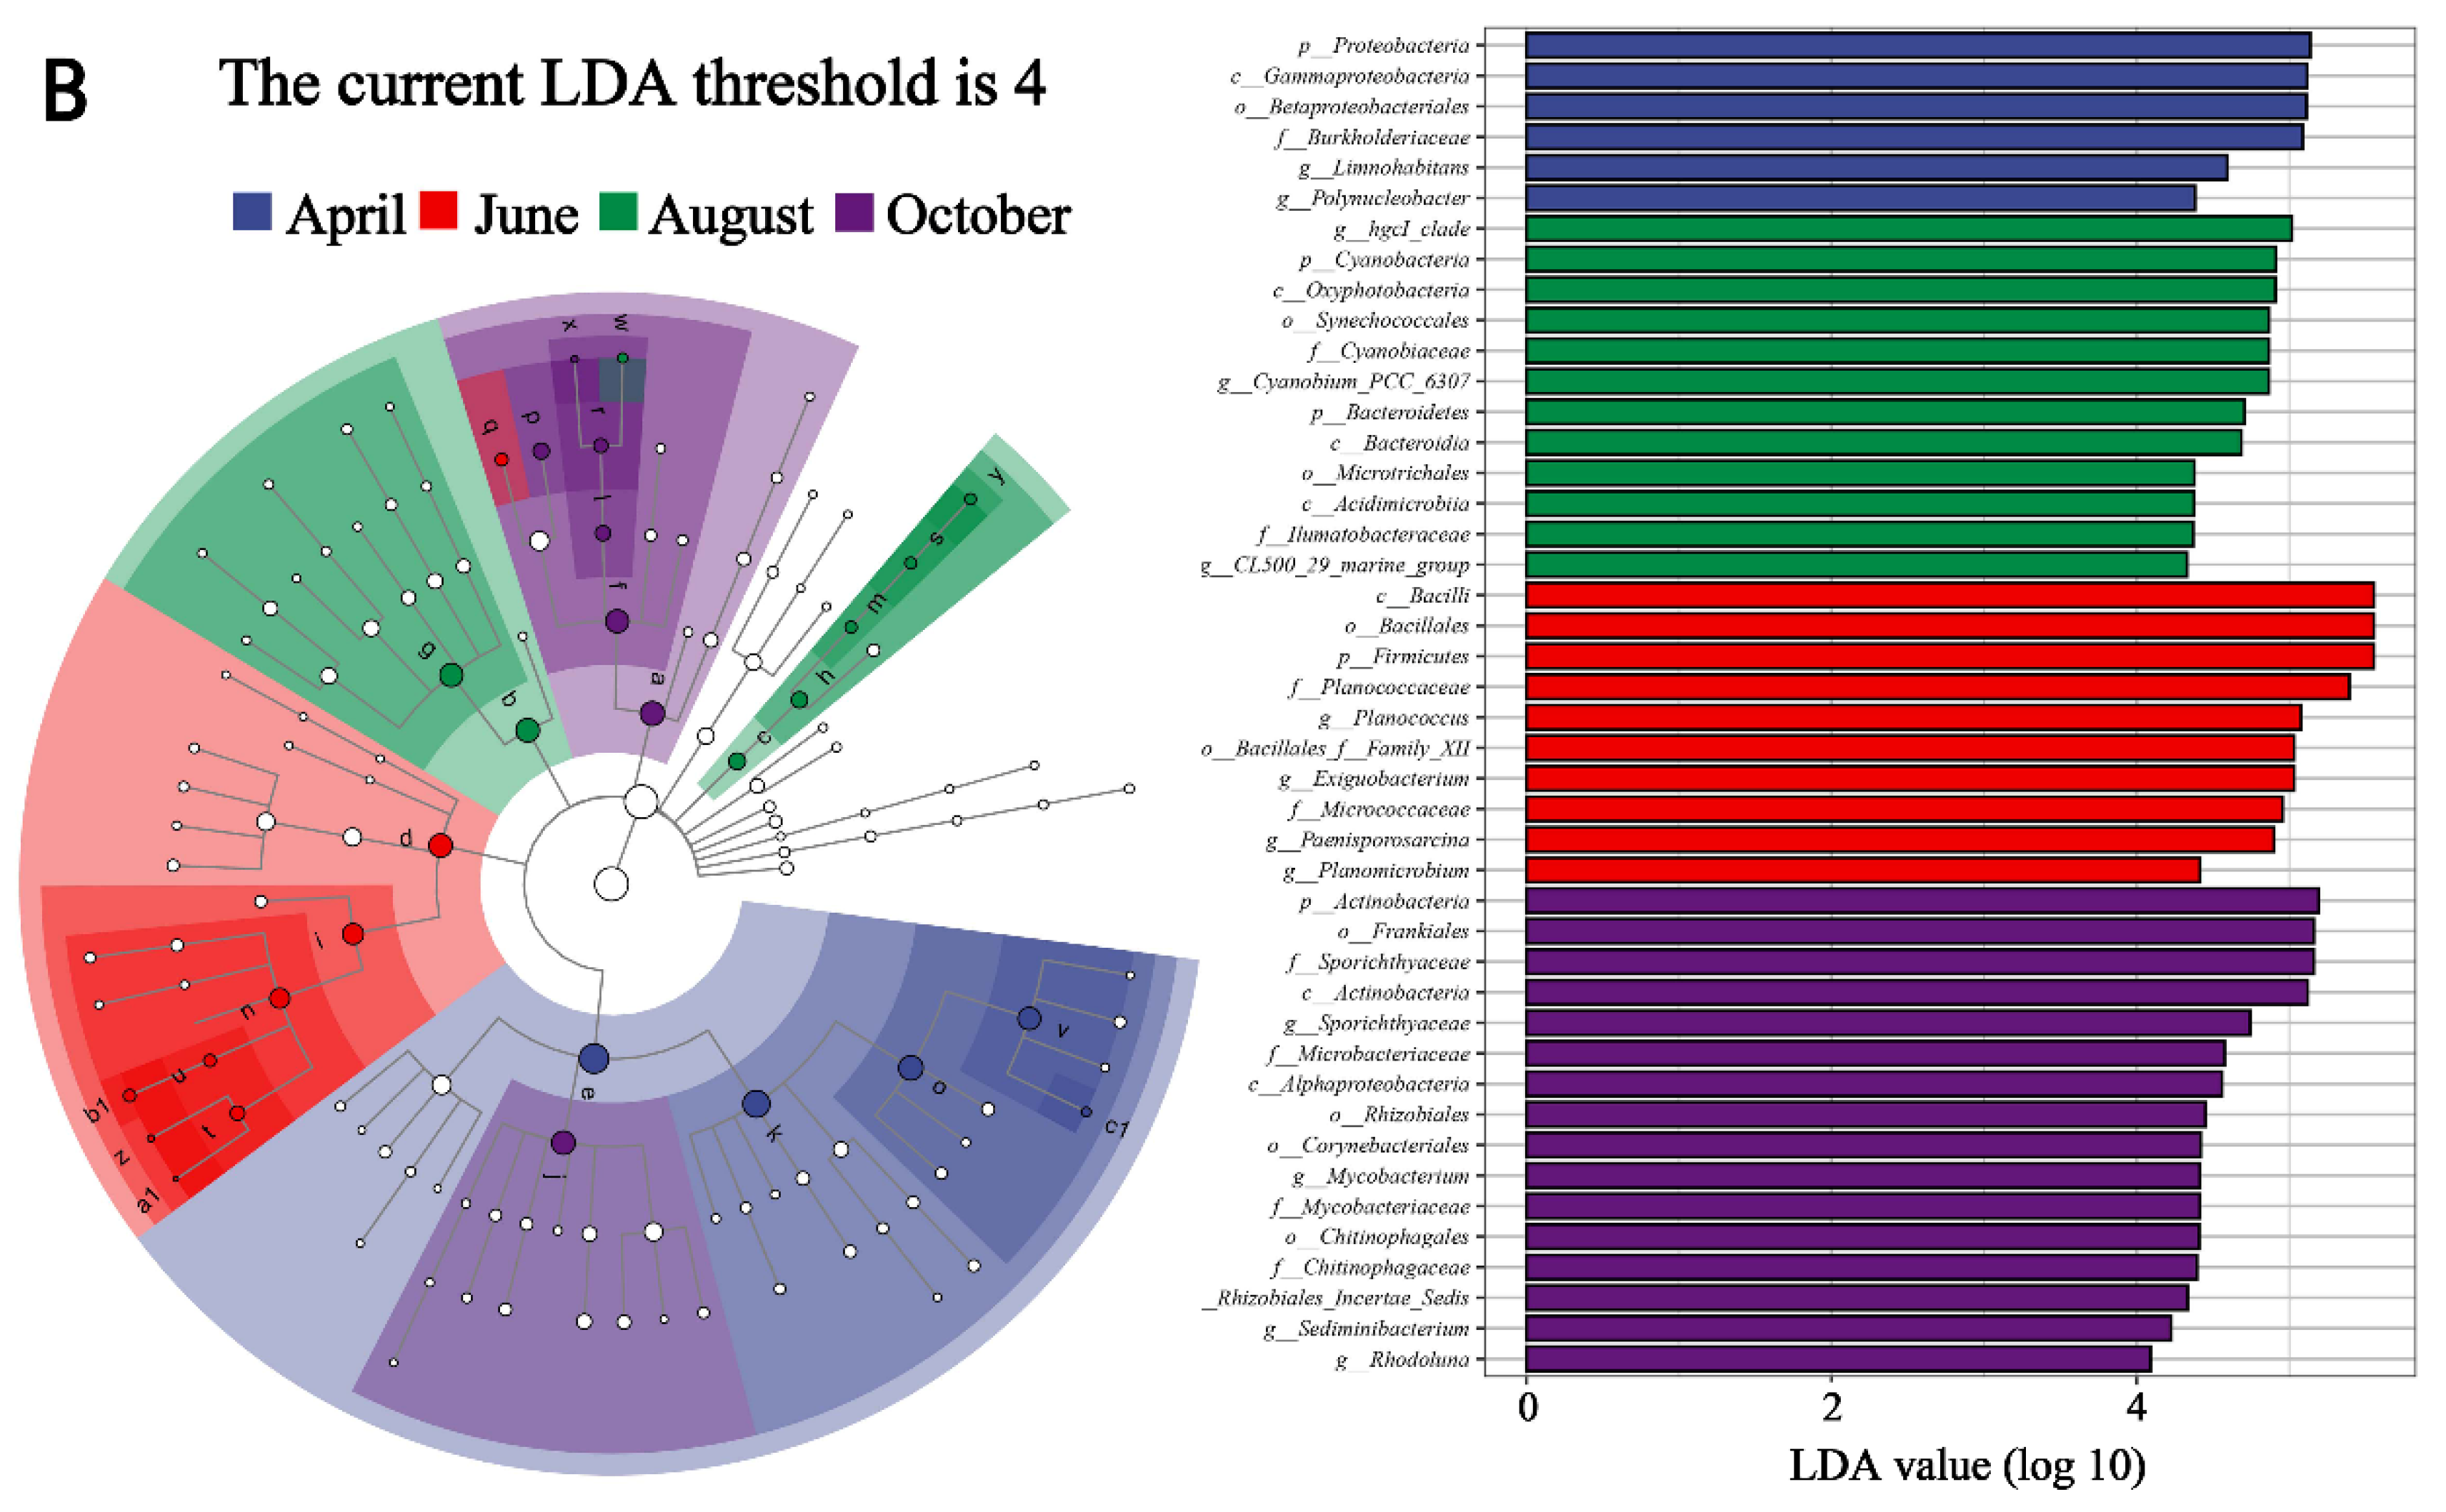
In order to further investigate the seasonal variation of dominant genera, a thermal map of genus abundance was shown (Figure 4A), and the LefSe analysis was carried out. The higher the LDA value was in magnitude, the greater the difference was (Figure 4B). The results showed that Limnohabitans was the dominant genus in April with a high LDA value. The abundance of Limnohabitans increased significantly (8.01%), but then decreased. In June, Exiguobacterium (23.44%), Planococcus (22.27%), Paenisporosarcina (16.81%) and Planomicrobium (5.85%) were the dominant genera. The abundance of them increased. In August, the abundance of hgcI_clade (21.84%) and CL500_29_marin_group (4.61%) increased, and they were the dominant genera. The abundance of Exiguobacterium, Planococcus, Paenisporosarcina and Planomicrobium decreased significantly, with high LDA values. In October, the abundance of Sporichthyaceae (11.31%) and Sediminibacterium (3.32%) increased significantly with high LDA values, and they became dominant genera together with hgcI_clade and CL500_29_marin_group.
3.5. Relationship between Bacterial Community and Physicochemical Factors
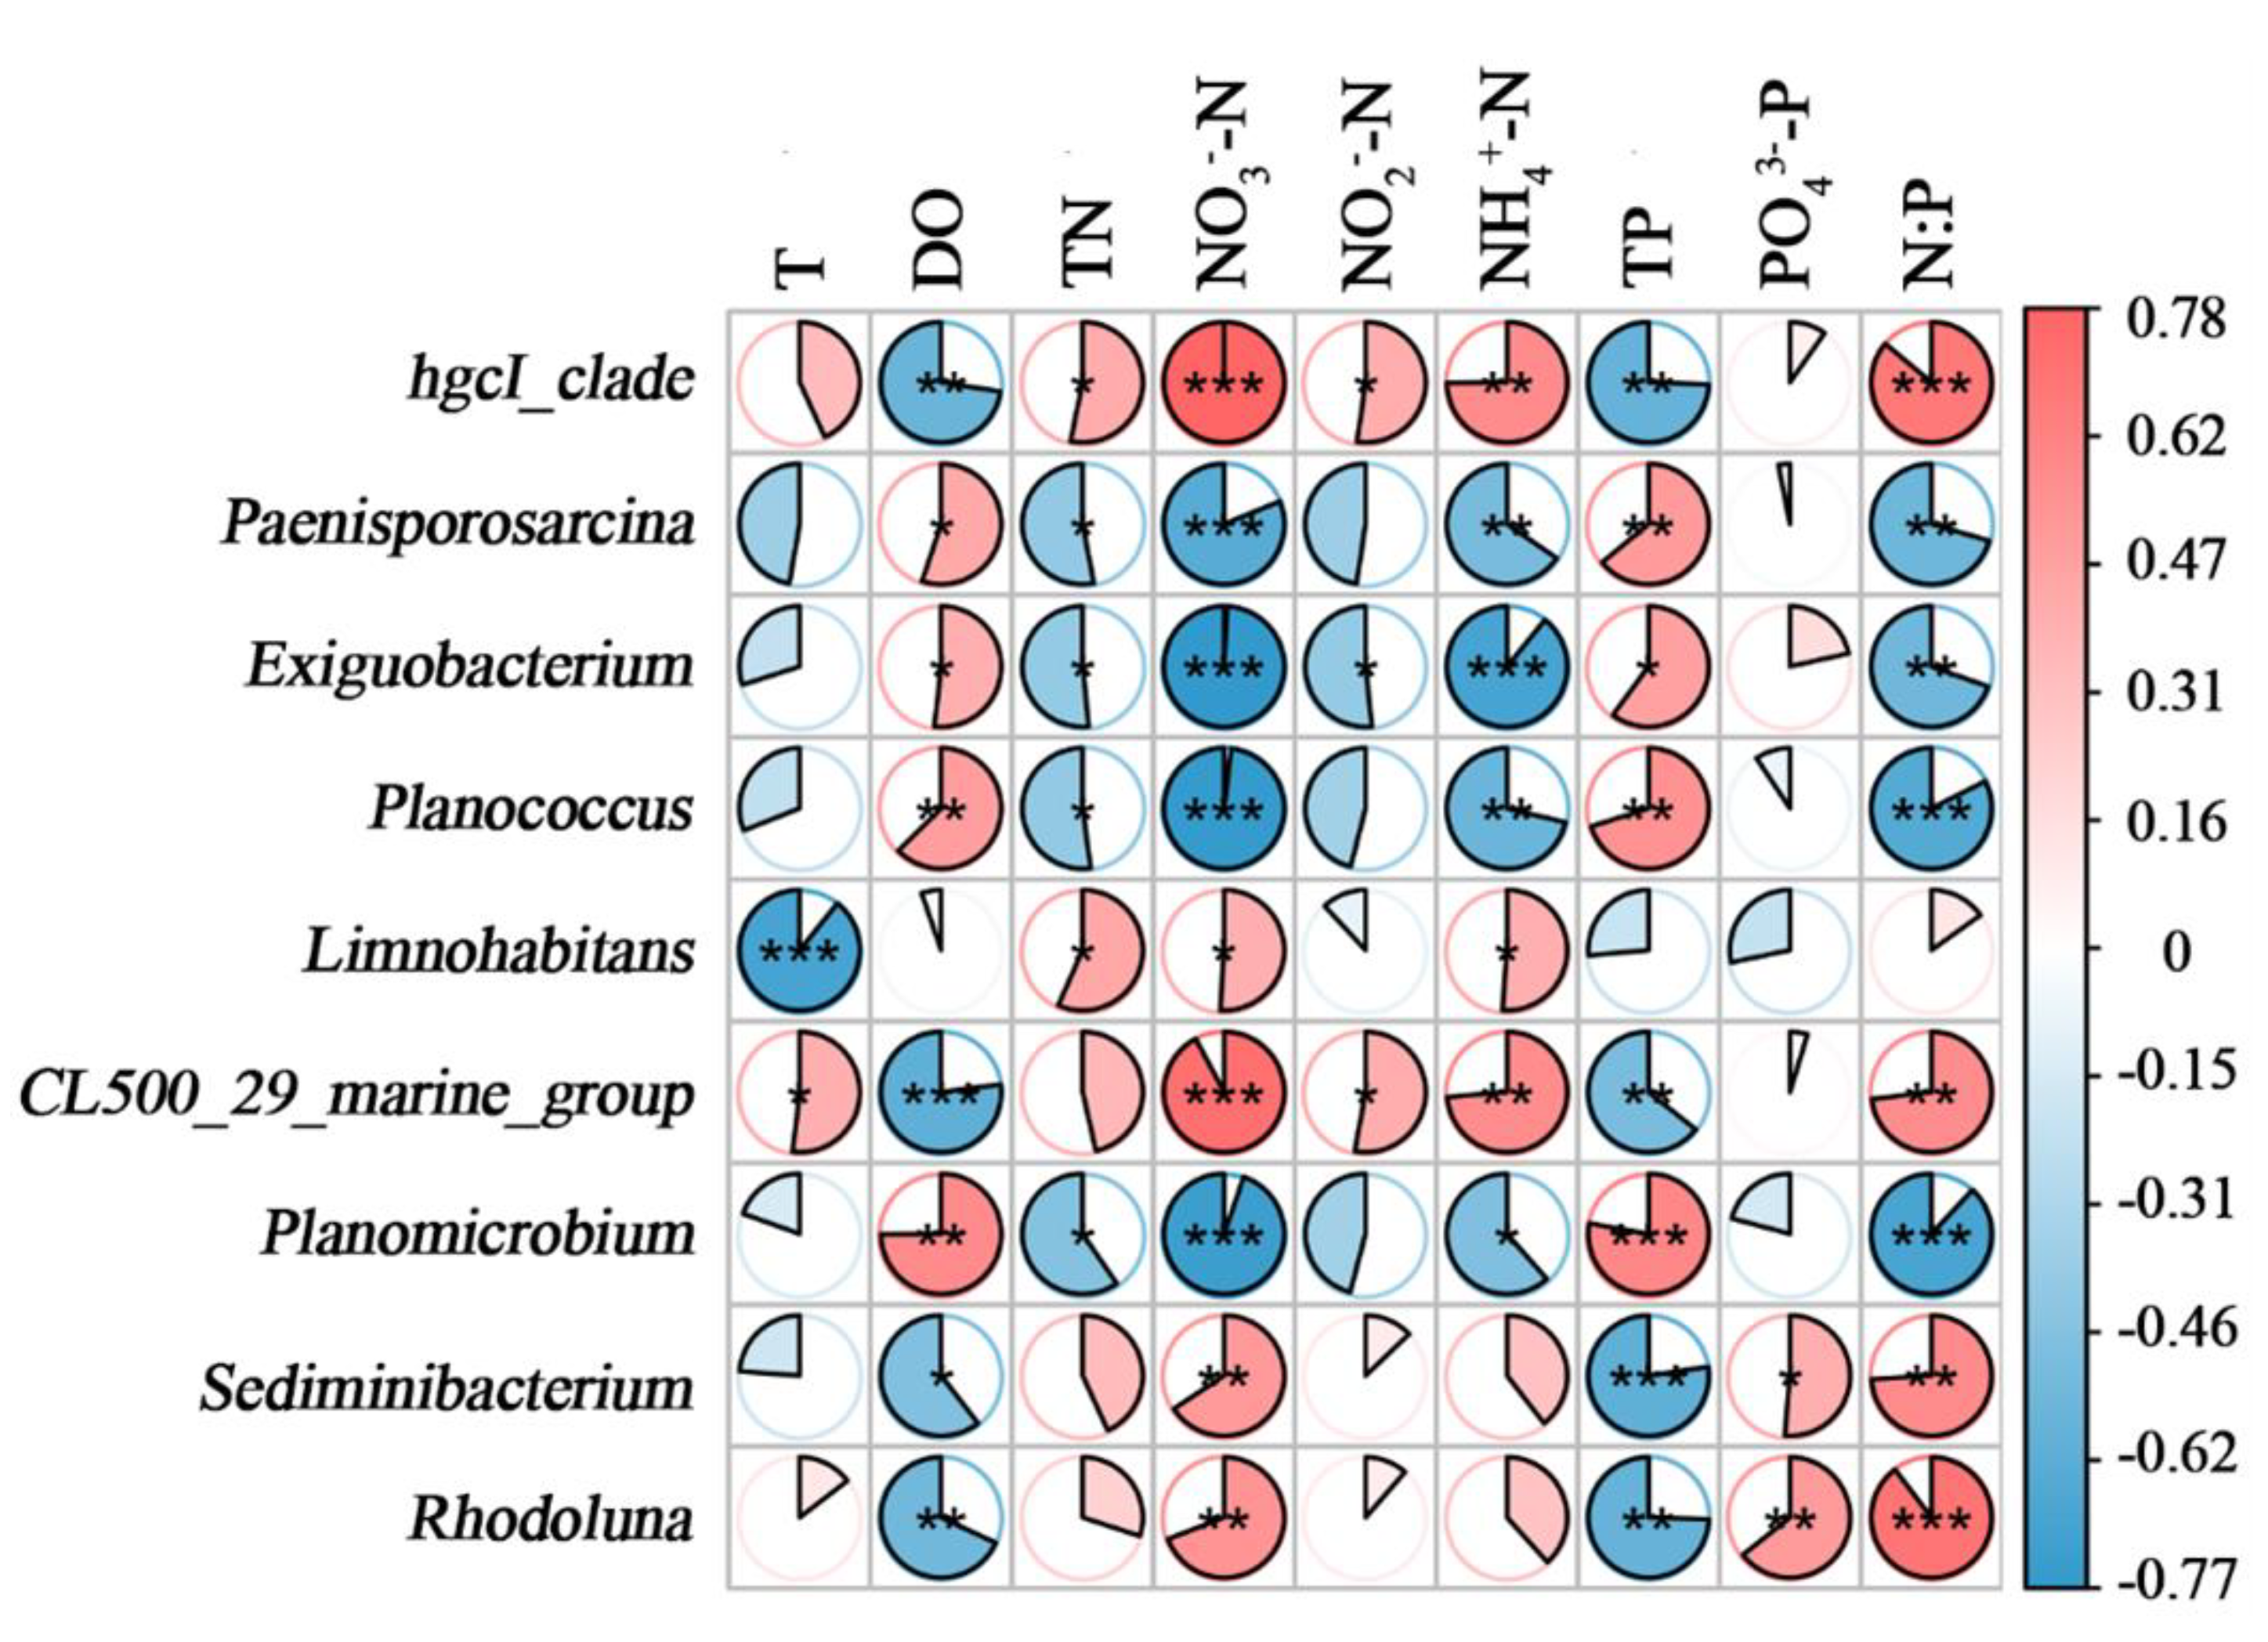
The bacterial community is easily affected by the environment. It is helpful to understand the influence of environment on the bacterial community by the correlation analysis between bacterial community and physicochemical factors of water body. In this study, the correlation between 9 genera with significant differences in abundance and physicochemical factors of water was analyzed (Figure 5). -P had no significant correlation with genera (except Sediminibacterium and Rhodoluna). Exiguobacterium, Planococcus, Paenisporosarcina and Planomicrobium were negatively correlated with -N, -N, -N, TN and N:P, and positively correlated with DO. HgcI_clade and CL500_29_marin_group were positively correlated with -N, -N, -N, TN, and negatively correlated with DO and TP. Limnohabitans were positively correlated with TN, -N, -N, and negatively correlated with T. Sediminibacterium, Rhodoluna were positively correlated with -N, N:P, and negatively correlated with DO, TP.
3.6. Bacterial Community Functional Analysis
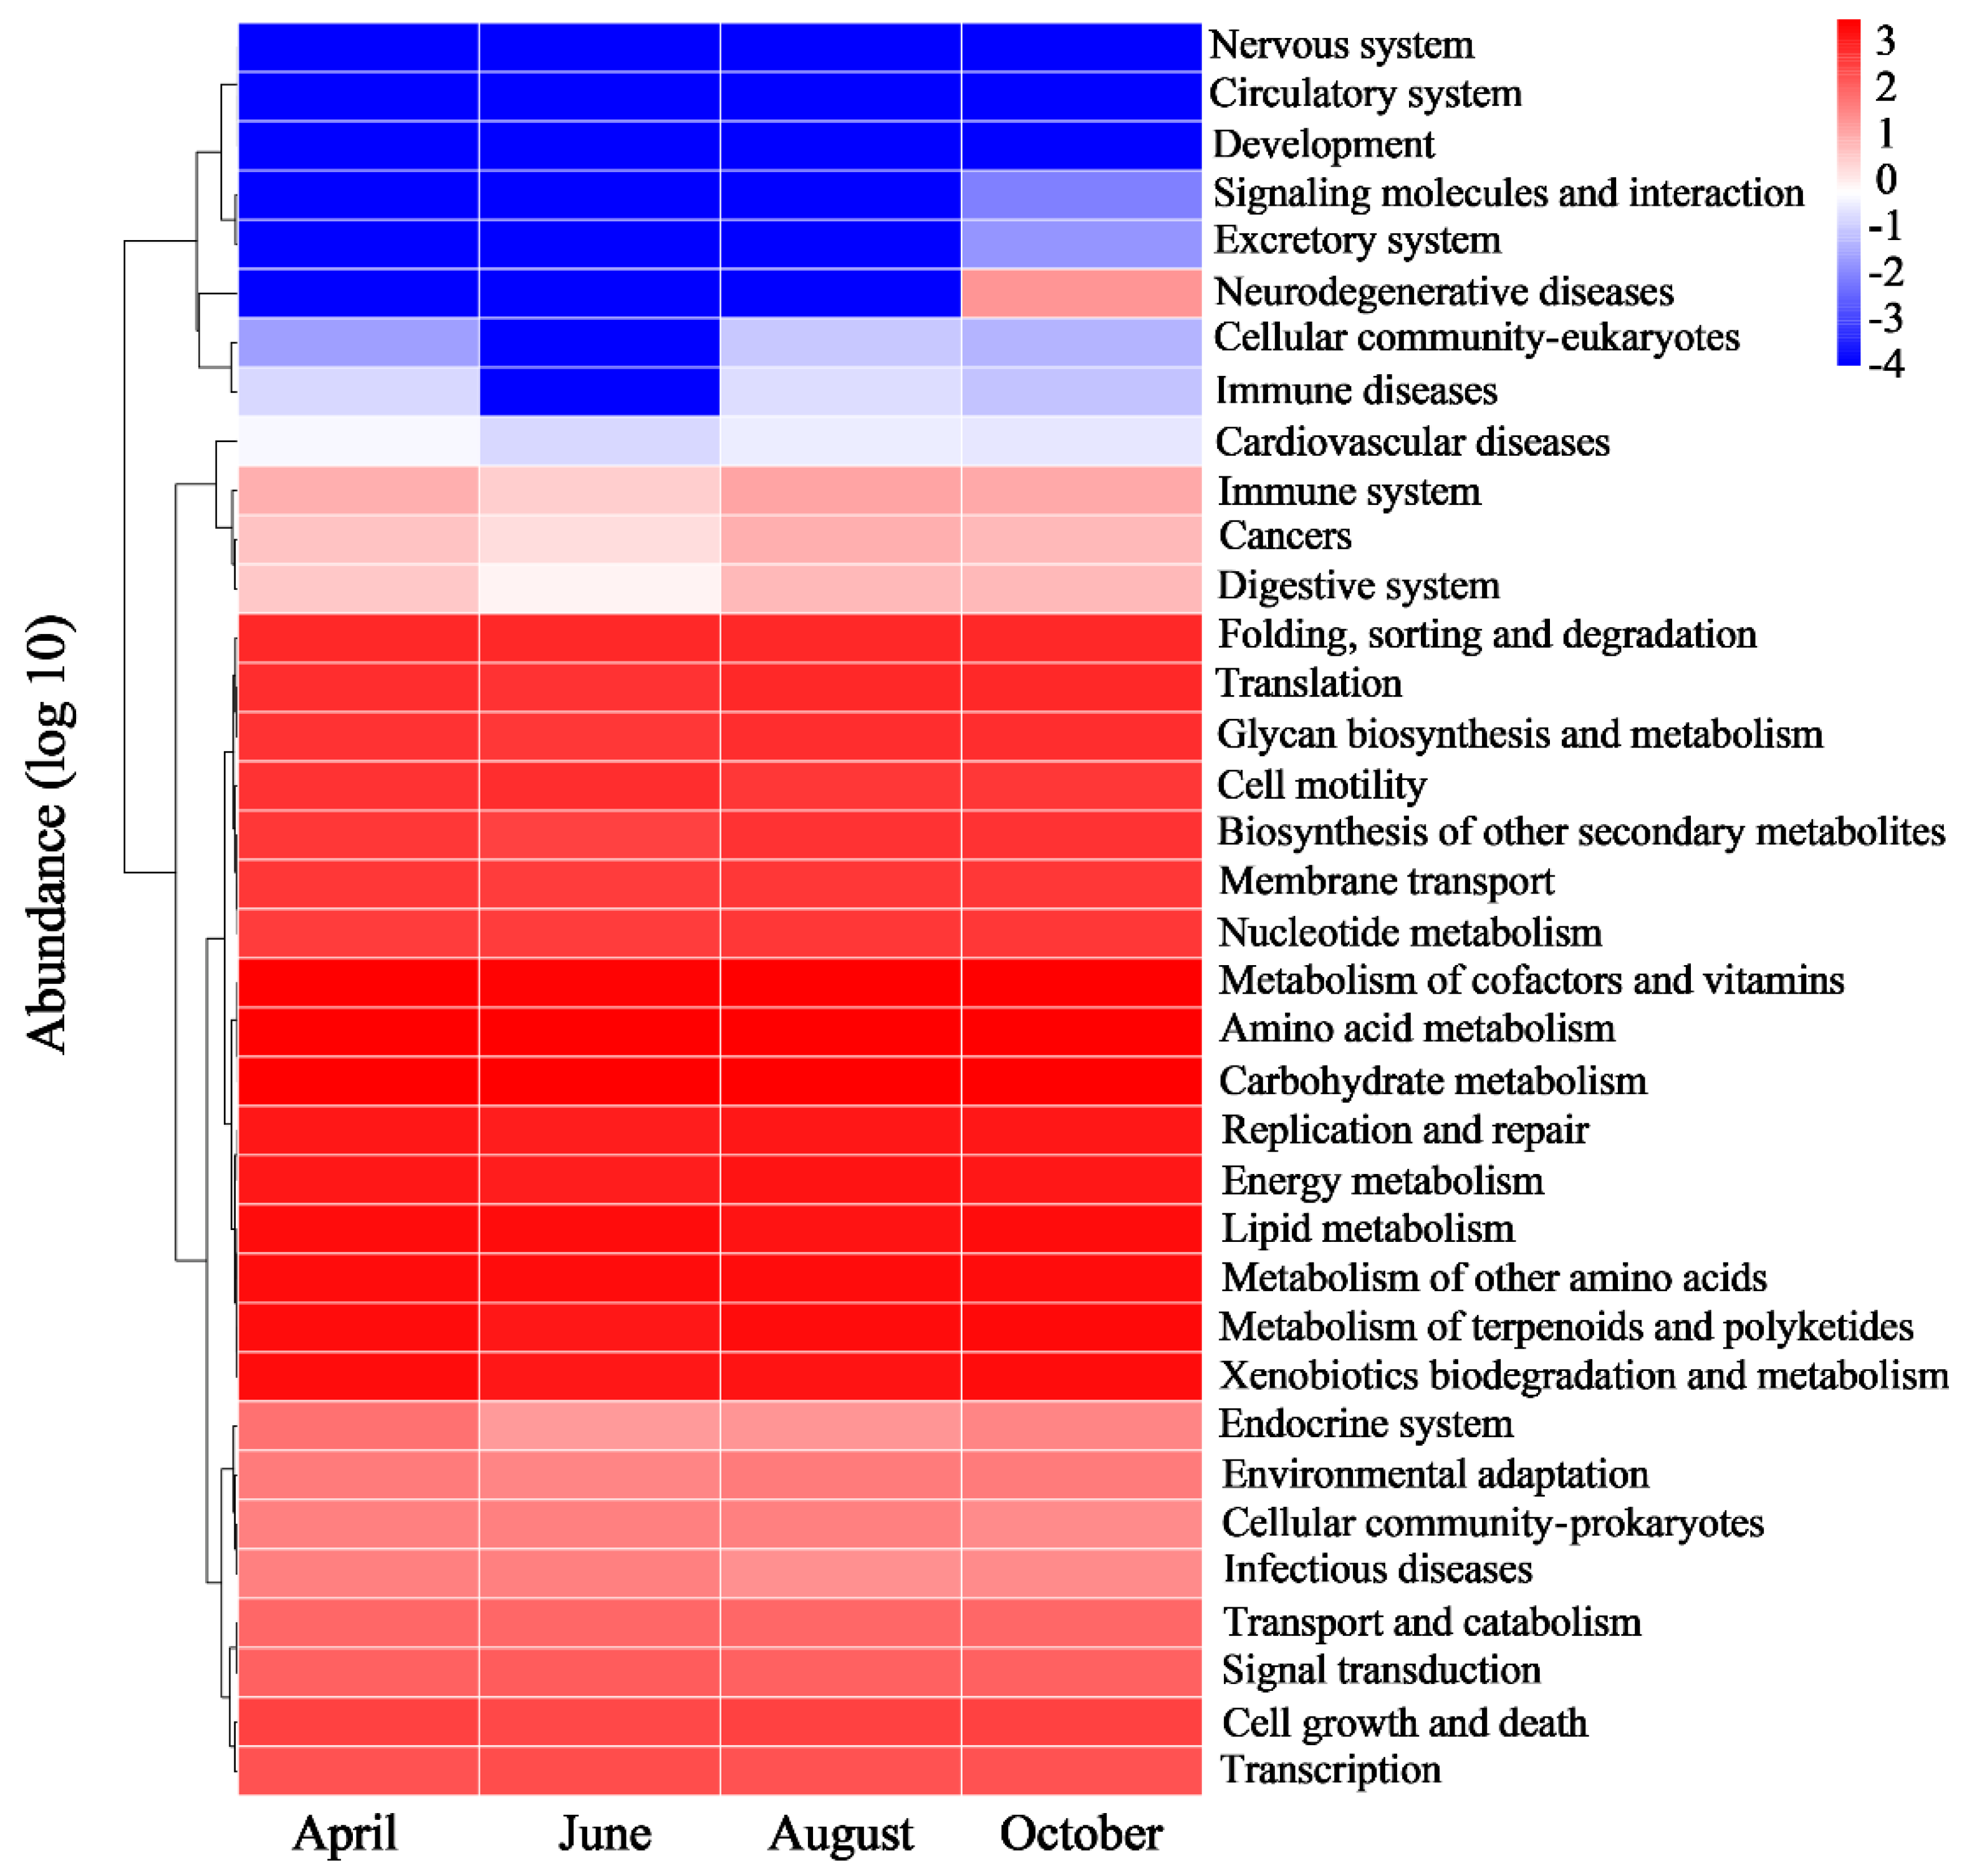
PICRUST 2 (Phylogenetic Investigation of Communities by Reconstruction of Unobserved States) was used to analyze the function of bacterial community in different months. Figure 6 shows that there were no significant differences in the abundance of secondary metabolic pathways in the bacterial community in different months. Pathways of metabolism and genetic information processing have the highest abundance, including amino acid, lipid, carbohydrate, terpenoid, nucleotide and energy pathways, as well as genetic replication, repair, folding, sorting and degradation pathways. The abundance of environmental information processing and metabolic cellular process pathways were at a lower level, including cell growth, death, motility and membrane transport. The pathway abundance of disease and organismal systems was the lowest, including infectious diseases, neurodegenerative diseases, endocrine systems and environmental adaptation systems. Among the pathways of diseases, the pathway abundance of infectious diseases was significantly higher than that of other diseases. The pathway abundance of immune diseases increased in August, and the pathway abundance of neurodegenerative diseases increased in October.
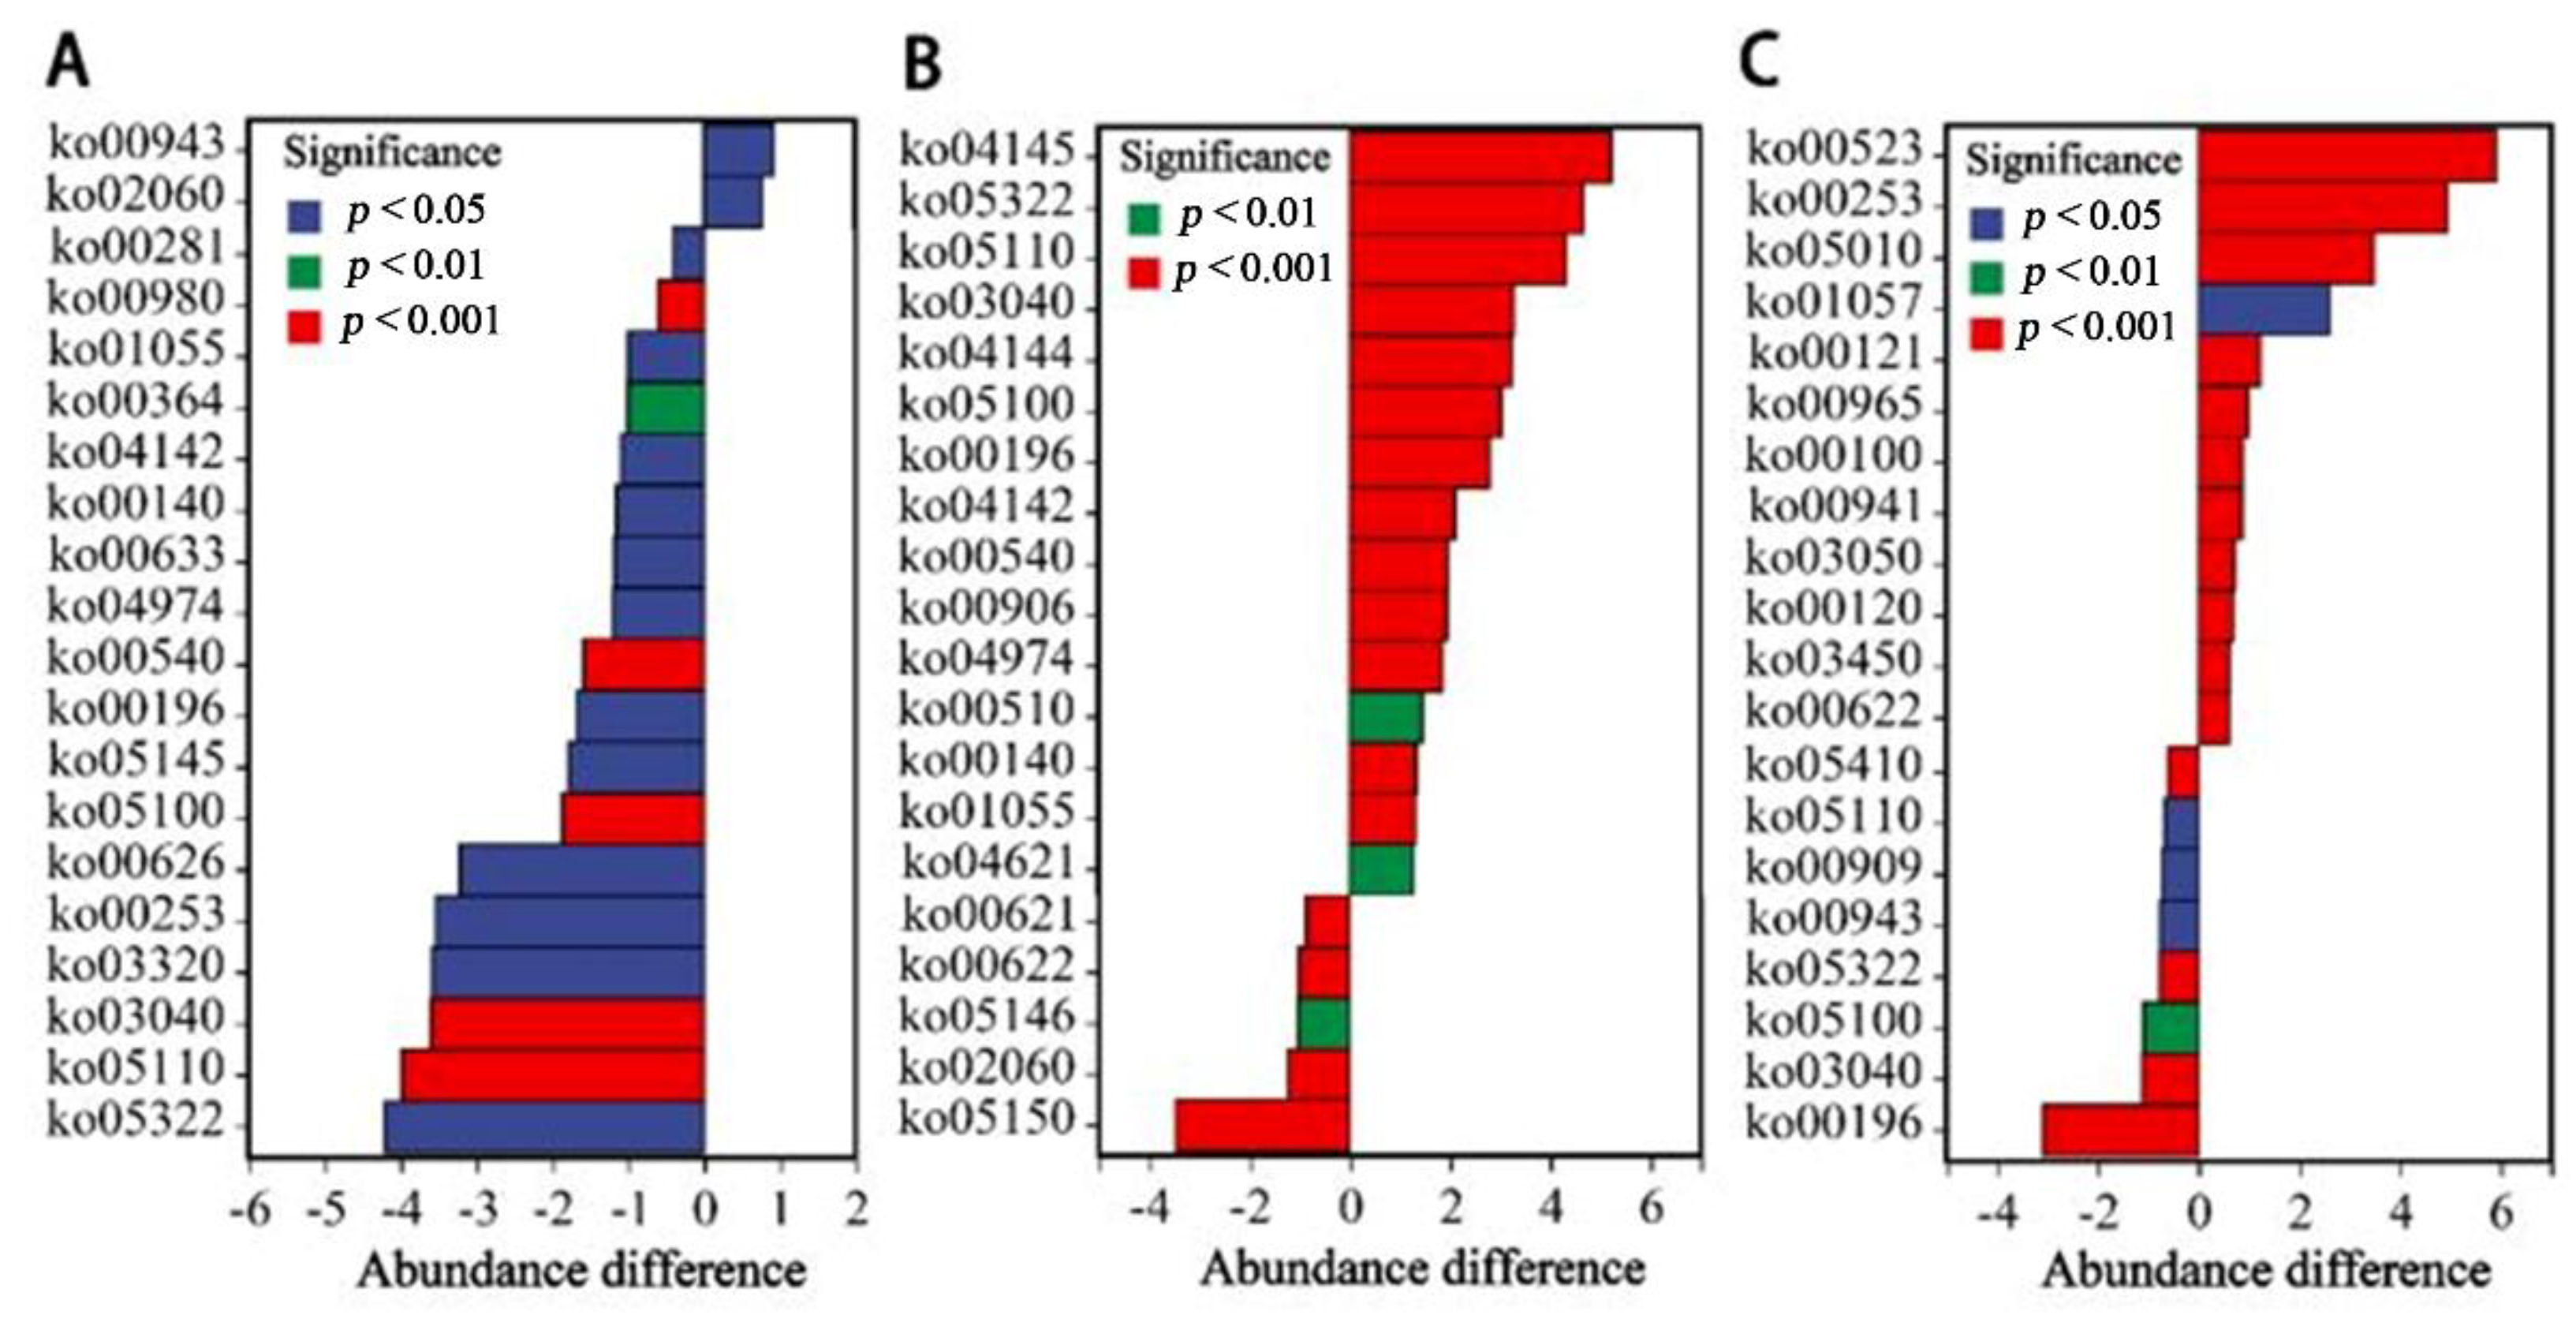
Figure 7 compared the abundance differences of tertiary metabolic pathways in the top 20 for each month. In terms of diseases, the pathway abundance of systemic lupus erythematosus (ko05322), vibrio cholerae infection (ko05110) and epithelial cell bacterial infection (ko05100) fluctuated, and the pathway abundance of staphylococcus aureus infection (ko05150) increased in June. As the aspect of immunology, the tetracycline synthesis (ko00253) pathway abundance increased in April. The lysosomal (ko04142) pathway abundance increased in April and August. The vancomycin antibiotic synthesis (ko01055) and NOD-like receptor signaling (ko04621) pathway abundance increased in August. The steroid compound synthesis (ko00100) pathway abundance increased in October. In terms of physiological metabolism, the pathway abundance of lipopolysaccharide synthesis (ko00540), protein digestion and absorption (ko04974), betalain biosynthesis (ko00965), bile acid synthesis (ko00120, ko00121) and spliceosome (ko03040) increased following the culture, indicating that the functions of carbohydrate, lipid, protein and genetic metabolism increased. Metabolic pathways are described in Table 4.
4. Discussion
In the culture process, the decomposition of fish excrement and residual feed will increase the concentration of nitrogen and phosphorus nutrients, which will lead to water pollution and decline of culture quality [29]. The concentrations of TN and TP in the YPS reached the discharge standard of freshwater pond culture [28], and the concentrations of -N and -N in the CA were lower than those in the traditional Pelteobagrus fulvidraco culture pond (-N: 0.75~1.85 mg/L, -N: 0.02~0.09 mg/L) [30], indicating its suitability for Pelteobagrus fulvidraco culturing. -N and -N in the CA increased in April and August, and June and August, respectively, which might be caused by the enhanced feeding of Pelteobagrus fulvidraco. Water purification equipment should be set up to reduce the concentration of nitrogen nutrients to avoid affecting the growth of Pelteobagrus fulvidraco. The concentration of -N and -N in the PA was lower than that in the CA. This result was consistent with that in other IMTAs, such as the sea urchin–fish–seaweed IMTA [31] and the fish–shrimp–ostreidae IMTA [5], which indicated the polyculture organisms might effectively utilize resources and improve water purification efficiency [32]. The rise of N:P caused by consumption of TP from various hydrophytes might lead to a potential impact on the function of the bacterial community, such as nitrification and denitrification [33]. Monitoring the change of N: P in water body can provide guidance for regulating the function of the bacterial community.
Alpha diversity values are important indexes to reflect the richness and diversity of the bacterial community. The results showed that the richness (Chao1) and diversity (Shannon) of the bacterial community in the YPS decreased in early summer (June), which might be due to the increase in -N concentration. However, at the end of summer (August), -N did not show obvious inhibitory effect, which might be due to the self-regulation ability of the bacterial community to adapt to a certain degree of -N stress [34]. The richness and diversity of the CA were lower than that of the PA (except October), which indicated that monoculture of Pelteobagrus fulvidraco in the CA might be not conducive to the formation of a complex bacterial community. This phenomenon also appeared in the grass carp monoculture system [35] and shrimp monoculture culture system [36]. Wang [37] has found that polyculture of Pelteobagrus fulvidraco, grass carp, silver carp and bighead carp with an appropriate proportion (15:5:4:3) could increase the diversity of the bacterial community in the Pelteobagrus fulvidraco culture system and alleviate the negative impact on the structure of the bacterial community in water and sediment. This result provides a new direction to optimize the YPS culture strategy by polyculture of fishes with other feeding habits.
Bacterial community is a complex system with the interaction of various flora [38,39]. Diverse culture systems often have different dominant phyla [40,41,42]. Investigating its change patterns and influencing factors is helpful to regulate the structure of the bacterial community and improve the culture environment. In this study, there were no significant differences in dominant phyla between the CA and PA caused by the circulating water system. Actinobacteria (35.68%), Firmicutes (24.58%), Proteobacteria (23.49%) and Bacteroidetes (6.59%) were the dominant phyla in the two areas, which was consistent with the results of Wang [37], indicating that these four species might be the dominant phyla in Pelteobagrus fulvidraco culture systems. At the genus level, the rise in water temperature and the increase in concentration of dissolved organic matter produced by phytoplankton [43] might promote the proliferation of Limnohabitans (Proteobacteria) to become the dominant genus in spring (April). This result was consistent with that in Vistula Lagoon [44]. However, the lack of light caused by the increase in suspended particles [45] and ingestion of protozoa [43] might lead to the decrease in Limnohabitans abundance. Exiguobacterium, Planococcus, Paenisporosarcina and Planomicrobium (Firmicutes) are obligate or facultative aerobic bacteria. Their abundance was positively correlated with DO, but negatively correlated with nitrogen nutrients and N: P. In the early stage of culture, there was sufficient DO in the water body, which might create conditions for Exiguobacterium, Planococcus, Paenisporosarcina and Planomicrobium to become dominant genera in early summer (June). However, the stress caused by -N accumulation in the water body might be the reason for the decrease in its abundance in late summer (August) [46]. Sediminibacterium (Bacteroides) [47], hgcI_clade and CL500_29_marin_group (Actinobacteria) [48] are important participants in microfood web and energy flow, which are closely related to plankton. Elevated water eutrophication levels will increase their abundance, which may explain the positive correlation between them and nitrogen nutrients, and the reason why they become dominant genera in late summer (August) and autumn (October). According to the analysis, the changes of dominant genera in the YPS were closely related to nitrogen nutrient, DO and other factors; attention should be paid to the indicator function represented by abundance changes of genera. The methods of timely increasing oxygen, regulating C: N: P in water body and transplanting favorable bacteria (such as nitrogen cycling bacteria and probiotics) [49] can be adopted to adjust bacterial community structure, so as to improve water quality and promote the growth of Pelteobagrus fulvidraco. This should be further explored in the later Pelteobagrus fulvidraco culture.
In the aquaculture system, microorganisms can promote the energy flow and material circulation in ecosystems as decomposers [50]. Some genera, such as Vibrio, Pseudomonas and Aeromonas, are pathogenic bacteria causing fish diseases, which pose a threat to the health of cultured fish. In the YPS, the abundance of metabolic pathways of fish diseases was low. It was speculated that the inhibition of harmful bacteria from a circulating water system might lead to this healthy water environment, which was consistent with the lumpfish culture system [51]. However, the high abundance of infectious diseases and immune disease pathways, such as systemic lupus erythematosus, vibrio cholerae infection and epithelial cell infection, might threaten human health. The water quality may be maintained by adding appropriate amounts of antibiotics and probiotics (such as lactic acid bacteria) [52], combined with the immune substances (such as tetracycline, vancomycin group antibiotics and steroid compound) produced by bacteria in different months. In terms of metabolism, the abundance of protein, carbohydrate, lipid and genetic pathways increased following the culture, such as lipopolysaccharide synthesis, protein digestion and absorption, bile acid synthesis and spliceosome metabolism. The reason may be the accumulation of nitrogen and phosphorus nutrients increasing the physiological metabolism intensity of microorganisms [53]. There is a close relationship between fish growth and water bacterial community. Guiding the water bacterial community to optimize the functions of fish surface and the digestive tract bacterial community is an effective method. At present, high throughput sequencing technology has been gradually applied to water environment monitoring, and pipelines for the analyses of omics data and optimization of metabolic processes based on bacterial community metabolic networks has been gradually developed [54,55]. Improving bacterial community function in aquaculture system by analyzing microbial metabolic characteristics will become a new method to upgrade aquaculture systems and optimize aquaculture modes.
5. Conclusions
In this manuscript, the bacterial community structure and functional characteristics in the YPS were investigated. The results showed that the YPS had higher water purification efficiency, lower nitrogen and phosphorus nutrient concentration and superior water quality, which was suitable for the culture of Pelteobagrus fulvidraco. The bacterial community structures in the CA and PA were similar, but because of the monoculture of Pelteobagrus fulvidraco in the CA, the richness and diversity of bacterial community were low, and the structure was simple. The dominant phyla of the system are Actinobacteria, Firmicutes, Proteobacteria and Bacteroides. Seasonal variation of dominant genera was obvious, which was closely related to physicochemical factors such as DO, T and nitrogen nutrients. The abundance of metabolism, infectious and immune diseases metabolic pathways increased with the accumulation of nitrogen nutrients in water. It is effective to optimize the bacterial community structure and improve the growth of Pelteobagrus fulvidraco by microbial monitoring, water quality control, transplantation of favorable flora and reasonable administration of probiotics.
Under the background of the comprehensive implementation of green ecological culture in aquaculture industry, exploring the structure and functional characteristics of the bacterial community can provide a theoretical guidance for successful management and promote the transformation and upgrading of Pelteobagrus fulvidraco aquaculture.
Author Contributions
Y.-X.Z. designed the research plan, carried out the investigation, analyzed results and wrote the paper. M.L., R.-F.Z., Z.-Y.S. and S.-W.X. assisted the investigation. X.-G.L. reviewed results and the paper. All authors have read and agreed to the published version of the manuscript.
Funding
Supported by the earmarked fund “Modern agricultural industrial technology system in China” (grant No. CARS-46) and “National key R & D plan of China” (grant No. 2019YFD0900300).
Institutional Review Board Statement
Not applicable.
Informed Consent Statement
Not applicable.
Data Availability Statement
The data that support the findings of this study are available from the corresponding author upon request.
Acknowledgments
The authors would like to thank the “Modern agricultural industrial technology system in China” (grant No. CARS-46)” and the “National key R & D plan of China” (grant No. 2019YFD0900300) for financial support. The authors also thank the reviewers for their contribution in improving our manuscript.
Conflicts of Interest
The author declares no competing interest.
References
- FAMA (Fisheries Administration of the Ministry of agriculture and rural affairs of the people’s Republic of China); NTEC (National fisheries Technology Extension Center); CSF (China society of fisheries). China Fisheries Statistics Yearbook; China Agricultural Press: Beijing, China, 2021. (In Chinese) [Google Scholar]
- Liu, X.G.; Shao, Z.Y.; Cheng, G.F.; Lu, S.M.; Gu, Z.J.; Zhu, H.; Shen, H.Y.; Wang, J.; Chen, X.L. Ecological engineering in pond aquaculture: A review from the whole-process perspective in China. Rev. Aquacult. 2021, 13, 1060–1076. [Google Scholar] [CrossRef]
- Feng, J.; Tian, X.L.; Dong, S.L.; He, R.P.; Zhang, K.; Zhang, D.X.; Li, L.; Zhang, Q.Q.; Zhang, T. Comparative analysis of the energy fluxes and trophic structure of polyculture ecosystems of Portunus trituberculatus based on Ecopath model. Aquaculture 2018, 496, 185–196. [Google Scholar] [CrossRef]
- Tang, Q.S.; Fang, J.G.; Zhang, J.H.; Jiang, Z.J.; Liu, H.M. Impacts of multiple stress on coastal ocean ecosystems and Integrated Multi-trophic Aquaculture. Prog. Fish. Sci. 2013, 34, 11. [Google Scholar]
- Biswas, G.; Kumar, P.; Ghoshal, T.K.; Kailasam, M.; De, D.; Bera, A.; Mandal, B.; Sukumaran, K.; Vijayan, K.K. Integrated multi-trophic aquaculture (IMTA) outperforms conventional polyculture with respect to environmental remediation, productivity and economic return in brackishwater ponds. Aquaculture 2020, 516, 734626. [Google Scholar] [CrossRef]
- Liu, X.G. Pond Aquaculture Ecological Engineering; Agriculture Press: Beijing, China, 2018. (In Chinese) [Google Scholar]
- Zhu, H.; Cheng, S.P.; Wang, J.; Liu, X.G.; Lai, Q.F. Construction and operation evaluation of ecologically engineered cultivation system of saline-alkaline pond. Fish Mod. 2018, 4, 27–33. [Google Scholar]
- Azam, F.; Long, R.A. Oceangraphy: Sea snow microcosms. Nature 2001, 414, 495–498. [Google Scholar] [CrossRef]
- Cotner, J.B.; Biddanda, B.A. Small players, large role: Microbial influence on biogeochemical processes in pelagic aquatic ecosystems. Ecosystems 2002, 5, 105–121. [Google Scholar] [CrossRef]
- Yeo, S.K.; Huggett, M.J.; Eiler, A.; Rappé, M.S. Coastal Bacterioplankton Community Dynamics in Response to a Natural Disturbance. PLoS ONE 2013, 8, e56207. [Google Scholar] [CrossRef]
- Eswaran, R.; Khandeparker, L. Influence of salinity stress on bacterial community composition and β-glucosidase activity in a tropical estuary: Elucidation through microcosm experiments. Mar. Environ. Res. 2020, 159, 104997. [Google Scholar] [CrossRef]
- Kan, J.; Wang, K.; Chen, F. Temporal variation and detection limit of an estuarine bacterioplankton community analyzed by denaturing gradient gel electrophoresis (DGGE). Aquat. Microb. Ecol. 2006, 42, 7–18. [Google Scholar] [CrossRef] [Green Version]
- Cardona, E.; Gueguen, Y.; Magré, K.; Lorgeoux, B.; Piquemal, D.; Pierrat, F.; Noguier, F.; Saulnier, D. BacteriaI community characterization of water and inestine of the shrimp Litopenaeus stylirostris in a biofloc system. BMC. Microbiol. 2016, 16, 157. [Google Scholar] [CrossRef] [PubMed] [Green Version]
- Anthony, C.Y.; Eric, W.T. Within-and between-lake variability in the composition of bacterioplankton communities: Investigations using multiple spatial Scales. Appl. Environ. Microbiol. 2004, 70, 214–223. [Google Scholar]
- Vieira, R.P.; Gonzalez, A.M.; Cardoso, A.M.; Oliveira, D.N.; Albano, R.M.; Clementino, M.M.; Martins, O.B.; Paranhos, R. Relationships between bacterial diversity and environmental variables in a tropical marine environment, Rio de Janeiro. Environ. Microbiol. 2008, 10, 189–199. [Google Scholar] [CrossRef]
- Wever, A.D.; Muylaert, K.; Gucht, K.V.D.; Pirlot, S.; Cocquyt, C.; Descy, J.P.; Plisnier, P.P.; Vyverman, W. Bacterial community composition in Lake Tanganyika: Vertical and horizontal heterogeneity. Appl. Environ. Microbiol. 2005, 71, 5029–5037. [Google Scholar] [CrossRef] [PubMed] [Green Version]
- Moriarty, D.J.W. The role of microorganisms in aquaculture ponds. Aquaculture 1997, 151, 333–349. [Google Scholar] [CrossRef]
- SEPA (State Environmental Protection Administration). Water and Wastewater Monitoring and Analysis Methods, 4th ed.; China Environmental Science Press: Beijing, China, 2002. (In Chinese) [Google Scholar]
- Liu, C.S.; Zhao, D.F.; Ma, W.J.; Guo, Y.D.; Wang, A.J.; Wang, Q.L.; Lee, D.J. Denitrifying sulfide removal process on high-salinity wastewaters in the presence of Halomonas sp. Appl. Microbiol. Biotechnol. 2016, 100, 1421–1426. [Google Scholar] [CrossRef] [PubMed]
- Chen, S.F.; Zhou, Y.Q.; Chen, Y.R.; Gu, J. fastp: An ultra-fast all-in-one FASTQ preprocessor. Bioinformatics 2018, 34, i884–i890. [Google Scholar] [CrossRef]
- Magoč, T.; Salzberg, S.L. FLASH: Fast length adjustment of short reads to improve genome assemblies. Bioinformatics 2011, 27, 2957–2963. [Google Scholar] [CrossRef] [Green Version]
- Callahan, B.J.; Mcmurdie, P.J.; Rosen, M.J.; Han, A.W.; Johnson, A.J.A.; Holmes, S.P. DADA2: High-resolution sample inference from Illumina amplicon data. Nat. Methods 2016, 13, 581–583. [Google Scholar] [CrossRef] [Green Version]
- Bolyen, E.; Rideout, J.R.; Dillon, M.R.; Bokulich, N.A.; Abnet, C.C.; Al-Ghalith, G.A.; Alexander, H.; Alm, E.J.; Arumugam, M.; Asnicar, F.; et al. Reproducible, interactive, scalable and extensible microbiome data science using QIIME 2. Nat. Biotechnol. 2019, 37, 852–857. [Google Scholar] [CrossRef]
- Schloss, P.D.; Westcott, S.L.; Ryabin, T.; Hall, J.R.; Hartmann, M.; Hollister, E.B.; Lesniewski, R.A.; Oakley, B.B.; Parks, D.H.; Robinson, C.J. Introducing mothur: Open-Source, Platform-Independent, Community-Supported Software for Describing and Comparing Microbial Communities. Appl. Environ. Microbiol. 2009, 75, 7537. [Google Scholar] [CrossRef] [Green Version]
- Segata, N.; Izard, J.; Waldron, L.; Gevers, D.; Miropolsky, L.; Garrett, W.S.; Huttenhower, C. Metagenomic biomarker discovery and explanation. Genome. Biol. 2011, 12, R60. [Google Scholar] [CrossRef] [PubMed] [Green Version]
- Barberan, A.; Bates, S.T.; Casamayor, E.O.; Fierer, N. Using network analysis to explore co-occurrence patterns in soil microbial communities. ISME. J. 2012, 6, 343–351. [Google Scholar] [CrossRef]
- Douglas, G.M.; Maffei, V.J.; Zaneveld, J.R.; Yurgel, S.N.; Brown, J.R.; Taylor, C.M.; Huttenhower, C.; Langille, M.G.I. PICRUSt2 for prediction of metagenome functions. Nat. Biotechnol. 2020, 38, 685–688. [Google Scholar] [CrossRef]
- Ministry of Agriculture of the People’s Republic of China. Requirements for Water Discharge from Freshwater Aquaculture Pond; Fisheries industry standard of the people’s Republic of China, SC/T 9101-2007; China Agriculture Press: Beijing, China, 2007. [Google Scholar]
- Zhang, X.L.; Wang, Q.; Zhang, G.Q.; Zhou, L.; Li, Y.F.; Zhang, Y.; Zhao, S.Y. Spatial variation of phytoplankton community structure of in-pond raceway system. South China Fish. Sci. 2021, 17, 36–45. [Google Scholar]
- Zhang, A.F.; Huang, J.F.; Zhang, H.X.; Tao, Z.Y.; Yu, Z.J.; Hu, Z.G. Changes in water quality and density of plankton in a juvenile yellow catfish rearing pond. Chin. J. Fish. 2021, 34, 71–75. [Google Scholar]
- Shpigel, M.; Shauli, L.; Odintsov, V.; Ben-Ezra, D.; Neori, A.; Guttman, L. The sea urchin, Paracentrotus lividus, in an Integrated MultiTrophic Aquaculture (IMTA) system with fish (Sparus aurata) and seaweed (Ulva lactuca): Nitrogen partitioning and proportional configurations. Aquaculture 2018, 490, 260–269. [Google Scholar] [CrossRef]
- Zhang, H.J.; Guo, Z.X.; Zhao, D.Y.; He, F. Variation of water quality in recirculating aquaculture system based on paddy wetland. Environ. Sci. Technol. 2020, 43, 159–164. [Google Scholar]
- Feng, F.; Fang, T.; Liu, J.T. Vertical distribution of species of nitrogen and phosphorus in the sediments of lake Donghu. Environ. Sci. 2006, 27, 1078–1082. [Google Scholar]
- Yi, S.M.; Dai, D.W.; Wu, H.; Chai, S.T.; Liu, S.J.; Meng, Q.X.; Zhou, Z.M. Dietary concentrate-to-forage ratio affects rumen bacterial community composition and metabolome of yaks. Front. Nutr. 2022, 9, 927206. [Google Scholar] [CrossRef]
- Tian, X.L.; Zheng, Y.Y.; Liu, B.J.; Wang, F.; Dong, S.L. Abundance dynamics and community functional diversity of bacteria in Grass carp polyculture systems. Period. Ocean. Univ. China 2012, 42, 19–27. [Google Scholar]
- Hoang, M.N.; Nguyen, P.N.; Bossier, P. Water quality, animal performance, nutrient budgets and microbial community in the biofloc-based polyculture system of white shrimp, Litopenaeus vannamei and gray mullet, Mugil cephalus. Aquaculture 2019, 515, 734610. [Google Scholar] [CrossRef]
- Wang, Y.T.; Li, B.; Wang, H.H.; Wu, F.L.; Zhang, L. Bacterial diversity of pond water and sediment in different culture systems of yellow catfish (Pelteobagrus fulvidraco) by Miseq sequencing. Acta Microbiol. Sin. 2020, 44, 781–789. [Google Scholar]
- Mancuso, C.; Franzmann, P.; Burton, H.; Nichols, P. Microbial community structure and biomass estimates of a methanogenic Antarctic Lake ecosystem as determined by phospholipid analyses. Microb. Ecol. 1990, 19, 73–95. [Google Scholar] [CrossRef] [PubMed]
- Stefano, A.; Si, T. Stability criteria for complex ecosystems. Nature 2012, 483, 205–208. [Google Scholar]
- Cheng, Y.Y. Research on Microbial Community Ecology in Sediment of a Pond Cultured Mainly with Grass Carp (Ctenopharyngodon indellus); Graduate School of Chinese Academy of Sciences: Beijing, China, 2011. [Google Scholar]
- Zhao, X.G. Influence of the Cultured Odontobutis Obscurus to the Microbial Community, Water Quality and Rice Traits in Rice-Fish System; Shanghai Ocean University: Shanghai, China, 2016. [Google Scholar]
- Fan, L.M.; Barry, K.; Hu, G.D.; Meng, S.L.; Chao, S.; Qiu, L.P.; Zheng, Y.; Wu, W.; Qu, J.H.; Chen, J.Z.; et al. Characterizing bacterial communities in tilapia pond surface sediment and their responses to pond differences and temporal variations. World J. Microbiol. Biotechnol. 2017, 33, 1. [Google Scholar] [CrossRef]
- Salcher, M.M. Same same but different: Ecological niche partitioning of planktonic freshwater prokaryotes. J. Limnol. 2014, 73, 74–87. [Google Scholar] [CrossRef] [Green Version]
- Ameryk, A.; Kownacka, J.; Zalewski, M.; Piwosz, K. Typical freshwater and marine bacterial lineages dynamics at salinity between 0 and 4 in the Vistula Lagoon. Estuar. Coast. Shelf Sci. 2021, 250, 107100. [Google Scholar] [CrossRef]
- Du, Y.Y.; Lou, Z.Y.; Zhang, Y.P.; Li, W.; Wang, T. Effect of cage culture on community structure and influencing factors of bacterioplankton in Liujiaxia Reservoir. Fresh. Fish. 2018, 48, 11–16. [Google Scholar]
- Wang, S.D.; Li, X.; Zhang, M.Z.; Jiang, H.B.; Wang, R.X.; Qian, Y.X.; Li, M. Ammonia stress disrupts intestinal microbial community and amino acid metabolism of juvenile yellow catfish (Pelteobagrus fulvidraco). Ecotoxicol. Environ. Saf. 2021, 227, 112932. [Google Scholar] [CrossRef]
- Li, Q.X.; Cao, L.X.; Tan, H.M.; Sun, J.; Cui, Y.; Xu, R.L. Bacterial communities in the waterlogged wooden cultural relics from the “Nanhai No.1” shipwreck. Acta Microbiol. Sin. 2018, 58, 1439–1452. [Google Scholar]
- Hu, Y.X.; Peng, Y.; Li, R.W.; Huang, J.; Zhou, Z.; Hu, S.; Wang, Y.C.; Qiu, G.S. Plankton diversity and community characteristics in Danjiangkou Reservoir based on environmental DNA metabarcoding. J. Lake Sci. 2021, 33, 1650–1659. [Google Scholar]
- Reed, H.E.; Martiny, J.B. Microbial composition affects the functioning of estuarine sediments. ISME J. 2013, 7, 868–879. [Google Scholar] [CrossRef] [PubMed]
- Jing, X.Y.; Gou, H.L.; Gong, Y.H.; Ji, Y.T.; Su, X.L. Seasonal dynamics of the coastal bacterioplankton at intensive fish-farming areas of the Yellow Sea, China revealed by high-throughput sequencing. Mar. Pollut. Bull. 2019, 139, 366–375. [Google Scholar] [CrossRef] [PubMed]
- Dahle, S.W.; Bakke, I.; Birkeland, M.; Nordøy, K.; Dalum, A.S.; Attramadal, K.J.K. Production of lumpfish (Cyclopterus lumpus L.) in RAS with distinct water treatments: Effects on fish survival, growth, gill health and microbial communities in rearing water and biofilm. Aquaculture 2020, 522, 735097. [Google Scholar] [CrossRef]
- Venkat, H.K.; Sahu, N.P.; Jain, K.K. Effect of feeding Lactobacillus-based probiotics on the gut micro-flora, growth and survival of postlarvae of Macrobrachium rosenbergii (de Man). Aquac. Res. 2004, 35, 501–507. [Google Scholar] [CrossRef]
- Bentzon-Tilia, M.; Gram, L. Monitoring and managing microbes in aquaculture-Towards a sustainable industry. Microb. Biotechnol. 2016, 9, 576–584. [Google Scholar] [CrossRef] [Green Version]
- Zelezniak, A.; Andrejev, S.; Ponomarova, O.; Mende, D.R.; Bork, P.; Patil, K.R. Metabolic dependencies drive species co-occurrence in diverse microbial communities. Proc. Natl. Acad Sci. USA 2015, 112, 6449–6454. [Google Scholar] [CrossRef] [Green Version]
- Perez-Garcia, O.; Lear, G.; Singhal, N. Metabolic network modeling of microbial interactions in natural and engineered environmental systems. Front. Microbiol. 2016, 7, 673. [Google Scholar] [CrossRef]
Figure 1.
Rarefaction curves of samples.

Figure 2.
Hierarchical clustering analysis (A) and principal coordinates analysis (B) of microbial communities.
Figure 2.
Hierarchical clustering analysis (A) and principal coordinates analysis (B) of microbial communities.

Figure 3.
Relative abundance of microbial communities at Phylum (A) and Genus (B) levels.


Figure 4.
Composition heatmap (A) and LefSe analysis (B) of microbial communities.


Figure 5.
Correlations between microbial communities and water physicochemical factors. Each row in the figure represents a genus; each column represents an environment factor; each cell represents a spearman correlation coefficient between a genus and an environment factor. Red denotes positive correlation and blue denotes negative correlation; * 0.01 < p ≤ 0.05; ** 0.001 < p ≤ 0.01; *** p ≤ 0.001.

Figure 6.
Metabolic pathway abundance heatmap.

Figure 7.
Metabolic pathway differential analysis. Comparison between June and April (A). Comparison between August and June (B). Comparison between October and August (C). Positive values represent that the abundance of pathways this month is higher than that of the previous month; negative values represent that the abundance of pathways in the previous month is higher than that of this month. The pathway descriptions are shown in Table 4.


Table 1.
Numbers of samples.
| Area | Site | April | June | August | October |
|---|---|---|---|---|---|
| CA | I | Ap1 | Ju1 | Ag1 | Oc1 |
| Ⅱ | Ap2 | Ju2 | Ag2 | Oc2 | |
| Ⅲ | Ap3 | Ju3 | Ag3 | Oc3 | |
| PA | Ⅳ | Ap4 | Ju4 | Ag4 | Oc4 |
| Ⅴ | Ap5 | Ju5 | Ag5 | Oc5 | |
| Ⅵ | Ap6 | Ju6 | Ag6 | Oc6 | |
| Ⅶ | Ap7 | Ju7 | Ag7 | Oc7 |
Table 2.
Physicochemical characteristics of samples.
| Time | Area | T (°C) | DO (mg/L) | TN (mg/L) | -N (mg/L) | -N (μg/L) | -N (mg/L) | TP (mg/L) | -P (μg/L) | N:P |
|---|---|---|---|---|---|---|---|---|---|---|
| April | CA | 18.63 ± 0.05 A | 12.94 ± 0.80 A | 1.84 ± 0.09 A | 0.34 ± 0.13 A | 3.85 ± 2.70 | 0.95 ± 0.21 αA | 0.14 ± 0.05 | 1.42 ± 1.20 | 14.12 ± 3.84 AB |
| PA | 18.45 ± 0.11 A | 12.39 ± 3.00 | 2.40 ± 1.32 | 0.39 ± 0.14 AB | 3.3 ± 1.37 B | 0.43 ± 0.20 βAB | 0.11 ± 0.01 AB | 0.99 ± 0.74 A | 14.84 ± 1.48 | |
| June | CA | 26.73 ± 0.09 B | 12.59 ± 0.81 A | 1.47 ± 0.01 B | 0.05 ± 0.00 B | 6.68 ± 1.40 α | 0.10 ± 0.05 B | 0.14 ± 0.01 | 3.93 ± 1.69 | 10.27 ± 0.75 B |
| PA | 26.65 ± 0.09 B | 12.08 ± 2.03 | 1.55 ± 0.34 | 0.04 ± 0.01 B | 3.99 ± 0.56 βB | 0.13 ± 0.06 B | 0.12 ± 0.01 A | 3.78 ± 1.70 A | 13.00 ± 2.42 | |
| August | CA | 31.23 ± 0.05 C | 9.21 ± 0.52 B | 1.85 ± 0.10 A | 0.53 ±0.02 A | 6.39 ± 2.48 | 0.94 ± 0.03 αA | 0.12 ± 0.01 α | 2.65 ± 1.00 | 16.06 ± 1.40 AB |
| PA | 31.3 ± 0.00 C | 9.68 ± 0.87 | 1.77 ± 0.09 | 0.58 ± 0.24 A | 7.86 ± 1.86 A | 0.73 ± 0.07 βA | 0.09 ± 0.01 βAB | 1.68 ± 0.38 A | 19.60 ± 1.88 | |
| October | CA | 21.23 ± 0.055 D | 9.98 ± 0.36 B | 1.71 ± 0.04 A | 0.39 ± 0.07 A | 4.21 ± 1.50 | 0.48 ± 0.08 αB | 0.08 ± 0.02 | 24.00± 16.74 | 24.02 ± 6.23 A |
| PA | 21.28 ± 0.08 D | 9.76 ± 1.37 | 1.72 ± 0.16 | 0.38 ± 0.06 AB | 2.59 ±0. 64 B | 0.38 ± 0.17 βAB | 0.08 ± 0.02 B | 27.90 ± 12.81 B | 22.89 ± 5.08 |
English letters indicate significant differences over time (p < 0.05); Latin letters indicate significant differences between areas (p < 0.05). Values are the mean ± SD.
Table 3.
Alpha diversity indices of microbial communities.
| Time | Area | Chao1 | Shannon |
|---|---|---|---|
| April | CA | 3.78 × 10³ ± 1.94 × 10³ | 8.48 ± 1.32 a |
| PA | 4.43 × 10³ ± 2.01 × 10² A | 9.49 ± 0.53 a | |
| June | CA | 6.87 × 10² ± 78.9 | 5.10 ± 0.47 b |
| PA | 7.44 × 10² ± 1.81 × 10² B | 5.36 ± 0.86 b | |
| August | CA | 2.06 × 10³ ± 3.55 × 10² | 8.41 ± 0.21 a |
| PA | 2.27 × 10³ ± 2.32 × 10² C | 8.59 ± 0.14 a | |
| October | CA | 3.03 × 10³ ± 1.53 × 10² | 8.46 ± 0.11 a |
| PA | 3.03 × 10³ ± 2.11 × 10² D | 8.34 ± 0.16 a |
English capital letters indicate significant differences in Chao1 index over time (p < 0.05); English lowercase letters indicate significant differences in Shannon index over time (p < 0.05). Values are the mean ± SD.
Table 4.
Metabolic pathway description (KEGG).
| Number | Name |
|---|---|
| ko00100 | Steroid biosynthesis |
| ko00120 | Primary bile acid biosynthesis |
| ko00121 | Secondary bile acid biosynthesis |
| ko00140 | Steroid hormone biosynthesis |
| ko00196 | Photosynthesis—antenna proteins |
| ko00253 | Tetracycline biosynthesis |
| ko00281 | Geraniol degradation |
| ko00364 | Fluorobenzoate degradation |
| ko00510 | N-Glycan biosynthesis |
| ko00523 | Polyketide sugar unit biosynthesis |
| ko00540 | Lipopolysaccharide biosynthesis |
| ko00621 | Dioxin degradation |
| ko00622 | Xylene degradation |
| ko00626 | Naphthalene degradation |
| ko00633 | Nitrotoluene degradation |
| ko00906 | Carotenoid biosynthesis |
| ko00909 | Sesquiterpenoid biosynthesis |
| ko00941 | Flavonoid biosynthesis |
| ko00943 | Isoflavonoid biosynthesis |
| ko00965 | Betalain biosynthesis |
| ko00980 | Metabolism of xenobiotics by cytochrome P450 |
| ko01055 | Biosynthesis of vancomycin group antibiotics |
| ko01057 | Biosynthesis of type II polyketide products |
| ko02060 | Phosphotransferase system (PTS) |
| ko03040 | Spliceosome |
| ko03050 | Proteasome |
| ko03320 | PPAR signaling pathway |
| ko03450 | Non-homologous end-joining |
| ko04142 | Lysosome |
| ko04144 | Endocytosis |
| ko04145 | Phagosome |
| ko04621 | NOD-like receptor signaling pathway |
| ko04974 | Protein digestion and absorption |
| ko05010 | Alzheimer’s disease |
| ko05100 | Bacterial invasion of epithelial cells |
| ko05110 | Vibrio cholerae infection |
| ko05145 | Toxoplasmosis |
| ko05146 | Amoebiasis |
| ko05150 | Staphylococcus aureus infection |
| ko05322 | Systemic lupus erythematosus |
| ko05410 | Hypertrophic cardiomyopathy (HCM) |
Publisher’s Note: MDPI stays neutral with regard to jurisdictional claims in published maps and institutional affiliations. |
© 2022 by the authors. Licensee MDPI, Basel, Switzerland. This article is an open access article distributed under the terms and conditions of the Creative Commons Attribution (CC BY) license (https://creativecommons.org/licenses/by/4.0/).
Share and Cite
MDPI and ACS Style
Zhao, Y.-X.; Liu, X.-G.; Lu, M.; Zhou, R.-F.; Sun, Z.-Y.; Xiao, S.-W. Characteristics of Bacterial Community in Pelteobagrus fulvidraco Integrated Multi-Trophic Aquaculture System. Water 2022, 14, 3192. https://doi.org/10.3390/w14203192
AMA Style
Zhao Y-X, Liu X-G, Lu M, Zhou R-F, Sun Z-Y, Xiao S-W. Characteristics of Bacterial Community in Pelteobagrus fulvidraco Integrated Multi-Trophic Aquaculture System. Water. 2022; 14(20):3192. https://doi.org/10.3390/w14203192
Chicago/Turabian StyleZhao, Yu-Xi, Xing-Guo Liu, Ming Lu, Run-Feng Zhou, Zhao-Yun Sun, and Shu-Wen Xiao. 2022. "Characteristics of Bacterial Community in Pelteobagrus fulvidraco Integrated Multi-Trophic Aquaculture System" Water 14, no. 20: 3192. https://doi.org/10.3390/w14203192
Note that from the first issue of 2016, this journal uses article numbers instead of page numbers. See further details here.