
Ecological Health Status of the Yitong River, China, Assessed with the Planktonic Index of Biotic Integrity

Key Laboratory of Songliao Aquatic Environment, Ministry of Education, Jilin Jianzhu University, 5088 Xincheng Street, Changchun 130118, China
*
Author to whom correspondence should be addressed.
Water 2022, 14(19), 3191; https://doi.org/10.3390/w14193191
Submission received: 27 August 2022
/
Revised: 17 September 2022
/
Accepted: 8 October 2022
/
Published: 10 October 2022
(This article belongs to the Section Biodiversity and Functionality of Aquatic Ecosystems)
Abstract
:The Yitong River Basin is the main northern urban river basin in China, and its ecological health has become an important issue of public interest. In 2021, the plankton community and main water quality parameters of the Yitong River were monitored quarterly. An evaluation system was established based on the Planktonic Index of Biotic Integrity (P–IBI) to assess the spatial and temporal variability in river health. To verify the feasibility of the P–IBI, its assessment results were compared with those of the water quality index (WQI), and the main factors affecting the P–IBI in different seasons were analyzed using correlation analysis between P–IBI metrics and environmental factors. Seasonal comparisons showed that most sampling sites exceeded the “moderate” level in spring and autumn, followed by winter. The worst assessment results occurred in summer. Urban river reaches were more polluted than reaches in rural areas. Regarding driving factors, hydraulic effects on the P–IBI in spring and autumn were significantly stronger than other environmental factors. In summer and winter, special attention should be paid to the input of nitrogen compounds and organic pollutants. Trends based on the P–IBI and the WQI differed in winter, but site patterns were consistent between both indices. The results provide a theoretical basis and data support for the health maintenance of the Yitong River.
1. Introduction
Due to rapid industrial and urban development, river ecosystems face serious problems such as pollution and hydromorphological alterations [1]. Among freshwater ecosystems, urban rivers have the most significant interactions with human activities. Especially in the past decades, river systems in and around the cities have suffered from varying degrees of urban and rural disturbance [2,3,4]. Many human activities, such as industrial sewage discharge, agricultural production, and excessive utilization of riparian vegetation not only affect the natural flow of the river but also change its original hydrological cycle, resulting in a series of issues including water pollution, eutrophication, habitat loss, and biodiversity reduction that have attracted widespread attention from local environmental protection agencies and researchers [5,6,7,8]. As the basis for river management, it is particularly important to study the health assessment of aquatic ecosystems such as urban rivers.
As primary producers, phytoplankton can exhibit the most sensitive response to changes in the river environment [9,10,11]. In addition to providing an energy source for waterfowl and fish, zooplankton is also a predator of algae and bacteria, and it plays a linking role in the food chain of aquatic environments [12,13,14]. Coupled with environmentally sensitive characteristics, it is also considered an ideal biological indicator for environmental monitoring [15,16]. Among the many ecological health assessment methods for aquatic ecosystems, the Index of Biotic Integrity (IBI) is one of the most widely used and effective methods [17]. As a multi-level indicator, it can objectively measure and express the ecological status by integrating various biological parameters [18], overcoming the limitations of using a single biological index for ecological health evaluation [19]. The concept of the IBI was first proposed by Karr in 1981 [20], and it has been widely used since then because its evaluation of the water body status is more scientifically sound and accurate than commonly used chemical methods [21]. Compared with the traditional water quality monitoring methods, the IBI can explore the response relationships among biological indicators by integrating multiple levels, and help with understanding the response of the IBI to dynamic changes in the environment. Furthermore, from the perspective of the composition, structure and function of biological communities, the IBI can help environmental managers to carry out more accurate and comprehensive health evaluations of aquatic ecosystems [22,23]. In recent years, the IBI based on fish, macroinvertebrates [24,25], and microorganisms [26] has become the most widely used tool for the health evaluation of aquatic ecosystems due to the in-depth exploration of the IBI evaluation system in various countries. However, the application of the IBI based on phytoplankton (Phyto–IBI) or zooplankton (Z–IBI) to river ecological health assessment is still in its infancy. Compared with fish and macroinvertebrates, plankton is more sensitive to dynamic changes in the environment, and the sampling process is relatively straightforward [27]. Furthermore, Zhang, et al. [28] suggested that simply comparing the scores of the Phyto–IBI and Z–IBI across different hydrological periods cannot accurately assess aquatic ecosystem health. Since the plankton evaluation method is still developing, practical experience is needed to verify its accuracy and applicability. Therefore, it has become urgent to study the Planktonic IBI (P–IBI) for the comprehensive evaluation of the ecological health of rivers based on phytoplankton and zooplankton.
As one of the main representatives of urban rivers in northern China, the Yitong River flows through the urban area of Changchun from south to north and is strongly influenced by human activities. It receives the treated wastewater from several sewage treatment plants. Because the upstream and downstream catchments of the river are mostly rural and suburban areas with aquaculture development and farmland, there are risks of high nitrogen and phosphorus loading and the resulting eutrophication of water bodies. Previous studies have shown that the middle and lower reaches of the Yitong River are often below the national water body standards [29]. Therefore, the current deterioration of water quality in the Yitong River Basin caused by point source and non-point source pollution cannot be ignored. In recent years, the local government has paid more attention to the development of water treatment projects, and the water quality of the Yitong River has gradually improved. However, no report has objectively evaluated the river’s ecological health to date. Therefore, it is important to carry out research on the evaluation of the ecological health of the Yitong River based on the P–IBI. Here, we explore the ecological health status of the Yitong River and the feasibility of the P–IBI in different seasons based on the P–IBI evaluation system in order to provide a reference for the establishment of suitable biological integrity evaluation methods in the region and provide data supporting river health maintenance and management.
2. Materials and Methods
2.1. Study Area and Sampling Sites
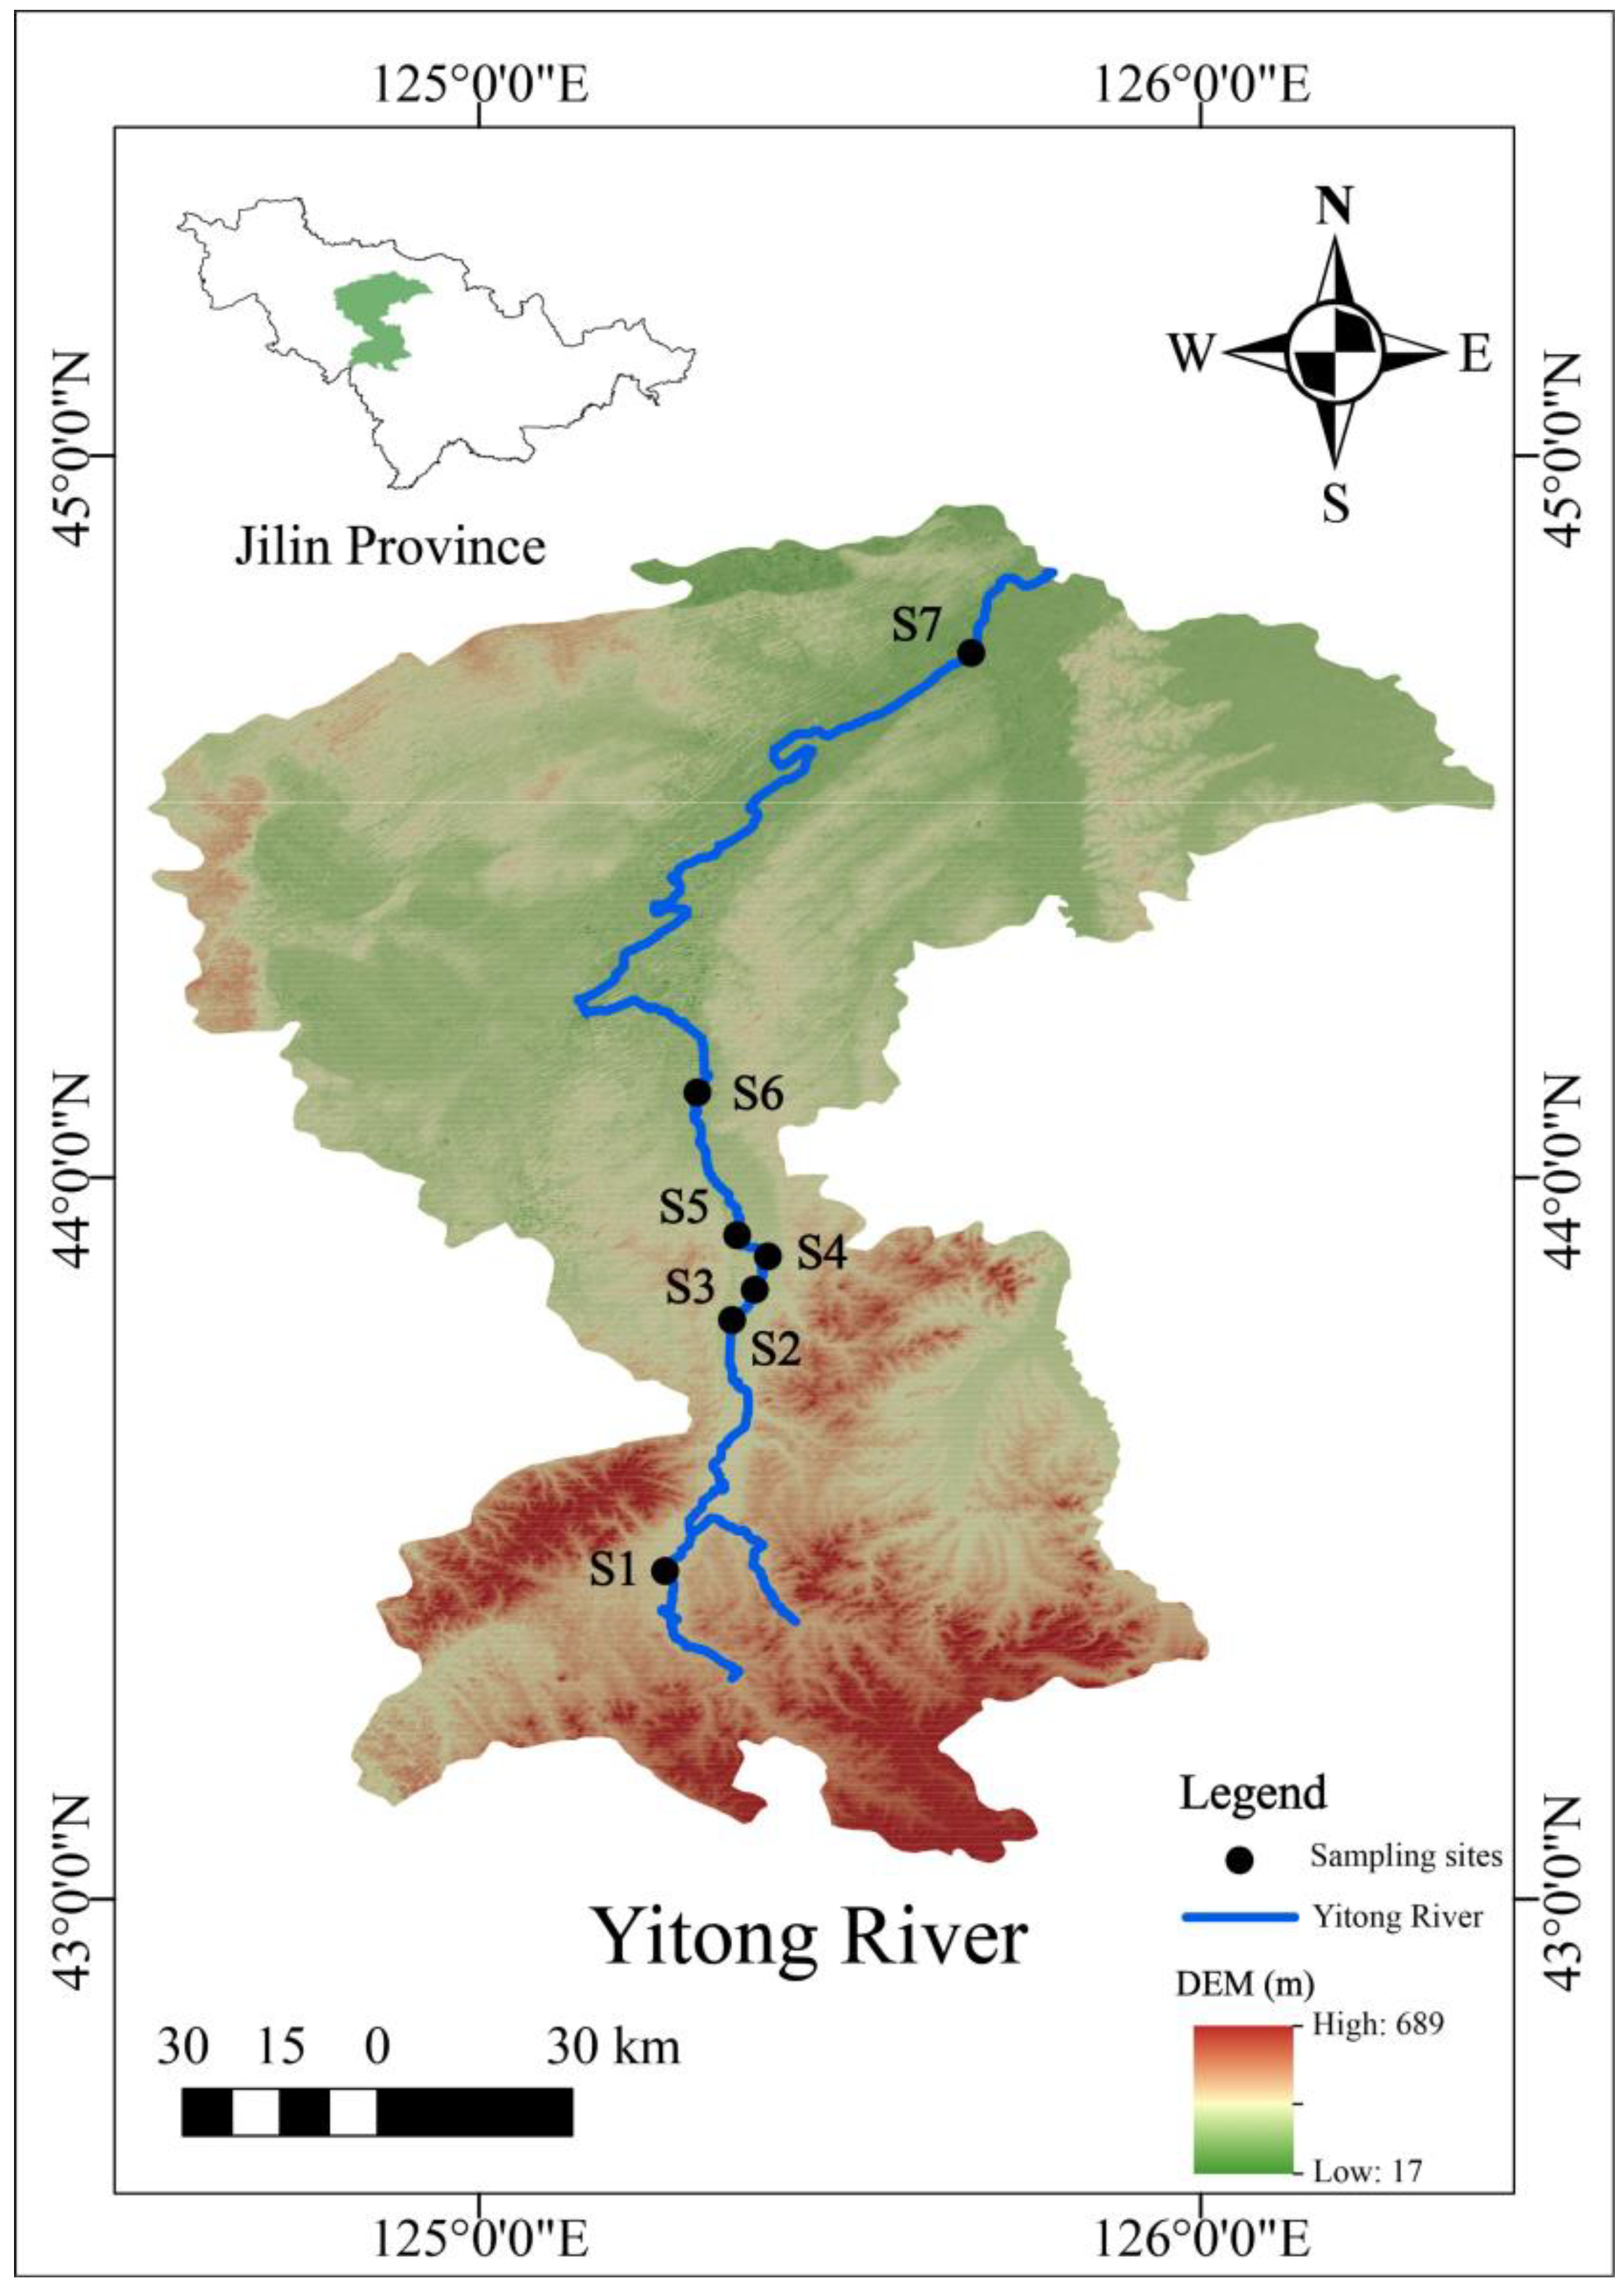
The Yitong River is in the central part of the Jilin Province. As the largest tributary on the left bank of the Songhua River, it originates in the Yitong Manchu Autonomous County in the Jilin Province. It flows through five cities, including Changchun, and finally joins the Second Songhua River. The Yitong River basin belongs to the temperate continental monsoon climate with seasonal rainfall changes. The regional average annual rainfall is 400–900 mm, and 80% of annual rainfall is in summer [30]. The total length of the Yitong River is 343.5 km, while the catchment area is 7515 km2. The annual runoff is 3.5 × 10⁸–6 × 10⁸ m3 [31]. In 2021, sampling in the Yitong River was carried out quarterly, in April (spring), June/August (summer), October (fall), and December (winter), and the frequency was once a month. Seven sampling points were established along the river, in the Xingguang section (S1), in the Xinlicheng Reservoir dam section (S2), in front of the south gate of the South Third Ring Road (S3), in front of the Free Gate (S4), in the Yangjiaweizi Bridge section (S5), the Baolong Bridge section (S6), and the Kaoshan Bridge Section (S7) (Figure 1). The sampling points S1, S2, and S5–S7 belong to national and provincial water quality monitoring sections. As an important water source for Changchun City, S2 reflects the water quality state before the river enters the urban area. The sampling points S1 and S6/S7 are in the upper and lower sections of the Yitong River, respectively, and the surrounding areas are mostly villages and farmland. Sampling points S3–S5 are affected by human activities in the surrounding urban landscape and, thus, fully reflect the pollution status of the Yitong River.
2.2. Sampling and Laboratory Analysis
Values of pH, dissolved oxygen (DO), and water temperature (WT) were measured at the sampling sites in situ using portable probes (Multi 3320, WTW, Weilheim, Germany and JPBJ–608, INESA, Shanghai, China). Water transparency was determined as Secchi depth (SD). Samples were collected 0.5 m below the water surface and stored at 0–4 °C before laboratory analyses, and analyses were completed within 24 h. Determinations of total nitrogen (TN), ammonium–nitrogen (NH4+–N), nitrate–nitrogen (NO3−–N), total phosphorus (TP), chemical oxygen demand (CODCr), and the permanganate index (CODMn) were performed according to the Method of Water and Wastewater Monitoring (fourth edition) [32].
A water sample was collected from each sampling site and stored it in a 1 L polyethylene bottle, and then was immediately fixed by adding Lugol’s solution and 4% formaldehyde solution. The 1 L sample was concentrated to 30 mL using the siphon method after being stored in the laboratory for 48 h. This sample was used for the detection of the phytoplankton Rotifera and Protozoa. Another 20 L water sample was collected from each sampling site, filtered through a No. 25 (pore size 64 µm) plankton net, concentrated to 100 mL, and fixed by adding 4% formaldehyde solution immediately. This sample was used for the detection of Cladocera and Copepoda. Phytoplankton and zooplankton concentrated samples were identified and counted under an Olympus CX23 microscope using 0.1 mL and 1 mL counting chambers, respectively. The phytoplankton and zooplankton species were identified utilizing manuals [33,34].
2.3. Application of the P–IBI
2.3.1. Reference Sites and Impaired Sites
The selection of reference and impaired sites is the basis for the application of the P–IBI. Reference sites usually refer to the sampling sites not disturbed by human activities [35]. However, most of the world’s freshwater ecosystems are disturbed by human activities to varying degrees. In theory, there are no sampling sites completely unaffected by humans. Based on the actual habitat conditions in the study area, the sampling sites with the best physical, chemical, and biological conditions were selected as reference sites through field visits. Sampling sites with relatively frequent human activities and relatively low seasonal average water quality were selected as impaired sites.
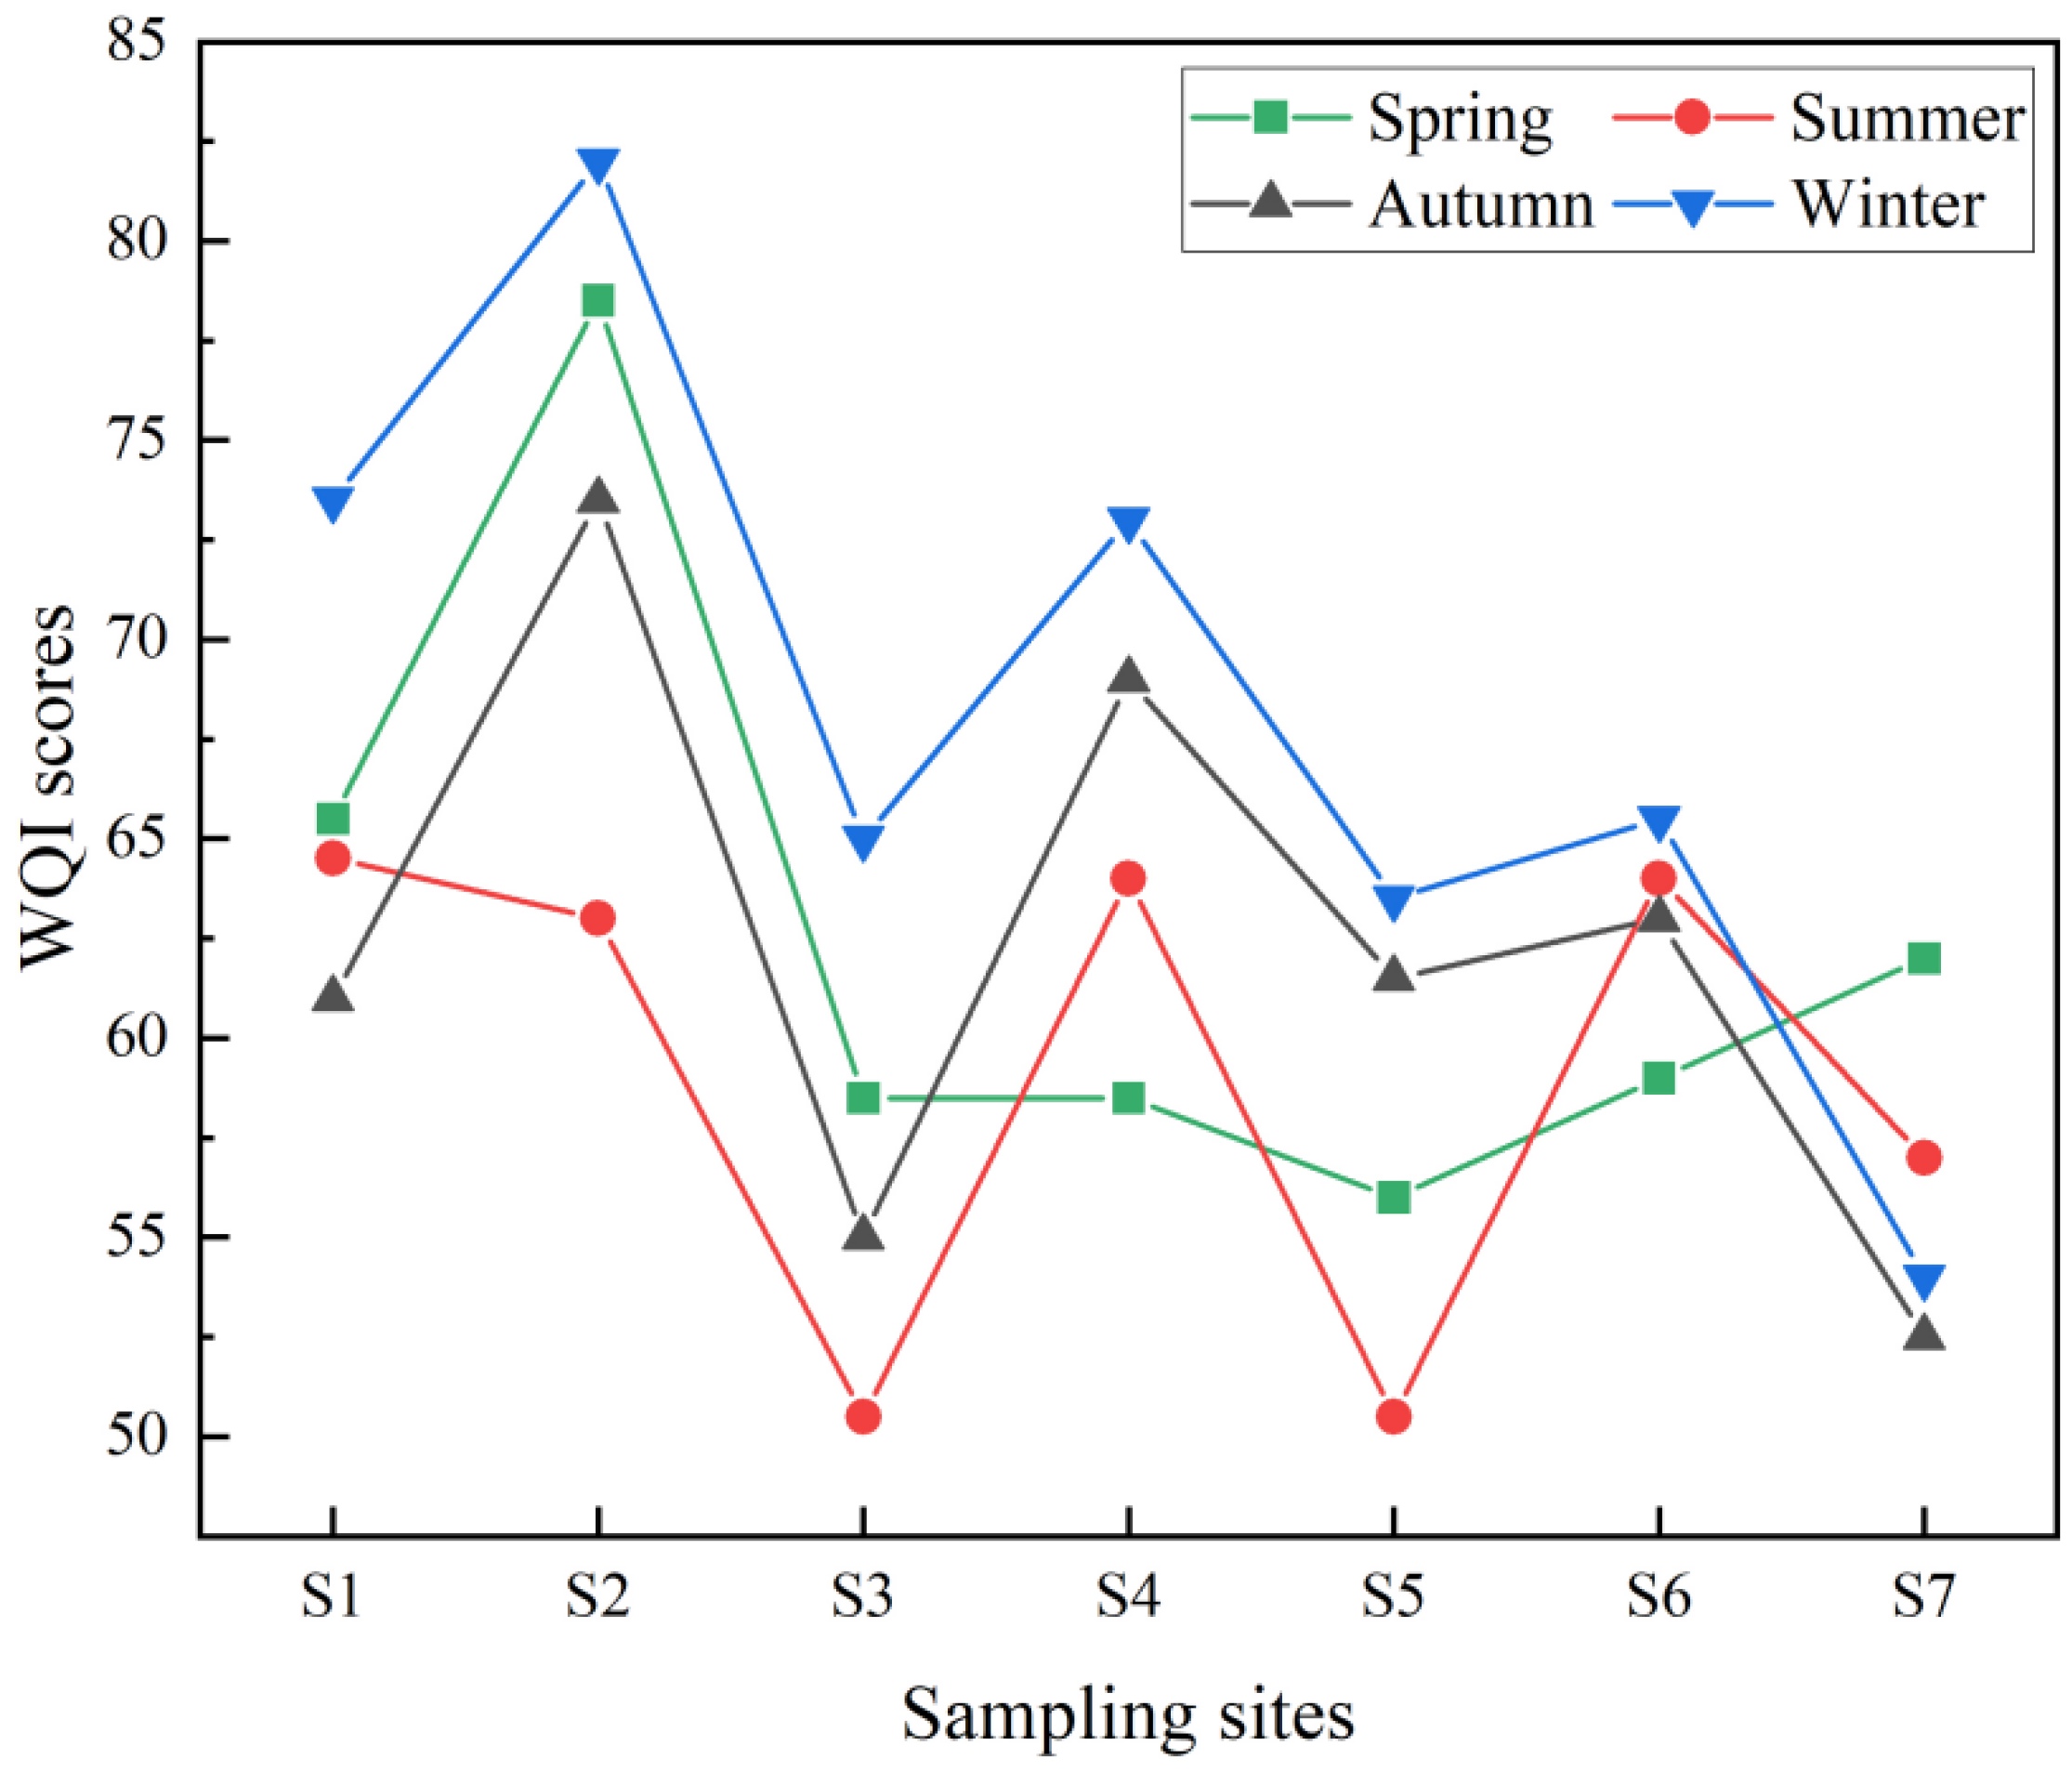
Field investigations showed that the river segment S2 was dominated by forest, partly grassland and dry land, and relatively little farmland. S1 and S2 were located in the upper reaches of the Yitong River. Both were on higher terrain compared to other sites. The population density of S1 surroundings was higher than that of S2 surroundings. The Xinlicheng Reservoir, where S2 was located, opens flood gates to the middle and lower reaches during the flood season in high water years, becoming one of the main water sources in the Yitong River. The basic water quality of the Yitong River was preserved. The concentrations of nutrients and organic pollutants at S2 were relatively low, the WQI was better than at other sites, and the river was relatively clean at S2 (Figure 2). S1, S6, and S7 had mostly villages and suburbs near the river, and the surrounding areas were covered by farmland. Sampling points S3–S5 were in the urban area of Changchun, where the population density was high, and the riverbanks were mostly surrounded by the ring roads, causing traffic pollution. Therefore, S2 was selected as a reference site, and other sites (S1, S3–S7) were selected as impaired sites.
2.3.2. Determination and Screening of Candidate Metrics
Considering the four plankton community characteristics (i) biomass, (ii) abundance, (iii) diversity, (iv) and trophic status, 22 candidate metrics were selected for phytoplankton indices of biotic integrity (Phyto–IBI) (Table S1), and 21 candidate metrics for zooplankton indices of biotic integrity (Z–IBI) (Table S2), while protozoa data were supplemented [21,28]. All candidate metrics were subjected to interference response, distribution range tests, discrimination power, and redundancy tests, and the biological metrics used to calculate P–IBI were screened out. We eliminated metrics with too many zero values and narrow distribution ranges, and then used the boxplot method to test the discrimination power of the candidate metrics. We eliminated the candidate metric when the 25–75% percentile range of impaired sites overlapped with the reference site to achieve a good distinction between the reference site and the impaired sites. The reserved candidate metrics were further analyzed with Pearson correlations. A correlation metric value between the two parameters of |r| ≥ 0.75 indicated that the information expressed by the two had a large overlap. One was reserved for establishing the P–IBI evaluation system [17].
2.3.3. Calculation of P–IBI Scores and the Establishment of Evaluation Criteria
The selected indicators needed to be converted to unify parameter dimensions. We referred to the methods of Zhu, et al. [17] for the calculation of P–IBI scores and evaluation criteria for the Yitong River. The P–IBI in different seasons were obtained by calculating the average of the Phyto–IBI and Z–IBI for each season [28]. We defined five criteria for evaluating the ecological health of the Yitong River: excellent, good, moderate, low, and bad.
2.4. Data Processing and Analysis
The water quality index (WQI) was used to objectively evaluate the water quality of the Yitong River based on water quality parameters. On the one hand, it was compared with the P–IBI evaluation results to assess differences between them. On the other hand, the feasibility of the P–IBI evaluation system was judged using the evaluation results of the WQI. According to previous research [36,37], combined with the “Environmental quality standards for surface water” (GB 3838–2002), the corresponding normalized values and weights of each index are listed in Table S3. The specific formula of WQI is:
where n is the total number of water quality parameters, Ci is the normalized value assigned to parameter i, and Pi is the relative weight assigned to parameter i. Using the WQI, the water quality status can be divided into five levels: excellent (91–100), good (71–90), moderate (51–70), low (26–50), and bad (0–25) [38].
We calculated P–IBI scores and metrics using Excel 2019. The discrimination power test and the temporal and spatial trend statistics of P–IBI scores were calculated using Origin 2021. SPSS 26.0 was used to perform Pearson correlations between candidate metrics. We used R–4.1.2 to draw a Pearson correlation heat map of environmental parameters and the P–IBI metrics in different seasons and the fitting curves of the WQI and P–IBI. A sampling site map and a P–IBI spatial distribution map were produced with ArcGIS 10.6.
3. Results
3.1. Development of the P–IBI
Taking the Phyto–IBI in spring as an example, the screening process of each metric was as follows. First, two metrics (P3 and P10) were eliminated due to excessive zero values and a narrow distribution range. Fifteen metrics were selected from the remaining 20 phytoplankton candidate metrics using the discrimination power test (Figure S1). The remaining five metrics (P6, P7, P11, P12, and P21) were excluded due to the low degree of separation between the reference site and the impaired sites. Second, a Pearson correlation analysis was performed among the selected 15 candidate metrics to test the independence of the information reflected by each metric and avoid redundancy. When |r| ≥ 0.75, the degree of overlap between metric information was considered high. For example, P2 and P5 were highly correlated (r = 0.990, p < 0.01) (Table S4), but compared with P5, P2 could retain more information. Therefore, P2 was reserved for the elaboration of the Phyto–IBI. The final Phyto–IBI in spring consisted of the metrics P2, P13, P15, and P16, and its score was the sum of the four metrics. The Phyto–IBI and Z–IBI of other seasons were calculated following the same procedure. By calculating the average of the Phyto–IBI and the Z–IBI, the final P–IBI score for each sampling site in each season was obtained. Finally, the ecological health status of each sampling site in different seasons was obtained according to the health evaluation standard described previously. The P–IBI metrics screened out in each season are shown in Table 1, and the P–IBI evaluation criteria are shown in Table 2.
3.2. Temporal and Spatial Variation of the P–IBI
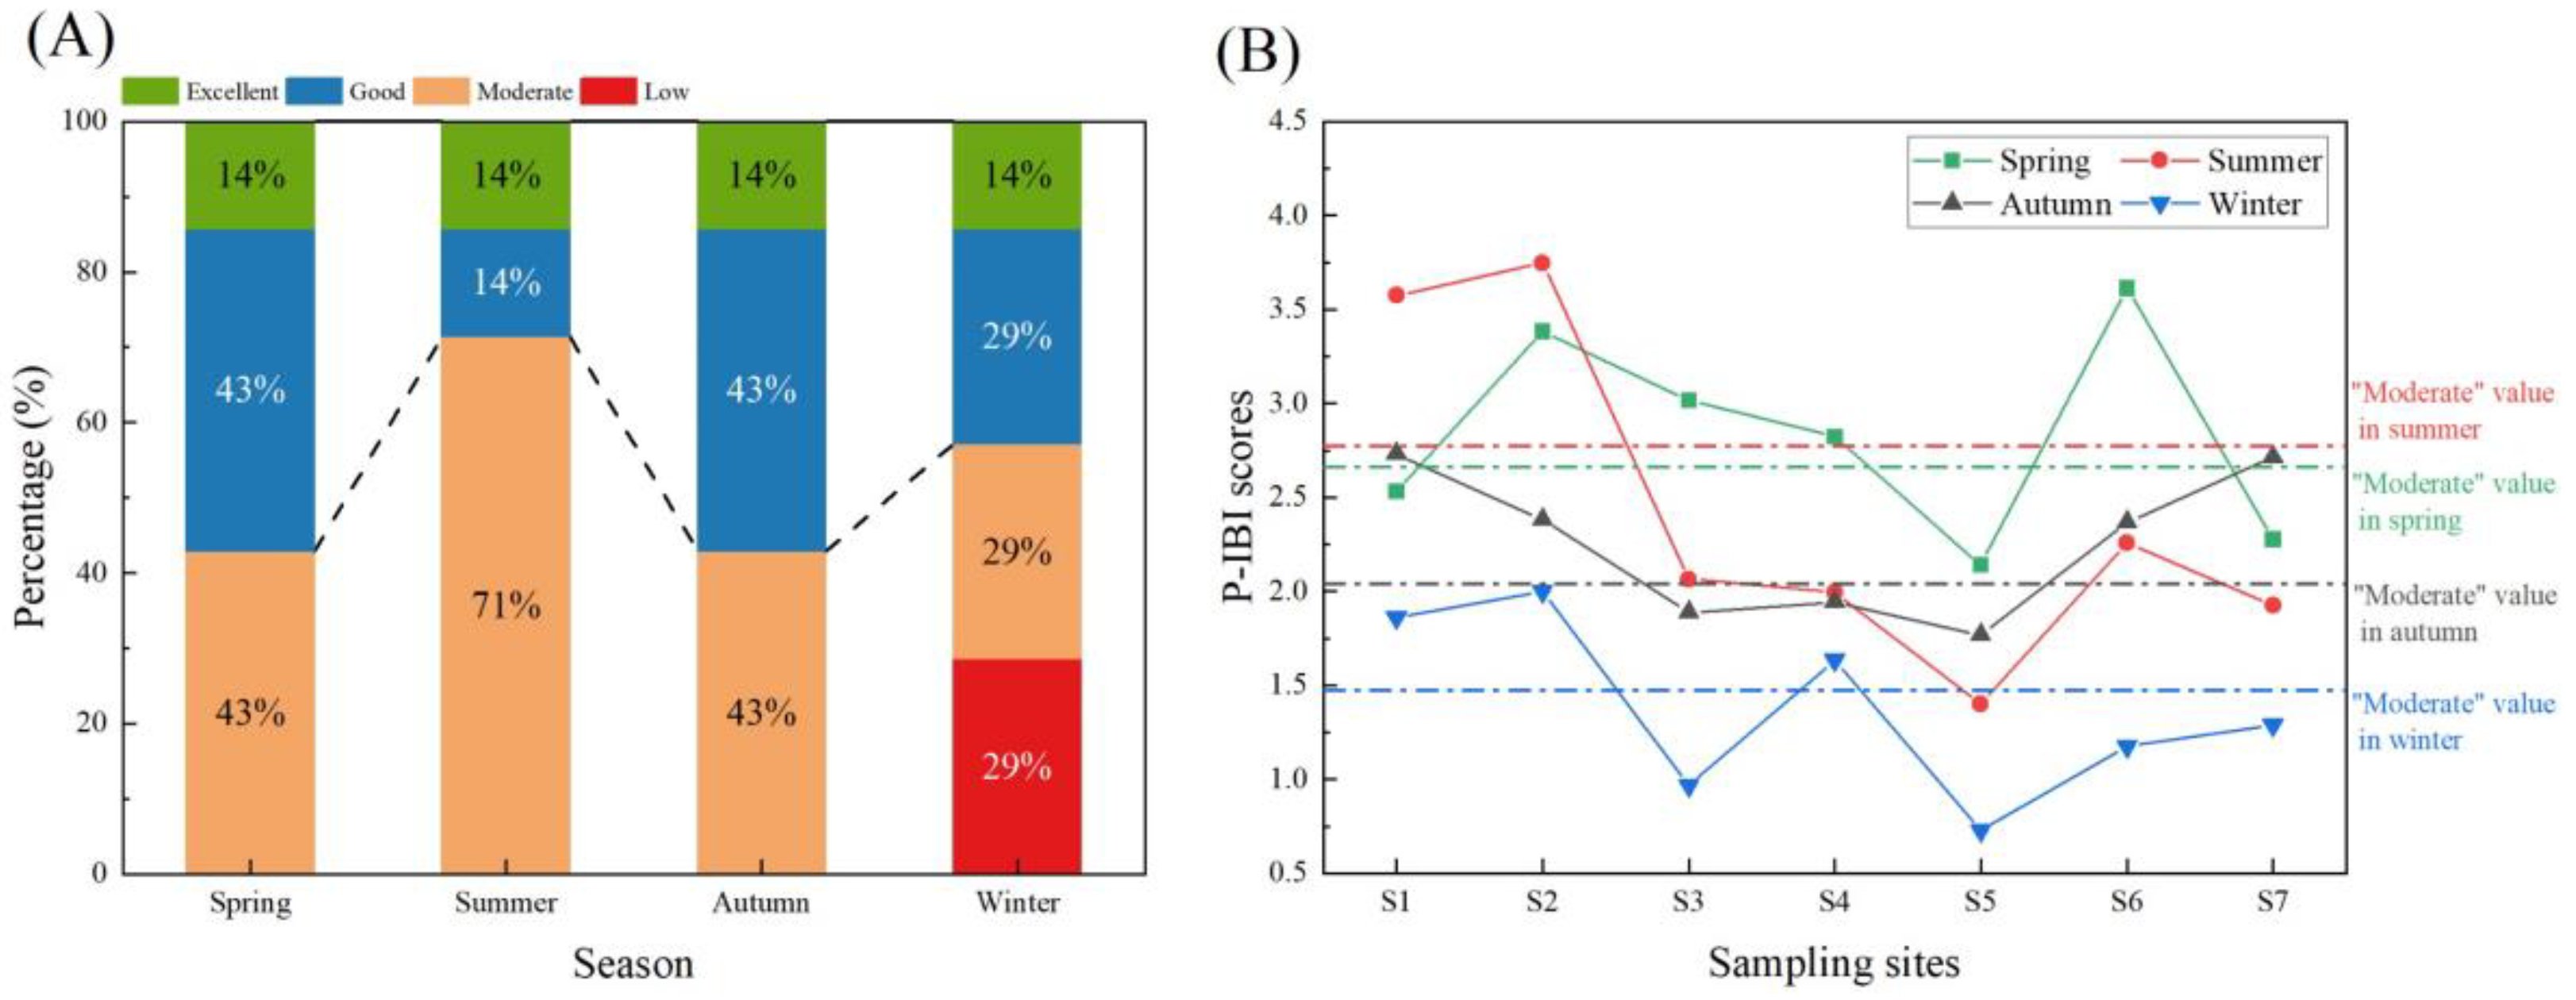
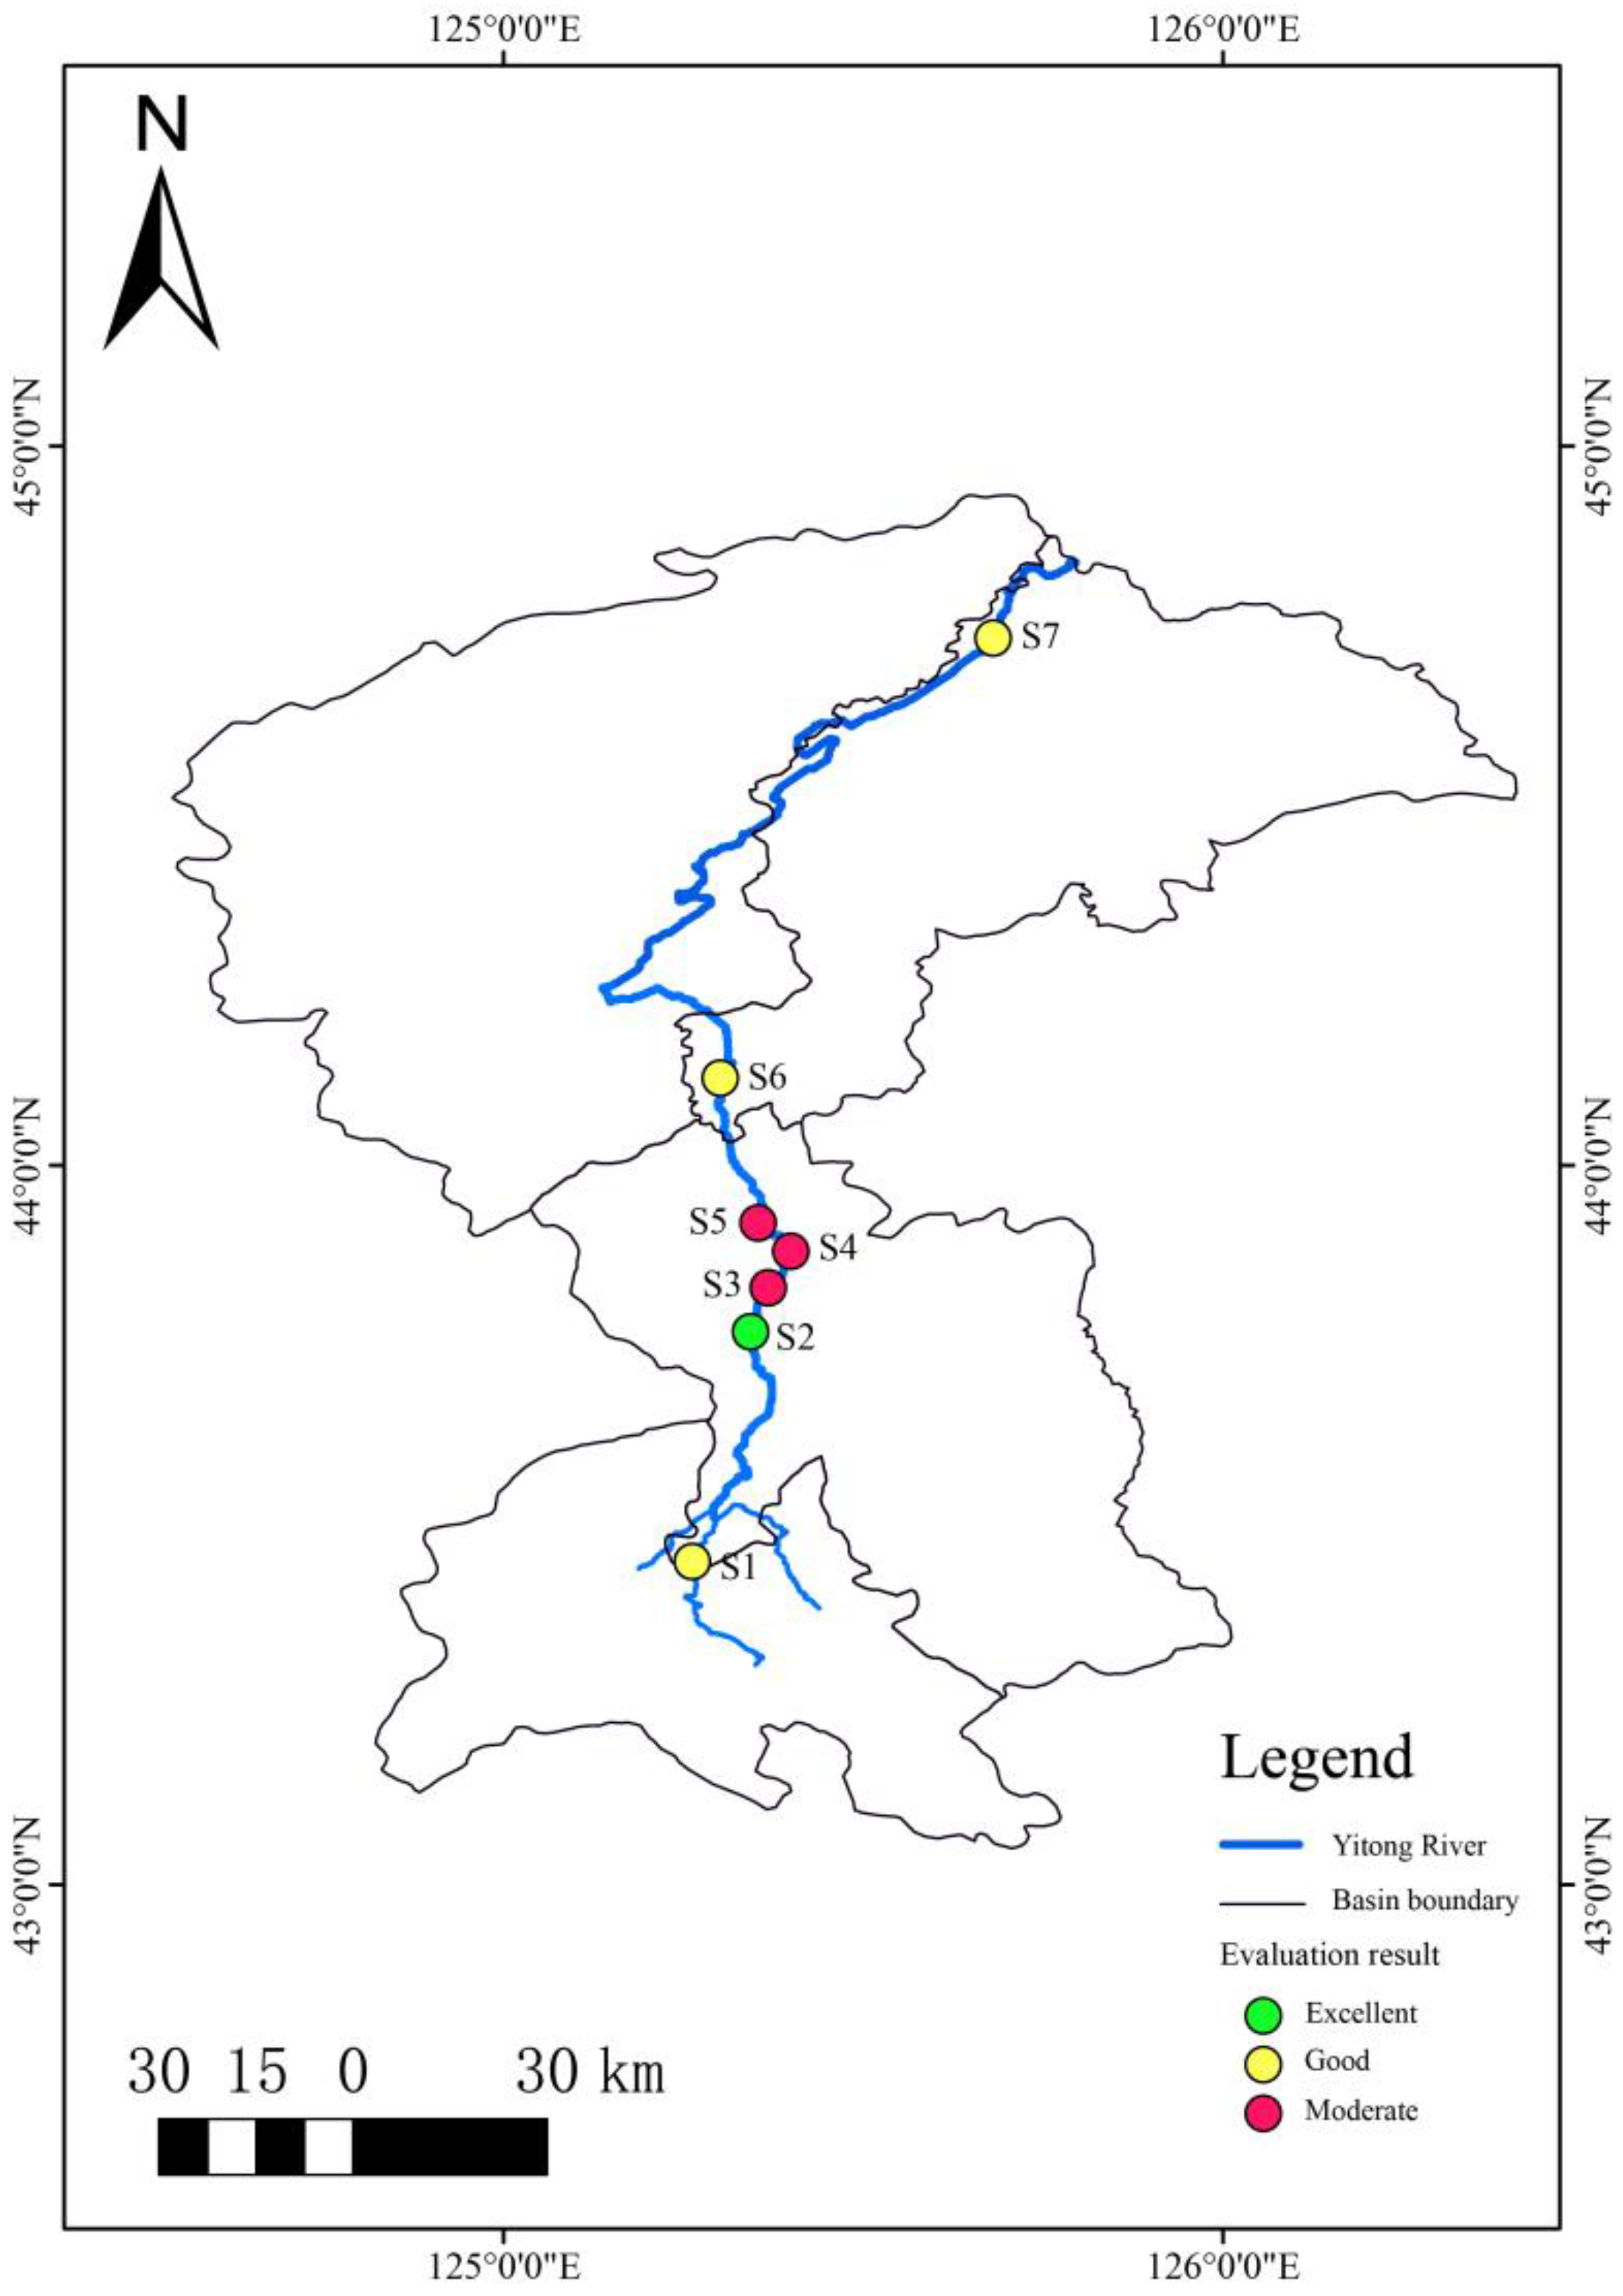
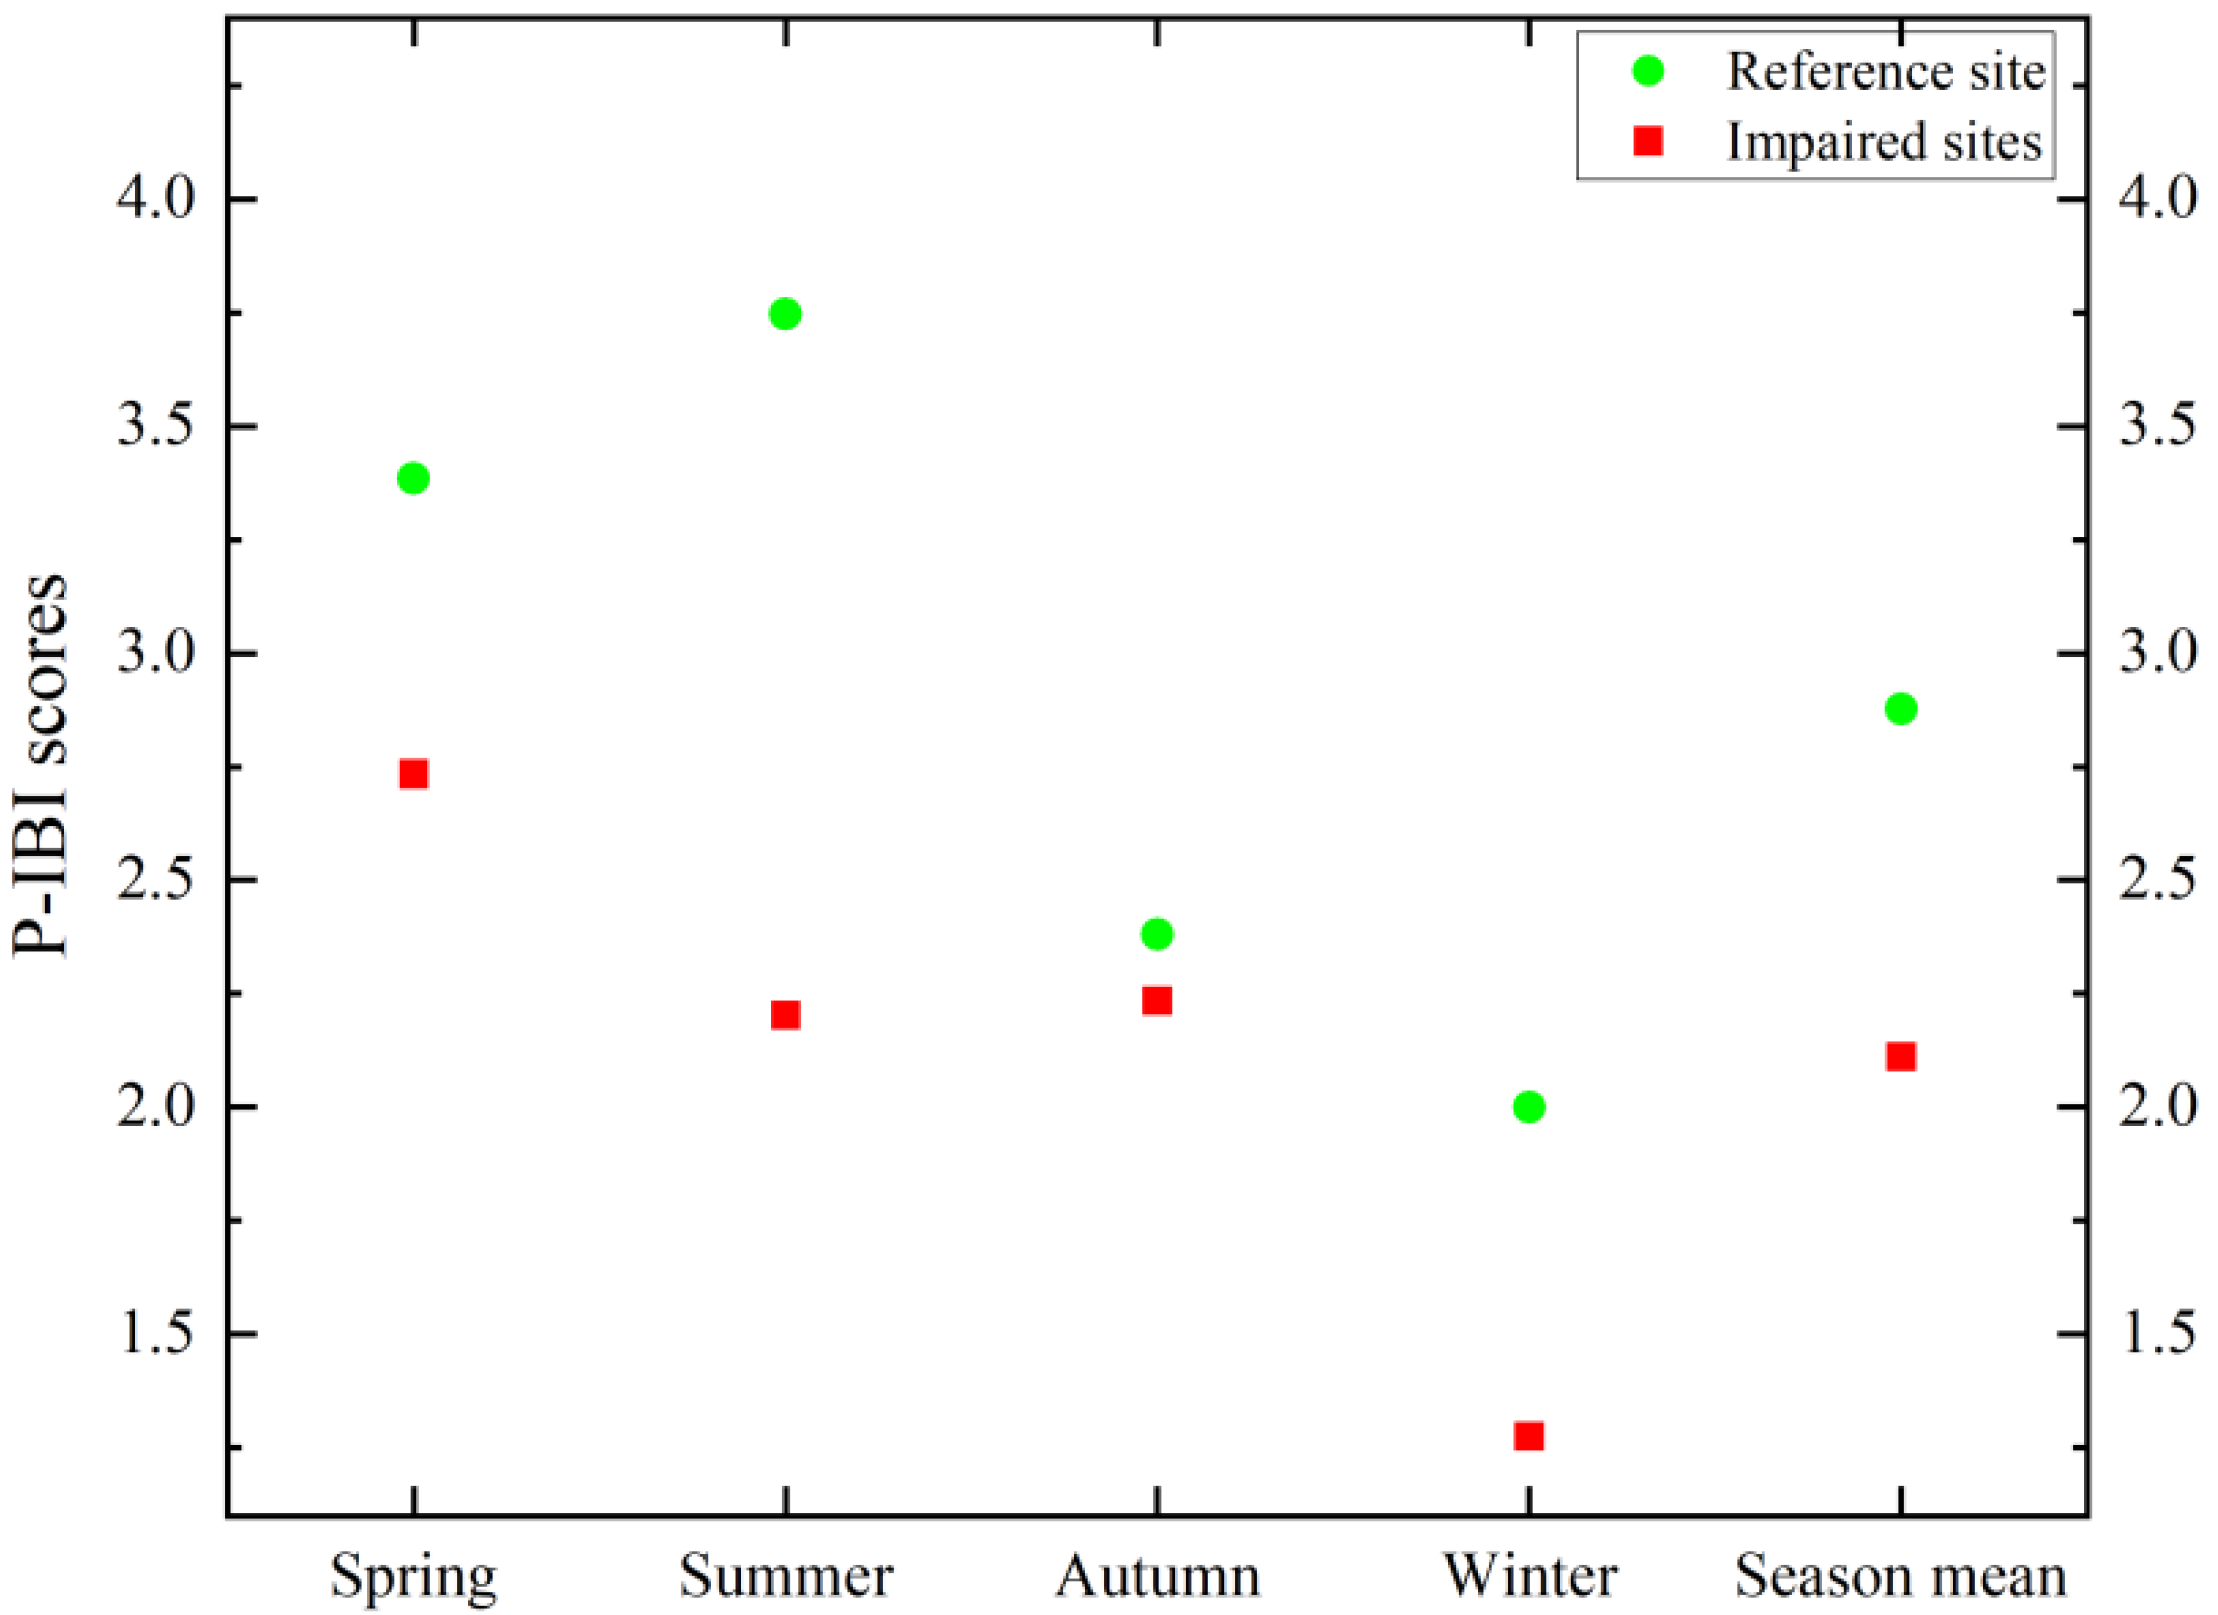
The health status of the Yitong River showed obvious seasonal changes. The health status was best in spring and autumn and worst in summer. In spring and fall, 57% of the sites showed evaluation results above “moderate”, in winter (43%), and in summer there were only 28% (Figure 3a). However, S3 and S5 were rated as “low” in winter, accounting for 29% of the sampling sites. The variation trend of the P–IBI among the sampling sites showed high consistency in different seasons, and the health status of S2 was at the “excellent” or “good” level throughout the year. From the upper reaches of the Yitong River to the urban middle reaches (S1–S5), the P–IBI value showed a clear downward trend. This trend reversed at S6 in the lower reaches (Figure 3b), which indicated that human activities strongly influenced the water body of the Yitong River flowing through the urban area of Changchun. The S5 sampling point in the lower reaches of the urban area was only “low” in summer and winter. According to the seasonal average P–IBI value of each sampling site, the health evaluation result of S2 was “excellent”. S1, S6, and S7 were classified as “good”, and the points S3–S5 as “moderate” (Figure 4). P–IBI could discriminate effectively between reference and impaired sites on all time scales (Figure 5).
3.3. Correlations between P–IBI and Environmental Factors
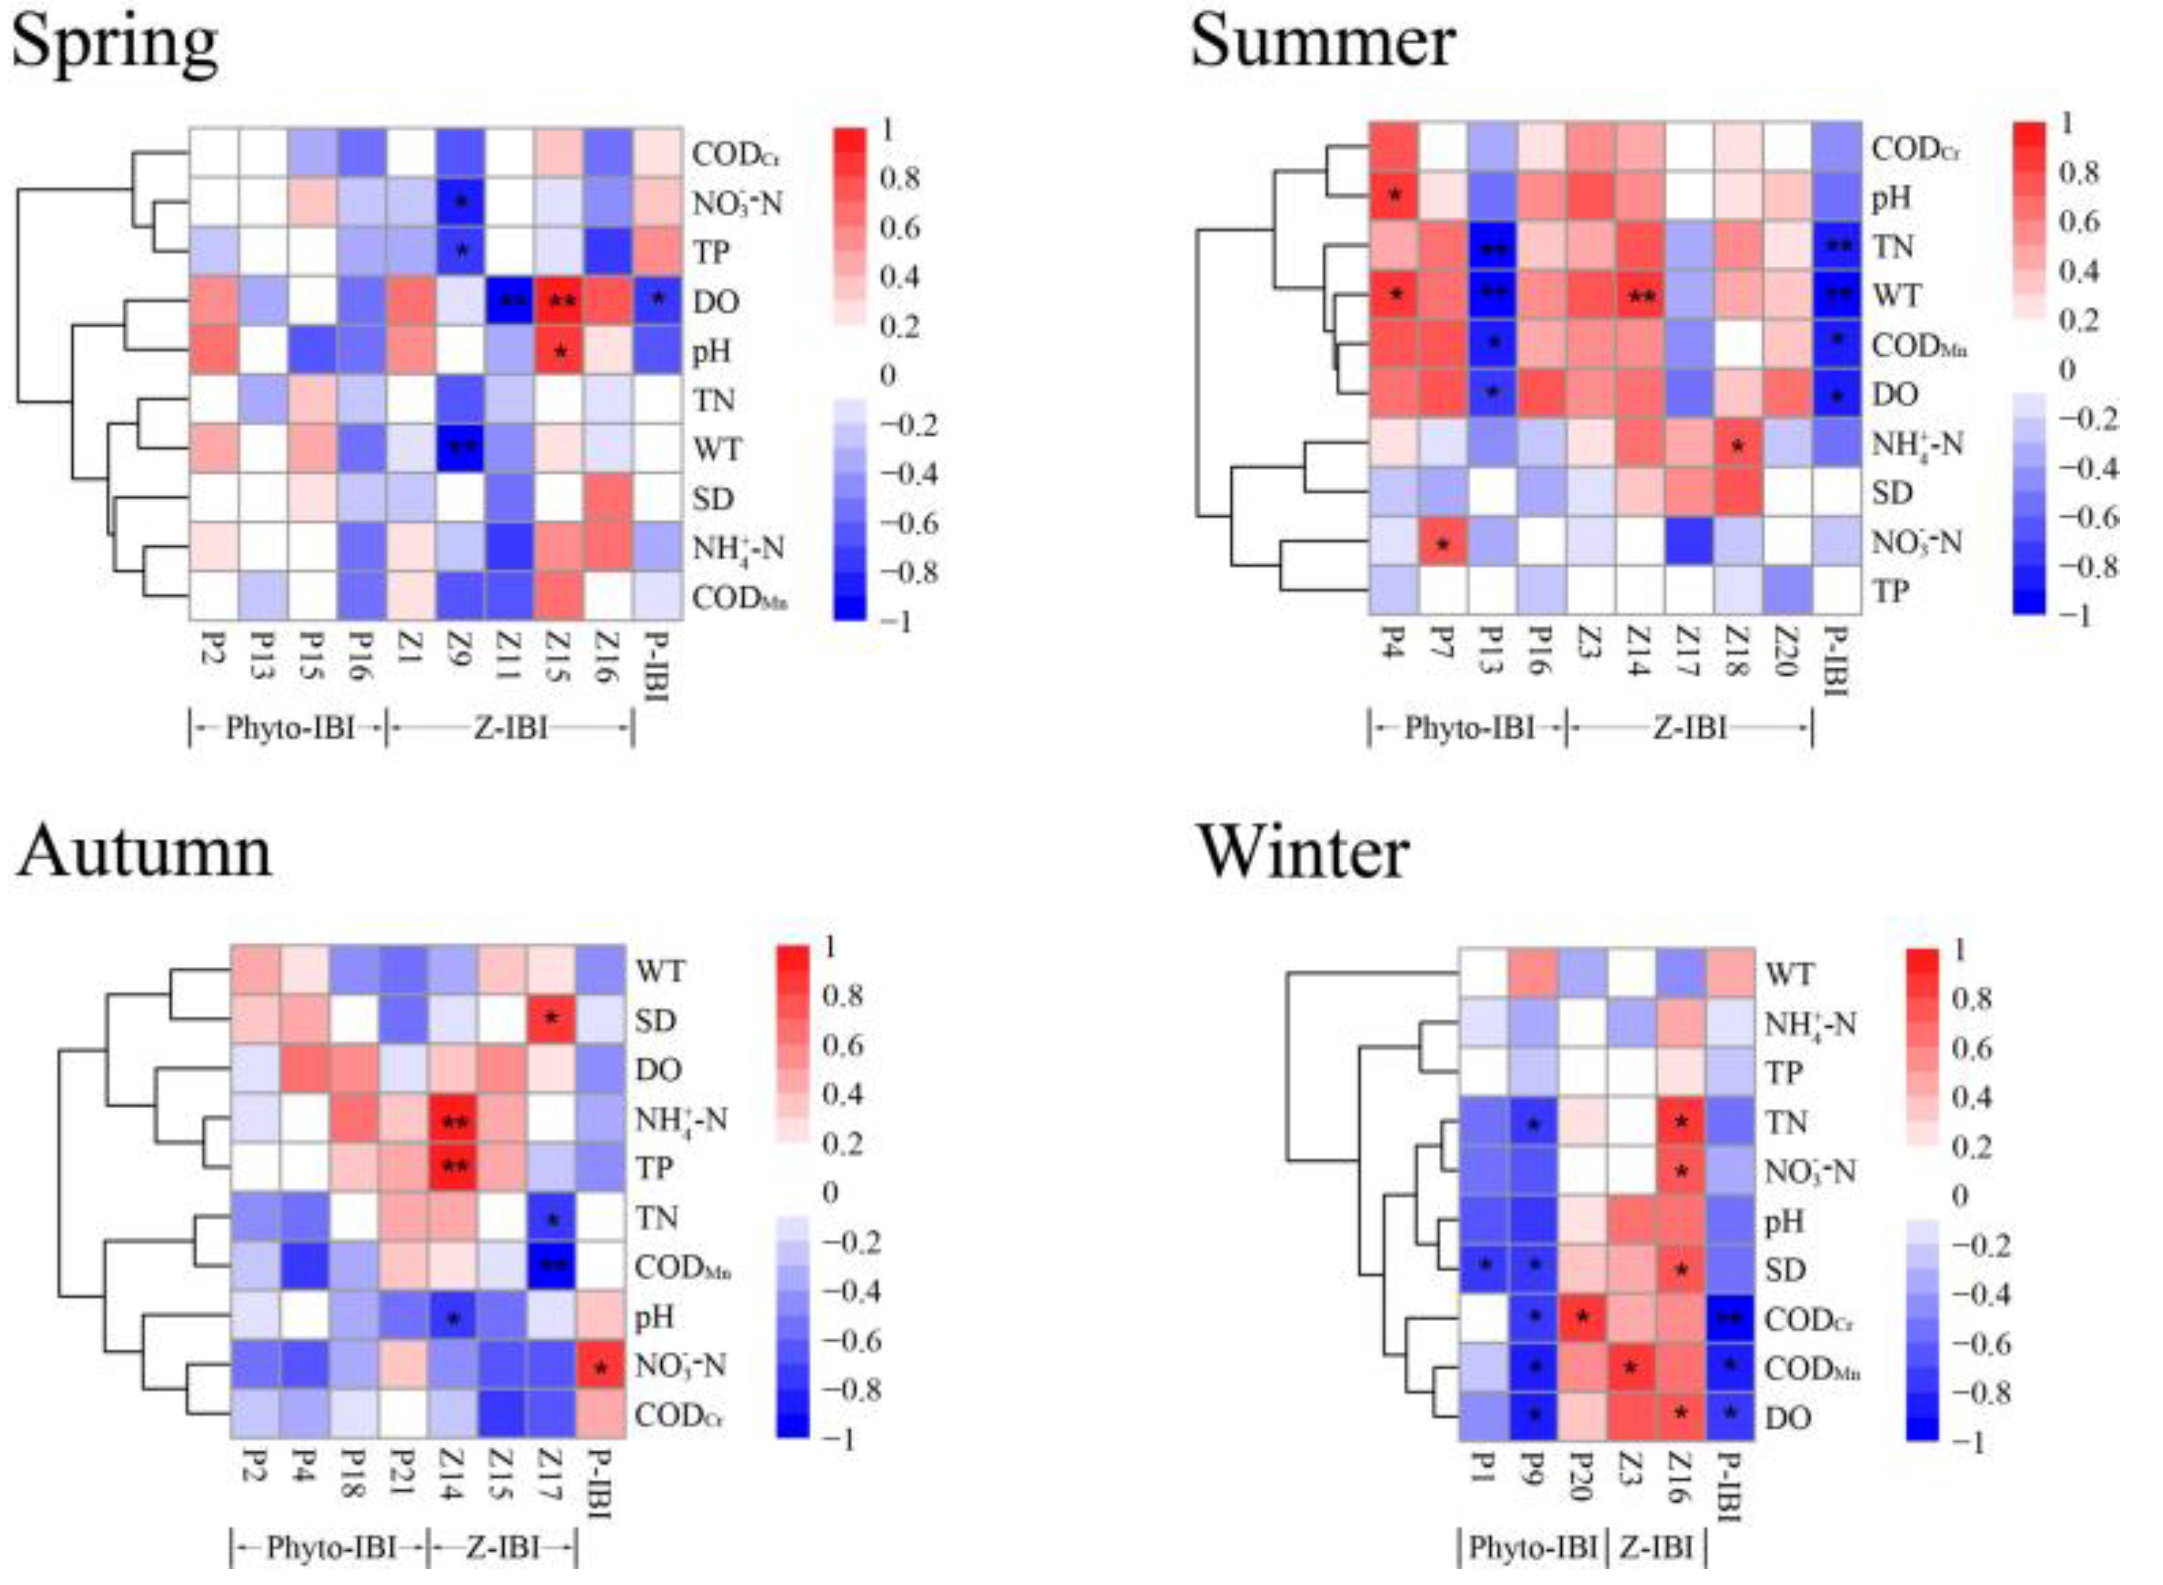
P–IBI values showed negative correlations with most environmental factors in different seasons (Figure 6). In spring and autumn, when the water body health level was the highest, few environmental factors were significantly related to P–IBI values. The environmental factors were mainly significantly correlated with Z–IBI metrics and not significantly correlated with Phyto–IBI metrics. The environmental factor that significantly affected the P–IBI value in spring was DO, and in autumn it was NO3−–N. However, the Phyto–IBI and Z–IBI metrics were significantly correlated with most environmental factors in summer and winter. The P–IBI was highly significantly negatively correlated with TN and WT and significantly correlated with CODMn and DO in summer. In winter, the P–IBI was highly significantly correlated with CODCr and significantly correlated with CODMn and DO.
3.4. Comparison between P–IBI and WQI
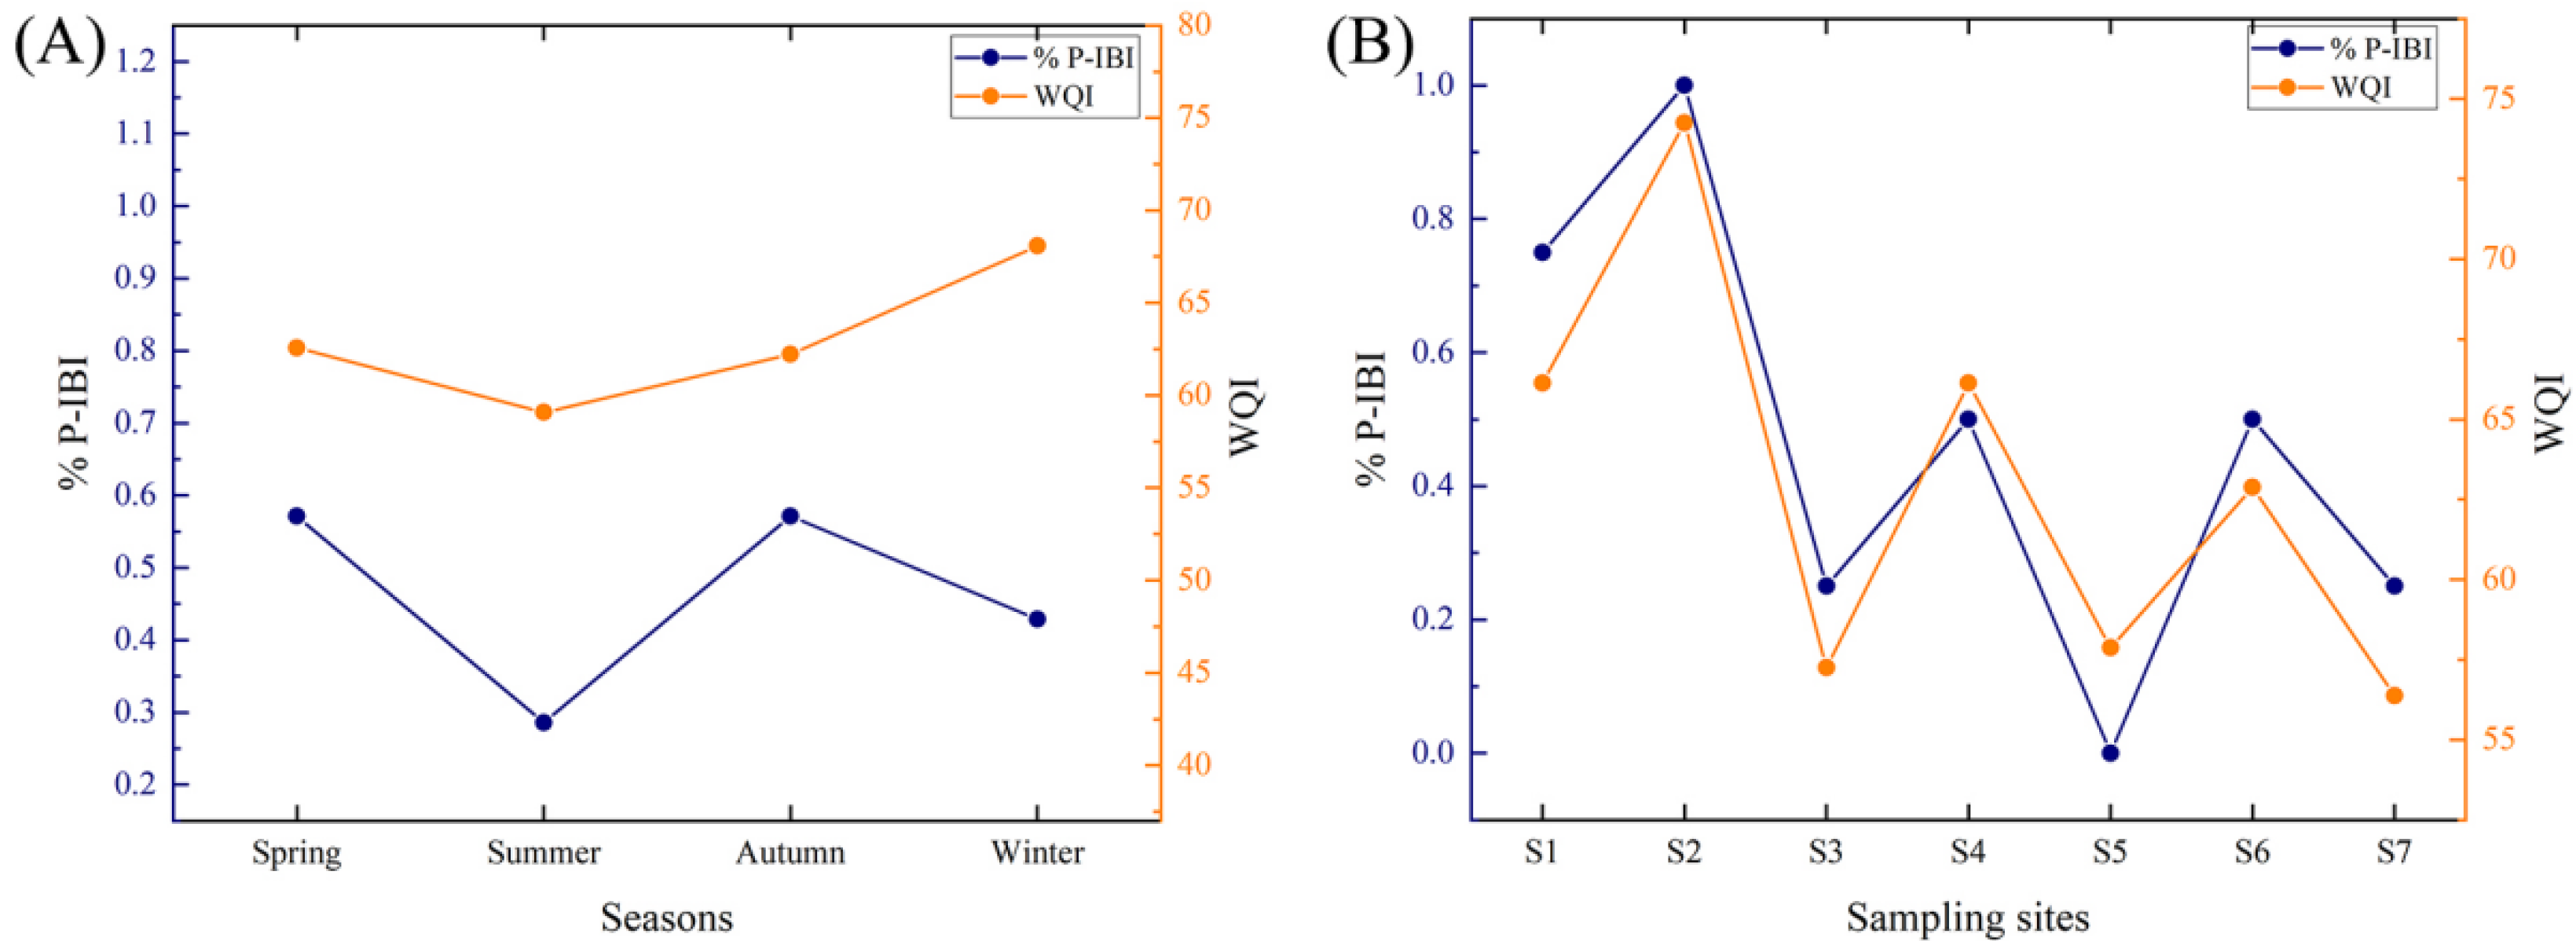
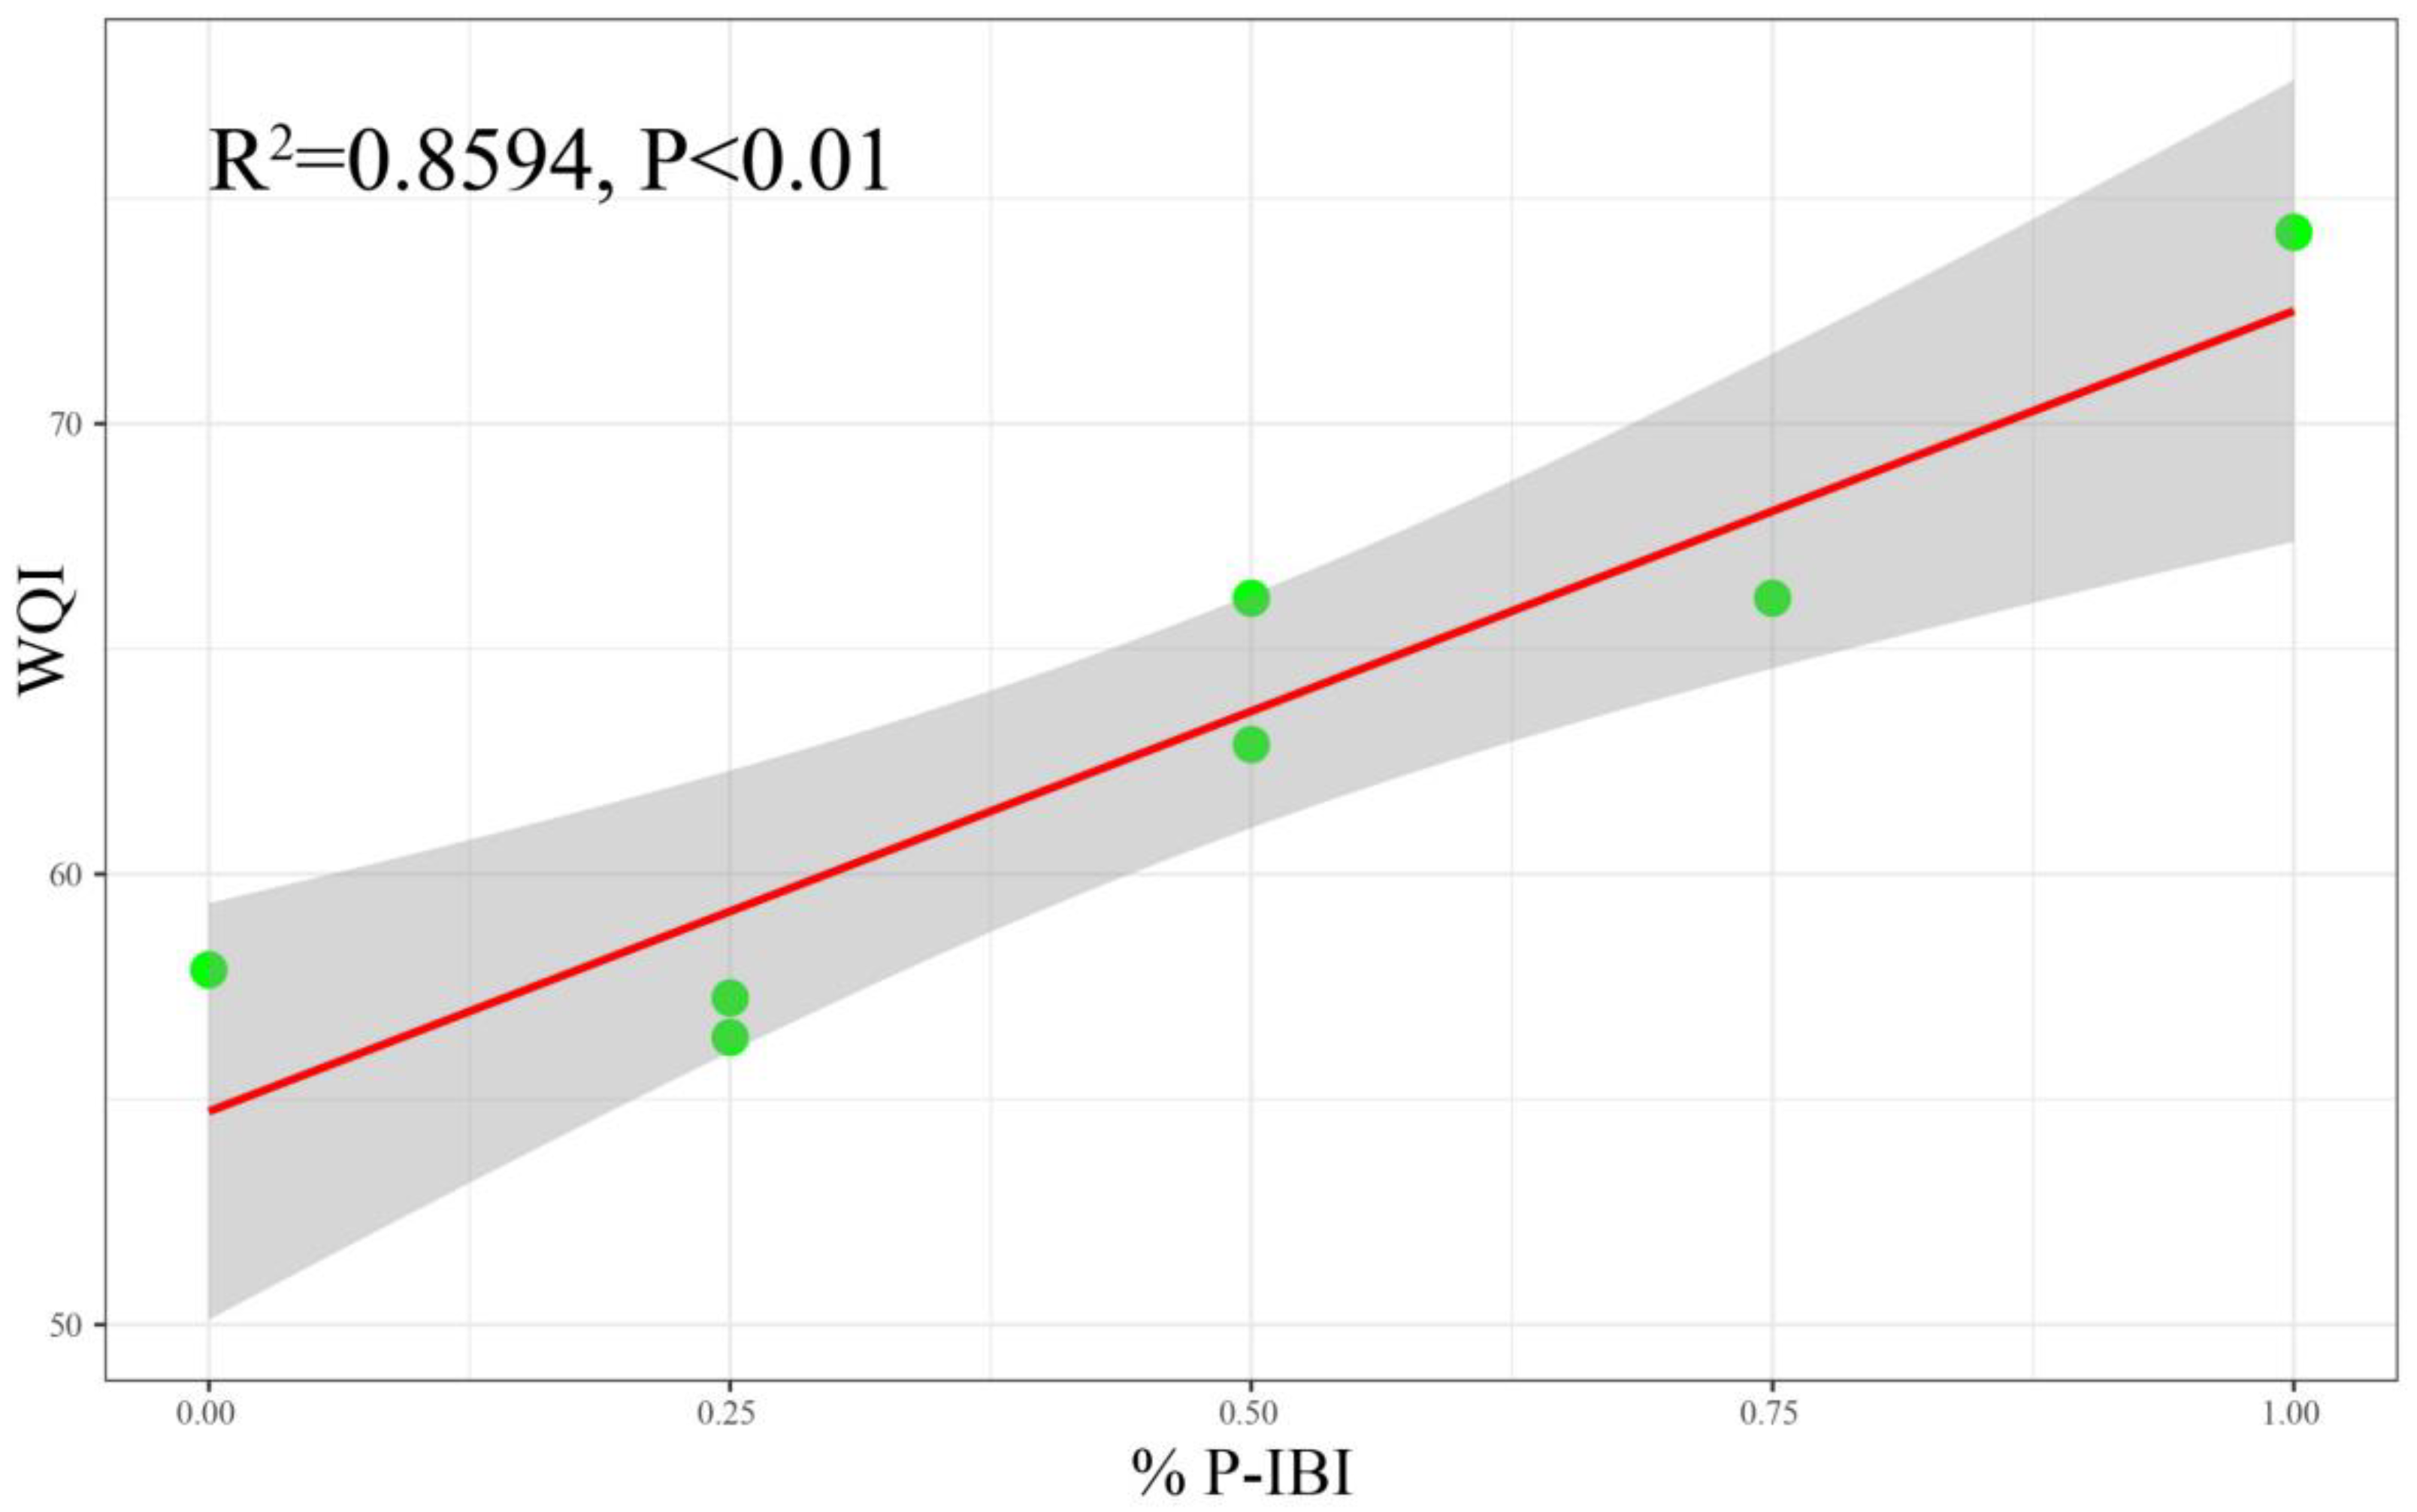
On a seasonal scale, the trends in the P–IBI and WQI evaluation results showed consistency, except for winter (Figure 7a). Based on seasonal average values, the percentage of sampling sites with P–IBI evaluation results exceeding the “moderate” level (% P–IBI) and WQI evaluation results showed an apparent synchronization regarding the distribution of sampling sites (Figure 7b). Furthermore, there was a highly significant positive correlation between % P–IBI and WQI (R2 = 0.8594, p < 0.01) (Figure 8). Except for the same evaluation results of points S3–S5, the evaluation results based on the P–IBI had a relatively higher evaluation level than those of the WQI. For example, the evaluation of S2 based on the WQI showed a “good” classification, and the evaluations of other sampling points were all “moderate”. However, based on the P–IBI, S2 was in the “excellent” category, and S1, S6, and S7 were in the “good” state.
4. Discussion
4.1. Spatial and Temporal Differences and Feasibility Analysis of P–IBI Assessment
The established P–IBI evaluation system integrated the structural characteristics of plankton along the Yitong River in different seasons. The Yitong River had the best health classifications in spring and autumn, with 57% of the sites with an evaluation level higher than “moderate”, followed by winter (43%) and summer (28%) (Figure 3a). However, the P–IBI and the WQI results did not show complete consistency on the seasonal scale (Figure 7a). According to the evaluation results of WQI, the season with the highest health evaluation was winter. This result was consistent with Wu et al.’s [39] study of the Taihu Lake Basin, i.e., the reason for the large difference in evaluation results in winter was likely due to the parameters selected by the two methods. The evaluation system based on the P–IBI was mainly established by the discrimination power test and correlations between candidate metrics, while the WQI is based on detected environmental parameters and their weights. Plankton growth in temperate rivers showed strong seasonality, especially in phytoplankton [40]. Due to low temperatures in winter, it was difficult for plankton to grow normally [41], and a single species could be observed in most locations, which led to the deviation of P–IBI evaluation results in winter. However, the DO concentration was an important indicator determining its numerical value in the WQI method. The relative weight assigned to it was 4, and the DO concentration in the Yitong River Basin was high in winter. The DO concentrations of all sampling points exceeded 7.5 mg/L and the assignment results for most water quality parameters were higher in winter than in other seasons, which increased the WQI value in winter to a certain extent (Table S5). The P–IBI evaluation of the health of the Yitong River in summer was consistent with the WQI method, i.e., the water quality was worst in summer. This was linked to an increase in cyanobacteria due to warmer summer temperatures as well as higher nutrient concentrations in the water, which further confirmed the accuracy of P–IBI in evaluating the ecological health of the Yitong River.
As for the spatial distribution, the health evaluations of S2 were all “excellent” or “good” throughout the year, while S3 and S5 were mostly in the “moderate” or lower level in all seasons. On the one hand, the S3–S5 sampling points were in the urban area of Changchun. Compared with other sites, the population density of S3–S5 surroundings was high with frequent human activities, causing serious disturbances to the river. Besides, tributaries of S3–S5 were also flowing through the urban area, which may have further magnified the impact of allochthonous pollution [42]. The rapid development of the urban economy and urbanization, the development of river banks, excessive utilization of water resources, and domestic sewage have caused apparent effects on the river water quality and ecology [43]. On the other hand, there were large sewage treatment plants in urban areas near S3 and S5. The treated sewage was directly discharged into the river, which had a certain impact on the integrity of the plankton. The P–IBI values had obvious seasonal patterns in the basin, but in autumn, the longitudinal trend of P–IBI values was relatively stable compared with other seasons, and the reference site S2 showed a significant decrease compared with the trend in S1 (Figure 3b), which did not appear in the seasonal trends of other points. The main reason for this was that in October 2021, the Xinlicheng Reservoir, where S2 was located, was carrying out flood discharge work. The higher flow led to a decrease in the abundance of plankton communities. The dilution and rapid flow affected the growth of plankton [42,44] and adversely affected plankton integrity characteristics, resulting in lower P–IBI values. According to seasonal average P–IBI values (Figure 4), the annual health evaluation of S2 was “excellent”, and those of the points S1, S6, and S7 with rural and suburban land use were “good”. The evaluation results of S3–S5 in the urban reach were “moderate”, indicating that the impact of human activities on the P–IBI was significantly stronger here than in farmland river sections.
To prove the accuracy and feasibility of the evaluation system established for the Yitong River based on the P–IBI, P–IBI and WQI results were linearly fitted and analyzed. Moreover, the separation ability of the P–IBI between the reference site and impaired sites was verified. Comparing the % P–IBI and WQI scores of the sampling sites, the dynamic trend of the two throughout the year was completely synchronized (Figure 7b). The % P–IBI and WQI also showed a highly significant positive correlation (Figure 8), indicating excellent consistency in the evaluation methods. The separation ability between the reference site and the impaired site groups was apparent (Figure 5). Although the separation ability between the reference site and the impaired site groups was low due to the external force of the reservoir flood discharge regime in autumn, according to the evaluation results of the whole year, the evaluation system based on the P–IBI can still be used as a scientifically sound and objective method to evaluate the ecological health of the Yitong River Basin.
According to the WQI evaluation results, except for the reference site S2, all sites were rated as “medium”. Unlike the P–IBI, the WQI could not distinguish between urban and rural reaches. The P–IBI is dependent on the high sensitivity of plankton to the inorganic salts in the river water and it can reflect a series of external environmental changes such as climate and river flow as well [44,45]. These characteristics cannot be assessed by the WQI [21]. Therefore, the P–IBI is more suitable for the ecological health evaluation of urban waterbodies with seasonal climate changes.
4.2. Correlations between the P–IBI and Environmental Factors
In spring and autumn, with higher health levels, there was no significant correlation between environmental factors and Phyto–IBI metrics. The main reason for this may have been that the complex external environment in spring and autumn more strongly promoted dynamic changes in biological integrity. During spring, the water body underwent a thawing process that caused seasonal changes in river flow, affecting the Phyto–IBI [46]. In autumn, the most obvious external change was the flood discharge work carried out by the reservoir in the sampling month. As a result, the zooplankton could have become relatively stable due to these external environmental changes, while phytoplankton is more mobile and easily carried away to other areas by external factors such as wind, waves, or currents [17,47]. Therefore, the impact of external forces on Phyto–IBI metrics was significantly greater than that of environmental factors, resulting in fewer environmental factors significantly correlated with the P–IBI. The Yitong River Basin was hot and rainy in summer, and the environment with high WT likely led to the formation of cyanobacterial blooms and related effects on the aquatic ecosystem [48]. In addition, rainfall can erode riverbanks and wash nutrients from the soil into water bodies, which can affect the integrity of plankton, resulting in highly significant negative correlations between TN as well as WT and the P–IBI in summer. In winter, both CODCr and CODMn showed a significant negative correlation with the P–IBI. Thus, we should be alert to the negative impact of organic pollutants on the Yitong River in winter.
4.3. Implications for River Health Management
Our results are of great significance to the ecological health evaluation of the Yitong River and its management and maintenance. First, compared with the WQI method, the ecological health evaluation of the Yitong River based on the P–IBI is scientifically sound and objective. Therefore, while monitoring the water quality of the river, its biological integrity should also receive sufficient attention. Second, the ecological assessment should fully consider seasonal changes in rivers. According to our results, there were obvious seasonal differences in the health status of the Yitong River. According to correlations between environmental parameters and the P–IBI, the main environmental factors affecting the biological integrity in different seasons were identified, which is an effective measure for managing aquatic ecosystem health. It is worth noting that the difference between the P–IBI and WQI in winter can also provide theoretical support for river managers, that is, health evaluation from a biological perspective should not be ignored in seasons with good water quality. Finally, according to the spatial distribution of the P–IBI evaluation results, urban river sections showed relatively high pollution levels. Therefore, local managers should pay special attention to the effects of human activities and sewage control in urban areas. Improving river water quality and creating a river basin environment where man and nature can coexist in harmony should be a priority.
5. Conclusions
(1) The P–IBI evaluation system established in this study assessed the ecological health of the Yitong River at different temporal and spatial scales. The ecological health of the Yitong River was the best in spring and autumn, followed by winter and then in summer, in which it was worst. According to average seasonal data, urban river reaches were significantly more polluted than rural reaches.
(2) According to correlation analyses between the P–IBI and environmental factors, external hydraulic effects on the Yitong River in spring and autumn were stronger than environmental factors. However, when the biological integrity is relatively poor in summer and winter, we should be alert to external inputs of nitrogen compounds and organic pollutants.
(3) In comparative analyses of the P–IBI and WQI based on average seasonal data, the evaluation results of the two in urban river sections were consistent, but the scores of other sampling sites based on the P–IBI were significantly higher than those based on the WQI. The trends of two methods in winter were significantly different but showed significant spatial synchronicity. Compared with the WQI, the P–IBI can classify the ecological health of urban rivers based on the integration of climate, flow changes, and influences of human activities.
(4) Except for the strong hydraulic influence in autumn, the P–IBI evaluation results of the reference site and impaired sites showed a strong separation ability, suggesting that the ecological health evaluation of the Yitong River based on the P–IBI was completely feasible. Our research results provide a theoretical basis and data support for local managers in the Yitong River Basin.
Supplementary Materials
The following supporting information can be downloaded at: https://www.mdpi.com/article/10.3390/w14193191/s1, references [21,28,32,49,50,51,52,53,54,55,56,57,58] are cited in the Supplementary Materials. Figure S1: Boxplots of 15 candidate metrics between the reference site and impaired sites in spring; Table S1: Candidate metrics for the phytoplankton index of biotic integrity (Phyto–IBI); Table S2: Candidate metrics for the zooplankton index of biotic integrity (Z–IBI); Table S3: Weights and normalization factors of the parameters used in the WQI; Table S4: Correlation analysis among 15 candidate metrics in spring; Table S5: Water quality parameters of Yitong River in different seasons.
Author Contributions
K.Z.: Writing—Original Draft; A.D.: Formal analysis, Conceptualization; S.W.: Methodology, Resources; X.Y.: Writing—Review & Editing, Supervision. All authors have read and agreed to the published version of the manuscript.
Funding
This research was funded by the Key R&D Program of Department of Science and Technology of Jilin Province (No. 20210203035SF).
Data Availability Statement
Data are available on request from the authors.
Conflicts of Interest
The authors declare that they have no conflict of interest.
References
- Luo, Z.; Zuo, Q.; Shao, Q. A new framework for assessing river ecosystem health with consideration of human service demand. Sci. Total Environ. 2018, 640, 442–453. [Google Scholar] [CrossRef]
- Pinto, U.; Maheshwari, B. A framework for assessing river health in peri-urban landscapes. Ecohydrol. Hydrobiol. 2014, 14, 121–131. [Google Scholar] [CrossRef]
- Zhang, W.; Lei, M.; Li, Y.; Wang, P.; Wang, C.; Gao, Y.; Wu, H.; Xu, C.; Niu, L.; Wang, L. Determination of vertical and horizontal assemblage drivers of bacterial community in a heavily polluted urban river. Water Res. 2019, 161, 98–107. [Google Scholar] [CrossRef] [PubMed]
- Determan, R.T.; White, J.D.; McKenna, L.W., III. Quantile regression illuminates the successes and shortcomings of long-term eutrophication remediation efforts in an urban river system. Water Res. 2021, 202, 117434. [Google Scholar] [CrossRef]
- Zhao, Y.; Zhou, L.; Dong, B.; Dai, C. Health assessment for urban rivers based on the pressure, state and response framework—A case study of the Shiwuli River. Ecol. Indic. 2019, 99, 324–331. [Google Scholar] [CrossRef]
- Zhang, K.; Shen, J.; Han, H.; Jia, Y. Urban River Health Analysis of the Jialu River in Zhengzhou City Using the Improved Fuzzy Matter-Element Extension Model. Water 2019, 11, 1190. [Google Scholar] [CrossRef] [Green Version]
- Xu, Z.; Xu, J.; Yin, H.; Jin, W.; Li, H.; He, Z. Urban river pollution control in developing countries. Nat. Sustain. 2019, 2, 158–160. [Google Scholar] [CrossRef]
- Verol, A.P.; Battemarco, B.P.; Merlo, M.L.; Machado, A.C.M.; Haddad, A.N.; Miguez, M.G. The urban river restoration index (URRIX)-A supportive tool to assess fluvial environment improvement in urban flood control projects. J. Clean. Prod. 2019, 239, 118058. [Google Scholar] [CrossRef]
- Xiong, L.; Fang, S.; Li, K.; Wu, Z.; Min, X.; Liu, J.; Xing, J.; Deng, Y.; Guo, Y. Temporal distribution patterns of phytoplankton and their drivers in Lake Poyang (China)–A monthly study from 2011 to 2019. Ecol. Indic. 2021, 133, 108435. [Google Scholar] [CrossRef]
- Henson, S.A.; Cael, B.; Allen, S.R.; Dutkiewicz, S. Future phytoplankton diversity in a changing climate. Nat. Commun. 2021, 12, 1–8. [Google Scholar]
- Alprol, A.E.; Ashour, M.; Mansour, A.T.; Alzahrani, O.M.; Mahmoud, S.F.; Gharib, S.M. Assessment of Water Quality and Phytoplankton Structure of Eight Alexandria Beaches, Southeastern Mediterranean Sea, Egypt. J. Mar. Sci. Eng. 2021, 9, 1328. [Google Scholar] [CrossRef]
- Lomartire, S.; Marques, J.C.; Gonçalves, A.M. The key role of zooplankton in ecosystem services: A perspective of interaction between zooplankton and fish recruitment. Ecol. Indic. 2021, 129, 107867. [Google Scholar] [CrossRef]
- Arnott, S.E.; Celis-Salgado, M.P.; Valleau, R.E.; DeSellas, A.M.; Paterson, A.M.; Yan, N.D.; Smol, J.P.; Rusak, J.A. Road salt impacts freshwater zooplankton at concentrations below current water quality guidelines. Environ. Sci. Technol. 2020, 54, 9398–9407. [Google Scholar] [CrossRef] [PubMed]
- Alprol, A.E.; Heneash, A.M.; Soliman, A.M.; Ashour, M.; Alsanie, W.F.; Gaber, A.; Mansour, A.T. Assessment of water quality, eutrophication, and zooplankton community in Lake Burullus, Egypt. Diversity 2021, 13, 268. [Google Scholar] [CrossRef]
- Zebral, Y.D.; Righi, B.D.P.; Abou Anni, I.S.; Escarrone, A.L.V.; Roza, M.; Vieira, C.E.D.; Costa, P.G.; Bianchini, A. Pollution levels and biomarker responses in zooplankton from three hydrographic regions of southern Brazil: An integrated approach for water quality monitoring. J. Environ. Chem. Eng. 2021, 9, 106180. [Google Scholar] [CrossRef]
- Feuilloley, G.; Fromentin, J.-M.; Saraux, C.; Irisson, J.-O.; Jalabert, L.; Stemmann, L. Temporal fluctuations in zooplankton size, abundance, and taxonomic composition since 1995 in the North Western Mediterranean Sea. ICES J. Mar. Sci. 2022, 79, 882–900. [Google Scholar] [CrossRef]
- Zhu, H.; Hu, X.-D.; Wu, P.-P.; Chen, W.-M.; Wu, S.-S.; Li, Z.-Q.; Zhu, L.; Xi, Y.-L.; Huang, R. Development and testing of the phytoplankton biological integrity index (P-IBI) in dry and wet seasons for Lake Gehu. Ecol. Indic. 2021, 129, 107882. [Google Scholar] [CrossRef]
- Karr, J.R.; Chu, E.W. Sustaining living rivers. Hydrobiologia 2000, 422–423, 1–14. [Google Scholar] [CrossRef]
- Huang, X.; Xu, J.; Liu, B.; Guan, X.; Li, J. Assessment of Aquatic Ecosystem Health with Indices of Biotic Integrity (IBIs) in the Ganjiang River System, China. Water 2022, 14, 278. [Google Scholar] [CrossRef]
- Karr, J.R. Ecological perspective on water quality goals. Environ. Manag. 1981, 5, 55–68. [Google Scholar] [CrossRef]
- Wan, X.; Yang, T.; Zhang, Q.; Wang, W.; Wang, Y. Joint effects of habitat indexes and physic-chemical factors for freshwater basin of semi-arid area on plankton integrity–A case study of the Wei River Basin, China. Ecol. Indic. 2021, 120, 106909. [Google Scholar] [CrossRef]
- Cai, W.; Xia, J.; Yang, M.; Wang, W.; Dou, C.; Zeng, Z.; Dong, S.; Sheng, L. Cross-basin analysis of freshwater ecosystem health based on a zooplankton-based Index of Biotic Integrity: Models and application. Ecol. Indic. 2020, 114, 106333. [Google Scholar] [CrossRef]
- Zhang, H.; Duan, Z.; Wang, Z.; Zhong, M.; Tian, W.; Wang, H.; Huang, H. Freshwater lake ecosystem health assessment and its response to pollution stresses based on planktonic index of biotic integrity. Environ. Sci. Pollut. Res. 2019, 26, 35240–35252. [Google Scholar] [CrossRef] [PubMed]
- Yang, Z.; Zhu, D.; Zhu, Q.; Hu, L.; Wan, C.; Zhao, N.; Liu, H.; Chen, X. Development of new fish-based indices of biotic integrity for estimating the effects of cascade reservoirs on fish assemblages in the upper Yangtze River, China. Ecol. Indic. 2020, 119, 106860. [Google Scholar] [CrossRef]
- Wu, J.; Mao, R.; Li, M.; Xia, J.; Song, J.; Cheng, D.; Sun, H. Assessment of aquatic ecological health based on determination of biological community variability of fish and macroinvertebrates in the Weihe River Basin, China. J. Environ. Manag. 2020, 267, 110651. [Google Scholar] [CrossRef] [PubMed]
- Niu, L.; Yi, L.; Wang, P.; Zhang, W.; Chao, W.; Jie, L.; Wu, H. Development of a microbial community-based index of biotic integrity (MC-IBI) for the assessment of ecological status of rivers in the Taihu Basin, China. Ecol. Indic. 2017, 85, 204–213. [Google Scholar] [CrossRef]
- Wu, N.; Schmalz, B.; Fohrer, N. Development and testing of a phytoplankton index of biotic integrity (P-IBI) for a German lowland river. Ecol. Indic. 2012, 13, 158–167. [Google Scholar] [CrossRef]
- Zhang, Y.; Ban, X.; Li, E.; Wang, Z.; Xiao, F. Evaluating ecological health in the middle-lower reaches of the Hanjiang River with cascade reservoirs using the Planktonic index of biotic integrity (P-IBI). Ecol. Indic. 2020, 114, 106282. [Google Scholar] [CrossRef]
- Yu, Y.; Wu, G.; Wang, C.; Lu, N.; Yuan, X.; Zhu, X. Pollution characteristics of antibiotics and antibiotic resistance of coliform bacteria in the Yitong River, China. Environ. Monit. Assess. 2019, 191, 1–13. [Google Scholar] [CrossRef] [PubMed]
- Li, H.; Qin, L.; He, H. Characteristics of the water footprint of rice production under different rainfall years in Jilin Province, China. J. Sci. Food Agric. 2018, 98, 3001–3013. [Google Scholar] [CrossRef] [PubMed]
- Meng, C.; Wang, X.; Li, Y. An optimization model for waste load allocation under water carrying capacity improvement management, a case study of the Yitong River, Northeast China. Water 2017, 9, 573. [Google Scholar] [CrossRef]
- Ministry of Environmental Protection of the People’s Republic of China. Method of Water and Wastewater Monitoring, 4th ed.; China Environmental Science Press: Beijing, China, 2002. (In Chinese) [Google Scholar]
- Hu, H.; Wei, Y. The Freshwater Algae of China: Systematics, Taxnomy and Ecology; Science Press: Beijing, China, 2006. (In Chinese) [Google Scholar]
- Han, M.; Shu, Y. Atlas of Freshwater Biology in China; China Ocean Press: Beijing, China, 1995. (In Chinese) [Google Scholar]
- Hu, X.; Zuo, D.; Xu, Z.; Huang, Z.; Liu, B.; Han, Y.; Bi, Y. Response of macroinvertebrate community to water quality factors and aquatic ecosystem health assessment in a typical river in Beijing, China. Environ. Res. 2022, 212, 113474. [Google Scholar] [CrossRef] [PubMed]
- Pesce, S.F.; Wunderlin, D.A. Use of water quality indices to verify the impact of Córdoba City (Argentina) on Suquía River. Water Res. 2000, 34, 2915–2926. [Google Scholar] [CrossRef]
- Wu, Z.; Wang, X.; Chen, Y.; Cai, Y.; Deng, J. Assessing river water quality using water quality index in Lake Taihu Basin, China. Sci. Total Environ. 2018, 612, 914–922. [Google Scholar] [CrossRef] [PubMed]
- Tian, Y.; Jiang, Y.; Liu, Q.; Dong, M.; Xu, D.; Liu, Y.; Xu, X. Using a water quality index to assess the water quality of the upper and middle streams of the Luanhe River, northern China. Sci. Total Environ. 2019, 667, 142–151. [Google Scholar] [CrossRef]
- Wu, Z.; Kong, M.; Cai, Y.; Wang, X.; Li, K. Index of biotic integrity based on phytoplankton and water quality index: Do they have a similar pattern on water quality assessment? A study of rivers in Lake Taihu Basin, China. Sci. Total Environ. 2019, 658, 395–404. [Google Scholar] [CrossRef]
- Wu, Z.; Cai, Y.; Liu, X.; Xu, C.P.; Chen, Y.; Zhang, L. Temporal and spatial variability of phytoplankton in Lake Poyang: The largest freshwater lake in China. J. Great Lakes Res. 2013, 39, 476–483. [Google Scholar] [CrossRef]
- Li, C.; Feng, W.; Chen, H.; Li, X.; Song, F.; Guo, W.; Giesy, J.P.; Sun, F. Temporal variation in zooplankton and phytoplankton community species composition and the affecting factors in Lake Taihu—A large freshwater lake in China. Environ. Pollut. 2019, 245, 1050–1057. [Google Scholar] [CrossRef]
- Lin, L.; Wang, F.; Chen, H.; Fang, H.; Zhang, T.; Cao, W. Ecological health assessments of rivers with multiple dams based on the biological integrity of phytoplankton: A case study of North Creek of Jiulong River. Ecol. Indic. 2021, 121, 106998. [Google Scholar] [CrossRef]
- Feng, B.; Zhang, M.; Chen, J.; Xu, J.; Xiao, B.; Zhou, M.; Zhang, M. Reduction in the phytoplankton index of biotic integrity in riverine ecosystems driven by industrial activities, dam construction and mining: A case study in the Ganjiang River, China. Ecol. Indic. 2021, 120, 106907. [Google Scholar] [CrossRef]
- Tornés, E.; Pérez, M.; Durán, C.; Sabater, S. Reservoirs override seasonal variability of phytoplankton communities in a regulated Mediterranean river. Sci. Total Environ. 2014, 475, 225–233. [Google Scholar] [CrossRef] [PubMed]
- Frémont, P.; Gehlen, M.; Vrac, M.; Leconte, J.; Delmont, T.O.; Wincker, P.; Iudicone, D.; Jaillon, O. Restructuring of plankton genomic biogeography in the surface ocean under climate change. Nat. Clim. Chang. 2022, 12, 393–401. [Google Scholar] [CrossRef]
- Tian, Y.; Jiang, Y.; Liu, Q.; Xu, D.; Liu, Y.; Song, J. The impacts of local and regional factors on the phytoplankton community dynamics in a temperate river, northern China. Ecol. Indic. 2021, 123, 107352. [Google Scholar] [CrossRef]
- Cai, K.; Qin, C.; Li, J.; Zhang, Y.; Niu, Z.; Li, X. Preliminary study on phytoplanktonic index of biotic integrity (P-IBI) assessment for lake ecosystem health: A case of Taihu Lake in Winter, 2012. Acta Ecol. Sin. 2016, 36, 1431–1441. (In Chinese) [Google Scholar]
- Zhao, K.; Wang, L.; You, Q.; Pan, Y.; Liu, T.; Zhou, Y.; Zhang, J.; Pang, W.; Wang, Q. Influence of cyanobacterial blooms and environmental variation on zooplankton and eukaryotic phytoplankton in a large, shallow, eutrophic lake in China. Sci. Total Environ. 2021, 773, 145421. [Google Scholar] [CrossRef]
- Margalef, D.R. Information theory in ecology. Mem. Real Acad. Cienc. Artes Barc. 1957, 32, 374–559. [Google Scholar]
- Pielou, E.C. The measurement of diversity in different types of biological collections. J. Theor. Biol. 1966, 13, 131–144. [Google Scholar] [CrossRef]
- Ludwig, J.A.; Reynolds, J.F.; QUARTET, L.; Reynolds, J. Statistical Ecology: A Primer in Methods and Computing; John Wiley & Sons: New York, NY, USA, 1988. [Google Scholar]
- Shannon, C.E. A mathematical theory of communication. Bell Syst. Tech. J. 1948, 27, 379–423. [Google Scholar] [CrossRef] [Green Version]
- Kelly, M.; Whitton, B.A. The trophic diatom index: A new index for monitoring eutrophication in rivers. J. Appl. Phycol. 1995, 7, 433–444. [Google Scholar] [CrossRef]
- Kane, D.D.; Gordon, S.I.; Munawar, M.; Charlton, M.N.; Culver, D.A. The Planktonic Index of Biotic Integrity (P-IBI): An approach for assessing lake ecosystem health. Ecol. Indic. 2009, 9, 1234–1247. [Google Scholar] [CrossRef]
- Palmer, C.M. A composite rating of algae tolerating organic pollution 2. J. Phycol. 1969, 5, 78–82. [Google Scholar] [CrossRef] [PubMed]
- Wu, J.-T. A generic index of diatom assemblages as bioindicator of pollution in the Keelung River of Taiwan. Hydrobiologia 1999, 397, 79–87. [Google Scholar] [CrossRef]
- Sládeček, V. Rotifers as indicators of water quality. Hydrobiologia 1983, 100, 169–201. [Google Scholar] [CrossRef]
- Wang, S.; Chen, H.; Liu, Q.; Xu, J.; Zhang, G.; Wang, Z. Zooplankton community structure and its correlation with water quality in Hancheng Lake. Ecol. Sci. 2018, 37, 114–123. (In Chinese) [Google Scholar]
Figure 1.
Location of the Yitong River and sampling sites.

Figure 2.
Comparison of WQI between sampling sites in different seasons.

Figure 3.
Spatiotemporal variation of the P–IBI. (A) Percentage composition of water quality grades in different seasons. (B) Spatial variation of the P–IBI at different sites.
Figure 3.
Spatiotemporal variation of the P–IBI. (A) Percentage composition of water quality grades in different seasons. (B) Spatial variation of the P–IBI at different sites.

Figure 4.
Spatial distribution of the P–IBI based on seasonally averaged data.

Figure 5.
Separation ability test of the reference site and impaired sites in different seasons.

Figure 6.
Heatmap of correlations between P–IBI metrics and environmental factors. Note: * p < 0.05 level; ** p < 0.01.
Figure 6.
Heatmap of correlations between P–IBI metrics and environmental factors. Note: * p < 0.05 level; ** p < 0.01.

Figure 7.
Comparison of % P–IBI and WQI evaluation results. (A) Comparison of % P–IBI and WQI evaluation results in different seasons. (B) Comparison of % P–IBI and WQI evaluation results at different sites. % P–IBI indicates the percentage of sampling sites with P–IBI evaluation results exceeding the “moderate” level.

Figure 8.
Linear regression between WQI and % P–IBI across sampling sites. % P–IBI indicates the percentage of sampling sites with P–IBI evaluation results exceeding the “moderate” level.
Figure 8.
Linear regression between WQI and % P–IBI across sampling sites. % P–IBI indicates the percentage of sampling sites with P–IBI evaluation results exceeding the “moderate” level.


Table 1.
Selected metrics for the P–IBI in different seasons.
| P–IBI Metrics | Spring | Summer | Autumn | Winter |
|---|---|---|---|---|
| Phyto–IBI metrics | P2, P13, P15, P16 | P4, P7, P13, P16 | P2, P4, P18, P21 | P1, P9, P20 |
| Z–IBI metrics | Z1, Z9, Z11, Z15, Z16 | Z3, Z14, Z17, Z18, Z20 | Z14, Z15, Z17 | Z3, Z16 |
Table 2.
Assessment criteria for the P–IBI in the Yitong River Basin.
| Season | Excellent | Good | Moderate | Low | Bad |
|---|---|---|---|---|---|
| Spring | ≥3.54 | 2.66–3.54 | 1.77–2.66 | 0.89–1.77 | ≤1.77 |
| Summer | ≥3.69 | 2.77–3.69 | 1.85–2.77 | 0.92–1.85 | ≤0.92 |
| Autumn | ≥2.72 | 2.04–2.72 | 1.36–2.04 | 0.68–1.36 | ≤0.68 |
| Winter | ≥1.96 | 1.47–1.96 | 0.98–1.47 | 0.49–0.98 | ≤0.49 |
| Season mean | ≥2.82 | 2.11–2.82 | 1.41–2.11 | 0.70–1.41 | ≤0.70 |
Publisher’s Note: MDPI stays neutral with regard to jurisdictional claims in published maps and institutional affiliations. |
© 2022 by the authors. Licensee MDPI, Basel, Switzerland. This article is an open access article distributed under the terms and conditions of the Creative Commons Attribution (CC BY) license (https://creativecommons.org/licenses/by/4.0/).
Share and Cite
MDPI and ACS Style
Zhao, K.; Dong, A.; Wang, S.; Yu, X. Ecological Health Status of the Yitong River, China, Assessed with the Planktonic Index of Biotic Integrity. Water 2022, 14, 3191. https://doi.org/10.3390/w14193191
AMA Style
Zhao K, Dong A, Wang S, Yu X. Ecological Health Status of the Yitong River, China, Assessed with the Planktonic Index of Biotic Integrity. Water. 2022; 14(19):3191. https://doi.org/10.3390/w14193191
Chicago/Turabian StyleZhao, Ke, Ang Dong, Shuwei Wang, and Xiangfei Yu. 2022. "Ecological Health Status of the Yitong River, China, Assessed with the Planktonic Index of Biotic Integrity" Water 14, no. 19: 3191. https://doi.org/10.3390/w14193191
Note that from the first issue of 2016, this journal uses article numbers instead of page numbers. See further details here.