
Effects of a Volcanic-Fluid Cycle System on Water Chemistry of a Deep Caldera Lake: Lake Tazawa, Akita Prefecture, Japan


1
Arctic Research Center, Hokkaido University, Sapporo 001-0021, Japan
2
Graduate School of Engineering Science, Akita University, Akita 010-8502, Japan
3
Faculty of Policy Studies, Nanzan University, Nagoya 466-8673, Japan
4
Department of Volcanology Research, Meteorological Research Institute, Sendai 983-0842, Japan
*
Author to whom correspondence should be addressed.
Water 2022, 14(19), 3186; https://doi.org/10.3390/w14193186
Submission received: 10 August 2022
/
Revised: 7 October 2022
/
Accepted: 7 October 2022
/
Published: 10 October 2022
(This article belongs to the Special Issue Water Quality Changes of Lakes and Rivers)
Abstract
:Lake Tazawa, the deepest lake (423.4 m depth at maximum) in Japan underwent drastically changed water quality in 1940, because volcanic water from two active volcanos was then drawn into the lake for power generation and irrigation. Thereby, the pH of lake water decreased from 6.7 to 4.2, which exterminated a land-locked type of sockeye salmon, Oncorhynchus nerka kawamurae (locally called Kunimasu trout). Additionally, the mean residence time of lake water changed from 195 years to 8.9 years by rapidly increasing the outflow for power generation and irrigation. In this study, long-term chemical fluxes controlling lake water chemistry were obtained, and a groundwater water cycle system between the lake and the volcano was explored by estimating hydrological and chemical budgets of the lake. In the chemical budget estimate, two ionic species, SO42− and Cl−, in volcanic fluids were chosen and each mass conservation equation was yielded. The hydrological budget estimate gave us the net groundwater inflow at −1.36 m3/s on average over three periods in 2020–2021, and then the simultaneous equation coupled with the chemical budget equation allowed us to separate into groundwater inflow and outflow at 6.01 m3/s and 7.37 m3/s, averaged over the three periods, respectively. The evaluated groundwater inflow and outflow were compared with those of the other crater or caldera lakes. The linear relationship between the lake volume and the magnitude of groundwater inflow or outflow suggests that the groundwater cycle scale in such a lake increases with the magnitude of the volcanic eruption to have formed the lake.
1. Introduction
Lakes produced from volcanic eruptions are generally classified, as volcanogenic lakes, into lakes dammed up by lava flows, pyroclastic flows or lahars and crater or caldera lakes formed by eruptions on the tops or bases of volcanos [1]. Monitoring and exploring a water quality variation in such a lake is very important to know the signals of volcanic activity that are connected to the eruption. The water quality of volcanic lakes can be determined by quantifying hydrological, chemical and thermal fluxes in the lakes, according to the mass conservation laws, but the accurate quantification is not easy, because ways to evaluate the fluxes depend on the volcanic activity level, the qualities of surface water and groundwater, including volcanic gas, and the hydrologic conditions of the lake and its catchment.
There are many studies of lake–groundwater interactions in inactive or active volcanos [2,3,4,5,6]. However, the whole picture of the water cycle system in a volcano including the lake and its catchment is not clear, because it is difficult to quantify the groundwater cycle system below or around the lake. By applying the MODFLOW-2005 code [7], Urrutia et al. [5] simulated the groundwater flow in the Tuyajto Lake catchment (area, 392 km2), including two inactive volcanos, on the Chilean Altiplano. Additionally, they tried to simulate temporal variations of the water level of Tuyajto Lake by the transient groundwater flow model, but the simulation exhibited a large error of more than the confidence interval at 10–90 %. This is because their hydrological budget estimate for the lake was not accurate. By using radioactive cesium derived from the Fukushima Daiichi Nuclear Power Plant accident, Japan, in March 2011, Hirayama et al. [8] estimated the bottom leakage rate of water to 8.1–9.3 L/s in Yugama Crater Lake, contained in the active Kusatsu-Shirane Volcano. However, the leakage rate was not ascertained by the other method, e.g., hydrological budget estimate for the lake. Terada et al. [3] simulated variations of magmatic gas and groundwater inflows from the bottom of a hot water lake, Yudamari Lake, in Aso Volcano, Japan, by a water flow model. By applying a hydrological budget equation coupled with a thermal budget equation for the lake, they then estimated the mass flux and enthalpy of volcanic fluids from the lake bottom to be 75–132 kg/s and 1840–3030 kJ/kg, respectively.
In this study, the effect of volcanic fluids on water chemistry of a deep caldera lake, Lake Tazawa, was explored by evaluating chemical fluxes of the inflow and outflow of surface water and groundwater in the lake. Groundwater inflow and outflow in the lake were then quantified by coupling a hydrological budget equation with a chemical budget equation for the lake. Relations between the groundwater flow scale and the lake volume are also discussed by a comparison with those for other crater or caldera lakes.
2. Study Area
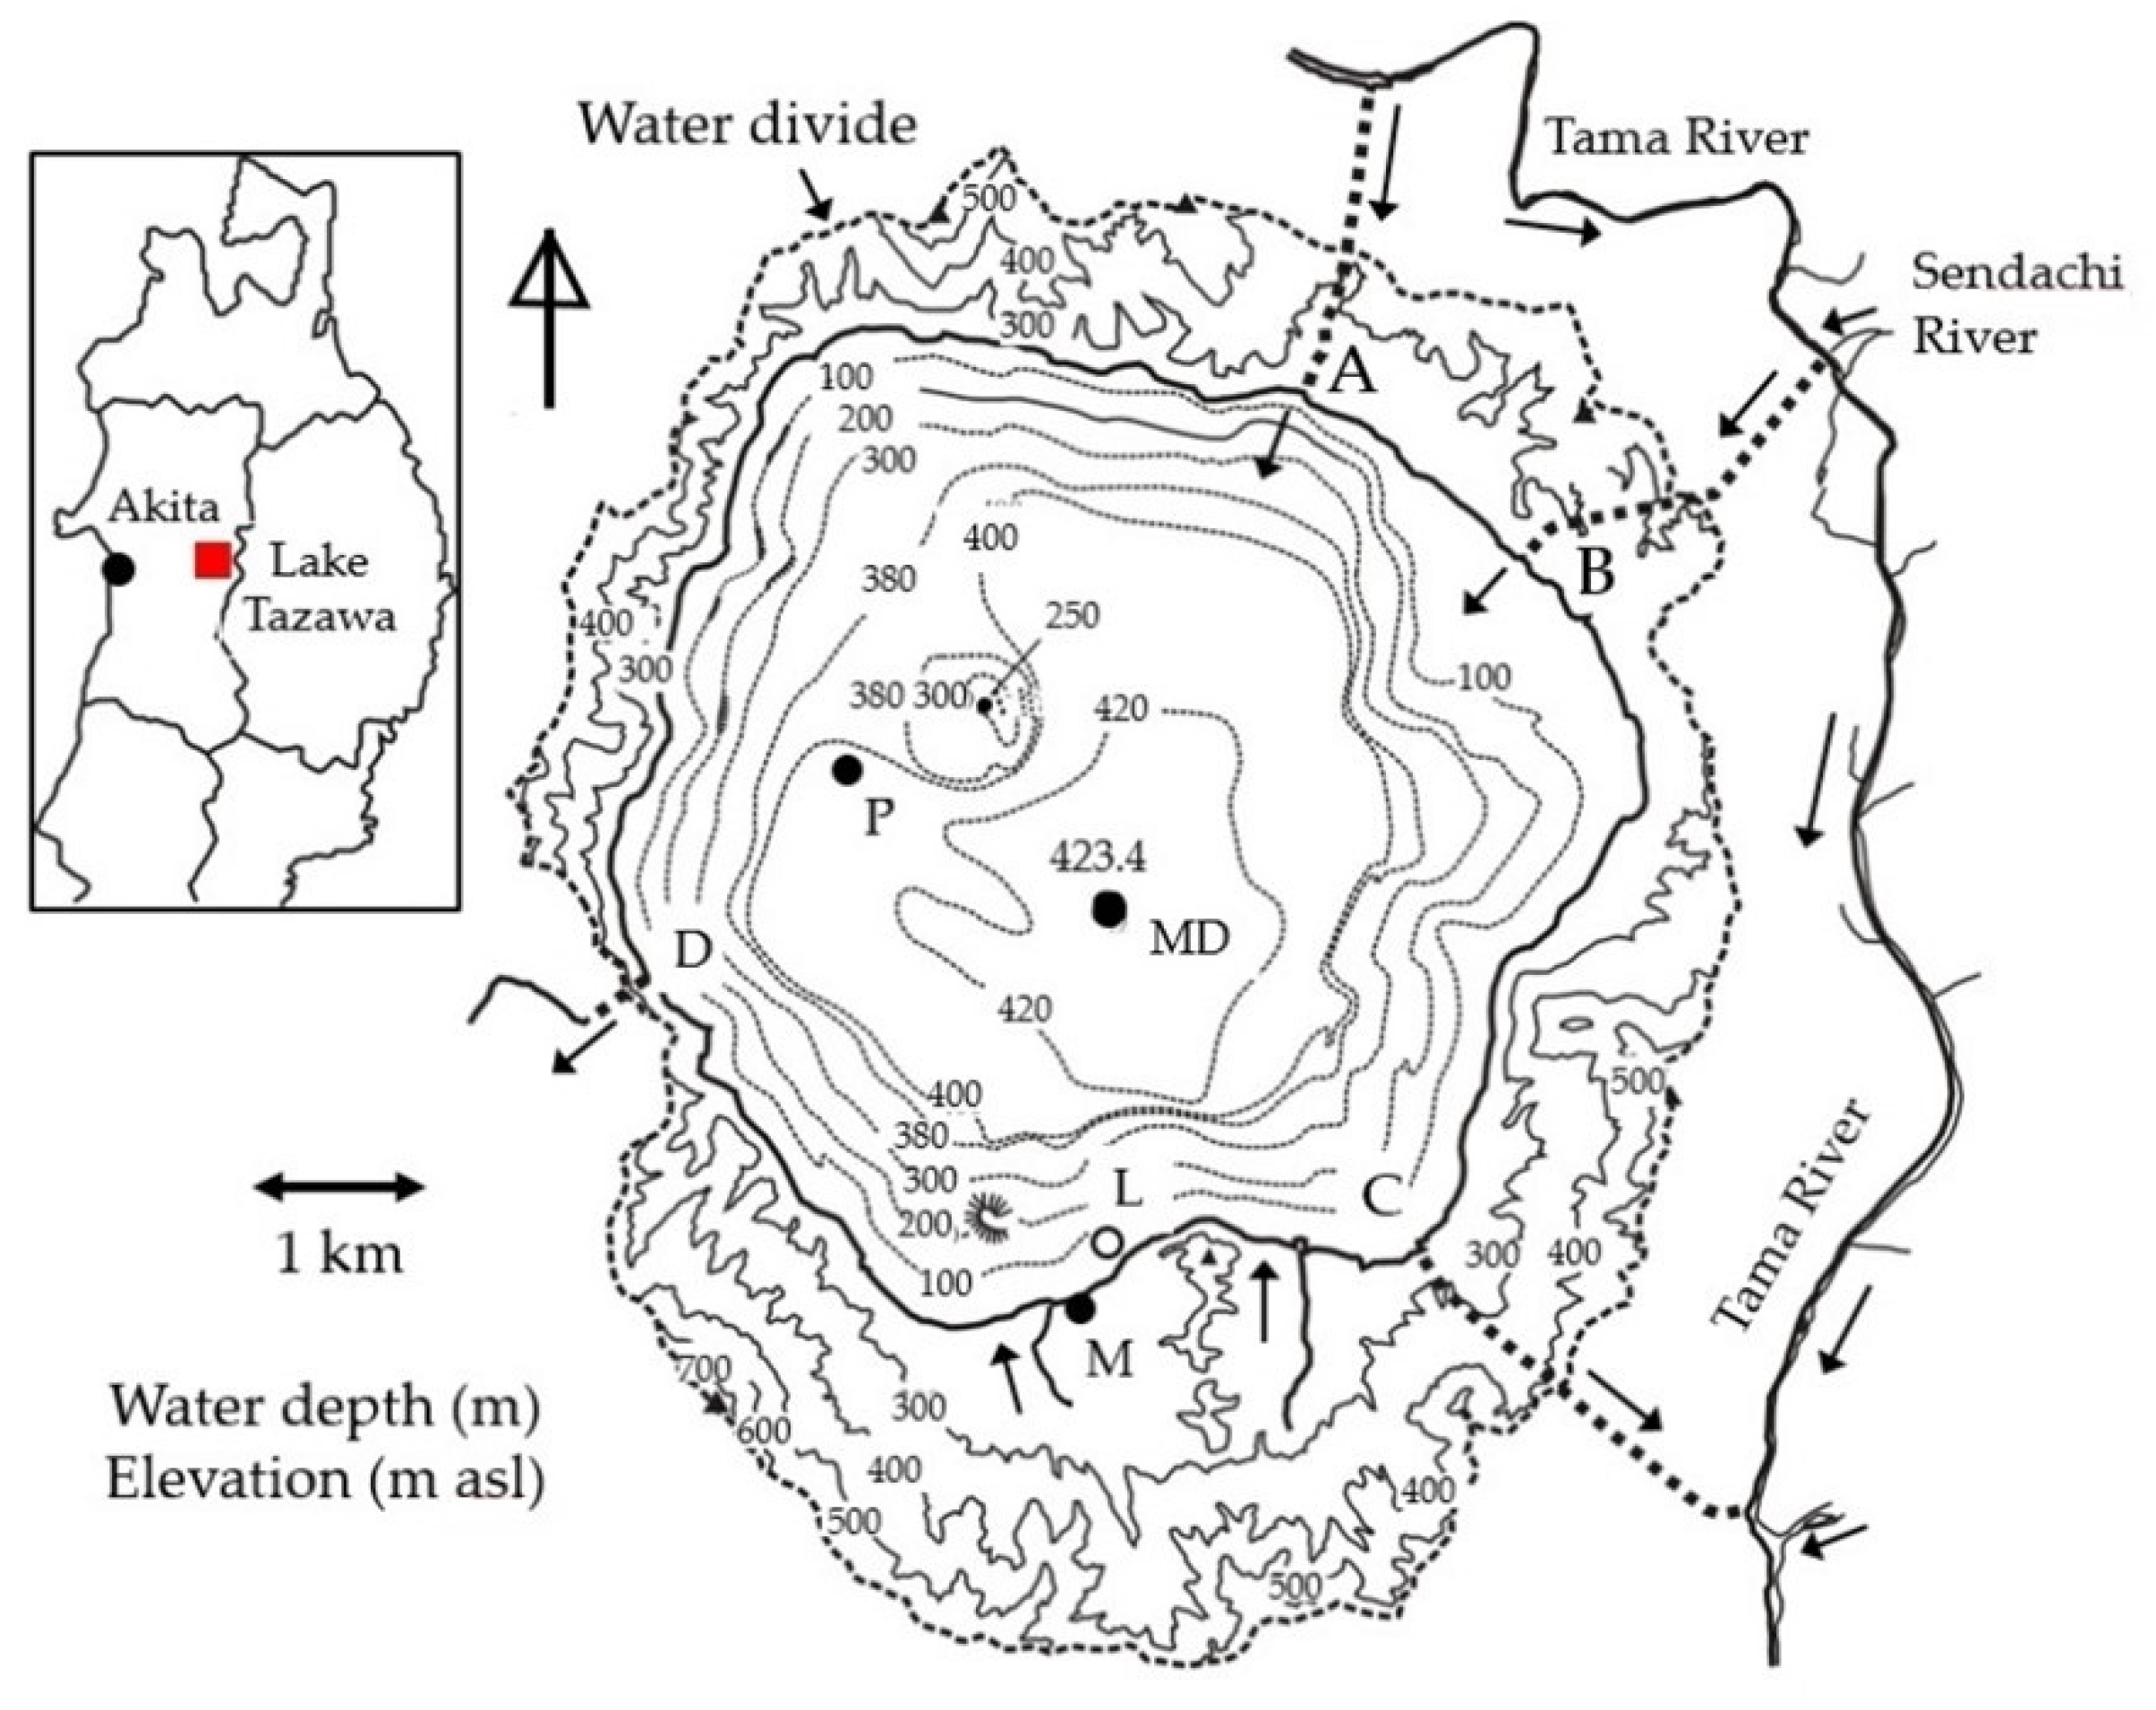
Lake Tazawa (39°43′30″ N, 140°39′41″ E) is located in Akita Prefecture, Honshu, Japan, and is the deepest lake in Japan with the maximum depth of 423.4 m, the mean depth of 280.0 m and the surface area of 25.83 km2 at the water level of 249.0 m above sea level (asl) (Figure 1). The lake is one of the volcanic caldera lakes, formed 1.7–2.0 million years ago [9], which is relatively very old for a volcanic large lake in Japan (e.g., Lake Shikotsu, ca. 40,000 years ago and Lake Towada, 15,000–35,000 years ago). Lake Tazawa at present exits in an inactive volcanic edifice, but is adjacent to river catchments affected by volcanic fluids supplied from the active Hachimantai Volcano and Komagatake Volcano.
The drainage area of Lake Tazawa is 21.15 km2, excluding the water surface area, where the lake catchment is enclosed by the water divide (i.e., caldera rim) shown by the thick dotted line in Figure 1. The lake’s shoreline is 20.0 km long, and the circle’s circumference equal to the water surface area is 18.0 km long. Its ratio is thus calculated at 1.11, indicating the shoreline shape is close to a circle (the ratio at 1.00). The drainage basin of Lake Tazawa is adjacent to the catchments of Tama River and its tributary, Sendachi River (Figure 1), and in 1940 during the Second World War, part of the two river waters was drawn into Lake Tazawa by constructing the conduits A and B (partly open channels), and the lake water was withdrawn by the conduit C into the lower Tama River for power generation and irrigation [10]. Volcanic fluids are actively produced in the upstream regions of Tama and Sendachi Rivers, following the high activity of Hachimantai and Komagatake Volcanos, respectively. The pH of the volcanic fluids is 1.1–1.3 and 6.0–6.2 for the original hot springs in the headwater regions of Tama River [11] and Sendachi River [12], respectively, but 5.1–6.6 and 6.7–7.1 just upstream of the conduits connected to Lake Tazawa, respectively. The large decrease of acidity downstream of Tama River is mainly due to the opening of a neutralization facility downstream of the hot spring site in April 1991. The discharges from the conduits A and B connected to Tama and Sendachi Rivers are 17.5 m3/s and 3.1 m3/s, respectively, averaged for the three years 2019–2021. The chemical flux of the Tama River could thus control the lake water quality, since the pH of lake water ranged over 5.3–6.0 in 2019–2021.
The outflow at the conduit C was 24.4 m3/s when averaged for 2019–2021. When compared with the discharge at the conduits A, B, and C, discharge at the conduit D (previous natural outflowing river) is very small, being 2.0 m3/s for 10 May–31 August in the irrigation season and at zero in the other periods. Hence, the lake water storage is likely maintained by the discharge of natural small inflowing rivers or the groundwater inflow, since the net outflow calculated by the discharge at all the conduits becomes positive by 3.8 m3/s or more. Meanwhile, the two inflowing streams near site M and the conduit C exhibit the total discharge of less than 1 m3/s on non-rainfall days (Figure 1).
The mean residence time was evaluated to be 8.86 years, when the lake volume is given at 6.816×10⁹ m3 at the lake level of 246.8 m asl as averages of 2019–2021. Before the intake of the river waters from the conduits, the unique outflow was 1.2 m3/s at site D, which allowed us to estimate the mean residence time to be 195.4 years if the lake volume is 7.393 × 10⁹ m3 at the water level of 249.0 m asl. Thus, the present residence time is 22.1 times shorter, which could activate the circulations of lake water and associated dissolved matters.
Meanwhile, the intake of the Tama River water in 1940 exterminated a land-locked type of sockeye salmon (alive at pH > 6.5), Oncorhynchus nerka kawamurae (local name, Kunimasu trout), since the pH of lake water then decreased from 6.7 to 4.2. The present pH of 5.3–6.0 cannot yet support the trout, though the acid-resistant Japanese dace, Triborodon hakonennsis (called “Ugui”) inhabits the lake. Local people eagerly wish the trout would return back to the lake, though this involves a need to increase the lake’s pH from 5.3–6.0 to more than 6.5. Here, the chemical conditions of Tama River required to achieve the target pH of the lake water at 6.5 or more is also discussed.
3. Methods
In order to evaluate groundwater inflow and outflow in Lake Tazawa and to explore the associated chemical cycle system, hydrological and chemical budgets of the lake were estimated by using the two budget equations. Here, the concepts and basic equations are shown.
3.1. Hydrological Budget of An Open Lake
For such an open lake, accompanied by a river outflow, as Lake Tazawa, a hydrological budget equation is as follows:
where V is the water volume (m3), A0 is the water surface area (m2), P is the precipitation (rainfall or snowfall) (m/s) onto the lake’s surface, E is the evaporation (m/s) at the lake’s surface, Rin and Rout are the river inflow and outflow (m3/s), Gin and Gout are the groundwater inflow and outflow (m3/s), respectively, and t is the time. The left side of Equation (1) depicts the water volume change per budget period ∆t. Evaporation E was calculated by using the following bulk transfer method:
where QE is the heat flux (W/m2) by evaporation, λ is the latent heat (J/kg) for evaporation, β is the ratio of water vapor density to dry air density (=0.622), aE is the dimensionless bulk transfer coefficient for latent heat, uz is the wind speed (m/s) at z (m) above the lake’s surface, p is the air pressure (Pa) at z, ez is the vapor pressure (Pa) at z, e0 is the saturated vapor pressure (Pa) at lake surface temperature Ts (K), and a and w are the air and water densities (kg/m3), respectively. Here, z = 5.0 m was adopted in Equation (2) as the height of the wind speed sensor above the lake water surface as well as the air temperature and relative humidity logger. The dimensionless bulk transfer coefficient, aE, for latent heat was given at a constant of 0.0013 for z = 5.0 m [13]. Evaporation E was calculated by applying the hydrometeorological data at site M and 0.2 m-depth water temperature data at site L to Equations (2) and (3).
∆V/∆t = (P–E)A0 + Rin − Rout + Gin − Gout
Under the condition of non-precipitation, Equation (1) is as follows:
G = Gin–Gout = ∆V/∆t + EA0 − Rin + Rout
Here, the G value, or the net groundwater inflow, is provided by calculating temporal changes in water volume change (∆V/∆t) and lake surface area A0 from the measurement of lake level (Figure 1), and using the calculated E and river inflow and outflow data. The data of daily mean inflow at the conduits, A and B, and daily mean outflow at the conduit C, supplied by Tohoku Electric Power Co. Ltd., Japan, were applied to Rin and Rout in Equation (1) and (4). Here, the inflow of the two streams near site M and the conduit C was neglected because of less than 1 m3/s on non-rainfall days (Figure 1). Also, the outflow at the conduit D can be neglected at zero, if the budget period is out of the irrigation season.
For the other way to evaluate the G value, when the inflow and outflow from the conduits are artificially stopped, the G value is calculated by the following Equation:
G = Gin–Gout = ∆V/∆t − (P–E)A0
The inflow and outflow at the conduits A, B and C were sporadically zero by artificial operations at the three power plants, and Equation (5) was then applicable.
3.2. Chemical Budget of an Open Lake
Unknown factors in Equation (1) are groundwater inflow Gin and groundwater outflow Gout. By solving simultaneous equations from Equation (1) and a chemical budget equation, Gin and Gout can be obtained separately if the needed chemical quantities were given to the chemical budget equation. The chemical budget equation for an open lake is given as follows:
where CL is the mean ionic concentration (g/L) of the lake; CRin, CRout, CP and CGin are the ionic concentrations (g/L) of inflowing and outflowing rivers, precipitation and inflowing groundwater, respectively S is the net depositional flux (kg/s) related to a chemical reaction of the ion. The mean ionic concentration, CL, of the lake is given as that of groundwater outflow, since the depths at which the lake water leaks out as groundwater are unknown. The magnitude of S is inferred by considering the lake water chemistry based on the ionic analysis.
∆(CLV)/∆t = CRinRin–CRoutRout+ CPPA0 + CGinGin − CLGout–S
If a non-precipitation period is adopted as the budget period, the third term on the right side of Equation (6) is zero. In the precipitation period, depending on the precipitation amount, the third term is not neglected, even if the ionic concentration of precipitation is a102 order smaller than those of river and lake waters [14], including volcanic fluids, because of the large water surface area (A0 = 25.83 km2 at the water level of 249.0 m asl).
The simultaneous equations from Equations (1) and (6) lead to:
where B =∆ (CLV)/ ∆t–CRinRin +CRoutRout − CPPA0 + S. Here, the B values are given by coupling with the analyzed chemistry of river and lake waters. Then, an ion unaffected by the chemical reaction (thus, S = 0) should be selected as the ion specified in the ionic concentration in Equation (6), though the flux S could be quantified by setting a sediment trap at the lake bottom and analyzing the trapped sediment chemically.
Gout = (CGin G–B)/(CL–CGin)
Gin = Gout + G
Here, the electric conductivity (EC) was monitored at a 0.2 m depth in site L and in the Tama River and the Sendachi River. In order to get time series of lake water concentration CL and river water concentrations, CRin and CRout, in Equation (6), relations between in situ EC25 (EC at water temperature 25 °C) and the ion concentrations analyzed for water samples were applied to the EC25 time series.
3.3. Field Observations
In order to quantify the parameters in Equation (1) and Equation (6), field observations were carried out in December 2017–March 2022. First, in order to evaluate the evaporation rate at the lake surface, using Equations (2) and (3), hydrometeorological data at site M were applied, and water temperature data at 0.2 m depth of site L were utilized for the surface water temperature (Figure 1). At site M, wind velocity, air temperature, relative humidity, air pressure, rainfall and solar radiation were recorded hourly on a meteorological monitoring system (Onset Computers, Inc., Bourne, MA, USA; URL https://www.onsetcomp.com/support/application_solutions/weather-station-kits (accessed on 21 June 2022)). Rainwater was then collected at site M in July and August 2020, and its ionic concentrations were evaluated in a laboratory. At site L, ca. 40 m offshore, a water pressure logger (ranges of 0–7.5 m and −20–50 °C, and accuracies of ±0.005 m and ±0.44 °C for water depth and temperature, respectively; URL https://www.onsetcomp.com/products/data-loggers/u20-001-03/ (accessed on 21 June 2022)) and an electric conductivity (EC) logger (ranges of 0–150 mS/m and −2–36 °C, and accuracies of ±0.10 mS/m and ±0.05 °C for EC and temperature, respectively; URL https://www.onsetcomp.com/products/data-loggers/u24-001/ (accessed on 21 June 2022)) were fixed at the lake bottom to measure hourly water pressure, and at a 0.2 m water depth to acquire hourly EC and water temperature, respectively.
The pressure difference between water pressure and air pressure was converted to water depth in meters, which was recorded as lake level in meters asl (above sea level), using a Level 1 Reference Point at 250.299 m asl near site M. The lake level in meters asl was sporadically ascertained with the accuracy of ±0.01 m by the use of leveling between the reference point and lake level. Lake surface area, varying with the lake level, was numerically obtained by a bathymetric map of high accuracy (5 m or 10 m depth contour; URL https://maps.gsi.go.jp/#16/39.702556/140.646372/&base=std&ls=std%7Clakedata&blend=1&disp=10&vs=c1g1j0h0k0l0u0t0z0r0s0m0f0&d=m (accessed on 30 April 2022)).
Daily snowfalls in winter at site M were estimated by using daily rainfall data in November at site M and the Senboku city weather station (39°41′54″ N, 140°43′54″ E), 6.64 km southeast of Lake Tazawa, since there existed a clearly linear relationship (y = 1.201x; x and y are daily rainfall (mm/day) between the weather station and site M, respectively (R2 = 0.959, p < 0.001).
Lowering the ASTD102 profiler (JFE Advantech, Co., Ltd., Japan; URL https://www.jfe-advantech.co.jp/eng/products/ocean-rinko.html (accessed on 21 June 2022)) on a boat, vertical profiles of water temperature, EC25 (EC at water temperature of 25 °C), and DO were sporadically obtained at 0.1 m depth intervals at the deepest point (site MD in Figure 1) and site P at 1.8 km west–northwest of site MD. The profiler has high accuracies of ±0.01 °C, ±0.1 mS/m and ±0.4 mg/L for water temperature, EC and DO, respectively. The profiler recorded the three factors only during its lowering, thus being unaffected by the disturbance from the bottom touch. It took 20–40 min at each point to get the vertical profiles.
Meanwhile, lake water was sampled at the surface of sites MD and L at 50 m, 150 m, 200 m and 400 m depths of site MD, and their water temperature, EC and pH were measured on a boat by a portable thermometer, Checktemp 1 (Type HI98509, NANNA Instruments, Japan, Ltd.: accuracy of ±0.2 °C), a portable EC meter (Type CM-21P; accuracy of ±0.5 mS/m for 0–100 mS/m; TOA DKK Co., Ltd., Japan), and a portable pH meter (Type NM-32P; accuracy of ±0.02 in pH; TOA DKK Co., Ltd.), respectively. For the water sampling at depths of 50 m or more, the 1.2 L Niskin water sampler (Model 1010, General Oceanics, Inc., Miami Gardens, FL, USA; URL https://www.generaloceanics.com/water-sampling-bottles/ (accessed on 7 July 2022)) was used. Bottom sediment cores 0.38 m and 0.49 m long were also sampled at site MD and site P, respectively, by a portable gravity core sampler [15] to obtain pore water from the sediment in a laboratory.
Upstream of the entrances of the conduits A and B (Figure 1), water samples of Tama River and Sendachi River were obtained on non-rainfall days, respectively, and their water temperature, EC and pH were measured by the same portable meters as in the lake. EC loggers of same type as in the lake were then fixed near the water sampling points in the rivers to record the water temperature and EC at 1 h intervals.
3.4. Chemical Analysis in a Laboratory
Concentrations of major ions (K+, Na+, Mg2+, Ca2+, Cl–, SO42–) in the sampled river water, lake water and rainwater were measured by ion chromatography (type Dionex ICS-1600 (cation) and ICS-2100 (anion), Thermo Fisher Scientific Inc., Japan; URL https://www.thermofisher.com/ (accessed on 24 November 2021)). Only the bicarbonate ion (HCO3–) concentration was measured by using the 0.1 mol hydrochloric acid titration.
In order to obtain the concentration CGin of inflowing groundwater in Equation (6), pore water in the bottom sediment core of site MD was sampled by an extractor kit with a 60 mL syringe and a porous cup (URL https://www.soilmoisture.com/1900K2/ (accessed on 24 November 2021)), and its EC25 and pH were measured by a compact EC meter (Type LAQUAtwin EC-11, HORIBA, Co. Ltd., Kyoto) and a compact pH meter (Type LAQUAtwin pH-11B, HORIBA, Co. Ltd., Kyoto), respectively. The ionic concentrations in the sampled pore water were similarly analyzed.
4. Results
4.1. Water Chemistry
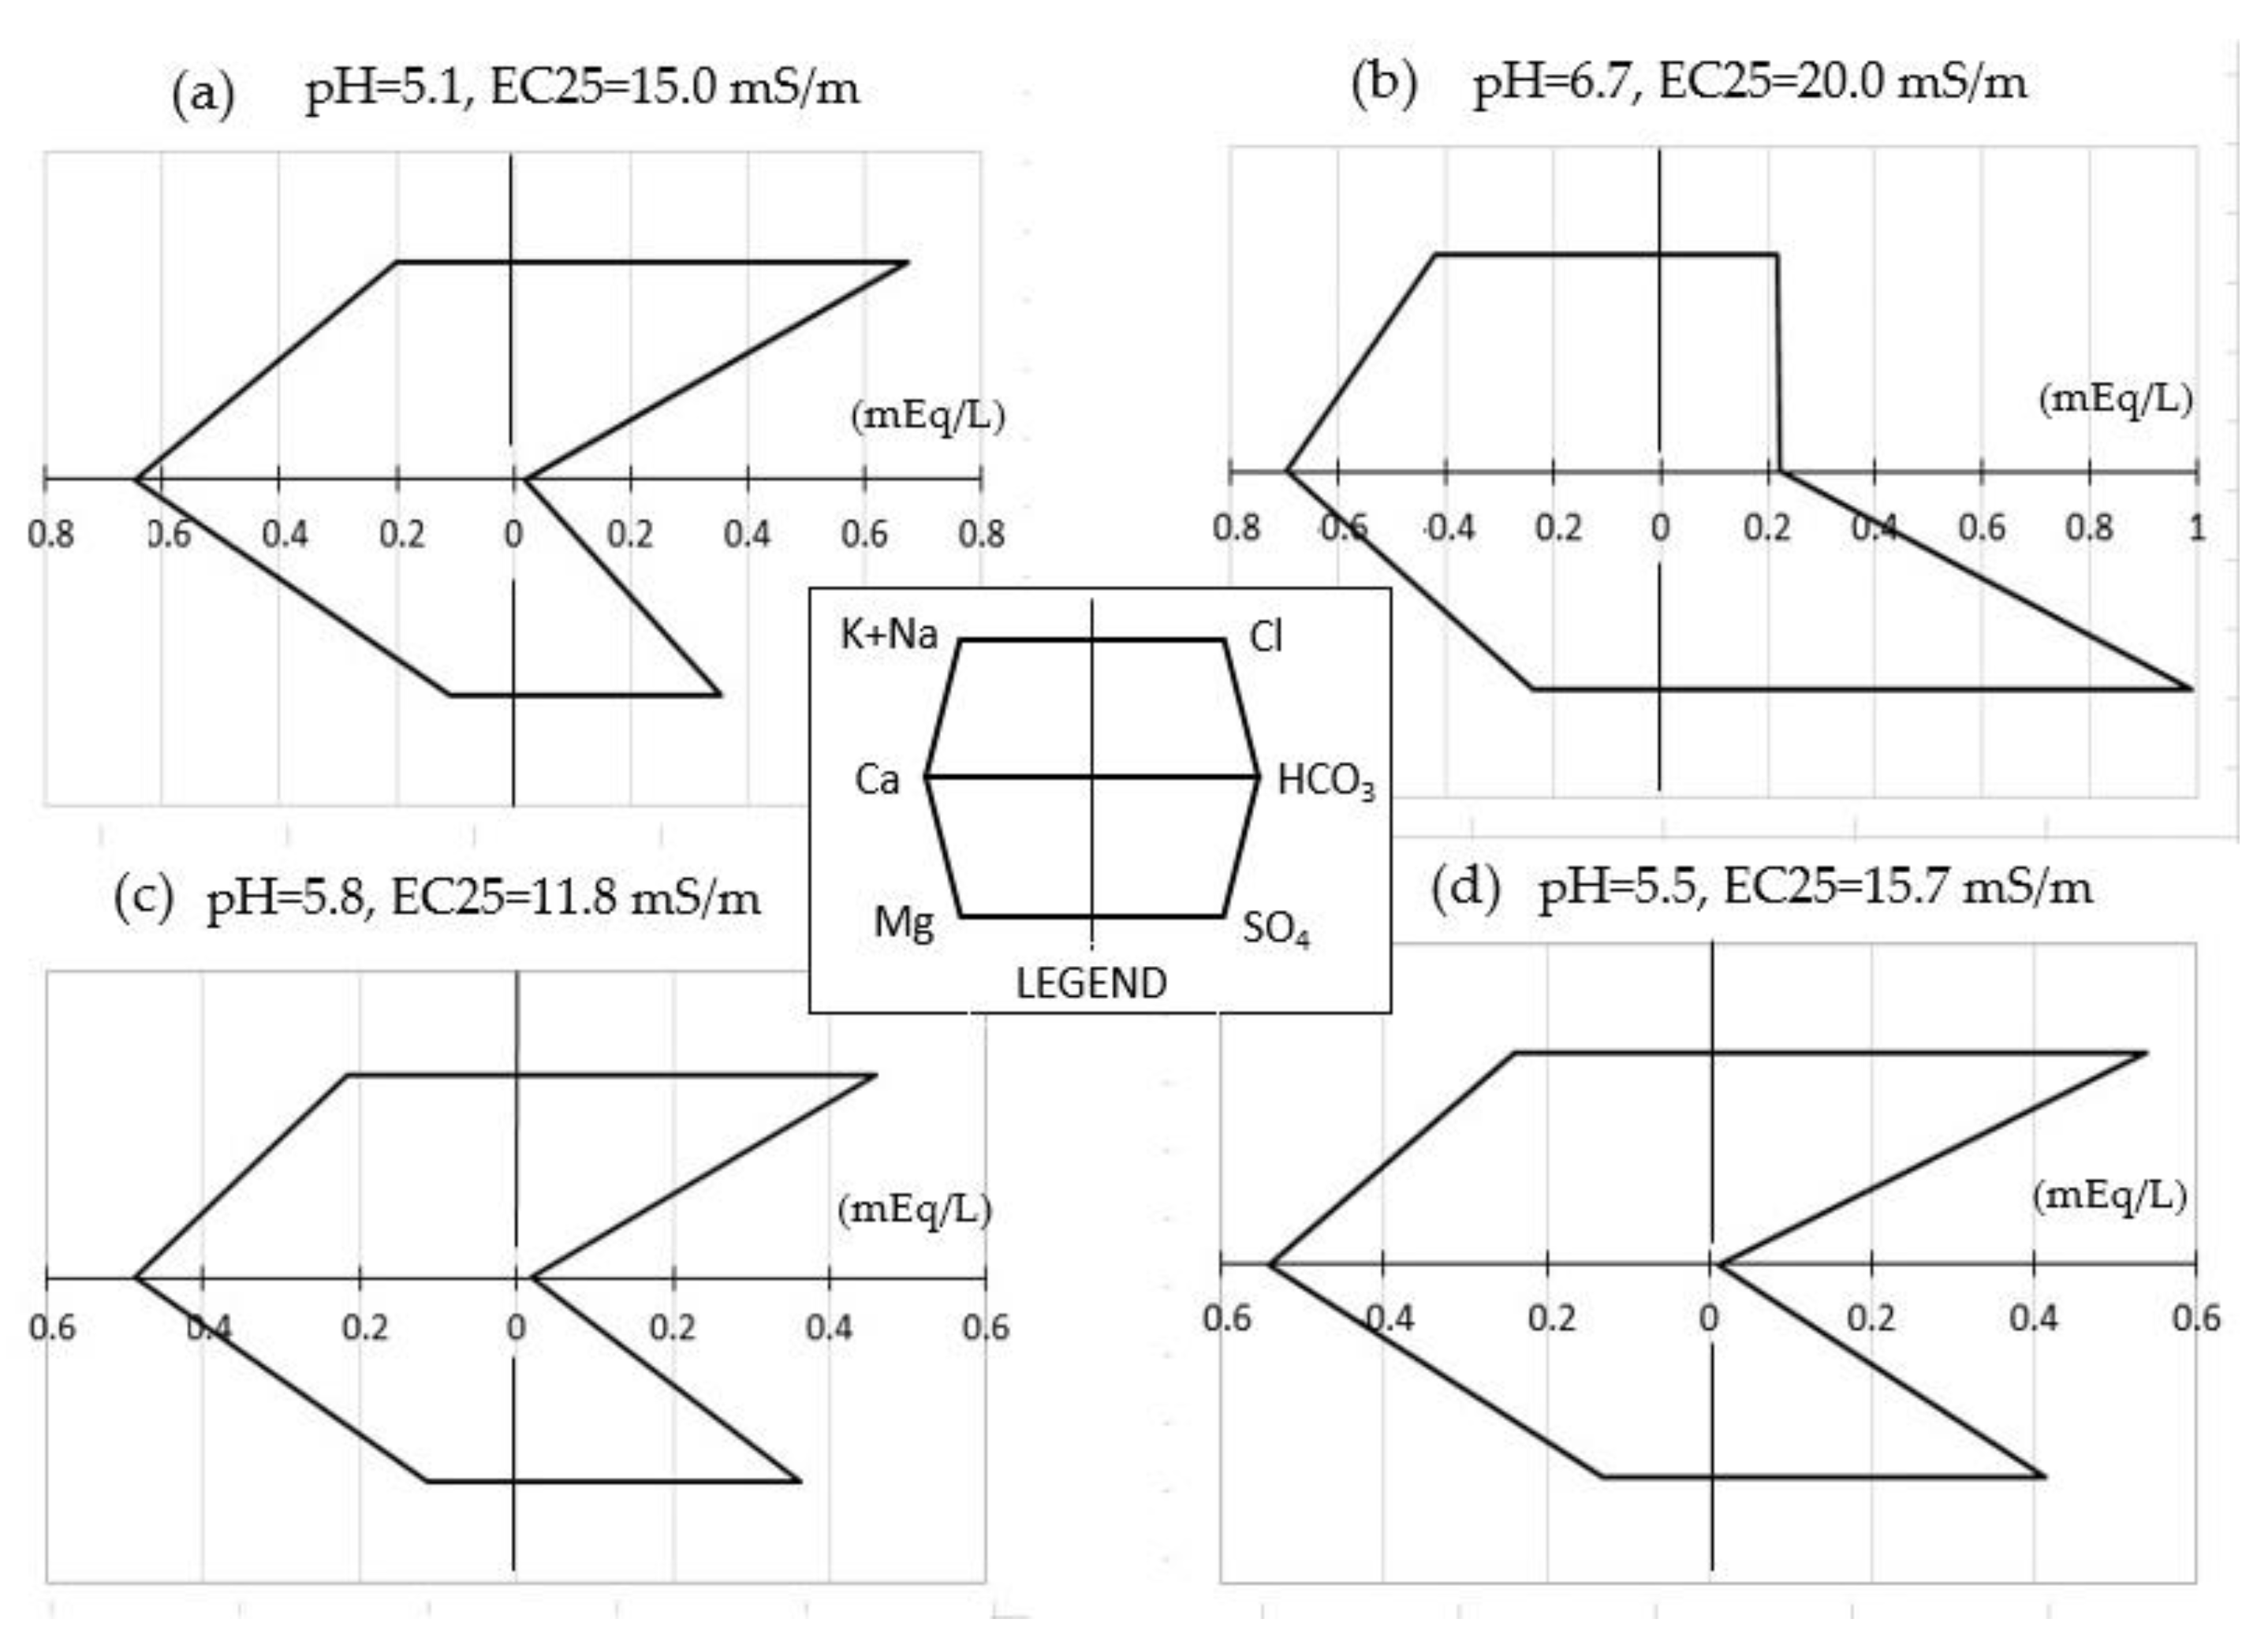
The chemical analyses for water samples provided their stiff diagrams (Figure 2). The lake water and river water were sampled on 8 and 9 July 2021, respectively. The pH and EC25 of sampled water were measured in situ. The waters were commonly high in Ca2+ cations, but also high in Cl- anions with a low pH for Tama River, and high in SO42– and HCO3− with a high pH for Sendachi River. Hence, it is seen that the original volcanic fluids supplied into the two rivers are different in quality. The lake waters rich in Cl-, and thus their water chemistry, is likely influenced by Tama River. The lake deep water exhibits relatively high acidity and EC25, compared with those at the surface (Figure 2c,d). This suggests that the geothermal flux (or water leakage of different qualities) occurred at the bottom [16] or that the vertical mixing of lake water in spring was incomplete (i.e., not holomictic).
For all the water samples, relations between EC25 and Cl− + SO42− concentrations, Cl- concentrations or SO42− concentrations were explored (Figure 3). Here, lake water was separated into the surface water (red plots) and the deep water (gray plots) at more than 50 m in depth. The determination coefficient R2 was then calculated by excluding the plots of deep lake water. There were then relatively high correlations (R2 = 0.827, p < 0.01) for the Cl− + SO42− concentration except for the deep lake water (Figure 3a). For each of the Cl- and SO42− concentrations, the relationship was separated into the Sendachi River samples and the others. There are high correlations for the Cl- concentration (R2 = 0.817, p < 0.01) and the SO42− concentration (R2 = 0.816, p < 0.01) of the Tama River and Lake Tazawa (Figure 3b,c), but for the Cl- concentration, the plots of the deep lake water tend to be non-linearity (Figure 3b). In total, the relation to the SO42− concentration is likely the best, because that of the deep lake water is also plotted on the regression line (Figure 3c).
Hence, if EC25 is monitored in the lake, Tama River and Sendachi River, the EC25 values are available as an indicator for discussing the fluvial SO42− flux and its chemical mass balance in Lake Tazawa, using the relations in Figure 3c. Then, the depositional flux S in Equation (6) is required to be negligibly small when compared with the other terms in Equation (6), since no sediment traps were set at the lake bottom. Meanwhile, in order to evaluate the EC25 value of the whole lake or that of deep water from the monitored surface’s EC25, the relation between EC25 at the surface and that at more depths should be obtained. Here, the vertical EC25 profiles of 0.1 m pitch by the ASTD102 profiler were utilized to obtain such a relation.
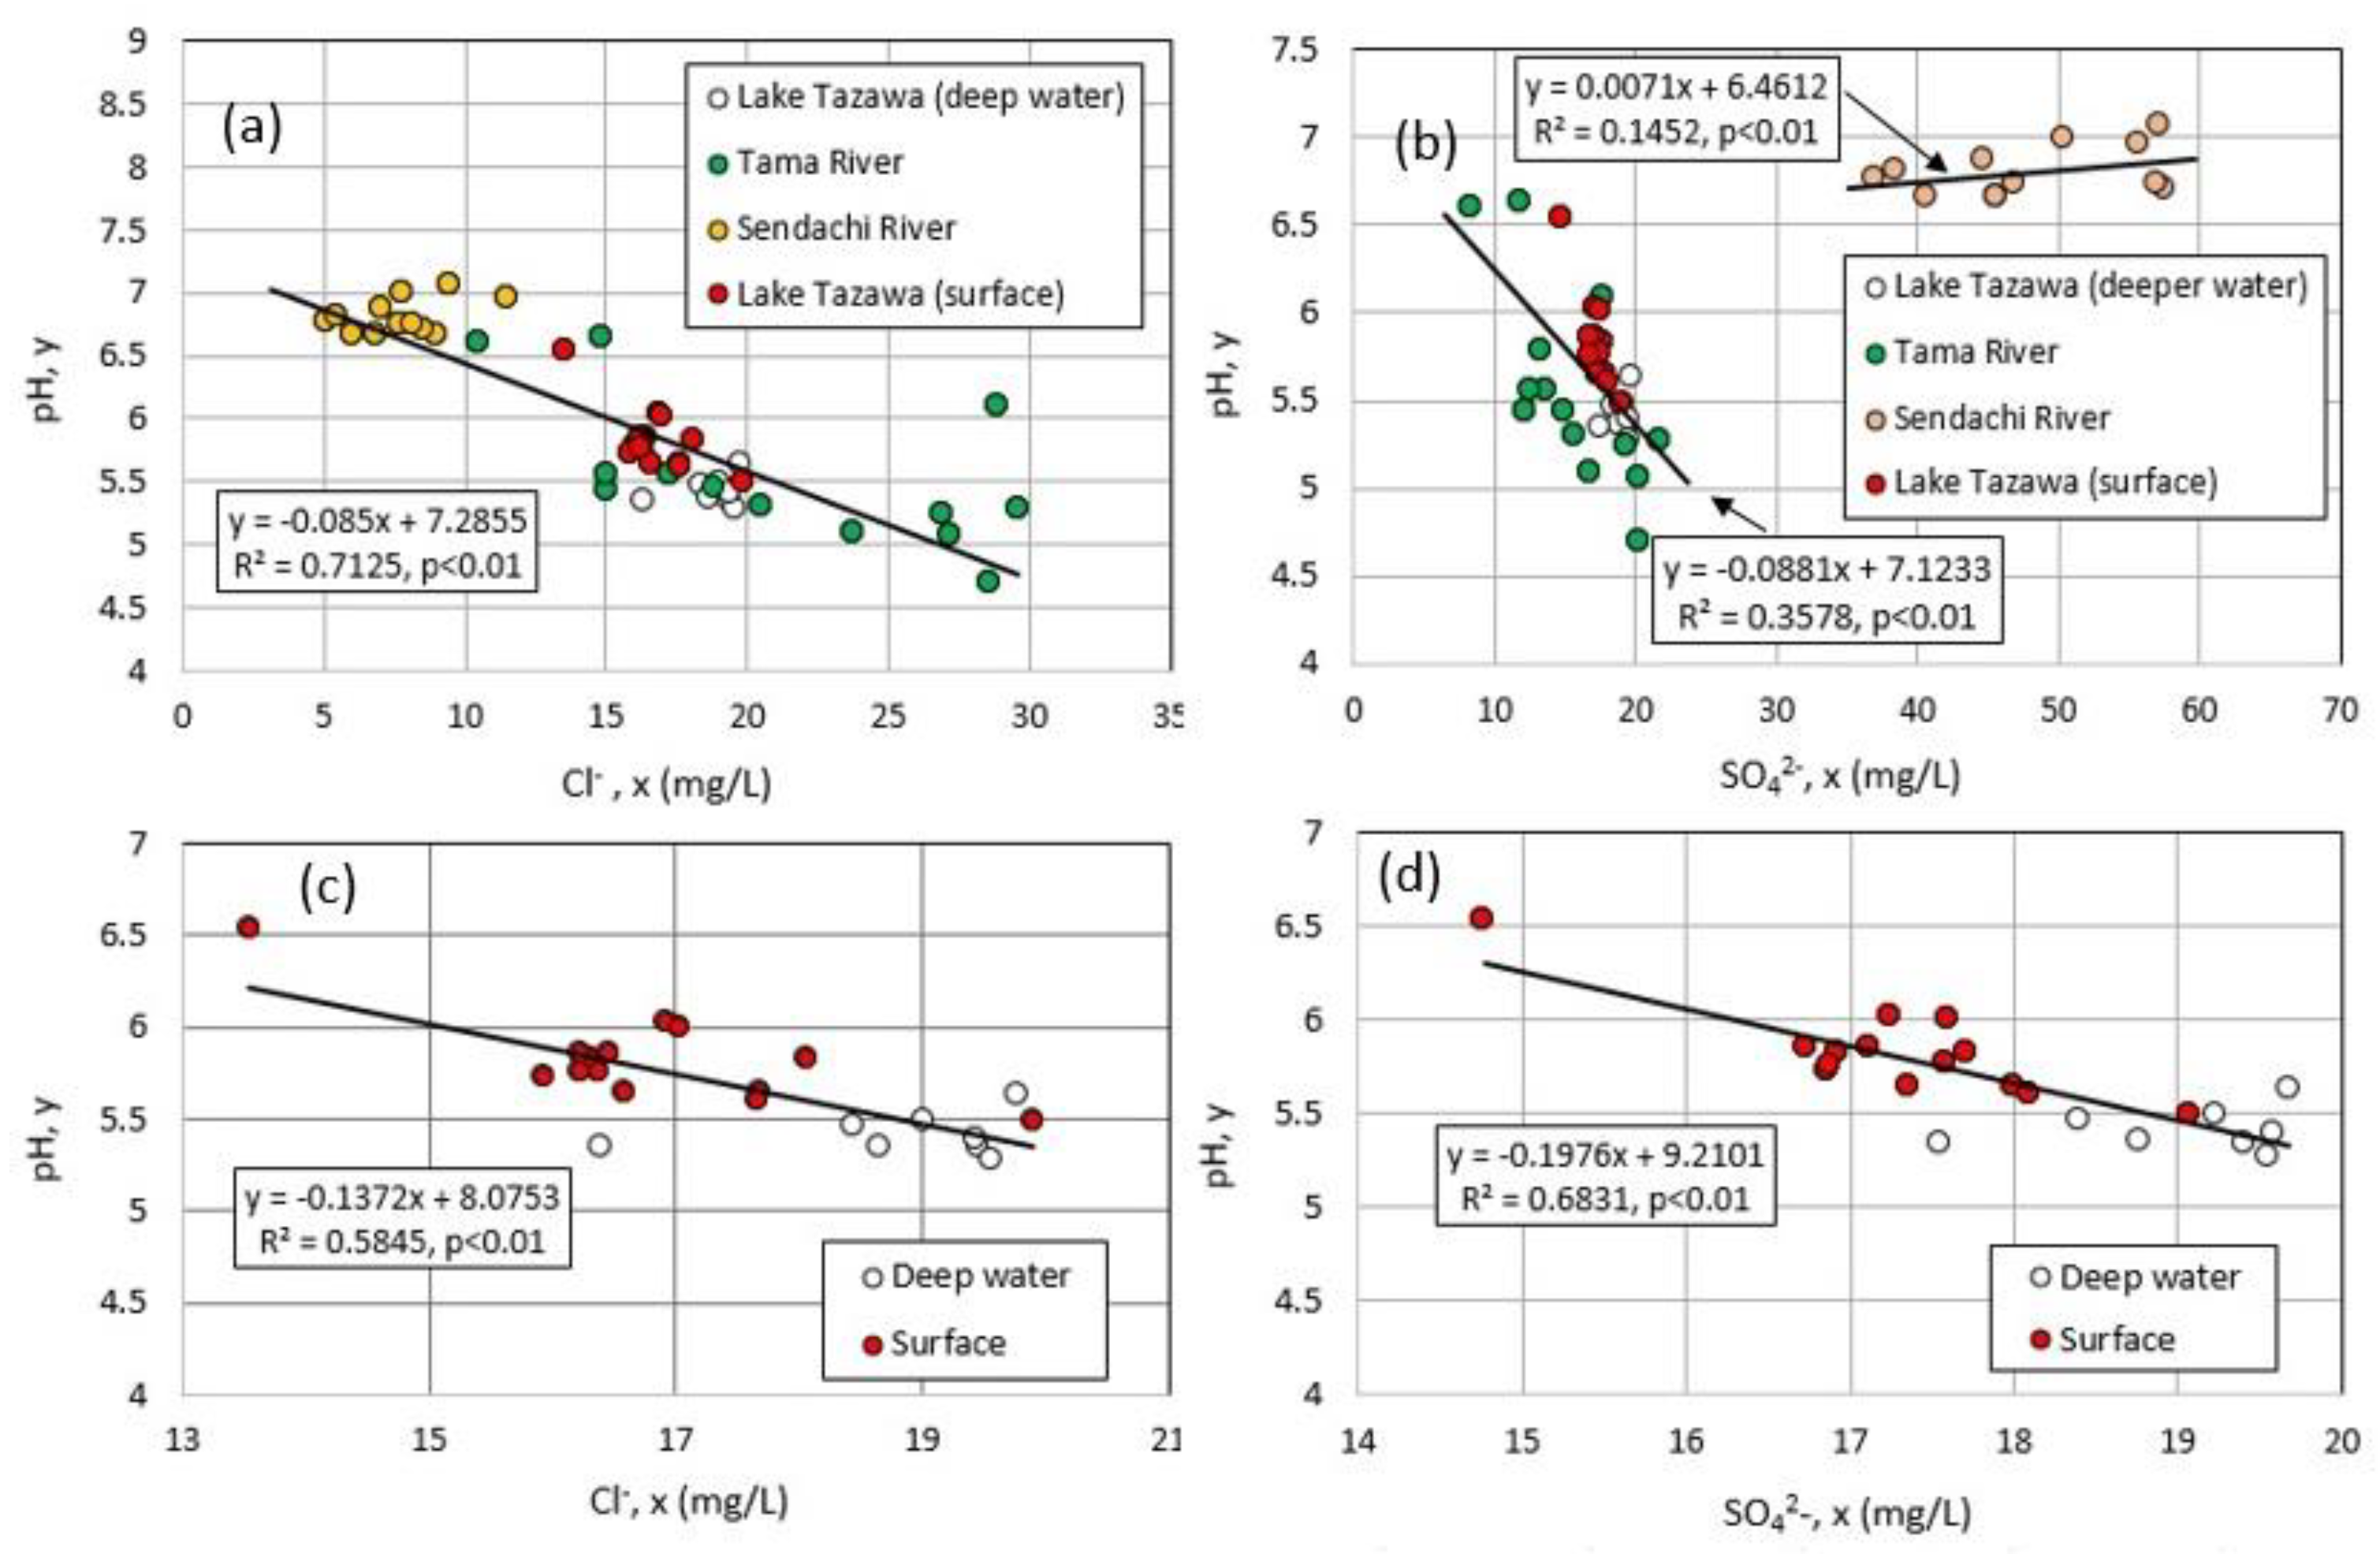
Relations between the Cl− or SO42− concentration and pH for all the samples and for lake water were also explored (Figure 4). The pH of all the samples, including the deep lake water, exhibit a significant correlation with the Cl− concentration at R2 = 0.713 (p < 0.01), but not as much with SO42− concentration, as shown by separately distributed plots for Sendachi River. Only for lake water does the pH indicate the high correlation with both Cl− and SO42− concentrations at R2 = 0.584 and 0.683 (p < 0.01), respectively. Hence, if the EC25 is monitored in the rivers and at the lake surface, the Cl− or SO42− concentration time series are obtained by the regression lines in Figure 3b,c, and then the pH time series are acquired from the regression lines in Figure 4a,c,d.
The pore water from the sediment cores at site MD gave the pH, EC25, and Cl− and SO42− concentrations of 6.51, 38.0 mS/m, 66.0 mg/L and 42.6 mg/L as the average, respectively. Here, the two concentrations were given as those of groundwater inflowing into Lake Tazawa, i.e., CGin in Equation (6). For the rainwater collected at site M, a pH of 5.45 and Cl- and SO42- concentrations of 0.25 mg/L and 0.77 mg/L were obtained as the average. The concentration values were applied as constants to CP in Equation (6).
4.2. Distributions of Water Quality in Lake Tazawa
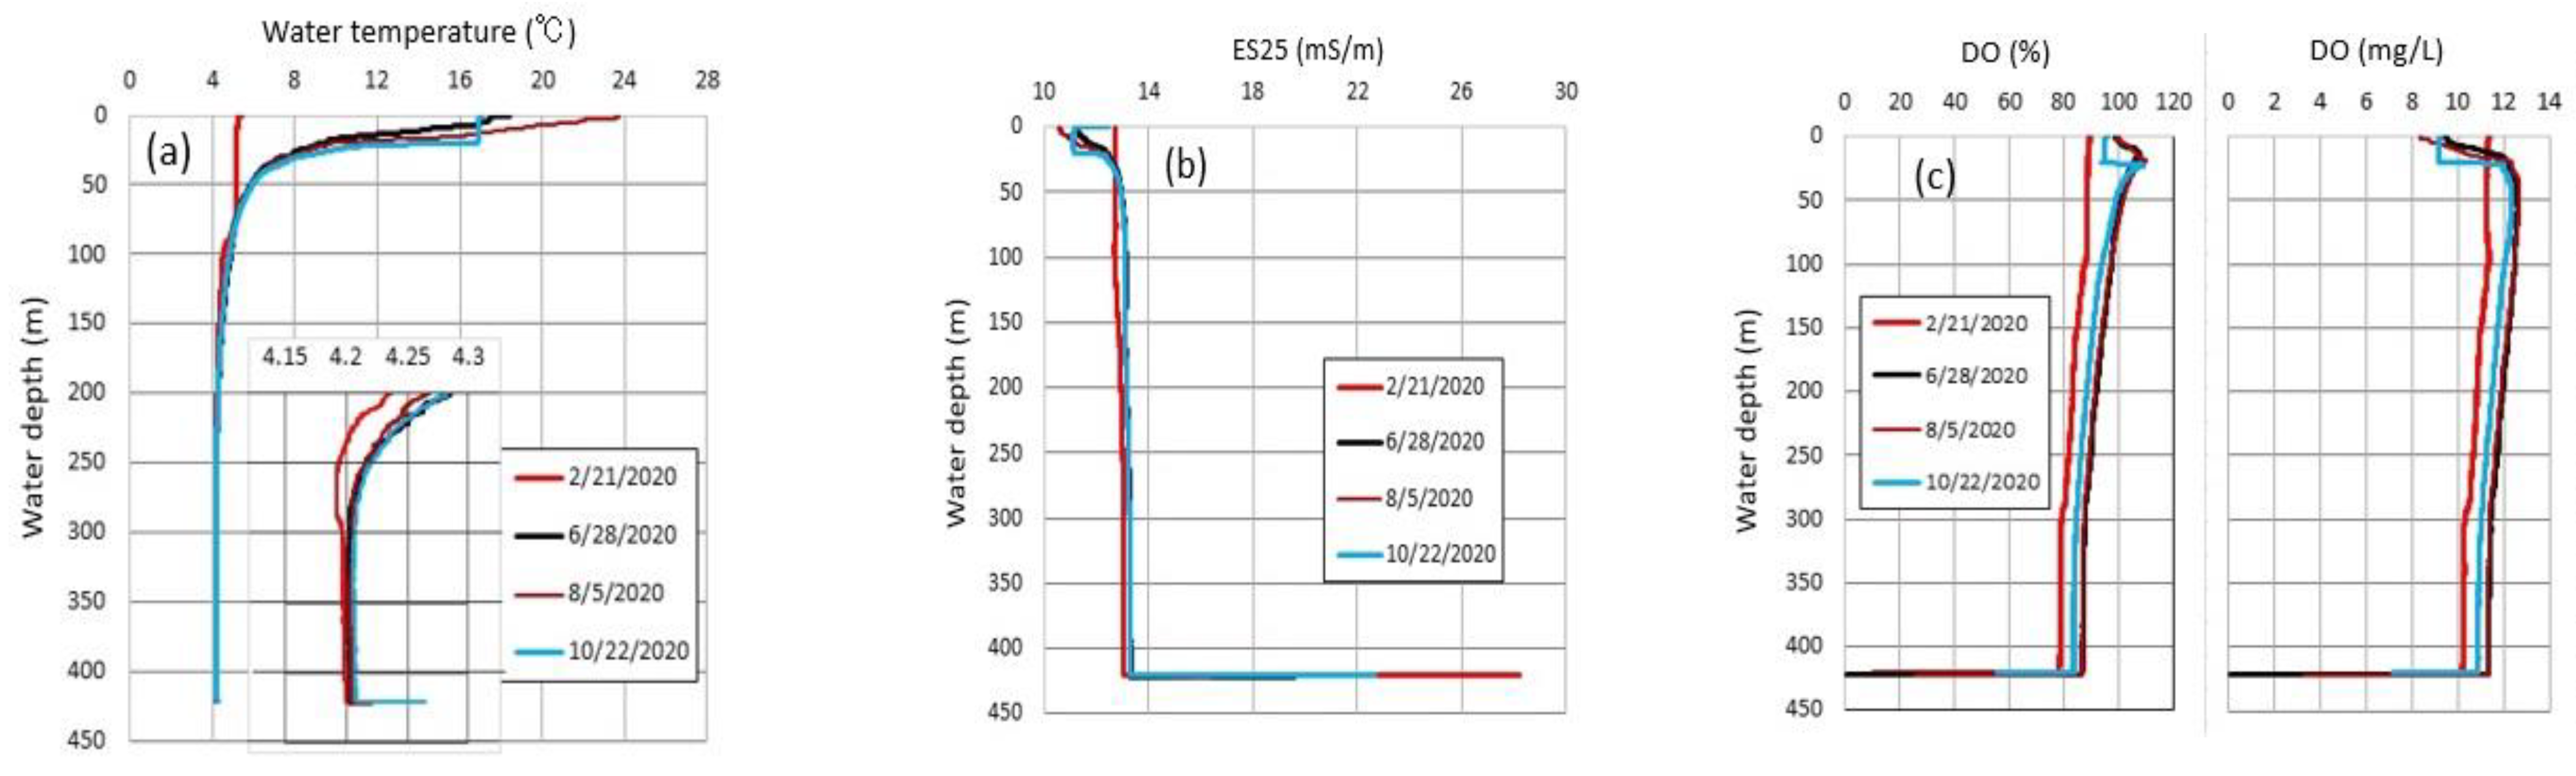
Vertical distributions of water temperature, ES25 and dissolved oxygen (DO) at site MD were obtained at 0.1 m pitch by the ASTD102 profiler on the four non-precipitation days in 2020 (Figure 5). The water temperature of 21 February 2020 was 5.41 °C at the surface and 4.20 °C at the bottom (421.0 m in depth). This suggests that the lake was nearly holomictic (Figure 5a). In fact, the temperature logger at 0.2 m depth of site L recorded 4.04–4.12 °C at 04:00–07:00 of 14 March 2020. However, the lake was not likely to be completely holomictic, since the 0.2 m depth temperature held more than 4.40 °C at all the other times. Toward the heating season of June and August, the surface temperature increased, and then decreased with the upper isothermal layer in the cooling season of October. Meanwhile, at more than 200 m in depth, the temperature gradually increased from 4.20 °C in February to 4.22 °C in October as the average between the 200 m depth and the bottom (see the inserted graph in Figure 5a). This suggests that the geothermal flux occurs at the bottom [16] or that groundwater with the different water quality leaks into the bottom layer. The EC25 at more than 200 m in depth then increased from 13.14 mS/m in February to 13.27 mS/m in June, but stayed almost constant in August and October. The DO stayed high at more than 80% or more than 10 mg/L in the whole layer (Figure 5c), suggesting low oxygen consumption by the decomposition of organic matter. Sporadically, water temperature and EC25 abruptly increased at 0.2 m or less above the bottom, and DO then became zero or nearly zero. This suggests that there existed a nepheloid layer near the bottom [17].
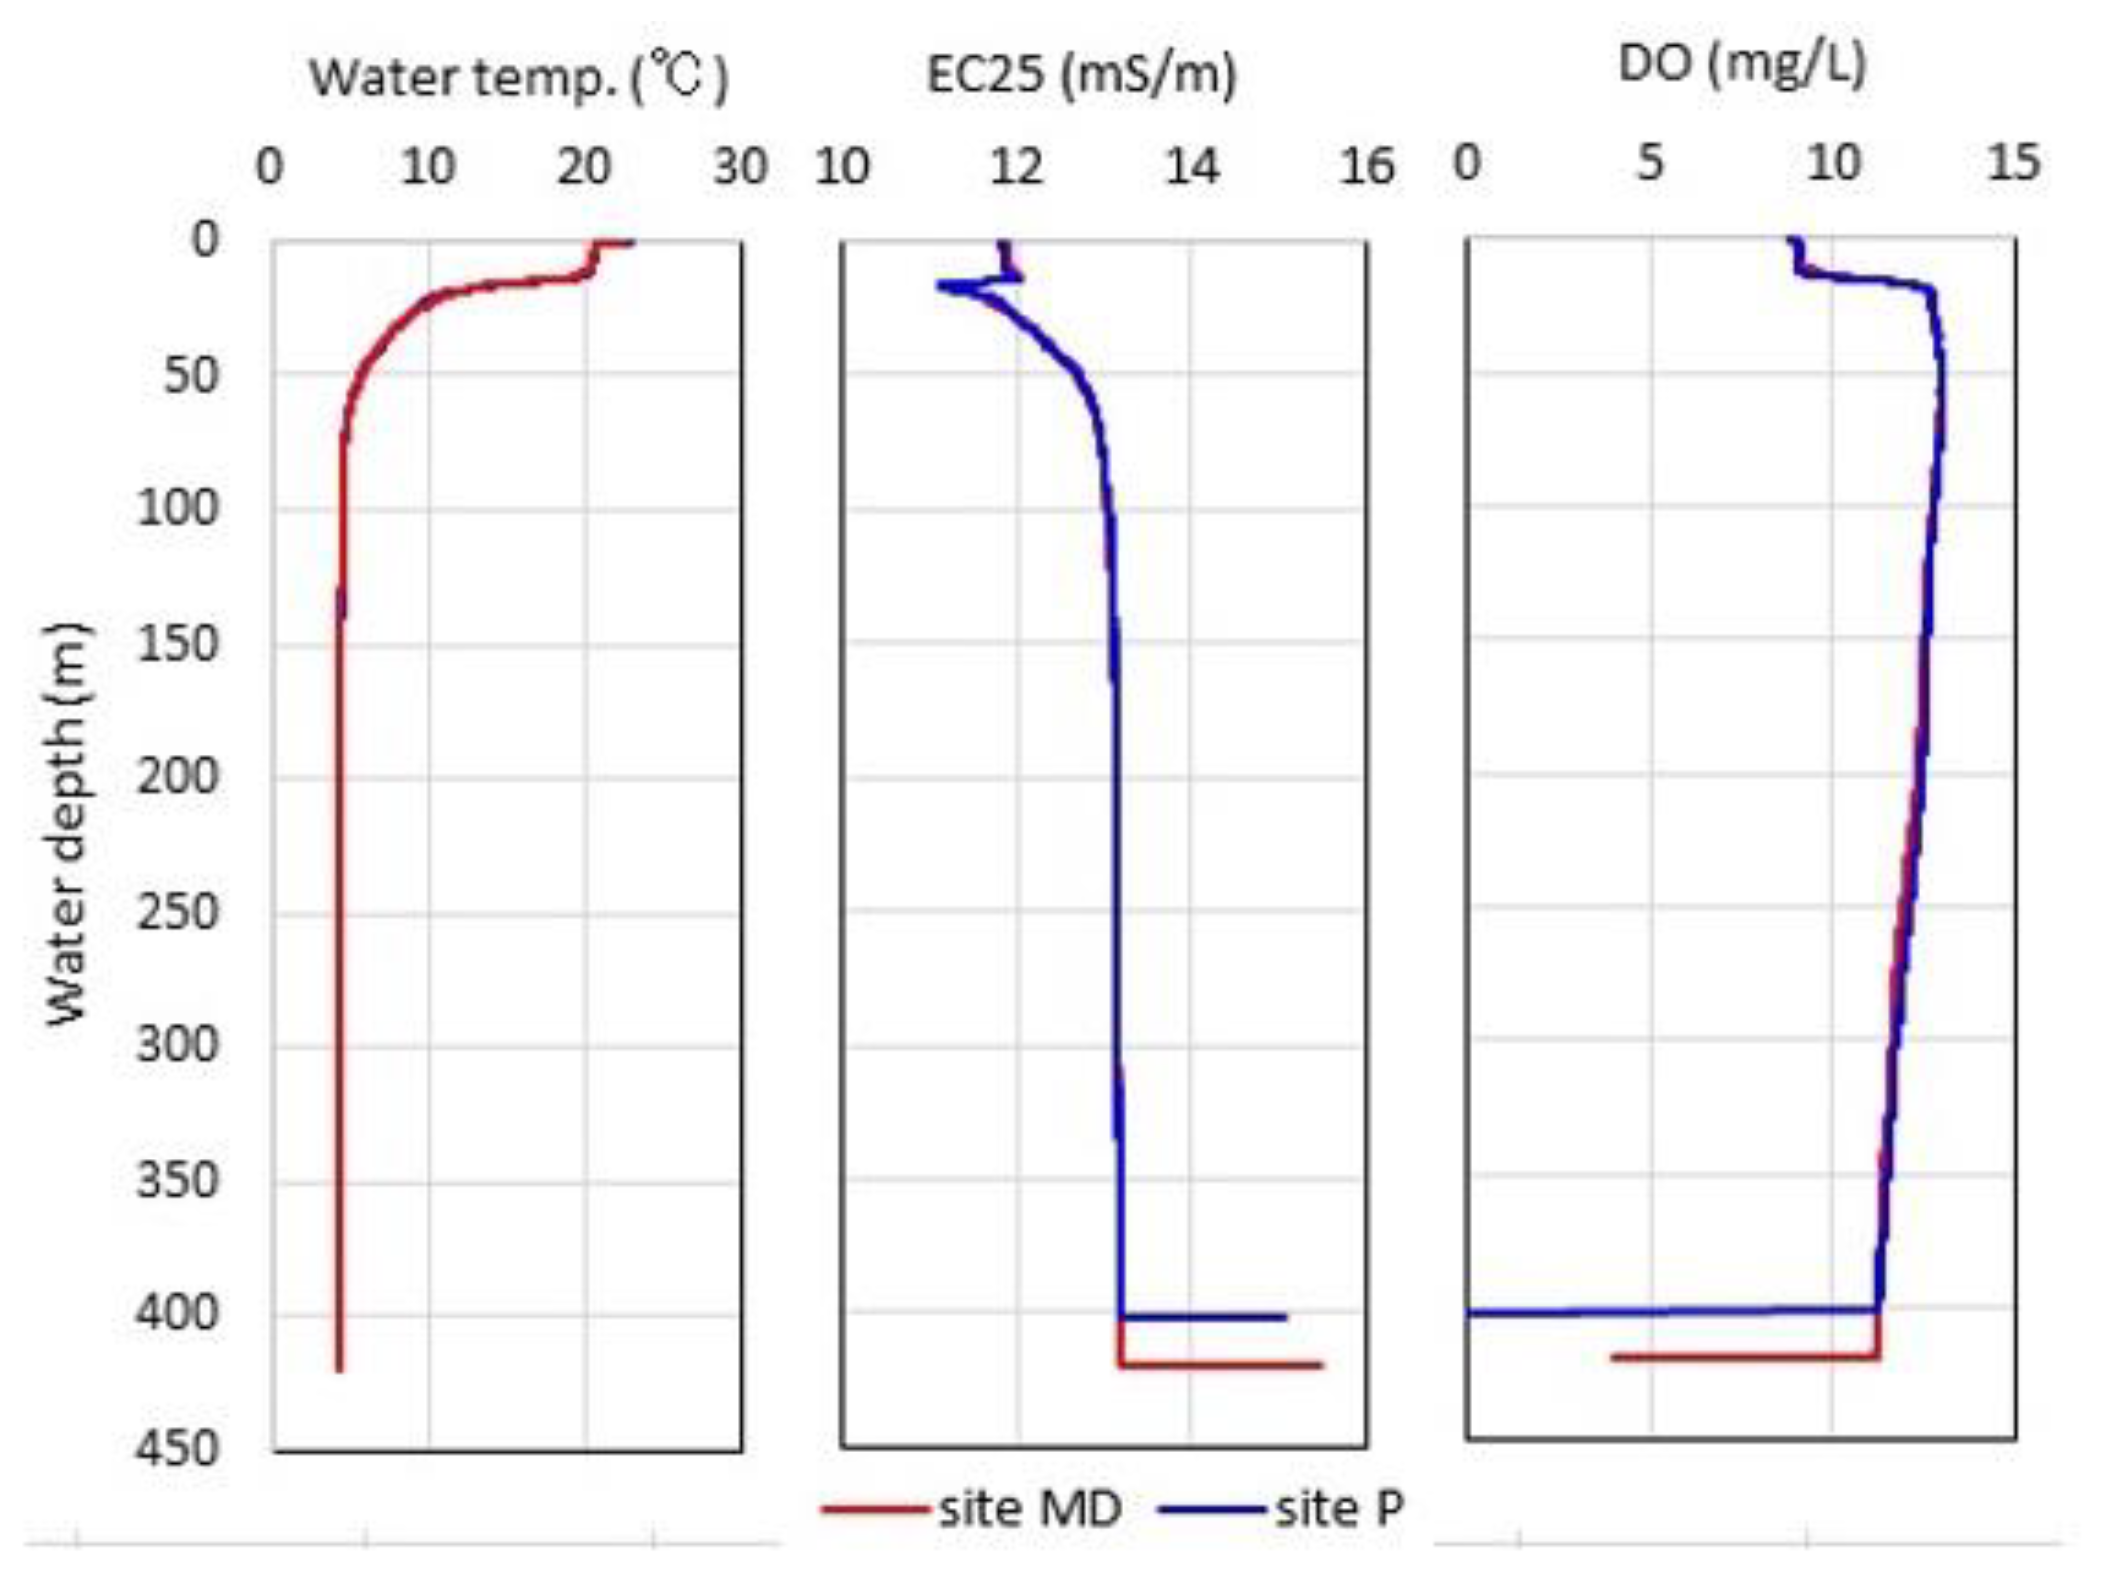
Vertical profiles of water temperature, EC25 and DO were also obtained at sites MD and P on 10 September 2020 (Figure 6). The profiles were acquired at 14:47–14:06 (site P) and 15:30–15:53 (site MD) of the day. There was little difference (within the accuracies, ±0.01 °C, ±0.1 mS/m and ±0.4 mg/L) between the two sites for the three quantities at a certain depth. This indicates that the chemical quality of lake water is horizontally uniform at a certain depth, and that the water quality data vertically obtained at site MD can be applied to the whole lake by the vertical integral. The uniformity of water quality was possibly produced by relatively strong horizontal lake currents, which can be induced by the inflow and outflow system in the lake.
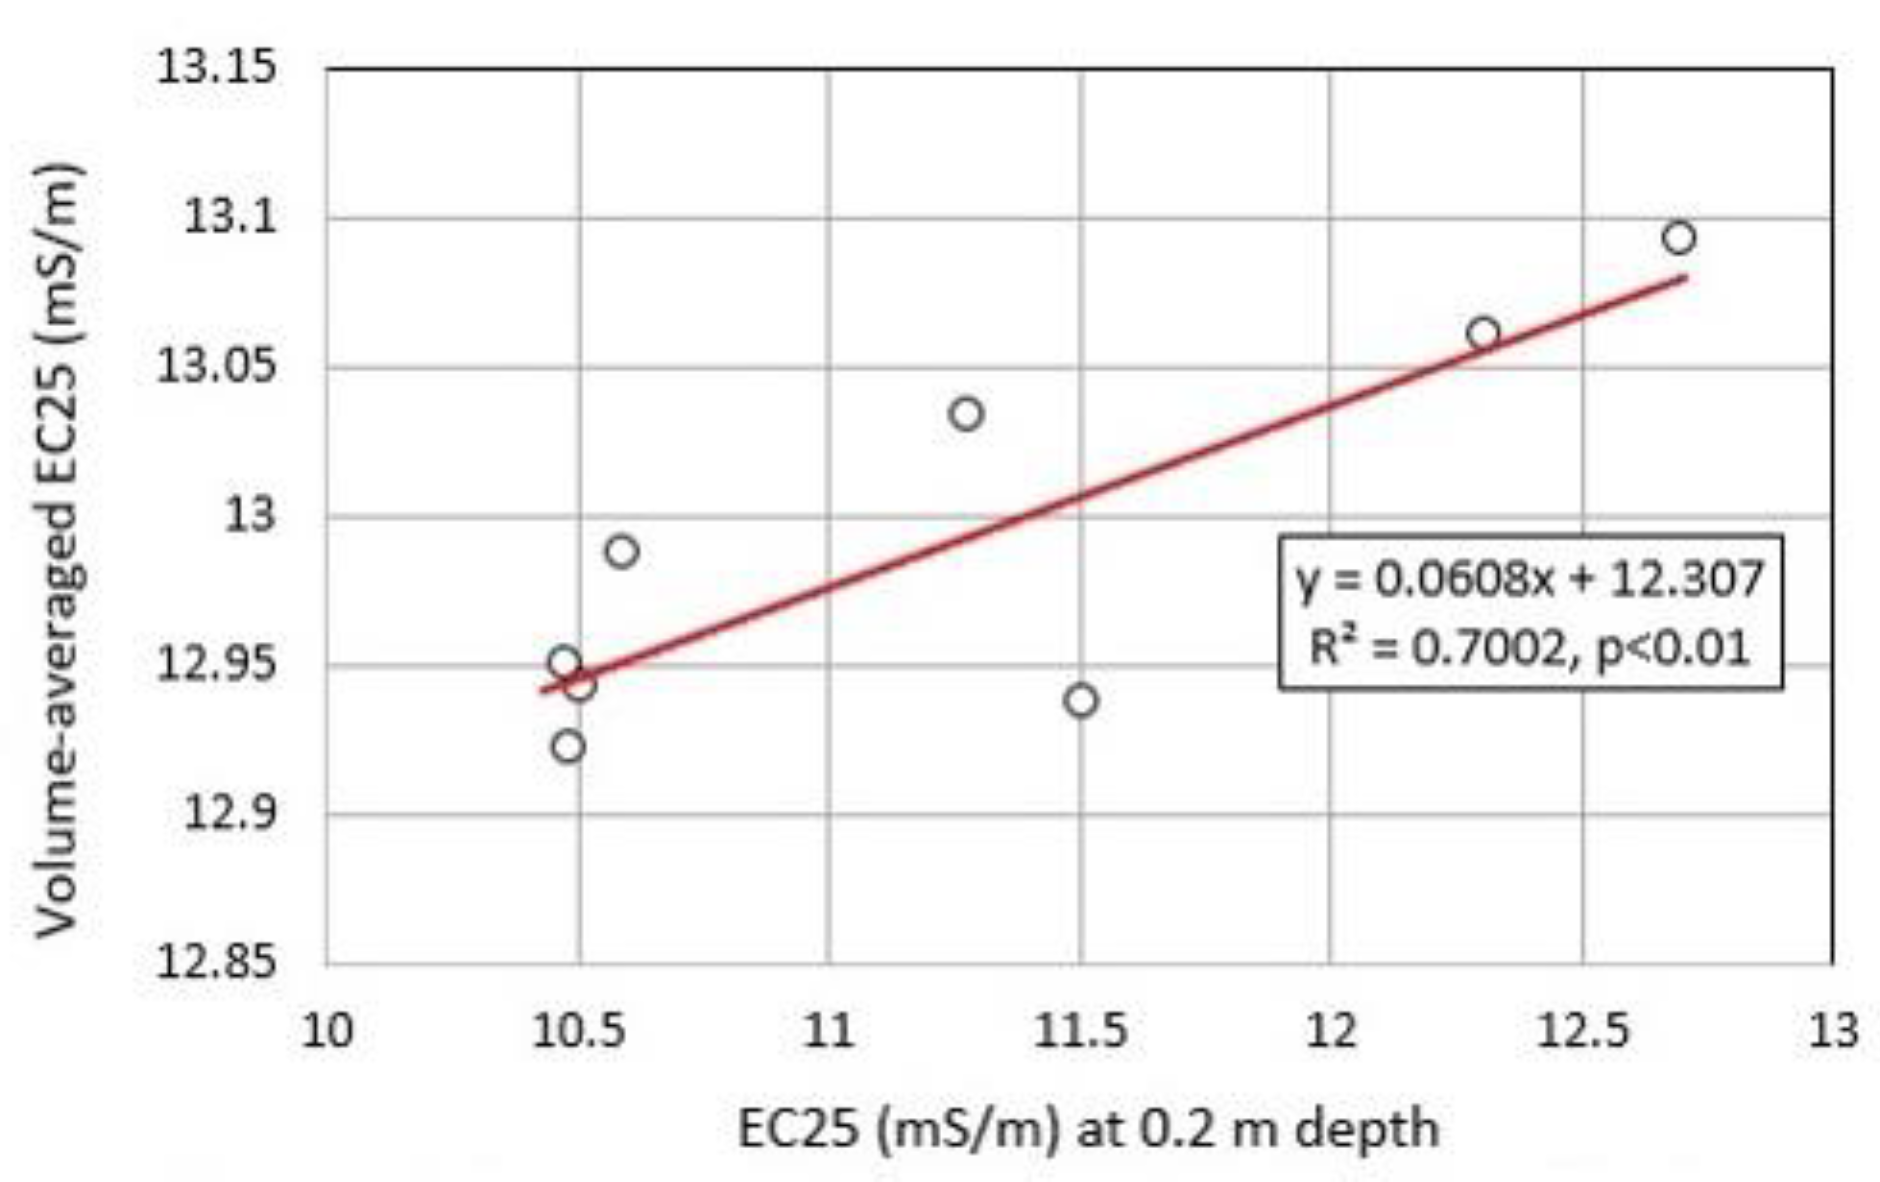
A relation between EC25 at 0.2 m depth and volume-averaged EC25 was explored (Figure 7). This relation was acquired by the vertical EC25 profiles at site MD from the profiler in 2020–2021. The volume-averaged EC25 was calculated by vertically integrating the EC25 profiles with the bathymetric map in Figure 1, supposing the horizontal uniformity in EC25 at a certain depth (Figure 6). The significant correlation (R2 = 0.700, p < 0.01) allowed us to evaluate EC25 in the whole lake from the EC monitoring at site L. The volume-averaged EC25 was then converted into the representative SO42− or Cl− concentration in the lake as the lake water concentration CL in Equation (6) and (7), using the regression lines in Figure 3b,c.
4.3. Time Series of Hydrometeology, Inflow and Outflow
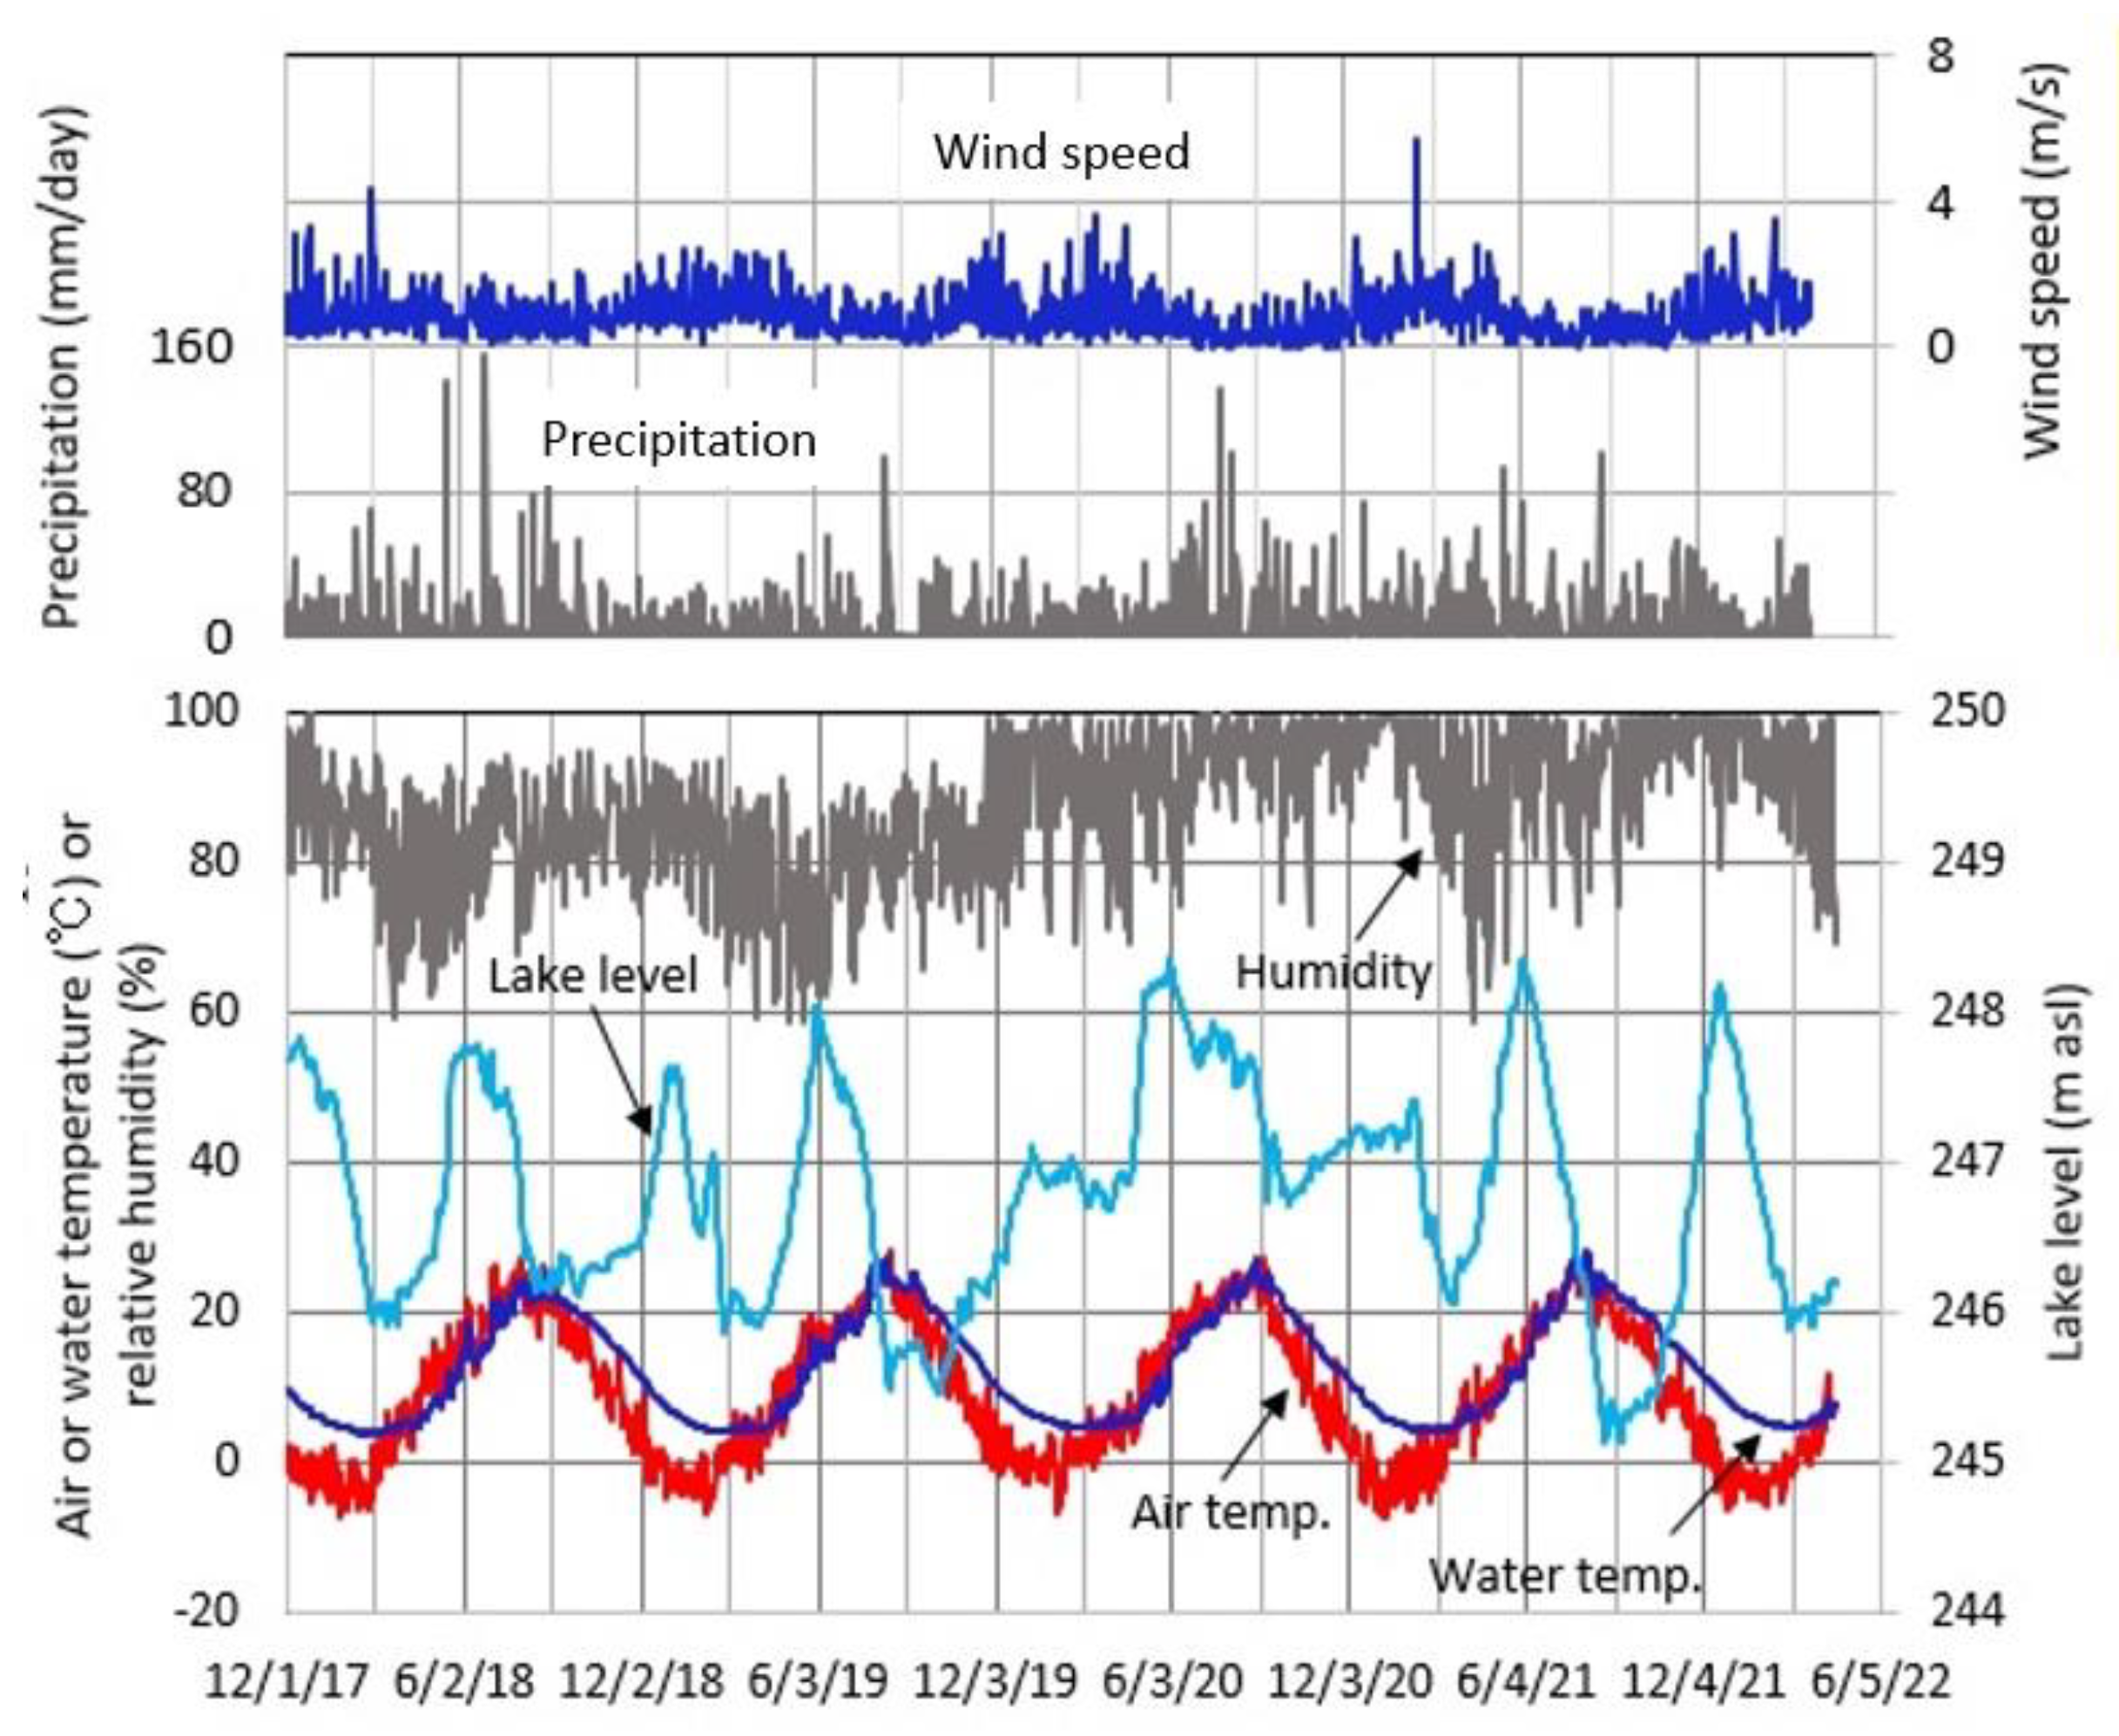
The meteorological monitoring at site M and the temperature and lake level loggers at site L furnished temporal variations of daily mean air temperature, relative humidity, wind speed, daily precipitation, daily mean lake level and 0.2 m depth water temperature for 1 December 2017–31 March 2022 (Figure 8). The lake level changed between 245.13 m asl (10 September 2021) and 248.36 m asl (31 May 2021). Thereby, the water depth at site MD varied between 419.13 m and 422.36 m, and the lake surface area changed between 2.523 × 10⁷ and 2.580 × 10⁷ m2. The wind speed, air temperature, relative humidity and 0.2 m depth water temperature were applicable to obtain daily time series of evaporation E (m/s) at the lake’s surface, using Equation (2) and (3), and to evaluate the contribution of evaporation to the hydrological budget of the lake by multiplying E by the lake’s surface area.
The air temperature was less than 0 °C on almost all the days in December–February, and snowfall then occurred. However, the air and water temperature variation in winter changed among the five winters in Figure 8. In the winter for December 2017, the surface water temperature was 3.93–4.20 °C for 12 February–10 March 2018, responding to the relatively low air temperature. Then, the lake could be completely holomictic, because the lake bottom temperature held 4.20–4.21 °C (Figure 5a). Meanwhile, in the winters from December 2018–2021, the lowest surface water temperature at the daily mean was 4.24 °C on 1 March 2019, 4.65 °C on 23 March 2020, 4.19 °C on 24 February 2021 and 4.15 °C on 6 March 2022. Each of the latter two temperatures (less than 4.20 °C) were recorded only once a day. Hence, in the winters from December 2018–2021, the vertical mixing of lake water was probably incomplete, though the hourly records indicated 4.00–4.20 °C for a few hours a day (Figure 5a). The lake level increased by 0.2–0.3 m in response to the large rainfalls at more than 100 mm/day. Actually, the lake level greatly varied with the maximum amplitude of 3.2 m. This indicates that the temporal variations in lake level are artificially controlled by the three power plants.
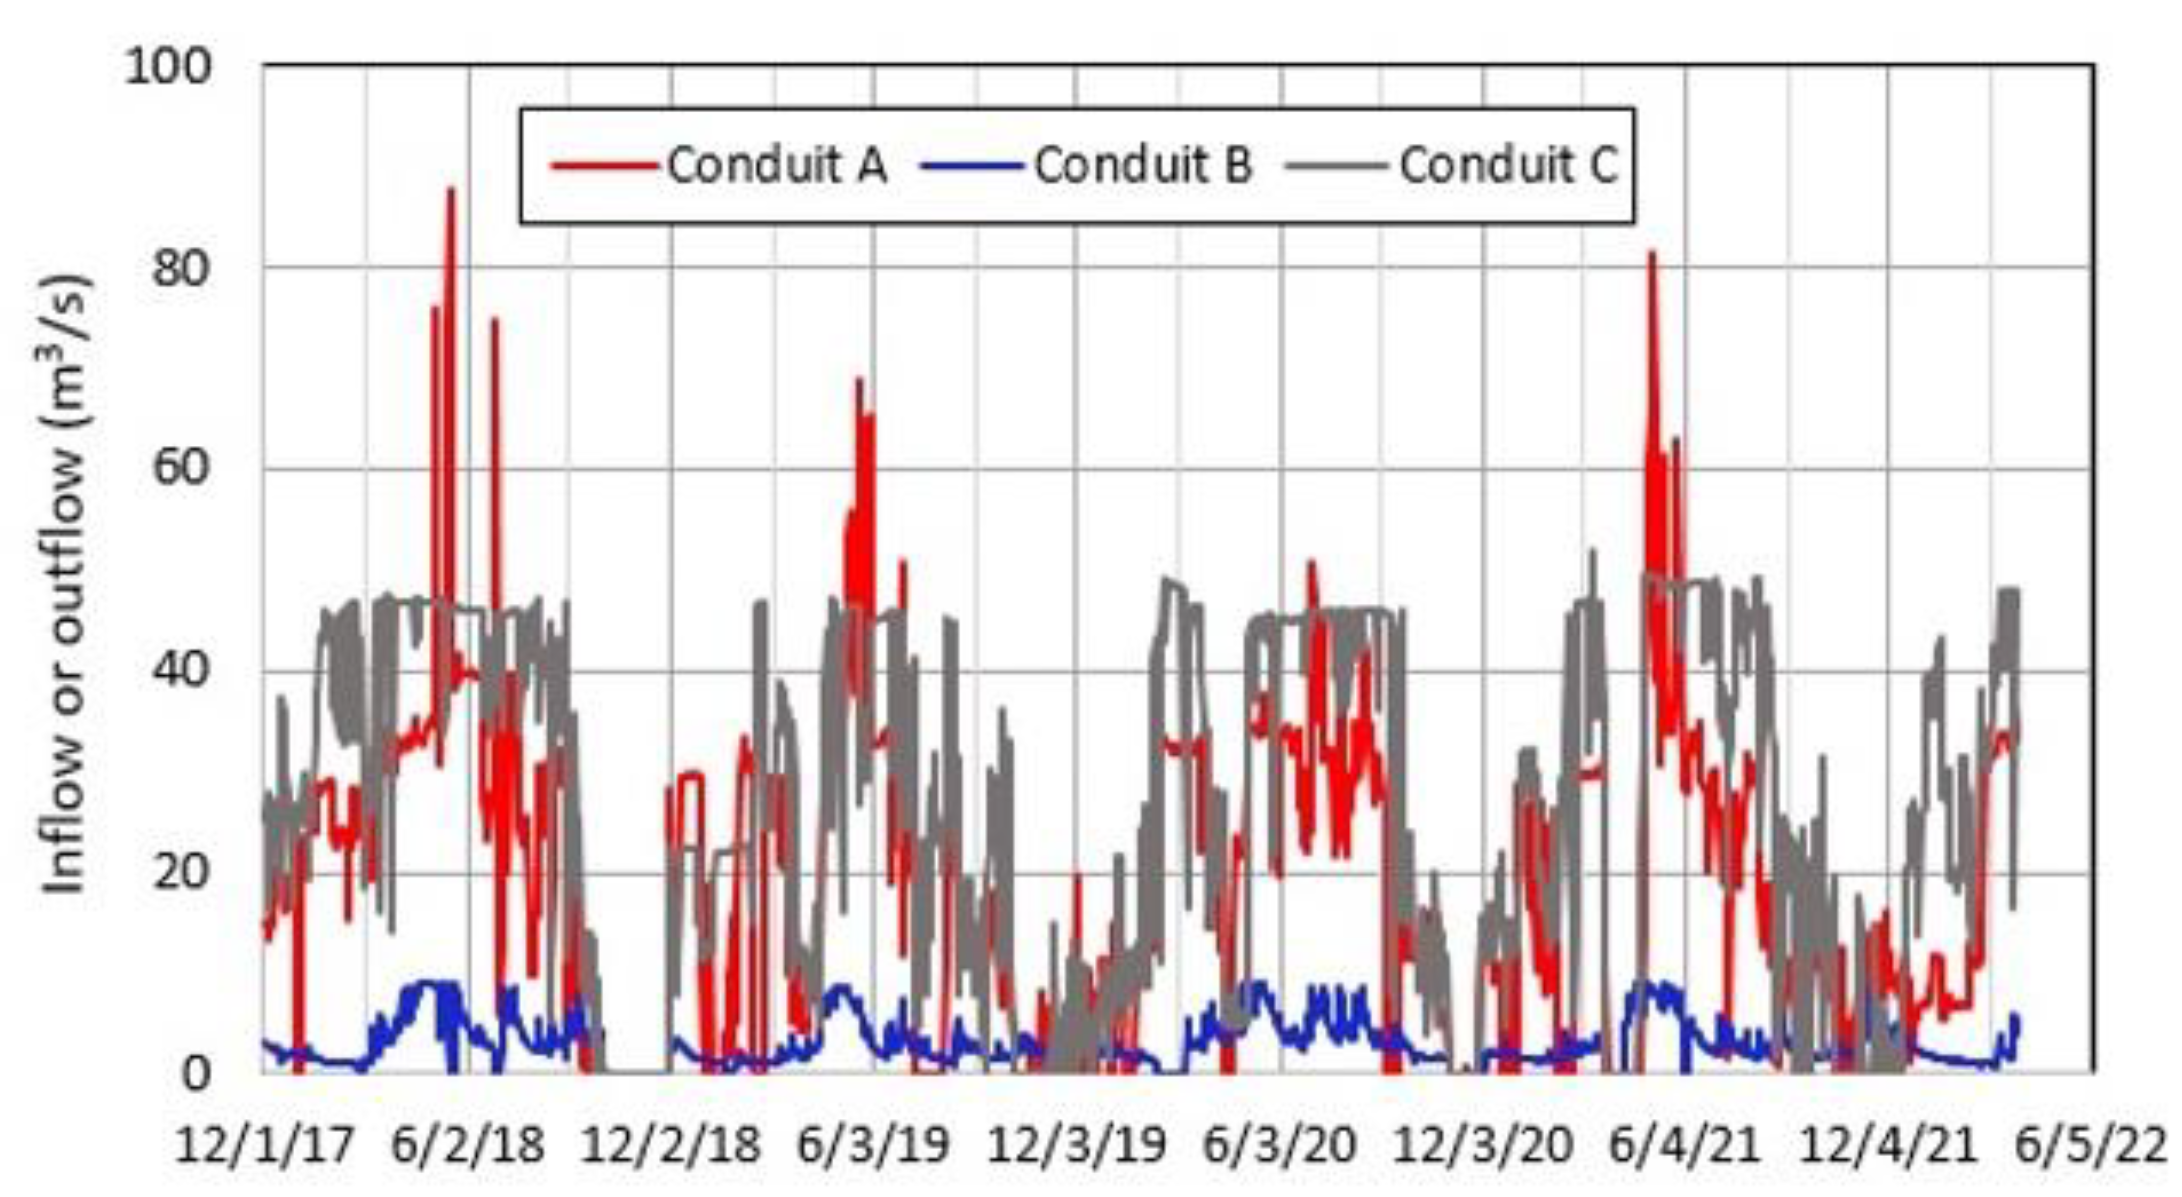
The discharge monitoring at the conduits A, B and C provided daily mean time series of the inflow at the conduits A and B and the outflow at the conduit C for 1 December 2017–31 March 2022 (Figure 9). The outflow stayed highly constant at 45–48 m3/s in the irrigation season of May–August in addition to the usual power generation. The annual mean inflows at the conduits A and B were 22.85 m3/s and 3.10 m3/s in 2018, 15.14 m3/s and 2.75 m3/s in 2019, 19.92 m3/s and 3.43 m3/s in 2020, and 17.52 m3/s and 3.18 m3/s in 2021. Thus, the inflow at the conduit A was 5.5–7.4 times larger than at the conduit B, and can greatly influence the hydrological budget in the lake. The inflow and outflow were adjusted to zero in March–April, before the irrigation season, or in October–November, after the irrigation season, to maintain the function of each of the power plants. In such a case, Equation (5) was applicable to evaluate the net groundwater inflow G. Meanwhile, the discharge at the conduit D (Figure 1) was constant at 2.0 m3/s for 10 May–31 August in the irrigation season and zero in the other periods.
4.4. Hydrological Budget Estimate for Lake Tazawa
By applying the observed and calculated quantities to Equation (1)–(3), the hydrological budget of Lake Tazawa was estimated, and thereby an unknown factor, the net groundwater inflow G, was obtained. Here, the eight periods of zero outflow at the conduit C and zero inflow at the conduit A for 1 December 2017–31 March 2022 (Figure 9) were adopted as hydrological budget periods (Table 1). This is because the magnitude of the inflow at conduit A and the outflow at conduit C is enough to seriously influence the hydrological budget in the lake, thus producing the high potentiality of large errors in estimating the net groundwater inflow G. Hence, Rout = 0 and Rin at the conduit B were given to Equation (1). In this case, non-rainfall periods were not chosen as in Chikita et al. [17], because the mean rainfall in m3/s over the periods after or before the irrigation season was negligibly small when compared with Rin and Rout (Figure 8). Here, the outflow at the conduit D was regarded as zero, because the eight periods were out of the irrigation season (10 May–31 August).
The evaporation E and the net groundwater inflow G were calculated for the eight periods (Table 2). Here, the rainfall on the lake was given as total (mm) and mean rainfall (m3/s) over the periods to compare with the inflow and outflow (Figure 9). The rainfall in m3/s was calculated by the product of daily rainfall (mm/day) and lake surface area (m2) corresponding to the lake level on the rainfall day. All the G values in Table 2 are negative, and thus the groundwater outflow Gout is larger than the groundwater inflow.
Gin, though the standard deviation of calculated G is relatively large. Considering the day length and standard deviation of the G values, of all the eight periods, No. 1 and Nos. 5–7 periods under the condition of zero inflow at the conduit B are likely to give the relatively reasonable G values at −1.73–−1.02 m3/s. In these four periods, the standard deviation of the lake level (thus, also the temporal change, ∆V/∆t, of lake volume) and mean rainfall were relatively small at 0.009–0.061 m and 1.11–1.74 m3/s, respectively. In the short periods of Nos. 2–4 and No. 8, when the inflow at the conduit B occurred, the inflow likely controlled the G values.
4.5. Time Series of Water Quality
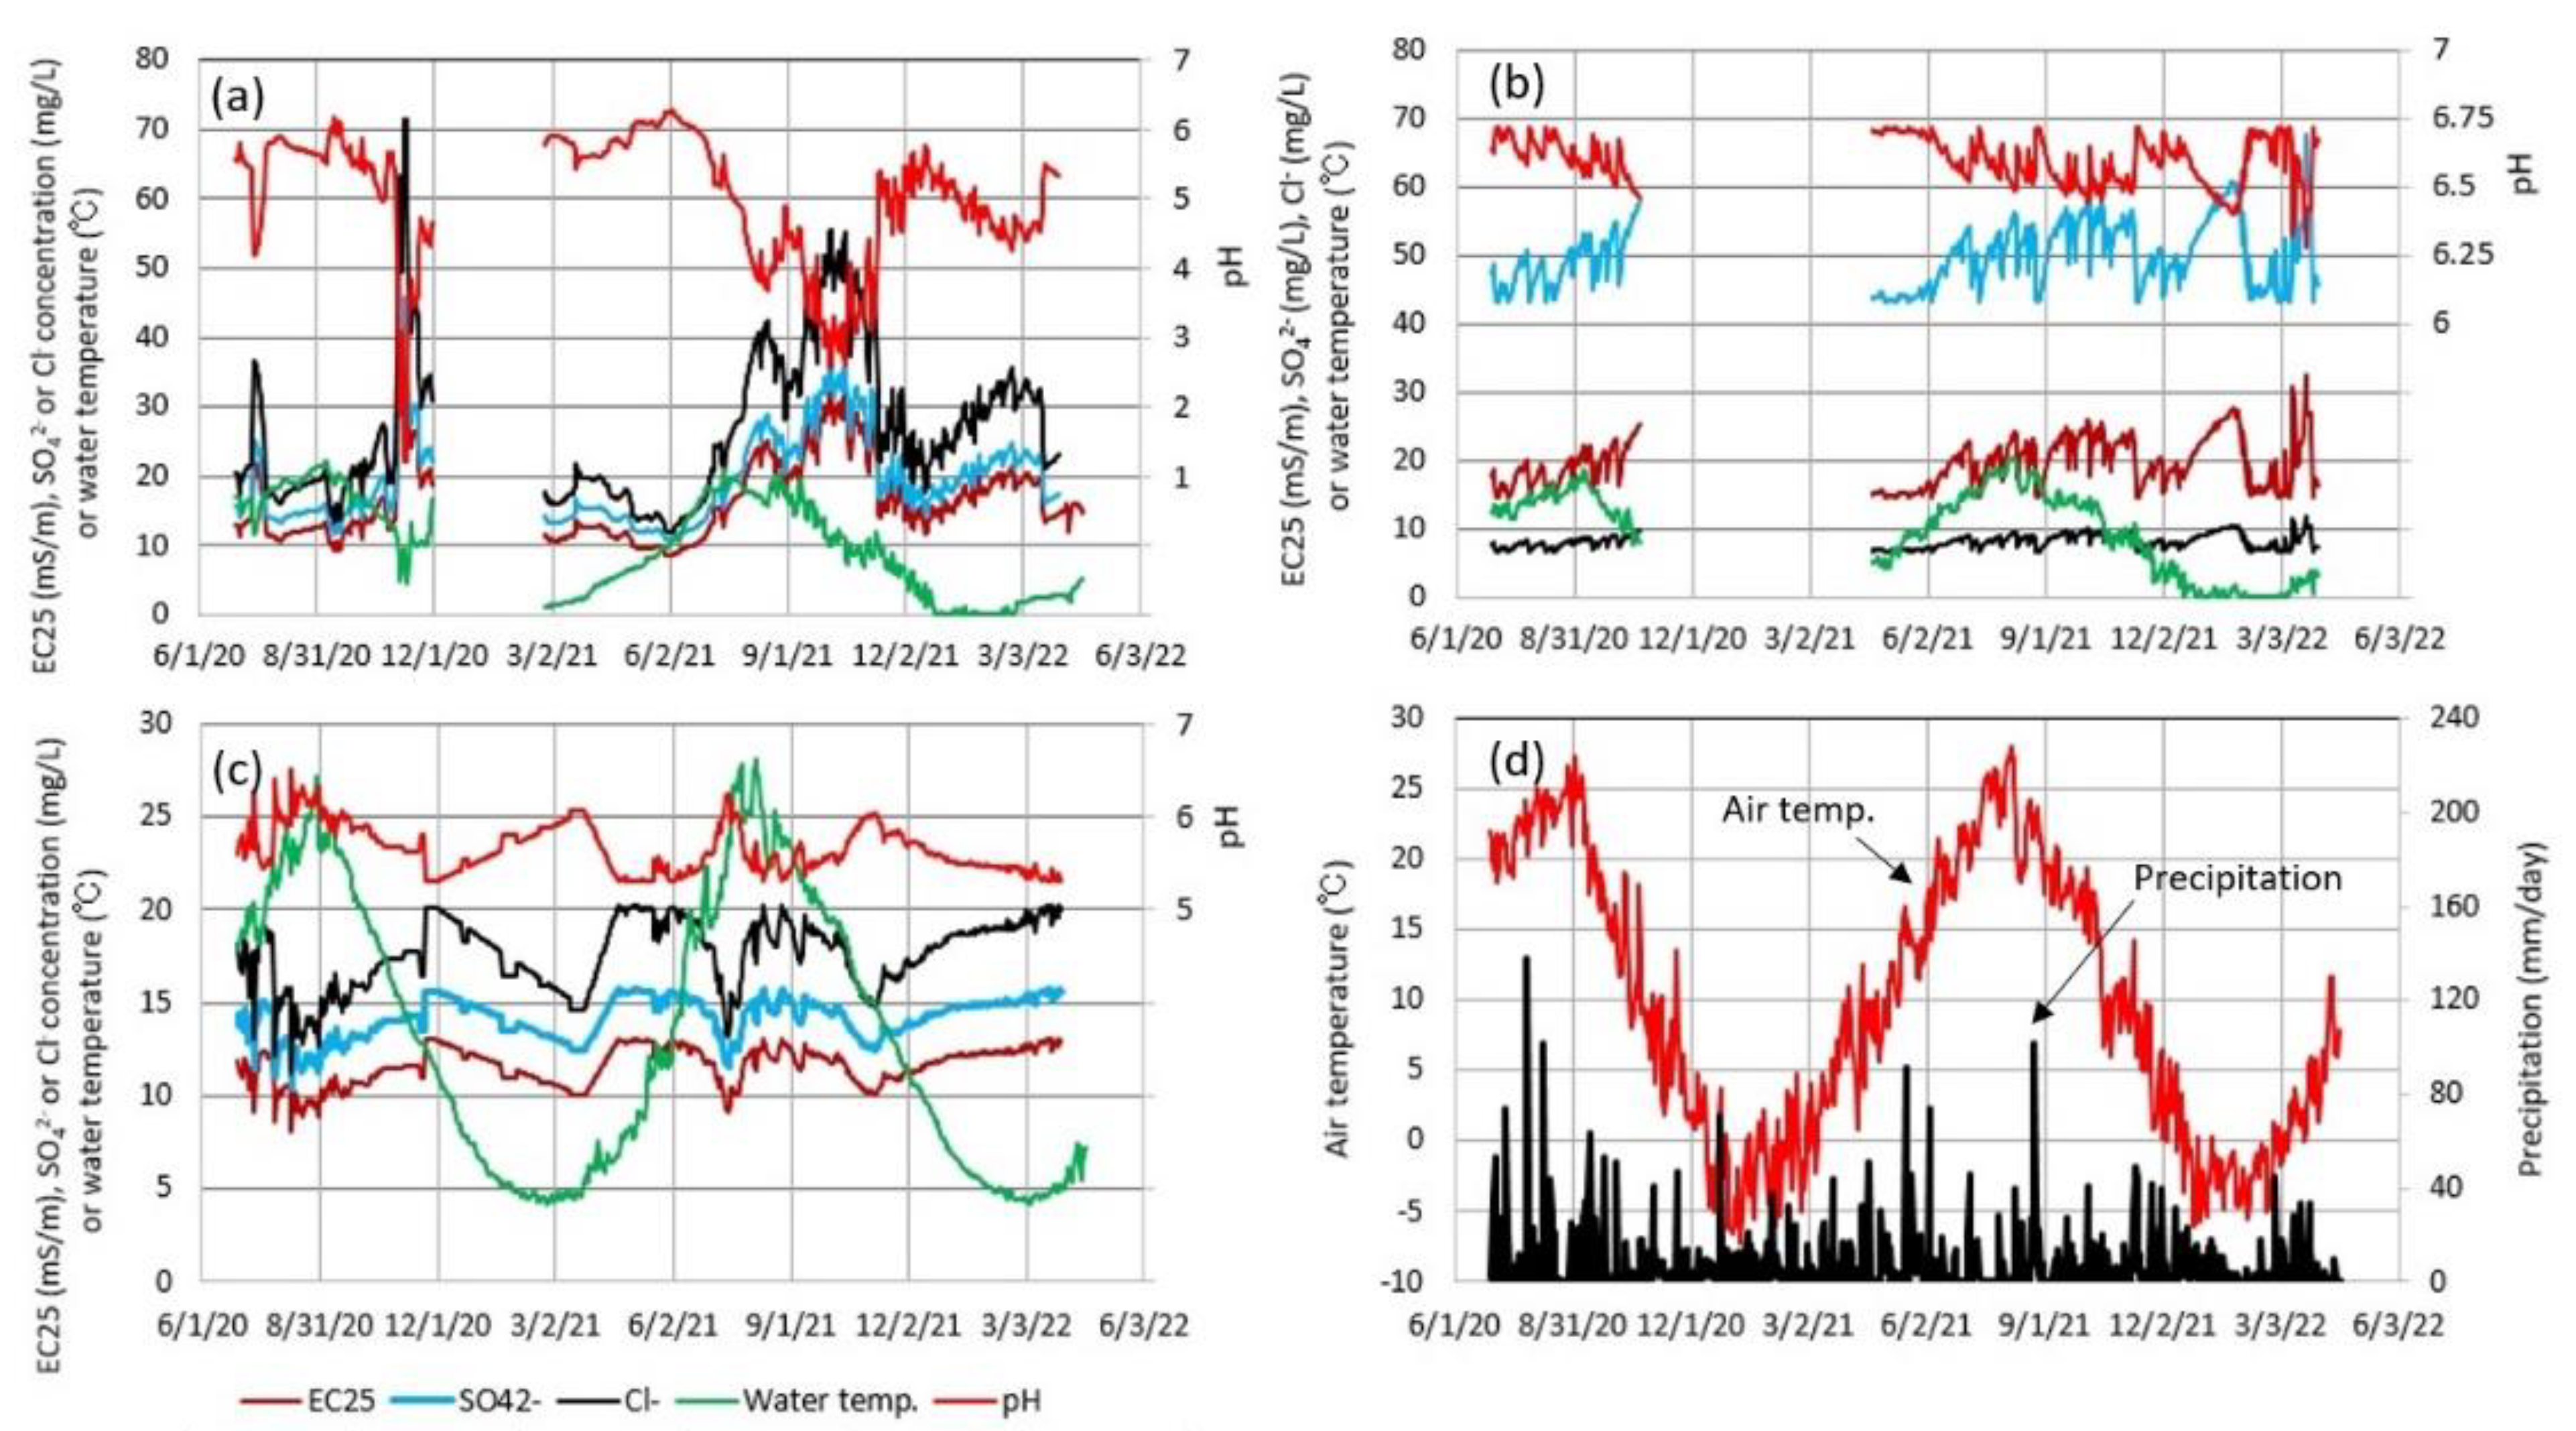
Time series of daily mean EC25, Cl− concentration, SO42− concentration, water temperature and pH were acquired for Tama River, Sendachi River and Lake Tazawa (0.2 m depth), as well as daily precipitation and daily mean air temperature for a period of 29 June 2020–31 March 2022 (Figure 10). The ionic concentrations and pH values were acquired by the regression lines in Figure 3 and Figure 4. Data failure occurred for 30 November 2020–23 February 2021 for the Tama River and for 22 October 2020–19 April 2021 for the Sendachi River, because the river stages were too low, causing the sensors to leave the water’s surface. The EC25 greatly changed at a range of 8.5–41.1 mS/m in the Tama River. The Yoroibata dam exists 4.37 km upstream of the water sampling point in the Tama River, and located more upstream, the neutralization facility for highly acidic spring water (pH = 1.1–1.3) is located at 20.2 km north–northeast of the dam. The water quality of the Tama River could thus be influenced by both the change in the processing capacity of the neutralization facility and its discharge, as well as the water quality at the dam. Meanwhile, the EC values of the Sendachi River and Lake Tazawa recorded small ranges of 14.6–32.6 mS/m and 8.1–13.0 mS/m, respectively.
The pH of Tama River varied greatly from 1.20 on 8 and 9 November 2020 to 6.27 on 6 June 2021, corresponding to the large EC change. The abrupt decrease of pH on 8 and 9 November 2020 is probably due to the discharge from the upstream Yoroibata dam, connected to the low processing capacity of the neutralization facility. Fortunately, the inflow at the conduit A was then zero (period five in Table 1). Thus, the high acidity in the Tama River did not affect the water quality of the lake. The pH of Sendachi River and Lake Tazawa exhibited small amplitudes of 6.28 (22 March 2022)–6.72 (2 May 2021) and 5.30 (10 April 2022)–6.53 (9 August 2020), respectively, thus indicating the persistence of nearly neutral and weakly acidic conditions, respectively.
The chemistry of the river and lake waters differs greatly from one another, since Tama River, Sendachi River and Lake Tazawa waters are rather rich in Cl−, rich in SO42−, and almost equal between the two ions, respectively (Figure 2 and Figure 3). The ionic concentrations in Lake Tazawa and chemical contributions of the two rivers can then be determined by the chemical mass balance in the lake or the chemical budget equation (Equation (6)).
The water temperatures of Sendachi River and Lake Tazawa likely vary as a strong response to the air temperature, especially in July and August 2021, where three temperature peaks were seen (Figure 10d). Meanwhile, the variation of the Tama River temperature does not follow that of the air temperature at all the times of the two months, because the three temperature peaks do not appear in July and August. This suggests that the Tama River is also thermally affected by the discharge at the Yoroibata dam. The water temperature of Tama River and Sendachi River became almost 0 °C for a period of 24 December 2021–24 February 2022 and 26 December 2021–6 March 2022, respectively, following the air temperature at less than 0 °C for 18 December 2021–6 March 2022. However, the rivers were then not completely ice-covered.
Hence, the volcanic fluids are unlikely to thermally affect the river water at the monitoring points, since the cooling at the river surface prevailed under the conditions of base flow in the snowfall season as seen in usual subarctic rivers [18]. The lake surface temperature was less than 4.5 °C for 17 February–3 March 2021 (4.41 °C, averaged for the 15 days) and for 22 February–8 March 2022 (4.41 °C, averaged for the 15 days), in contrast to the air temperature of less than 0 °C for 13 December–28 February 2020 (−2.05 °C averaged for 78 days) and 18 December–25 February 2022 (−2.67 °C averaged for 70 days), respectively. This suggests that the lake was not completely but nearly holomictic for the bottom water at 4.20–4.21 °C (Figure 5a and Figure 8) [16].
4.6. Time Series of Chemical Fluxes
Using the time series of daily mean inflow at the conduits A and B and daily mean outflow at the conduit C (Figure 9), as well as their Cl− and SO42− concentrations (Figure 10), time series of daily mean Cl− and SO42− fluxes at all the conduits were obtained for a period of 29 June 2020–31 March 2022 (Figure 11). Then, time series of daily precipitation and its Cl− and SO42− fluxes were also acquired, assuming the Cl- and SO42- concentrations to be constant at 0.25 mg/L and 0.77 mg/L as the average for the rainwater collected at site M, respectively. The Cl− and SO42− fluxes at the conduit C were then calculated by applying the concentrations at 0.2 m depth (Figure 10c) to the outflow.
The inflow at the conduits A and B was 18.4 m3/s and 3.1 m3/s, averaged over 20 April 2021–31 March 2022, respectively (data failure of ES25 at the conduit B for 22 October–19 April 2021), and thus the inflow at the conduit A was 5.9 times larger than at the conduit B. Similarly, the Cl− flux and SO42− flux at the conduit A were 453.3 g/s and 336.7 g/s, respectively, which were 18.7 times and 2.2 times larger than 24.3 g/s and 150.8 g/s at the conduit B, respectively. The outflow, Cl− flux and SO42− flux at the conduit C were 27.7 m3/s, 519.2 g/s and 410.7 g/s, respectively, for the same period. Hence, negative water storage at 6.2 m3/s, negative Cl− storage at 41.6 g/s and positive SO42− storage at 76.8 g/s were brought to the lake. Then, the pH of lake water could decrease by 1.53 over the period by applying the regression lines between pH and Cl− or SO42− concentration in Figure 4c,d, since the pH of lake water increased by 0.92 for the net Cl- output at 6.71 mg/L, and decreased by 2.45 by the net SO42− input at 12.4 mg/L. The precipitation could affect the lake water chemistry in case of heavy rainfalls of more than 100 mm/day during the SO42− flux of 100 g/s or less at the conduit C, since the SO42− flux during rainfalls was then more than 20 g/s. Meanwhile, the Cl− flux by rainfall was 7.4 g/s at maximum, and thus is likely to be negligibly small at any time.
In the above chemical budget calculation, groundwater inflow Gin and groundwater outflow Gout and their chemical fluxes are not considered. The chemical contribution to water chemistry of Lake Tazawa will be quantified more accurately after estimating Gin and Gout.
4.7. Evaluating Groundwater Inflow and Outflow
In the four periods of 2018–2021, the operation at the power plants gave zero inflow and zero outflow (Table 1). If the chemical budget equation is applied to these periods as budget periods, the groundwater inflow and outflow in Lake Tazawa could be evaluated with relatively high accuracy, by the combination with the G values in Table 2. Here, the G values in periods five to seven were applied to Equation (7) from the simultaneous equations coupled with Equation (5), and both Cl− and SO42− concentrations were utilized as CL, CGin, CGout and CP in Equation (6).
Consequently, G, Gin and Gout values were obtained for each of the three periods, together with the mean CL and CpPA0 values (Table 3). The groundwater inflow Gin ranged over 5.60–6.46 m3/s for the SO42− concentration and 4.27–4.91 m3/s for the Cl− concentration, while the groundwater outflow Gout was 6.62–8.19 m3/s for the SO42− concentration and 5.33–6.64 m3/s for the Cl− concentration. The values calculated by the SO42− concentration are probably more reasonable than those by the Cl- concentration because of the consistent relation between the EC25 and the SO42- concentration (Figure 3c). The ionic concentration CL of lake water was evaluated by the regression line in Figure 7 and then by that in Figure 3b,c. For the Cl- concentration in Figure 3b, the plots of the deep lake water deviated greatly from the regression line. This deviation should be connected to the overestimation of the Cl- concentration CL by the use of the regression line in Figure 3b.
From Table 3, the groundwater inflow and outflow are comparable in magnitude to the inflow at the conduit B (Figure 9). Before the intake through conduits A and B in 1940, the outflow at site D was unique at 1.2 m3/s as a natural river outflow. Thus, supposing no large temporal change of the lake volume, it is noted that the groundwater inflow and outflow contributed greatly to the water residence time and water quality in the previous lake. However, the calculated groundwater inflow should include the small river inflow (totally, less than 1 m3/s) observed near site M and the conduit C (Figure 1), since such inflow was not considered in the calculation. Thus, the groundwater inflow could be overestimated at about 1 m3/s.
5. Discussion
5.1. Contribution of Chemical Fluxes to Water Chemistry of Lake Tazawa
Using the SO42− and Cl− fluxes at the conduits A, B and C (Figure 11) and those of the evaluated groundwater inflow and outflow (Table 3), their contribution to the lake water chemistry was accurately quantified. Here, by weighting the day length in Table 3, the groundwater inflow and outflow from the SO42− concentration were given at constants of 6.01 m3/s and 7.37 m3/s, respectively (thus, G = −1.36 m3/s). Taking the period of 20 April 2021–31 March 2022 (346 days) as 4.5., the mean SO42− fluxes at 256.1 g/s by the groundwater inflow and at 115.9 g/s by the groundwater outflow were incorporated into the mean SO42− fluxes at the conduits A, B and C (336.7 g/s, 150.8 g/s and 410.7 g/s, respectively) and by precipitation (1.5 g/s). The total inflowing and outflowing SO42− fluxes are thus given at 745.1 g/s and 526.6 g/s, respectively, and thereby the positive SO42− storage of 218.5 g/s or 2.56 × 10⁻³ mg/L/day could occur in the lake. This positive storage could produce a decrease in pH by 0.18 over the period, using the regression line in Figure 4d.
Similarly, the mean Cl- flux was 453.3 g/s at the conduit A, 24.3 g/s at the conduit B, 519.2 g/s at the conduit C, 396.7 g/s for the groundwater inflow, 149.2 g/s for the groundwater outflow and 0.5 g/s for the precipitation. Hence, the total inflowing and outflowing Cl− fluxes are 874.8 g/s and 668.5 g/s, respectively, and thus the Cl- increase at 206.3 g/s or 2.43 × 10⁻³ mg/L/day could appear in the lake. The Cl− increase corresponds to a decrease of pH by 0.12 over the period, by applying the regression line in Figure 4c. Thus, it is seen that the present chemical situation of Lake Tazawa is serious to the revival of land-locked sockeye salmon.
Focusing on the SO42− and Cl− fluxes by the surface inflow and outflow, when the SO42− and Cl− fluxes at the conduit A decreased by 41.9 g/s and 41.7 g/s, respectively, the net SO42− and Cl- fluxes by surface inflow and outflow becomes zero. These correspond to a decrease of 2.3 mg/L or an increase of 0.2 in pH for each of the SO42− and Cl− concentrations in the Tama River (Figure 4a,b). Hence, the processing capacity of neutralization in the region upstream of the sampling point in the Tama River should be strengthened to increase pH in Lake Tazawa.
5.2. Comparison with the Other Volcanic Lakes
There are some previous studies that evaluated groundwater inflow and outflow in volcanic craters or caldera lakes under relatively low volcanic activity [17,19,20,21,22,23]. The lakes were formed by the eruptions of isolated volcanos. Here, we explored how the groundwater flow system in volcanic lakes is related to the magnitude of volcanic eruptions to have formed the lakes.
In some Japanese caldera or crater lakes, the groundwater inflow and outflow have been evaluated by estimating the hydrological budget and/or chemical budget of the lakes (Table 4). The lakes, which were formed by the eruptions of isolated volcanos, are separated into open and closed types (with and without an outflow river, respectively). In Lake Tachibana, the groundwater inflow Gin was estimated as a base flow on non-rainfall days [19]. For Lake Ikeda, the Gin and Gout values roughly estimated by Momii [23] were adopted.
Irrespective of the open or closed type, the Gin and Gout are of the similar order of magnitude, though Gin is consistently smaller than Gout. This means that, in case of such caldera or crater lakes, the water storage in the lake itself and the lake catchment is spatially limited. Here, the “lake catchment” refers to the land area between the caldera or crater rim (i.e., “water divide” in Figure 1 for Lake Tazawa) and the lake shore.
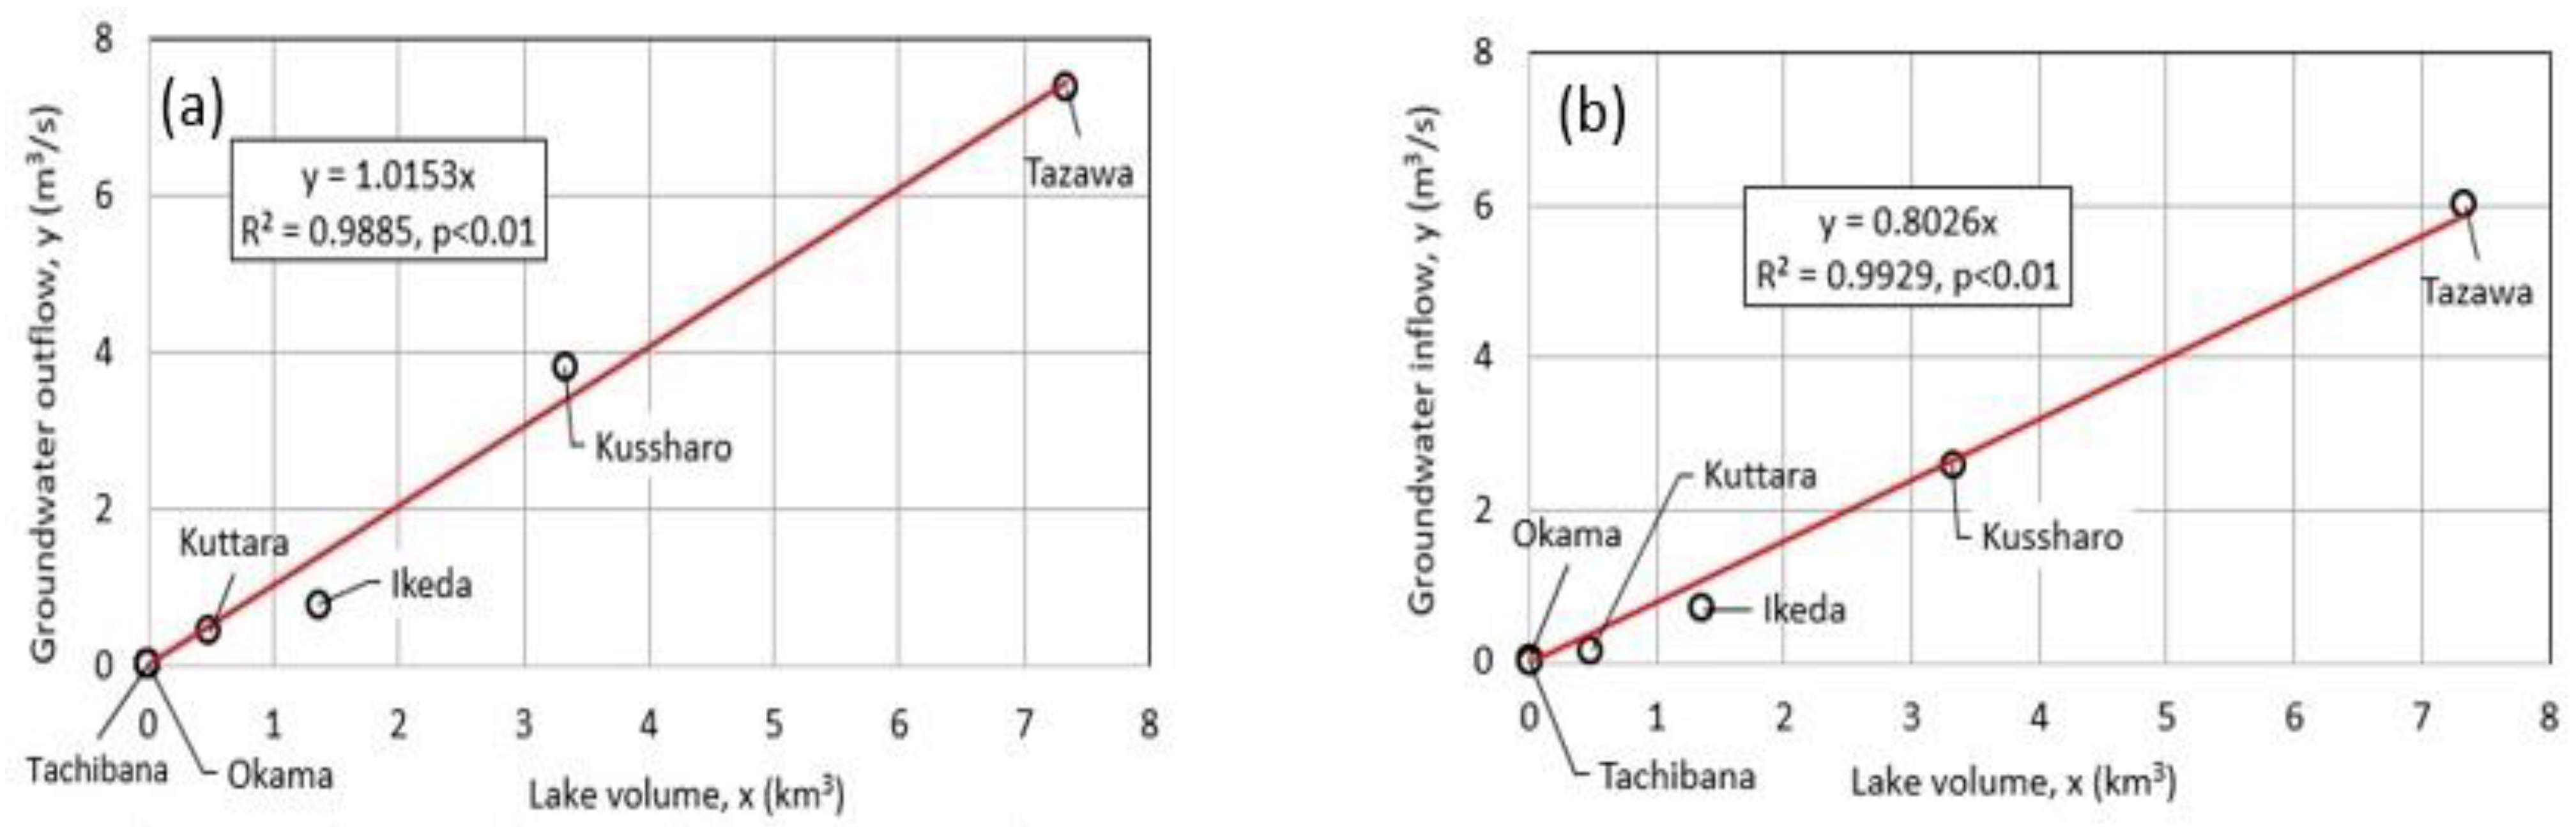
Here, relations between the lake volume and the groundwater outflow or the groundwater inflow were explored for the lakes in Table 4 (Figure 12). These indicate clearly linear relationships with the high correlations of R2 = 0.989 and 0.993. Hence, it is suggested that the magnitude of volcanic eruptions to have formed the lakes roughly determined the lake-basin scale and the subsequent groundwater cycle scale in the lake. For Lake Ikeda, Nakao [22] pointed out that when compared with Lake Kuttara, the ability of groundwater outflow to adjust the lake level is relatively low. In Figure 12a, in fact, the groundwater outflow in Lake Ikeda is located below the regression line. The groundwater inflow is likely controlled by the magnitude of precipitation onto the lake catchment. However, the linearity in Figure 12b indicates that, irrespective of the magnitude of precipitation, the groundwater storage in the catchment to produce groundwater inflow could be spatially adjusted. The details about the pathways of groundwater inflow and outflow inside the volcanos are still unknown. Knowing the water pathways is very important to understand the linkage to the deeper hydrothermal system and to predict the eruption type of a volcano.
6. Conclusions
In 1940, for irrigation and power generation, part of Tama River and Sendachi River waters, containing strongly acidic and nearly neutral volcanic fluids, respectively, were drawn into a volcanic deep lake, Lake Tazawa, by artificial conduits. Thereby, the Kunimasu trout, a land-locked type of sockeye salmon, became extinct, because the lake water greatly decreased pH from 6.7 to 4.2. The neutralization facility for the Tama River, which started to work in April 1991, increased the pH of lake water up to 5.2, but, so far, has not improved the water quality to the pH level at more than 6.5, allowing the Kunimasu trout to inhabit it. In this study, the contribution of the chemical- fluxes from the conduits and by groundwater inflow and outflow to the water chemistry of Lake Tazawa were quantified by estimating hydrological and chemical budgets of the lake. First, the hydrological budget estimate evaluated the net groundwater inflow G (=Gin − Gout), and then the groundwater inflow Gin and outflow Gout were separately obtained by solving the simultaneous equations coupled with the chemical budget equation.
In order to estimate the hydrological budget of the lake, the 2017–2020 data of hydrometeorology, lake level, lake surface temperature, and river inflow and outflow in the lake were provided. Of all the data, the data of eight periods including zero inflow from the conduit A (and also zero from the conduit B) and zero outflow were chosen to avoid large errors in G from the large variation of lake level or lake volume change (∆V/∆t). The outflow at the conduit D was then given at zero, since the eight budget periods were out of the irrigation season. All the calculated G values were negative, indicating that Gout is larger than Gin. However, the absolute G values calculated for the periods with inflow at the conduit B were consistently larger than those for the periods with neither inflow nor outflow. This is a result probably reflecting the absolute G smaller than the inflow at the conduit B. The G values for the four periods with neither inflow nor outflow were then given at −1.73–−1.02 m3/s.
The EC25 and chemical data of June 2020–March 2022 were provided for the chemical budget estimate. Three periods with zero inflowing chemical flux and zero outflowing chemical flux in the lake were chosen, corresponding to the periods of the hydrological budget. The simultaneous equations from the hydrological budget equation and chemical budget equation gave Gout and Gin at 6.62–8.19 m3/s and 5.60–6.46 m3/s, respectively, using the SO42- concentration. Then, the groundwater inflow could be overestimated, because the small stream inflow was neglected. Taking Gout = 7.37 m3/s and Gin = 6.01 m3/s as the average for the three periods, the calculation of chemical fluxes at the three conduits and by Gin and Gout averaged for 20 April 2021–31 March 2022 indicated the SO42− increase of 218.5 g/s or 2.56 × 10⁻³ mg/L/day and the Cl− increase at 206.3 g/s or 2.43 × 10⁻³ mg/L/day in the lake. The positive storage of SO42− and Cl− could produce a decrease in pH by 0.18 and 0.12 over the period of 20 April 2021–31 March 2022, respectively. Hence, it is needed to increase the processing power of neutralization for the Tama River water to make the land-locked type of sockeye salmon, Kunimasu, inhabit it.
For crater or caldera lakes in isolated volcanos, relations between the lake volume and Gin or Gout exhibited clearly linear relationships. This indicates that the groundwater flow scale in such a lake increases with the magnitude of the volcanic eruptions to have formed the lakes.
Author Contributions
Conceptualization, K.A.C.; methodology, K.A.C., K.A., H.O. and J.O.; validation, K.A.C., K.A. and H.O.; formal analysis, K.A.C. and K.A.; investigation, K.A.C., K.A. and H.O. and J.O.; resources, K.A.C., K.A.,H.O. and J.O.; data curation, K.A.C. and K.A.; writing—original draft preparation, K.A.C.; writing—review and editing, K.A., H.O. and J.O.; visualization, K.A.C. and H.O.; supervision, K.A. and H.O.; project administration, K.A.C.; funding acquisition, K.A.C., K.A. and H.O. All authors have read and agreed to the published version of the manuscript.
Funding
This research was partially funded by Earthquake Research Institute, the University of Tokyo, grant number ERI JURP 2019-Y-VOLCANO8 and Nanzan University Pache Research Subsidy I-A-2 for the 2020 academic year.
Informed Consent Statement
Not applicable.
Data Availability Statement
Discharge data at the three conduits in Lake Tazawa were supplied by Tohoku Electric Power Co., Ltd., Japan, according to requests of the authors. The data are not open to the public on the web site.
Acknowledgments
The authors express deep gratitude to A. Ohtake, T. Chiba and the other staff of the Lake Tazawa Kunimasu Trout Museum on the shore of Lake Tazawa for their great help in the field observations. N. Odano, an official of the Sendachi-city Hall, kindly helped us to set the instruments in Lake Tazawa. The authors are also indebted to Tohoku Electric Power Co., Ltd., Japan for the welcome data supply of the discharge in Lake Tazawa.
Conflicts of Interest
The authors declare no conflict of interest. The funders had no role in the design of the study; in the collection, analyses, or interpretation of data; in the writing of the manuscript, or in the decision to publish the results.
References
- Manville, V.; Hodgson, K.A.; Nairn, I.A. A review of break-out floods from volcanogenic lakes in New Zealand. N. Z. J. Geol. Geophys. 2007, 50, 131. [Google Scholar] [CrossRef]
- Mazza, R.; Taviani, S.; Capelli, G.; De Benedetti, A.A.; Giordano, G. Quantitative hydrogeology of volcanic lakes: Examples from the central Italy Volcanic Lake District. In Volcanic Lakes; Rouwet, D., Christenson, B., Tassi, F., Vandemeulebrouck, J., Eds.; Springer: Berlin/Heidelberg, Germany, 2015; pp. 355–377. [Google Scholar] [CrossRef]
- Terada, A.; Hashimoto, T.; Kagiyama, T. A water flow model of the active crater lake at Aso volcano, Japan: Fluctuations of magmatic gas and groundwater fluxes from the underlying hydrothermal system. Bull. Volcanol. 2012, 74, 641–655. [Google Scholar] [CrossRef]
- Ross, K.A.; Gashugi, E.; Gafasi, A.; Wüest, A.; Schmid, M. Characterisation of the subaquatic groundwater discharge that maintains the permanent stratification within Lake Kivu; East Africa. PLoS ONE 2015, 10, e0121217. [Google Scholar] [CrossRef] [PubMed]
- Urrutia, J.; Herrera, C.; Custodio, E.; Jódar, J.; Medina, A. Groundwater recharge and hydrodynamics of complex volcanic aquifers with a shallow saline lake: Laguna Tuyajto, Andean Cordillera of northern Chile. Sci. Total Environ. 2019, 696, 134116. [Google Scholar] [CrossRef] [PubMed]
- Itadera, K.; Yoshida, A. Water budget of Lake Ashinoko, the origin of Hakone thermal waters. J. Hydrol. Reg. Stud. 2020, 28, 100682. [Google Scholar] [CrossRef]
- Harbaugh, A.W. MODFLOW-2005, the US Geological Survey Modular Groundwater Model: The Groundwater Flow Process (6-A16); U.S. Geological Survey: Reston, VA, USA, 2005. [Google Scholar]
- Hirayama, Y.; Okawa, A.; Nakamachi, K.; Aoyama, T.; Okada, Y.; Oi, T.; Hirose, K.; Kikawada, Y. Estimation of water seepage rate in the active crater lake system of Kusatsu-Shirane volcano, Japan, using FDNPP-derived radioactive cesium as a hydrological tracer. J. Environ. Radioact. 2020, 218, 106257. [Google Scholar] [CrossRef] [PubMed]
- Kano, K.; Ohguchi, T.; Hayashi, S.; Yanai, K.; Ishizuka, O.; Miyagi, I.; Ishiyama, D. Tazawako caldera, NE Japan and its eruption products. J. Geol. Soc. Jpn. 2020, 126, 233–249. [Google Scholar] [CrossRef]
- Semboku City (Ed.) Kunimasu; Akita Sakigake Simpo Co., Ltd.: Akita, Japan, 2017; 32p. [Google Scholar]
- Sato, H.; Ishiyama, D.; Mizuta, T.; Matsubaya, O.; Murakami, F. Geochemical characteristics of thermal waters and precipitates in Tamagawa Hot Spring area, Akita, Japan. Resour. Geol. 2010, 60, 15–24. [Google Scholar] [CrossRef]
- Nakamura, H.; Ando, T.; Suzuki, T. Geology and hot springs of Kuroyu geothermal area, Akita Prefecture. Mon. Rep. Geol. Surv. Jpn. 1960, 11, 85–88. [Google Scholar]
- Kondo, J. Meteorology in Aquatic Environments; Asakura Publishing Ltd.: Tokyo, Japan, 1994; 350p. [Google Scholar]
- Takahashi, R.; Muranaka, K.; Nakaya, K.; Takahashi, S. Estimation of dissolved ion content in rain based on electric conductivity and pH measurements. Environ. Techol. 1996, 25, 698–707. [Google Scholar] [CrossRef]
- Katsuki, K.; Seto, K.; Suganuma, Y.; Yang, D.Y. Characteristics of portable core samplers for lake deposit investigations. J. Geogr. 2019, 128, 359–376. [Google Scholar] [CrossRef]
- Boehrer, B.; Fukuyama, R.; Chikita, K.A. Stratification of very deep, thermally stratified lakes. Geophys. Res. Lett. 2008, 35, L16405. [Google Scholar] [CrossRef] [Green Version]
- Chikita, K.A.; Goto, A.; Okada, J.; Yamaguchi, T.; Miura, S.; Yamamoto, M. Hydrological and chemical budgets of Okama Crater Lake in active Zao Volcano, Japan. Hydrology 2022, 9, 28. [Google Scholar] [CrossRef]
- Urano, H.; Miyamoto, H.; Maeda, H.; Toda, Y. On the influence of base flow temperature on stream temperature formation. J. Jpn. Soc. Civ. Eng. Ser. B1 2013, 69, I_1681–I_1686. [Google Scholar] [CrossRef] [Green Version]
- Chikita, K.A.; Momoki, Y.; Degawa, Y. Water balance of a crater lake and its leakage—Lake Tachibana, Hokkaido. Geophys. Bull. Hokkaido Univ. 1988, 51, 1–11. [Google Scholar] [CrossRef]
- Nakao, K.; Otsuki, S.; Tanoue, R.; Naruse, R. Watershed leakage from a closed lake—Lake Kuttara. Geophys. Bull. Hokkaido Univ. 1967, 17, 47–64. Available online: http://hdl.handle.net/2115/13924 (accessed on 31 July 2022).
- Chikita, K.A.; Nishi, M.; Fukuyama, R.; Hamahara, K. Hydrological and chemical budgets in a volcanic caldera lake: Lake Kussharo, Hokkaido, Japan. J. Hydrol. 2004, 291, 91–114. [Google Scholar] [CrossRef]
- Nakao, K. Secular variation of the lake level evaluated by water budget in Lake Ikeda. Geophys. Bull. Hokkaido Univ. 1987, 49, 131–137. [Google Scholar] [CrossRef]
- Momii, K.; Nakagawa, K.; Cho, K. Consideration about a hydrological budget of Lake Ikeda as a water resource. In Proceedings of the Hydrology & Water Resources Meeting 2003, Philadelphia, PA, USA, 23–26 June 2003; Volume 18, pp. 42–43. [Google Scholar] [CrossRef]
Figure 1.
Location of Lake Tazawa in Akita Prefecture, Japan, observation sites and four conduits A, B, C and D (thick dotted lines) on the bathymetric (thin dotted lines) and surrounding topographic (thin solid lines) maps with 100 m contours. MD: Deepest point, M: Meteorological station, L: Monitoring point of lake level, water temperature and electric conductivity (EC), MD and P: Observation points of the ASTD102 profiler.

Figure 2.
Stiff diagrams of sampled water in (a) Tama River and (b) Sendachi River, and at the (c) surface and (d) 400 m of site MD in Lake Tazawa.
Figure 2.
Stiff diagrams of sampled water in (a) Tama River and (b) Sendachi River, and at the (c) surface and (d) 400 m of site MD in Lake Tazawa.

Figure 3.
Relations between EC25 and (a) SO42−+Cl− concentration, (b) Cl− concentration and (c) SO42− concentration. The plots of lake water are separated into those of surface water and deep water at more than 50 m of depth.
Figure 3.
Relations between EC25 and (a) SO42−+Cl− concentration, (b) Cl− concentration and (c) SO42− concentration. The plots of lake water are separated into those of surface water and deep water at more than 50 m of depth.

Figure 4.
Relations between Cl− or SO42− concentration and pH for (a) and (b) (all the samples) and for (c) and (d) (lake water).
Figure 4.
Relations between Cl− or SO42− concentration and pH for (a) and (b) (all the samples) and for (c) and (d) (lake water).

Figure 5.
Vertical profiles of (a) water temperature, (b) EC25 and (c) DO on the four days in 2020. In (a), the temperature at 200 m or more in depth is enlarged. The DO profiles are shown in both saturation (%) and amount (mg/L).
Figure 5.
Vertical profiles of (a) water temperature, (b) EC25 and (c) DO on the four days in 2020. In (a), the temperature at 200 m or more in depth is enlarged. The DO profiles are shown in both saturation (%) and amount (mg/L).

Figure 6.
Vertical profiles of water temperature, EC25 and DO at sites MD and P on 10 September 2020 (Figure 1).
Figure 6.
Vertical profiles of water temperature, EC25 and DO at sites MD and P on 10 September 2020 (Figure 1).

Figure 7.
Relation between EC25 at 0.2 m depth and the volume-averaged EC25 calculated using the vertical EC25 profiles in 2020–2021 and the bathymetric map (Figure 1).
Figure 7.
Relation between EC25 at 0.2 m depth and the volume-averaged EC25 calculated using the vertical EC25 profiles in 2020–2021 and the bathymetric map (Figure 1).

Figure 8.
Temporal variations of daily mean wind speed and daily precipitation (upper) and daily mean relative humidity, air temperature, and water temperature at 0.2 m depth and lake level (lower) for 1 December 2017–31 March 2022.
Figure 8.
Temporal variations of daily mean wind speed and daily precipitation (upper) and daily mean relative humidity, air temperature, and water temperature at 0.2 m depth and lake level (lower) for 1 December 2017–31 March 2022.

Figure 9.
Temporal variations of daily mean inflow at the conduits A and B and daily mean outflow at the conduit C (Figure 1) for 1 December 2017–31 March 2022.
Figure 9.
Temporal variations of daily mean inflow at the conduits A and B and daily mean outflow at the conduit C (Figure 1) for 1 December 2017–31 March 2022.

Figure 10.
Temporal variations of daily mean EC25, Cl− concentration, SO42− concentration, water temperature and pH in (a) Tama River, (b) Sendachi River and (c) Lake Tazawa (0.2 m depth), and (d) daily precipitation and daily mean air temperature for 29 June 2020–31 March 2022.
Figure 10.
Temporal variations of daily mean EC25, Cl− concentration, SO42− concentration, water temperature and pH in (a) Tama River, (b) Sendachi River and (c) Lake Tazawa (0.2 m depth), and (d) daily precipitation and daily mean air temperature for 29 June 2020–31 March 2022.

Figure 11.
Temporal variations of daily mean Cl− flux and SO42− flux at (a) the conduit A, (b) the conduit B and (c) the conduit C, and (d) the two fluxes by precipitation for 29 June 2020–31 March 2022. Inflow at the conduits A and B, outflow at the conduit C and daily precipitation are also shown.

Figure 12.
Relations between lake volume and (a) groundwater outflow or (b) groundwater inflow evaluated for the caldera or crater lakes in Table 4.
Figure 12.
Relations between lake volume and (a) groundwater outflow or (b) groundwater inflow evaluated for the caldera or crater lakes in Table 4.


Table 1.
Periods, day length, lake level, and inflow and outflow for calculating the net groundwater inflow G.
Table 1.
Periods, day length, lake level, and inflow and outflow for calculating the net groundwater inflow G.
| Lake Level | Conduit A m3/s | Conduit B m3/s | Conduit C m3/s | ||||
|---|---|---|---|---|---|---|---|
| No. | Period | Days | m asl | ||||
| Mean | Std. Dev. | ||||||
| 1 | 4 October–29 November 2018 | 57 | 246.356 | 0.061 | 0.00 | 0.00 | 0.00 |
| 2 | 22–27 October 2019 | 6 | 245.925 | - | 0.00 | 2.38 | 0.00 |
| 3 | 1–3 November 2019 | 3 | 245.997 | - | 0.00 | 2.48 | 0.00 |
| 4 | 8–10 November 2019 | 3 | 247.210 | - | 0.00 | 2.12 | 0.00 |
| 5 | 5–17 November 2020 | 13 | 247.047 | 0.010 | 0.00 | 0.00 | 0.00 |
| 6 | 21–29 November 2020 | 9 | 247.124 | 0.009 | 0.00 | 0.00 | 0.00 |
| 7 | 25 March–8 April 2021 | 15 | 246.344 | 0.034 | 0.00 | 0.00 | 0.00 |
| 8 | 26–28 October 2021 | 3 | 245.898 | - | 0.00 | 2.15 | 0.00 |
Table 2.
Periods, day length, rainfall and calculated results of evaporation E and net groundwater inflow G.
Table 2.
Periods, day length, rainfall and calculated results of evaporation E and net groundwater inflow G.
| Evaporation | Rainfall | G | ||||||
|---|---|---|---|---|---|---|---|---|
| No | Period | Days | m3/s | Total | Mean m3/s | |||
| Mean | Std. Dev. | mm | m3/s | Mean | Std. Dev. | |||
| 1 | 4 October–29 November 2018 | 57 | 0.162 | 0.075 | 251.0 | 1.30 | −1.14 | 2.31 |
| 2 | 22–27 October 2019 | 6 | 0.641 | - | 16.4 | 0.80 | −3.05 | 1.38 |
| 3 | 1–3 November 2019 | 3 | 0.770 | - | 9.4 | 0.92 | −3.29 | - |
| 4 | 8–10 November 2019 | 3 | 0.741 | - | 2.4 | 0.24 | −3.51 | - |
| 5 | 5–17 November 2020 | 13 | 0.098 | 0.073 | 48.5 | 1.11 | −1.02 | 1.13 |
| 6 | 21–29 November 2020 | 9 | 0.120 | 0.079 | 40.8 | 1.35 | −1.23 | 1.83 |
| 7 | 25 March–8 April 2021 | 15 | 0.023 | 0.064 | 88.6 | 1.74 | −1.73 | 2.77 |
| 8 | 26–28 October 2021 | 3 | 0.070 | - | 17.4 | 1.70 | −3.81 | - |
Table 3.
Periods, day length and G of the three periods in Table 2, and given CL and CpPA0, and calculated Gin and Gout for the SO42− and Cl− concentrations.
Table 3.
Periods, day length and G of the three periods in Table 2, and given CL and CpPA0, and calculated Gin and Gout for the SO42− and Cl− concentrations.
| No. | Period | Days | CL (mg/L) | CPPA0 (g/s) | G (m3/s) | Gin (m3/s) | Gout (m3/s) | ||||
|---|---|---|---|---|---|---|---|---|---|---|---|
| SO42− | Cl− | SO42− | Cl− | SO42− | Cl− | SO42− | Cl− | ||||
| 5 | 5–17 November 2020 | 13 | 15.75 | 20.31 | 0.73 | 0.24 | −1.02 | 5.60 | 4.31 | 6.62 | 5.33 |
| 6 | 21–29 November2020 | 9 | 15.78 | 20.37 | 0.93 | 0.30 | −1.23 | 5.85 | 4.27 | 7.08 | 5.51 |
| 7 | 25 March–8 April 2021 | 15 | 15.64 | 20.12 | 0.97 | 0.31 | −1.73 | 6.46 | 4.91 | 8.19 | 6.64 |
Table 4.
Groundwater inflow Gin and groundwater outflow Gout in Japanese caldera or crater lakes, previously evaluated from the estimates of the hydrological budget and/or chemical budget. Their location, type, lake volume and lake surface area are also shown.
Table 4.
Groundwater inflow Gin and groundwater outflow Gout in Japanese caldera or crater lakes, previously evaluated from the estimates of the hydrological budget and/or chemical budget. Their location, type, lake volume and lake surface area are also shown.
| Name | Location | Type | Lake Volume (km3) | Surface Area (km2) | Gin (m3/s) | Gout (m3/s) | References |
|---|---|---|---|---|---|---|---|
| Lake Tachibana | 42°31′07″ N, 141°08′ 27″ E | Closed | 9.27 × 10⁻⁴ | 0.120 | 0.003 | 0.010 | Chikita et al. [19] |
| Okama Lake | 38°08′18″ N, 140°26′58″ E | Closed | 1.27 × 10⁻³ | 0.0821 | 0.017 | 0.044 | Chikita et al. [17] |
| Lake Kuttara | 42°30′07″ N, 141°11′07″ E | Closed | 0.491 | 4.68 | 0.16 | 0.44 | Nakao et al. [20] |
| Lake Kussharo | 43°36′12″ N, 144°19′30″ E | Open | 3.33 | 79.48 | 2.60 | 3.82 | Chikita et al. [21] |
| Lake Ikeda | 31°14′06″ N, 130°33′47″ E | Open | 1.36 | 10.62 | 0.71 | 0.77 | Nakao [22], Momii [23] |
| Lake Tazawa | 39°43′30″ N, 140°39′41″ E | Open | 7.34 | 25.59 | 6.01 | 7.37 | This study |
Publisher’s Note: MDPI stays neutral with regard to jurisdictional claims in published maps and institutional affiliations. |
© 2022 by the authors. Licensee MDPI, Basel, Switzerland. This article is an open access article distributed under the terms and conditions of the Creative Commons Attribution (CC BY) license (https://creativecommons.org/licenses/by/4.0/).
Share and Cite
MDPI and ACS Style
Chikita, K.A.; Amita, K.; Oyagi, H.; Okada, J. Effects of a Volcanic-Fluid Cycle System on Water Chemistry of a Deep Caldera Lake: Lake Tazawa, Akita Prefecture, Japan. Water 2022, 14, 3186. https://doi.org/10.3390/w14193186
AMA Style
Chikita KA, Amita K, Oyagi H, Okada J. Effects of a Volcanic-Fluid Cycle System on Water Chemistry of a Deep Caldera Lake: Lake Tazawa, Akita Prefecture, Japan. Water. 2022; 14(19):3186. https://doi.org/10.3390/w14193186
Chicago/Turabian StyleChikita, Kazuhisa A., Kazuhiro Amita, Hideo Oyagi, and Jun Okada. 2022. "Effects of a Volcanic-Fluid Cycle System on Water Chemistry of a Deep Caldera Lake: Lake Tazawa, Akita Prefecture, Japan" Water 14, no. 19: 3186. https://doi.org/10.3390/w14193186
Note that from the first issue of 2016, this journal uses article numbers instead of page numbers. See further details here.