
Simulation of the Water Storage Capacity of Siling Co Lake on the Tibetan Plateau and Its Hydrological Response to Climate Change
1
Changjiang River Scientific Research Institute, Wuhan 430010, China
2
Department of Hydraulic Engineering, Tsinghua University, Beijing 100084, China
3
State Key Laboratory of Hydroscience and Engineering, Tsinghua University, Beijing 100084, China
*
Author to whom correspondence should be addressed.
Water 2022, 14(19), 3175; https://doi.org/10.3390/w14193175
Submission received: 16 August 2022
/
Revised: 28 September 2022
/
Accepted: 7 October 2022
/
Published: 9 October 2022
(This article belongs to the Special Issue Climate Changes and Hydrological Processes)
Abstract
:Due to their special geographical locations and environments, plateau lakes play a key role in maintaining regional water balance, but lake water storage changes are upsetting this balance. Based on data from lakes on the Tibetan Plateau (TP), this study used the Spatial Processes in Hydrology (SPHY) model to simulate the runoff process in the Siling Co basin from 2000 to 2016 and estimated the changes in water storage of Siling Co and the contribution of each component of runoff into the lake. The results showed that the water storage capacity of Siling Co has increased by 1.2 billion m3/yr, and the lake area continues to expand; declines in precipitation have significantly reduced baseflow (BF), rainfall runoff (RR), and snow runoff (SR), while temperature increases have raised glacier runoff (GR). The simulated average runoff showed that BF, GF, RR, and SR contribute 24%, 22%, 16%, and 38%, respectively, of the flow into Siling Co. Based on hypothetical climate change scenarios and two Shared Socioeconomic Pathways (SSP1-2.6 and SSP3-7.0) from the MRI-ESM2-0 GCMs, this study estimated that a 10% increase in precipitation could lead to a 28% increase in total runoff, while a 1 °C increase in temperature could lead to a 10% decrease in runoff. The average runoff depth of the basin is expected to increase by 30–39 mm, since the temperature and precipitation may increase significantly from 2020 to 2050. The intensification of glacial melting caused by the increase in temperature continues, posing a greater challenge to many water resources management problems caused by the expansion of lakes.
1. Introduction
The Tibetan Plateau (TP) is known as the roof of the world, with a total area of approximately 2.5 million km2 and an average elevation exceeding 4000 m, and is the most expansive and highest plateau in the world. As an important water source in Asia [1,2], there are many rivers and lakes on the TP. Rivers such as the Yangtze River, Yellow River, and Indus River provide the basic water security for the billions of people in the surrounding area [3]; plateau lakes including Siling Co and Lake Nam Co have ensured the necessary ecological security for the regional wetland ecosystems [4,5]. Therefore, the river-lake system of the TP plays a key role in maintaining the regional water balance [6].
Statistics show that the total lake area on the TP is 45,000 km2, accounting for approximately 50% of the total lake area in China [7]. At present, the accelerating global warming trend has significantly affected the hydrological cycle of the plateau, and evolution of the runoff pattern in the alpine region has become indisputable [8,9,10]. In particular, glaciers and snow-covered areas are highly sensitive to climate change [11,12]. Changes of the flow regime caused by glacial retreat and snowmelt will have a negative impact on the river ecosystem [13], and rising water levels in some plateau lakes increase the risk of outburst floods [14]. Due to the lack of human activities, changes in lake hydrological factors (such as precipitation, evaporation, glacial melting, and permafrost degradation) in alpine regions are closely related to climate change [15]. In particular, for the closed lake basin, the precipitation in the surrounding high-altitude area and the melting of alpine glaciers form an effective supply to the lake, and the continuous increase in water storage results in continuous expansion of the lake area. Although there are some controversies in the dynamic change and attribution of plateau lakes, many studies have shown that the accelerated melting of glaciers and snow cover and increased regional precipitation caused by climate warming are the main factors affecting the changes in lake area [16,17,18]. Therefore, how to accurately assess the water storage capacity of lakes in alpine regions and explore the mechanisms driving lake changes is one of the key issues in current water science.
Most scholars use aerial survey data combined with remote sensing and geographic information system (GIS) analysis to establish the relationships between lake area, water level, and water volume and determine the water storage capacity of lakes of different sizes, and favorable results have been achieved [19,20,21]; Zhang et al. [22] pointed out that over the past 50 years, the average water level of plateau lakes increased by approximately 4 m, and the water storage capacity of lakes increased by nearly 170 billion tons. Zhao et al. [5] found that the lake area on the TP increased at an annual rate of 0.83% between 1976 and 2009. As the largest lake on the TP, the area of Siling Co has expanded by 656.64 km2 from 1976 to 2009, and the lake area has showed a process of steady growth → accelerated growth → steady growth [23]. However, due to natural factors, such as a volatile climate, complex terrain, wide distribution of glaciers and frozen soil, and large differences in precipitation and snow cover, the hydrological processes in alpine regions exhibit strong spatial variability, causing many difficulties in the quantitative estimation of glacial melting and rainfall runoff in lakes [24,25].
The water sources of a closed lake basin can be simplified as river runoff and lake surface precipitation. The main methods for quantifying percentage contributions of each runoff component include the isotope tracing method [26], numerical simulation [27], and hydrological models [28,29]. However, the temporal changes in isotope abundance could cause errors when distinguishing soil water and groundwater, and the numerical simulation method focuses on the segmentation of baseflow. Due to its modular hydrological process setup, the distributed hydrological model exhibits strong deterministic characteristics and can be applied for reliable runoff estimation. The consideration of current hydrological models for glacier cover mainly takes two forms: embedding glacier modules into conventional hydrological models (e.g., improved SWAT model, VIC model [30,31], etc.) or developing new glacier models (e.g., GERM model [32], SPHY model [33], etc.), and some domestic and global scholars have implemented them to glacier simulation in alpine regions. The Spatial Processes in Hydrology (SPHY) model integrates most of the hydrological modules, is one of the few distributed hydrological models for cold regions that includes simulation of glaciers and snow cover, and can quantitatively assess the contribution of them [34,35].
Therefore, the objectives of this study are twofold: (1) applying the SPHY model to investigate the temporal and spatial distribution and trends of precipitation, runoff, and water storage in Siling Co from 2000 to 2016; clarified the contributions of glaciers, snow cover, precipitation, and BF to the lake water volume; (2) using the results of the hypothetical climate change scenarios and the Meteorological Research Institute Earth System Model version 2.0 (MRI-ESM2-0) in Coupled Model Intercomparison Project phase 6 (CMIP6) to analyze characteristics of variation in flow into Siling Co under future climate change scenarios and to predict the impacts of different scenarios on the water storage capacity of the lake. We aim to understand the driving mechanisms of lake expansion in the TP through this study.
2. Study Area and Data
2.1. Overview of the Study Area
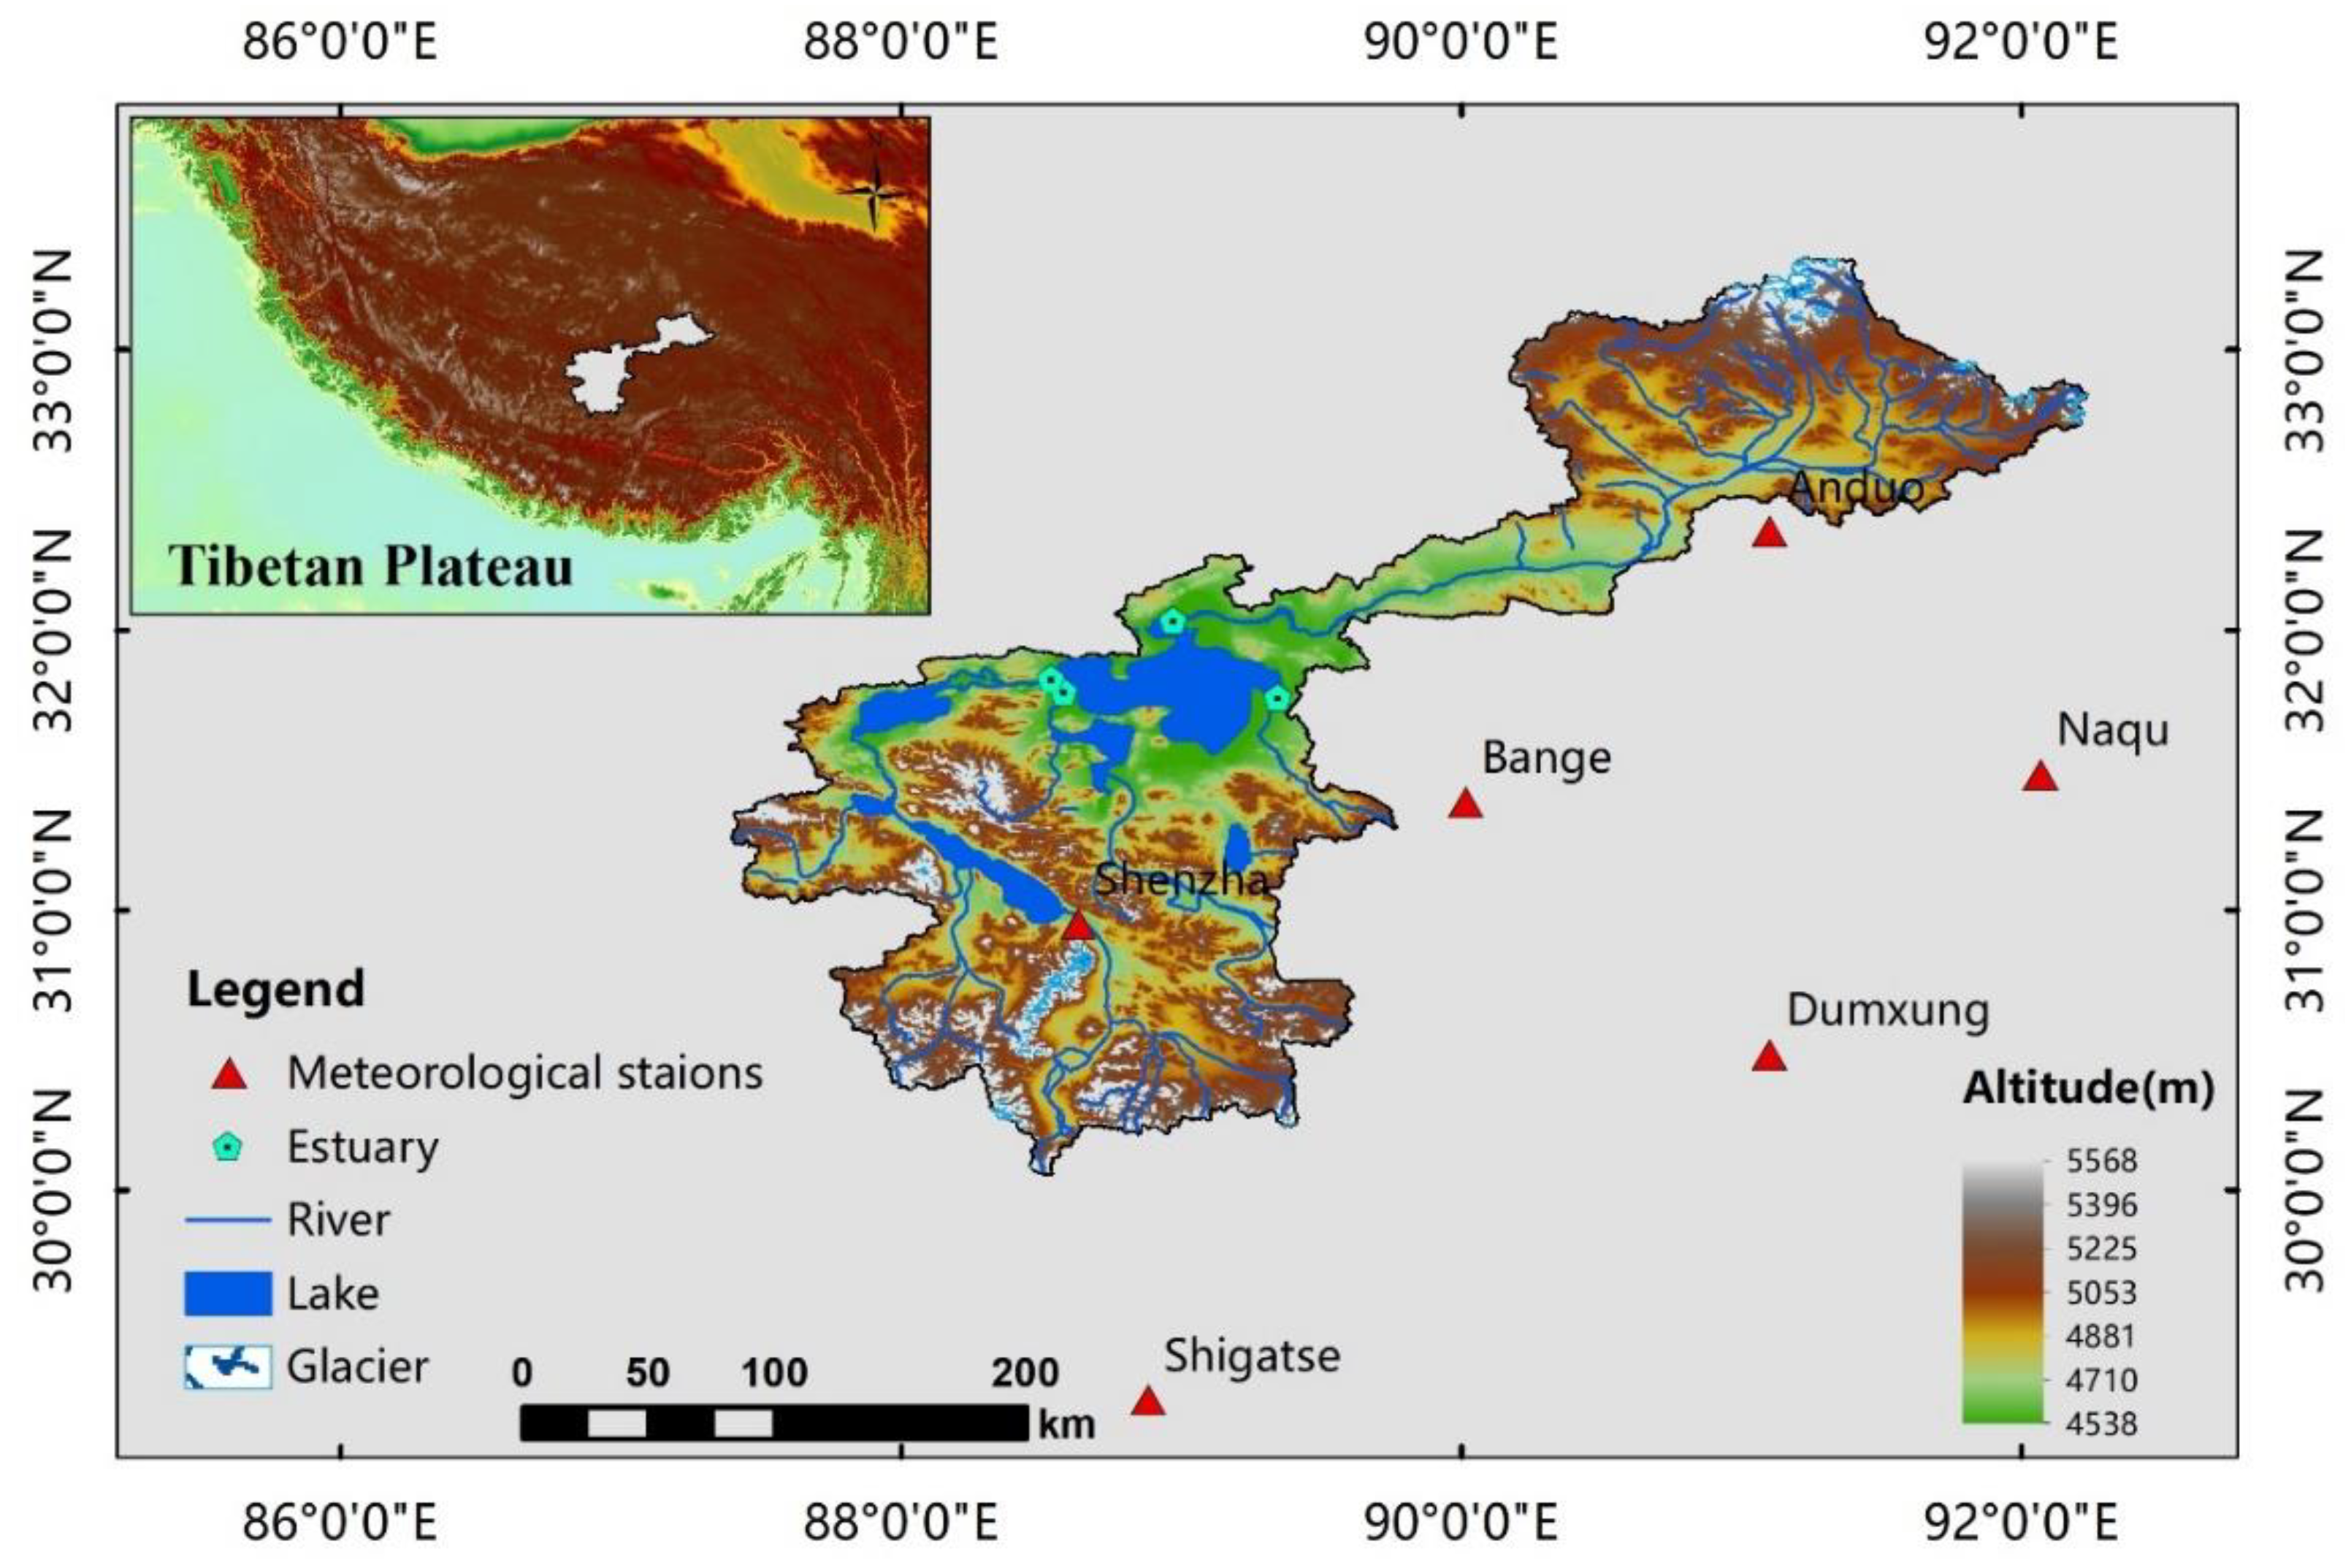
Siling Co is located to the southeast of the endorheic basin on the northern TP (31°34′–31°57′ N, 88°33′–89°21′ E, Figure 1), with an average elevation above 4600 m, a basin area of approximately 59,400 km2, and a lake area of 2013.5–2323.6 km2 (from 2002 to 2009) [23], and is the largest closed inland lake on the TP.
Due to its special geographical location, the Siling Co area is characterized by alpine and temperate continental climates, with a relative humidity of approximately 40% and an annual average temperature of approximately 0.7 °C. The vegetation is relatively sparse due to the cold climate. The annual average precipitation is approximately 320 mm, and the precipitation is mainly concentrated from May to September with large seasonal variations [36]. The glacial resources in the Siling Co area are rich, and there are 6378 modern glaciers in the endorheic basin of the TP where the study area is located, with an area of glaciers of approximately 7273.3 km2 and an ice reserve of approximately 660 km3 [37,38]. Glacial melt, snowmelt, and precipitation mainly flow into the lake from various locations by the four rivers of Zajia Zangbo, Boqu Zangbo, Ali Zangbo, and Zagen Zangbo. The longest inland river in Tibet, Zajia Zangbo, has a total length of 409 km and originates from the snow-capped mountains Tanggula and Gradendong, with a watershed area totals roughly 16,600 km2; Zagen Zangbo has a length of 355 km and a basin area of 16,300 km2, it originates in the Kegang Snow Mountain and flows into Siling Co by the west shore of the lake. In addition, both Boqu Zangbo, which enters the lake from the east coast, and Ali Zangbo, which enters the lake from the southwest shore after flowing through the Co Ngoin lake, have smaller catchments (1100 km2 and 6700 km2), and the basin are no glacial mountains. Hence, the flow varies widely amongst rivers.
2.2. Data Sources
The main research data used to analyze the climate change and assess the water storage components of Siling Co included meteorological data, digital elevation model (DEM) data, simulated station data, soil data, land use data, and glacial data. Considering the completeness and timeliness of records, the meteorological data were selected from six national meteorological stations in the study area and its surrounding areas, with the time period being 2000 to 2016, and included daily average temperature, daily maximum temperature, daily minimum temperature, and daily precipitation. The DEM data were derived from the Hydrological data and maps based on Shuttle Elevation Derivatives at multiple Scales of the United States Geological Survey (USGS), which are based on the 90-m resolution Shuttle Radar Topography Mission (SRTM). The simulated station data were determined based on the inlets of the four rivers that empty into Siling Co. The soil data were derived from HiHydroSoil with a resolution of 800 m and include soil physical parameters, such as saturated water content (WCSat), field water holding capacity (pF2), wilting point (pF3), permanent wilting point (pF4.2) and saturated hydraulic conductivity (Ksat) of different soil layers and different soil types. The land use data were from the GlobCover 2009 data from the European Space Agency (ESA) with an accuracy of 300 m, including 23 different land use types, of which croplands, grasslands, woodlands, bare areas, water bodies, and permanent glaciers were located in the study area. Glacier outline data were derived from the Second Chinese Glacier Inventory. Details of each meteorological station and soil data can be found in Table 1, and Figure 1 and Figure 2.
3. Research Methods
3.1. Principles of the SPHY Model
The SPHY model is a spatially distributed leaky bucket type of model, applies the PCRaster dynamic modeling framework, is written in the Python programming language [33]. It is created based on a grid, and averages are stored in the grid cells. The model includes six main modules, i.e., glacier, snow cover, groundwater, dynamic vegetation, confluence path, and lake/reservoir path, and the modules can be run independently with the exception of the glacier module. In terms of the horizontal regional structure, the model defines each grid cell as “no glacier”, “completely covered by glacier”, or “partially covered by glacier”, with proportions ranging from 0 to 1. Cells without glaciers or partially covered by glacier are defined as either snow-covered or non-snow-covered cells, and cells without snow cover are defined as other types, such as vegetation, water, and exposed soil [39]. In terms of the longitudinal soil structure, the model divides the soil column into the three components of the root zone, sub-root zone, and groundwater layer. The soil water from the previous layer enters the next layer through percolation, and water balance is satisfied within each soil layer and in the combination of all three parts. Outflows from different soil layers are defined as surface runoff, lateral flow, and baseflow, respectively.
After precipitation is intercepted by vegetation near the ground, part or all of it evaporates, and the evaporation was calculated using the modified Hargreaves equation based on temperature data. Precipitation after subtracting evaporation was divided into different runoff processes according to the differences in areas receiving precipitation and the temperature threshold. The hydrological cycle of the basin driven by precipitation and temperature data finally estimates the four components of rainfall runoff, glacier runoff, snow runoff, and baseflow. The total runoff was calculated as follows:
where QTR is the total runoff in a particular grid cell (mm), GRo is the glacier runoff (mm), SRo is the Snow runoff (mm), RRo is the rainfall runoff (mm), and BF is the baseflow (mm).
This study mainly explored the characteristics of glacier runoff in the Siling Co area and the response to climate change; therefore, this paper focuses on the hydrology of ice and snow. For other principles and processes, please refer to the description of SPHY model [33].
3.1.1. Glacier Melt Runoff Process
In the SPHY model, grid cells partially or fully covered with glaciers are considered to contain debris-covered glaciers or debris-free glaciers, and a Degree-day factor (DDF) is used to describe the glacial melting rate. The melting of debris-free glaciers can be expressed as follows:
where DDFCI is the DDF for debris-free glaciers (mm·°C−1·d−1), and FCI is the fraction of debris-free glaciers within the glacier cover of each cell.
The calculation of melting of debris-covered glaciers is similar to that for debris-free glaciers:
where DDFDC is the DDF for debris-covered glaciers (mm·°C−1·d−1), and FDC is the fraction of debris-covered glaciers within the glacier cover of each cell.
The sum of the two equations gives the total amount of glacial melting:
where GlacF is the fraction of glacier cover in the grid cell.
Some of the glacier meltwater flows into the groundwater to form baseflow, while the remainder of the melted glaciers flow out to form glacier runoff, and the ratio of the two is determined by the glacier melt runoff factor (GlacROF). The quantities of glacier runoff GRo (mm) and glacier percolation Gperc,t (mm) are defined as follows:
3.1.2. Snow Runoff Process
The SPHY model defines the solid form (snowfall) and liquid form (rainfall) of precipitation by setting a temperature threshold:
where Ps,t is the amount of snowfall on day t (mm), Pl,t is the rainfall on day t (mm), Tcrit is the critical temperature for distinguishing rain and snow (°C), and Tavg,t is the average temperature on day t (°C).
The SPHY model uses the degree-day model for snowmelt to calculate the daily potential snowmelt amount:
where Apot,t is the potential snowmelt amount on day t (mm), and DDFS is the DDF for snow cover (mm·°C−1·d−1).
The actual snowmelt quantity is limited by the amount of snow cover at the end of the previous day:
where Aact,t is the actual snowmelt amount on day t (mm), and SSt-1 is the snow storage amount on day t−1 (mm).
According to the actual snowmelt amount and snowfall amount, the snow cover on day t − 1 is updated to that for day t. When the temperature drops below the melting point of snow, the refrozen snow meltwater on day t − 1 is added to the snowbank:
where SSWt−1 is the amount of refrozen meltwater on day t − 1 (mm).
The maximum amount of refrozen meltwater SSWmax (mm) is limited by the thickness of the snow cover. The total snow cover SST (mm) is composed of snow cover and refrozen meltwater:
Therefore, the snow cover and snowmelt processes can only occur in the surface grid cells, and the snow falling on the glacier is included in the glacier module. When the temperature exceeds the melting point of the snow cover and there is no melt water frozen in the snow cover, the snow runoff SRo (mm) can be calculated:
where ΔSSW (mm) is the change in the amount of meltwater in the snow cover.
3.2. Water Balance Process
It is generally suggested that the impact of water storage can be ignored when estimating the long-term water balance, and the difference between annual average precipitation and evapotranspiration is equivalent to the mean annual runoff [40]. However, the water balance of lake area in closed basins should be expressed as follows:
where ΔS is the water storage capacity (m3), QTot is the total inflow into the lake (m3), PW is the precipitation on the lake surface (m3), and ETW is the evaporation from the lake surface (m3).
In this study, the precipitation data from the six nearest stations in the Siling Co area, i.e., Shenzha, Bange, Ando, Shigatse, Dumxung, and Naqu, were selected for correlation analysis, and there were consistent precipitation changes. Therefore, the inverse distance weighted (IDW) method was used to interpolate the precipitation on the lake surface. The water source needed for evaporation from the lake surface is sufficient, and the actual evaporation can reach the maximum potential evapotranspiration. Therefore, the daily meteorological data (temperature, wind speed, relative humidity, and sunshine hours) from the meteorological stations closest to the lake were used, and the lake evaporation was calculated according to the Penman-Monteith equation recommended by the Food and Agriculture Organization (FAO) of the United Nations (UN).
3.3. Model Calibration and Validation
There are many lakes on the TP, the terrain is complex, and field observations are difficult. Most of the ground observations start late and are limited to the water level of the lake, and long-term series of lake inflow measurements are lacking [41]. In recent years, the development of remote sensing monitoring technology using radar satellites such as GFO, ERS-2, ICESat, and CryoSat-2 has greatly improved lake observation methods and observation accuracy [42,43]. In this study, the model was validated using a high-resolution dataset of changes in water level of lakes on the TP [44]. This dataset used multiple altimetry missions and Landsat satellite data to create a time series of lake water level changes with high temporal resolution on a weekly-to-monthly time scale and provided high-precision data for 52 large lakes on the TP (including Siling Co) from 2000 to 2017.
To test the results of simulation by the SPHY model, this study selected the three evaluation indicators Nash-Sutcliffe efficiency (NSE), relative error (RE), and coefficient of determination (R2):
where So,i and Ssim,i are the cumulative water storage capacity from the dataset at time step i (m3) and the simulated cumulative water storage capacity (m3), respectively; o,i and sim,i are the means of the cumulative water storage capacity from the dataset (m3) and the simulated cumulative water storage capacity (m3), respectively; and n is the number of variables in the validation period.
In the calibration in this study, the start time for the change in water storage in Siling Co in the dataset (May 2001) was used as the reference, the period from 2001 to 2008 was used for calibration, and the period from 2009 to 2016 was used for validation. Firstly, the main sensitive parameters and the best range of values were identified based on parameter definitions and principles. Secondly, the adjustment direction was determined by the parameter sensitivity differences, the model outputs were compared with the dataset, and the parameter-by-parameter calibration was utilized to make the best simulation. Finally, the runoff simulation for the validation period was performed using the manually adjusted model parameters. The main sensitive parameter values in SPHY are shown in Table 2.
4. Results and Analysis
4.1. Model Efficiency Evaluation
In this study, 19 May 2001 was used as the initial date for model evaluation, and the corresponding simulated lake inflow was output according to the date in the dataset. The cumulative water storage capacity of the lake was estimated based on the water balance to perform parameter validation and efficiency evaluation of the model.
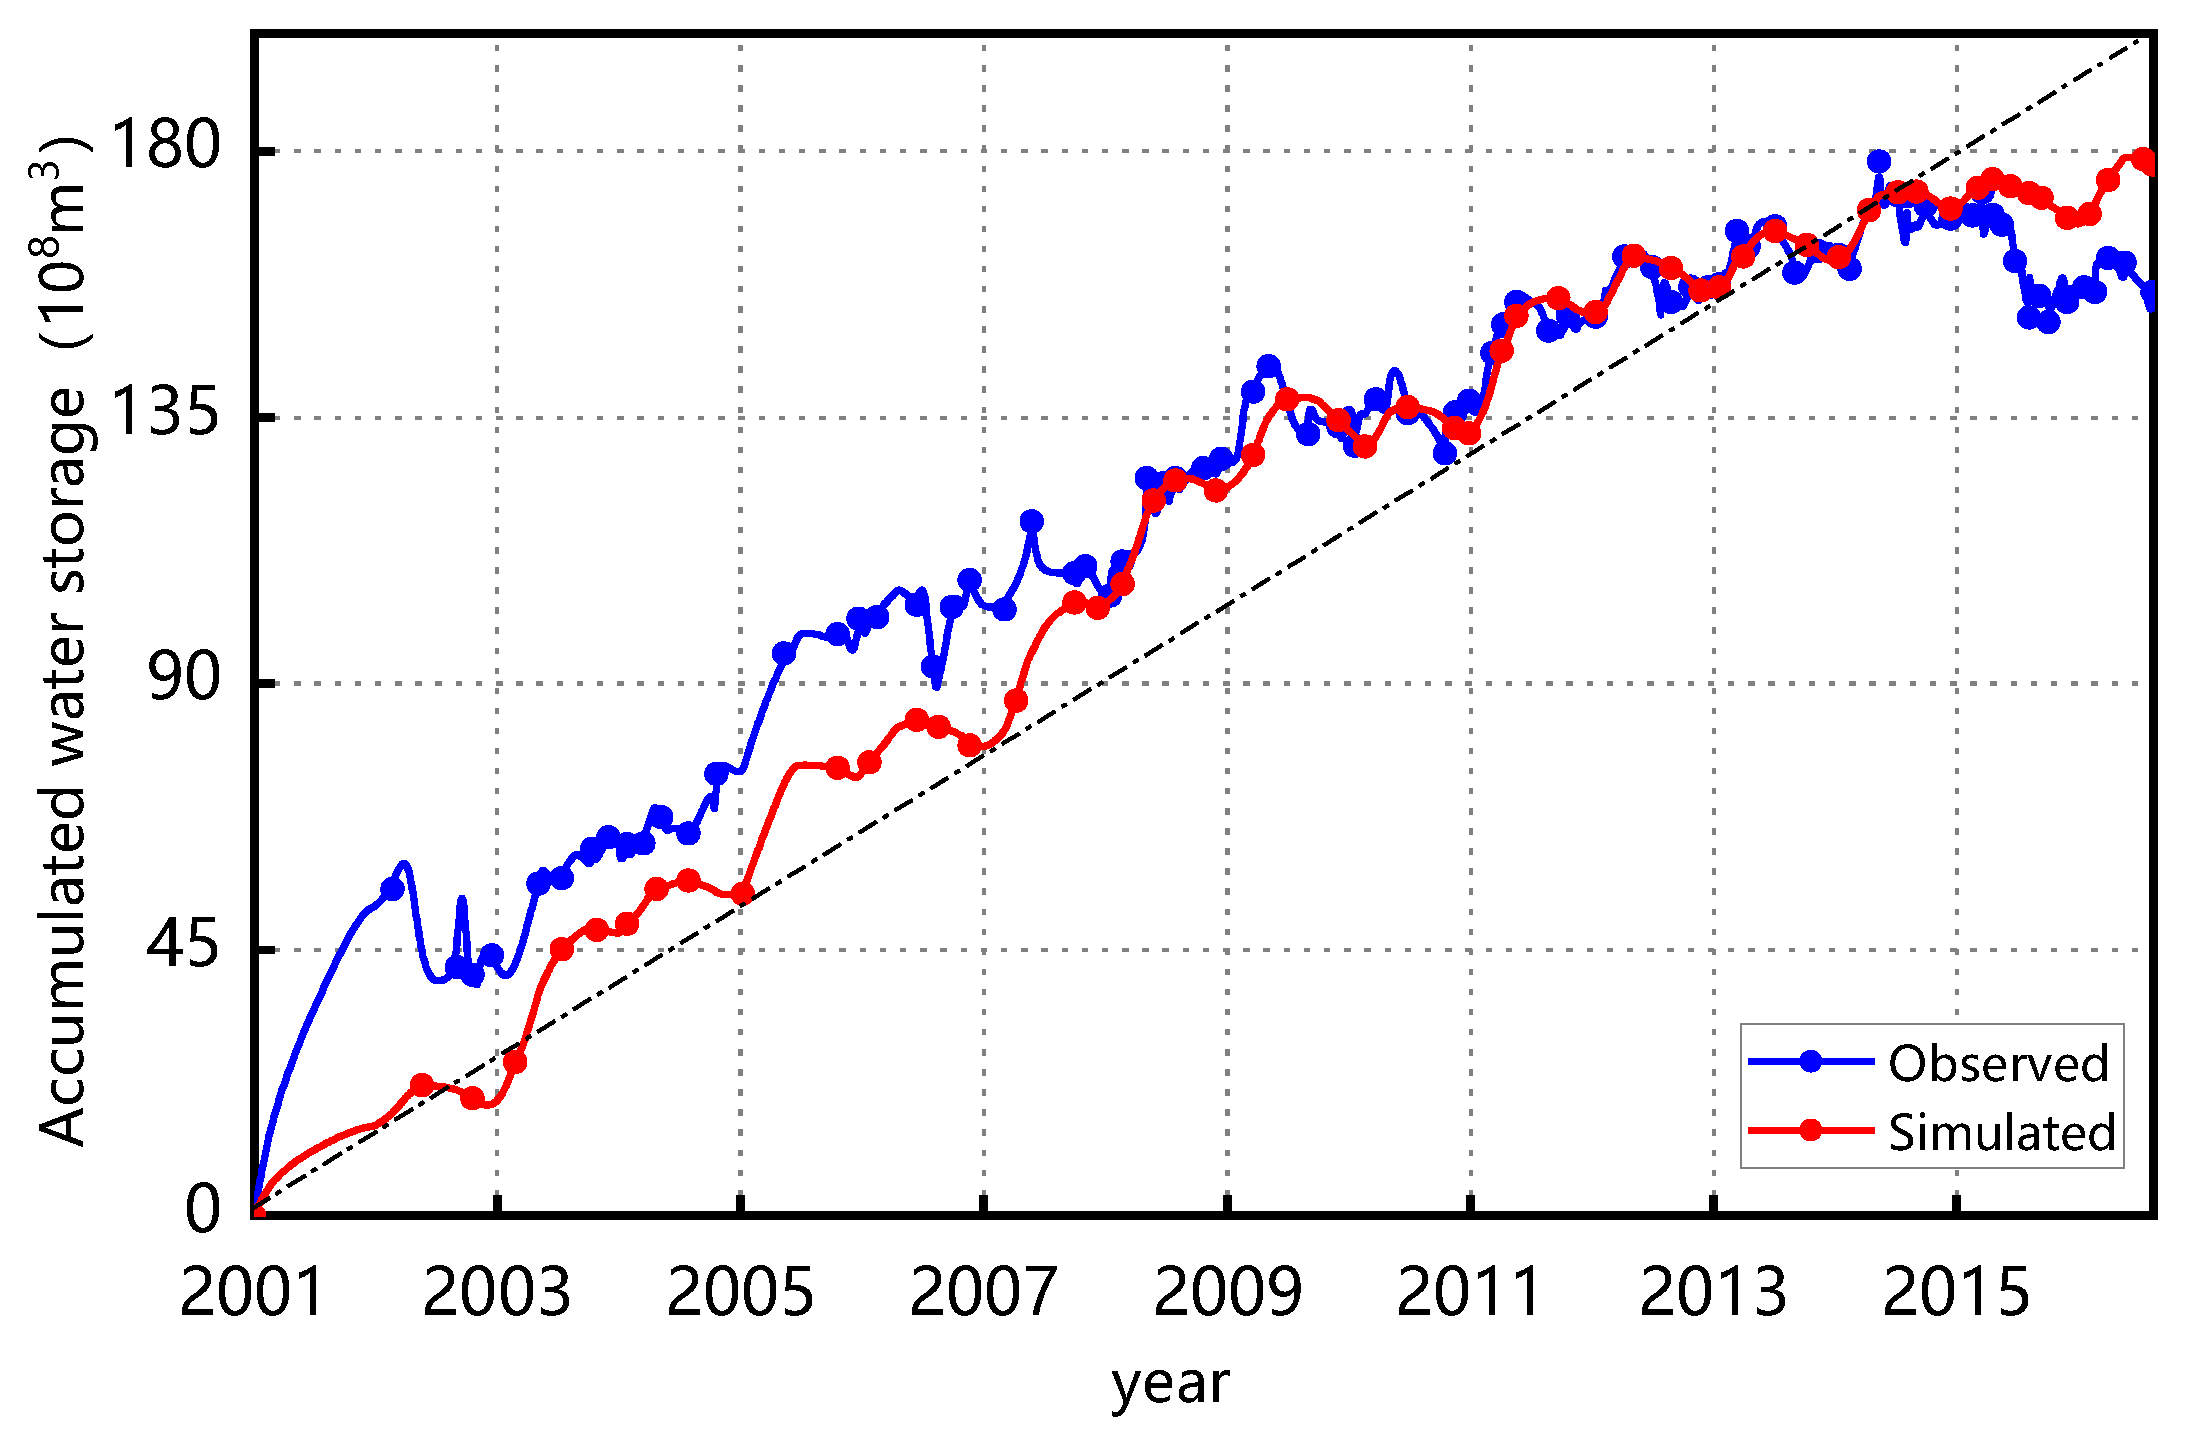
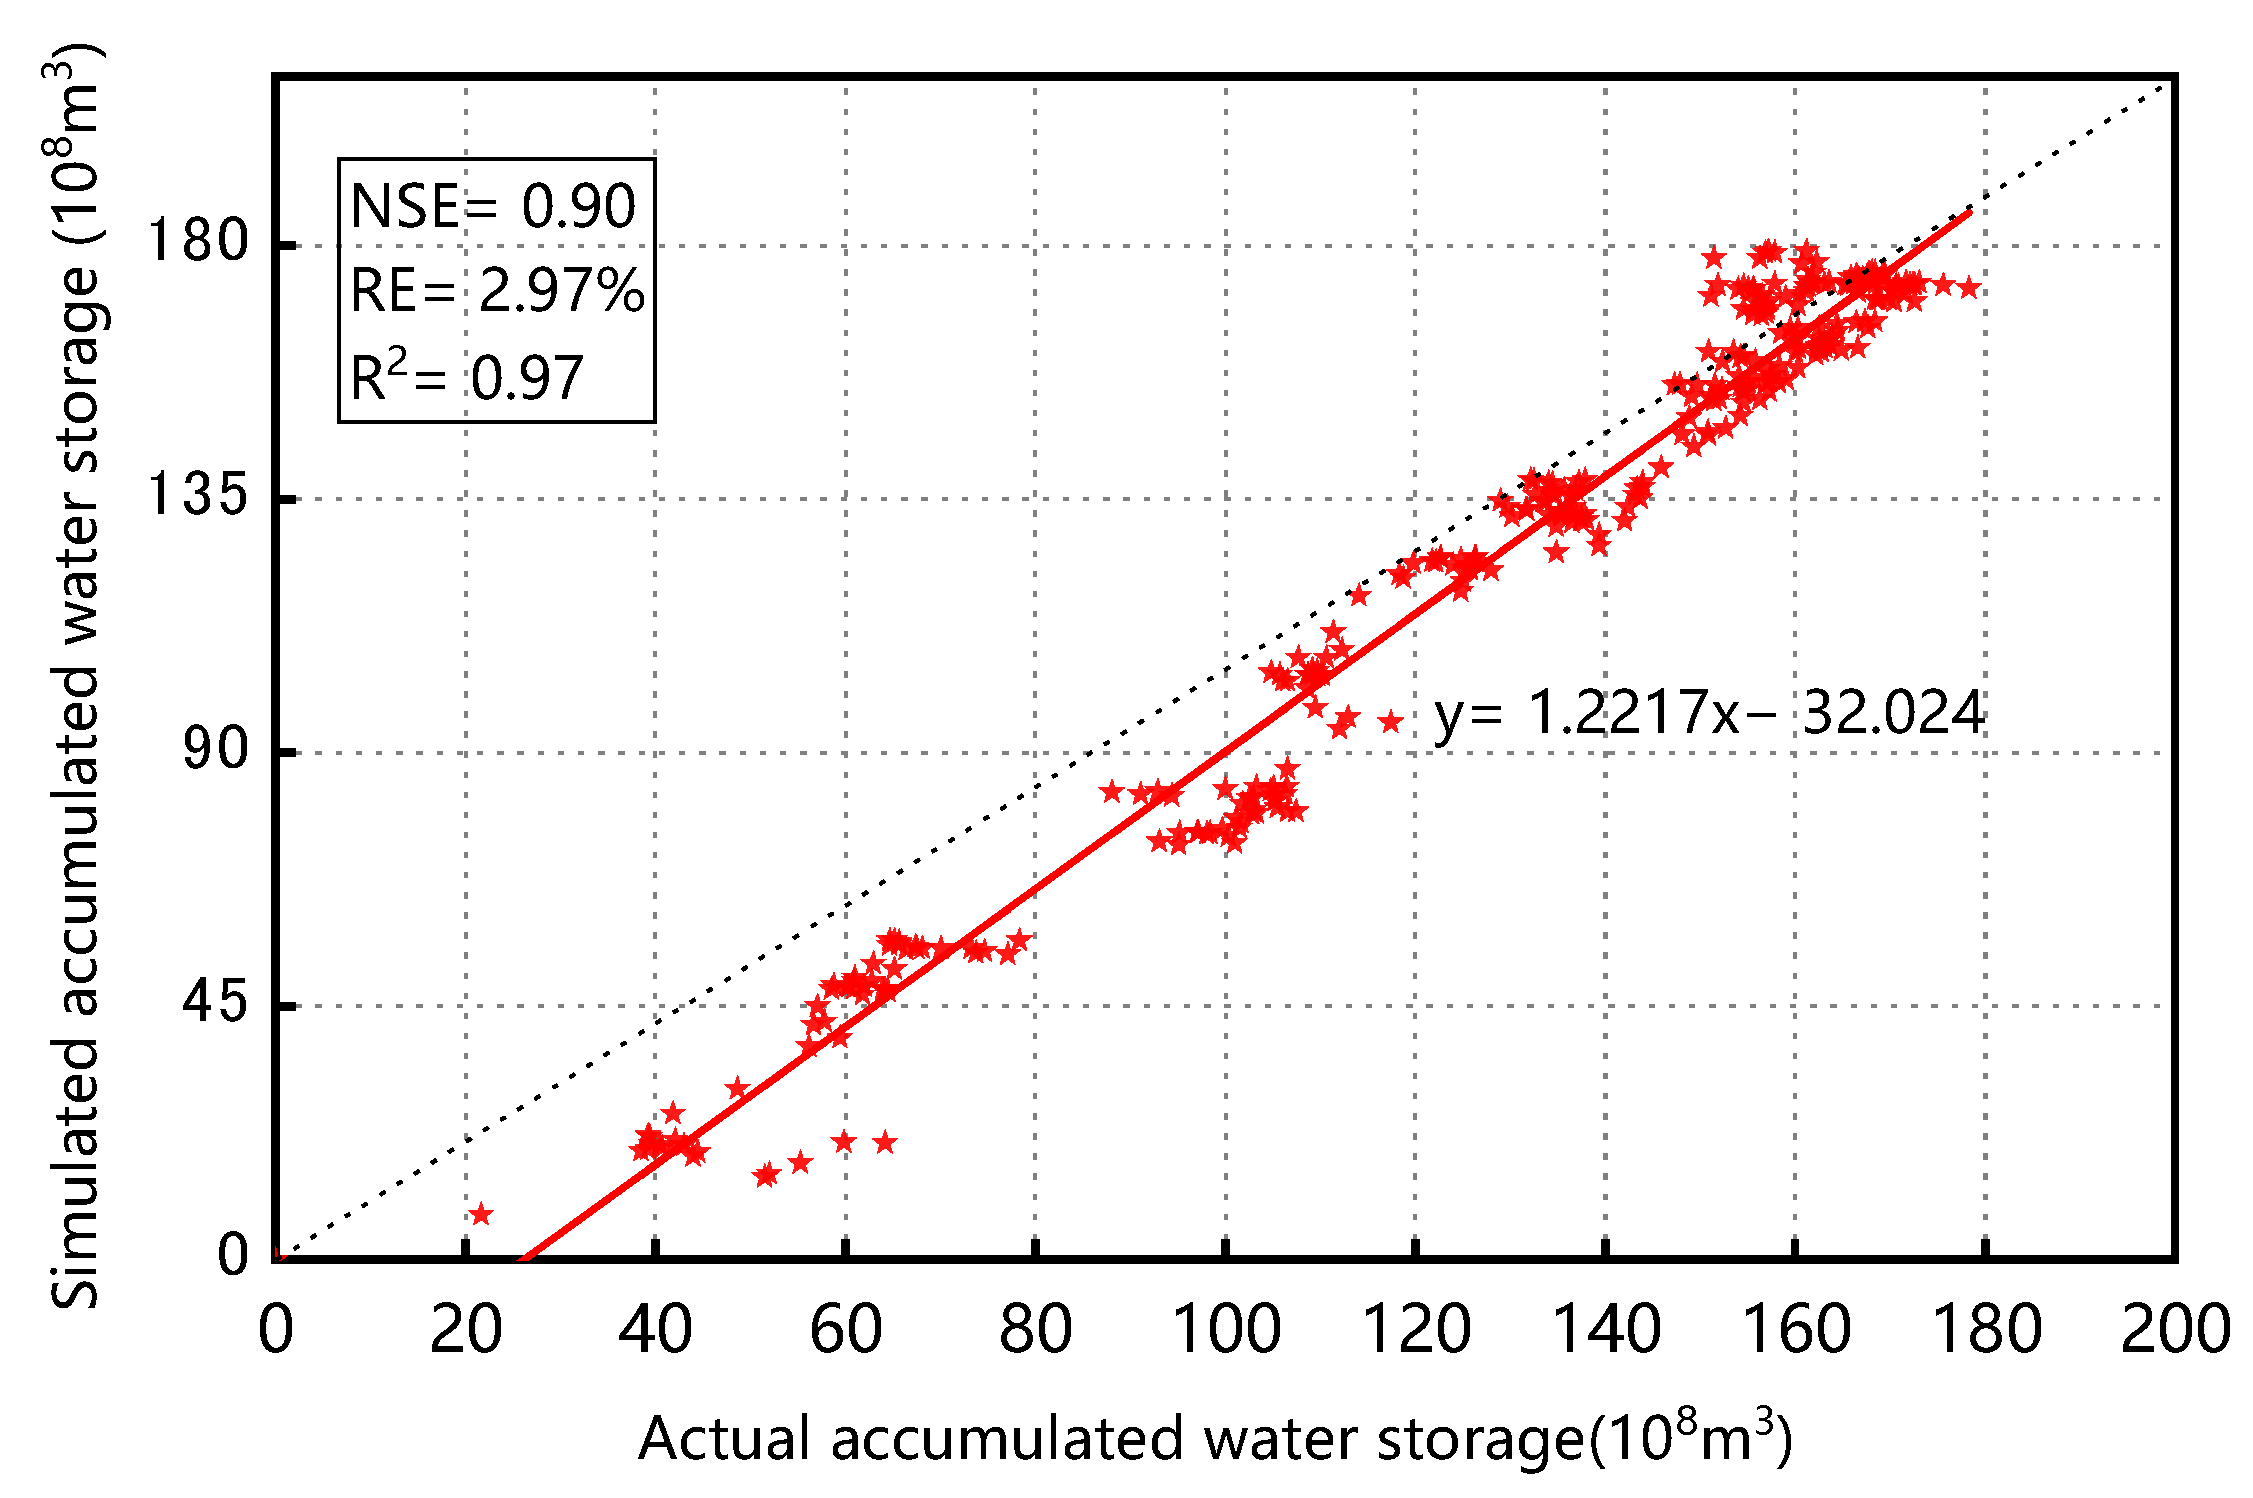
As can be seen from Table 3, the NSE, RE, and R2 for the calibration period were 0.59, 17.6%, and 0.92, respectively, and those for the validation period were 0.61, −2.0%, and 0.81, respectively. The NSE and RE values for the validation period were better than those for the calibration period, which may be because satellite technology advancement has improved the accuracy of observations of lake water level and lake area during the validation period, which in turn affects values for changes in lake water storage capacity. Figure 3 also shows that the lake water storage capacity in the dataset exhibited irregular oscillatory variation within the calibration period; the magnitude of variation was relatively high in the short term (2002 and 2006) and displayed relatively regular fluctuation after 2009. The RE reached 17.6% during the calibration period, which indicated that the simulated lake inflow was relatively low during the calibration period, and during the validation period, R2 exceeded 0.8 and was relatively high. The comparison between the simulated and actual cumulative water storage capacity in the lake during the entire time period in Figure 4 shows that the lake inflow simulated by the model was relatively consistent with the actual values, and the model’s efficiency is acceptable.
4.2. Characteristics of Regional Climate Change
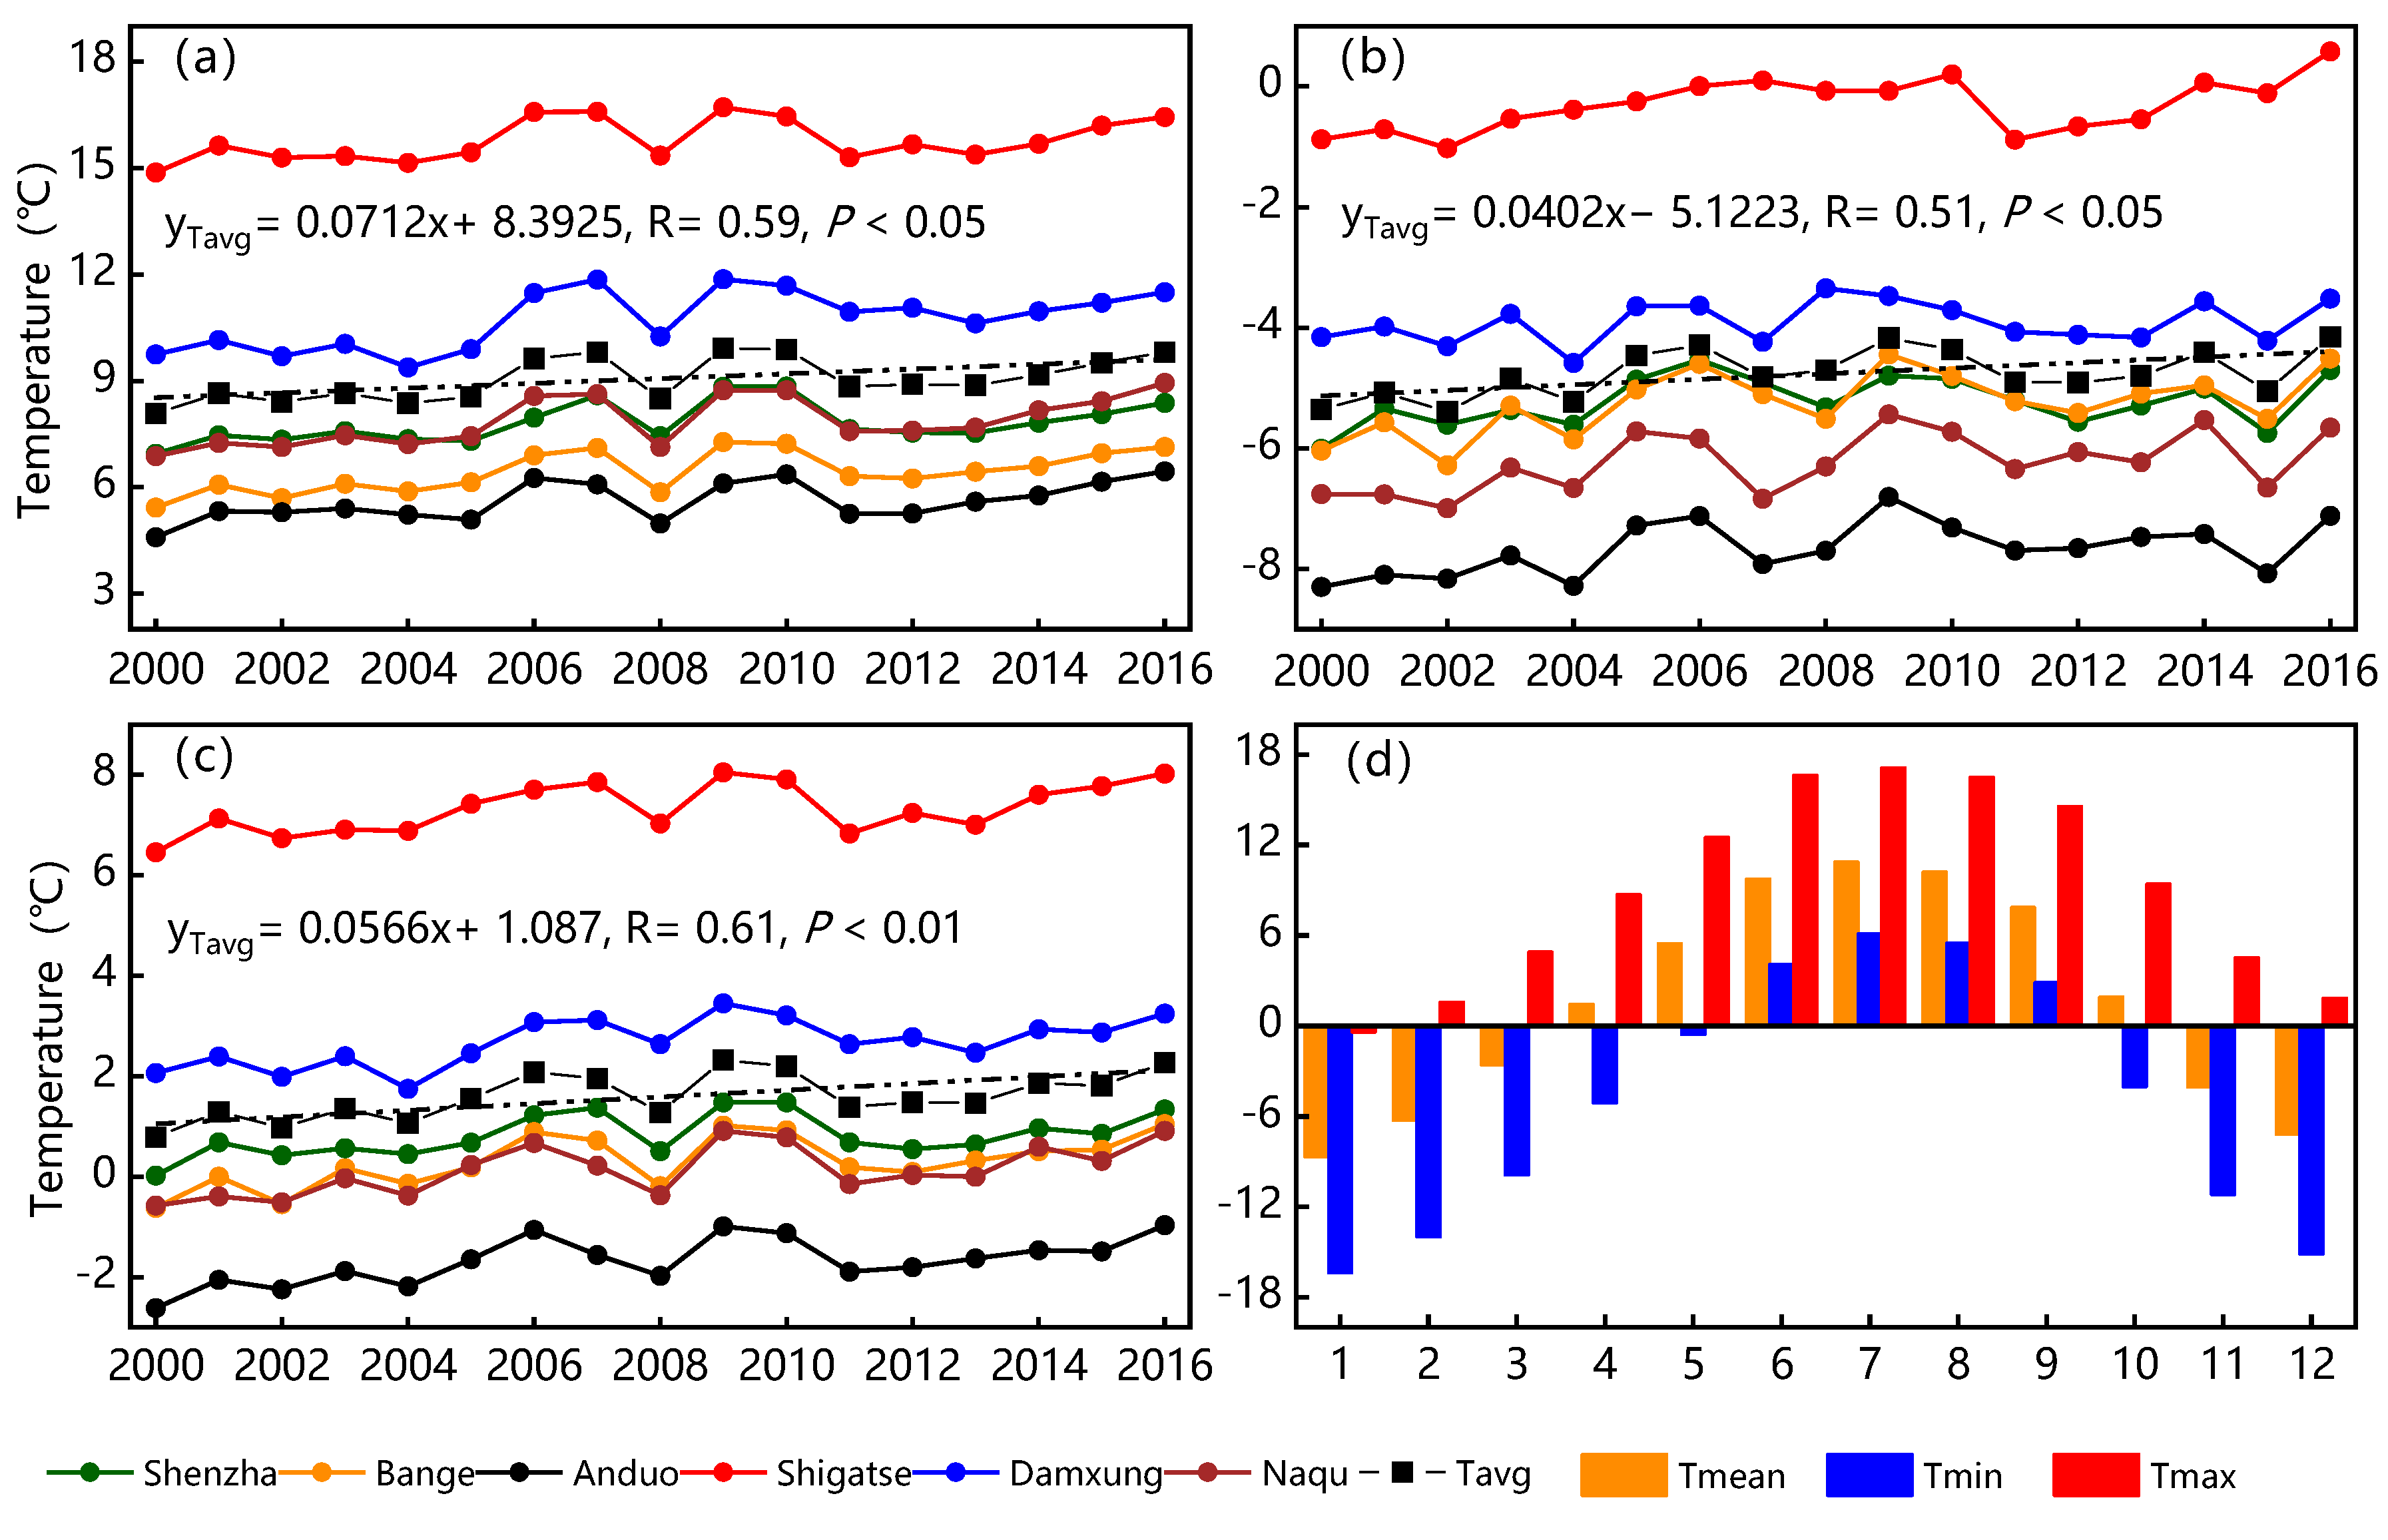
Since the 21st century, the temperature in the Siling Co basin has undergone significant changes in the context of global warming, which has affected regional precipitation to a certain extent. The temperature changes at various meteorological stations were significantly consistent (Figure 5). Overall, the multiyear average temperature in the basin was approximately 1.60 °C, with the highest temperature at the Shigatse station, where an annual average maximum temperature is 15.77 °C, and the lowest temperature occurred at the Ando station (−7.66 °C). The M-K trend test showed that the basin average temperature fluctuated but increased significantly by approximately 0.57 °C/decade during the study period. However, as the temperature increased, precipitation slightly declined at a rate of 5.0 mm/yr (Failed significance test at 95% confidence level). The precipitation at each station varied from 2000 to 2007. After 2008, the precipitation at each station consistently decreased with a relatively large variation amplitude and a standard deviation of 83.97 mm.
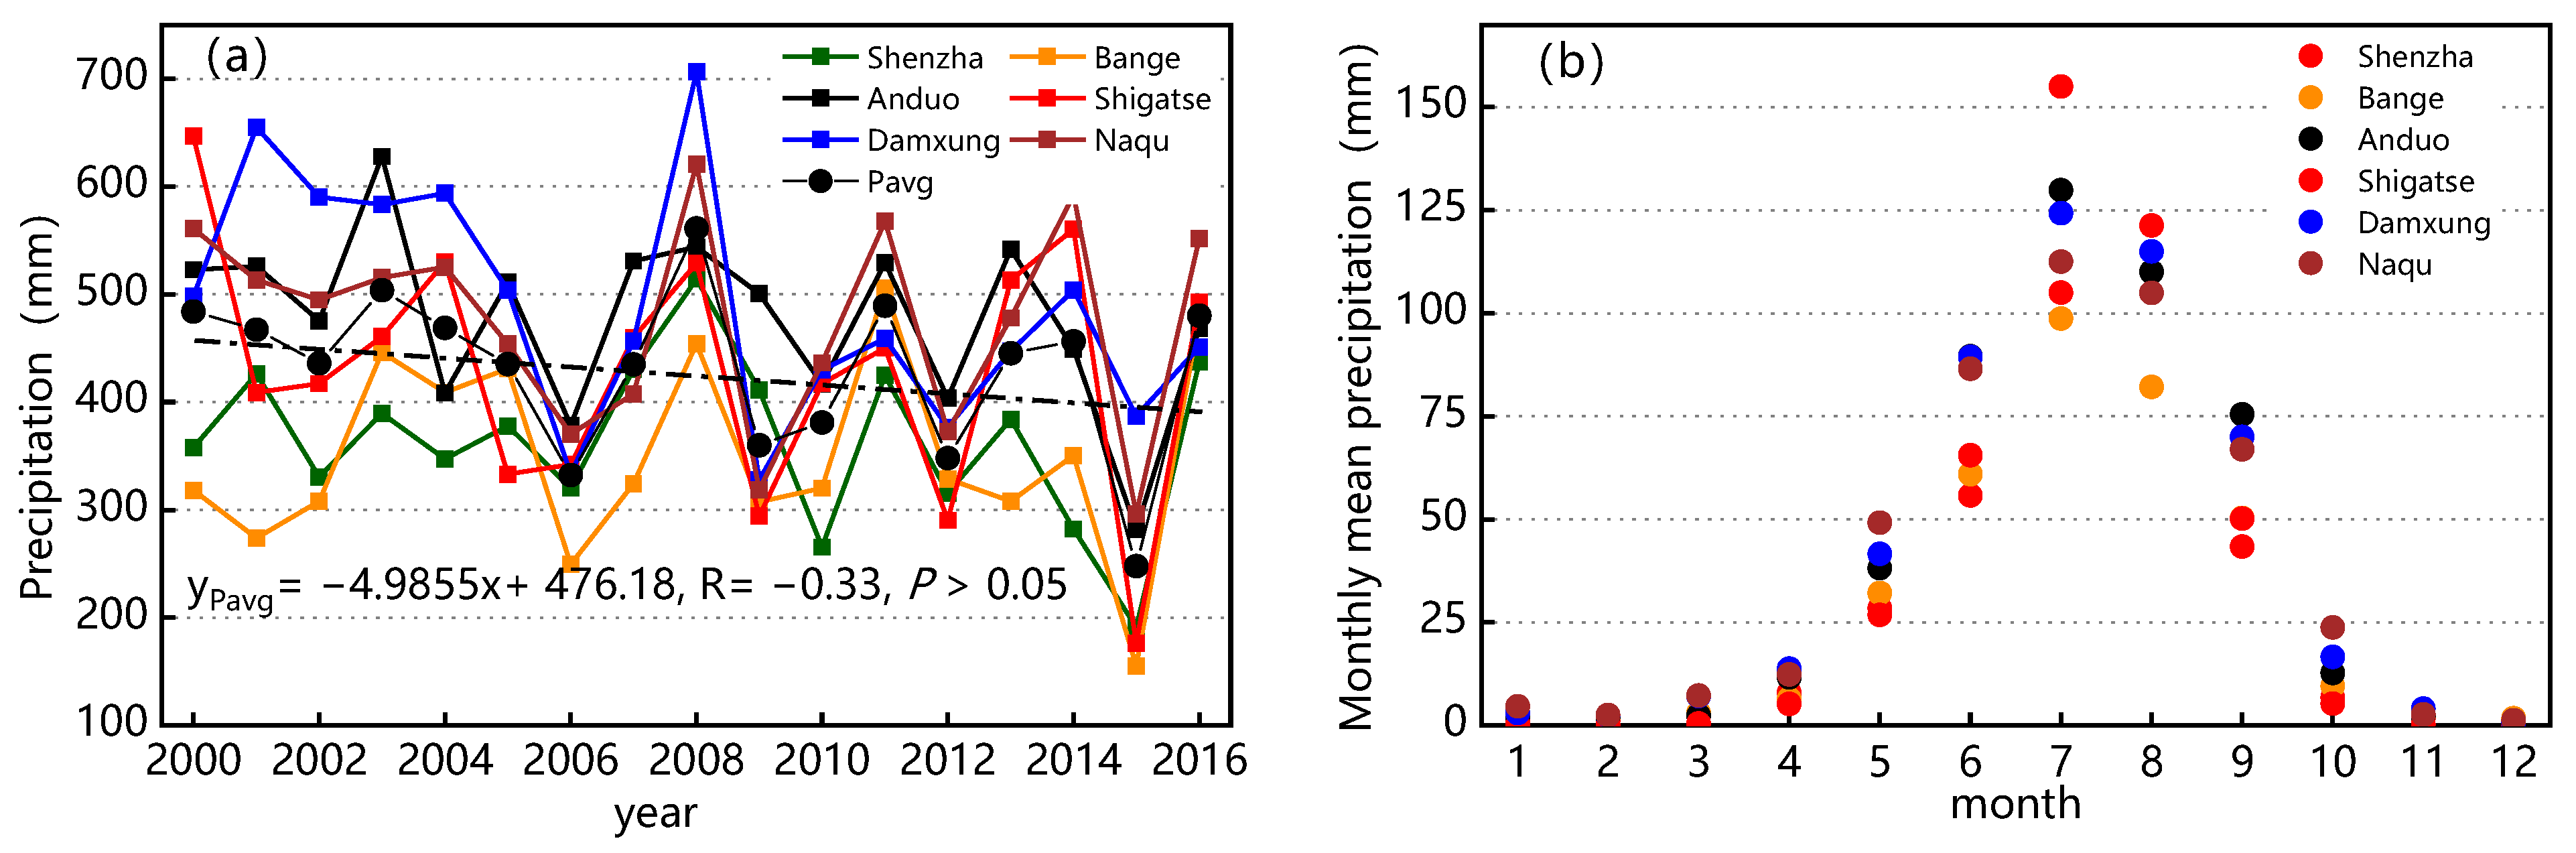
The monthly and seasonal variations in temperature and precipitation in the Siling Co area were characteristic of a typical plateau climate and temperate continental climate. The differences in temperature and precipitation were very obvious. The maximum monthly average temperature in the basin was 17.13 °C in July, the minimum monthly average temperature was −16.37 °C in January, and the temperature was below 0 °C for nearly 40% of the year. In contrast, 94.6% of the precipitation was concentrated in the warm and wet spring and summer, and the precipitation in July and August accounted for half of the annual precipitation (Figure 6).
4.3. Characteristics of Water Storage Changes in the Lake Area
To study the changes in the water storage capacity of the lake, the inlets of four rivers, namely, Zajia Zangbo, Boqu Zangbo, Ali Zangbo, and Zagen Zangbo, were selected as the outlets of the sub-basins to simulate the recharge of Siling Co by different rivers. QTot was calculated as follows:
where Qzj, Qbq, Qal, and Qzg are the outflows of the four rivers in m3. The water storage capacity of the lake was calculated using Equation (15).
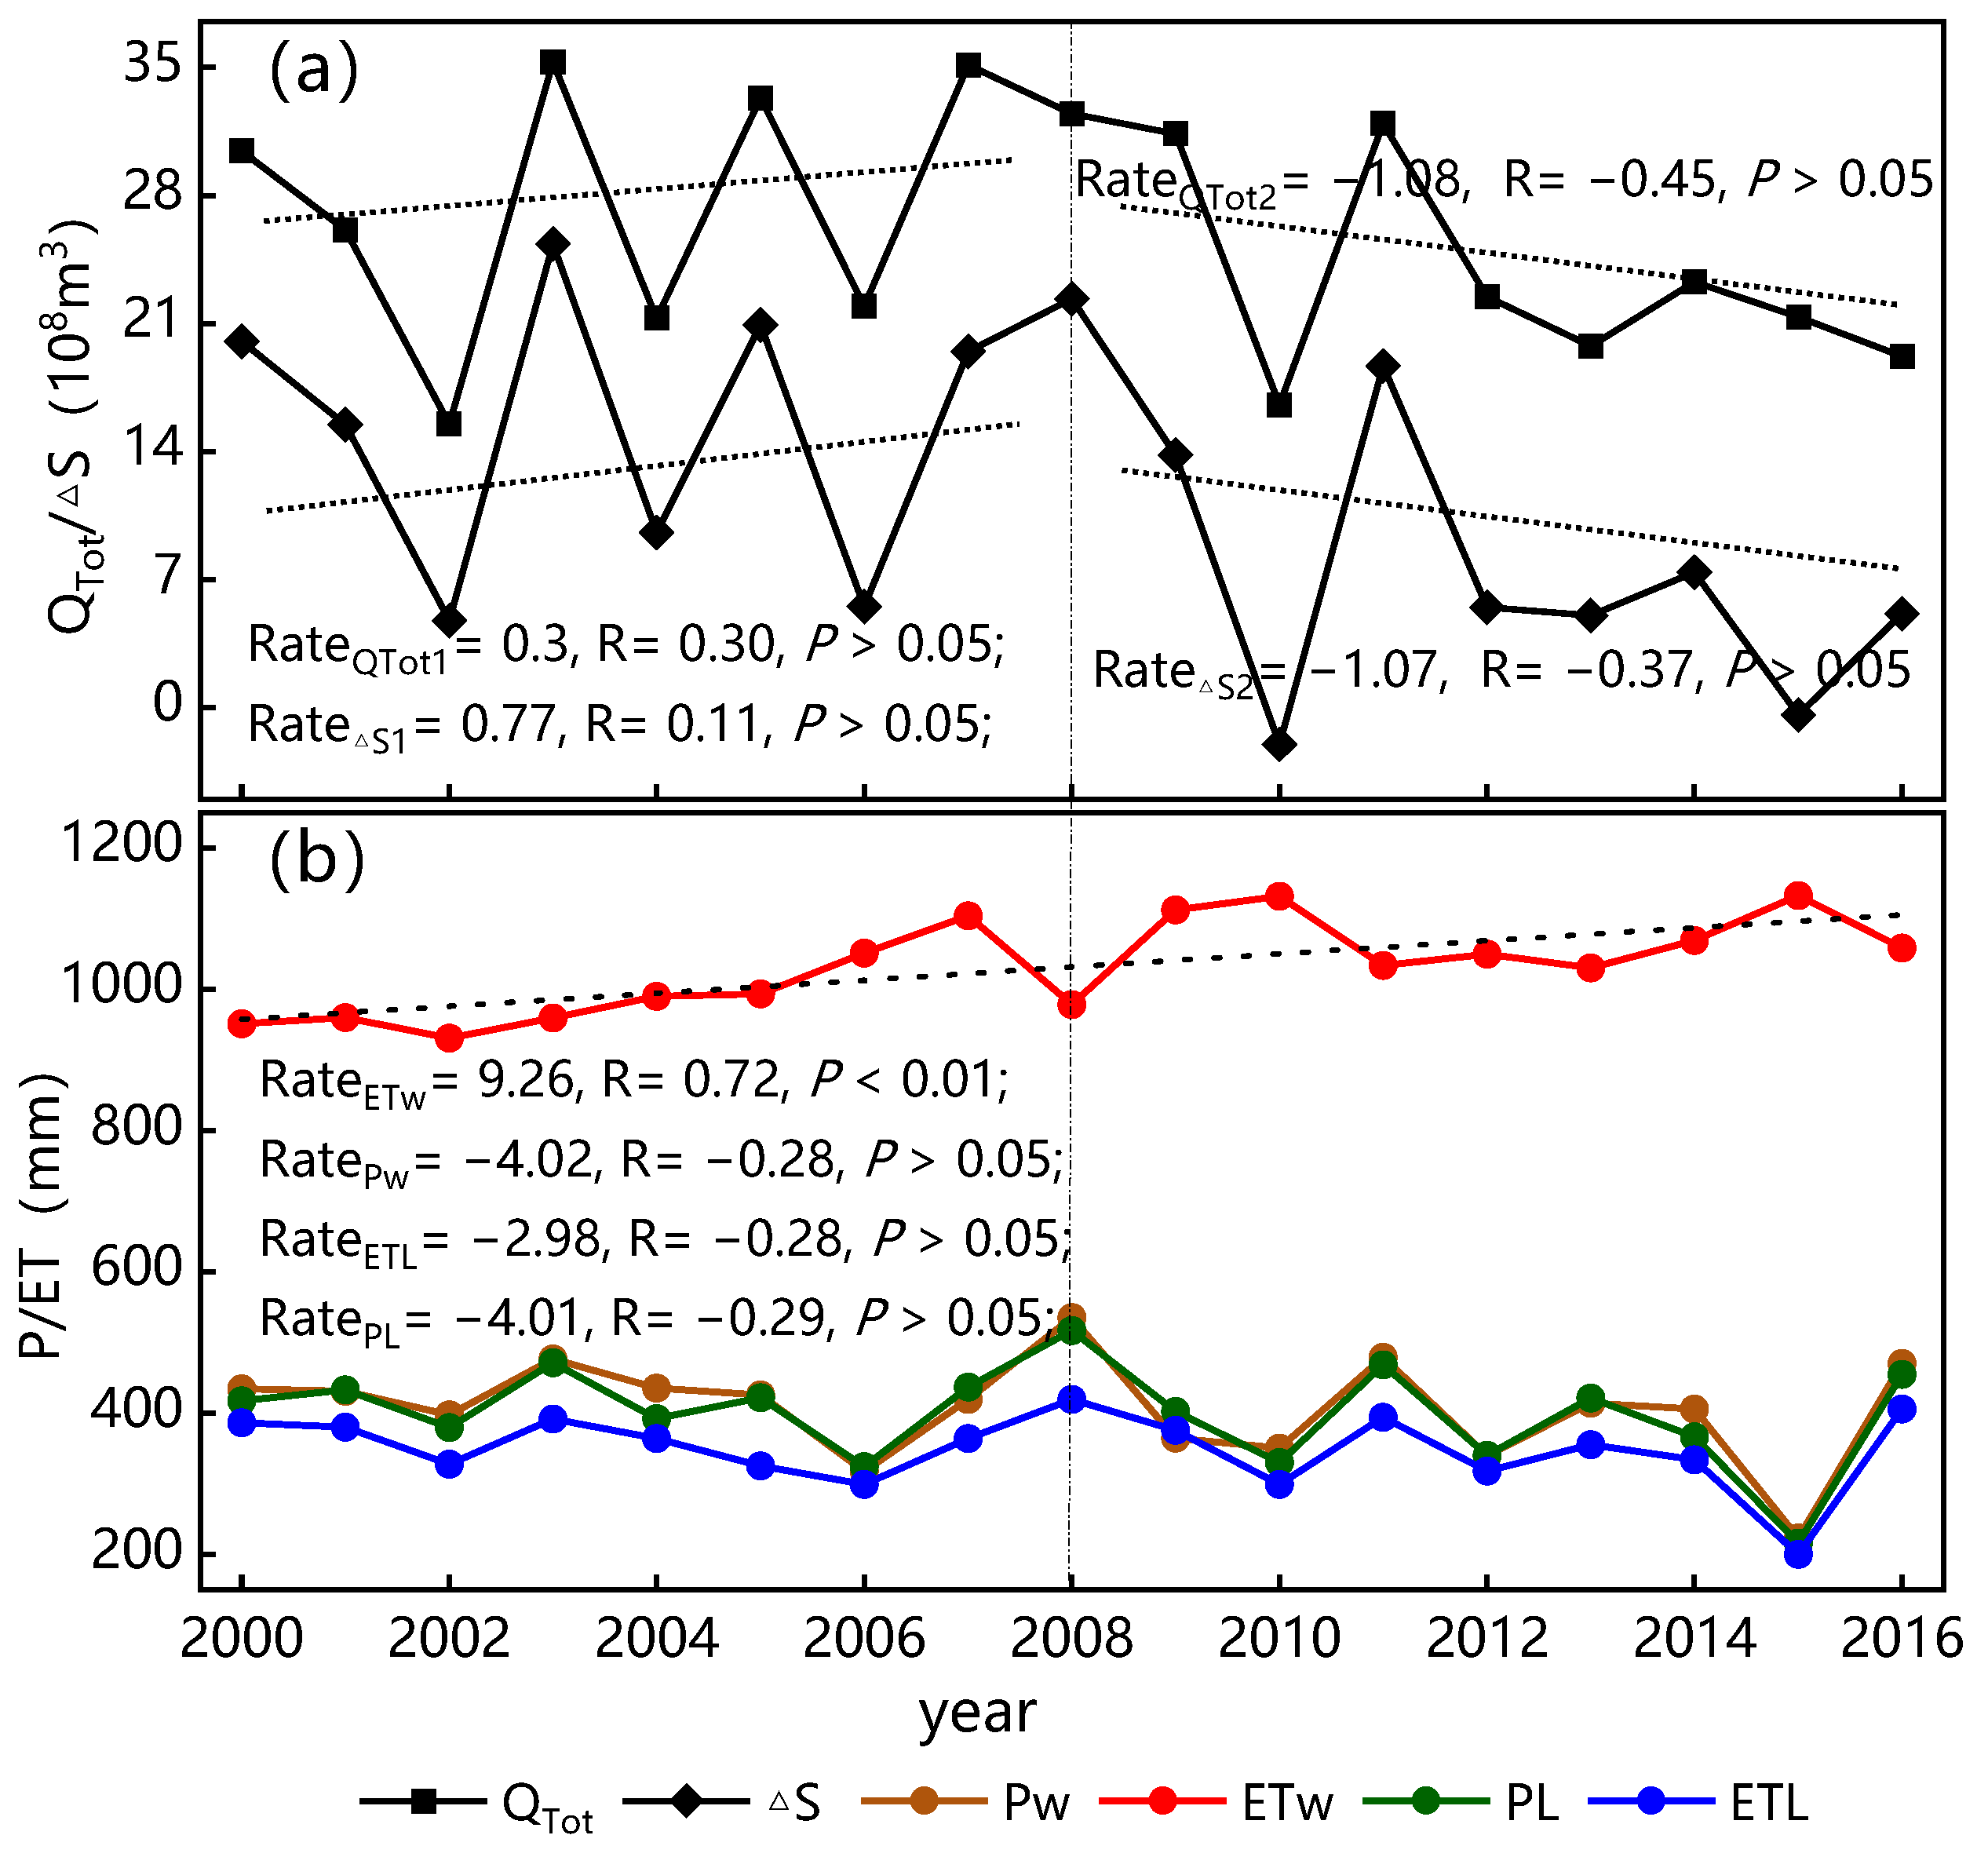
Figure 7 shows the interannual variation in the land surface (water area) precipitation (PL or PW), land surface (water area) evaporation (ETL or ETW), total lake inflow (QTot), and lake water storage capacity (ΔS) from 2000 to 2016. The difference in annual precipitation between the area of water and the land surface was small, both showed a non-significant downward trend, with a decline rate of approximately 4 mm/yr. On the other hand, ETW (annual average 1031.5 mm) increased significantly at a rate of 9.26 mm/yr and was much higher than ETL (annual average was 349.7 mm, and the rate of change was −3 mm/yr), which may have been related to the continuous increase in the temperature in the basin. The water source for ETW was sufficient, and the main controlling factor was temperature. As the temperature rose, ETW increased, but the water source for ETL was limited, and precipitation became the dominant factor. Both the annual lake inflow and the annual lake water storage capacity first increased and then decreased between 2000 and 2016, and the rates of change between 2000 and 2008 were 77 million m3/yr and 30 million m3/yr and then declined to −107 million m3/yr and −108 million m3/yr, respectively. Although the trend of ΔS and QTot was not statistically significant, the water storage capacity of Siling Co increased at an average rate of 1.16 billion m3/yr, and ΔS increase rate of decrease also caused the lake size from a rapid increase to a steady increase, which was similar to findings from previous studies [17]. However, overall, ΔS (−88 million m3/yr) exceeded the change in QTot (−41 million m3/yr), which was mainly due to the decrease in lake runoff caused by the decrease in precipitation in the basin, while the continuous increase in EW further reduced the lake water storage capacity.
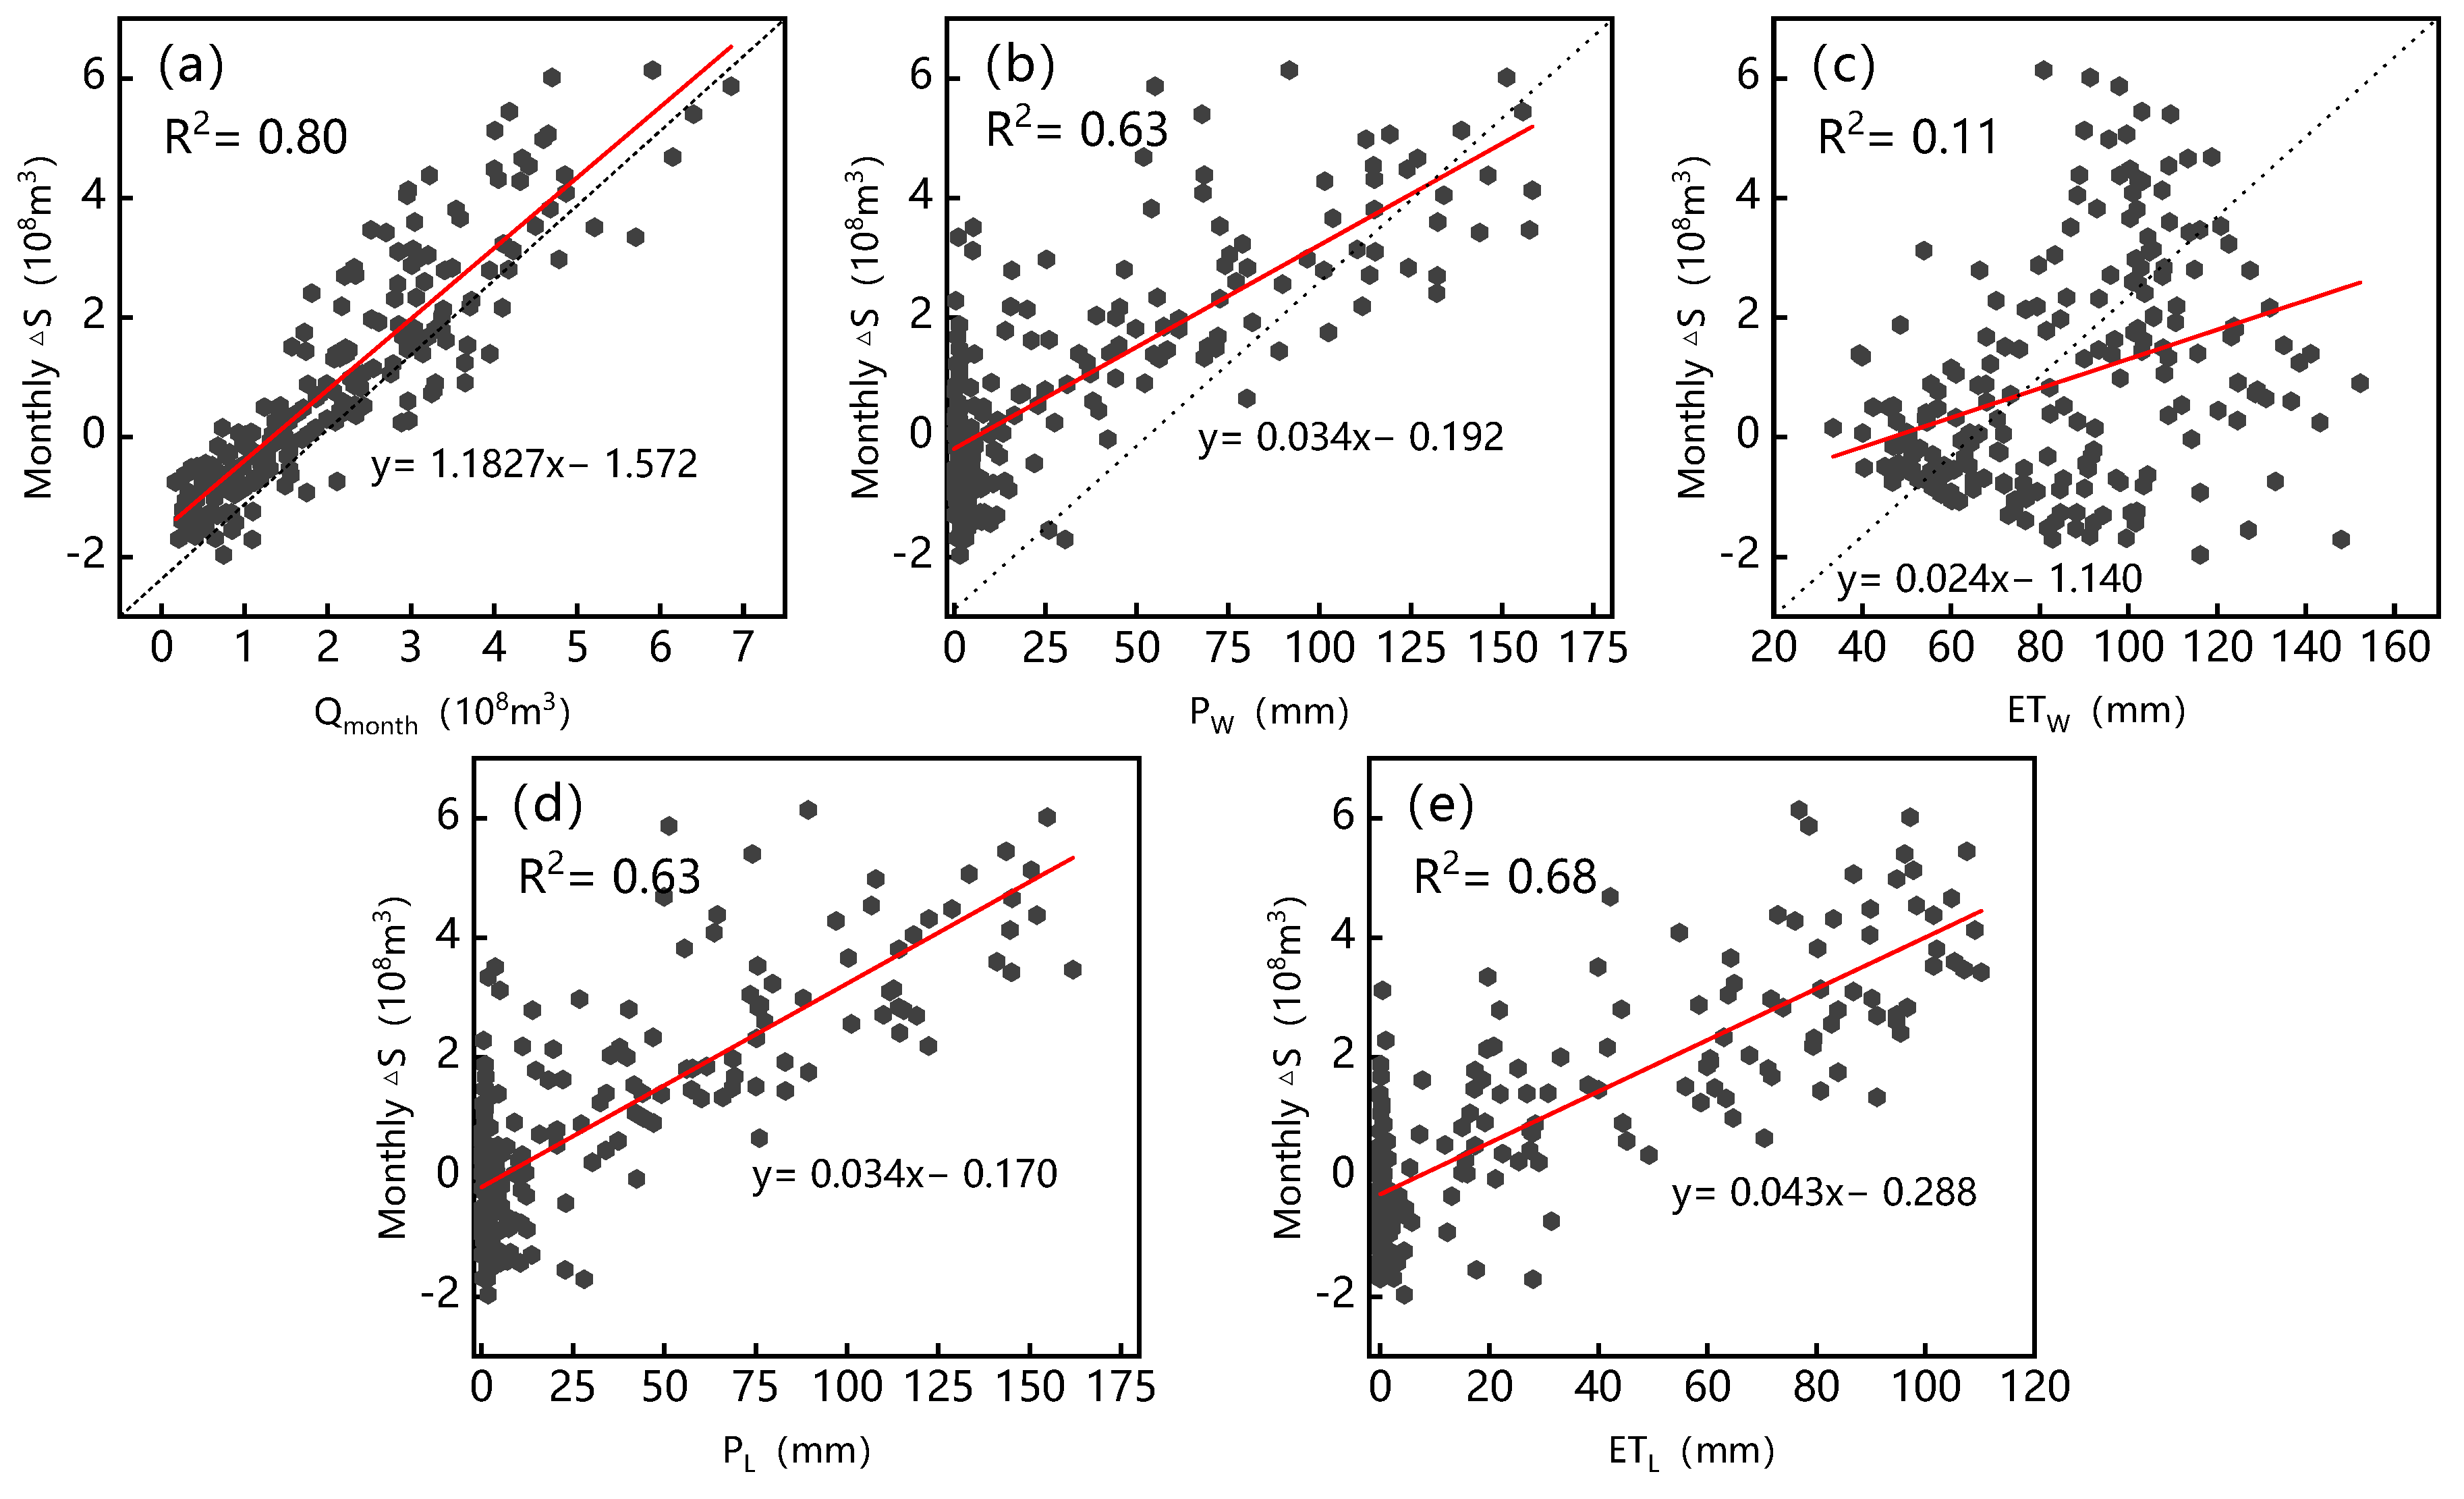
The water balance showed that lake surface precipitation/evaporation and lake inflow were the main factors affecting changes in lake water storage capacity. The diagram showing correlations of ΔS with Q, P, and ET was plotted based on the monthly data (Figure 8). Lake inflow, P, and EL were most strongly correlated with ΔS (R2 values were 0.80, 0.63, and 0.68, respectively), and there was no obvious correlation between Ew and ΔS, which indicated that lake inflow exerted the most significant impact on ΔS, followed by P, and the impact of EW was not significant. Analysis showed that EW has a continuous water supply, with small interannual fluctuations, and can be used as a stable indicator of output of water resources from the basin.
4.4. Characteristics of Variation in the Runoff Components of Lake Inflow
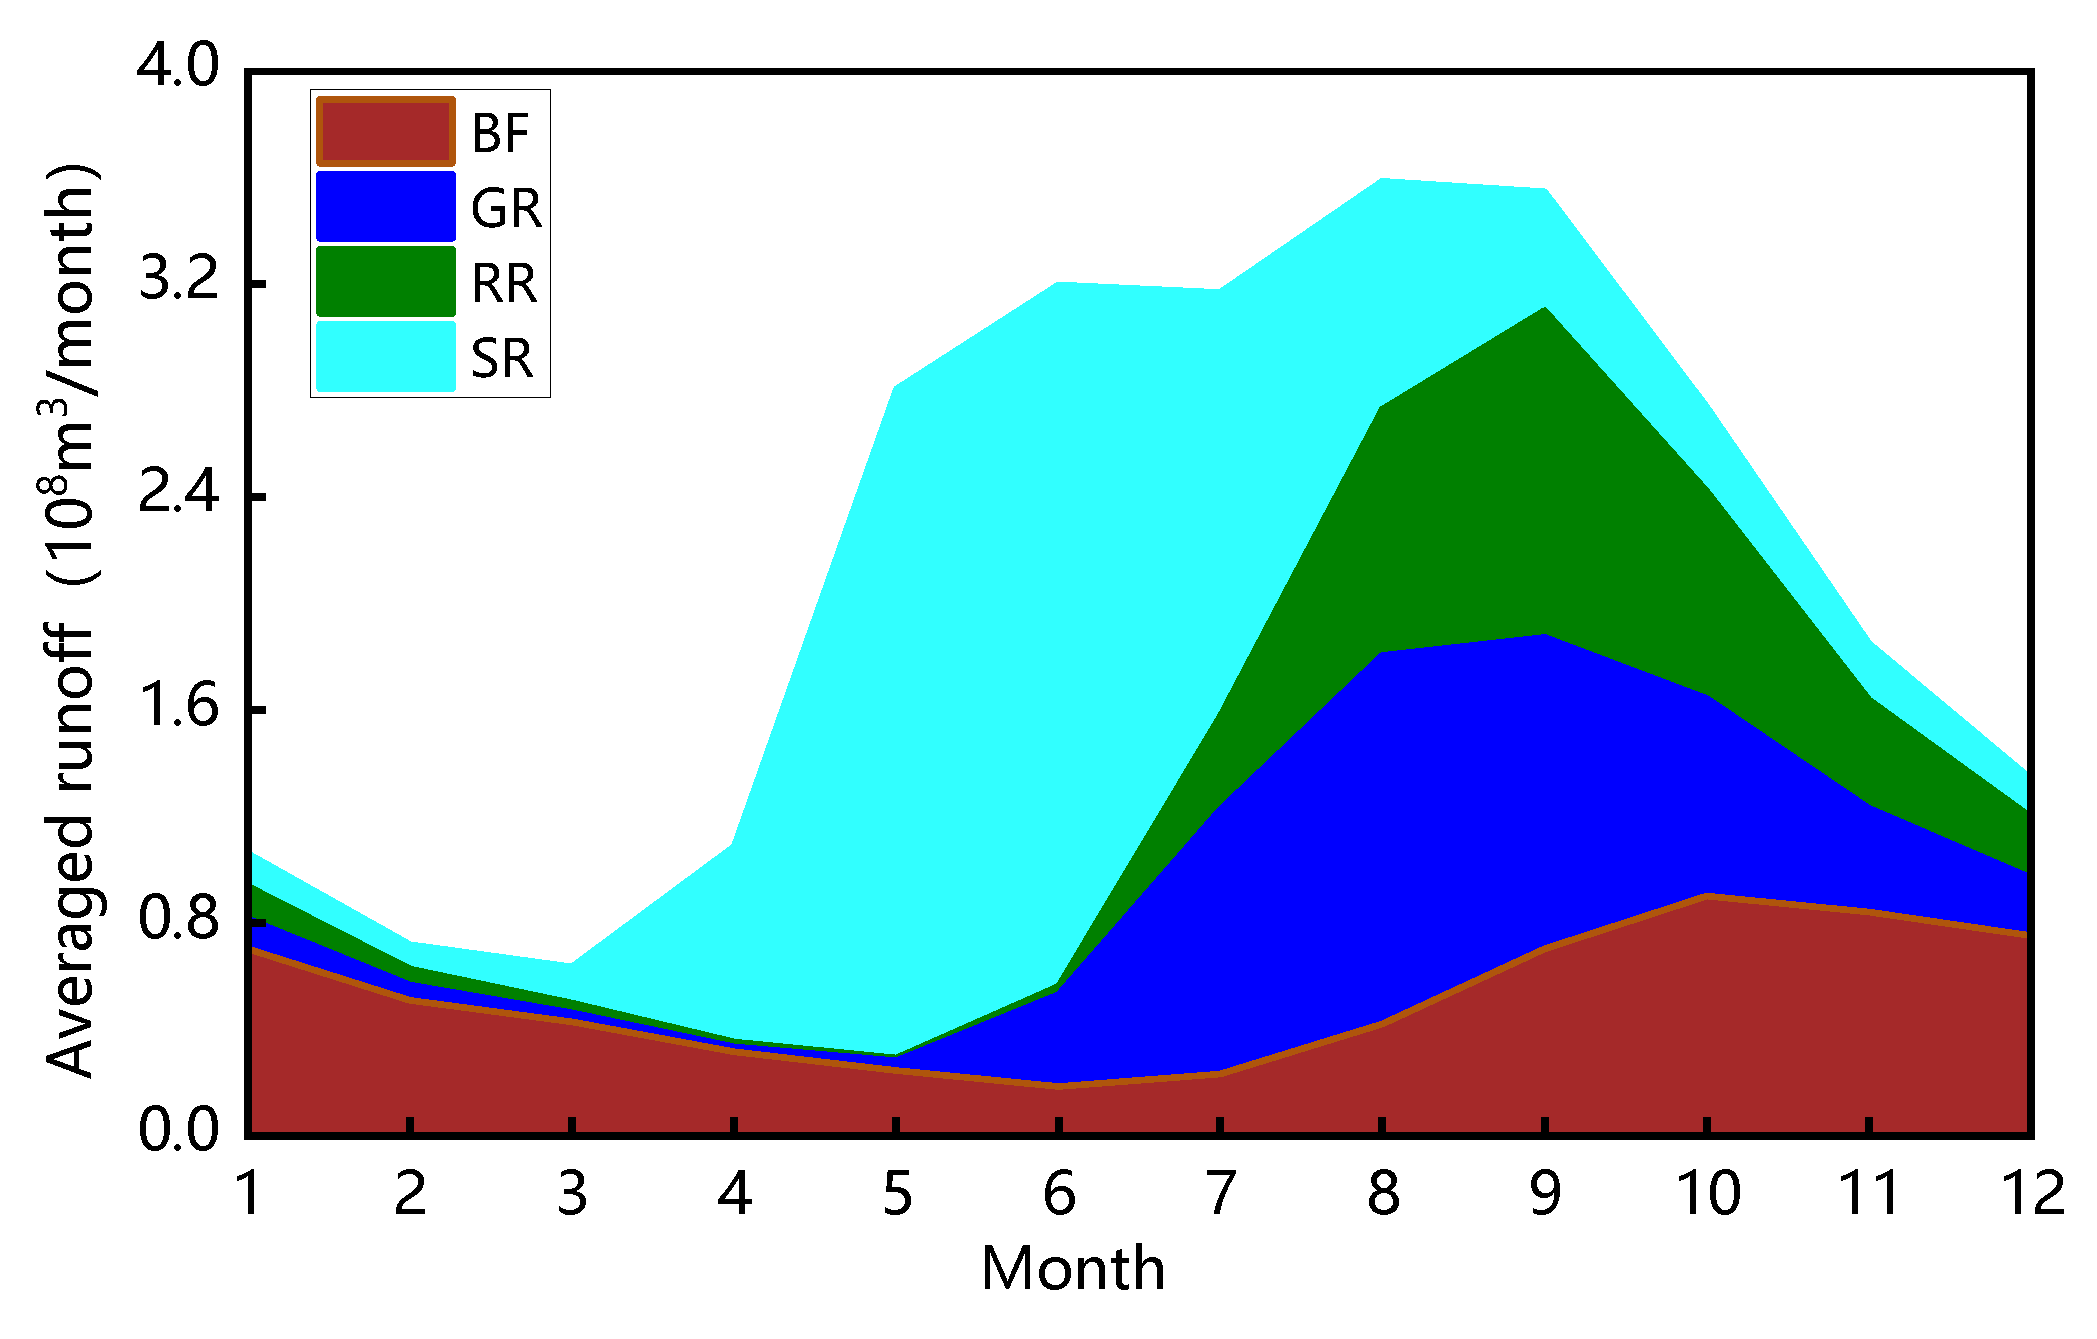
Based on the SPHY model of the Siling Co basin, the runoff into the lake was divided into the four components of GR, SR, RR, and BF. Figure 9 shows the interannual variation in each runoff component of total inflow during the simulation period. Figure 10 represents the seasonal distribution of each runoff component.
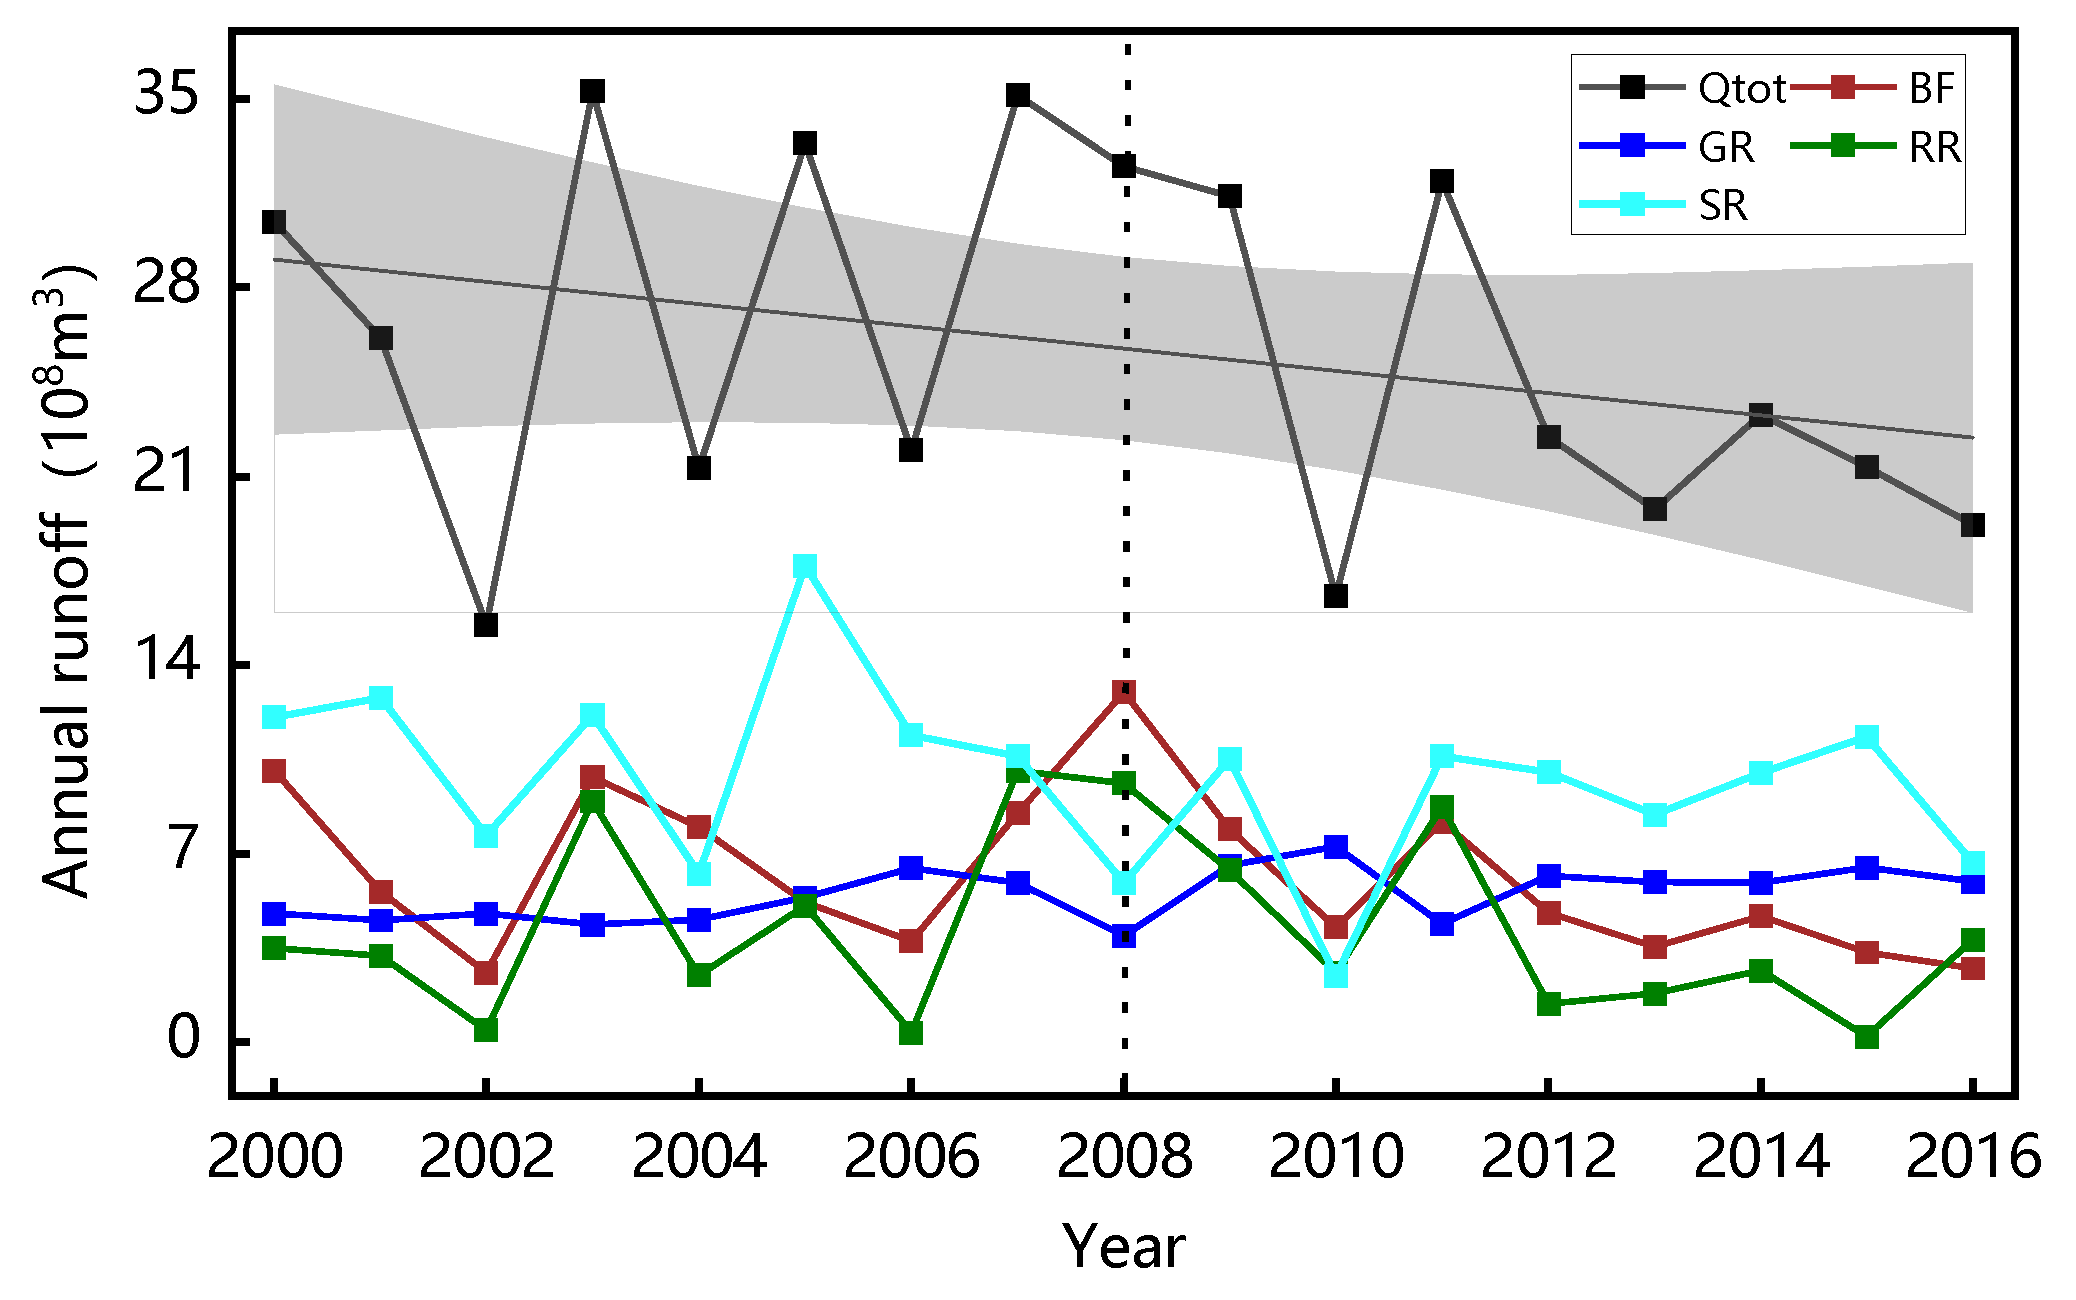
In general, the total runoff in Siling Co declined significantly between 2000 and 2016 with rates of decrease of 41 million m3/yr, and the variation trend of SR, RR, and BF is consistent with the total runoff. However, GR increased significantly at a rate of 11 million m3/yr (Figure 9). 2008 is the abrupt point of precipitation change trend through the analysis of regional precipitation characteristics. Compared with the total runoff data from 2000 to 2008, the average runoff from 2009 to 2016 declined by 471 million m3. The percentage contributions of BF and RR were significantly reduced, suggesting that reduced precipitation has a significant impact on BF and RR. Snowfall dropped along with precipitation, and the SR decreased by 187 million m3/yr before and after the precipitation abrupt change. By contrast, the contribution of glacial runoff to total runoff increased by 8.4%, which indicates that the recharge and regulation of runoff to the lake by glacial melting was more significant in the later years of the study period when precipitation was low. However, since the glacial resources are limited and can be greatly impacted by global warming, this water source regulation effect could be weakened [45].
Figure 10 shows that SR at the monthly scale mainly occurred from April to September and peaked in May or June, which is because snowmelt is affected by both temperature changes and snow storage. In April, the average temperature in the basin was 1.44 °C, and temperature gradually increased, so the snowmelt increased. The temperatures were highest in summer and fall, but snow cover was only present in the high-altitude areas at the edge of the basin, and the lack of snow reserves led to a decline in the melting rate. When the temperature dropped below 0 °C in winter, snowmelt mainly occurred near rivers at relatively low elevations. Therefore, different degrees of SR occur throughout the year. RR and precipitation were strongly correlated, but the overall lag was one month, which indicates that the regulation and storage by rivers in the basin is significant. Glacial runoff mainly occurred from June to October, and the changes were not large. The main reason may be that the morphology of the permanent glaciers is relatively stable, and the glacier-melting time is relatively long from the microscopic point of view. The BF is the basic component that maintains the water in the basin, and its distribution was the most stable during the year. However, due to the slow rate of groundwater movement, the BF also showed a significant lagging phenomenon compared with precipitation.
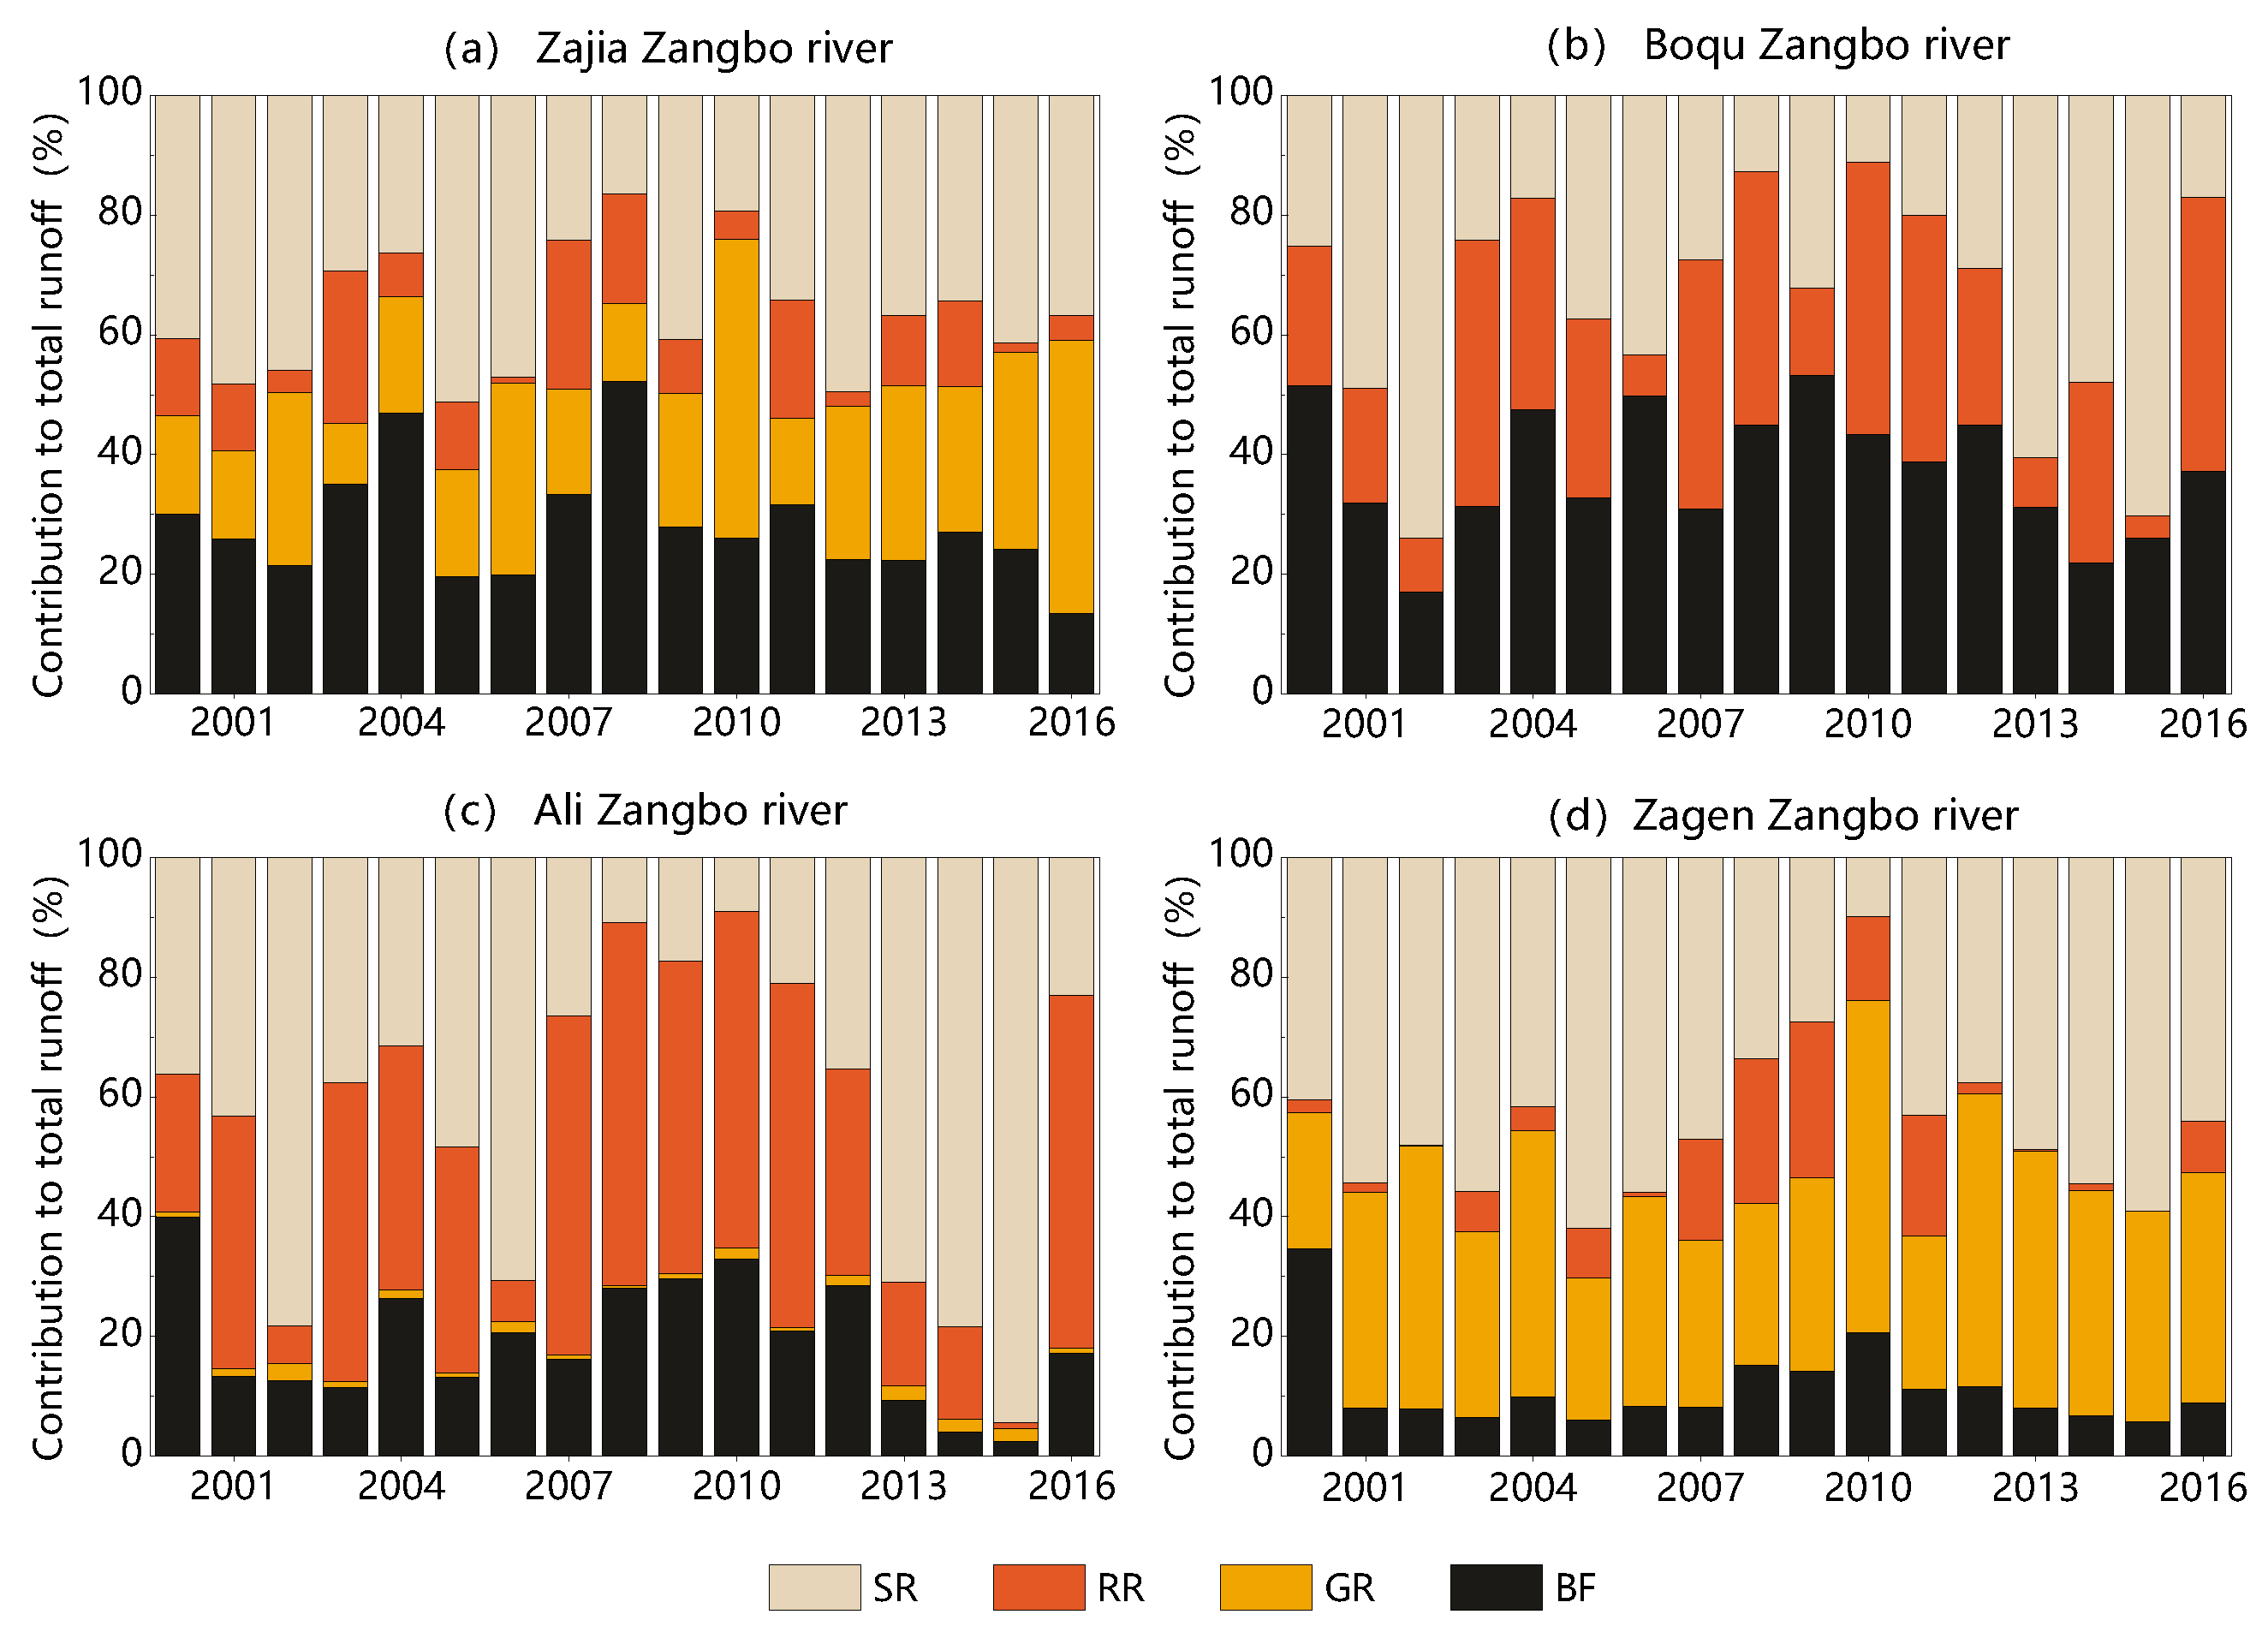
To quantitatively assess the runoff into Siling Co and the changes of the lake, an in-depth analysis of the four rivers was conducted. Runoff components and their contribution values show high variability, among the sub-basins (Table 4). For instance, Boqu Zangbo had the highest percentage of BF ingredients (39%), while GR was essentially limited to Zajia Zangbo and Zagen Zangbo (22% and 34%, respectively). By contrast, RR dominated Ali Zangbo’s total runoff, and SR was generally maintained at more than 30% in all four rivers. Previous studies have shown that the climate change response of hydrological processes was highly basin-scale and seasonal-scale dependent [46], e.g., up to around 45% of the baseflow component in the Tianshan Mountains inland region of northwest China [47]. Considering the impacts of soil aquifer thickness, soil freezing and thawing, glacial enrichment, and vegetation cover on the delayed groundwater response, certain regional characteristics of baseflow existed. In general, the contributions of BF, GR, RR, and SR to the runoff into the Siling Co were 24%, 22%, 16%, and 38%, respectively; SR was the component that contributed the most to runoff, and RR contributed the least.
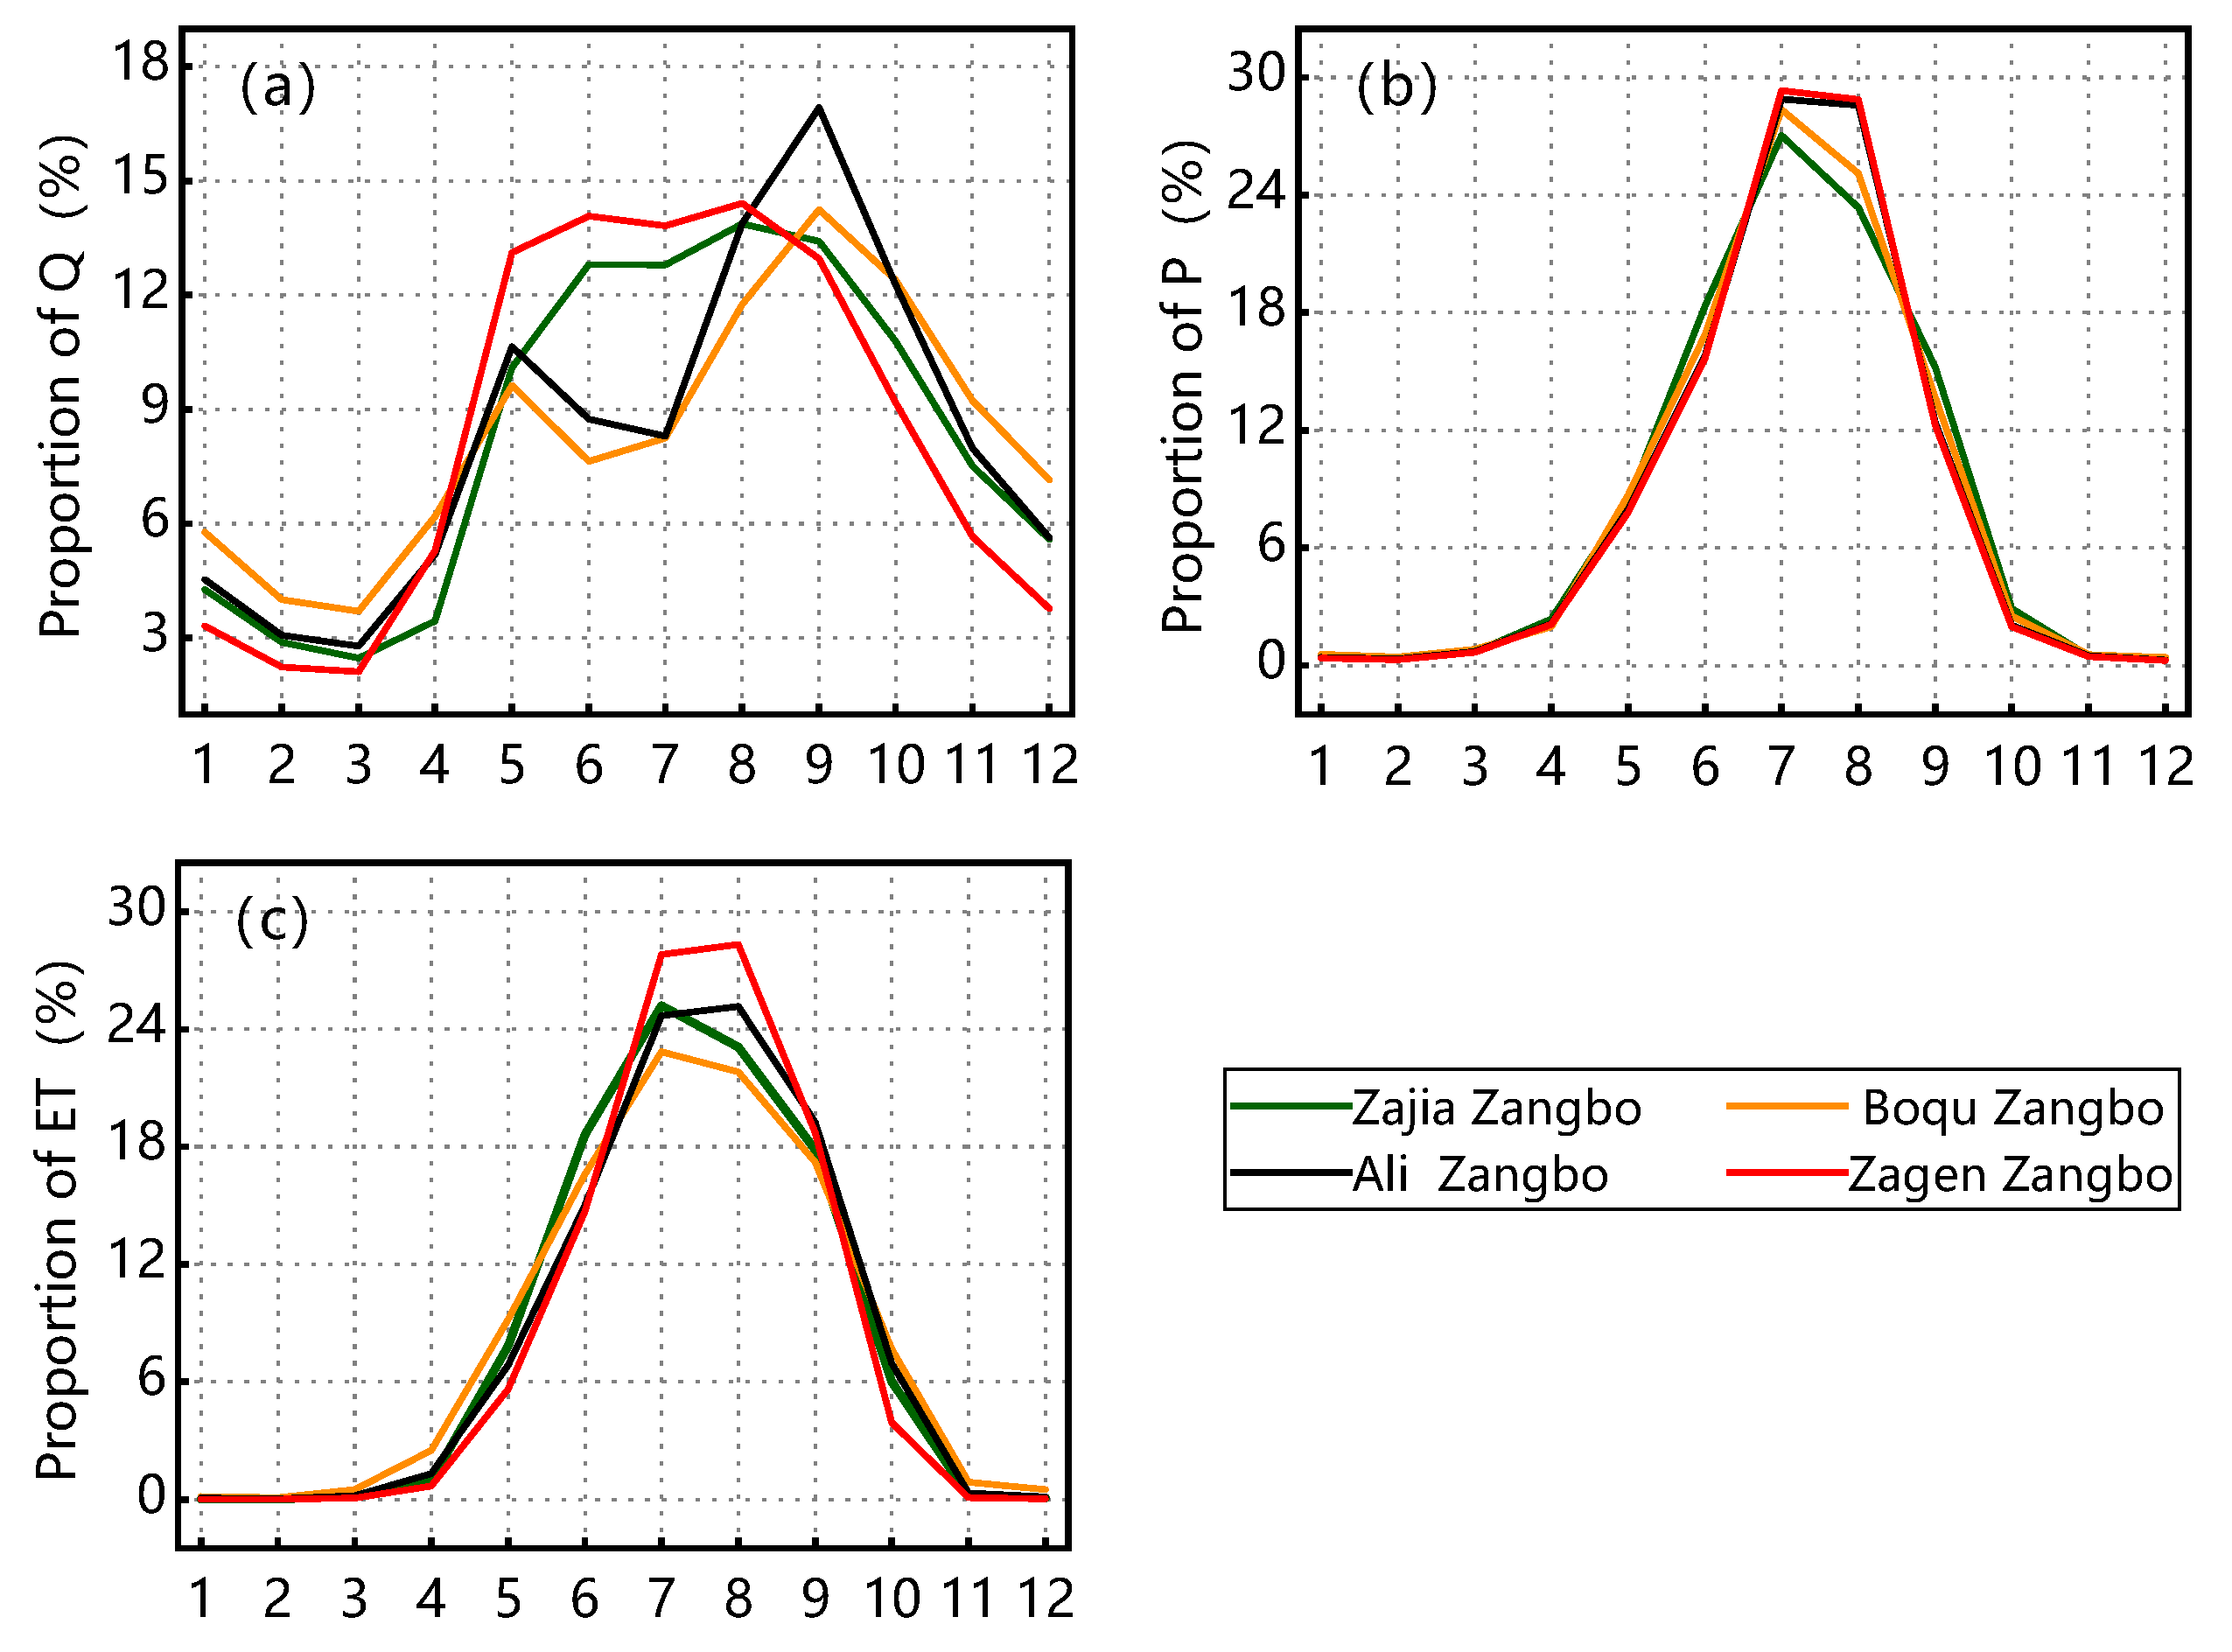
Moreover, Zajia Zangbo is the largest supply river to Siling Co, accounting for approximately 59% of the annual runoff. The contribution of the BF and SR to the runoff during the simulation period was relatively stable, with an average contribution of 65.8% (Table 4). The contribution of RR declined, while GR increased significantly (Figure 11a). The Boqu Zangbo basin has the smallest area and the lowest annual recharge. There are no glaciers in the basin and precipitation is the only water recharge source; the differences in BF, RR, and SR are small; and the BF is relatively stable. A small number of glaciers are found in the Ali Zangbo basin, the main water recharge sources for this basin were SR and RR, and their contribution to the total runoff ranged between 60% and 95%, with an average of 80%. However, the contribution of SR and RR shows considerable fluctuation. The analysis showed that the distinction between rainfall and snowfall in precipitation is subject to changes in temperature, and the SR showed a strong consistency with changes in temperature (Figure 5). For Zagen Zangbo, the dominant components of runoff were GR and SR, with an average contribution of 80.7%, while RR contributed the least, since the precipitation in this sub-basin falls to the ground mostly in the form of snow due to locally low temperatures, which are mainly caused by the high terrain and abundant glacial resources in the Zagen Zangbo basin. Figure 12a shows that the regulation and storage of glacial runoff makes the flows of ZajiaZangbo and Zagen Zangbo stabler than those of Boqu Zangbo and Ali Zangbo. The comparison shows that the pattern of runoff is similar among the four rivers; the peak occurred from May to September (Figure 12a) and accounted for 63.3% of the annual runoff into all four sub-basins.
4.5. Hydrological Responses to Climate Change
This paper mainly analyzed the impact of climate change on runoff from the two aspects of hypothetical climate change scenarios and future climate scenarios. Based on data measured from 2000 to 2014, a hypothetical climate change scenario was constructed by assuming that precipitation increases of 10% and temperature increases of 1 °C over the study period. Subsequently, considering the different shared socioeconomic pathways, 2000–2014 was used as the baseline period, and the forecast period was set to 2020–2050. Two models, SSP1-2.6 and SSP3-7.0 of MRI-ESM2-0 in CMIP6, were selected to construct future climate change scenarios by downscaling and data bias correction. Then, based on the precipitation and temperature driven hydrological process models under different climate scenarios, the runoff into Siling Co was simulated.
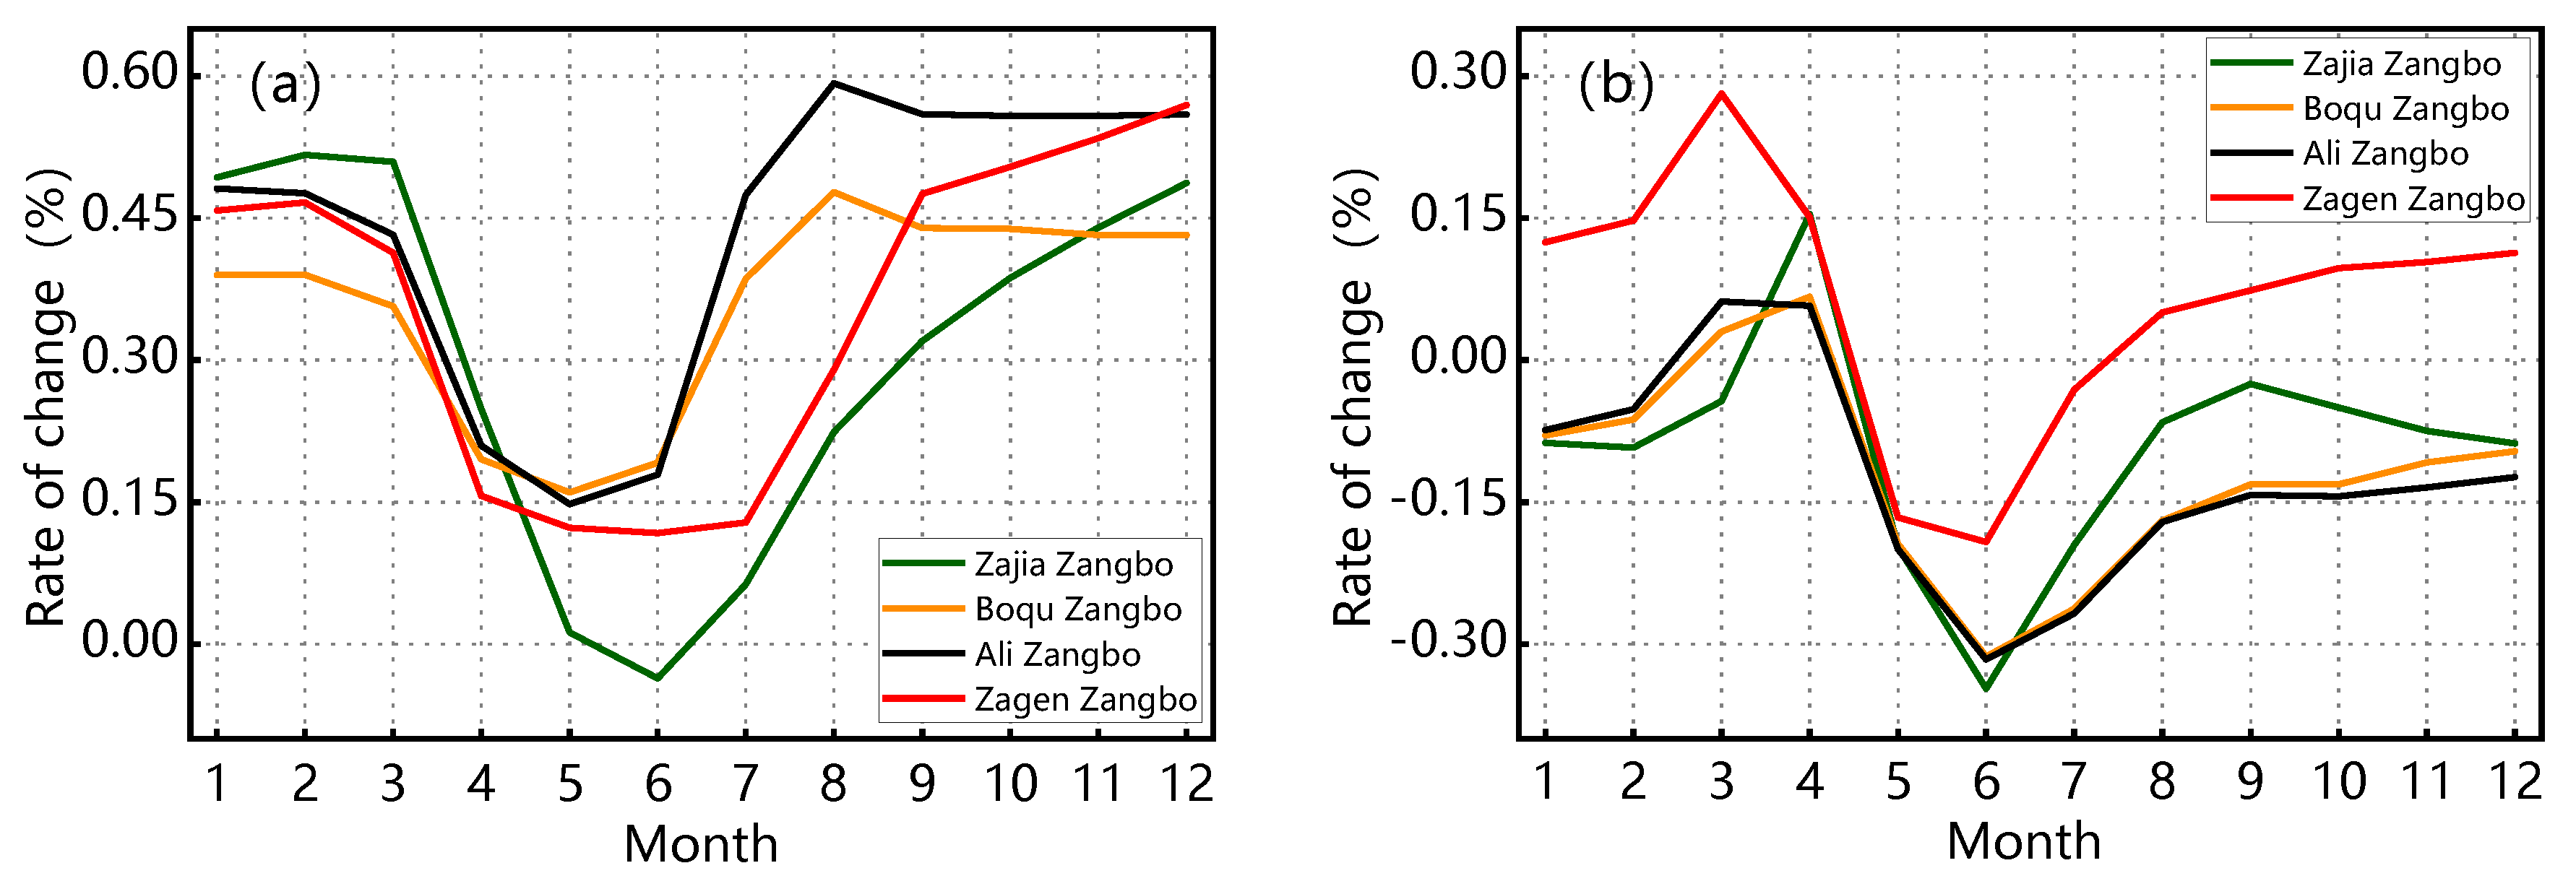
Figure 13 shows the seasonal variation in the inflows from the rivers in the lake area after the increase in precipitation and temperature. There was a positive correlation between precipitation and lake inflow, the impact of the warm and wet seasons on runoff was smaller than that of the cold seasons, and the increases in the inflow from Zajia Zangbo and Zagen Zangbo were smaller than those of the inflow from Boqu Zangbo and Ali Zangbo, which indicates that Zajia Zangbo and Zagen Zangbo have greater ability to regulate water sources and are more sensitive to temperature changes due to the presence of glaciers (Figure 13b). Overall, under certain temperature conditions, a 10% increase in precipitation was able to lead to a 28% increase in the total runoff into the basin, while a 1 °C increase in temperature could lead to a 10% decrease in runoff for a given precipitation. The ΔS-Q correlation showed that a 10% increase in precipitation and a 1 °C increase in temperature could lead to an increase of 329 million m3/yr and a decrease of 110 million m3/yr in the water storage capacity of Siling Co, respectively.
Based on the SSP1-2.6 and SSP3-7.0 scenarios of the MRI-ESM2-0 model, this study predicts future increases in average annual temperature in the Siling Co basin of 0.68 °C and 0.78 °C and rates of increase of 0.28 °C/decade and 0.41 °C/decade, respectively, compared with the baseline period; the predicted changes in average maximum temperature and average minimum temperature are similar to those for average air temperature, with rates of change ranging between 0.22 and 0.51 °C/decade (Table 5). At the watershed scale, precipitation is predicted to increase under different scenarios, resulting in an increase of 30–39 mm in the average runoff depth of the basin compared to that in the baseline period. This study also projects that the average evaporation in the basin will decline compared to that in the baseline period, perhaps because evaporation is not only related to temperature but also affected by precipitation. The MRI-ESM2-0 model predicts that precipitation will be mainly concentrated in summer, while the precipitation in spring and autumn is projected to be low, leading to insufficient evaporation in the basin. However, in general, evaporation is predicted to increase under the conditions of future climate warming.
Figure 14 shows the seasonal changes in RR, SR, GR, and BF in the basin from 2020 to 2050 relative to the baseline period. The annual average increase in BF and RR is projected to exceed 20 mm, while the SR is predicted to decrease by approximately 8.15 mm. The main reasons are that (1) runoff will generally increase due to increased rainfall, (2) snowfall will gradually decline due to warming conditions, and more precipitation will occur in the form of rainfall, resulting in a conversion of SR into BF and RR. In addition, it is expected that GR could continue to increase in the future, which is consistent with findings of Lutz et al. [48].
This study found seasonal variation in each runoff component to be relatively consistent under the SSP1-2.6 and SSP3-7.0 scenarios. RR usually shows a relatively large increase from August to October, which is the same as the pattern for rainfall but has a certain lag. The pattern for BF is similar to that for RR, i.e., it starts to increase gradually in August, reaches a peak in October, and then slowly declines until the following spring, which indicates that the underground aquifer in the Siling Co basin is relatively shallow, and the BF is greatly affected by precipitation. The effects of temperature increase on SR and GR are opposite. Other than the increase in SR in April, the annual SR will decline to varying degrees, with the largest decrease in June. In contrast, GR only shows a large increase from July to November, which is mainly caused by the large temperature increase in summer (Figure 14). In the long run, rising temperatures and melting of glaciers and snow under the climate change will have a significant impact on water availability [49], and the uneven seasonal distribution of precipitation could increase the risks of drought and flood disasters in the Siling Co basin during the warm and wet seasons, respectively.
5. Discussion
5.1. Uncertainty in the Simulation of Total Lake Inflow
Existing studies have demonstrated strong heterogeneity in the spatiotemporal variation in temperature and precipitation in alpine regions [50] and exploring high-precision meteorological data is the key challenge to meet to reduce the uncertainty in model input [51]. The main data used in the SPHY model-based Siling Co runoff simulation include temperature and precipitation, but the observed data are relatively scarce in the study area. Bilinear interpolation based on latitude, longitude and elevation information of meteorological stations can create some uncertainty in the runoff simulation by using averages in the grid as the model input. However, the overall elevation range of the basin is only 4500–5500 m, most areas are flat, with the exception of the high mountainous undulations at the boundary, and the local climate can be thought of as comparable; hence, the variation of the bilinear spatial interpolation of precipitation and temperature may not deviate significantly. For regions with scant or no data, studies have introduced virtual weather stations for watershed generalization and defined lapse rates of temperature and precipitation to obtain model inputs [47], or used gridded precipitation data products with downscaling and bias correction by means of spline interpolation and the quantile mapping method to extract model grids [29,46]. Apart from the consideration of meteorological data sources from adjacent watersheds and similar climatic conditions, product fusion based on actual measurement data has applicability in terms of model input. How to construct a multi-source fusion homogenized representative dataset applicable to a specific region is the focus of the next phase of research. In addition, model parameters constitute an important cause of uncertainty in runoff simulation. Precipitation in the Siling Co area mainly occurs in the form of rainfall and snowfall, so the critical temperature for distinguishing rainfall and snowfall is an important sensitive parameter that affects runoff classification, but it generally does not have a fixed value. The model often sets the critical temperature to a single value, which increases the uncertainty of runoff classification. In future studies, additional model tests should be conducted to explore the differences between rainfall and snowfall in different basins and to introduce statistically significant data for validation so that runoff classification is more realistic. In studies on GR, most scholars found that the DDF of glaciers on the TP ranges between 3 and 6 mm·°C−1·d−1, which is also the reason for the difference in the contribution of GR [29,35]. Therefore, for sensitive parameters, such as the DDF and Kx in the model, hydrological processes in the same area should be realistically analyzed in physical tests and the existing calibration method and sensitivity analysis to reveal the structure and function of the model and to explore the intrinsic relationships among the model parameters based on historical data and test results, which will thus improve the accuracy of parameter calibration. In the case of no data or lack of data for the alpine region, the characteristics of the underlying surface of the basin should be studied in depth, the model parameter transfer scheme should be constructed according to the similarity criterion, and the parameters should be calibrated in the experiments.
5.2. Uncertainty in Lake Water Storage Estimation
This study used the high-resolution water level change dataset for the TP as a validation indicator, which may have increased the uncertainty in lake water storage estimation. For many years, the lack of water level and water volume observation data from plateau lakes has posed certain difficulties for exploring the evolutionary patterns of plateau lakes and accurately predicting lake runoff changes, while the inverse simulation based on satellite data is being used as an effective approach for obtaining basic indicators for Siling Co. Multiple altimetry missions and land satellite data-based high-resolution water level change datasets for the TP were used to obtain the lake coastline positions and lake water level values, and field trials were carried out in two typical lakes. The theoretical uncertainty analysis was carried out based on high-resolution optical images, and the relative error was considered acceptable, which increases the accuracy of the validation data. However, this study did not use altimetry data before 2002, which may be the reason for the low value in the initial stage of the simulation (Figure 3). In general, the lake cumulative storage estimates were closer to the dataset results. In addition, related scholars have also studied Siling Co, such as Song et al. [52] who used satellite altimetry and optical image analysis and found that the total amount of water storage in the lake increased by 14.79 km3 in 2001–2011, while Liu et al. [53] integrated satellite images and glacial permafrost data, the results showed that the lake level rose by an average of 8.14 m during 2000–2015, and the water storage increased by 17.47 km3, both of which were slightly lower than the 15.4 km3 and 19.16 km3 during the same period of this paper. This phenomenon may be caused by the SPHY model’s reliance on precipitation and temperature as its primary driving factor, while neglecting meteorological elements such as insolation, wind speed, and barometric pressure in the basin results in inaccurate simulations of land surface evaporation of the basin, which raises the flow into the lake. On the other hand, lakes in the Siling Co basin are widely distributed, and the evolution of rivers and lakes and the regulation and storage of runoff by small lakes may become the factors affecting the changes in the water storage capacity of Siling Co. In this study, the four rivers were used as recharge sources for lake storage, and the effects of river-lake interactions were ignored, which may lead to estimation bias. Therefore, future studies should fully consider the uncertainty in the rainfall runoff process, establish the mechanisms linking the lakes in the alpine region, and explore the joint hydrological response of the lakes to climate change.
5.3. Uncertainty in Runoff Prediction
Driven by both precipitation and glacier melting, the hydrological response to future climate change in alpine regions largely depends on precipitation and temperature, and due to local climate and scenario assumption methods, some uncertainty could exist in precipitation predictions in future climate models. The MRI-ESM2-0 model used in this study has shown good adaptability in the TP region [54,55]. According to Zhu et al., MRI-ESM2-0 is one of the five best models for simulating the temporal and spatial variation in precipitation on the TP [56]. Cui et al. used CMIP6 multimodel data to simulate and evaluate temperature and precipitation on the TP and found that the MRI-ESM2-0 model can better illustrate the trend of precipitation in summer and temperature change in winter [57]. In general, precipitation and temperatures on the TP are consistently predicted to increase in the future, and the impact of different climate model scenarios on the results becomes increasingly significant with increases in emission intensity [58], which is similar to the results of this study. In addition, hypothetical climate change scenarios were added to predict runoff based on quantitative changes in temperature and precipitation. In addition to the proportional changes in temperature and precipitation, the seasonal pattern of climate signals and the frequency distribution of precipitation are also important reasons for the uncertainty in runoff simulation. To perform refined prediction and assessment of glacial melting, it is necessary to strengthen the monitoring of glaciers in alpine regions and explore the transformation of GR and the mechanism of replenishment of glaciers by precipitation. In addition, in the future, additional studies should be carried out on different climate modes of the CMIP6 model, and different downscaling and celibatarian methods should be used to search for meteorological data that match the temporal and spatial distribution of the alpine region.
6. Conclusions
In this study, an SPHY-based runoff model for the Siling Co basin was constructed using data for lakes on the TP. Comparison with the results of high-resolution water level and water volume change dataset indicated that the SPHY model can effectively simulate the runoff process in the study area. The main findings of this study are as follows.
- (1)
- The multiyear average temperature in the Siling Co basin fluctuated but increased overall at a rate of approximately 0.57 °C/decade, while annual precipitation significantly declined at a rate of 5.0 mm/yr. The precipitation at various meteorological stations varied significantly between 2000 and 2007 and consistently decreased after 2008, which became a direct driving factor affecting the lake inflow.
- (2)
- The lake inflow and the annual water storage capacity showed a strong positive correlation, and the average rates of change were 2.6 billion m3/yr and 1.2 billion m3/yr, respectively. During the study period, the lake water storage capacity experienced rapid to gentle increases.
- (3)
- The average contribution of GR to the total runoff was 22% and showed a significant increasing trend (11 million m3/yr). SR, RR, and BF are all projected to decline during the simulation period, with average contribution rates of 38%, 16%, and 24%, respectively.
- (4)
- A 10% increase in precipitation would lead to a 28% increase in the total runoff into the basin, while a 1 °C increase in temperature would lead to a 10% decrease in runoff. Under different future climate scenarios, the increases in temperature and precipitation could increase the average runoff depth in the basin by 30–39 mm, and the lake water storage capacity and area could further increase.
Despite the limitations of some uncertainties, we can clearly recognize the substantial role that glacial melting played in the growth of inland lakes on the TP and their sensitivity to climate warming. Future studies should take into account a variety of climate models and lake cluster linkage mechanisms, combine data from various remote sensing sources to precisely predict the eco-hydrological response of lake expansion and its surrounding environment, and offer solid justification for the scientific formulation of water resources management policies in highland regions.
Author Contributions
Conceptualization, Y.T. and J.H.; Formal analysis, D.Z.; Funding acquisition, J.H. and D.Z.; Methodology, J.H.; Resources, D.Z.; Software, Z.Y.; Visualization, Z.Y.; Writing—original draft, Y.T.; Writing—review and editing, Y.T. and Z.Y. All authors have read and agreed to the published version of the manuscript.
Funding
This research was supported by grants from the National Key Research and Development Project (Nos. 2021YFC3000202). The authors are thankful to the anonymous reviewers for their insightful criticism and recommendations.
Institutional Review Board Statement
Not applicable.
Informed Consent Statement
Not applicable.
Data Availability Statement
The datasets are available from the corresponding author on reasonable request.
Conflicts of Interest
The authors declare no conflict of interest.
References
- Immerzeel, W.W.; Lutz, A.F.; Andrade, M.; Bahl, A.; Biemans, H.; Bolch, T.; Hyde, S.; Brumby, S.; Davies, B.J.; Elmore, A.C.; et al. Importance and vulnerability of the world’s water towers. Nature 2020, 577, 364–369. [Google Scholar] [CrossRef] [PubMed]
- Bibi, S.; Wang, L.; Li, X.; Zhou, J.; Chen, D.; Yao, T. Climatic and associated cryospheric, biospheric, and hydrological changes on the Tibetan Plateau: A review. Int. J. Climatol. 2018, 38, e1–e17. [Google Scholar] [CrossRef] [Green Version]
- Wei, D.; Wei, Z.; Bintao, L.; Xi, N.; Bo, K. Water security and the countermeasures in South Asia based on the “Belt and Road” intiative. Adv. Earth Sci. 2018, 33, 687–701. [Google Scholar]
- Sun, H.; Zheng, D.; Yao, T.; Zhang, Y. Protection and Construction of the National Ecological Security Shelter Zone on Tibetan Plateau. J. Geogr. 2012, 67, 3–12. [Google Scholar]
- Zhao, Z.; Zhang, Y.; Liu, L.; Liu, F.; Zhang, H. Recent changes in wetlands on the Tibetan Plateau: A review. J. Geogr. Sci. 2015, 25, 879–896. [Google Scholar] [CrossRef] [Green Version]
- Zhang, G.; Yao, T.; Xie, H.; Kang, S.; Lei, Y. Increased mass over the Tibetan Plateau: From lakes or glaciers? Geophys. Res. Lett. 2013, 40, 2125–2130. [Google Scholar] [CrossRef]
- Zhu, L.; Xie, M.; Wu, Y. Quantitative analysis of lake area variations and the influence factors from 1971 to 2004 in the Nam Co basin of the Tibetan Plateau. Chin. Sci. Bull. 2010, 55, 1294–1303. [Google Scholar] [CrossRef]
- Zhang, L.; Su, F.; Yang, D.; Hao, Z.; Tong, K. Discharge regime and simulation for the upstream of major rivers over Tibetan Plateau. J. Geophys. Res. Atmos. 2013, 118, 8500–8518. [Google Scholar] [CrossRef]
- Yang, H.; Qi, J.; Xu, X.; Yang, D.; Lv, H. The regional variation in climate elasticity and climate contribution to runoff across China. J. Hydrol. 2014, 517, 607–616. [Google Scholar] [CrossRef]
- Li, H.; Xu, C.; Beldring, S.; Tallaksen, L.M.; Jain, S.K. Water Resources Under Climate Change in Himalayan Basins. Water Resour. Manag. 2016, 30, 843–859. [Google Scholar] [CrossRef]
- Duan, J.; Wang, L.; Ren, J.; Li, L. Progress in Glacier Variations in China and Its Sensitivity to Climatic Change during the Past Century. Prog. Geogr. 2009, 28, 231–237. [Google Scholar]
- Molina, J.; Lagüela, S.; Zazo, S. Methodology to Evaluate Aquifers Water Budget Alteration Due to Climate Change Impact on the Snow Fraction. Water Resour. Manag. 2021, 35, 2569–2583. [Google Scholar] [CrossRef]
- Gao, B.; Yang, D.; Zhao, T.; Yang, H. Changes in the eco-flow metrics of the Upper Yangtze River from 1961 to 2008. J. Hydrol. 2012, 448, 30–38. [Google Scholar] [CrossRef]
- Wang, X.; Chen, G.; Dai, X.; Zhao, J.; Liu, X.; Gao, Y.; Zhang, J.; Chen, Y.; Li, X.; Qin, W.; et al. Improved Process Management of Glacial Lake Outburst Flood Hazards by Integrating Modular Monitoring, Assessment, and Simulation. Water Resour. Manag. 2022, 36, 2343–2358. [Google Scholar] [CrossRef]
- Wang, Y.; Yang, H.; Gao, B.; Wang, T.; Qin, Y.; Yang, D. Frozen ground degradation may reduce future runoff in the headwaters of an inland river on the northeastern Tibetan Plateau. J. Hydrol. 2018, 564, 1153–1164. [Google Scholar] [CrossRef]
- Tao, C.; Xiaohua, H.; Liyun, D.; Hongyi, L.; Xiaodong, H.; Lin, X. Snow Cover Variation and Its Impacts over the Qinghai-Tibet Plateau. Proc. Chin. Acad. Sci. 2019, 34, 1247–1253. [Google Scholar]
- Hao, G.; Wu, B.; Zhang, L.; Fu, D.; Li, Y. Temporal and spatial variation analysis of the area of Siling Co lake in Tibet based on ESTARFM (1976–2014). J. Geo-Inf. Sci. 2016, 18, 833–846. [Google Scholar]
- Lei, Y.; Yao, T.; Bird, B.W.; Yang, K.; Zhai, J.; Sheng, Y. Coherent lake growth on the central Tibetan Plateau since the 1970s: Characterization and attribution. J. Hydrol. 2013, 483, 61–67. [Google Scholar] [CrossRef]
- Zhu, L.; Xie, M.; Wu, Y. Quantitative analysis of lake area variation and its causes in Namco, Tibet (1971 to 2004). Chin. Sci. Bull. 2010, 55, 1789–1798. [Google Scholar] [CrossRef]
- Yang, R.; Zhu, L.; Wang, J.; Ju, J.; Ma, Q.; Turner, F.; Guo, Y. Spatiotemporal variations in volume of closed lakes on the Tibetan Plateau and their climatic responses from 1976 to 2013. Clim. Change 2017, 140, 621–633. [Google Scholar] [CrossRef]
- Qiao, B.; Zhu, L.; Yang, R. Temporal-spatial differences in lake water storage changes and their links to climate change throughout the Tibetan Plateau. Remote Sens. Environ. 2019, 222, 232–243. [Google Scholar] [CrossRef]
- Zhang, G.; Wang, M.; Zhou, T.; Chen, W. Progress in remote sensing monitoring of lake area, water level, and volume changes on the Tibetan Plateau. J. Remote Sens. 2022, 26, 115–125. [Google Scholar]
- Meng, K.; Shi, X.; Wang, E.; Liu, F. Selin Co Lake in the central Tibetan Plateau has been rising rapidly and melting glaciers in recent 10 years. Chin. Sci. Bull. 2012, 57, 668–676. [Google Scholar]
- Zhou, J.; Wang, L.; Zhong, X.; Yao, T.; Qi, J.; Wang, Y.; Xue, Y. Quantifying the major drivers for the expanding lakes in the interior Tibetan Plateau. Sci. Bull. 2022, 67, 474–478. [Google Scholar] [CrossRef]
- Zhou, J.; Wang, L.; Zhang, Y.; Guo, Y.; Li, X.; Liu, W. Exploring the water storage changes in the largest lake (Selin Co) over the Tibetan Plateau during 2003–2012 from a basin-wide hydrological modeling. Water Resour. Res. 2015, 51, 8060–8086. [Google Scholar] [CrossRef] [Green Version]
- Zhou, J.; Ding, Y.; Wu, J.; Liu, F.; Wang, S. Streamflow generation in semi-arid, glacier-covered, montane catchments in the upper Shule River, Qilian Mountains, northeastern Tibetan plateau. Hydrol. Process. 2021, 35, e14276. [Google Scholar] [CrossRef]
- Xu, L.; Liu, J.; Jin, C.; Wang, A.; Guan, D.; Wu, J.; Yuan, F. Advances in basic flow segmentation methods for hydrological processes. Chin. J. Appl. Ecol. 2011, 22, 3073–3080. [Google Scholar]
- Gan, R.; Chen, Z. Simulation of runoff process and variation characteristics in Shaying River Basin. South-North Water Transf. Water ST 2021, 19, 83–91. [Google Scholar]
- Singh, V.; Jain, S.K.; Shukla, S. Glacier change and glacier runoff variation in the Himalayan Baspa river basin. J. Hydrol. 2021, 593, 125918. [Google Scholar] [CrossRef]
- Luo, Y.; Arnold, J.; Liu, S.; Wang, X.; Chen, X. Inclusion of glacier processes for distributed hydrological modeling at basin scale with application to a watershed in Tianshan Mountains, northwest China. J. Hydrol. 2013, 477, 72–85. [Google Scholar] [CrossRef]
- Guo, J.; Li, Z.; Li, F.; Zhang, S. Evaluation on snow coverage and snow depth simulated by VIC-CAS model based on multi-source remote sensing data in mountainous upper reach of the Shule River basin. J. Glaciol. Geocryol. 2021, 43, 650–661. [Google Scholar]
- Huss, M.; Farinotti, D.; Bauder, A.; Funk, M. Modelling runoff from highly glacierized alpine drainage basins in a changing climate. Hydrol. Process. 2008, 22, 3888–3902. [Google Scholar] [CrossRef]
- Terink, W.; Lutz, A.F.; Simons, G.W.H.; Immerzeel, W.W.; Droogers, P. SPHY v2.0: Spatial Processes in Hydrology. Geosci. Model Dev. 2015, 8, 2009–2034. [Google Scholar] [CrossRef] [Green Version]
- Latif, Y.; Ma, Y.; Ma, W.; Muhammad, S.; Adnan, M.; Yaseen, M.; Fealy, R. Differentiating Snow and Glacier Melt Contribution to Runoff in the Gilgit River Basin via Degree-Day Modelling Approach. Atmosphere 2020, 11, 1023. [Google Scholar] [CrossRef]
- Wu, J.; Li, H.; Zhou, J.; Tai, S.; Wang, X. Variation of Runoff and Runoff Components of the Upper Shule River in the Northeastern Qinghai–Tibet Plateau under Climate Change. Water 2021, 13, 3357. [Google Scholar] [CrossRef]
- Zhang, G.; Xie, H.; Yao, T.; Kang, S. Water balance estimation of top 10 Lakes in China based on ICESat and Landsat. Chin. Sci. Bull. 2013, 58, 2664–2678. [Google Scholar]
- Guo, W.; Liu, S.; Xu, J.; Wu, L.; Shangguan, D.; Yao, X.; Wei, J.; Bao, W.; Yu, P.; Liu, Q.; et al. The second Chinese glacier inventory: Data, methods and results. J. Glaciol. 2015, 61, 357–372. [Google Scholar] [CrossRef] [Green Version]
- Liu, S.; Yao, X.; Guo, W.; Xu, J.; Shang, G.; Wei, J.; Bao, W.; Wu, L. The contemporary glaciers in China based on the Second Chinese Glacier Inventory. J. Geogr. 2015, 70, 3–16. [Google Scholar]
- Fatima, E.; Hassan, M.; Hasson, S.U.; Ahmad, B.; Ali, S.S.F. Future water availability from the western Karakoram under representative concentration pathways as simulated by CORDEX South Asia. Theor. Appl. Climatol. 2020, 141, 1093–1108. [Google Scholar] [CrossRef]
- Li, S.; Du, T.; Gippel, C.J. A Modified Fu (1981) Equation with a Time-varying Parameter that Improves Estimates of Inter-annual Variability in Catchment Water Balance. Water Resour. Manag. 2022, 36, 1645–1659. [Google Scholar] [CrossRef]
- Lei, Y.; Yao, T.; Yang, K.; Sheng, Y.; Kleinherenbrink, M.; Yi, S.; Bird, B.W.; Zhang, X.; Zhu, L.; Zhang, G. Lake seasonality across the Tibetan Plateau and their varying relationship with regional mass changes and local hydrology. Geophys. Res. Lett. 2017, 44, 892–900. [Google Scholar] [CrossRef] [Green Version]
- Phan, V.H.; Lindenbergh, R.; Menenti, M. ICESat derived elevation changes of Tibetan lakes between 2003 and 2009. Int. J. Appl. Earth Obs. Geoinf. 2012, 17, 12–22. [Google Scholar] [CrossRef]
- Jiang, L.; Nielsen, K.; Andersen, O.B.; Bauer-Gottwein, P. Monitoring recent lake level variations on the Tibetan Plateau using CryoSat-2 SARIn mode data. J. Hydrol. 2017, 544, 109–124. [Google Scholar] [CrossRef] [Green Version]
- Li, X.; Long, D.; Huang, Q.; Han, P.; Zhao, F.; Wada, Y. High-temporal-resolution water level and storage change data sets for lakes on the Tibetan Plateau during 2000–2017 using multiple altimetric missions and Landsat-derived lake shoreline positions. Earth Syst. Sci. Data 2019, 11, 1603–1627. [Google Scholar] [CrossRef] [Green Version]
- Yu, X.; Yang, H.; Li, S. An Improved Conceptual Model Quantifying the Effect of Climate Change and Anthropogenic Activities on Vegetation Change in Arid Regions. Remote Sens. 2019, 11, 2110. [Google Scholar] [CrossRef] [Green Version]
- Khanal, S.; Lutz, A.F.; Kraaijenbrink PD, A.; van den Hurk, B.; Yao, T.; Immerzeel, W.W. Variable 21st Century Climate Change Response for Rivers in High Mountain Asia at Seasonal to Decadal Time Scales. Water Resour. Res. 2021, 57, e2020WR029266. [Google Scholar] [CrossRef]
- Luo, Y.; Arnold, J.; Allen, P.; Chen, X. Baseflow simulation using SWAT model in an inland river basin in Tianshan Mountains, Northwest China. Hydrol. Earth Syst. Sci. 2012, 16, 1259–1267. [Google Scholar] [CrossRef] [Green Version]
- Lutz, A.F.; Immerzeel, W.W.; Shrestha, A.B.; Bierkens, M.F.P. Consistent increase in High Asia’s runoff due to increasing glacier melt and precipitation. Nat. Clim. Change 2014, 4, 587–592. [Google Scholar] [CrossRef] [Green Version]
- White, C.J.; Tanton, T.W.; Rycroft, D.W. The Impact of Climate Change on the Water Resources of the Amu Darya Basin in Central Asia. Water Resour. Manag. 2014, 28, 5267–5281. [Google Scholar] [CrossRef]
- Liu, Z.; Yang, M.; Wan, G.; Wang, X. The Spatial and Temporal Variation of Temperature in the Qinghai-Xizang (Tibetan) Plateau during 1971–2015. Atmosphere 2017, 8, 214. [Google Scholar] [CrossRef] [Green Version]
- Muhammad, W.; Yang, H.; Lei, H.; Muhammad, A.; Yang, D. Improving the Regional Applicability of Satellite Precipitation Products by Ensemble Algorithm. Remote Sens. 2018, 10, 577. [Google Scholar] [CrossRef] [Green Version]
- Song, C.; Huang, B.; Ke, L. Inter-annual changes of alpine inland lake water storage on the Tibetan Plateau: Detection and analysis by integrating satellite altimetry and optical imagery. Hydrol. Process. 2014, 28, 2411–2418. [Google Scholar] [CrossRef]
- Liu, W.; Liu, H.; Xie, C.; Zhao, J.; Liu, G.; Wang, W.; Zhang, Q.; Zhao, Q. Dynamic changes in lakes and potential drivers within the Selin Co basin, Tibetan Plateau. Environ. Earth Sci. 2022, 81, 1–17. [Google Scholar] [CrossRef]
- Zhang, X.; Chen, H. Assessment of warm season precipitation in the eastern slope of the Tibetan Plateau by CMIP6 models. Adv. Clim. Change Res. 2022, 18, 129–141. [Google Scholar]
- Chen, W.; Jiang, D.; Wang, X. Evaluation and Projection of CMIP6 Models for Climate over the Qinghai-Xizang (Tibetan) Plateau. Plateau Meteorol. 2021, 40, 1455–1469. [Google Scholar]
- Zhu, Y.; Yang, S. Evaluation of CMIP6 for historical temperature and precipitation over the Tibetan Plateau and its comparison with CMIP5. Adv. Clim. Change Res. 2020, 11, 239–251. [Google Scholar] [CrossRef]
- Cui, T.; Li, C.; Tian, F. Evaluation of Temperature and Precipitation Simulations in CMIP6 Models over the Tibetan Plateau. Earth Space Sci. 2021, 8, e2020EA001620. [Google Scholar] [CrossRef]
- Zhang, J.; Lun, Y.; Liu, L.; Liu, Y.; Li, X.; Xu, Z. CMIP6 evaluation and projection of climate change in Tibetan Plateau. J. Beijing Norm. Univ. (Nat. Sci.) 2022, 58, 77–89. [Google Scholar]
Figure 1.
Overview of the Siling Co basin and the locations of meteorological stations.

Figure 2.
Spatial distribution of land use types and physical parameters in different soil layers.

Figure 3.
Changes of lake water storage in Siling Co (Based on May 2001).

Figure 4.
Comparison between actual and simulated accumulated lake water storage during the simulation period.
Figure 4.
Comparison between actual and simulated accumulated lake water storage during the simulation period.

Figure 5.
Temperature variation of meteorological stations in Siling Co. (a) Annual maximum temperature; (b) Annual minimum temperature; (c) Annual average temperature; (d) Monthly average temperature.
Figure 5.
Temperature variation of meteorological stations in Siling Co. (a) Annual maximum temperature; (b) Annual minimum temperature; (c) Annual average temperature; (d) Monthly average temperature.

Figure 6.
Precipitation variation of meteorological stations in Siling Co. (a) Annual precipitation; (b) Monthly precipitation.
Figure 6.
Precipitation variation of meteorological stations in Siling Co. (a) Annual precipitation; (b) Monthly precipitation.

Figure 7.
The interannual variation of the (a) total lake inflow (QTot), lake water storage capacity (ΔS) and (b) precipitation (PL or PW), evaporation (ETL or ETW) during the simulated period.
Figure 7.
The interannual variation of the (a) total lake inflow (QTot), lake water storage capacity (ΔS) and (b) precipitation (PL or PW), evaporation (ETL or ETW) during the simulated period.

Figure 8.
Correlation between lake storage and (a) total lake inflow, (b) water area precipitation, (c) water area evaporation, (d) land surface precipitation, (e) land surface evaporation.
Figure 8.
Correlation between lake storage and (a) total lake inflow, (b) water area precipitation, (c) water area evaporation, (d) land surface precipitation, (e) land surface evaporation.

Figure 9.
Interannual variation of lake inflow and its runoff components during the simulated period.
Figure 9.
Interannual variation of lake inflow and its runoff components during the simulated period.

Figure 10.
Monthly distribution of runoff components from the lake inflow.

Figure 11.
The contribution of BF, GR, RR and SR to total runoff in each sub-basin of Siling Co. (a) Zajia Zangbo, (b) Boqu Zangbo, (c) Ali Zangbo, (d) Zagen Zangbo.
Figure 11.
The contribution of BF, GR, RR and SR to total runoff in each sub-basin of Siling Co. (a) Zajia Zangbo, (b) Boqu Zangbo, (c) Ali Zangbo, (d) Zagen Zangbo.

Figure 12.
Distribution of multiyear monthly average (a) discharge, (b) precipitation and (c) evaporation in the sub-basins.
Figure 12.
Distribution of multiyear monthly average (a) discharge, (b) precipitation and (c) evaporation in the sub-basins.

Figure 13.
Variation in runoff caused by increased precipitation and temperature. (a) Precipitation increased by 10%; (b) temperature increased by 1 °C.
Figure 13.
Variation in runoff caused by increased precipitation and temperature. (a) Precipitation increased by 10%; (b) temperature increased by 1 °C.

Figure 14.
Monthly variations of RR, SR, GR and BF under the (a) SSP1-2.6, and (b) SSP3-7.0 climate scenarios.
Figure 14.
Monthly variations of RR, SR, GR and BF under the (a) SSP1-2.6, and (b) SSP3-7.0 climate scenarios.


Table 1.
Information on meteorological stations in the Siling Co basin.
| Station Name | Lat/N | Lon/E | Elevation/m | Data Type | Period/Year |
|---|---|---|---|---|---|
| Shenzha | 30.95 | 88.6333 | 4672 | Prec/Tem | 2000–2016 |
| Bange | 31.38333 | 90.01667 | 4700 | Prec/Tem | 2000–2016 |
| Anduo | 32.35 | 91.1 | 4800 | Prec/Tem | 2000–2016 |
| Shigatse | 29.25 | 88.88333 | 3836 | Prec/Tem | 2000–2016 |
| Dumxung | 30.48333 | 91.1 | 4200 | Prec/Tem | 2000–2016 |
| Naqu | 31.48333 | 92.06667 | 4507 | Prec/Tem | 2000–2016 |
Table 2.
SPHY model parameters for calibration in Siling Co.
| Parameters | Description | Unit | Parameter Ranges | Fitted Value | |||
|---|---|---|---|---|---|---|---|
| Zajia Zangbo | Boqu Zangbo | Ali Zangbo | Zagen Zangbo | ||||
| δgw | Groundwater recharge delay time | d | 1~4 | 1 | 1 | 1 | 1 |
| αgw | Baseflow recession coefficient | // | 0.01 | 0.01 | 0.01 | 0.01 | |
| GlacF | Glacier fraction of grid cell | // | 0.85 | 0 | 0.5 | 0.85 | |
| DDFDG | Degree-day factor for debris-covered glaciers | mm·°C−1·d−1 | 2~8 | 4.5 | 4.5 | 4.5 | 3.5 |
| DDFG | Degree-day factor for debris-free glaciers | mm·°C−1·d−1 | 2~8 | 6 | 5 | 5 | 3.8 |
| DDFS | Degree-day factor for snow | mm·°C−1·d−1 | 2~8 | 4 | 4 | 4 | 4 |
| Tcrit | Temperature threshold | °C | −4~2 | −3 | −3 | −3 | −3 |
| Kx | Flow recession coefficient | // | 0.5~1 | 0.98 | 0.98 | 0.98 | 0.98 |
Table 3.
Simulation efficiency and evaluation index in different period.
| Evaluation Index | Calibration Period (2001–2008) | Validation Period (2009–2016) | Simulation Period (2001–2016) |
|---|---|---|---|
| NSE | 0.59 | 0.61 | 0.90 |
| RE | 17.6% | −2.0% | 2.97% |
| R2 | 0.92 | 0.81 | 0.97 |
Table 4.
Runoff composition and contribution to total runoff in each sub-basin of Siling Co.
| Sub-Basin | Annual Runoff (108 m3) | BF (%) | GR (%) | RR (%) | SR (%) |
|---|---|---|---|---|---|
| Zajia Zangbo | 15.24 | 29.45 | 21.67 | 12.55 | 36.33 |
| Boqu Zangbo | 0.83 | 38.55 | 0 | 31.85 | 29.60 |
| Ali Zangbo | 3.34 | 20.87 | 1.04 | 43.93 | 34.16 |
| Zagen Zangbo | 6.32 | 11.55 | 34.21 | 8.73 | 45.50 |
| Total | 25.74 | 24.23 | 21.37 | 16.31 | 38.08 |
Table 5.
Variation of temperature, precipitation, evaporation, glacier melt and runoff under different climate scenarios.
Table 5.
Variation of temperature, precipitation, evaporation, glacier melt and runoff under different climate scenarios.
| Climate Scenarios | Tmax | Tmin | Tmean | P | E | GM | Q | |
|---|---|---|---|---|---|---|---|---|
| (℃) | (mm) | |||||||
| SSP1-2.6 | Amplitude of variation | 0.65 | 0.70 | 0.68 | 27.86 | −7.48 | 5.36 | 39.13 |
| rate of change (/10a) | 0.22 | 0.38 | 0.28 | 23.40 | 14.96 | 1.45 | 9.96 | |
| SSP3-7.0 | Amplitude of variation | 0.72 | 0.84 | 0.78 | 12.07 | −13.09 | 5.28 | 29.77 |
| rate of change (/10a) | 0.34 | 0.51 | 0.41 | 36.98 | 18.11 | 0.82 | 21.26 | |
Publisher’s Note: MDPI stays neutral with regard to jurisdictional claims in published maps and institutional affiliations. |
© 2022 by the authors. Licensee MDPI, Basel, Switzerland. This article is an open access article distributed under the terms and conditions of the Creative Commons Attribution (CC BY) license (https://creativecommons.org/licenses/by/4.0/).
Share and Cite
MDPI and ACS Style
Tang, Y.; Huo, J.; Zhu, D.; Yuan, Z. Simulation of the Water Storage Capacity of Siling Co Lake on the Tibetan Plateau and Its Hydrological Response to Climate Change. Water 2022, 14, 3175. https://doi.org/10.3390/w14193175
AMA Style
Tang Y, Huo J, Zhu D, Yuan Z. Simulation of the Water Storage Capacity of Siling Co Lake on the Tibetan Plateau and Its Hydrological Response to Climate Change. Water. 2022; 14(19):3175. https://doi.org/10.3390/w14193175
Chicago/Turabian StyleTang, Yuanzhi, Junjun Huo, Dejun Zhu, and Zhe Yuan. 2022. "Simulation of the Water Storage Capacity of Siling Co Lake on the Tibetan Plateau and Its Hydrological Response to Climate Change" Water 14, no. 19: 3175. https://doi.org/10.3390/w14193175
Note that from the first issue of 2016, this journal uses article numbers instead of page numbers. See further details here.