
Numerical Research on Fractured Surrounding Rock Deformation and Failure Law Caused by Submarine Mining
1
Key Laboratory of Shale Gas and Geoengineering, Institute of Geology and Geophysics, Chinese Academy of Sciences, Beijing 100029, China
2
Innovation Academy for Earth Science, Chinese Academy of Sciences, Beijing 100029, China
3
Key Laboratory for Geo-Hazards in Loess Area, Xi’an Center of Geological Survey CGS, Xi’an 710054, China
*
Author to whom correspondence should be addressed.
Water 2022, 14(19), 3171; https://doi.org/10.3390/w14193171
Submission received: 13 September 2022
/
Revised: 1 October 2022
/
Accepted: 7 October 2022
/
Published: 8 October 2022
(This article belongs to the Section Hydrogeology)
Abstract
:The existence of cracks has a considerable influence on the deformation failure characteristics and mechanical behavior of the surrounding rock mass. For submarine mining in particular, if a fractured zone in which water is flowing is formed between the goaf and the overlying strata, it will result in a devastating disaster in the mine. Therefore, it is of great significance to understand the deformation and failure law of fractured surrounding rock. Based on field investigation and the self-developed Y-Mat finite-discrete element numerical calculation program, submarine mining in the Xinli mine under three different working conditions was simulated. The research results showed that when mining in fractured rock mass, the influence range was large, the surrounding rock deformation was significant, and a discontinuous stress field was generated. Backfill mining can effectively restrain the deformation failure of surrounding rock and reduce the occurrence of penetrating fractures. Moreover, the effect of backfill mining was more obvious in the fractured surrounding rock. The fault had a barrier effect on the penetration of surrounding rock cracks, but its effect was weakened in the fractured surrounding rock. Under the working conditions of the study area, i.e., backfill mining in the fractured rock mass, the primary fractures in the surrounding rock were destroyed first, followed by the intact rock mass between the cracks. It was possible for the fractures to run through the overlying strata. Double subsidence centers developed on the surface and the reflection of deformation on the surface showed obvious hysteresis. These research results can provide a reference for mining stability evaluation and disaster prevention in the study area.
1. Introduction
Deformation failures in roadways and goafs seriously threaten the safety of mine workers and affect mining progress. Additionally, deformation failures may also cause ground subsidence [1,2,3]. As a common structural plane in rock mass, cracks play an important role in controlling the deformation and failure of rock mass. The anisotropy in deformation and water conductivity reflected by cracks is of great importance to the stability and safety of underground engineering [4,5,6]. In order to ensure mining safety and to reduce its influence on surface deformation, backfill mining should be adopted. Backfill mining not only improves the mining rate, but also has a good inhibitory effect on the movement of surrounding rock [7,8,9]. However, regardless of the type of filling material, its deformation and strength parameters are smaller than those of the ore body itself. After filling, the interaction between the surrounding rock and filling body will still cause filling body deformation, leading to the failure of the surrounding rock [10,11]. Therefore, it is necessary to conduct a thorough and detailed study on the deformation and failure laws of fractured surrounding rock under filling mining conditions.
According to statistics, there are more than 100 submarine mines around the world [12]. Due to the special engineering geological conditions of submarine mining, it is impossible to setup rock-movement monitoring points on the surfaces of mining areas of seabed mines because they are covered with seawater, and thus, rock movement cannot be predicted using statistical models based on measured data. Moreover, the shapes of the metal ore bodies are not regular; thus, it is difficult to apply the probability integral method that is typically used in coal mine research [13,14]. With the development of computer technology, numerical simulation methods have gradually entered the field of engineering geology [15,16]. At present, numerical research on surrounding rock deformation and failure caused by mining mostly use FLAC (Fast Lagrangian Analysis of Continua), RFPA (Rock Failure Process Analysis), UDEC (Universal Distinct Element Code), PFC (Particle Flow Code), and other types of numerical simulation software based on FEM (Finite Element Method) and DEM (Discrete Element Method) [17,18,19]. Min et al. used a large number of discrete fracture networks based on UDEC software to achieve the numerical simulation of the mechanical deformation of fractured rock mass at different scales [20]. Based on FLAC3D, Kang et al. described the deformation characteristics and distribution of the stress field of a deeply buried road, and Xing et al. investigated the deformation failure zone around roadways and the influences of the post-failure constitutive parameters of rock mass [13,21]. Wang et al. used RFPA to study the failure mechanism of circular tunnels in transversely isotropic rocks [22]. Huang et al. explored the effect of a weak interlayer on the deformation failure of a roadway based on ABAQUS and found that the weak interlayer affected the stability of the roadway by causing asymmetrical stress and increasing the failure zones [23]. Using PFC, Wang et al. analyzed the mechanical and crack evolution characteristics of coal-rock under different fracture-hole conditions, and Liu et al. discussed the damage evolution law of a horseshoe-shaped coal mine roadway [24,25].
In summary, researchers have conducted long-term investigations on the deformation failure of surrounding rock based on numerical simulations, and some meaningful results have been achieved. However, FEM focuses on simulating the damage inside the rock, while DEM is good at simulating the fracture inside the rock [26,27]. Although FDEM (Finite-Discrete Element Method) can simulate the rock mass deformation and failure processes more accurately, it also has shortcomings in terms of computational efficiency and destruction criteria. Moreover, according to the regularities of fracture development obtained by field measurement and statistics, it is usually used in qualitative analysis or in seepage calculations, while the real fracture is rarely used in simulation calculations.
Thus, on the basis of previous studies, FDEM was optimized by improving the calculation method of contact force, introducing the changing rate of slip and elastic–plastic failure criterion. A set of improved algorithms was put forward, and a program called Y-Mat was developed in Matlab. Taking the representative fractured surrounding rock in the Xinli submarine mine as a prototype, the Y-Mat program and detailed fracture data were used to simulate the surrounding rock deformation and failure caused by shallow excavation in the mining area. The influence of backfill mining and fractured surrounding rock on goaf deformation failure, crack initiation, extension and penetration, and ground subsidence were explored. The results provide guidance for mining in shallow orebodies in the study area.
2. Overview of the Study Area
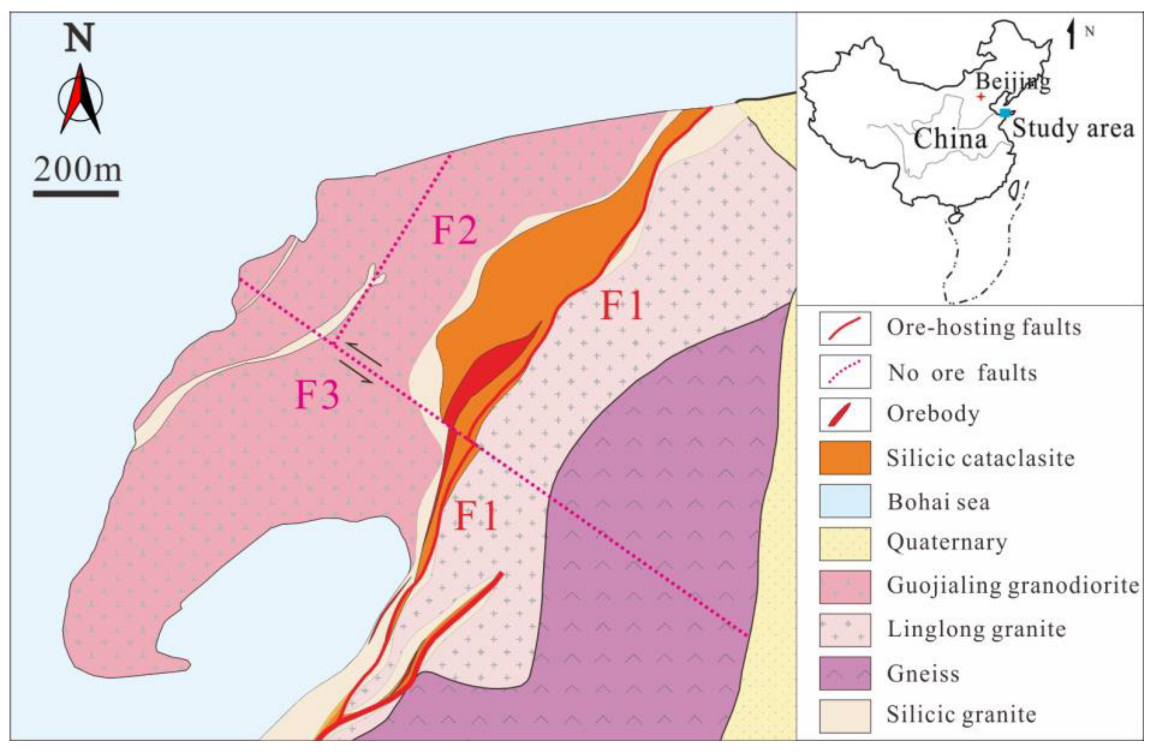
The Sanshandao gold mine is located in the Sanshandao village, Shandong Province, China. It is surrounded by the Bohai sea on three sides and is only connected to the land in the southeast, as shown in Figure 1. The Xinli mining area, which is part of the Sanshandao gold mine, is the only undersea mine in China. Due to its special geological and structural conditions, mining is difficult and risky. The terrain of the study area is gentle, and the surface is mainly covered by quaternary deposits. The lithologies are composed of the Neoarchean Jiaodong group and include granite, granodiorite, gneisserite, etc. [28,29].
The geological structure of the mining area is dominated by fractures, and three faults, named F1, F2, and F3, have developed. Among them, F1 is the most important ore-controlling fault, and it is inclined to the southeast and has an average dip angle of 46°. F1 is a compression torsional fault, with a black fault gouge that is 10–40 cm thick. Additionally, cataclastic rock zones that are 1–10 m thick have developed on both sides of the main section. The relationship between the three principal stresses and the depth is obtained according to the in situ measurement results [30]:
where are the maximum horizontal stress, the minimum horizontal stress, and the vertical stress (MPa), respectively, and H is the depth (m).
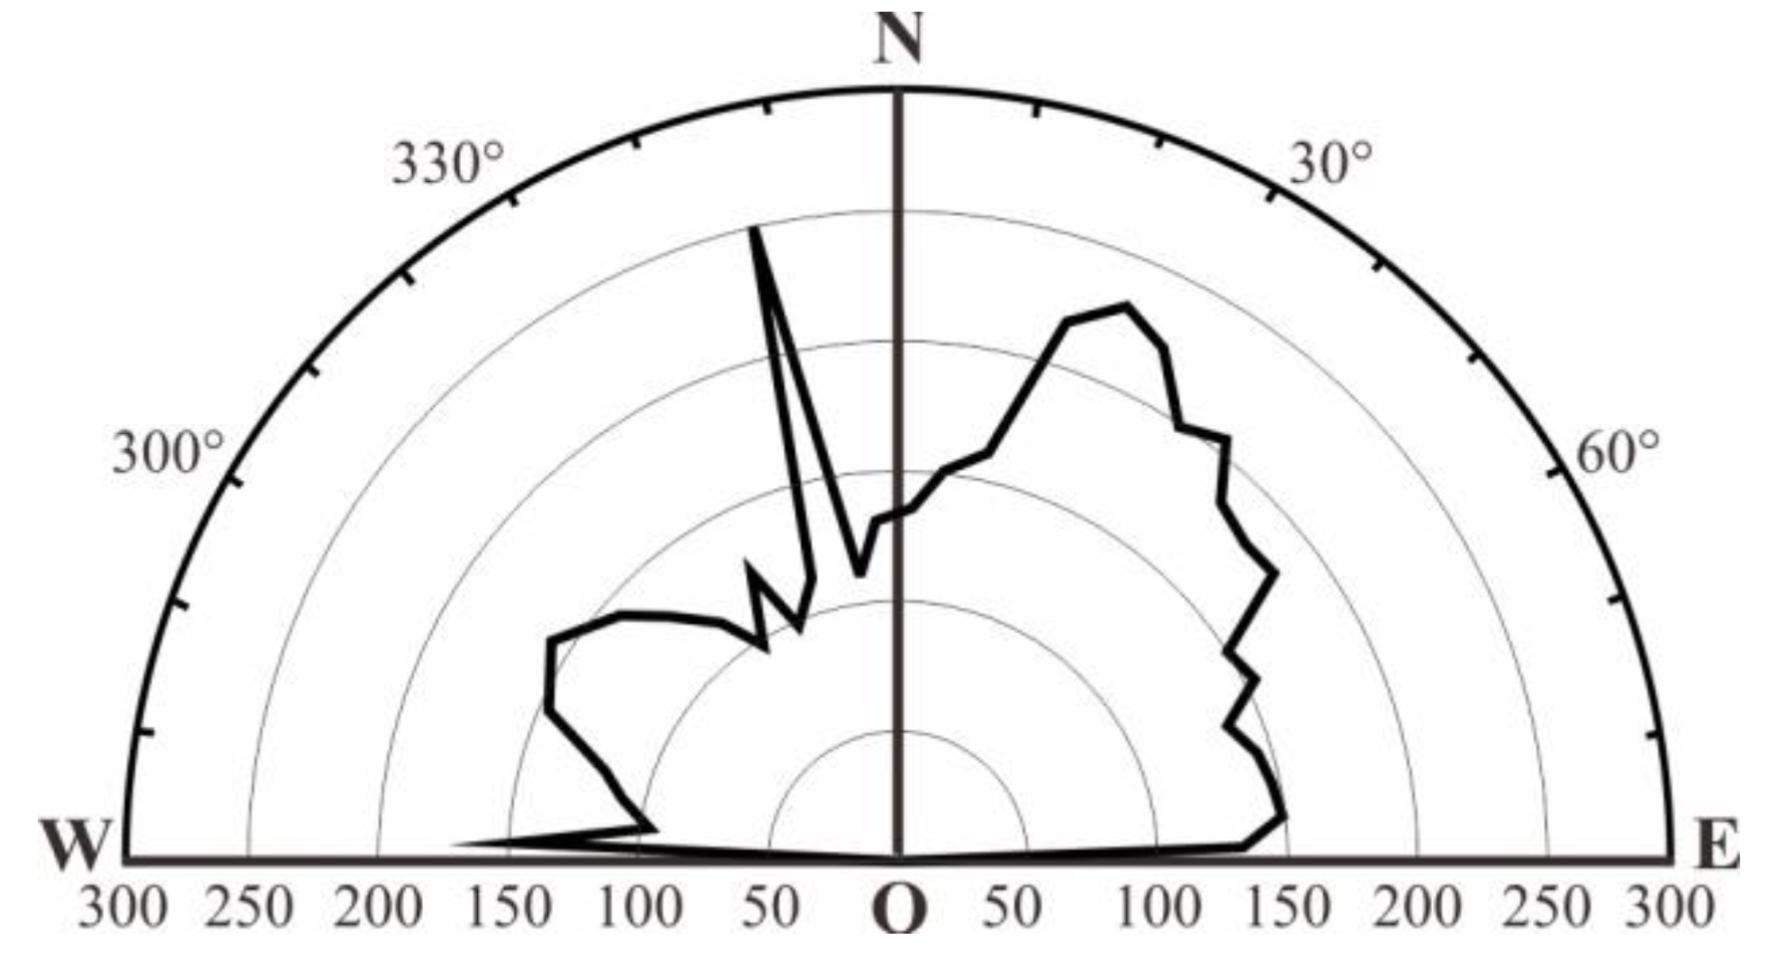
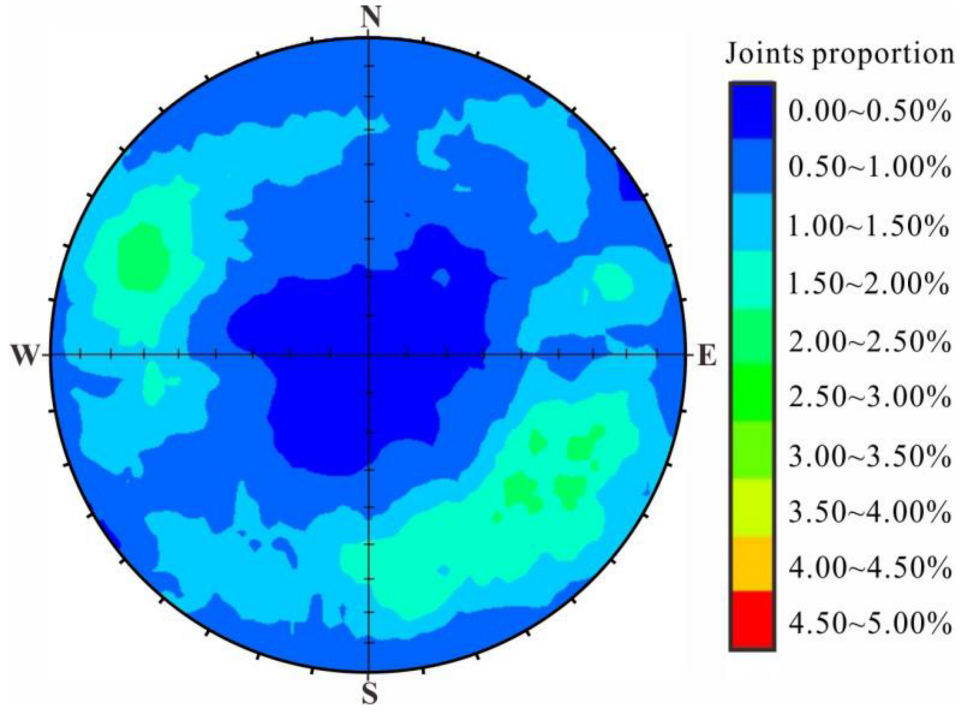
As a common structural plane in rock mass, cracks play a key role in the deformation failure and water conductivity of surrounding rock. Therefore, it is the most important and basic task to accurately obtain the distribution characteristics of cracks in the study area. The cracks in the surrounding rock of shallow roadways in the Xinli mine have been measured for many years [31,32]. According to the joint occurrence data, a strike rose diagram and pole isopycnal map of the cracks were drawn, as shown in Figure 2 and Figure 3.
According to Figure 2, most of the fractures strike in the NE direction, and the azimuth distribution is discrete. The second most common direction for fractures to strike in is the NWW direction, with an azimuth between 290° and 320°. At the same time, there is a group of dense fractures distributed at the azimuth angles of 340°–350°. It can be seen from Figure 3 that there are more cracks in the second and fourth quadrants with a wide range of inclination angles. There are little cracks in the first and third quadrants, and the inclination angles are larger. The fractures can be divided into three sets according to the occurrence of the main faults in the mining area. The inclination of the fractures in Set 1 is distributed in the fourth quadrant and is related to fault F1. The inclination of the fractures in Set 2 is distributed in the second quadrant and is related to fault F2, and the inclination of the fractures in Set 3 is distributed in the first and third quadrants and is related to the nearly erect fault F3.
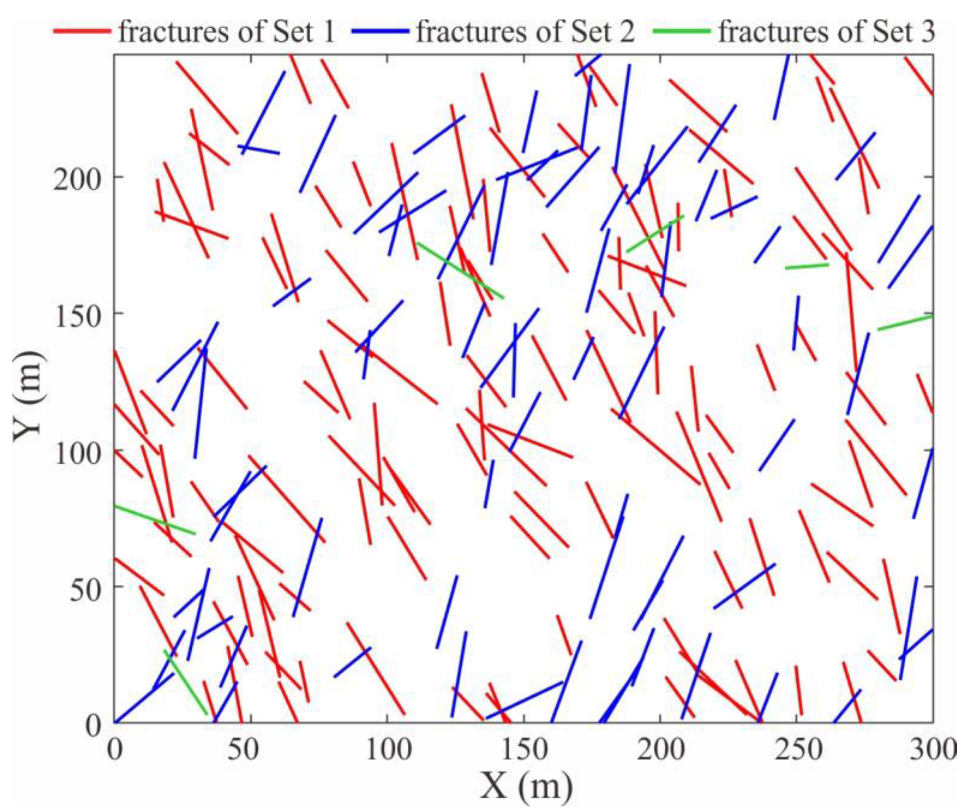
Considering the number ratio of each set of fractures and the efficiency of the calculation program, a model with a length of 300 m and a height of 245 m was established to include 120 fractures from Set 1, 74 fractures from Set 2, and 6 fractures from Set 3. In order to adapt to the calculation model, the length of fractures was set as 15 m–45 m. Based on the Monte Carlo method, the generation and display program for random cracks were written in Matlab, as shown in Figure 4.
3. Methodology
3.1. Y-Mat Program
FDEM is a numerical method originally proposed by Munjiza et al., but it still has some shortcomings in the computational efficiency and the description of rock mechanical behavior [33,34]. Therefore, the Y-Mat program was proposed, and the following aspects were optimized:
- The calculation efficiency of the program was increased through improving the calculation method for contact force. Most of the current contact algorithms are based on the penalty function originally proposed by Munjiza [35]. In the calculation process, it is necessary to calculate the boundary intersection point between the contact edge and the target triangle, the relative position of the intersection point between the contact edge and the midline of the triangle, and the magnitude of the potential [33,34]. In general, there are four such intersection points between the two main contact edges of a contact pair, which affect the computational efficiency of the program. Thus, the contact force is calculated according to the length of the invading edge and the potential of the invading part’s center, which simplifies the calculation process and greatly improves the calculation efficiency [32].
- Referring to the definition of static and dynamic loading in the laboratory, the concept of the changing rate of slip in numerical simulation is proposed, and the calculation method of contact tangential force considering static and dynamic friction and their mutual conversion is introduced [36,37]; in rock mechanics tests, the rate is usually not used as the static and dynamic conversion indices, while the strain rate is used to judge whether rock loading is dynamic or static. The reason for this is that the values of the static and dynamic conversion rates are random and difficult to determine, and different sample sizes have different responses to the same rate. In the improved model, the concept of strain rate is borrowed, and the slip rate is defined as the index of the transformation between the dynamic and static states [32].
- Combined with the elastoplastic deformation of rock mass and referring to the relevant theories in FLAC, the Mohr–Coulomb constitutive model and the maximum tensile stress criterion are introduced to correct the deformation force of the element after yield [38]. In addition to elastic deformation, rock materials also have strong plastic deformation characteristics. Therefore, the elastic constitutive model alone cannot reflect the mechanical behavior of continuum [32].
The specific optimization principle and implementation method of the Y-Mat program are referred to the reference [32] and will not be described in detail here.
3.2. Model Establishment
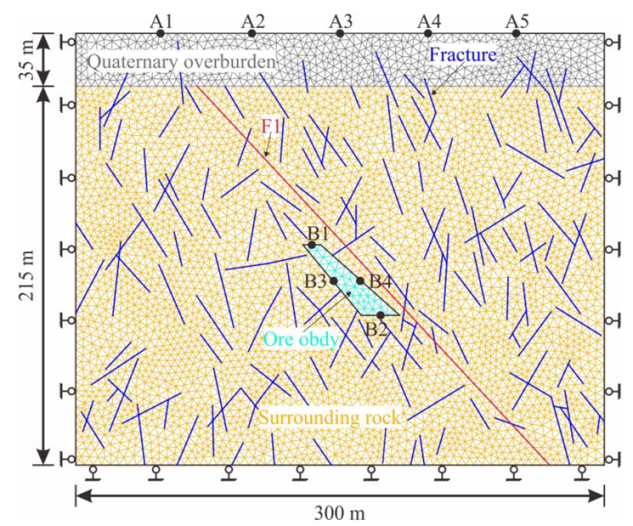
As shown in Figure 5, a numerical model was established to study the surrounding rock deformation and failure caused by ore body excavation. The model consisted of three groups: quaternary overburden, surrounding rock mass, and ore body. Among them, the red line represented the ore-controlling fault F1, and the blue line represented the discrete fracture network. In order to show the deformation laws of roadways and surfaces more intuitively, five monitoring points A1–A5 were set up on the ground 50 m, 100 m, 150 m, 200 m, and 250 m away from the left boundary of the model. Monitoring points B1, B2, B3, and B4 were placed in the center of the roof and floor and along the left and right sides of the excavation area.
3.3. Boundary Conditions and Parameter Selection
The horizontal displacement on the two lateral boundaries of the model and the vertical displacement on the bottom boundary were limited. The top boundary was set as a free deformation boundary. According to the engineering geological conditions of the study area, the parameters adopted in the model are shown in Table 1. Based on empirical formulae (1)–(3) for in situ stress, horizontal and vertical gradient ground stress were applied in the model. The horizontal ground stress increased gradually from top to bottom: the top stress was 13.16 MPa, and the gradient increment was 0.0539 MPa/m. The vertical ground stress increased gradually from top to bottom: the top stress was 7.69 MPa, and the gradient increment was 0.0315 MPa/m.
3.4. Test Scheme
In order to study the influence of filling and fissures on the deformation and failure of surrounding rock, three numerical tests were designed under different working conditions. Test scheme 1 was for backfill mining without fissures, test scheme 2 was mining with fissures, and test scheme 3 was backfill mining with fissures. To ensure the stability of the numerical calculations, the calculation time step was set as ∆t = 1 × 10⁻⁵. Before the ore body was excavated, 10,000 steps were calculated, and then the plastic states and displacements of all of the elements were cleared. After the ore body was excavated, 5000 steps were calculated, and the excavation area was filled.
4. Results and Discussion
4.1. Damage and Failure Process of the Surrounding Rock
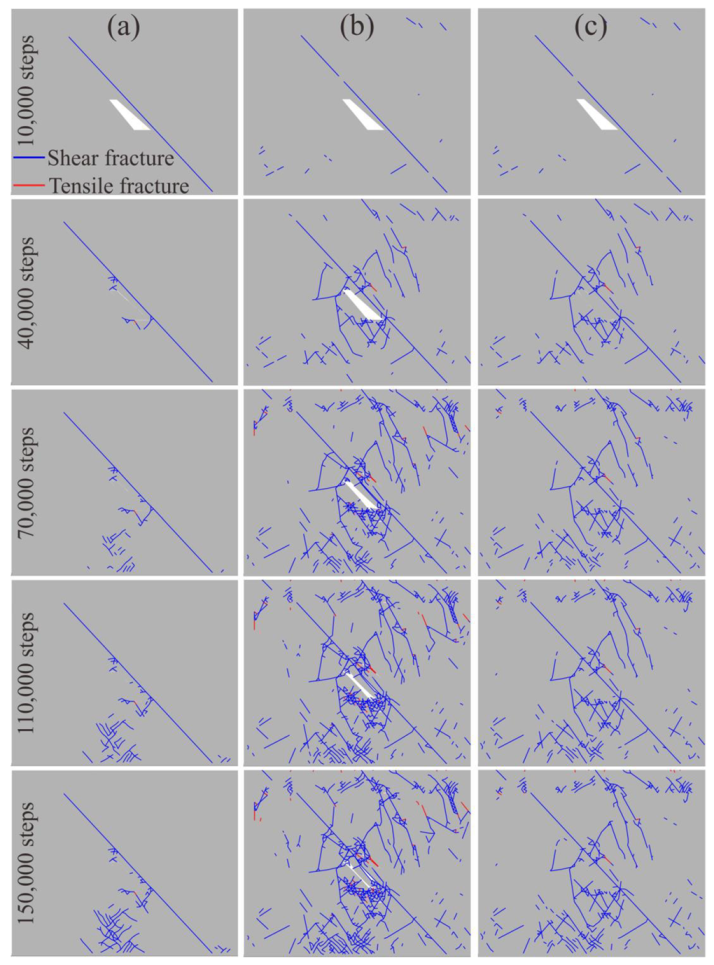
Figure 6 shows the damage and failure process of surrounding rock under three different working conditions. Overall, the new cracks induced by excavation in the intact surrounding rock were mostly the result of shear failure and mainly developed in the vertical direction. Among them, the number of cracks that developed downward was large, and the distance was far, while the number of cracks that developed upward was small, and the distance was short, which was due to the great ground stress in the deep surrounding rock. The deep surrounding rock was more prone to failure when the deformation space was obtained due to excavation. Fault F1 had a certain barrier effect on the failure of the surrounding rock. When the rock mass deformation between the goaf and the fault was small, there was almost no fracture development in the surrounding rock on the hanging wall, and as rock mass deformation increased, cracks gradually appeared in the surrounding rock on the hanging wall.
By comparing Figure 6a,c, it can be seen that due to the existence of primary discrete fractures, the development law of fractures was different from that presented in the isotropic model, which showed that the fractures were concentrated near the excavation area. The intact rock mass between the primary fractures was damaged and then ran through the primary fractures. At the same time, the barrier effect of fault F1 on the surrounding rock failure became weak. In contrast, as seen in Figure 6b,c, more new fractures developed without backfilling, and it was easy for a large penetrating fracture to form when combined with the primary fracture. Filling can inhibit the emergence of penetrating fractures well, especially new small fractures near the goaf, and the failure of intact rock mass between the shallow primary fractures. These phenomena were consistent with the conclusions of previous research [2].
4.2. Surrounding Rock Deformation Characteristics
4.2.1. Ground Deformation
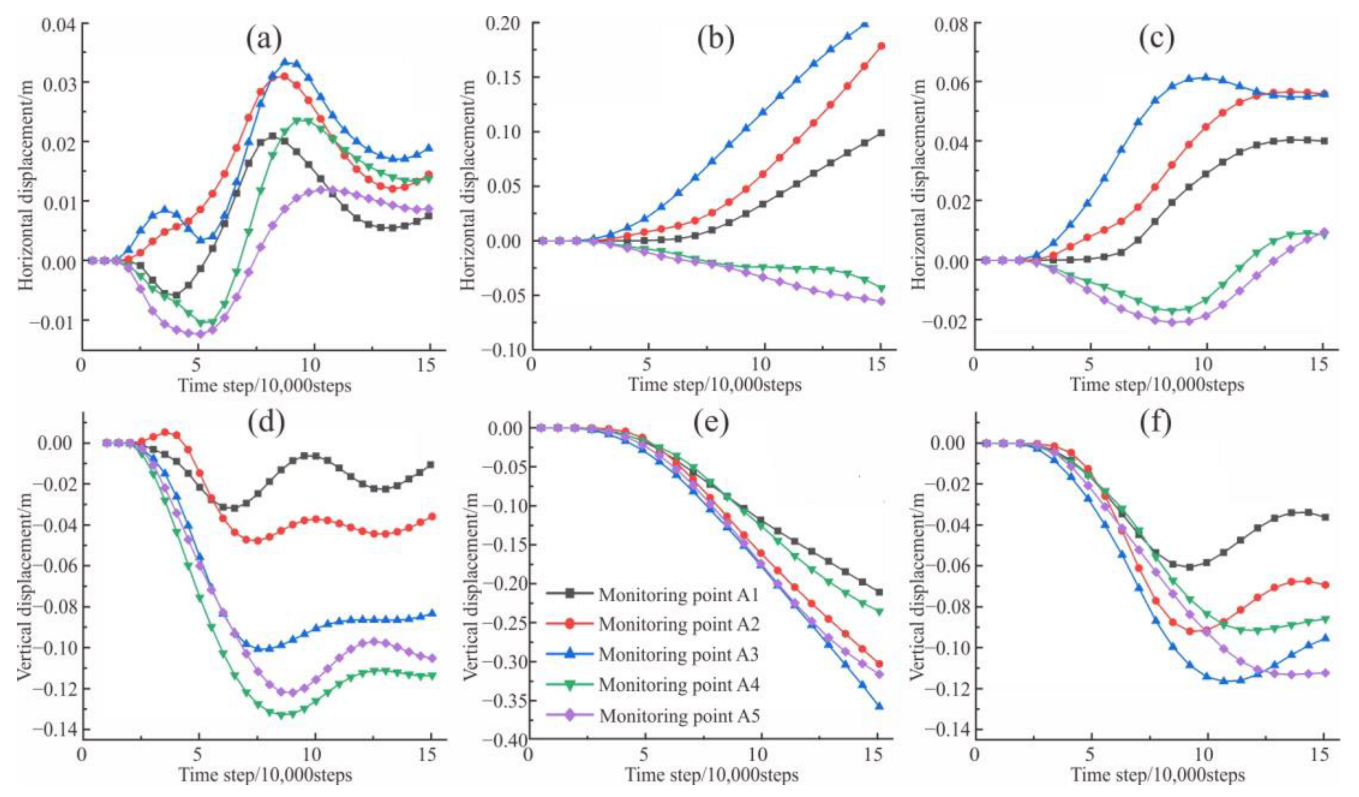
The displacement curves of five surface monitoring points: A1, A2, A3, A4, and A5 under three different working conditions are shown in Figure 7. It can be seen from Figure 7a–c that the horizontal displacement of each monitoring point was not large, but compared to that of non-filling mining, the horizontal displacement of filling mining was only about one-third. If the calculation continued, this difference would have increased further, indicating that filling mining has a great influence on surrounding rock deformation. In addition, the horizontal deformation of A3 was the largest under all three conditions, with a maximum value of about 20 cm.
According to Figure 7d–f, under the condition of mining without filling, the settlement value of A3 located in the surface center of the five monitoring points was the largest, reaching 37 cm at 150,000 steps, which was nearly three times that of those under the other two conditions. In addition, under the three working conditions, the maximum settlement position was different, indicating that the change in the working conditions had little influence on the horizontal deformation center but a great influence on the settlement center.
From Figure 7b,c,e,f, for the fractured rock mass in the early stage, the horizontal and vertical displacement laws were basically identical under non-filling mining and filling mining. However, with the interaction of the surrounding rock and filling body, ground surface deformation converged under backfilling mining, and the ground surface deformation continued to increase under non-filling mining. Settlement will not stop until the excavation area is completely closed or has reached a new equilibrium.
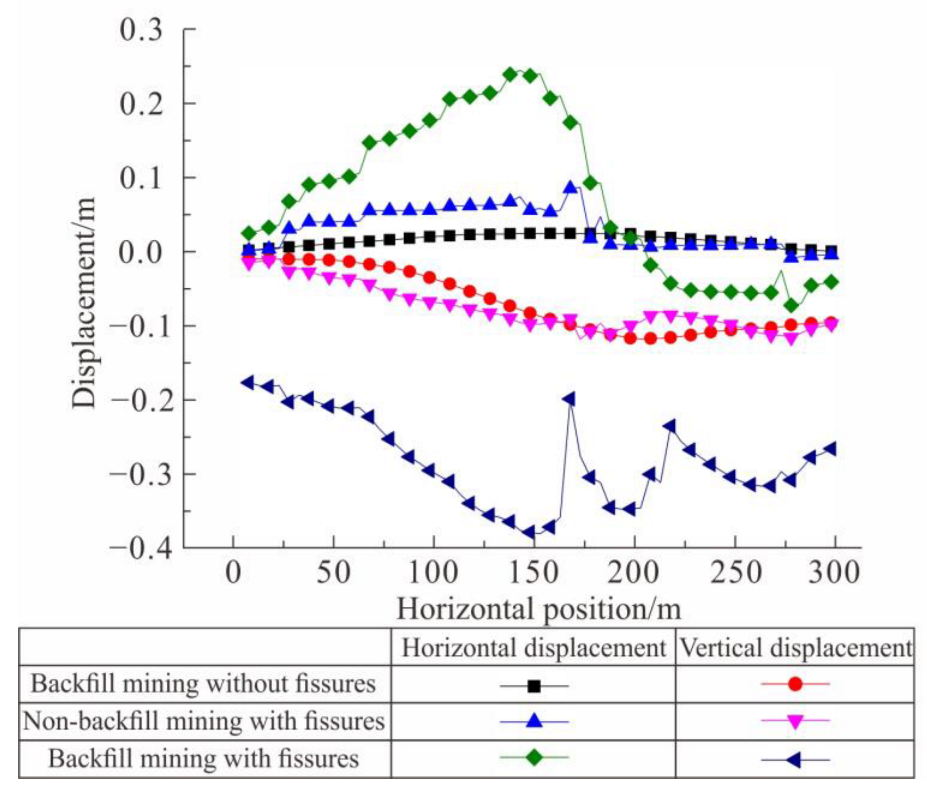
In order to show the relationship between deformation amount and deformation position more intuitively, displacement curves of the surface monitoring points at 150,000 steps were drawn, as shown in Figure 8. In the figure, the X-axis represents the horizontal position, 0 m represents the left boundary of the model, and 300 m represents the right boundary of the model. It can be seen from the figure that the horizontal displacement value is small regardless of whether there was filling or not, and the horizontal displacement was well-restrained after filling. Compared to the horizontal displacement, the vertical displacement was larger, which was the main factor causing surface collapse, ground fissures, and other disasters, so more attention should be paid to it. In the model without primary fractures, only one settlement center appeared on the surface, which was located on the hanging wall far away from the ore body. Considering the primary fractures, when the filling mining method was adopted, there were two settlement centers on the ground, and when the filling mining method was not adopted, three settlement centers developed. The location of these settlement centers may be closely related to the distribution of the fractures in the surrounding rock, and the occurrence of these phenomena was consistent with previous research conclusions [2,39,40].
4.2.2. Deformation of Surrounding Rock around the Goaf
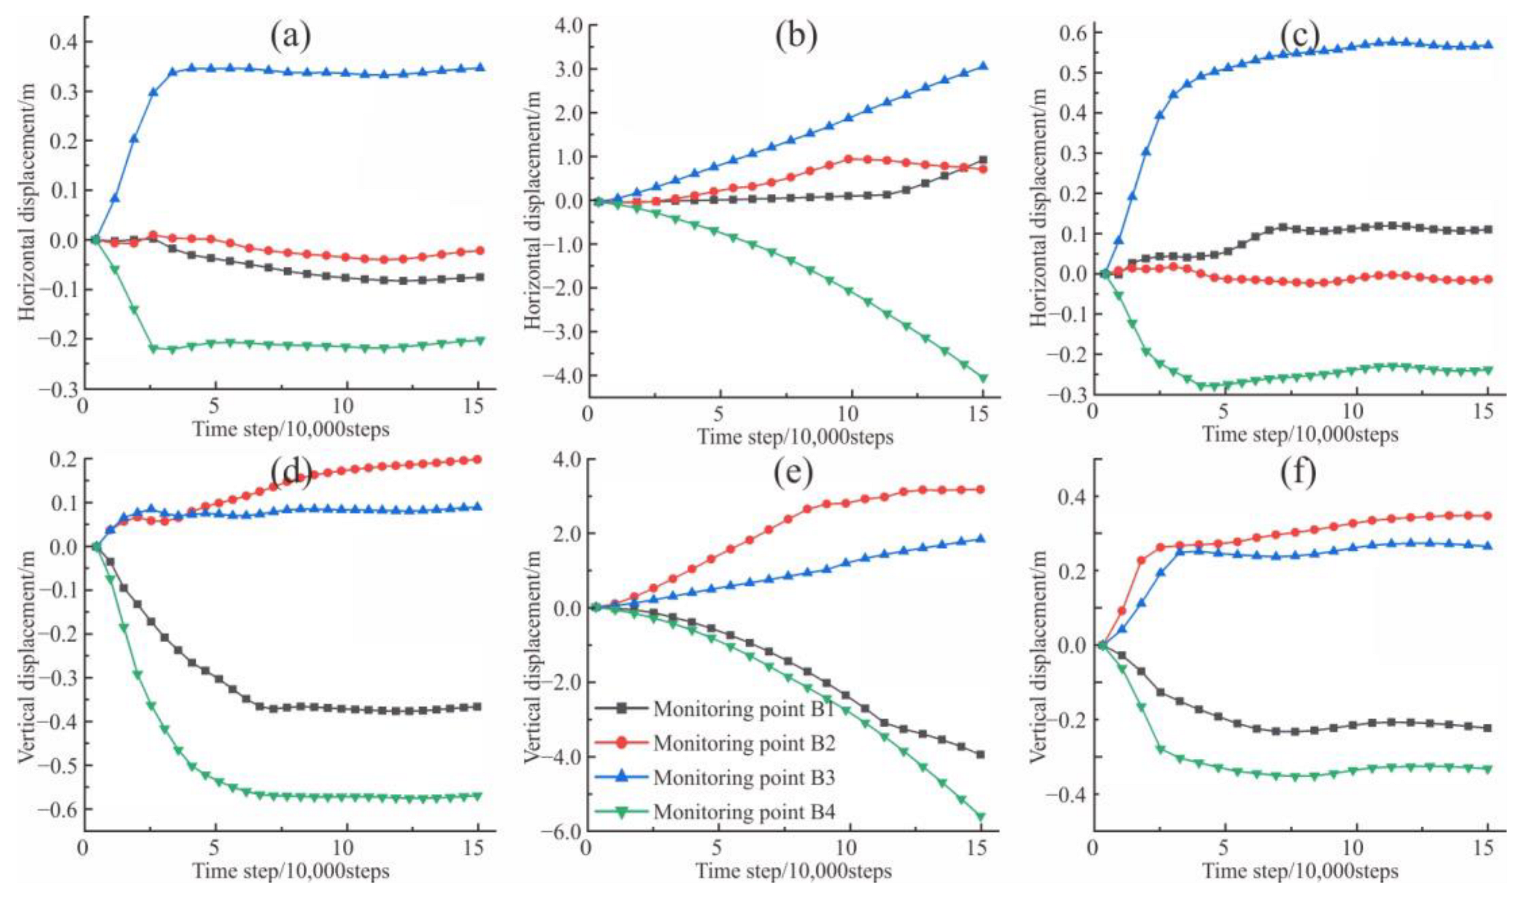
The displacement curves of four monitoring points B1, B2, B3, and B4 around the goaf under the three different working conditions are shown in Figure 9. By comparing Figure 9a–c, it can be seen that the horizontal displacements of the monitoring points on the left and right sides of the goaf without filling were large. The left monitoring point, B3, moved to the right, with a displacement of about 3.1 m, while the right monitoring point, B4, moved to the left, with a horizontal displacement of about 4.4 m. The horizontal displacement of the two monitoring points did not slow down, while the right point showed a sudden increasing trend, which was influenced by fault F1. The horizontal displacement of the monitoring points on both sides of the fractured rock mass under the filling condition was consistent without considering the fractures; that is, the horizontal displacement of all of the monitoring points increased at first and then tended to become more stable due to the support of the filling body. The horizontal displacement of the right monitoring point, B4, was small because the surrounding rock between the right wall of the goaf and the fault was separated from the fault, resulting in large downward displacement under the action of gravity, so contact was made with the backfill earlier, and horizontal deformation was inhibited.
Comparing Figure 9d–f, it can be seen that under the non-filling condition, the roof monitoring point, B1, and the floor monitoring point, B2, both increased first and then slowed down. The reason for the slowing trend in the later stage was that the deformation space was restricted. Under the filling conditions, the vertical displacements of roof monitoring point B1 and floor monitoring point B2 were large, and all of the monitoring points experienced a gradual increase, a slow increase, and a stabilization process, indicating that the filling body had played a role in restraining the deformation. Compared to the model without fractures, the deformation values of roof monitoring point B1 and right monitoring point B4 decreased because the broken block made contact with the filling body earlier under the action of gravity. In addition, the deformation space of the right surrounding rock before filling was not only the mined-out area, but also the original fractures in the surrounding rock mass.
4.3. Surrounding Rock Stress Characteristics
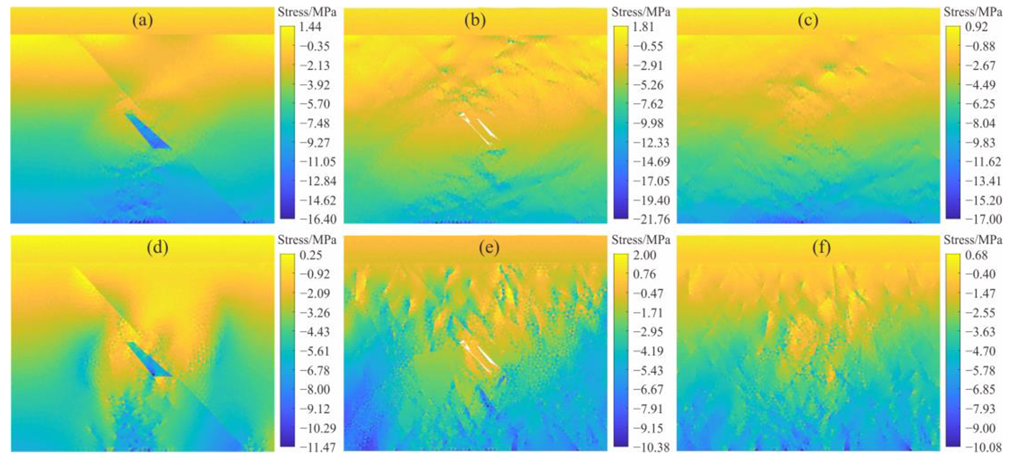
The distribution of the surrounding rock’s stress field in the study area under three different working conditions is shown in Figure 10. As can be seen from the figure, both excavation and filling can cause changes and readjustments of the horizontal stress field. Under the non-filling condition, the tensile stress zones near the excavation area were obvious and extended vertically along the excavation area on the hanging wall. The model adopting the backfilling method can greatly improve this kind of stress distribution. Compared to the isotropic model not considering the primary fractures, the stress field distribution in the model was obviously changed by the cracks. The stress was no longer continuous near the cracks, and differential stress was formed. Meanwhile, the tensile stress near the goaf decreased with backfilling, and the stress difference near the fissures gradually disappeared.
5. Conclusions
- When primary fractures were not considered, the new fractures in the surrounding rock mainly extended downward in the vertical direction, and the fault played a barrier role to the surrounding rock failure. Filling can effectively inhibit the deformation failure of surrounding rock and reduce the occurrence of penetrating cracks. After excavation, the primary fractures of the surrounding rock were destroyed first, followed by the intact rock mass between the cracks. When the surrounding rock with primary fractures was excavated, the influence range was significantly enlarged. It was possible for fractures to run through the overlying strata, and the barrier effect of the faults on the fractures was weakened.
- When primary fractures were not considered, the excavation caused uneven settlement on the surface, and the settlement center shifted away from the fault direction after filling. The left and right walls of the mined-out area were mainly displaced horizontally, while the roof and floor were mainly displaced vertically. When primary fractures were considered, multiple subsidence centers formed on the surface, and the reflection of deformation on the surface showed obvious hysteresis. In addition to the goaf, primary fissures also provided deformation space for the surrounding rock. The effect of filling mining was more obvious in the fractured surrounding rock.
- The influence of excavation and filling on the stress field of surrounding rock was significant whether there were discrete fractures or not. A tensile stress zone was developed around the goaf, and the local stress state of surrounding rock was changed by means of excavation. Filling can reduce the degree of stress field change caused by excavation, but it will always have an irreversible influence on the surrounding rock’s stress field. When primary fractures are considered, the stress field will be discontinuous, and the rock mass near the fractures will also have a large stress difference. Moreover, this phenomenon gradually decreased when the excavation area was backfilled.
There are still several limitations associated with this study. In the actual mining process, in order to ensure the stability of surrounding rock in the mining process, the stope is usually excavated and filled by means of layering excavation and support. The monolithic excavation of a shallow reserved ore body considered in this paper is the most dangerous condition. A more detailed excavation and filling model should be established to further discuss this problem. In addition, the study of surrounding rock deformation and failure caused by shallow excavation is only based on numerical simulation. Although the failure of surrounding rock can be simulated, the method is relatively simple. Relevant physical simulation tests should be carried out, and the deformation and failure mechanism of surrounding rock can be further discussed and improved by combining these methods with in situ geophysical exploration and drilling.
Author Contributions
Data curation, G.L. (Guang Li); formal analysis, G.L. (Gang Liu) and J.G.; methodology, G.L. (Guang Li) and G.L. (Gang Liu); software, G.L. (Gang Liu) and J.G.; writing—original draft, G.L. (Guang Li); writing—review and editing, G.L. (Guang Li) and F.M. All authors have read and agreed to the published version of the manuscript.
Funding
This research was supported by the National Natural Science Foundation of China (Grant Nos. 41831293 and 42072305).
Data Availability Statement
Not applicable.
Acknowledgments
The authors are grateful to the assigned editors and anonymous reviewers for their enthusiastic help and valuable comments which have greatly improved this paper.
Conflicts of Interest
The authors declared that they have no conflict of interest regarding this study. We declare that we do not have any commercial or associative interests that represent a conflict of interest in connection with the paper submitted.
References
- Sui, W.H.; Xu, Z.M. Risk assessment for coal mining under sea area. New Front. Eng. Geol. Environ. 2013, 9, 199–202. [Google Scholar]
- Li, G.; Wang, Z.; Ma, F.; Guo, J.; Liu, J.; Song, Y. A Case Study on Deformation Failure Characteristics of Overlying Strata and Critical Mining Upper Limit in Submarine Mining. Water 2022, 14, 2465. [Google Scholar] [CrossRef]
- Sun, Z.Y.; Zhang, D.L.; Fang, Q.; Dui, G.S.; Chu, Z.F. Analytical solutions for deep tunnels in strain-softening rocks modeled by different elastic strain definitions with the unified strength theory. Sci. China Tech. Sci. 2022, 65. [Google Scholar] [CrossRef]
- Armand, G.; Leveau, F.; Nussbaum, C.; de La Vaissiere, R.; Noiret, A.; Jaeggi, D.; Landrein, P.; Righini, C. Geometry and properties of the excavation-induced fractures at the Meuse/Haute-Marne URL drifts. Rock Mech. Rock Eng. 2014, 47, 21–41. [Google Scholar] [CrossRef]
- Rona, P.A. Resources of the Sea Floor. Science 2003, 299, 673–674. [Google Scholar] [CrossRef] [PubMed]
- Li, G.; Liu, S.; Lu, R.; Ma, F.; Guo, J. Experimental Study on Mechanical Properties and Failure Laws of Granite with Artificial Flaws under Coupled Static and Dynamic Loads. Materials 2022, 15, 6105. [Google Scholar] [CrossRef]
- Li, G.; Ma, F.; Guo, J.; Zhao, H. Deformation Characteristics and Control Method of Kilometer-Depth Roadways in a Nickel Mine: A Case Study. Appl. Sci. 2020, 10, 3937. [Google Scholar] [CrossRef]
- Hock, E.; Brown, E.T. Underground Excavations in Rock; Institution of Min. & Met.: London, UK, 1980. [Google Scholar]
- Li, G.; Wan, Y.; Guo, J.; Ma, F.; Zhao, H.; Li, Z. A Case Study on Ground Subsidence and Backfill Deformation Induced by Multi-Stage Filling Mining in a Steeply Inclined Ore Body. Remote Sens. 2022, 14, 4555. [Google Scholar] [CrossRef]
- Sheorey, P.; Loui, J.; Singh, K.; Singh, S. Ground subsidence observations and a modified influence function method for complete subsidence prediction. Int. J. Rock Mech. Min. Sci. 2000, 37, 801–818. [Google Scholar] [CrossRef]
- Li, G.; Ma, F.; Guo, J.; Zhao, H. Case Study of Roadway Deformation Failure Mechanisms: Field Investigation and Numerical Simulation. Energies 2021, 14, 1032. [Google Scholar] [CrossRef]
- Dong, S.; Zhang, W.; Zhou, W.; Chai, R.; Wang, H.; Zhao, C.; Dong, X.; Wang, Q. Discussion on Some Topical Issues of Water Prevention and Control in Coal Mines. Mine Water Environ. 2021, 40, 1–6. [Google Scholar] [CrossRef]
- Kang, Y.S.; Liu, Q.S.; Xi, H.L.; Gong, G.Q. Improved compound support system for coal mine tunnels in densely faulted zones: A case study of China’s Huainan coal field. Eng. Geol. 2018, 240, 10–20. [Google Scholar] [CrossRef]
- Li, G.; Ma, F.; Guo, J.; Zhao, H. Experimental research on deformation failure process of roadway tunnel in fractured rock mass induced by mining excavation. Environ. Earth Sci. 2022, 81, 243. [Google Scholar] [CrossRef] [PubMed]
- Jing, L. A review of techniques, advances and outstanding issues in numerical modelling for rock mechanics and rock engineering. Int. J. Rock Mech. Min. Sci. 2003, 40, 283–353. [Google Scholar] [CrossRef]
- Li, G.; Ma, F.; Guo, J.; Zhao, H.; Liu, G. Study on deformation failure mechanism and support technology of deep soft rock roadway. Eng. Geol. 2020, 264, 105262. [Google Scholar] [CrossRef]
- Elmo, D.; Stead, D. An integrated numerical modelling–discrete fracture network approach applied to the characterisation of rock mass strength of naturally fractured pillars. Rock Mech. Rock Eng. 2010, 43, 3–19. [Google Scholar] [CrossRef]
- Li, G.; Ma, F.; Liu, G.; Zhao, H.; Guo, J. A Strain-Softening Constitutive Model of Heterogeneous Rock Mass Considering Statistical Damage and Its Application in Numerical Modeling of Deep Roadways. Sustainability 2019, 11, 2399. [Google Scholar] [CrossRef] [Green Version]
- Fukuda, D.; Mohammadnejad, M.; Liu, H.; Dehkhoda, S.; Chan, A.; Cho, S.; Min, G.; Han, H.; Kodama, J.; Fujii, Y. Development of a GPGPU-parallelized hybrid finite-discrete element method for modeling rock fracture. Int. J. Numer. Anal. Methods Geomech. 2019, 43, 1797–1824. [Google Scholar] [CrossRef]
- Min, K.B.; Jing, L. Numerical determination of the equivalent elastic compliance tensor for fractured rock masses using the distinct element method. Int. J. Rock Mech. Min. Sci. 2003, 40, 795–816. [Google Scholar] [CrossRef]
- Xing, Y.; Kukatilake, P.H.S.W.; Sandbak, L.A. Effect of rock mass and discontinuity mechanical properties and delayed rock supporting on tunnel stability in an underground mine. Eng. Geol. 2018, 238, 62–75. [Google Scholar] [CrossRef]
- Wang, X.; Tian, L. Mechanical and crack evolution characteristics of coal–rock under different fracture-hole con-ditions: A numerical study based on particle flow code. Environ. Earth Sci. 2018, 77, 297. [Google Scholar] [CrossRef]
- Huang, F.; Zhu, H.H.; Zhu, Q.W.; Xu, Q.W. The effect of weak interlayer on the failure pattern of rock mass around tunnel-Scaled model tests and numerical analysis. Tunn. Undergr. Space Technol. 2013, 35, 207–218. [Google Scholar] [CrossRef]
- Wang, S.; Sloan, S.; Tang, C.; Zhu, W. Numerical simulation of the failure mechanism of circular tunnels in transversely isotropic rock masses. Tunn. Undergr. Space Technol. 2012, 32, 231–244. [Google Scholar] [CrossRef]
- Liu, W.; Wang, X.; Li, C. Numerical Study of Damage Evolution Law of Coal Mine Roadway by Particle Flow Code (PFC) Model. Geotech. Geol. Eng. 2019, 37, 2883–2891. [Google Scholar] [CrossRef]
- Guo, H.; Ooi, E.T.; Saputra, A.; Yang, Z.; Natarajan, S.; Song, C. A quadtree-polygon-based scaled boundary finite element method for image-based mesoscale fracture modelling in concrete. Eng. Fract. Mech. 2019, 211, 420–441. [Google Scholar] [CrossRef]
- Liu, H.Y.; Kang, Y.M.; Lin, P. Hybrid finite—Discrete element modeling of geomaterials fracture and fragment muck-piling. Int. J. Geotech. Eng. 2015, 9, 115–131. [Google Scholar] [CrossRef]
- Duan, X.; Ma, F.; Gu, H.; Guo, J.; Zhao, H.; Liu, G.; Liu, S. Identification of Mine Water Sources Based on the Spatial and Chemical Characteristics of Bedrock Brines: A Case Study of the Xinli Gold Mine. Mine Water Environ. 2021, 41, 126–142. [Google Scholar] [CrossRef]
- Liu, G.; Ma, F.; Liu, G.; Guo, J.; Duan, X.; Gu, H. Quantification of Water Sources in a Coastal Gold Mine Through End-member Mixing Analysis Combining Multivariate Statistical Methods. Water 2020, 12, 580. [Google Scholar] [CrossRef] [Green Version]
- Duan, X.; Ma, F.; Guo, J.; Zhao, H.; Gu, H.; Liu, S.; Sun, Q. Source Identification and Quantification of Seepage Water in a Coastal Mine, in China. Water 2019, 11, 1862. [Google Scholar] [CrossRef] [Green Version]
- Liu, S.; Ma, F.; Zhao, H.; Guo, J.; Duan, X.; Sun, Q. Numerical Investigation of a Hydrosplitting Fracture and Weak Plane Interaction Using Discrete Element Modeling. Water 2020, 12, 535. [Google Scholar] [CrossRef] [Green Version]
- Liu, G.; Ma, F.; Zhang, M.; Guo, J.; Jia, J. Y-Mat: An improved hybridfinite-discrete element code for addressing geotechnical and geological engineering problems. Eng. Comput. 2021, 39, 1962–1983. [Google Scholar] [CrossRef]
- Lisjak, A.; Mahabadi, O.; He, L.; Tatone, B.; Kaifosh, P.; Haque, S.; Grasselli, G. Acceleration of a 2D/3D finite-discrete element code for geomechanical simulations using General Purpose GPU computing. Comput. Geotech. 2018, 100, 84–96. [Google Scholar] [CrossRef]
- Lisjak, A.; Tatone, B.S.; Mahabadi, O.K.; Grasselli, G.; Marschall, P.; Lanyon, G.W.; de la Vaissière, R.; Shao, H.; Leung, H.; Nussbaum, C. Hybrid finite-discrete element simulation of the EDZ formation and mechanical sealing process around a microtunnel in Opalinus Clay. Rock Mech. Rock Eng. 2016, 49, 1849–1873. [Google Scholar] [CrossRef]
- Munjiza, A.; Andrews, K.R.F. NBS contact detection algorithm for bodies of similar size. Int. J. Numer. Methods Eng. 1998, 43, 131–149. [Google Scholar] [CrossRef]
- Mahabadi, O.K.; Grasselli, G.; Munjiza, A. Y-GUI: A graphical user interface and pre-processor for the combined finite-discrete element code, Y2D, incorporating material heterogeneity. Comput. Geosci. 2010, 36, 241–252. [Google Scholar] [CrossRef]
- Mahabadi, O.; Kaifosh, P.; Marschall, P.; Vietor, T. Three-dimensional FDEM numerical simulation of failure processes observed in Opalinus Clay laboratory samples. J. Rock Mech. Geotech. Eng. 2014, 6, 591–606. [Google Scholar] [CrossRef] [Green Version]
- Itasca, Fast Language Analysis of Continua in 3 Dimensions, Version 5.0; Itasca Consulting Group: Mineapolis, MN, USA, 2012.
- Ma, F.; Zhao, H.; Zhang, Y.; Guo, J.; Wei, A.; Wu, Z.; Zhang, Y. GPS monitoring and analysis of ground movement and deformation induced by transition from open-pit to underground mining. J. Rock Mech. Geotech. Eng. 2012, 4, 82–87. [Google Scholar] [CrossRef] [Green Version]
- Zhao, H.; Ma, F.; Zhang, Y.; Guo, J. Monitoring and mechanisms of ground deformation and ground fissures induced by cut-and-fill mining in the Jinchuan Mine 2, China. Environ. Earth Sci. 2013, 68, 1903–1911. [Google Scholar] [CrossRef]
Figure 1.
Engineering geological map of the Xinli mining area.

Figure 2.
The strike rose diagram.

Figure 3.
The pole isopycnal map.

Figure 4.
Geometric model of cracks in Xinli.

Figure 5.
Numerical model.

Figure 6.
Fracture generation process of surrounding rock caused by excavation. (a) Condition of backfill mining without fissures; (b) condition of mining with fissures; and (c) condition of backfill mining with fissures.
Figure 6.
Fracture generation process of surrounding rock caused by excavation. (a) Condition of backfill mining without fissures; (b) condition of mining with fissures; and (c) condition of backfill mining with fissures.

Figure 7.
Displacement curves of the monitoring points on the ground. (a) Horizontal displacement under the condition of backfill mining without fissures; (b) horizontal displacement under the condition of mining with fissures; (c) horizontal displacement under the condition of backfill mining with fissures; (d) vertical displacement under the condition of backfill mining without fissures; (e) vertical displacement under the condition of mining with fissures; and (f) vertical displacement under the condition of backfill mining with fissures.

Figure 8.
Displacement curves of the monitoring points on the ground at 150,000 time steps.

Figure 9.
Displacement curves of the four monitoring points around the excavation area. (a) Horizontal displacement under the condition of backfill mining without fissures; (b) horizontal displacement under the condition of mining with fissures; (c) horizontal displacement under the condition of backfill mining with fissures; (d) vertical displacement under the condition of backfill mining without fissures; (e) vertical displacement under the condition of mining with fissures; and (f) vertical displacement under the condition of backfill mining with fissures.

Figure 10.
Stress distribution in the surrounding rock. (a) Horizontal stress under the condition of backfill mining without fissures; (b) horizontal stress under the condition of mining with fissures; (c) horizontal stress under the condition of backfill mining with fissures; (d) vertical stress under the condition of backfill mining without fissures; (e) vertical stress under the condition of mining with fissures; and (f) vertical stress under the condition of backfill mining with fissures.


Table 1.
Numerical model parameters.
| Type | Parameter | Quaternary Deposits | Surrounding Rock | Ore Body | Backfill | Fractures |
|---|---|---|---|---|---|---|
| Block | Elastic modulus (MPa) | 0.15 | 5 | 2.1 | 0.5 | - |
| Poisson’s ratio | 0.16 | 0.20 | 0.19 | 0.15 | - | |
| Density (g·cm3) | 1.75 | 2.70 | 2.71 | 1.90 | - | |
| Cohesion (MPa) | 0.05 | 3.2 | 1.4 | 3.2 | - | |
| Internal friction angle (°) | 28 | 32.6 | 32 | 35 | - | |
| Tensile strength (MPa) | 0.05 | 4.25 | 2.9 | 2.0 | - | |
| Surface | Cohesion (MPa) | 0.05 | 3.2 | 1.4 | 3.2 | 0.014 |
| Frictional angle (°) | 32 | 35 | 35 | 38 | 12 | |
| Sliding frictional angle (°) | 28 | 32.6 | 32 | 35 | 10 | |
| Residual frictional angle (°) | 5 | 10 | 10 | 5 | 5 | |
| Tensile strength (MPa) | 0.05 | 4.25 | 2.90 | 2.00 | 0.007 | |
| Fracture energy release rate (N/m) | 50 | 200 | 100 | 200 | 10 | |
| Penalty function (Pa) | 7.5 × 10⁸ | 5.0 × 10¹⁰ | 2.1 × 10¹⁰ | 1.0 × 10⁹ | 2.5 × 10⁹ | |
| Normal contact penalty function (Pa) | 1.5 × 10⁹ | 5.0 × 10¹⁰ | 2.1 × 10¹⁰ | 2.0 × 10⁹ | 5.0 × 10⁹ |
Publisher’s Note: MDPI stays neutral with regard to jurisdictional claims in published maps and institutional affiliations. |
© 2022 by the authors. Licensee MDPI, Basel, Switzerland. This article is an open access article distributed under the terms and conditions of the Creative Commons Attribution (CC BY) license (https://creativecommons.org/licenses/by/4.0/).
Share and Cite
MDPI and ACS Style
Li, G.; Liu, G.; Ma, F.; Guo, J. Numerical Research on Fractured Surrounding Rock Deformation and Failure Law Caused by Submarine Mining. Water 2022, 14, 3171. https://doi.org/10.3390/w14193171
AMA Style
Li G, Liu G, Ma F, Guo J. Numerical Research on Fractured Surrounding Rock Deformation and Failure Law Caused by Submarine Mining. Water. 2022; 14(19):3171. https://doi.org/10.3390/w14193171
Chicago/Turabian StyleLi, Guang, Gang Liu, Fengshan Ma, and Jie Guo. 2022. "Numerical Research on Fractured Surrounding Rock Deformation and Failure Law Caused by Submarine Mining" Water 14, no. 19: 3171. https://doi.org/10.3390/w14193171
Note that from the first issue of 2016, this journal uses article numbers instead of page numbers. See further details here.