Article

Delineation of Hydrochemical Characteristics and Tracing Nitrate Contamination of Groundwater Based on Hydrochemical Methods and Isotope Techniques in the Northern Huangqihai Basin, China

1
Yinshanbeilu Grassland Eco-Hydrology National Field Observation and Research Station, Beijing 100038, China
2
Institute of Water Resources for Pastoral Area, MWR, Hohhot 010020, China
3
Geological Environment Monitoring Institute of Inner Mongolia, Hohhot 010020, China
*
Author to whom correspondence should be addressed.
Water 2022, 14(19), 3168; https://doi.org/10.3390/w14193168
Submission received: 1 September 2022 / Revised: 30 September 2022 / Accepted: 2 October 2022 / Published: 8 October 2022
(This article belongs to the Special Issue Groundwater Quality and Public Health)

Abstract

:
Hydrochemical research and identification of nitrate contamination are of great significant for the endorheic basin, and the Northern Huangqihai Basin (a typical endorheic basin) was comprehensively researched. The results showed that the main hydrochemical facies were HCO3–Mg·Ca and HCO3–Ca·Mg. Spatial variation coefficients of most indices were greater than 60%, which was probably caused by human activities. The hydrochemical evolution was mainly affected by rock weathering and also by cation exchange. The D–18O relationship of groundwater was δD = 5.93δ18O − 19.18, and the dexcess range was −1.60–+6.01‰, indicating that groundwater was mainly derived from precipitation and that contaminants were very likely to enter groundwater along with precipitation infiltration. The NO3(N) contents in groundwater exceeded the standard. Hydrochemical analyses indicated that precipitation, industrial activities and synthetic NO3 were unlikely to be the main sources of nitrate contamination in the study area. No obvious denitrification occurred in the transformation process of nitrate. The δ15N(NO3) values ranged from +0.29‰ to +14.39‰, and the δ18O(NO3) values ranged from −6.47‰ to +1.24‰. Based on the δ15N(NO3) – δ18O(NO3) dual isotope technique and hydrochemical methods, manure, sewage and NH4 fertilizers were identified to be the main sources of nitrate contamination. This study highlights the effectiveness of the integration of hydrochemical and isotopic data for nitrate source identification, and is significant for fully understanding groundwater hydrochemistry in endorheic basins and scientifically managing and protecting groundwater.

1. Introduction

Water quantity affects the extent of water exploitation, while water quality determines the value of water use [1]. In the natural environment, the specific hydrochemical characteristics of groundwater are formed over time in response to the comprehensive influence of climate, topography, aquifer lithology and other factors. The groundwater in some areas is low salinity freshwater and is rich in trace elements that are good for human health (such as Sr, Li and H2SiO3). This kind of water has very high value for use. However, in some areas, the groundwater is naturally inferior, characterized by high levels of salinity, fluorine and arsenic [2,3], which may aggravate water shortages due to poor water quality, especially for the endorheic basins that water resources are rare. Due to the intensification of human activities, the hydraulic head field and hydrochemical evolution process have been disturbed to a certain extent [4,5]. Variation in the vadose zone thickness changes the oxidation–reduction environment of the dissolved minerals during the leaching process. Coupled with the input of artificial contaminants, the hydrochemical characteristics may change. Some activities may improve groundwater quality, while others cause groundwater pollution, such as nitrate contamination [6,7,8,9]. A high content of nitrate in water leads to eutrophication of water bodies and degradation of ecosystems. Drinking groundwater with a high nitrate content for a long time can cause serious diseases, such as methemoglobinemia, blue babies and gastric cancer [9]. At present, nitrogen contamination in water has become an international problem and needs to be solved in order to ensure the safety of drinking water and sustain the ecological health.
Approximately 20% of the Earth’s land is covered by endorheic basins, but the basins account for only 2.3% of the total worldwide annual river runoff, and the hydrochemical research on them has not received enough attention [10]. Dowling et al. [11] studied the arsenic releasing mechanisms in the Bengal Basin based on the statistical methods and correlation analysis. Kawawa et al. [12] used the hydrochemical methods and isotopic techniques to study the mechanism of salinity changes and hydrochemical evolution of groundwater in the Machile–Zambezi Basin, and concluded that high groundwater salinity was associated with pre–Holocene environmental changes and was restricted to a stagnant saline zone. Nipada et al. [13] took the Western Lampang Basin as the study area and researched the arsenic contamination in groundwater based on the PHREEQC software. Endorheic basins are widely distributed in China and nitrate contamination occurs. Many studies have been performed by domestic scholars [5,14,15], but these studies were mainly focused on special indices, such as arsenic and fluorine [16,17]. As regards nitrate concentration, some scholars [6,8,18] pointed out that the nitrate concentrations in their studied basin increased due to the human activities. Mukherjee et al. [19] indicated that the ingestion of untreated nitrate contaminated groundwater in the lower Ganga Basin caused a risk of methemoglobinemia. Avilés et al. [20] concluded that the nitrate content in the Titicaca Basin was influenced by manure piles, synthetic N fertilizers, and sewage collector pipes based on the δ15N(NO3)–δ18O(NO3) isotopic technique. One major limitation of these studies is that the hydrochemical characteristics and identification of nitrate sources were separately researched in general. In fact, the comprehensive analysis of hydrochemical characteristics is conducive to revealing the variability of nitrate and identifying its source, and the two parts should be combined and comprehensively researched.
The northern Huangqihai Basin, located in the northern China, is a typical endorheic basin and plays an important role in the Beijing–Tianjin–Hebei region. Huangqihai Lake is one of the eight well–known lakes in Inner Mongolia, but its area shrank in the past two decades [21]. The groundwater level obviously declines [22]. Nitrate and other indices in the groundwater in some areas exceed the standard and are not suitable for drinking. Excessive exploitation and groundwater quality deterioration aggravate the contradiction between the supply and demand of groundwater resources. What was worse, the ecosystem reliant on groundwater resources has become increasingly fragile. Previous research on the northern Huangqihai Basin mainly focused on ecology [23,24,25], and pointed out that the wetland degeneration and the ecological deterioration were mainly controlled by a series of human activities, such as the unreasonable exploitation of groundwater, river closure and the increase of the building land. Regarding water quality, a few scholars [26,27] evaluated the trophic level of the surface water. However, few studies on the hydrochemistry and nitrate source of groundwater in the Huangqihai Basin have been reported. The northern Huangqihai Basin is an endorheic basin typical in arid and semiarid regions, and the hydrochemical research on it is expected to well develop the research system of endorheic basin. The study objective was the Quaternary phreatic water which often constitutes the most important source of drinking water in semiarid and arid regions but easily influenced by external factors, human health is closely associated with its hydrochemical evolution. In addition, the Huangqihai Basin plays an ecological significant role in the Beijing–Tianjin–Hebei region. Therefore, research on the hydrochemistry and tracing nitrate contamination in the northern Huangqihai Basin is not only significant for developing the theoretical research on endorheic basin, but also has great practical meanings of the sustainable utilization of regional groundwater and ecological protection.
Currently, there are few reports that have systematically and comprehensively analyzed the hydrochemical characteristics and nitrate contamination of groundwater, especially in endorheic basins. This paper intends to comprehensively analyze the hydrochemical characteristics and seeks to highlight the effectiveness of the combined use of hydrochemical and isotopic data for tracing nitrate source. Therefore, the main objectives of this study are: (1) to analyze the hydrochemical characteristics of groundwater and the spatial distributions of the main indices; (2) to reveal the hydrochemical evolution of groundwater; (3) to identify the source of groundwater and the way through which artificial contamination may enter groundwater; and (4) to integrate the dual isotope technique and hydrochemical analyses to identify nitrate contamination. It is expected that this research can enrich hydrogeochemical research on endorheic basins in arid and semiarid regions and provide an effective way to identify the nitrate source.

2. Materials and Methods

2.1. Study Area

The northern Huangqihai Basin (113°2′–113°28′ E, 40°43′–41°3′ N), is located in Right Chahaer County and the Jinning District of Wulanchabu city in Inner Mongolia, China (Figure 1a). The study area has a continental monsoon climate with an annual average temperature of 5.23 °C. The annual average rainfall is 359.30 mm and mainly concentrated in summer. The basin is surrounded by mountains on three sides; the terrain is generally high in the north and low in the south. Surface water resource is rare, the main rivers have dried up in their middle and downstream regions in recent years, and the other rivers are seasonal. The development of the regional social economy is highly dependent on groundwater, especially for agriculture.
The entire study area is covered by the unconsolidated Quaternary sediments and the main aquifer is the Quaternary phreatic aquifer. Based on the lithologic characteristics, the phreatic aquifer is further divided into two aquifers: the Quaternary Holocene lacustrine aquifer (Q4l) and the Quaternary Upper Pleistocene alluvial–diluvial aquifer (Q3al+pl) (Figure 1b). The Q4l aquifer is distributed around Huangqihai Lake and consists of medium and fine sand, while the Q3al+pl aquifer is distributed around the Q4l aquifer and mainly composed of sandy gravel, pebbles and coarse sand. According to previous research [22], the dynamic type of the groundwater level is the rainfall infiltration–artificial exploitation type. In summer, rainfall is abundant, but the groundwater level does not immediately rise and even declines due to the high consumption of irrigation. After irrigation, the groundwater level recovers due to the hysteresis recharge of rainfall and reaches a high level in spring. The groundwater levels and depths may change over time, but the overall flow direction of the Quaternary phreatic water does not obviously change during a hydrological year, that is, the groundwater generally flows from the north to the south following the topography. As for the Quaternary phreatic water (Figure 1b), the Q3al+pl aquifer is located upstream of the hydraulic head field and the Q4l aquifer is located downstream of that. Influenced by the terrain, geomorphic type and hydrological conditions, the hydraulic gradient upstream is steeper than that downstream. As seen from Figure 1c, the groundwater depth changes from deep to shallow from north to south. The groundwater depths near Huangqihai Lake and rivers are usually shallower than 5 m, and the depths in other areas are deeper than 5 m. According to previous studies [22], the extreme evaporation depth of the groundwater is 5 m, in other words, the depths of groundwater in most areas exceed the extreme evaporation depth.

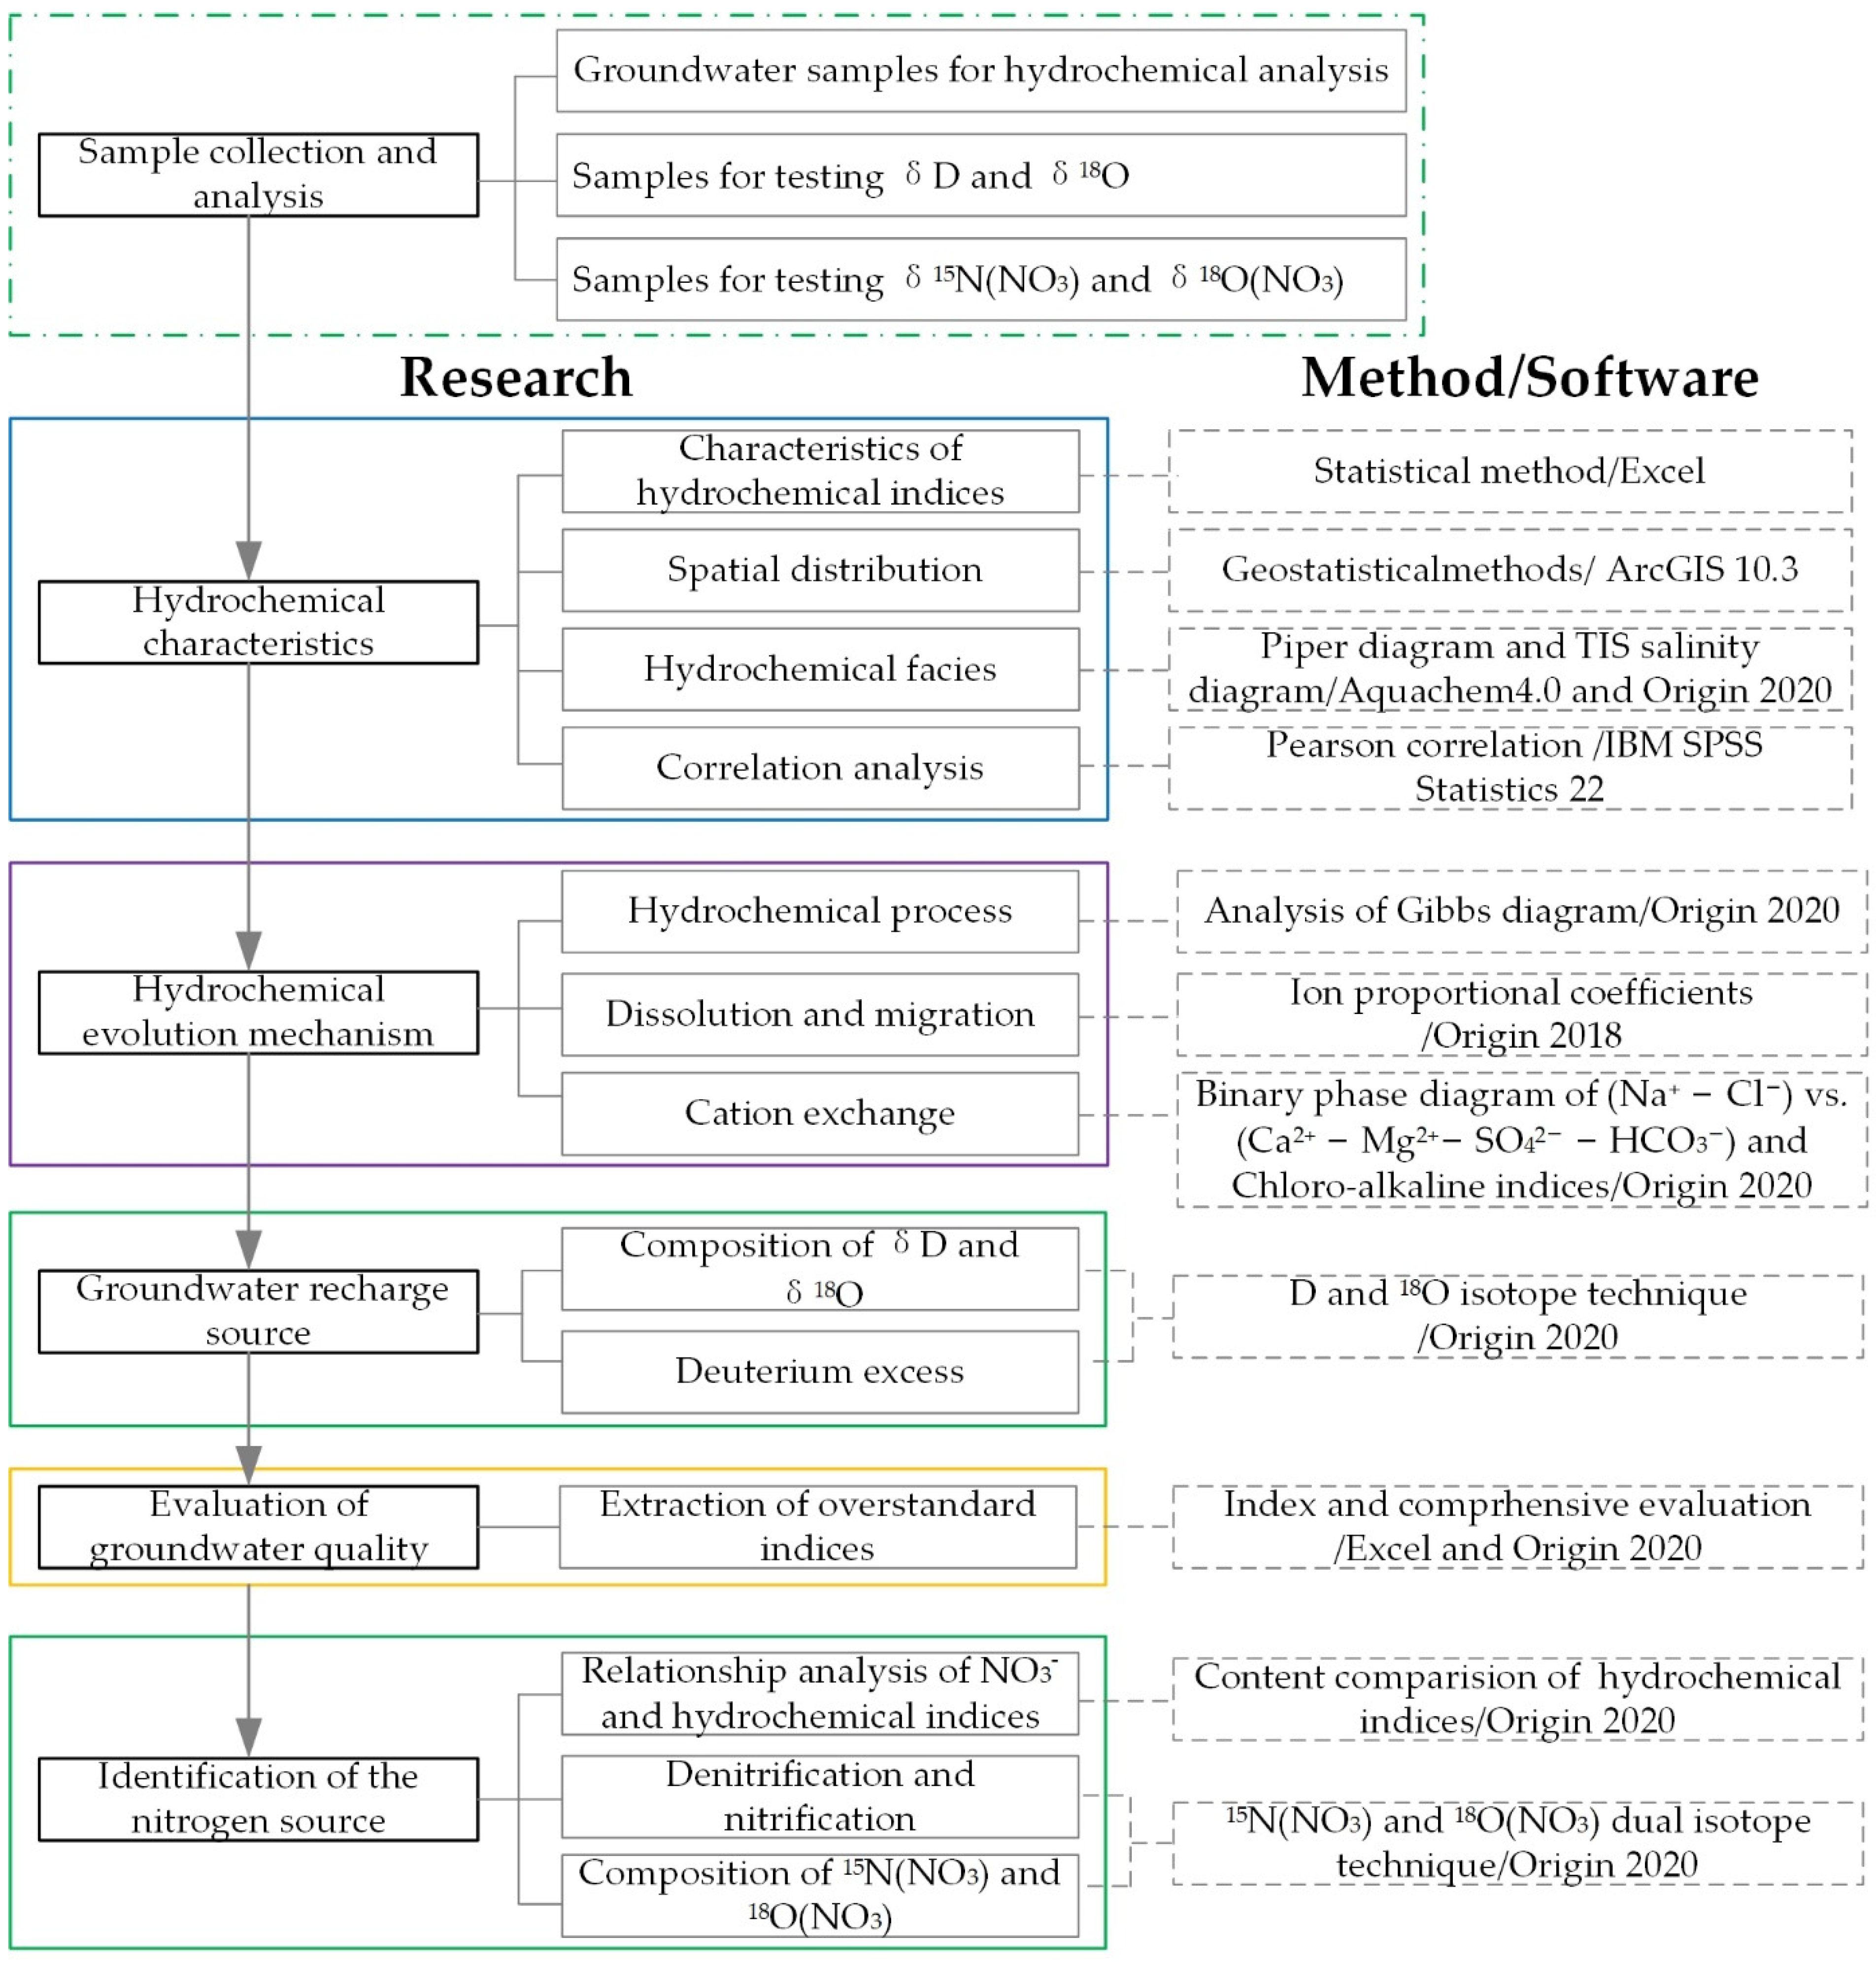
2.2. Data Preparation and Methods

2.2.1. Data Preparation

The groundwater level and depth data were measured in late September 2021. Thirty–eight groundwater samples were collected according to the Groundwater Quality Standard (GB/T 14848-2017) [28]. Before sampling, the wells were pumped for thirty minutes to obtain fresh groundwater. All groundwater samples were collected from the Quaternary phreatic aquifer and evenly distributed in different hydrogeological units (Figure 1a). Groundwater samples were sealed and stored in 5 L PVC bottles that were carefully cleaned before sampling. After collection, the samples were kept at 4 °C and later sent to the Inner Mongolia Mineral Resources Experimental Research Institute for analyzing. Hydrochemical indices were analyzed by using the standard methods as suggested by Analysis Methods of Groundwater quality (DZ/T 0064.1–2021) [29]. pH was analyzed by an ion meter (PXJ–1B, Jiangsu Electric Analysis Instrument Factory, Jiangyan, China). The concentrations of cations (Mg2+, Ca2+, Na+ and K+) and some trace elements (Fe, Mn, Cu, Pb, Cd, etc.) were analyzed by a PerkinElmer Optima 8300 with a detection accuracy of 0.001 mg/L. The concentrations of anions (SO42−, Cl, F and NO3) were measured by ion chromatography (IC850). The concentrations of NH4+, NO2 and H2SiO3 were analyzed by a visible spectrophotometer (7200, Tianmei Scientific Instument Co., LTD, Shanghai, China). The concentrations of HCO3, total hardness (TH) and chemical oxygen demand of manganese (CODMn) were analyzed by the titration method. The total dissolved solids (TDS) were determined by the weighing method (Electronica scales JA31001). The accuracy of the testing results was checked using an ionic error equilibrium, and the relative error was controlled below 3%, which meant that the analyzing results were reliable [30]. Twenty–five chemical indices of the groundwater samples were analyzed. The concentrations of some indices, such as Cu, Cd, Hg, and Cr6+, were low, even below the detection limit. Based on the previous study and the real conditions of the study area, the analysis was focused on the main ions and the overstandard indices.
The samples for testing δD, δ18O, δ15N(NO3) and δ18O(NO3) were collected in late September 2021 and early May 2022 based on the Handbook of Hydrogeology [30], and twelve D–18O isotope samples and twelve 15N–18O(NO3) isotope samples were collected in each phase. These samples were collected form the Quaternary phreatic aquifer, and numbered H1–H6 and H8–H13. D–18O isotope samples were sealed in 10 mL EP plastic tubes, and 15N–18O(NO3) isotope samples were sealed in 50 mL EP plastic tubes after filtering with a 0.45 μm filter, and then stored at a low temperature. All isotope samples were analyzed by the LICA United Technology Limited. The D–18O isotope test machine was a Liquid water isotope analyzer (912–0050, Los Gatos Research, Inc., San Jose, CA, USA), and the 15N–18O(NO3) isotope test machine was a Thermo Fisher MT253 and Flash 2000HT. Three parallel samples (H10′, H11′ and H12′) for analyzing those isotopes were collected and sent to another testing organization (Institute of Hydrogeology and Environmental Geology, Chinese Academy of Geological Sciences), and the relative errors between the results testing from the two testing organizations were all less than 3%.
The main ions (Mg2+, Ca2+, Na+, K+, HCO3, SO42−, Cl) and other indices (NO3, NO2, NH4+, TDS, TH, CODMn and H2SiO3) were used to reflect the hydrochemical characteristics, reveal the hydrochemical evolution and evaluate groundwater quality. The D and 18O isotopes were conducted to analyze the source of groundwater. The relationship analysis among NO3, SO42−, Cl, Na+ and K+ and the 15N(NO3) and 18O(NO3) isotopes were combined to accurately identify nitrate contamination.

2.2.2. Methods

In this study, the hydrochemical characteristics of groundwater were analyzed from four aspects: the concentration characteristics of hydrochemical indices, spatial distribution, hydrochemical facies and correlation analysis among hydrochemical indices. Second, the hydrochemical evolution mechanisms were further studied by applying hydrochemical methods. Then, the main source of groundwater was recognized by using the D–18O isotope technique. Based on the evaluation of groundwater quality, the main sources of nitrate in groundwater were identified by integrating the hydrochemical and isotopic data. The methodology flowchart (Figure 2) is shown below.
(1)
Mole fraction
The mole fraction is the ratio of the amount of substance in a solution to the sum of the amounts of substance in each component, and the equation is listed below [31]. The mole fraction can reflect the relative amount of a substance in a solution and is the basis of the classification of hydrochemical facies and ion proportional coefficient method.
C i = ρ i / M r i i = 1 n ρ i / M r i × 100 %
where Ci is the mole fraction of the i ion, %; ρi is the mass concentration, mg/L; and Mri is the relative molecular mass, 1.
(2)
Shukalev classification
Shukalev classification is a common method of classifying hydrochemical facies and mainly based on the mole fractions of the main ions (Ca2+, Mg2+, Na+ + K+, HCO3, SO42− and Cl). Ions with a mole fraction greater than 25% should participate in the classification of the hydrochemical facies. Based on this, there are 49 hydrochemical facies [30].
Noticeably, the NO3 ion is not considered according to the Shukalev classification. This is mainly because the NO3content is lower than 25% in the natural groundwater environment. However, due to the disturbance of human activities, the content of NO3 may increase and influence the hydrochemical evolution. Kpaйнoв et al. [39] pointed out that the new hydrochemical types (NO3–Ca and NO3–Na type) were widely found in many agricultural areas of the former Soviet Union and the United States. Huang et al. [40] improved the Shukalev classification and took NO3 into consideration when determining the hydrochemical facies. Due to this, the NO3 ion was taken into consideration in this study to indicate nitrate contamination.
(3)
Cation exchange
Through cation exchange, Ca2+ and Mg2+ in groundwater were replaced by Na+, which may affect the cation concentrations and hydrochemical facies [16]. The binary phase diagram of (Na+ – Cl) vs. (Ca2+ + Mg2+ – SO42− – HCO3) can indicate whether cation exchange occurs [16] based solely on the milligram equivalent ratios, this method is simple and not explained in detail here. Chlor–alkali indices can reflect the direction of cation exchange analysis based on the two indices (CAI1 and CAI2), and the equations were listed below [41].
CAI 1 = [ Cl ( Na + + K + ) ] / Cl
CAI 2 = [ Cl ( Na + + K + ) ] / ( SO 4 2 + HCO 3 + CO 3 2 + NO 3 )
where the units of the ions involved in the equations are meq/L. When the values of both CAI1 and CAI2 were negative, the forward reaction of cation exchange occurred in groundwater; when the values of both CAI1 and CAI2 were positive, the backward reaction occurred in groundwater.
(4)
Isotope values
The isotope concentration analyses are usually expressed as the sample deviations from the standard [42]. The calculated equation is shown below.
δ = R s a m p l e R s t a n d a r d R s a m p l e × 1000
where R is the isotope ratio, such as D/1H, 18O/16O and 15N/14N, the H and O isotopes take Vienna Standard mean ocean water (V–SMOW) as the reference standard, the N isotope takes the atmospheric N2 as the reference standard; δ is the sample deviation from the standard, such as δD, δ18O and δ15N, and its unit is ‰.
(5)
Evaluation of groundwater quality
According to the Groundwater Quality Standard (GB/T 14848-2017) [28], groundwater quality is divided into five levels (I~V). Groundwater at levels I~III can be used for domestic drinking, groundwater at level IV can be used for drinking after proper treatment, and groundwater at level V is not suitable for drinking. Taking level III as the standard (Table 1), if the concentration of the evaluated index is inferior to level III, it means that the index is over the standard. When comprehensively evaluating the groundwater sample, the determination of the evaluated level obeys the inferior principle [28].
(6)
Denitrification and nitrification
Due to denitrification, nitrate and nitrite are reduced to gaseous nitrides and nitrogen in an anaerobic environment, which may change the composition of δ15N(NO3) and 18O(NO3) of different nitrogen sources. Therefore, an important prerequisite for using δ15N(NO3) and δ18O(NO3) isotopic values to identify the nitrogen source is that no significant denitrification occurs [43]. If denitrification occurs, the residual NO3 would enrich 15N(NO3), and the content of NO3 decreases [44]. The occurrence of denitrification can also be judged by the enrichment coefficient (εN/εO). According to the research results of Bottcher et al. [45] and Fukada et al. [46], the enrichment coefficient (εN/εO) should range between 1.3–2.1.
(7)
δ15N(NO3) – δ18O(NO3) dual isotope technique
When using the 15N(NO3) alone, the δ15N value ranges between different sources overlap, which leads to multiple solutions. The 15N(NO3) – 18O(NO3) dual isotope technique provides a useful and powerful tool to identify nitrate contaminations by using the stable isotopes 15N and 18O of nitrate together [8]. Combined with hydrochemical methods, the source of nitrate can be accurately identified, which is of great significance to the prevention and control of nitrogen contamination.
Nitrate in groundwater may come from atmospheric deposition, inorganic fertilizer, soil, manure and sewage, and different nitrate sources have specific δ15N(NO3) and δ18O(NO3) value ranges [18,47]. Based on previous research [47,48,49], the ranges of δ15N(NO3) and δ18O(NO3) originating from different sources were classified and are shown in Table 2. Then, the sources of nitrate can be identified by using the δ15N(NO3) – δ18O(NO3) dual isotope technique.

3. Results

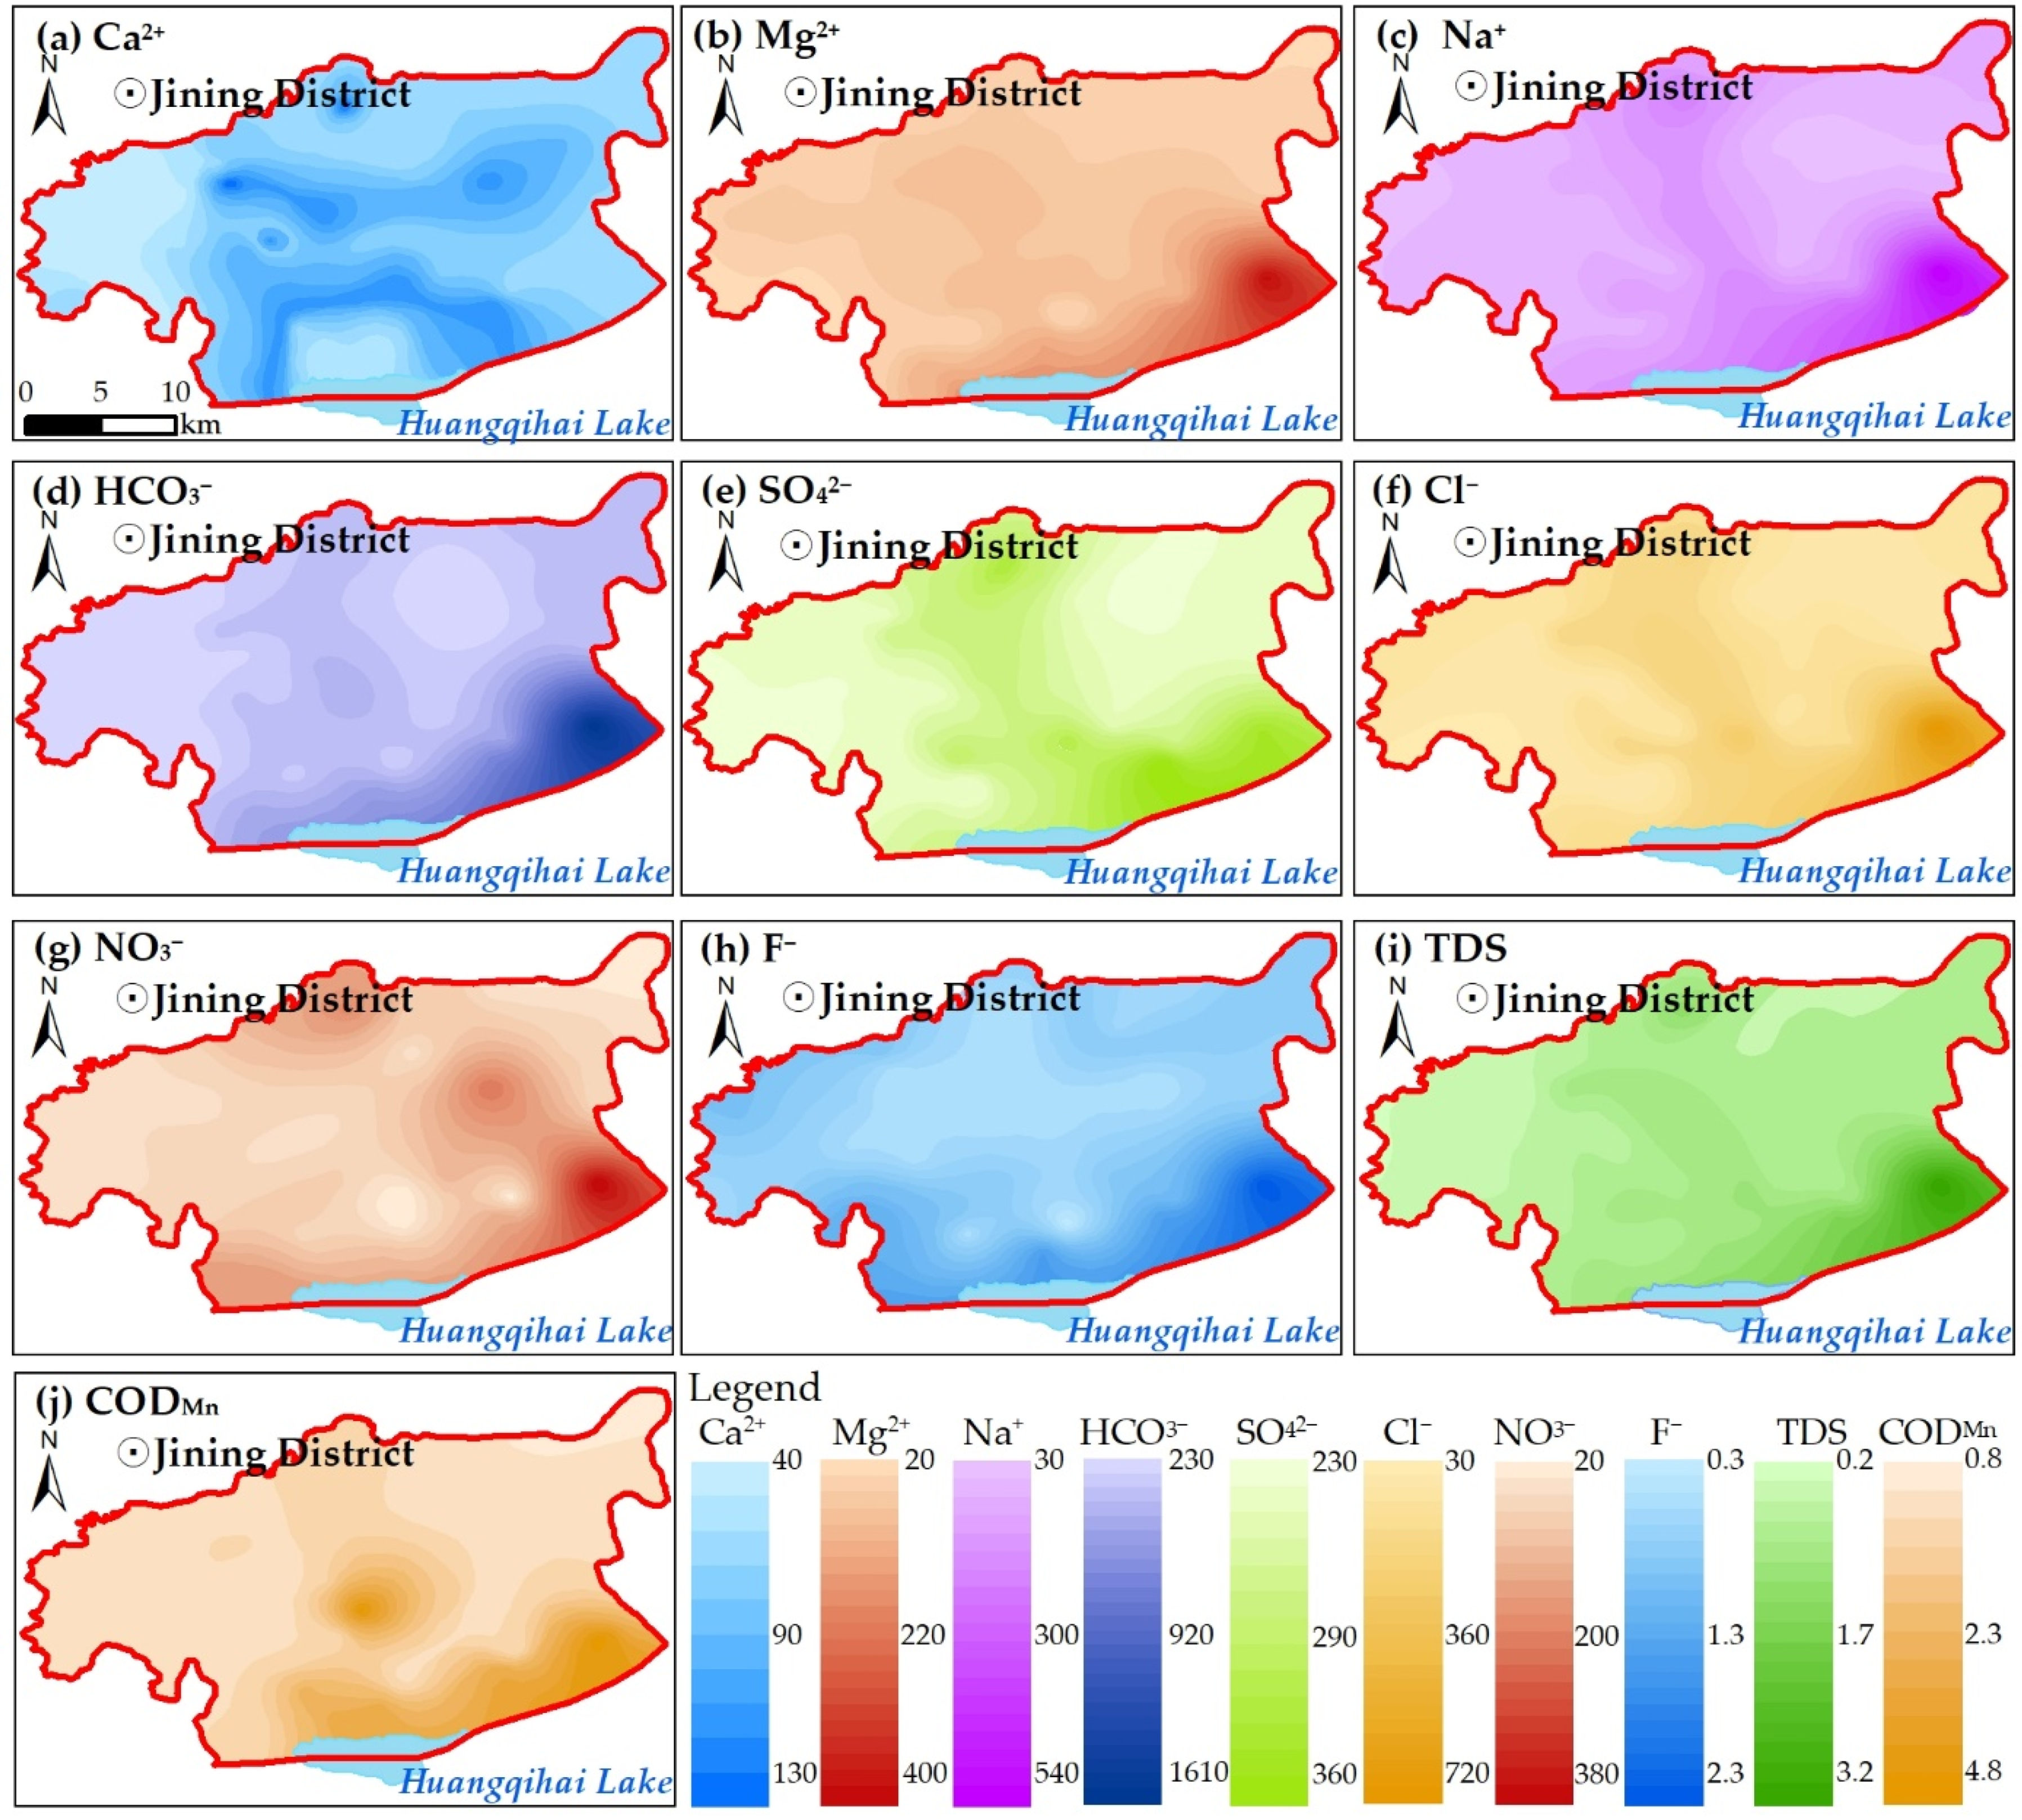
3.1. Hydrochemical Characteristics Analysis

The groundwater in the study area was weakly alkaline with low salinity overall. The pH values ranged from 7.38 to 8.50, with an average value of 7.82. The TDS values ranged from 287.03 to 3426.54 mg/L, with an average of 744.56 mg/L. The SD value of TDS was 545.50 mg/L, and the Cv value was 73.22%, meaning that the spatial dispersion degree of TDS was high. The concentrations of TH were higher, ranging from 362.83 to 1851.67 mg/L, with an average of 451.54 mg/L. The SD value of TH was as high as 1170.65 mg/L, and the Cv value was 63.22%. Among the main anions in groundwater, the content of HCO3 was the highest, followed by Cl, SO42− and NO3. Among the main cations, Mg2+ and Ca2+ were the dominant ions, while the concentrations of Na+ and K+ were relatively lower. The concentrations of F ranged from 0.31 to 2.39 mg/L, with an average of 0.91 mg/L. The NO3− concentrations fluctuated widely, ranging from 0.43 to 419.71 mg/L, with an average of 79.77 mg/L. The concentrations of CODMn ranged from 0.12 to 5.07 mg/L, with an average of 1.44 mg/L. According to Table 3, the SD values of Mg2+, Na+, HCO3, SO42−, Cl, NO3, TDS, TH and CODMn were high, and their Cv values were correspondingly high, which indicated that the dispersion degrees of them were high. The probable reasons for the high Cv values are discussed below.
Hydrochemical characteristics of groundwater may be influenced by natural factors and human activities. Some natural factors, such as earthquakes and volcanic eruptions, may lead to the remarkable increase in the ion contents (K+, Na+, HCO3−, and SO42−), and the influence areas of these factors are large [50,51], while the influences caused by other natural factors are relatively slight. Loose Quaternary sediment is widely distributed in the study area without obvious changes in lithology, no obvious tectonic movement has occurred in recent years, and the extreme values of the analytic indices are distributed discontinuously. Hence, it was inferred that natural factors were not the main cause of the high dispersion and high Cv values. According to previous studies [52], the hydrochemical indices, influenced by human activities, were characterized by high dispersion and high fluctuation, and their Cv values were correspondingly high. Thus, the Cν value can reflect the influence of human activities to some extent, and the disturbance of human activities can also lead to a high value of Cν. In general, there is a variation if the Cν value is higher than 30%, and there is a great variation if the Cν value is higher than 60%. The greater Cν is, the greater the difference, and the greater the influence of external factors on the groundwater index. As shown in Table 3, the Cv values of pH and H2SiO3 were low, meaning that the distributions of the two indices were spatially steady, while the Cv values of other indices were high, the Cv values of Mg2+, Na+, Cl and NO3 were even greater than 100%. The spatial variations were also reflected in Figure 3, the concentrations of these indices in some areas were much higher than those in other areas. In summary, the intensive variations were mainly influenced by human activities.
As shown in Figure 3, the concentrations of TDS, Ca2+, Mg2+, Cl and SO42− in groundwater were generally high in the central region of the study area, low in the east and west, low in the north and high in the south. The terrain of the study area gently slopes toward Huangqihai Lake, and the groundwater runs off slowly; the water – rock interactions were fully reacted, and groundwater ions accumulated from upstream to downstream. Furthermore, the groundwater depths in most areas downstream were shallower than the extreme evaporation depth, and the evaporation of groundwater was intensive. Due to the above factors, the contents of TDS, Ca2+, Mg2+, Cl and SO42− were generally high in the downstream area. The concentration of F was low in the middle and relatively high in the periphery. The concentrations of NO3 and CODMn were relatively low in most areas but high in area nearby the Huangqihai Lake.
Based on the Piper diagram (Figure 4a), the anions were mainly distributed closer to the HCO3 side for the groundwater samples of the upstream aquifer (Q3al+ pl), while the cations were mainly distributed close to the Mg2+ and Ca2+ sides, indicating that the chemical facies upstream were mainly HCO3–Mg·Ca or HCO3–Ca·Mg. For the groundwater samples of the downstream aquifer(Q4l), the cations were obviously biased toward the side of Na+, and the concentrations of anions (Cl and SO42−) increased. Therefore, the anion types gradually transitioned from HCO3 upstream to HCO3·Cl (Cl·HCO3) and Cl·SO4 downstream, and the types of cations changed from Mg·Ca (Ca·Mg) to Mg·Ca·Na (Ca·Mg·Na), and even Na·Mg·Ca (Na·Mg·Ca) and Na type. Noticeably, the NO3 mole fractions of the C29 and C30 samples were 36.25% and 33.18%, respectively. To reflect nitrate contamination [39,40], the NO3 ion was taken into account when determining the hydrochemical facies. Therefore, two new hydrochemical types, except the 49 types, appeared in the C29 and C30 samples, namely, the NO3·HCO3–Ca·Mg and HCO3·NO3·Cl–Ca·Mg facies. According to studies by Apollaro et al. [53], the iso–ionic–salinity (TIS) lines were added in the correlation plot of (Na+ + K+) vs. (Ca2+ + Mg2+) to reflect the ionic salinity. As shown in Figure 4b, the content of Ca2+ and Mg2+ was higher than that of Na+ + K+ on the whole, and the groundwater had low ionic salinity which ranged from 10.43 to 56.21 meq/L. The TDS values were comparatively low with an average of 744.56 mg/L which were in the range of fresh water (TDS < 1000 mg/L).
In this study, the Pearson correlations of groundwater indices were analyzed to reflect the possible sources and chemical reactions related to the hydrochemical indices (Table 4).
According to Table 4, the correlation coefficient (r) of TDS and TH was 0.976, indicating that there was a good positive correlation between them. The two indices had good positive correlations with Mg2+, Na+, Ca2+, Cl, HCO3 and SO42−, reflecting the significant contribution of these elements in mineralization of groundwater. r (Ca2+ vs. Mg2+) did not reach a significance level of 0.05, meaning that there is no obvious relationship between Ca2+ and Mg2+. This was mainly because the sources of Ca2+ and Mg2+ or the reactions related to the two ions in groundwater were different. Both Ca2+ and Mg2+ had a positive relationship with SO42−, which indicated that sulfates rich in calcium and magnesium were dissolved in groundwater. r (Mg2+ vs. HCO3) was as high as 0.968; that is, the dissolution of carbonate rich in Mg2+ in groundwater, such as dolomite, was the main source of Mg2+. Meanwhile, r (Ca2+ vs. HCO3) was small and did not reach the significance level of 0.05, indicating that the dissolution of carbonate was not the main source of Ca2+ in groundwater or that the relationship between Ca2+ and HCO3 was weaker due to other reactions, such as cation exchange and crystallization. r (Na+ vs. Cl) was as high as 0.951, indicating that the dissolution of salt rocks in groundwater was the main source of Na+ and Cl. According to r (Na+ vs. HCO3) and r (Na+ vs. SO42−), both of which were higher than 0.8, it was inferred that there were other sources of Na+ in addition to the dissolution of salt rock. H2SiO3 was positively correlated with Mg2+ and Na+, illustrating the dissolution of silicate containing Mg2+ and Na+ in groundwater. F had a relatively good correlation with pH, HCO3, Na+ and Cl, that is, high F groundwater was generally accompanied by a distinctive hydrochemical characteristic: Ca–poor and Na–rich with alkaline conditions and high HCO3 concentration. These results were consistent with previous studies [16,54,55]. The dissolution of fluorite and some silicate minerals, such as micas, was the main source of F in groundwater [3].

3.2. Hydrochemical Evolution Mechanism

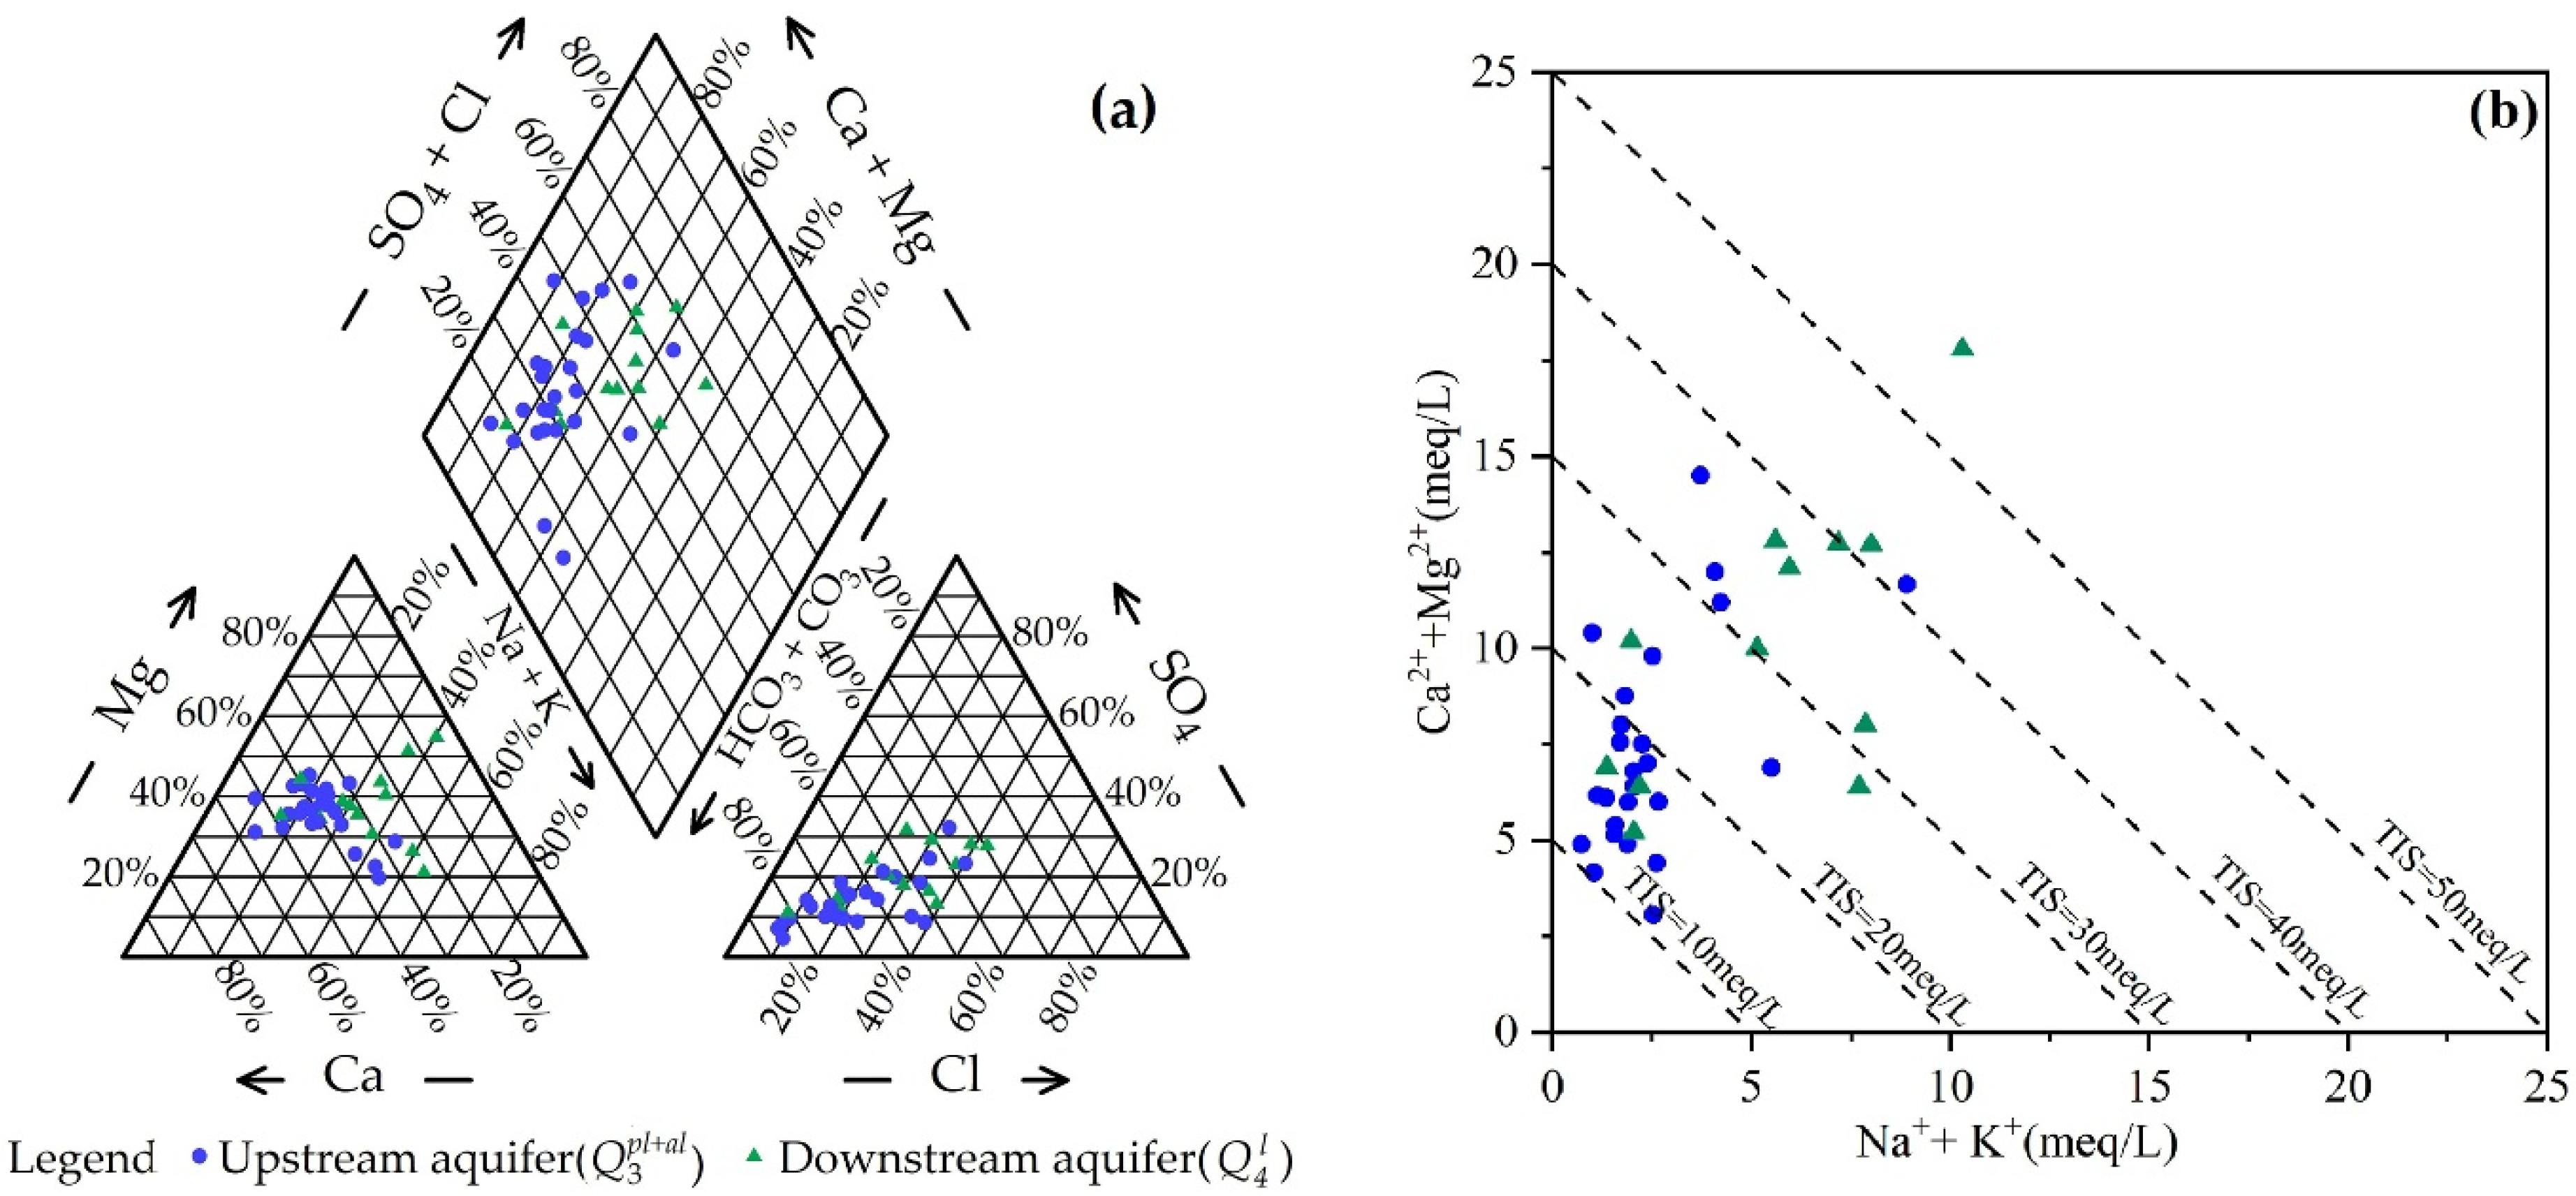
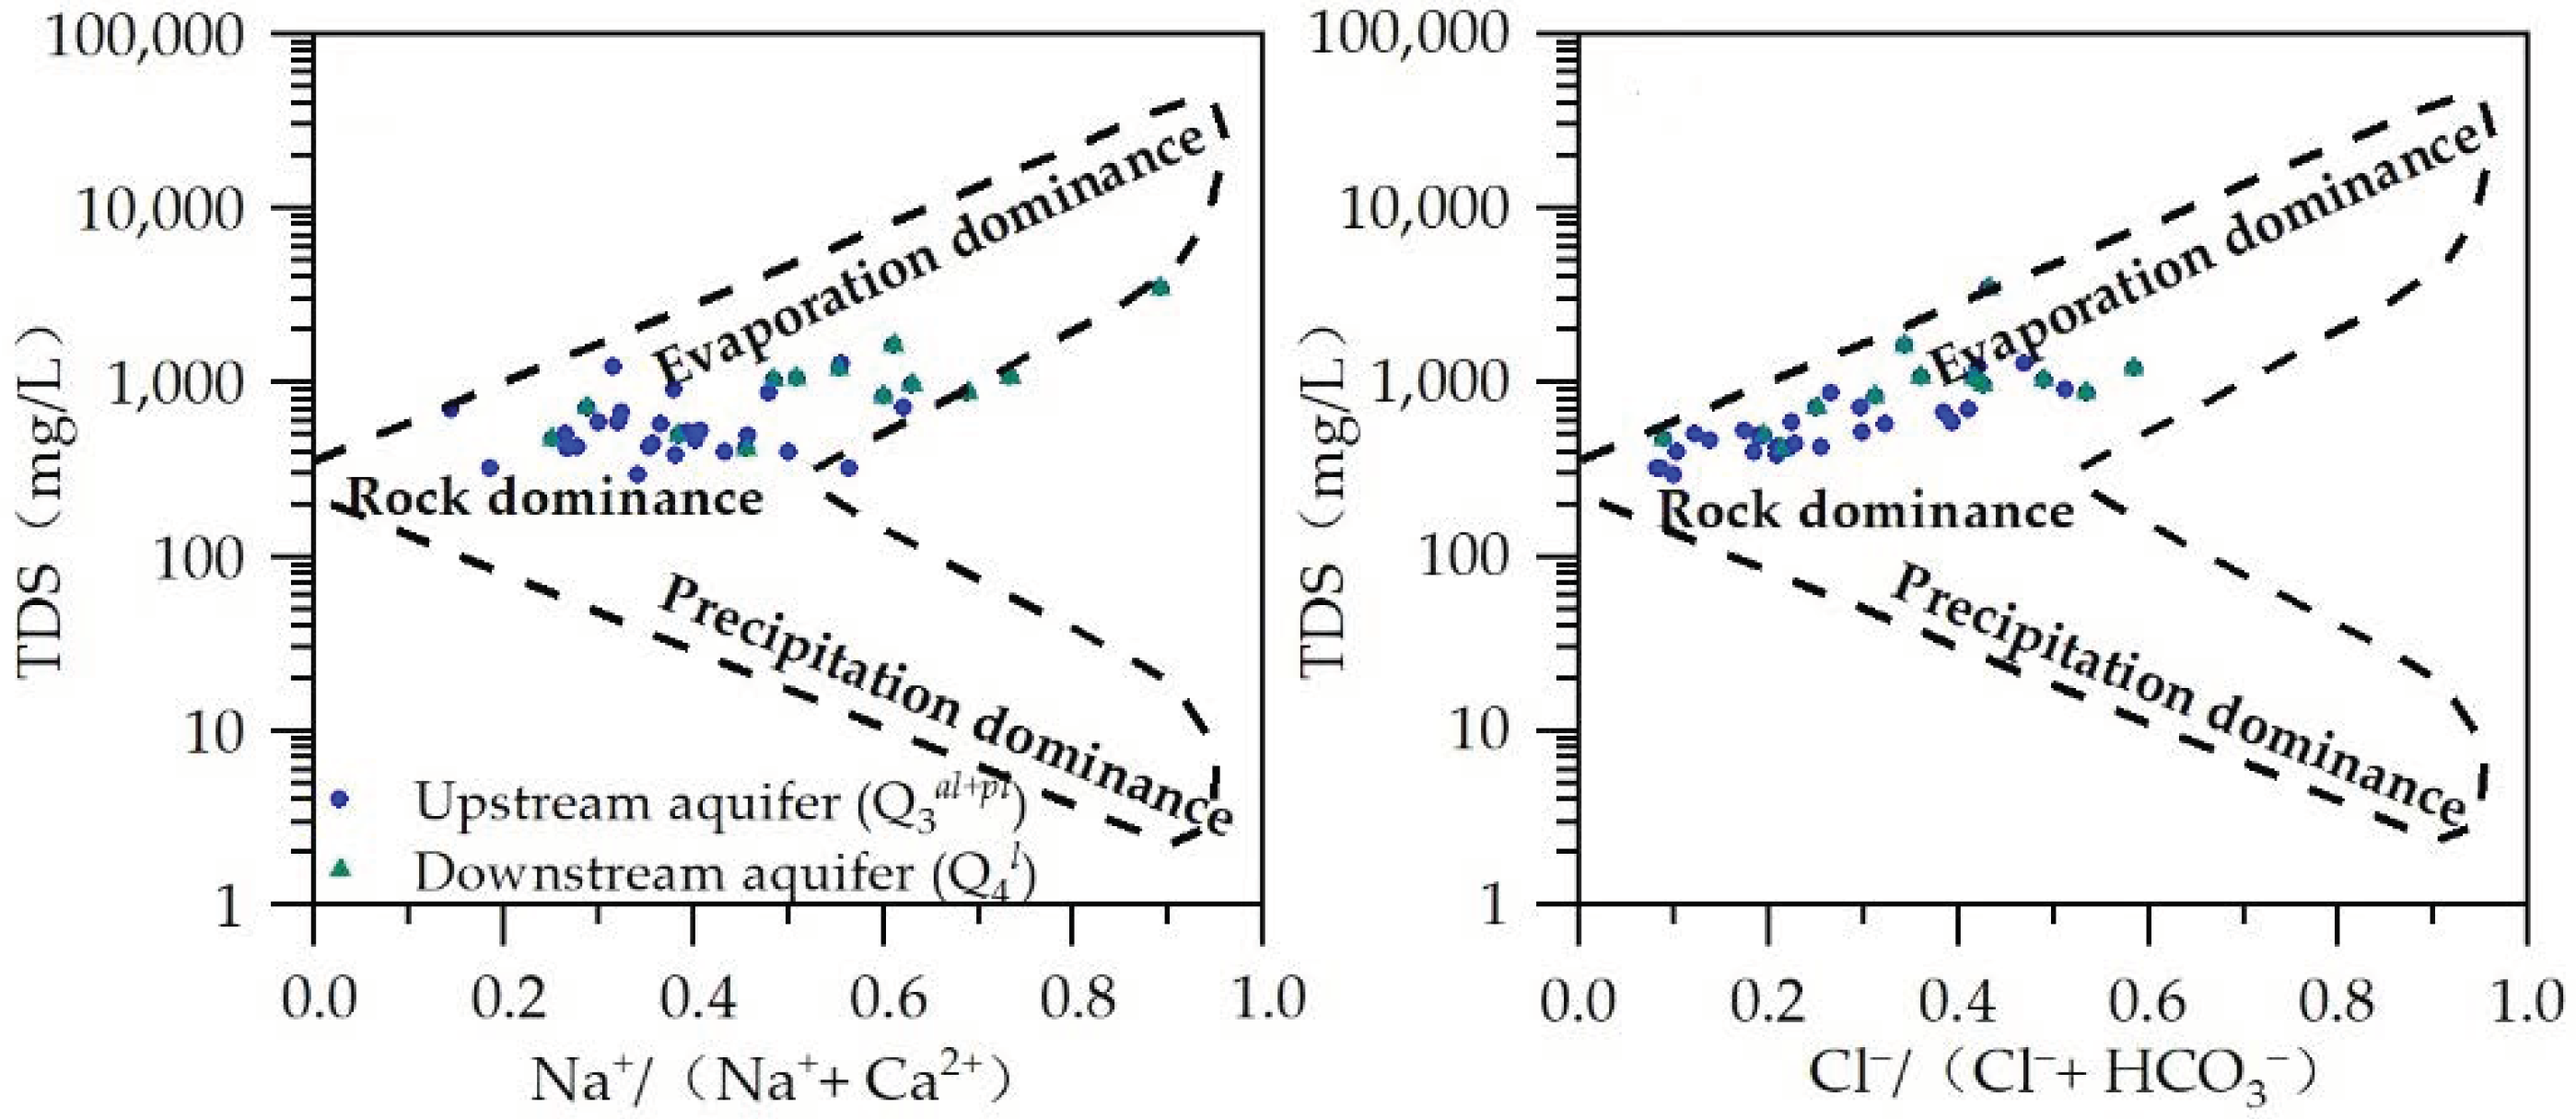
3.2.1. Hydrochemical Process

According to the Gibbs diagram, the main evolution mechanism of groundwater was classified into three types: evaporation, rock weathering and atmospheric precipitation [5,33,41]. As shown in Figure 5, the ratio of Na+/(Na+ + Ca2+) ranged from 0.14 to 0.59, and the ratio of Cl/(Cl + HCO3) ranged between 0.05 and 0.59, indicating that the ions’ concentrations of groundwater in the study area were mainly affected by rock weathering. The Na+/(Na+ + Ca2+) and Cl/(Cl + HCO3) ratios of the downstream aquifer (Q4l) were larger than those of the upstream aquifer (Q3al+pl). The burial depth of groundwater gradually became shallow from upstream to downstream, evaporation strengthened, some Ca2+ ions were precipitated as CaCO3, and the contents of Na+ and Cl were further concentrated.

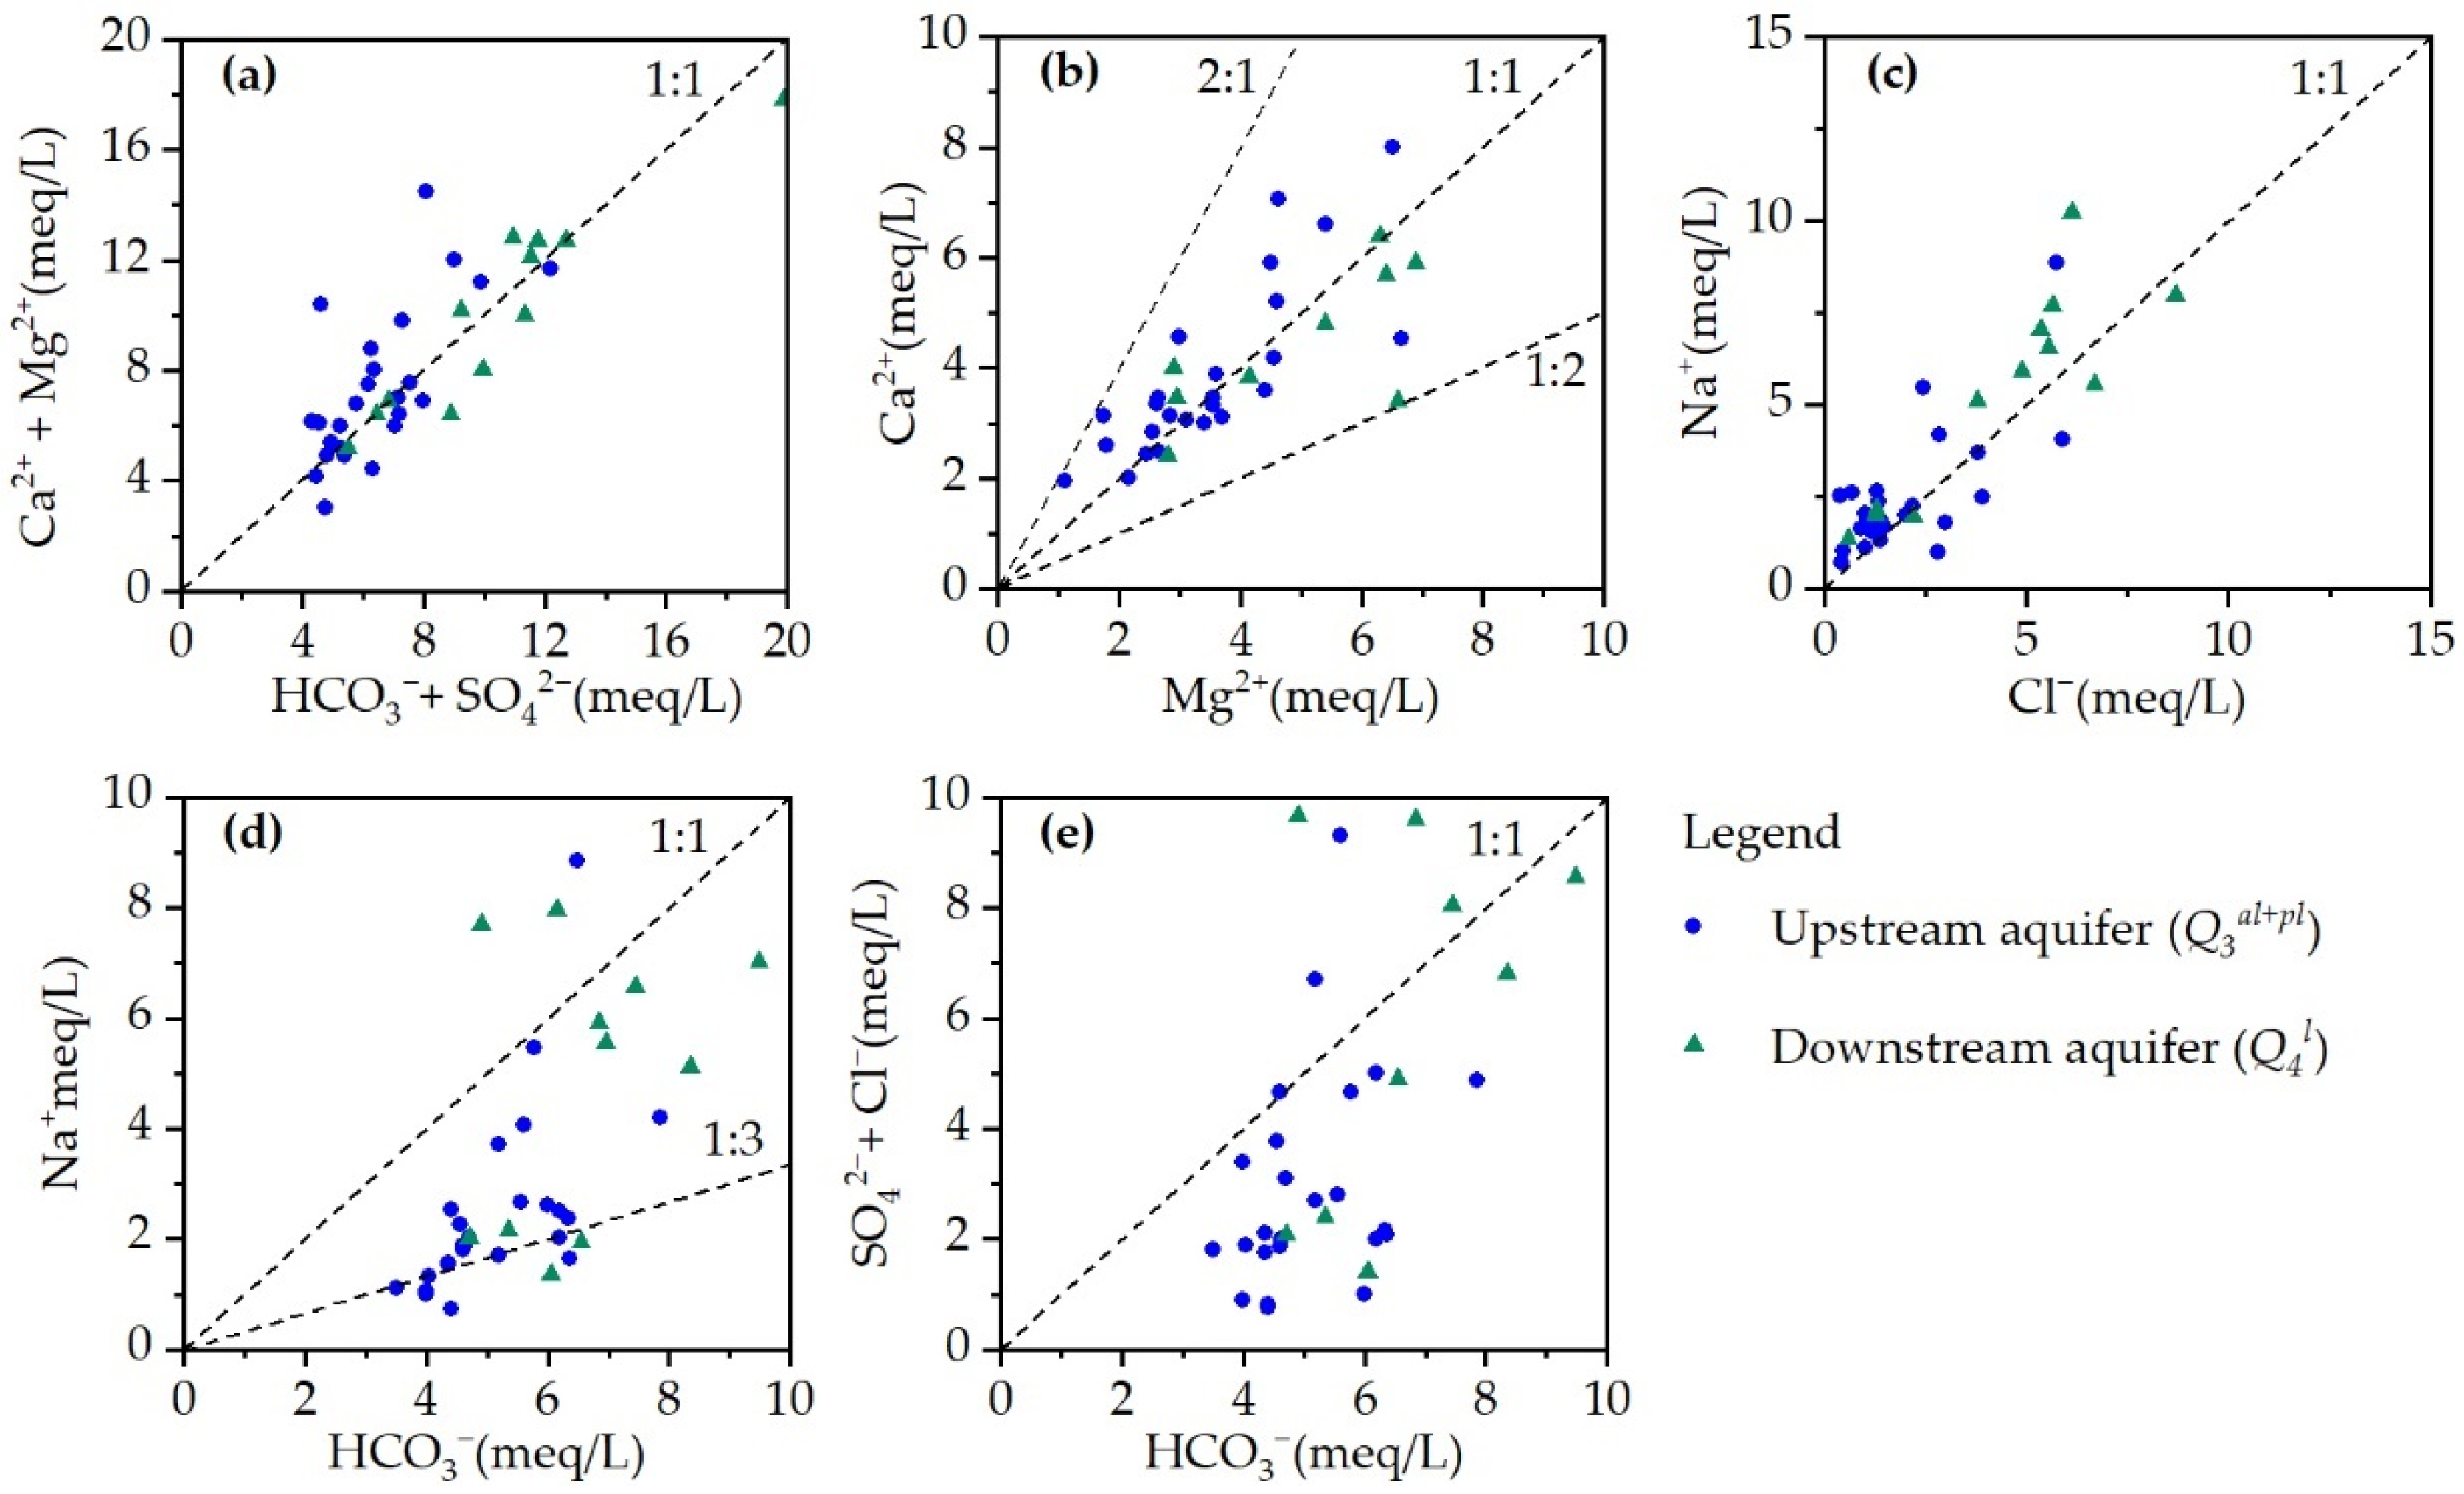
3.2.2. Analysis of the Main Dissolution and Migration

Based on the above analysis, the probable dissolutions and migrations were further judged by using the ion proportional coefficients method [16,56].
(1)
(Ca2+ + Mg2+)/(HCO3 + SO42−)
In general, Ca2+ and Mg2+ in groundwater mainly come from the dissolution of carbonate, silicate and evaporite, so the (Ca2+ + Mg2+)/(HCO3 + SO42−) ratio was used to determine the main sources of Ca2+ and Mg2+ [16]. As shown in Figure 6a, the samples were mostly located above the 1:1 line, led by the groundwater samples in the upstream aquifer (Q3al+pl). Combined with Table 4, r (Ca2+ vs. SO42−) and r (Mg2+ vs. SO42−) were high, which indicated that Ca2+ and Mg2+ in the groundwater were derived not only from the dissolution of carbonate and silicate minerals, but also from the dissolution of sulfate minerals. The ratios of (Ca2+ + Mg2+)/(HCO3 + SO42−) in some groundwater samples were less than 1:1, which may be caused by carbonate precipitation and cation exchange.
(2)
Ca2+/Mg2+
The ratio of Ca2+ to Mg2+ was used to reflect the dissolution of calcite and dolomite [41]. As shown in Figure 6b, the samples were generally distributed near the 1:1 line. The samples in the upstream aquifer (Q3al+pl) were mostly distributed above the 1:1 line; that is, the Ca2+ content was higher than the Mg2+ content, indicating that the main dissolved carbonate in the groundwater was calcite. Meanwhile, the samples in the downstream aquifer (Q4l) were mostly distributed below 1:1; that is, the Ca2+ content was lower than the Mg2+ content in the downstream aquifer (Q4l). Dolomite dissolution produces 1:1 Ca2+/Mg2+, and calcite only produces Ca2+. If calcite or dolomite was dissolved in groundwater, the content of Ca2+ should be higher than that of Mg2+. In fact, the Ca2+ contents were lower than the Mg2+ contents, indicating that cation exchange may occur and that the Ca2+ ions in groundwater were adsorbed on the surface particles of the aquifer.
(3)
Na+/Cl and Na+/HCO3
The Na+/Cl ratio can indicate the dissolution of salt rocks and silicates in groundwater [16]. Most of the samples were located above the 1:1 line (Figure 6c). In the process of hydrochemical evolution, the content of Cl was steady and participated less in the reaction, and its main source was the dissolution of the salt rocks. The Na+ content was higher than the Cl content, which may be due to silicate dissolution as well as salt rock dissolution during the flow process of groundwater [57].
Plagioclase exists in the study area [22]. Plagioclase minerals generally include albite, labradorite (intermediate), anorthite and so on. Groundwater in the study area was in a slightly alkaline environment, in which plagioclase dissolved. The dissolution reactions are listed below. According to (5) and (6), the albite released 1:1 Na+/HCO3and 1:3 Na+/SiO2, and the labradorite produced 1:3 Na+/HCO3 and 1:3 Na+/SiO2 [4]. Figure 6d shows that the ratio of Na+/HCO3 mostly ranged between 1:3 and 1:1, which meant that the content of HCO3 was higher than that of Na+. Combined with Table 4, r (Na+ vs. HCO3) and r (Na+ vs. H2SiO3) were positive, indicating the dissolution of albites and labradorites in groundwater. If the dissolution degrees of albite and labradorite were the same, both would release 1:3 Na+/SiO2. However, r (Na+ vs. HCO3) was higher than r (Na+ vs. H2SiO3), meaning that the reaction degree of labradorites was more intensive than that of albites. Furthermore, cation exchange also affected the content of Na+.
Albite: NaAlSi3O3 + CO2 + 2H2O = Na+ + 3SiO2 + Al(OH)3 + HCO3
Labradorites: 2NaCaAl3Si5O16 + 3CO2 + 9H2O = 2Na+ + 2 Ca2+ + 2SiO2 + 3Al2Si2O5(OH)4 +6HCO3
(4)
(SO42− + Cl)/HCO3
The dissolution of carbonate and silicate was the main source of HCO3 in the study area, while the weathering and dissolution of salt rocks and the oxidation of sulfide minerals were the main sources of Cl and SO42−. Most of the samples were distributed below the 1:1 line (Figure 6e), which meant that the content of HCO3 was higher than that of SO42− and Cl. This result indicated that the dissolution of carbonate and silicate minerals played a dominant role in the hydrochemical process, while the dissolution of salt rock and oxidation of sulfur minerals was relatively weak.

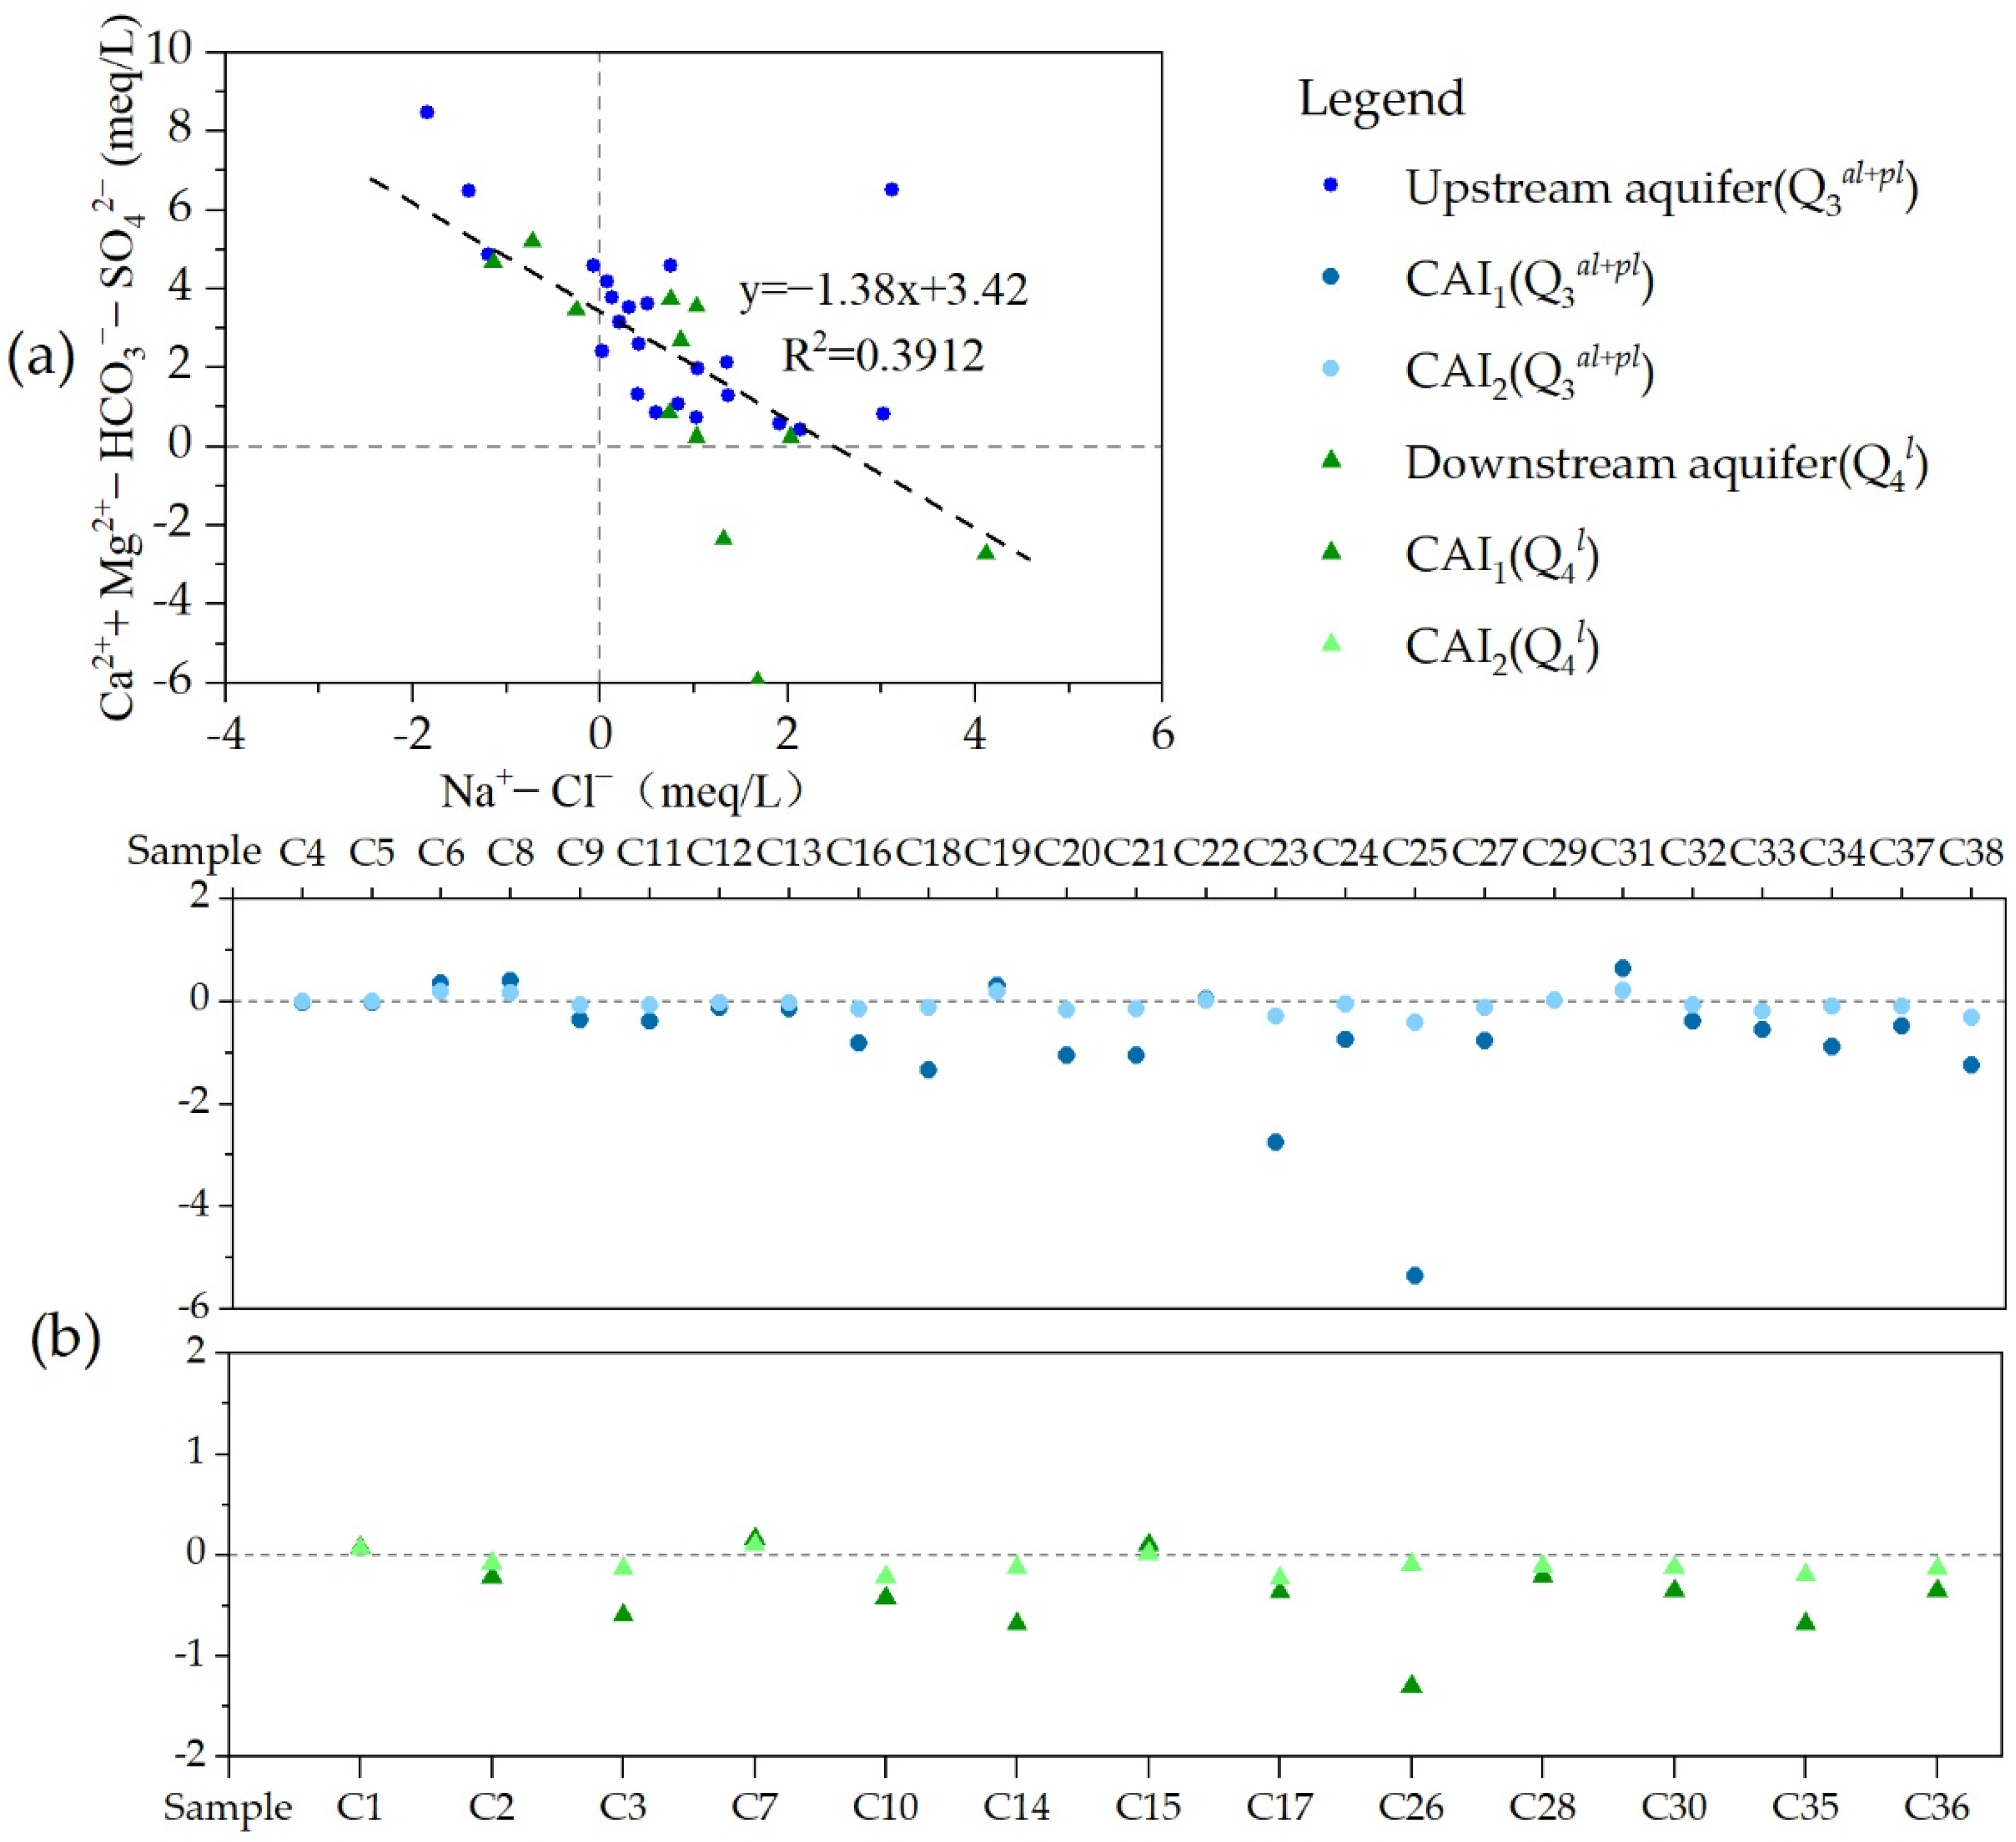
3.2.3. Cation Exchange

Cation exchange influenced the main cations concentration, and it was judged by using the binary phase diagram of (Na+ − Cl) vs. (Ca2+ + Mg2+ − SO42− − HCO3) and Chlor–Alkali indices [4,16].
(1)
(Na+ − Cl) vs. (Ca2+ + Mg2+ − SO42− – HCO3)
If cation exchange was the dominant process influencing the contents of Na+, Ca2+ and Mg2+, the relationship between the two parameters was negative linear, with a slope of −1.0. As shown in Figure 7a, there was a certain linear relationship between (Na+ – Cl) and (Ca2+ + Mg2+ − SO42− − HCO3) in groundwater, but the correlation coefficient was low. It was indicated that cation exchange existed in the hydrogeochemical process, but it did not play a dominant role in the changes in the contents of Na+, Ca2+ and Mg2+.
(2)
Chloro–alkaline indices
According to Figure 7b, the CAI1 and CAI2 values of most groundwater samples were smaller than 0, indicating that Ca2+ and Mg2+ in groundwater were replaced by Na+, and the reactions occurred: Ca2+ + 2NaX 2Na+ + CaX; Mg2+ + 2NaX 2Na+ + MgX. This was mainly because the sorptive abilities of Ca2+ and Mg2+ are higher than that of Na+ [31]. The CAI1 and CAI2 values of a few samples were greater than 0, which indicated that the Na+ ions in groundwater in some areas were exchanged by Ca2+ or Mg2+ ions, and the reactions might occur: 2Na+ + CaX Ca2+ + 2NaX; 2Na+ + MgX Mg2+ + 2NaX. Previous studies [31,58,59] have shown that cation exchange is also influenced by other factors, such as the sediment granularity in the aquifer, pH and concentrations of the ions. Taking C1 and C7 as examples, the Na+ contents of the two samples were much higher than the average content, and the high Na+ content might cause the Na+ ions in groundwater to be exchanged with the Ca2+ or Mg2+ ions in aquifer media.

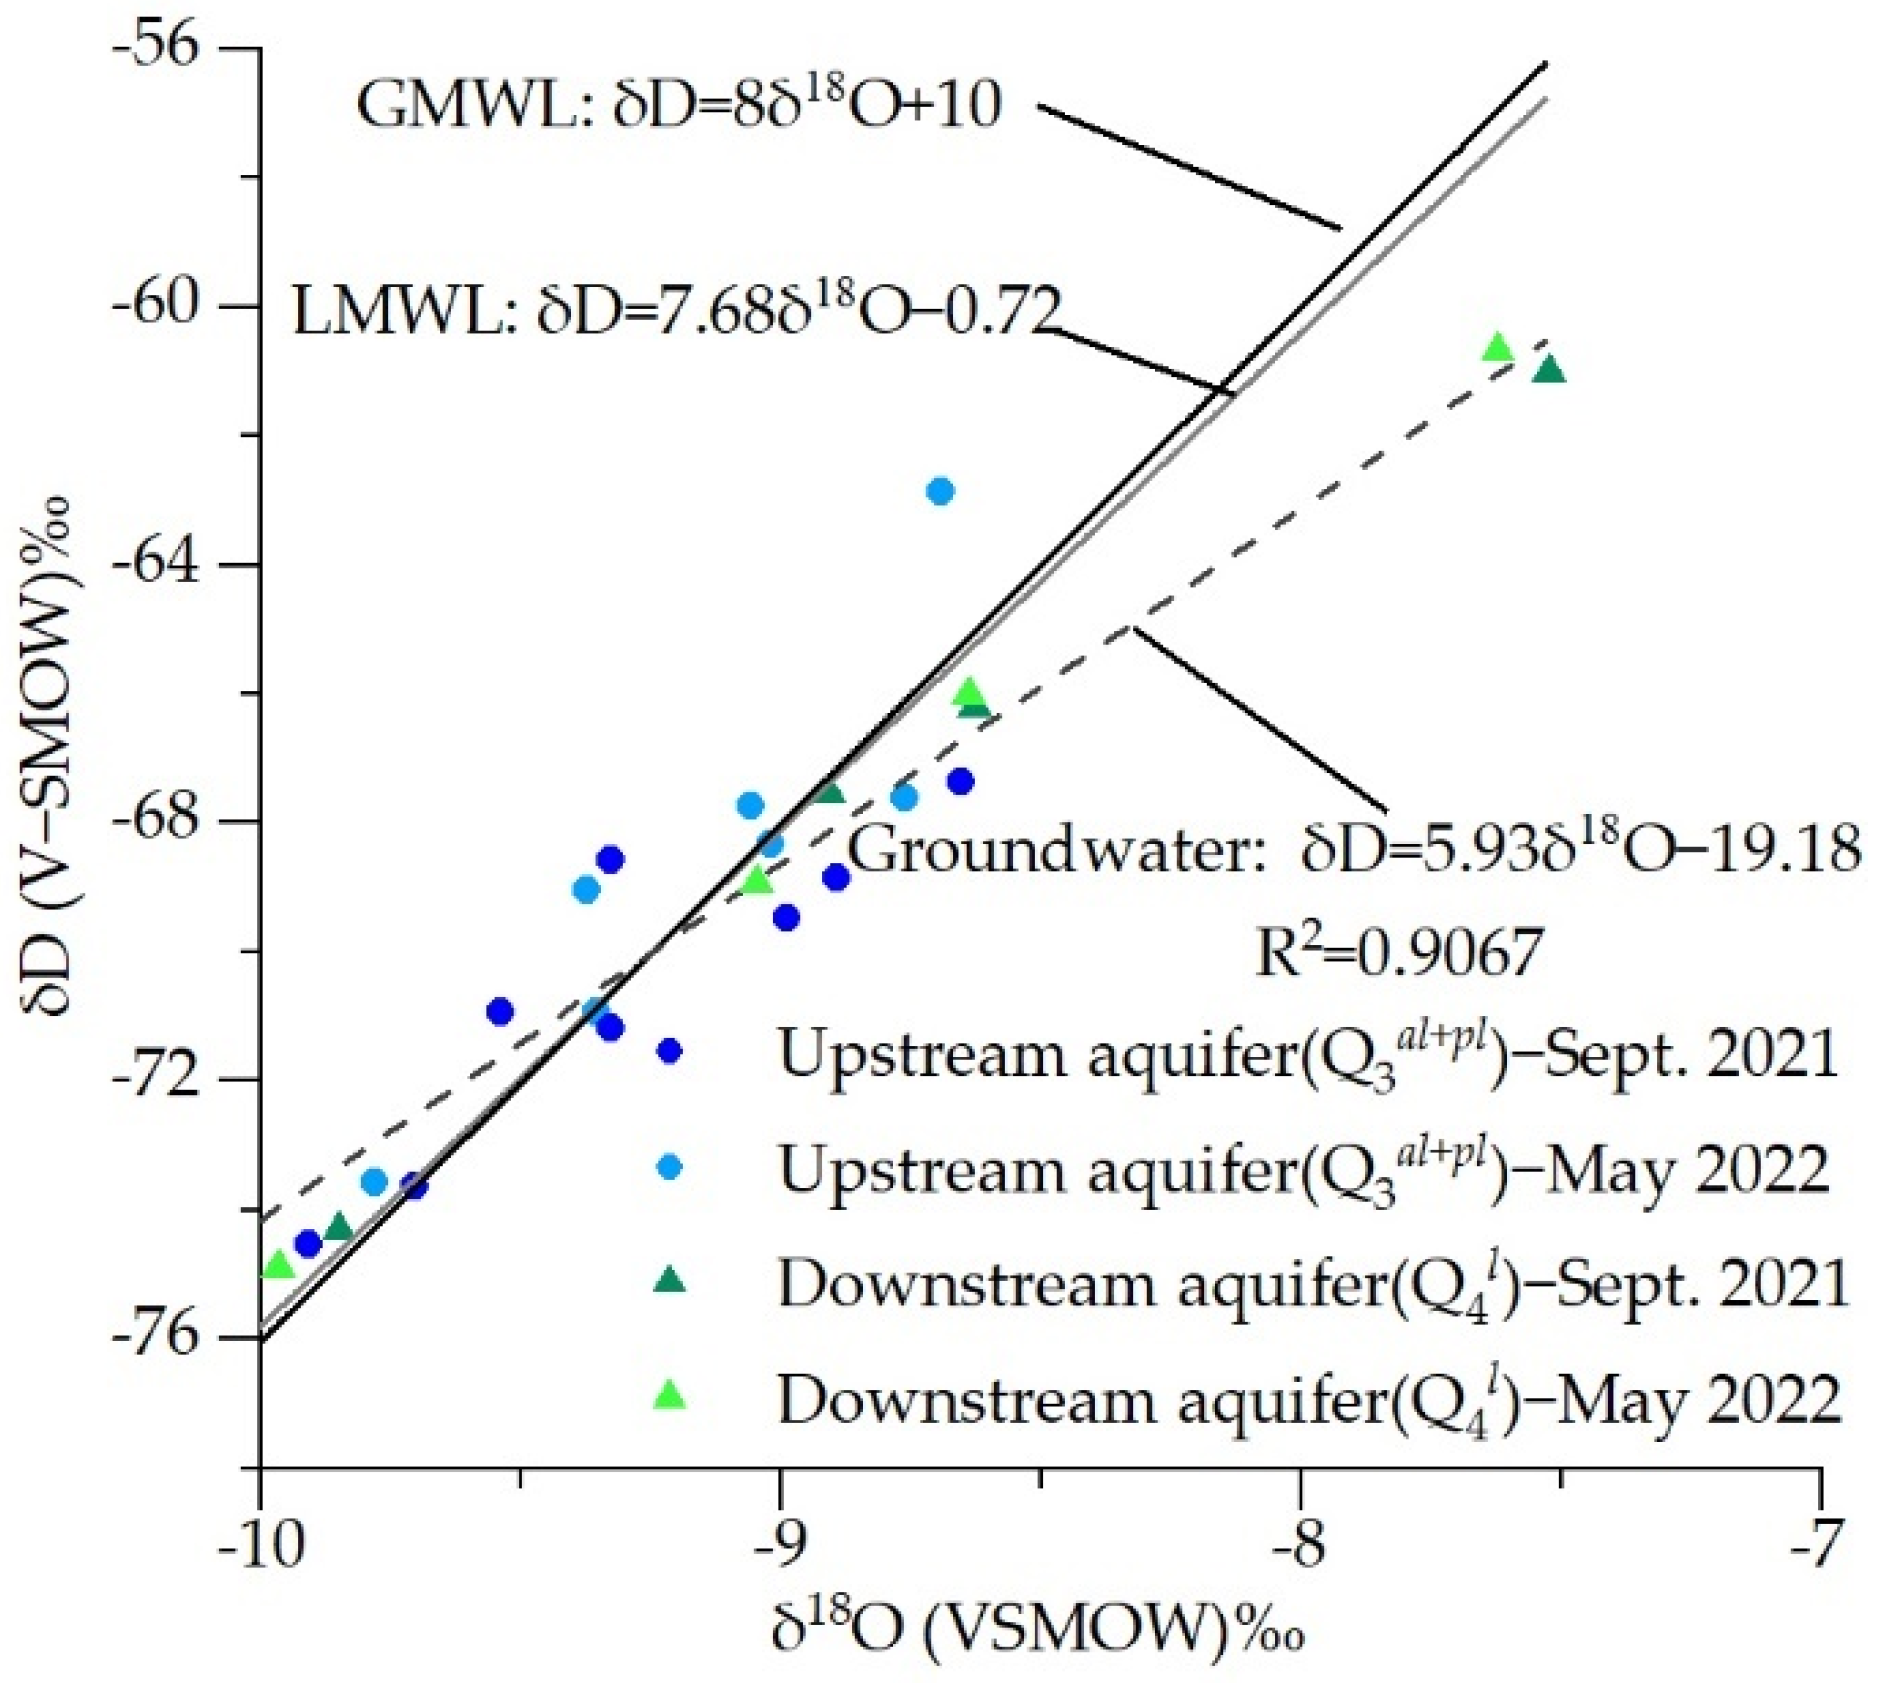
3.3. Groundwater Source

The global meteoric water line (GMWL) was δD = 8δ18O + 10 [60]. Due to the lack of the precipitation isotopic data of the study area, the local meteoric water line (LMWL) of Hohhot, which was located in the same climate zone as the study area and near the study area, was chosen to reflect the D–18O isotopic composition of precipitation in the study area, and the LMWL equation was δD = 7.68δ18O − 0.72 (R2 = 0.8964) [61]. The study area is situated inland with less precipitation and intensive evaporation, and is comprehensively influenced by the East Asian summer monsoon and westerly circulation. The water vapor of the precipitation, which was caused by westerly circulation, originates from the North Atlantic and is transported from Xinjiang to inland China. It is characterized by low humidity and obvious secondary evaporation, which causes the temperature effect [61,62]. The water vapor brought by the East Asian summer monsoon has a high humidity and is slightly influenced by evaporation; along with transportation inland, the heavy isotopes are preferentially condensed, and δD and δ18O values in precipitation decrease with increasing of precipitation, which was called the rainfall effect [61,62]. For the above reasons, the slope of the LMWL was less than that of the GMWL (Figure 8).
The δD values of groundwater ranged from −74.93 to −61.01‰, the δ18O values of groundwater ranged from −10.08 to −7.39‰, and the averages of δD and δ18O were 69.14 and 9.07‰, respectively. Samples were mostly distributed near the LMWL (Figure 8), and the linear equation of δD and δ18O of groundwater was δD = 5.93δ18O − 19.18 (R2 = 0.9067), indicating that local atmospheric precipitation was the main source of groundwater. Contaminants were very likely to enter groundwater along with the precipitation infiltration. The linear slope of δD and δ18O of groundwater was lower than that of GMWL (8) and LMWL (7.68), which meant that heavy isotopes were further enriched by evaporation during the runoff process of groundwater. The isotopic composition (δD and δ18O) was influenced to some extent by the regional climate and local processes (evaporation, vegetation distribution, anthropogenic activities) [48]; thus, the δD and δ18O values of groundwater may be different in different areas and different times. According to Table 5, the averages of δD and δ18O downstream were higher than those upstream which was caused by the intensification of evaporation in the shallow groundwater depth area. Comparing the δD and δ18O values in different seasons (Table 5), the δ18O averages in May 2022 were slightly higher than those in September 2021 regardless of whether the groundwater samples were distributed upstream and downstream; the δD average downstream in May 2022 was just 0.30‰ higher than that in September 2021, and the average upstream in May 2022 was −0.55‰ lower than that in September 2021. The reasons for the difference between different times need further research based on monthly isotopic data over years, and measurement uncertainty should be taken into consideration.
The deuterium excess values (d–excess = δD − 8δ18O) were used to analyze the intensity of groundwater evaporation. The stronger the evaporation was, the more negative the d–excess value was [63]. The d–excess values of groundwater ranged from −1.60 to 6.01‰, with an average value of 3.38‰. The average of d–excess in the study area was positive but smaller than the d–excess average of the global meteoric water (10‰) [60]. It was indicated that the ion contents of groundwater in the study area were controlled by water–rock interactions and influenced by evaporation. Due to intensive evaporation, the contents of ions are generally concentrated in the groundwater. The solubilities of some salts (such as NaCl) are high, and the contents of their ions in groundwater (such as Na+ and Cl) can increase to a high level. On the other hand, the solubilities of some salts (such as CaCO3) are low. Taking CaCO3 as an example, the content of Ca2+ increases due to evaporation, but once its content is saturated, the Ca2+ ion in groundwater precipitates in the form of CaCO3, Ca2+ + CO3 = CaCO3↓, and the Ca2+ content in the groundwater decreases. This may change the ion compositions of groundwater, and further influence the hydrochemical facies. In general, intensive evaporation in the shallow aquifer can cause an increase in the TDS and TH contents [64].
By comparing the d–excess values of groundwater in different seasons (Table 5), the d–excess average in May (3.42‰) was slightly higher than that in September (3.40‰). Due to the lack of time series data of isotopes, the possible reasons were preliminarily inferred based on previous studies [61,65]: (1) the difference in the isotopic composition of precipitation (the main source of groundwater) between different seasons and (2) the different influences of evaporation on groundwater between different seasons. The measurement uncertainty should be considered. Continuous measurements of stable isotopes both in precipitation and groundwater and further research are needed. From the spatial distribution, the d–excess values decreased from the upstream aquifer (Q3al+pl) to the downstream aquifer (Q4l). The main reason was that the water–rock interactions continuously proceeded along the direction of groundwater runoff, and an oxygen shift occurred. The burial depth of groundwater became shallow from north to south, and evaporation intensified; thus, the heavy isotopes were enriched. From the time perspective, the content of Cl would be enriched due to evaporation. According to the Pearson correlation analysis, r (Cl vs. δ18O) was 0.611, but it did not reach the significance level of 0.05, indicating that evaporation slightly affected the isotopic compositions.

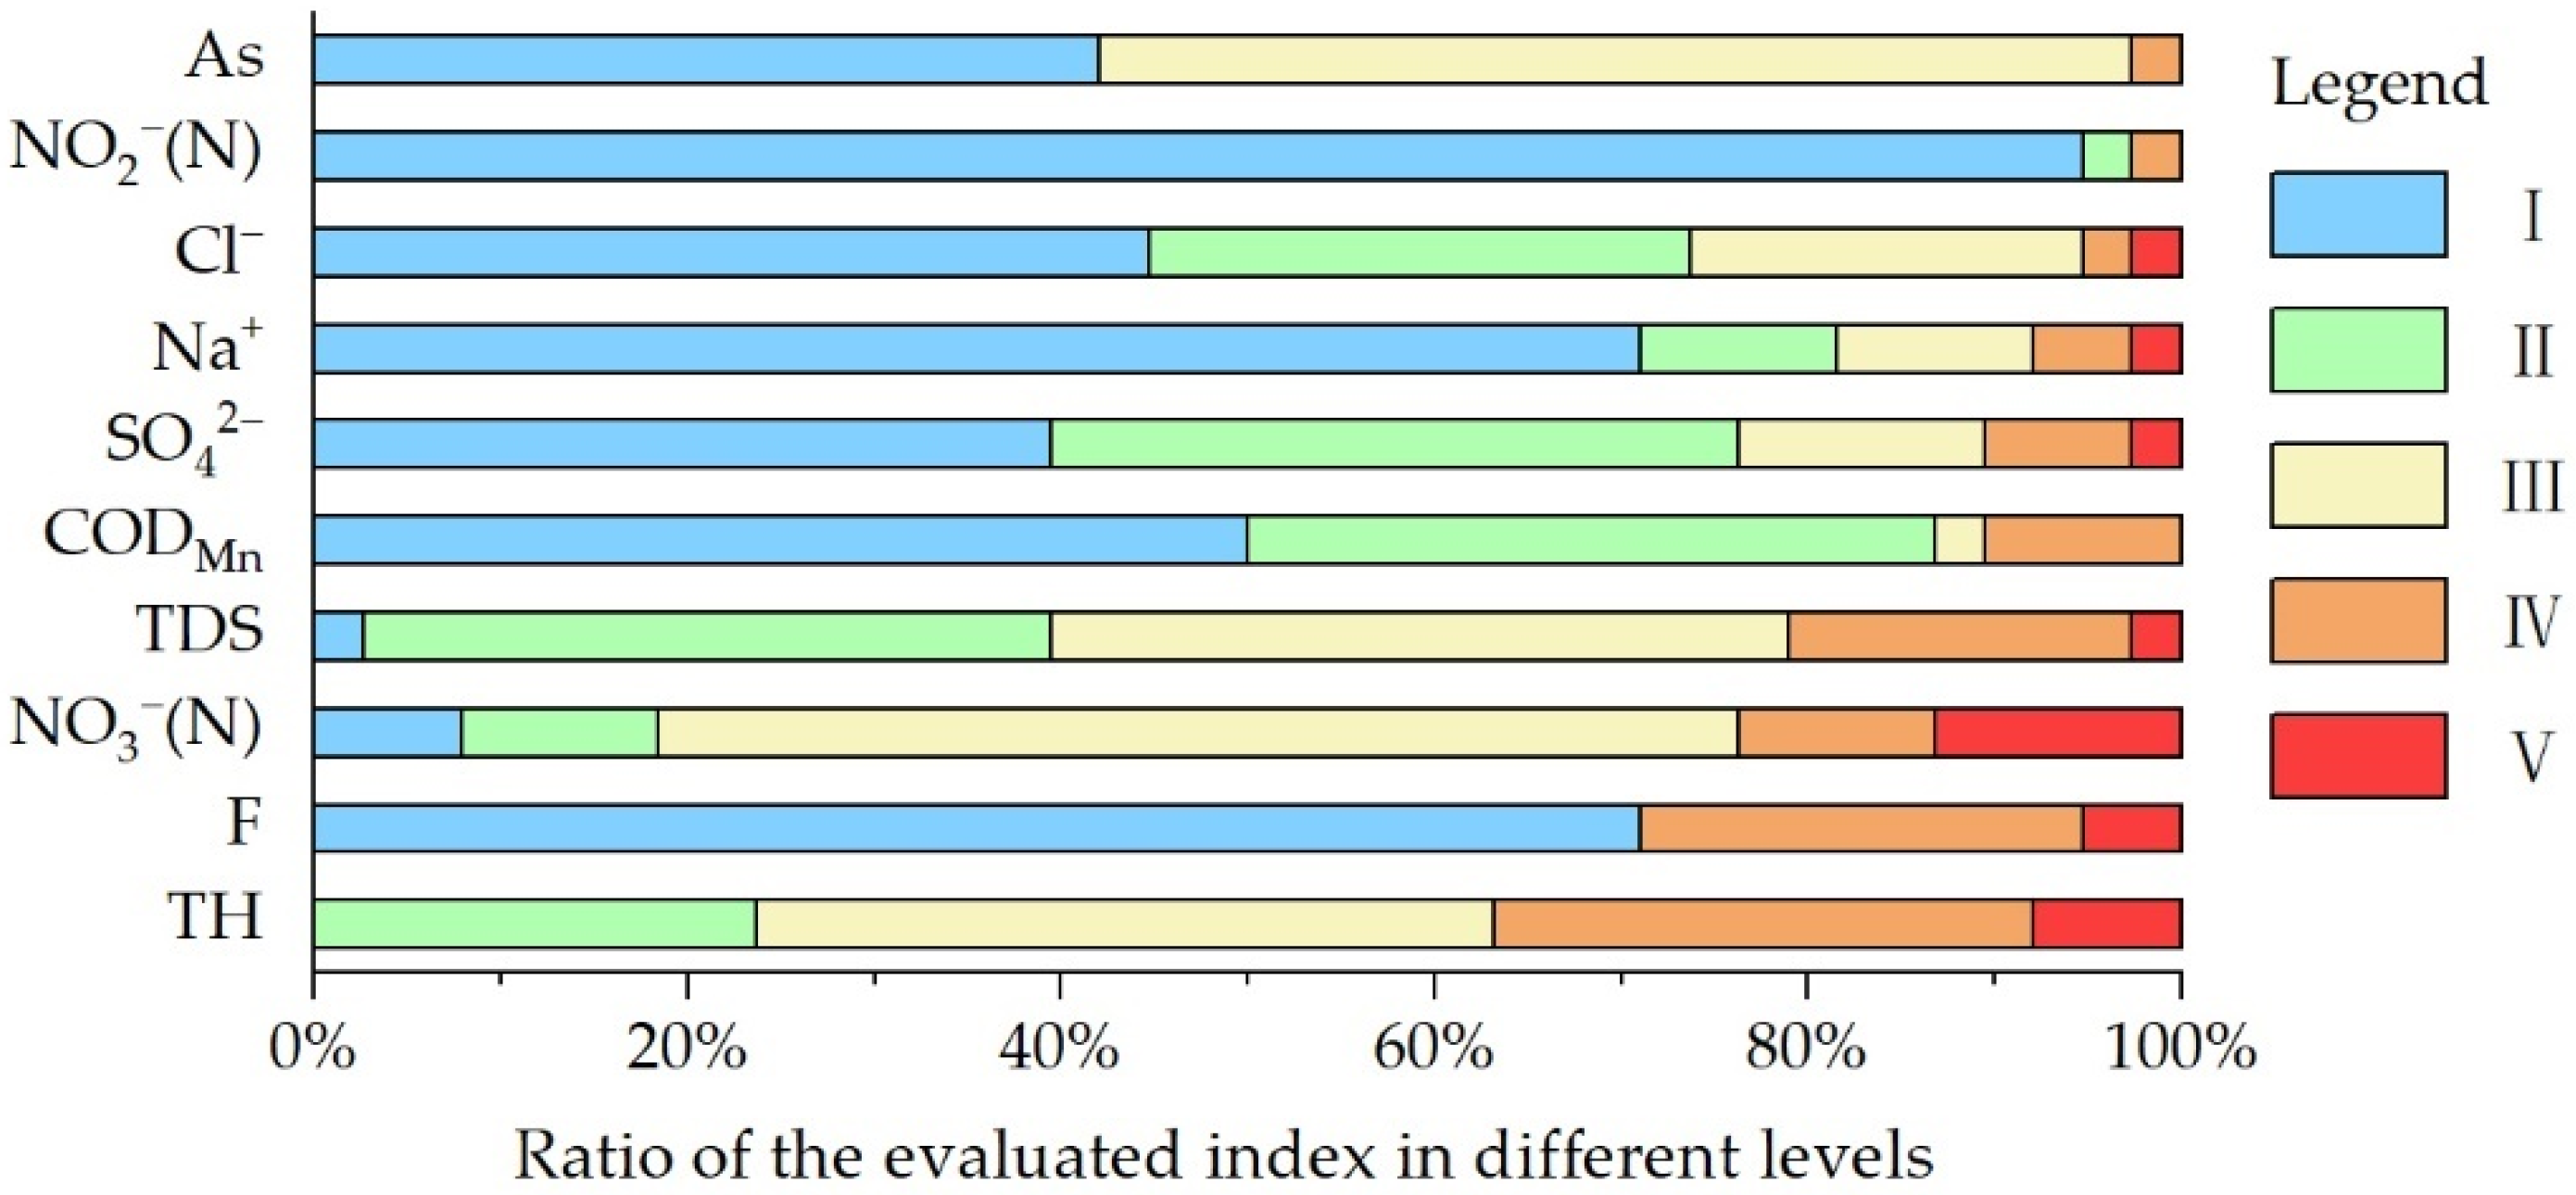
3.4. Evaluation of Groundwater Quality

According to the Groundwater Quality Standard (GB/T 14848-2017), the comprehensive overstandard rate of groundwater in the study area was 60.53% by following the inferior principle, and the overstandard indices were TH, F, NO3(N), TDS, CODMn, SO42−, Na+, Cl, NO2(N) and As. The statistical data of the overstandard indices are shown in Table 6 and Figure 9.
The indices (TH, TDS, F, Na+ and Cl) in groundwater exceeded the standard, mainly due to natural factors. The climate in the study area is arid, evaporation is intensive, the groundwater flows slowly due to the gentle terrain, and the background contents of F in some areas are high. All these factors led to the overstandard of these indices. The concentrations of NO3(N) and NO2(N) in some areas exceeded the standard. According to Table 6, the highest concentration of NO3(N) was 4.74 times that of Level III, and the concentration of NO2(N) was 1.35 times that of Level III. Combining Table 3 and Figure 3, the spatial variations in NO3(N) and NO2(N) in the study area were strong, indicating that the contents of NO3(N) and NO2(N) were influenced by human activities. CODMn is a common index to reflect the pollution of organic oxidizable substances in groundwater [66]. CODMn in the study area had a strong spatial variability. Concentrations of CODMn in some zones were higher than 3 mg/L, indicating that the synthetic organic compounds caused the deterioration of the groundwater environment by human factors.

3.5. Identification of Nitrogen Contamination
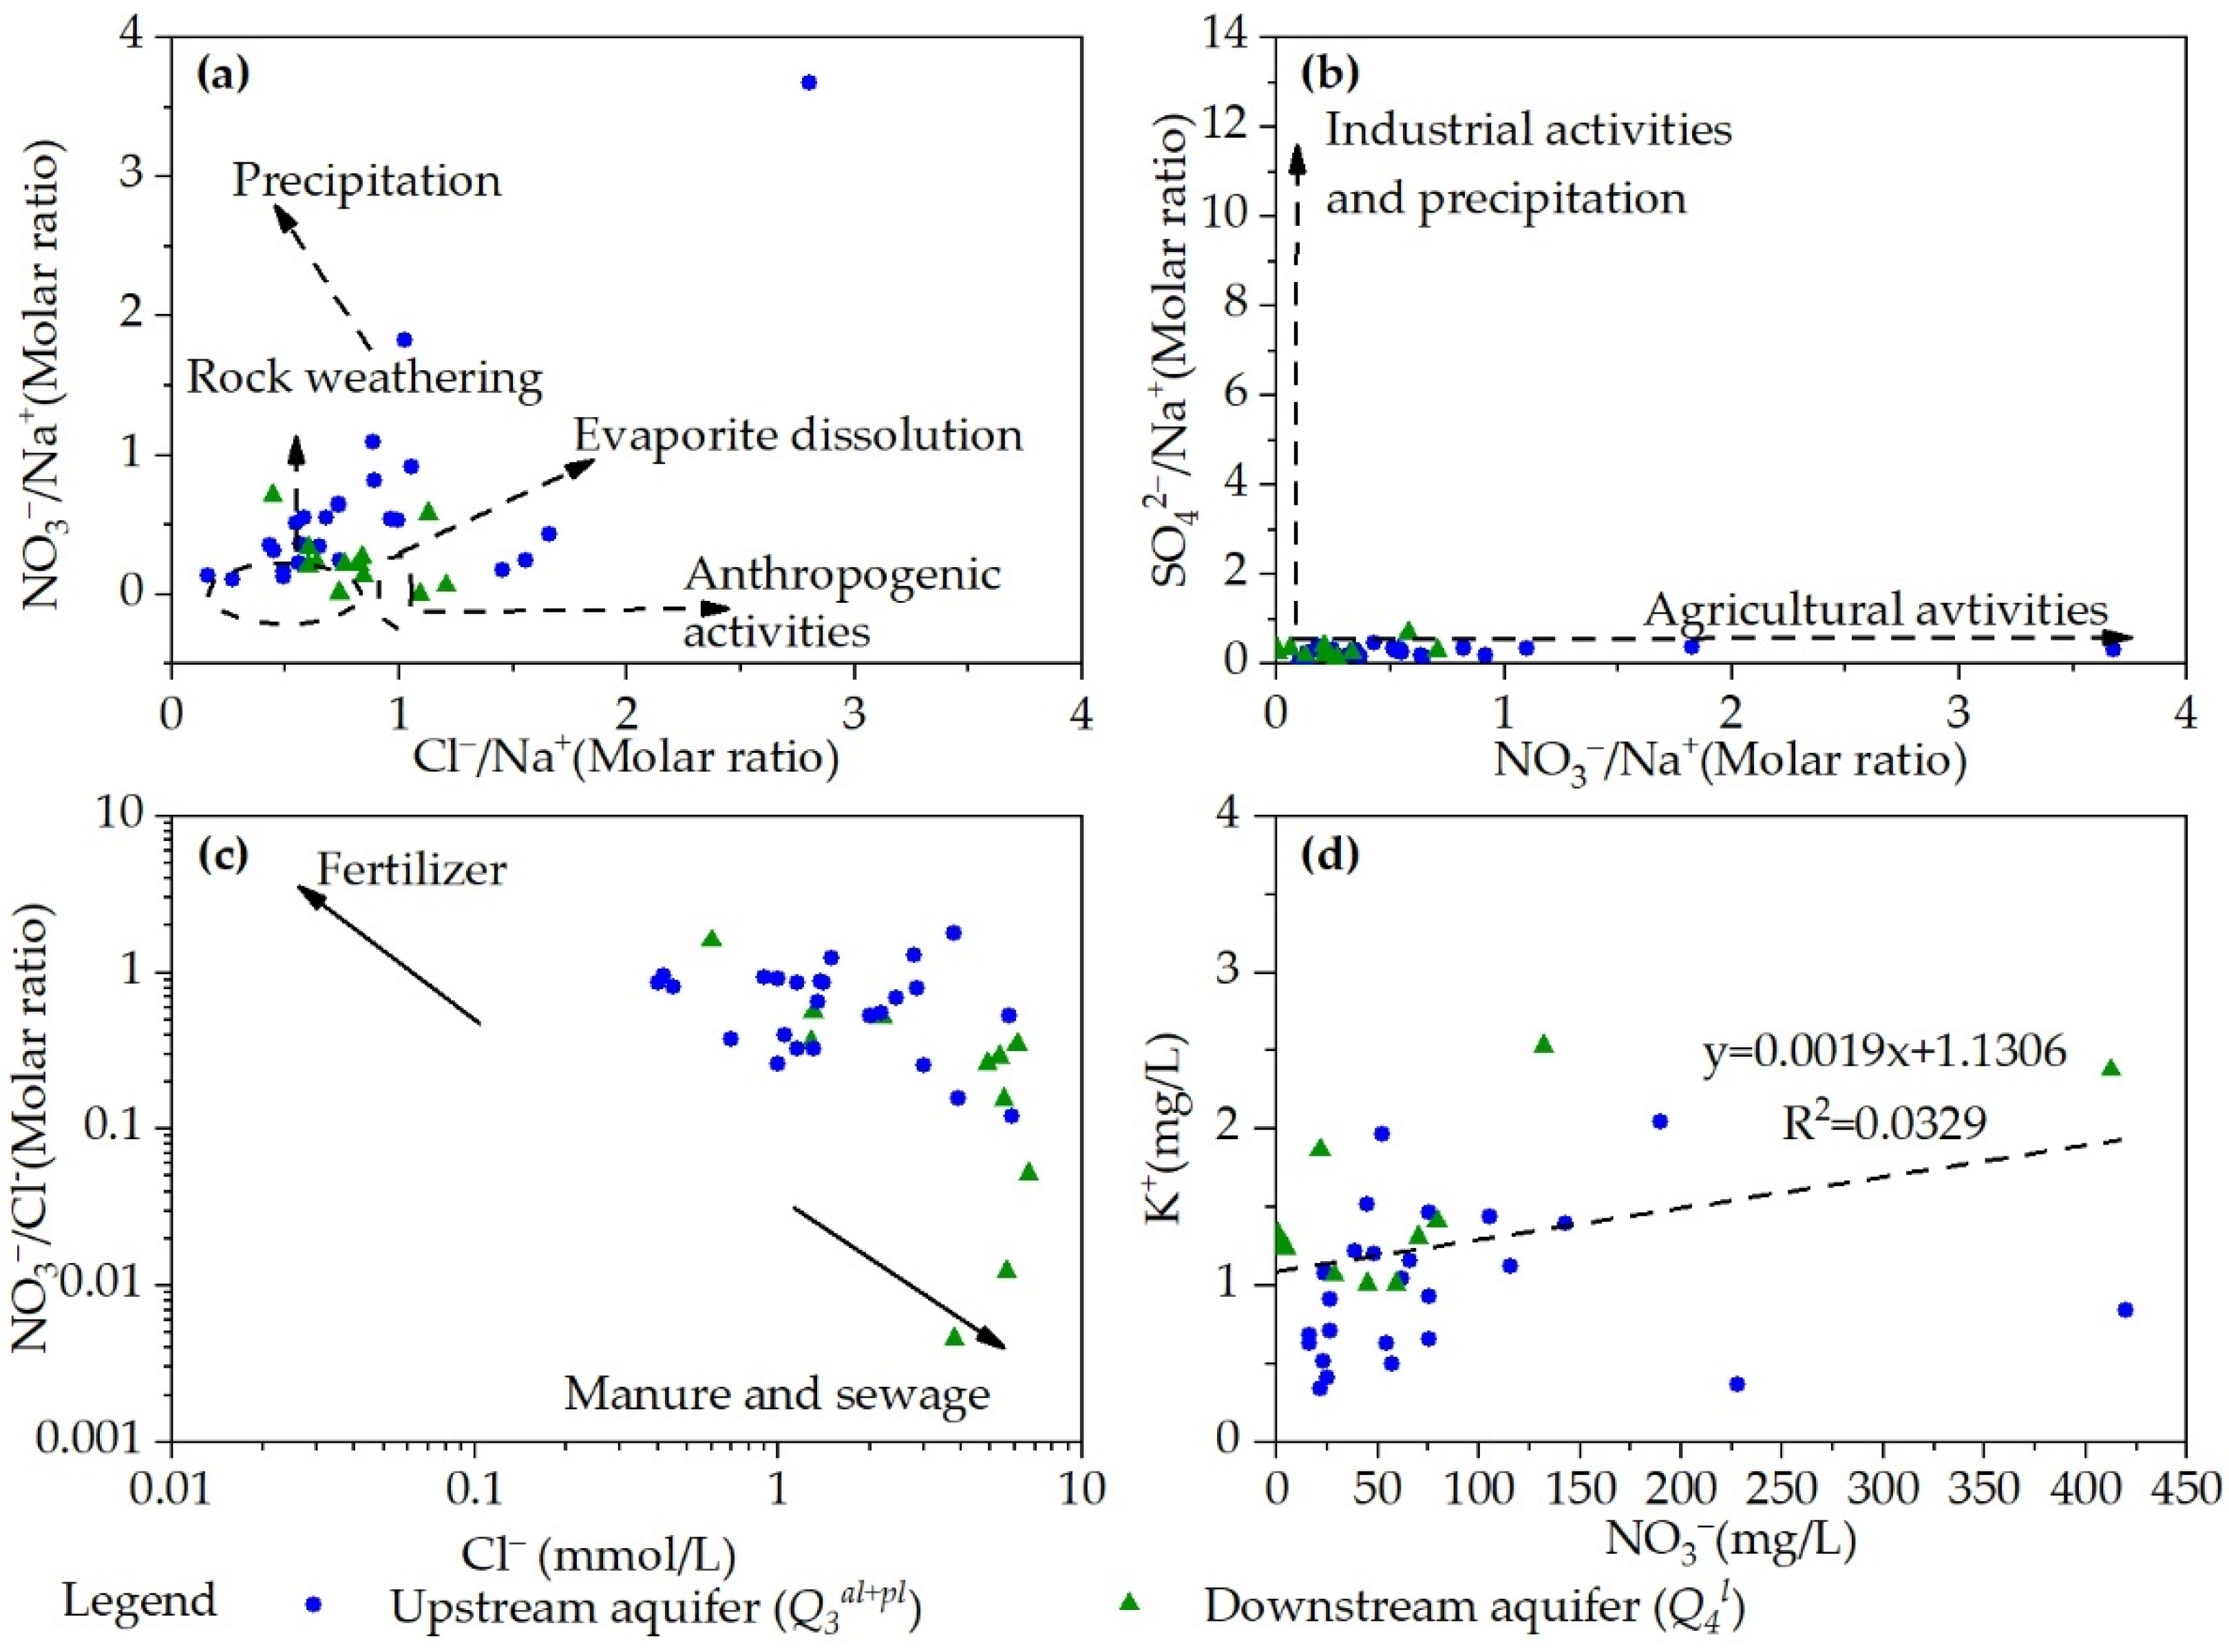
Based on the evaluated groundwater quality results, the NO3(N) concentrations in some parts of the study area were overstandard, and the highest concentration far exceeded the level III standard. Thus, the main source of nitrate contaminations should be scientifically identified.

3.5.1. Relationship between NO3 and Other Ions (Cl, SO42−, Na+ and K+)

As shown in Figure 10a, the Cl/Na+ ratios of most samples were close to 1, indicating that the Cl/Na+ ratios were mainly affected by salt rock dissolution [16]. The NO3/Na+ ratios ranged from 0.00 to 3.69 with an average of 0.49, and the Cv was 1.34 (>1), indicating that there was a strong spatial variation. Combined with Figure 10b, the ratios of SO42−/Na+ were smaller than those of NO3/Na+ overall, and the groundwater samples were located near the agricultural side, meaning that the nitrate content of groundwater was mainly affected by agricultural activities. The distribution of the points in Figure 10a was scattered and the Cv of NO3/Na+ was higher than 1, meaning that agricultural activities in different zones had different impacts on groundwater. The discussed results were consistent with the field survey results. The farmland in the study area was widely distributed, and the main crops were potatoes, oats and vegetables. Fertilizers and pesticides were very likely to enter groundwater along with the water from irrigation and precipitation, resulting in excessive nitrogen in groundwater.
Contaminations coming from manure and sewage would show a higher Cl content and a lower NO3/Cl ratio. The Cl molar concentration should usually be greater than 1 mmol/L, while the NO3/Cl molar concentration ratio should range between 0.001 and 0.1 [44,67]. The contaminations originating from synthetic NO3 fertilizer via agricultural activities should show characteristics of low Cl concentrations and high NO3/Cl ratios, the Cl content should be less than 0.1 mmol/L, and the NO3/Cl molar concentration ratio should range between 0.1 and 10 [18]. As shown in Figure 10c, the Cl contents were generally more than 1 mmol/L, and the molar concentration ratios of NO3/Cl ranged between 0.1 and 10, with an average value of 0.58. The points were mostly distributed in the upper–right of Figure 10c, indicating that the nitrate content in groundwater was affected by a variety of factors such as manure, sewage and fertilizers. To further explore the probability of synthetic NO3 fertilizer as a probable source of nitrate, the bivariate relationship between NO3 and K+ was examined. There will be a strong correlation between NO3 and K+ if NO3 originates from synthetic NO3 fertilizer [7]. In fact, there was a weak correlation between NO3 and K+ (Figure 10d), indicating that synthetic NO3 fertilizer is not the dominant source of NO3 in the study area.

3.5.2. Denitrification and Nitrification

As shown in Figure 11a, the relationship between NO3 and δ15N(NO3) was not negative, indicating that denitrification in groundwater was not obvious. Previous studies [45,46] have shown that the enrichment coefficient (εN/εO) should range between 1.3–2.1 if intensive denitrification occurs in groundwater, in other words, the slope of δ15N(NO3) and δ18O(NO3) should range from 0.48 to 0.77. As shown in Figure 11c, the slope of δ15N(NO3) and δ18O(NO3) was −0.09, far lower than 0.48 and 0.77, respectively. It was indicated that no obvious denitrification occurred during the transforming process of nitrate in the study area.
Under an oxidative environment, NH4+ is transformed into NO3 by Nitrobacter, which is called nitrification. According to the experimental research of Kendall [68], one O atom of NO3 comes from the atmosphere, and the other two O atoms come from H2O in environment, i.e., δ18O(NO3) = 2/3δ18O(H2O) + 1/3δ18O(O2). The δ18O(H2O) average of groundwater in the study area was −9.07‰, and the δ18O(O2) value was +23.5‰ [69]. Based on this, the δ18O(NO3) theoretical value was calculated as 1.79‰. The actual values of δ18O(NO3) in the study area ranged from −6.47 to +1.24‰, and the average was −2.40‰. There was a difference between the actual values and theoretical value, the main possible reasons were: (1) the real conditions were different from the laboratory cultures; (2) the δ18O(O2) value was cited from previous study not from actual measurement. According to the previous research, the δ18O(NO3) value produced by microbial nitrification ranged from −10 to +10‰ in general [47,68,70]. As shown in Figure 11b, the δ18O(NO3) values all fell within the above range and indicated that nitrification was the main process of nitrogen transformation.

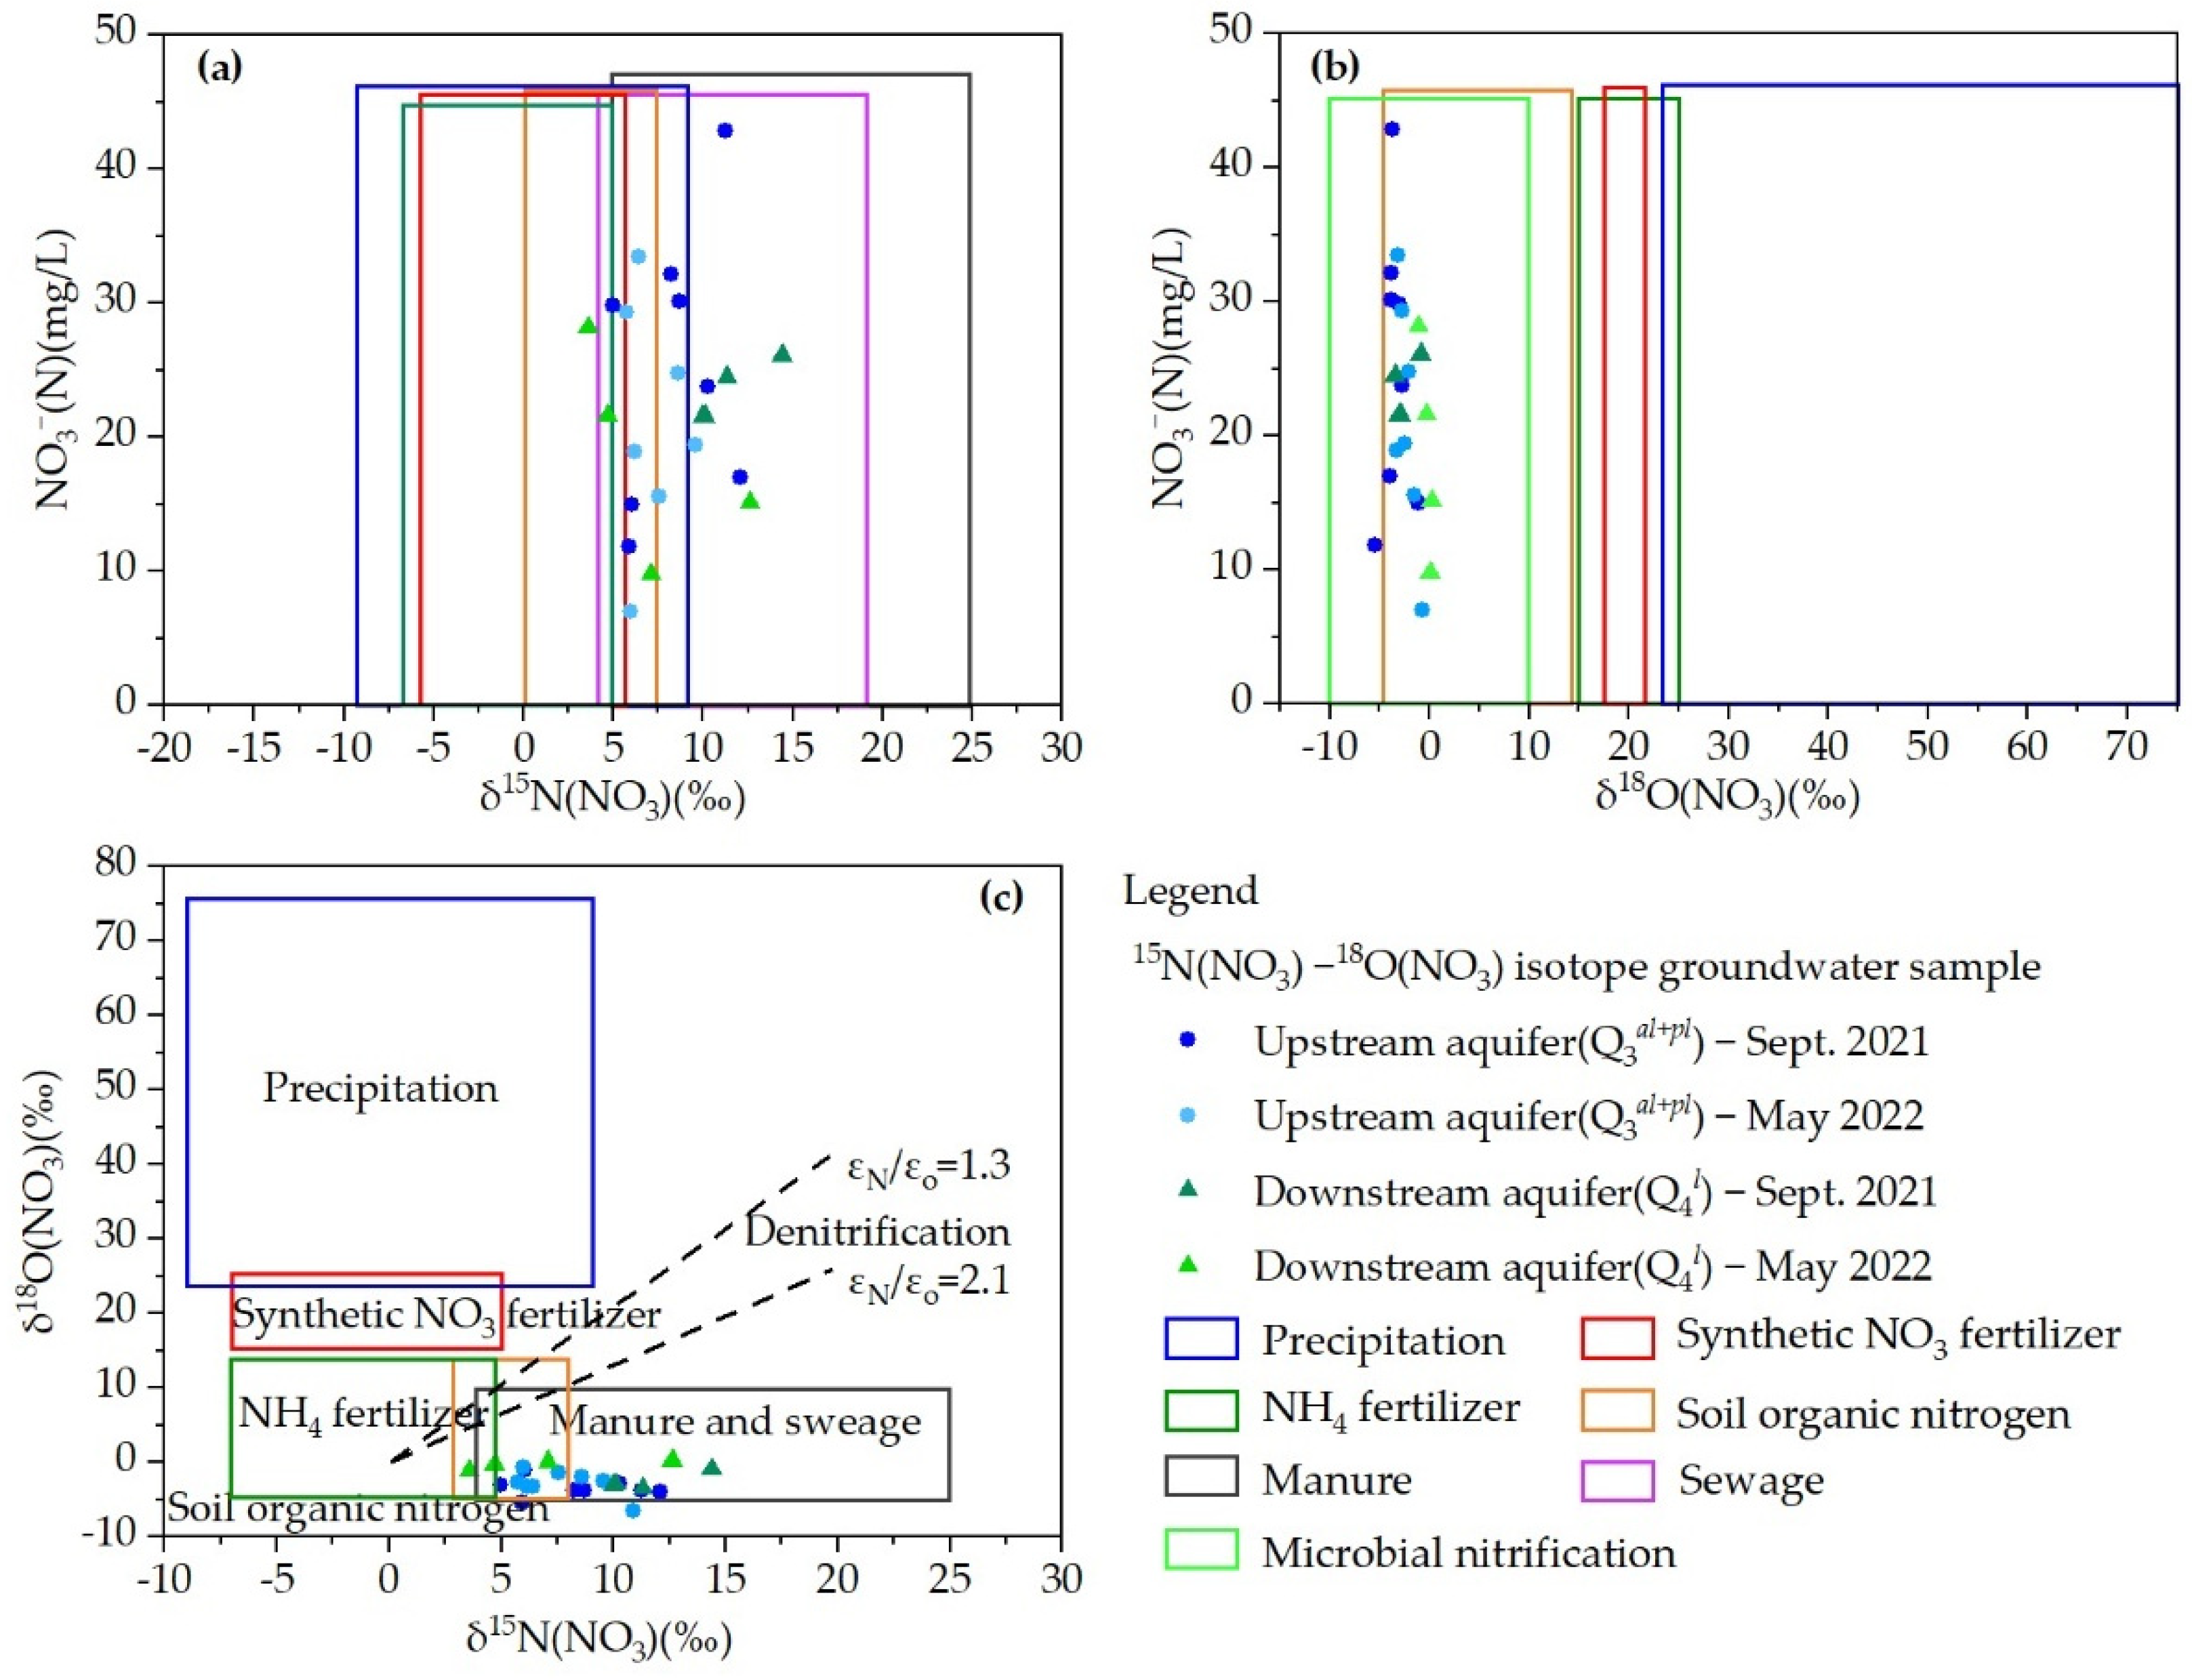
3.5.3. δ15. N(NO3) – δ18O(NO3) Dual Isotope Technique

As shown in Figure 11a,b, the distribution of samples was an irregular plane, indicating that NO3 contamination was a mixture of point sources and nonpoint sources. The δ15N(NO3) values were within the overlap range of multiple sources (Figure 11a), such as precipitation, soil organic nitrogen, manure and sewage, while the δ18O(NO3) values were in the range of soil organic nitrogen (Figure 11b). The results based on single isotope to identify the source of nitrogen were not accurate enough due to the overlaps of the δ15N(NO3) values among multiple sources.
To overcome this problem, the 15N(NO3) –18O(NO3) dual isotopes technique has been proposed [8] (Figure 11c). The δ15N(NO3) values ranged from +0.29 to +14.39‰, and the δ18O(NO3) values ranged from −6.47 to +1.24‰. 50% of the groundwater samples were in the range of manure and sewage, 41.67% of the groundwater samples were in the overlap area of soil organic nitrogen and manure and sewage, and 8.33% of the samples were located below the range of manure and sewage. High concentration of nitrate in groundwater indicated that soil organic nitrogen was not the main source of nitrate contamination. The mixed contamination of manure, sewage and NH4 fertilizers increased the nitrate contents in groundwater, and the contribution of manure and sewage was greater than that of NH4 fertilizers. The δ15N(NO3) and δ18O(NO3) data further affirmed the hydrochemical interpretation that precipitation, industrial activities and synthetic NO3 were unlikely to be the main sources of NO3 in the study area.

4. Conclusions

Hydrochemical characteristics and evolution process of groundwater in the northern Huangqihai Basin were comprehensively analyzed by using multiple hydrochemical methods. The groundwater in the study area was generally weakly alkaline with low salinity. The relative anionic abundance of groundwater samples was in the order of HCO3> Cl > SO42− > NO3, whereas the cationic abundance was Mg2+ > Ca2+ > Na+ > K+. The distributions of Mg2+, Na+, Cl and NO3 showed significant spatial variations (Cv > 100%), indicating the influence of human activities on groundwater. The main chemical facies of groundwater were HCO3–Mg·Ca and HCO3–Ca·Mg. The mole fractions of NO3 in C29 and C30 samples were higher than 25%, and two new hydrochemical facies (NO3·HCO3–Ca·Mg and HCO3·NO3·Cl–Ca·Mg) appeared based on the improved Shukalev classification method. The hydrochemical evolution of groundwater was predominantly affected by rock weathering and also by cation exchange.
The main source of groundwater was precipitation by means of the D–18O isotope technique, and the relationship between δD and δ18O of groundwater was δD = 5.93δ18O − 19.18 (R2 = 0.9067). The d–excess range was −1.60 to +6.01‰ with an average value of 3.38‰ (<10‰), indicated that groundwater was controlled by water–rock interactions and influenced by evaporation. Contaminants were very likely to enter groundwater along with precipitation infiltration, resulting in excessive nitrogen in groundwater.
The NO3(N) contents in some parts of the study area were far exceeded the level III standard. The NO3/Na+ ratios ranged from 0.00 to 3.69 with an average of 0.49, and the Cv was 1.34 (>1). The ratios of SO42−/Na+ were smaller than those of NO3/Na+ overall, indicating that the nitrate content of groundwater was mainly affected by agricultural activities. The Cl contents were generally more than 1 mmol/L, and the NO3/Cl ratios ranged between 0.1 and 10 with an average value of 0.58. The correlation between NO3 and K+ was weak. The hydrochemical analysis showed that precipitation, industrial activities and synthetic NO3 were unlikely to be the main sources of nitrate contamination.
The relationship between NO3 and δ15N(NO3) was not negative, and the slope of δ15N(NO3) vs. δ18O(NO3) in groundwater was −0.09, far lower than 0.48 and 0.77, respectively. The δ18O(NO3) values fell within the range (−10 to +10‰). These analyses indicated that no obvious denitrification occurred, and that nitrification was the main process during nitrogen transformation in the study area. The δ15N(NO3) values ranged from +0.29 to +14.39‰, and the δ18O(NO3) values ranged from −6.47 to +1.24‰. The δ15N(NO3) and δ18O(NO3) data further affirmed the hydrochemical interpretation that precipitation, industrial sewage and synthetic NO3 were unlikely sources of NO3, and the main sources were manure, sewage and NH4 fertilizers.
The integration of hydrochemical analysis and dual isotope technique provides a further insight into the identification of nitrate contamination from multiple perspectives: hydrochemical characteristics, evolution mechanism, probable pathway of contaminants entering groundwater, bivariate relationships between NO3 and other indices, and isotope composition. It is recommended that extensive and sustained monitoring of the D–18O isotopes in groundwater and the 15N(NO3) and 18O(NO3) isotopes in the potential nitrate sources (fertilizers, manure and sewage) should be performed in further studies.

Author Contributions

Conceptualization, J.J.; methodology, J.J. and Z.W.; investigation, H.D. and J.Z.; data curation, Z.W. and Y.Z.; writing—original draft preparation, J.J.; writing—review and editing, J.J. All authors have read and agreed to the published version of the manuscript.

Funding

This research was funded by the Basic Scientific Research Foundation Special Project of the China Institute of Water Resources and Hydropower Research (No. MK2021J07 and MK2020J10), Project of Collaborative Innovation Center for Grassland Ecological Security (Ecohydrological Characteristics and Ecosystem Services Assessment in Tabu River Watershed, No. MK0143A032021) and Science and Technology Planning Project of Inner Mongolia (No. MK0143A012022).

Institutional Review Board Statement

Not applicable.

Informed Consent Statement

Not applicable.

Data Availability Statement

Not applicable.

Acknowledgments

The authors are grateful to all the editors and anonymous reviewers for their helpful comments that greatly improved the quality of the manuscript.

Conflicts of Interest

The authors declare no conflict of interest.

References

  1. He, X.D.; Li, P.Y.; Ning, J.; He, S.; Yang, N.N. Geochemical processes during hydraulic fracturing in a tight sandstone reservoir revealed by field and laboratory experiments. J. Hydrol. 2022, 612, 128292. [Google Scholar] [CrossRef]
  2. Fuoco, I.; Rosa, D.R.; Barca, D.; Figoli, A.; Gabriele, B.; Apollaro, C. Arsenic polluted waters: Application of geochemical modelling as a tool to understand the release and fate of the pollutant in crystalline aquifers. J. Environ. Manag. 2022, 301, 113796. [Google Scholar] [CrossRef] [PubMed]
  3. Fuoco, I.; Marini, L.; De Rosa, R.; Figoli, A.; Gabriele, B.; Apollaro, C. Use of reaction path modelling to investigate the evolution of water chemistry in shallow to deep crystalline aquifers with a special focus on fluoride. Sci. Total Environ. 2022, 830, 154566. [Google Scholar] [CrossRef]
  4. Shi, X.Y.; Wang, Y.; Jiao, J.J.; Zhong, J.L.; Wen, H.G.; Dong, R. Assessing major factors affecting shallow groundwater geochemical evolution in a highly urbanized coastal area of Shenzhen City, China. J. Geochem. Explor. 2018, 184, 17–27. [Google Scholar] [CrossRef]
  5. Ren, C.B.; Zhang, Q.Q. Groundwater chemical characteristics and controlling factors in a region of northern China with intensive human activity. Int. J. Env. Res. Public Health 2020, 17, 9126. [Google Scholar] [CrossRef] [PubMed]
  6. Su, F.; Wu, J.; Wang, D.; Zhao, H.; Wang, Y.; He, X. Moisture movement, soil salt migration, and nitrogen transformation under different irrigation conditions: Field experimental research. Chemosphere 2022, 300, 134569. [Google Scholar] [CrossRef] [PubMed]
  7. Anornu, G.; Gibrilla, A.; Adomako, D. Tracking nitrate sources in groundwater and associated health risk for rural communities in the White Volta River basin of Ghana using isotopic approach (δ15N, δ18O–NO3 and 3H). Sci. Total Environ. 2016, 603–604, 687–698. [Google Scholar] [CrossRef] [PubMed]
  8. Hu, M.M.; Wang, Y.C.; Du, P.C.; Shui, Y.; Cai, A.M.; Lu, C.; Bao, Y.F.; Li, Y.H.; Li, S.Z.; Zhang, P.W. Tracing the sources of nitrate in the rivers and lakes of the southern areas of the Tibetan Plateau using dual nitrate isotopes. Sci. Total Environ. 2019, 658, 132–140. [Google Scholar] [CrossRef]
  9. Li, P.Y.; He, X.D.; Guo, W.Y. Spatial groundwater quality and potential health risks due to nitrate ingestion through drinking water: A case study in Yan’an City on the Loess Plateau of northwest China. Hum. Ecol. Risk Assess. 2019, 25, 11–31. [Google Scholar] [CrossRef]
  10. Mayo, A.L.; Tingey, D.G. Shallow groundwater chemical evolution, isotopic hyperfiltration, and salt pan formation in a hypersaline endorheic basin: Pilot Valley, Great Basin, USA. Hydrogeol. J. 2021, 29, 2219–2243. [Google Scholar] [CrossRef]
  11. Dowling, C.B.; Poreda, R.J.; Basu, A.R.; Peters, S.L.; Aggarwal, P.K. Geochemical study of arsenic release mechanisms in the Bengal Basin groundwater. Water Resour. Res. 2002, 38, 1173. [Google Scholar] [CrossRef] [Green Version]
  12. Banda, K.E.; Wilson, M.; Rasmus, J.; Jason, O.; Imasiku, N.; Flemming, L. Mechanism of salinity change and hydrogeochemical evolution of groundwater in the Machile–Zambezi Basin, South–western Zambia. J. Afr. Earth Sci. 2019, 153, 72–82. [Google Scholar] [CrossRef]
  13. Nipada, S.; Saowani, S.; Schradh, S. Arsenic contamination in groundwater and potential health risk in western Lampang Basin, northern Thailand. Water 2022, 14, 465. [Google Scholar] [CrossRef]
  14. Wen, Y.; Qiu, J.H.; Cheng, S.; Xu, C.C.; Gao, X.J. Hydrochemical evolution mechanisms of shallow groundwater and its quality assessment in the estuarine coastal zone: A case study of Qidong, China. Int. J. Env. Res. Pub. He. 2020, 17, 3382. [Google Scholar] [CrossRef]
  15. Zhang, Y.H.; Xu, M.; Li, X.; Qi, J.H.; Zhang, Q.; Guo, J.; Yu, L.L.; Zhao, R. Hydrochemical characteristics and multivariate statistical analysis of natural water system: A case study in Kangding county, southwestern China. Water 2018, 10, 80. [Google Scholar] [CrossRef] [Green Version]
  16. Su, H.; Kang, W.D.; Kang, N.; Liu, J.T.; Li, Z. Hydrogeochemistry and health hazards of fluoride–enriched groundwater in the Tarim Basin, China. Environ. Res. 2021, 200, 111476. [Google Scholar] [CrossRef] [PubMed]
  17. Feng, F.; Jia, Y.F.; Yang, Y.; Huan, H.; Lian, X.Y.; Xu, X.J.; Xia, F.; Han, X.; Jiang, Y.H. Hydrogeochemical and statistical analysis of high fluoride groundwater in northern China. Environ. Sci. Pollut. Res. Int. 2020, 27, 34840–34861. [Google Scholar] [CrossRef]
  18. Chen, Z.X.; Yu, L.; Liu, W.G.; Lam, M.H.W. Nitrogen and oxygen isotopic compositions of water–soluble nitrate in Taihu Lake water system, China: Implication for nitrate sources and biogeochemical process. Env. Earth Sci. 2014, 71, 217–223. [Google Scholar] [CrossRef]
  19. Mukherjee, I.; Singh, U.K. Characterization of groundwater nitrate exposure using Monte Carlo and Sobol sensitivity approaches in the diverse aquifer systems of an agricultural semiarid region of Lower Ganga Basin, India. Sci. Total Environ. 2021, 787, 147657. [Google Scholar] [CrossRef]
  20. Avilés, F.; Patricia, G.; Lorenzo, S.; Elisa, S.; Yvan, R.; Joel, S.; Eduardo, R.O.; Céline, D. Hydrogeochemical and nitrate isotopic evolution of a semiarid mountainous basin aquifer of glacial–fluvial and paleolacustrine origin (Lake Titicaca, Bolivia): The effects of natural processes and anthropogenic activities. Hydrogeol. J. 2022, 30, 181–202. [Google Scholar] [CrossRef]
  21. Chen, J.Q.; Lv, J.M.; Wang, Q.W.; Wang, J. External Groundwater alleviates the degradation of closed lakes in semi–arid regions of China. Remote Sens. 2019, 12, 45. [Google Scholar] [CrossRef] [Green Version]
  22. Han, X.Q.; Lin, J.; Yang, Y.; Sun, X.M.; Zhu, X.L.; Wu, J.F.; Wu, J.C. Three–dimensional modeling and visualization of hydrogeological structure in water supply well fields of Jining district, Inner Mongolia. J. Inn. Mong. Agric. Univ. 2017, 38, 45–52. (In Chinese) [Google Scholar] [CrossRef]
  23. Chen, M.M.; Liu, J.G. Historical trends of wetland areas in the agriculture and pasture interlaced zone: A case study of the Huangqihai Lake Basin in northern China. Ecol. Model. 2015, 318, 168–176. [Google Scholar] [CrossRef]
  24. Tian, F.; Wang, Y.; Zhao, Z.L.; Dong, J.; Liu, J.; Ling, Y.; Yuan, Y.P.; Ye, M.N. Holocene vegetation and climate changes in the Huangqihai Lake region, Inner Mongolia. Acta Geol. Sin. 2020, 94, 1178–1186. [Google Scholar] [CrossRef]
  25. Fu, Y.C.; Zhao, J.Y.; Peng, W.Q.; Zhu, G.P.; Quan, Z.J.; Li, C.H. Spatial modelling of the regulating function of the Huangqihai Lake wetland ecosystem. J. Hydro. 2018, 564, 283–293. [Google Scholar] [CrossRef]
  26. Guo, Z.X.; Hao, W.G.; Zhang, S.; Zhang, Z.G. Evaluation on present situation of water environmental quality in Huangqihai Lake. Chin. Agric. Sci. Bull. 2007, 23, 346–350. (In Chinese) [Google Scholar] [CrossRef]
  27. Hao, W.G.; Bao, X.Q.; Wei, Y.F.; Guo, Z.X.; Zhuang, J.; Liang, J. Eutrophication and its dynamic changes in Huangqihai lake. Yellow River 2008, 30, 74–75. (In Chinese) [Google Scholar] [CrossRef]
  28. GB/T14848-2017; Standard for Groundwater Quality. Standards Press of China: Beijing, China, 2017. (In Chinese)
  29. DZ/T 0064-2021; Analysis Method of Groundwater Quality. Standards Press of China: Beijing, China, 2021. (In Chinese)
  30. China Geological Survey. Handbook of Hydrogeology, 2nd ed.; Geological Publishing House: Beijing, China, 2018; pp. 108–110.
  31. Qian, H.; Ma, Z.Y. Hydrogeochemistry; Geology Publishing House: Beijing, China, 2005. (In Chinese) [Google Scholar]
  32. Piper, A.M. A graphic procedure in the geochemical interpretation of water analysis. Trans. Am. Geophys. Union 1944, 25, 914–928. [Google Scholar] [CrossRef]
  33. Gibbs, R.J. Mechanisms controlling world water chemistry. Science 1970, 170, 1088–1090. [Google Scholar] [CrossRef]
  34. Lachaal, F.; Messaoud, R.B.; Jellalia, D.; Chargui, S.; Chekirbane, A.; Mlayah, A.; Massuel, S.; Leduc, C. Impact of water resources management on groundwater hydrochemical changes: A case of Grombalia shallow aquifer, NE of Tunisia. Arab. J. Geosci. 2018, 11, 304. [Google Scholar] [CrossRef]
  35. Lachache, S.; Nabou, M.; Merzouguui, T.; Amroune, A. Hydrochemistry and origin of principal major elements in the groundwater of the Béchar–Kénadsa basin in arid zone, south–west of Algeria. J. Water Land Dev. 2018, 36, 77–87. [Google Scholar] [CrossRef] [Green Version]
  36. Eskandari, E.; Mohammadzadeh, H.; Nassery, H.; Vadiati, M.; Zadeh, A.M.; Kisi, O. Delineation of isotopic and hydrochemical evolution of karstic aquifers with different cluster–based (HCA, KM, FCM and GKM) methods. J. Hydrol. 2022, 609, 127706. [Google Scholar] [CrossRef]
  37. Apollaro, C.; Di Curzio, D.; Fuoco, I.; Buccianti, A.; Dinelli, E.; Vespasiano, G.; Castrignanò, A.; Rusi, S.; Barca, D.; Figoli, A.; et al. A multivariate non–parametric approach for estimating probability of exceeding the local natural background level of arsenic in the aquifers of Calabria region (Southern Italy). Sci. Total Environ. 2022, 806, 150345. [Google Scholar] [CrossRef] [PubMed]
  38. Deepika, B.V.; Ramakrishnaiah, C.R.; Naganna, S.R. Spatial variability of ground water quality: A case study of Udupi district, Karnataka State, India. J. Earth Syst. Sci. 2020, 129, 221. [Google Scholar] [CrossRef]
  39. Kpaйнoв, C.P.; Фoйгт, Г.Ю.; Wang, Y.X. Geochemical and ecological consequences of changes in groundwater chemical composition under the influence of pollutants. J. Geosci. Transl. 1992, 19, 73–80. (In Chinese) [Google Scholar] [CrossRef]
  40. Huang, G.X.; Liu, C.Y.; Sun, J.C.; Zhang, M.; Jing, J.H.; Li, L.P. A regional scale investigation on factors controlling the groundwater chemistry of various aquifers in a rapidly urbanized area: A case study of the Pearl River Delta. Sci. Total Environ. 2018, 625, 510–518. [Google Scholar] [CrossRef]
  41. Hu, C.P.; Liu, Z.Q.; Xiong, K.N.; Lyu, X.X.; Li, Y.; Zhang, R.K. Characteristics of and influencing factors of hydrochemistry and carbon/nitrogen variation in the Huangzhouhe river basin, a World Natural Heritage Site. Int. J. Environ. Res. Public Health 2021, 18, 13169. [Google Scholar] [CrossRef]
  42. Heaton, T.H.E. Isotopic studies of nitrogen pollution in the hydrosphere and atmosphere: A review. Chem. Geol. Isot. Geosci. Sect. 1986, 59, 87–102. [Google Scholar] [CrossRef]
  43. Adebowale, T.; Surapaneni, A.; Faulkner, D.; McCance, W.; Wang, S.Q.; Currell, M. Delineation of contaminant sources and denitrification using isotopes of nitrate near a wastewater treatment plant in peri-urban settings. Sci. Total Environ. 2019, 65, 2701–2711. [Google Scholar] [CrossRef]
  44. Widory, D.; Petelet, G.E.; Négrel, P.; Ladouche, B. Tracking the sources of nitrate in groundwater using coupled nitrogen and boron isotopes: A synthesis. Environ. Sci. Tech. 2005, 39, 539–548. [Google Scholar] [CrossRef]
  45. Bottcher, J.; Sreebel, O.; Voerkelius, S.; Schmidt, H.L. Using isotope fractionation of nitrate–nitrogen and nitrate–oxygen for evaluation of microbial denitrification in a sandy aquifer. J. Hydrol. 1990, 114, 413–424. [Google Scholar] [CrossRef]
  46. Fukada, T.; Hiscock, K.M.; Dennis, P.F.; Grischek, T. A dual isotope approach to identify denitrification in groundwater at a river–bank infiltration site. Water Res. 2003, 37, 3070–3078. [Google Scholar] [CrossRef]
  47. Xue, D.M.; Botte, J.; De, B.B.; Accoe, F.; Nestler, A.; Taylor, P.; Van, C.O.; Berglund, M.; Boeckx, P. Present limitations and future prospects of stable isotope methods for nitrate source identification in surface and groundwater. Water Res. 2009, 43, 1159–1170. [Google Scholar] [CrossRef] [PubMed]
  48. Andrew, A.A.; Jun, S.; Takahiro, H.; Makoto, K.; Akoachere, R.; George, E.N.; Aka, F.T.; Ono, M.; Eyong, G.E.T.; Tandia, B.K. Flow dynamics and age of groundwater within a humid equatorial active volcano (Mount Cameroon) deduced by δD, δ18O, 3H and chlorofluorocarbons (CFCs). J. Hydrol. 2013, 502, 156–176. [Google Scholar] [CrossRef]
  49. Liao, H.W.; Jiang, Z.C.; Zhou, H.; Qin, X.Q.; Huang, Q.B. Isotope–based study on nitrate sources in a karst wetland water, southwest China. Water 2022, 14, 1533. [Google Scholar] [CrossRef]
  50. Raj, P.S.; Prasad, B.S.; Amrita, W.; Friedemann, F.T. Earthquake chemical precursors in groundwater: A review. J. Seismol. 2018, 22, 1293–1314. [Google Scholar] [CrossRef]
  51. Skelton, A.; Liljedahl-Claesson, L.; Wästeby, N.; Andrén, M.; Stockmann, G.; Sturkell, E.; Mörth, C.M.; Stefansson, A.; Tollefsen, E.; Siegmund, H.; et al. Hydrochemical changes before andafter earthquakes based on long-termmeasurements of multiple parametersat two sites in northern Iceland–Areview. J. Geophys. Res. Sol. Ea. 2019, 124, 2702–2720. [Google Scholar] [CrossRef]
  52. Peng, C.; He, J.T.; Liao, L.; Zhang, Z.G. Research on the influence degree of human activities on groundwater quality by the method of geochemistry: A case study from Liujiang Basin. Earth Sci. Front. 2017, 24, 321–331. (In Chinese) [Google Scholar] [CrossRef]
  53. Apollaro, C.; Vespasiano, G.; De Rosa, R.; Marini, L. Use of mean residence time and flowrate of thermal waters to evaluate the volume of reservoir water contributing to the natural discharge and the related geothermal reservoir volume. Application to Northern Thailand hot springs. Geothermics 2015, 58, 62–74. [Google Scholar] [CrossRef]
  54. Li, J.X.; Zhou, H.L.; Qian, K.; Xie, X.J.; Xue, X.B.; Yang, Y.J.; Wang, Y.X. Fluoride and iodine enrichment in groundwater of north China plain: Evidences from speciation analysis and geochemical modeling. Sci. Total Environ. 2017, 598, 239–248. [Google Scholar] [CrossRef]
  55. Singh, G.; Rishi, M.S.; Herojeet, R.; Kaur, L.; Sharma, K. Evaluation of groundwater quality and human health risks from fluoride and nitrate in semi–arid region of northern India. Environ. Geochem. Health 2020, 42, 1833–1862. [Google Scholar] [CrossRef] [PubMed]
  56. An, Y.K.; Lu, W.X. Hydrogeochemical processes identification and groundwater pollution causes analysis in the northern Ordos Cretaceous Basin, China. Environ. Geochem. Health 2017, 40, 1209–1219. [Google Scholar] [CrossRef] [PubMed]
  57. Farid, I.; Zouari, K.; Rigane, A.; Beji, R. Origin of the groundwater salinity and geochemical processes in detrital and carbonate aquifers: Case of Chougafiya basin (Central Tunisia). J. Hydrol. 2015, 530, 508–532. [Google Scholar] [CrossRef]
  58. Capuano, R.M.; Jones, C.R. Cation exchange in groundwater-chemical evolution and prediction of paleo-groundwater flow: A natural-system study. Water Resour. Res. 2020, 56, e2019WR026318. [Google Scholar] [CrossRef]
  59. Eaman, S.; De Louw, P.G.B.; Van der Zee, S.E.A.T.M. Cation exchange in a temporally fluctuating thin freshwater lens on top of saline groundwater. Hydrogeol. J. 2017, 25, 223–241. [Google Scholar] [CrossRef] [Green Version]
  60. Craig, H. Isotopic variations in meteoric waters. Science 1961, 133, 1702–1703. [Google Scholar] [CrossRef]
  61. Guo, X.; Li, W.B.; Du, L.; Jia, D.B.; Liu, T.X. Characteristics and influence factors for the hydrogen and oxygen isotopic of precipitation in inner Mongolia. China Environ. Sci. 2022, 42, 1088–1096. (In Chinese) [Google Scholar] [CrossRef]
  62. Dansgaard, W. Stable isotopes in precipitation. Tellus 1964, 16, 436–468. [Google Scholar] [CrossRef]
  63. Claus, K.; Rolf, F.R.; Fernando, R.B.; Iñaki, V. Vapor source and spatiotemporal variation of precipitation isotopes in southwest Spain. Hydrol. Process. 2021, 35, e14445. [Google Scholar] [CrossRef]
  64. Chen, X.; Jiang, C.L.; Zheng, L.G.; Zhang, L.Q.; Fu, X.J.; Chen, S.G.; Chen, Y.C.; Hu, J. Evaluating the genesis and dominant processes of groundwater salinization by using hydrochemistry and multiple isotopes in a mining city. Environ. Pollut. 2021, 283, 117381. [Google Scholar] [CrossRef]
  65. Xia, C.; Liu, G.; Mei, J.; Meng, Y.; Hu, Y. Characteristics of hydrogen and oxygen stable isotopes in precipitation and the environmental controls in tropical monsoon climatic zone. Int. J. Hydrog. Energy. 2019, 44, 5417–5427. [Google Scholar] [CrossRef]
  66. Wang, C.; Zhang, H.; Lei, P.; Xin, X.K.; Zhang, A.J.; Yin, W. Evidence on the causes of the rising levels of CODMn along the middle route of the South–to–North Diversion Project in China: The role of algal dissolved organic matter. J. Environ. Sci. 2022, 113, 281–290. [Google Scholar] [CrossRef] [PubMed]
  67. Koba, K.; Tokuchi, N.; Wada, E.; Nakajima, T.; Iwatsubo, G. Intermittent denitrification: The application of a 15N natural abundance method to a forested ecosystem. Geochim. Cosmochim Ac. 1997, 61, 5043–5050. [Google Scholar] [CrossRef]
  68. Kendall, C. Tracing nitrogen sources and cycling in catchments. Isot. Tracers Catchment Hydrol. 1998, 1, 519–576. [Google Scholar] [CrossRef]
  69. Amberger, A.; Schmidt, H.L. Natürliche isotopengehalte von nitrat als indikatoren für dessen herkunft. Geochim. Et Cosmochim. Acta 1987, 51, 2699–2705. [Google Scholar] [CrossRef]
  70. Kent, R.; Landon, M.K. Trends in concentrations of nitrate and total dissolved solids in public supply wells of the Bunker Hill, Lytle, Rialto, and Colton groundwater sub basins, San Bernardino county, California: Influence of legacy land use. Sci. Total Environ. 2013, 452–453, 125–136. [Google Scholar] [CrossRef]
Figure 1. Location of the study area and water samples (a), hydraulic head field (b) and the burial depth of groundwater (c).
Water 14 03168 g001
Figure 2. Methodology flowchart. At present, many methods are used to proceed the hydrochemcial research, such as Piper diagram, correlation analysis, Gibbs diagram, ion proportional coefficients, cluster–based methods [14,31,32,33,34,35,36,37]. According to previous studies and the study objectives, we used Excel to complete the statistical analysis. Statistics of the minimum, maximum, average and medium were used to reflect the concentration characteristics of the indices. The standard deviation (SD) was applied to reflect the variation degree between the average value and the actual value, and the coefficient of variation (Cv) was used to indicate the dispersion degree [38]. Based on the geostatistical methods, the spatial distributions of the main hydrochemical indices were obtained by using the Kriging interpolation with the help of ArcGIS 10.3. The Piper diagram drawn by Aquachem 4.0 and the iso–ionic–salinity (TIS) diagram were applied to classify the hydrochemical facies and the salinity distribution. Pearson correlation was undertaken to analyze the relationships among the hydrochemical indices via IBM SPSS Statistics 22. Gibbs diagram, ion proportional coefficients were conducted to reveal the hydrochemical evolution mechanism. Based on the binary phase diagram and chloro – alkaline indices, the cation exchange was judged. Integration of the δ15N(NO3) – δ18O(NO3) dual isotope technique and hydrochemical analyses was designed to trace the nitrate contamination. Origin 2020 was used to plot Gibbs diagram, TIS diagram, binary phase diagrams, and isotope distribution figures. The details of the methods are listed below.
Water 14 03168 g002
Figure 3. Spatial distribution of hydrochemical indices (aj). The unit of TDS is g/L and the units of other indices are mg/L.
Water 14 03168 g003
Figure 4. Piper diagram of groundwater (a) and correlation plot of (Na+ + K+) vs. (Ca2+ + Mg2+), also showing TIS salinity diagram for reference (b).
Water 14 03168 g004
Figure 5. Gibbs diagram of groundwater.
Water 14 03168 g005
Figure 6. Ion proportional coefficient diagrams: (Ca2+ + Mg2+) vs. (HCO3 + SO42−) (a), Ca2+ vs. Mg2+ (b), Na+ vs. Cl (c), Na+ vs. HCO3 (d), and (SO42− + Cl) vs. HCO3 (e).
Water 14 03168 g006
Figure 7. Coefficient diagrams of (Na+ − Cl) vs. (Ca2+ + Mg2+ − SO42− − HCO3) for analyzing cation exchange reaction (a) and distribution diagram of Chloro–alkaline indices (b).
Water 14 03168 g007
Figure 8. Relationship between δD and δ18O of groundwater in the study area. Sampling sites: Upstream aquifer (Q3al+pl) and downstream aquifer (Q4l); sampling times: September 2021 and May 2022.
Water 14 03168 g008
Figure 9. Evaluated results of groundwater, the division of the I~V levels was based on the Standard for Groundwater Quality (GB/T 14848-2017) [28].
Water 14 03168 g009
Figure 10. Relationships of (NO3/Na+) vs. (Cl/Na+) (a), (SO42−/Na+) vs. (NO3/Na+) (b), (NO3/Cl) vs. Cl (c), and NO3/K+ (d).
Water 14 03168 g010
Figure 11. Relationships of NO3 vs. δ15N(NO3) (a), NO3 vs. δ18O(NO3) (b) and δ15N(NO3) vs. δ18O(NO3) (c).
Water 14 03168 g011
Table 1. Evaluated standard of the main indices of groundwater.
IndexLevel IIIIndexLevel III
pH8.5F1
TH450CODMn3
TDS1000Fe0.3
SO42−250Mn0.1
Cl250I0.08
Na+200Hg0.001
NO3(N)20As0.01
NO2(N)1Cr6+0.05
NH4(N)0.5Cd0.005
Level III: Level III of Standard for Groundwater Quality (GB/T 14848-2017); Units: pH is unitless, the other indices have units of mg/L; the nitrogen species were expressed as N to be consistent with the Groundwater Quality Standard; Fe represents the total iron; Mn represents the total manganese.
Table 2. Ranges of δ15N(NO3) and δ18O(NO3) originating from different sources (unit: ‰).
PrecipitationSynthetic NO3
Fertilizer
NH4
Fertilizer
Soil Organic
Nitrogen
ManureSewage
δ15N(NO3)−13~+13−6~+6−7~+50~+8+5~+25+4~+19
δ18O(NO3)+23~+75+17~+25+15~+25−5~+14−5~+10
Table 3. Statistics of hydrochemical parameters of groundwater (n = 38).
IndexMaximumMinimumAverageMedianSDCv
pH8.587.387.827.810.243.03
Ca2+160.3239.0880.3369.1430.4637.92
Mg2+413.2713.3760.9543.5164.39105.64
Na+577.6016.6691.5153.3598.86108.03
HCO31677.97213.56386.78340.17237.2861.35
SO42−392.2014.41102.7556.9094.2191.69
Cl744.5114.18114.6974.10129.57112.97
NO3419.710.4379.7753.8794.27118.18
NO21.350.000.040.000.22561.36
F2.390.310.910.800.4853.02
H2SiO350.0016.6726.6726.045.8621.97
TDS3426.54287.03744.56568.66545.2073.22
TH451.54362.831851.67152.641170.6563.22
CODMn5.070.121.441.011.1177.23
The units of all groundwater quality indices, except pH, are in mg/L. SD: mg/L. Cv: %.
Table 4. Correlation matrices of hydrochemical indices (n = 38).
pHCa2+Mg2+Na+HCO3SO42−ClFH2SiO3TDSTHCODMn
pH1
Ca2+−0.1141
Mg2+−0.2250.1351
Na+−0.2040.1850.908 **1
HCO3−0.2260.0400.968 **0.915 **1
SO42−−0.1050.564 **0.666 **0.816 **0.639 **1
Cl−0.2940.3080.912 **0.951 **0.869 **0.794 **1
F0.290−0.2290.550 **0.487 **0.563 **0.2670.359 *1
H2SiO3−0.1880.0000.596 **0.477 **0.528 **0.2050.565 **0.0791
TDS−0.2240.352 *0.949 **0.962 **0.917 **0.825 **0.961 **0.455 **0.524 **1
TH−0.2390.392 *0.965 **0.892 **0.910 **0.768 **0.929 **0.450 **0.553 **0.976 **1
CODMn−0.0400.0860.671 **0.711 **0.708 **0.584 **0.679 **0.331 *0.345 *0.699 **0.646 **1
* and ** represent significant levels of 0.05 and 0.01, respectively.
Table 5. Statistics of δD, δ18O and d–excess in different seasons (Unit: ‰).
SampleSampling SiteSeptember 2021May 2022
δDδ18Od–ExcessδDδ18Od–Excess
H1Upstream
aquifer
(Q3al+pl)
−69.51−8.992.38−69.06−9.315.43
H2−67.41−8.651.79−67.61−8.641.50
H5−74.58−9.914.70−74.93−10.085.73
H6−70.97−9.545.35−62.86−8.565.65
H8−68.60−9.336.01−67.74−8.973.98
H9−71.20−9.333.40−70.95−9.293.36
H12−68.89−8.892.23−68.32−8.923.04
H13−73.68−9.703.95−73.57−9.764.52
Average−70.60−9.293.73−69.38−9.194.15
H3Downstream
aquifer
(Q4l)
−66.19−8.632.84−66.01−8.502.02
H4−74.31−9.854.49−74.89−9.964.82
H10−61.01−7.53−0.81−60.68−7.39−1.60
H11−67.53−8.913.74−68.94−8.952.68
Average−67.26−8.732.57−67.63−8.701.98
Table 6. Statistics of the overstandard indices.
IndexNa+ClSO42−NO3(N)NO2(N)NH4(N)
Level III200250250201.000.50
Rover7.895.2610.5323.682.630.00
M2.892.981.574.741.35/
IndexFTDSTHAsCODMn
Level III110004500.013
Rover28.9521.0536.842.6310.53
M2.393.434.111.241.69
Rover: Overstandard ratio based on the level III standard, %; M: Multiple of the maximum concentration to a multiple of the level III standard; Level III: Level III of Standard for Groundwater Quality (GB/T 14848-2017), mg/L.
Publisher’s Note: MDPI stays neutral with regard to jurisdictional claims in published maps and institutional affiliations.

