
Modelling the Effects of Dam Reservoir Backwater Fluctuations on the Hydrodynamics of a Small Mountain Stream


1
Institute of Nature Conservation, Polish Academy of Sciences, al. Adama Mickiewicza 33, 31-120 Kraków, Poland
2
Hydrology and Hydrodynamics Department, Institute of Geophysics Polish Academy of Sciences, ul. Księcia Janusza 64, 01-452 Warszawa, Poland
3
Faculty of Environmental Engineering and Land Surveying, University of Agriculture in Kraków, al. Mickiewicza 24/28, 30-059 Kraków, Poland
*
Author to whom correspondence should be addressed.
Water 2022, 14(19), 3166; https://doi.org/10.3390/w14193166
Submission received: 11 July 2022
/
Revised: 23 September 2022
/
Accepted: 6 October 2022
/
Published: 8 October 2022
(This article belongs to the Section Hydraulics and Hydrodynamics)
Abstract
:The water depth and flow velocity of a river may be temporarily disturbed by the water level fluctuations connected with the operation of artificial dam reservoirs located downstream (so-called backwater fluctuations (BF)). In this research, we use the two-dimensional hydrodynamic model iRIC MFlow_02 to quantify the effects of BF on the lowermost section (ca. 1.5-km length) of a small (channel width ≤ 20 m) mountain stream, the Smolnik Stream, which flows into the Rożnów Dam Reservoir, in Southern Poland. To reproduce the hydrological conditions generally observed in the stream, six scenarios were simulated, considering three steady flow discharges at the inlet, with recurrence intervals of 1 year (1.8 m3 s−1, small flood), 2 years (24.5 m3 s−1; medium flood), and 20 years (89.5 m3 s−1; large flood), and two reservoir levels at the outlet: 265 m a.s.l. (normal reservoir water level) and 270 m a.s.l. (maximum reservoir water level). In these simulations, sediment transport and morphodynamics are not considered. The average modelled water depth was increased by backwater fluctuation in the channel, from 28% (from 1.62 m vs. 2.07 m) during a small flood, up to 59% (from 3.46 m to 5.50 m) during a large flood. Contrastingly, the average modelled flow velocity was decreased in the channel (from −8% 0.52 m s−1 vs. 0.47 m s−1) during a small flood to −78% (0.49 m s−1 vs. 0.11 m s−1) during a large flood. Our results demonstrate that backwater fluctuations substantially disturb the hydrodynamics of the studied stream, which is interpreted as a triggering factor of the previously documented alterations in its sedimentology, morphology, and riparian vegetation pattern.
1. Introduction
Dams are one of the most important factors globally altering the hydro-morphological regime of rivers and negatively affecting their ecological functioning [1,2]. For example, Grill et al. [3] pointed out that only 37% of rivers longer than 1000 kilometres remain free-flowing over their entire length and that dams and reservoirs are the major drivers of river connectivity loss. Dam-related alterations of river hydromorphology are substantially better understood in the river sections downstream [4,5,6,7,8] than in the river reaches upstream of dam reservoirs [9,10,11,12,13,14], particularly on mountain watercourses [15,16,17]. However, upstream from a dam reservoir, river hydrodynamics may be directly changed by temporary inundation driven by the reservoir, which can trigger morphological adjustments that can additionally modify the initial hydrodynamics, even at the time when backwater inundation does not occur [17].
Existing gaps in our knowledge about the upstream effects of dams on river hydrodynamics can be explained by their relatively small spatial extent (reaching typically from a few to tens of kilometres) in comparison to the downstream effects (typically spanning from tens to thousands of kilometres) (cf. [5,17,18]). On a mountain river, a disturbance in the river hydrodynamics occurring upstream from a dam reservoir has generally a smaller spatial extent than in the case of lowland watercourses, because of the higher bottom slope limiting the zone of the river valley that can be inundated due to the changes of reservoir water level [16]. Despite their relatively small spatial extent and short-term duration, the river valley inundations connected with the operation of downstream reservoirs (the so-called Backwater Fluctuation—BF) may alter the long-term functioning of all the abiotic (e.g., sedimentology, morphology) and biotic (e.g., riparian vegetation) components of the reservoir tributary [16]. In the case of mountain rivers, the direction of a disturbance in river hydrodynamics caused by BF (e.g., an increase in flood water depth and a decrease in its flow velocity) [17] highly contrasts the natural regime of such rivers, which is characterized by relatively shallow and fast water flow [19]. This short-term disturbance of the river hydrodynamics caused by BF may trigger numerous and complex impacts on riverine biota, as well as on the physical parameters of in-channel and floodplain habitats [1,19,20,21,22,23], which make the quantification of such a disturbance in river hydrodynamics a prerequisite to assess and evaluate other risks induced by them [16].
Previous works have suggested that alterations of river hydrodynamics in the dam reservoir backwater zone are a result of interactions between river discharge and the water level fluctuation in the dam reservoir, and that their magnitude is higher when BF has occurred during small floods than for those occurring during the larger ones [17]. Most of the existing works on such alterations are based on the observations of medium and large-sized rivers [10,16], mainly located in lowland areas [20,21,22], while only very few have analyzed this problem on small streams [23] in mountain areas [17].
In this work, we aimed to address this gap by investigating the patterns of BF-induced hydrodynamic alterations occurring on a small mountain stream (the Smolnik) flowing into a large dam reservoir (Rożnów Dam Reservoir, Southern Poland). Our research is motivated by field observations and information from the local citizens, which both suggest that the hydrodynamics of the studied stream are permanently altered in the backwater zone of the Rożnów Dam Reservoir, which is functioning since 1941. To support future assessment of the ecological and flood risk effects of this alteration occurring on the Smolnik stream, we applied a planar two-dimensional hydrodynamic model to quantify the magnitude spatial extents of BF-induced changes in water depth and flow velocity of the river, considering low (1-year return period), medium (2-year return period), and high (20-year return period) floods.
2. Materials and Methods
2.1. Study Area
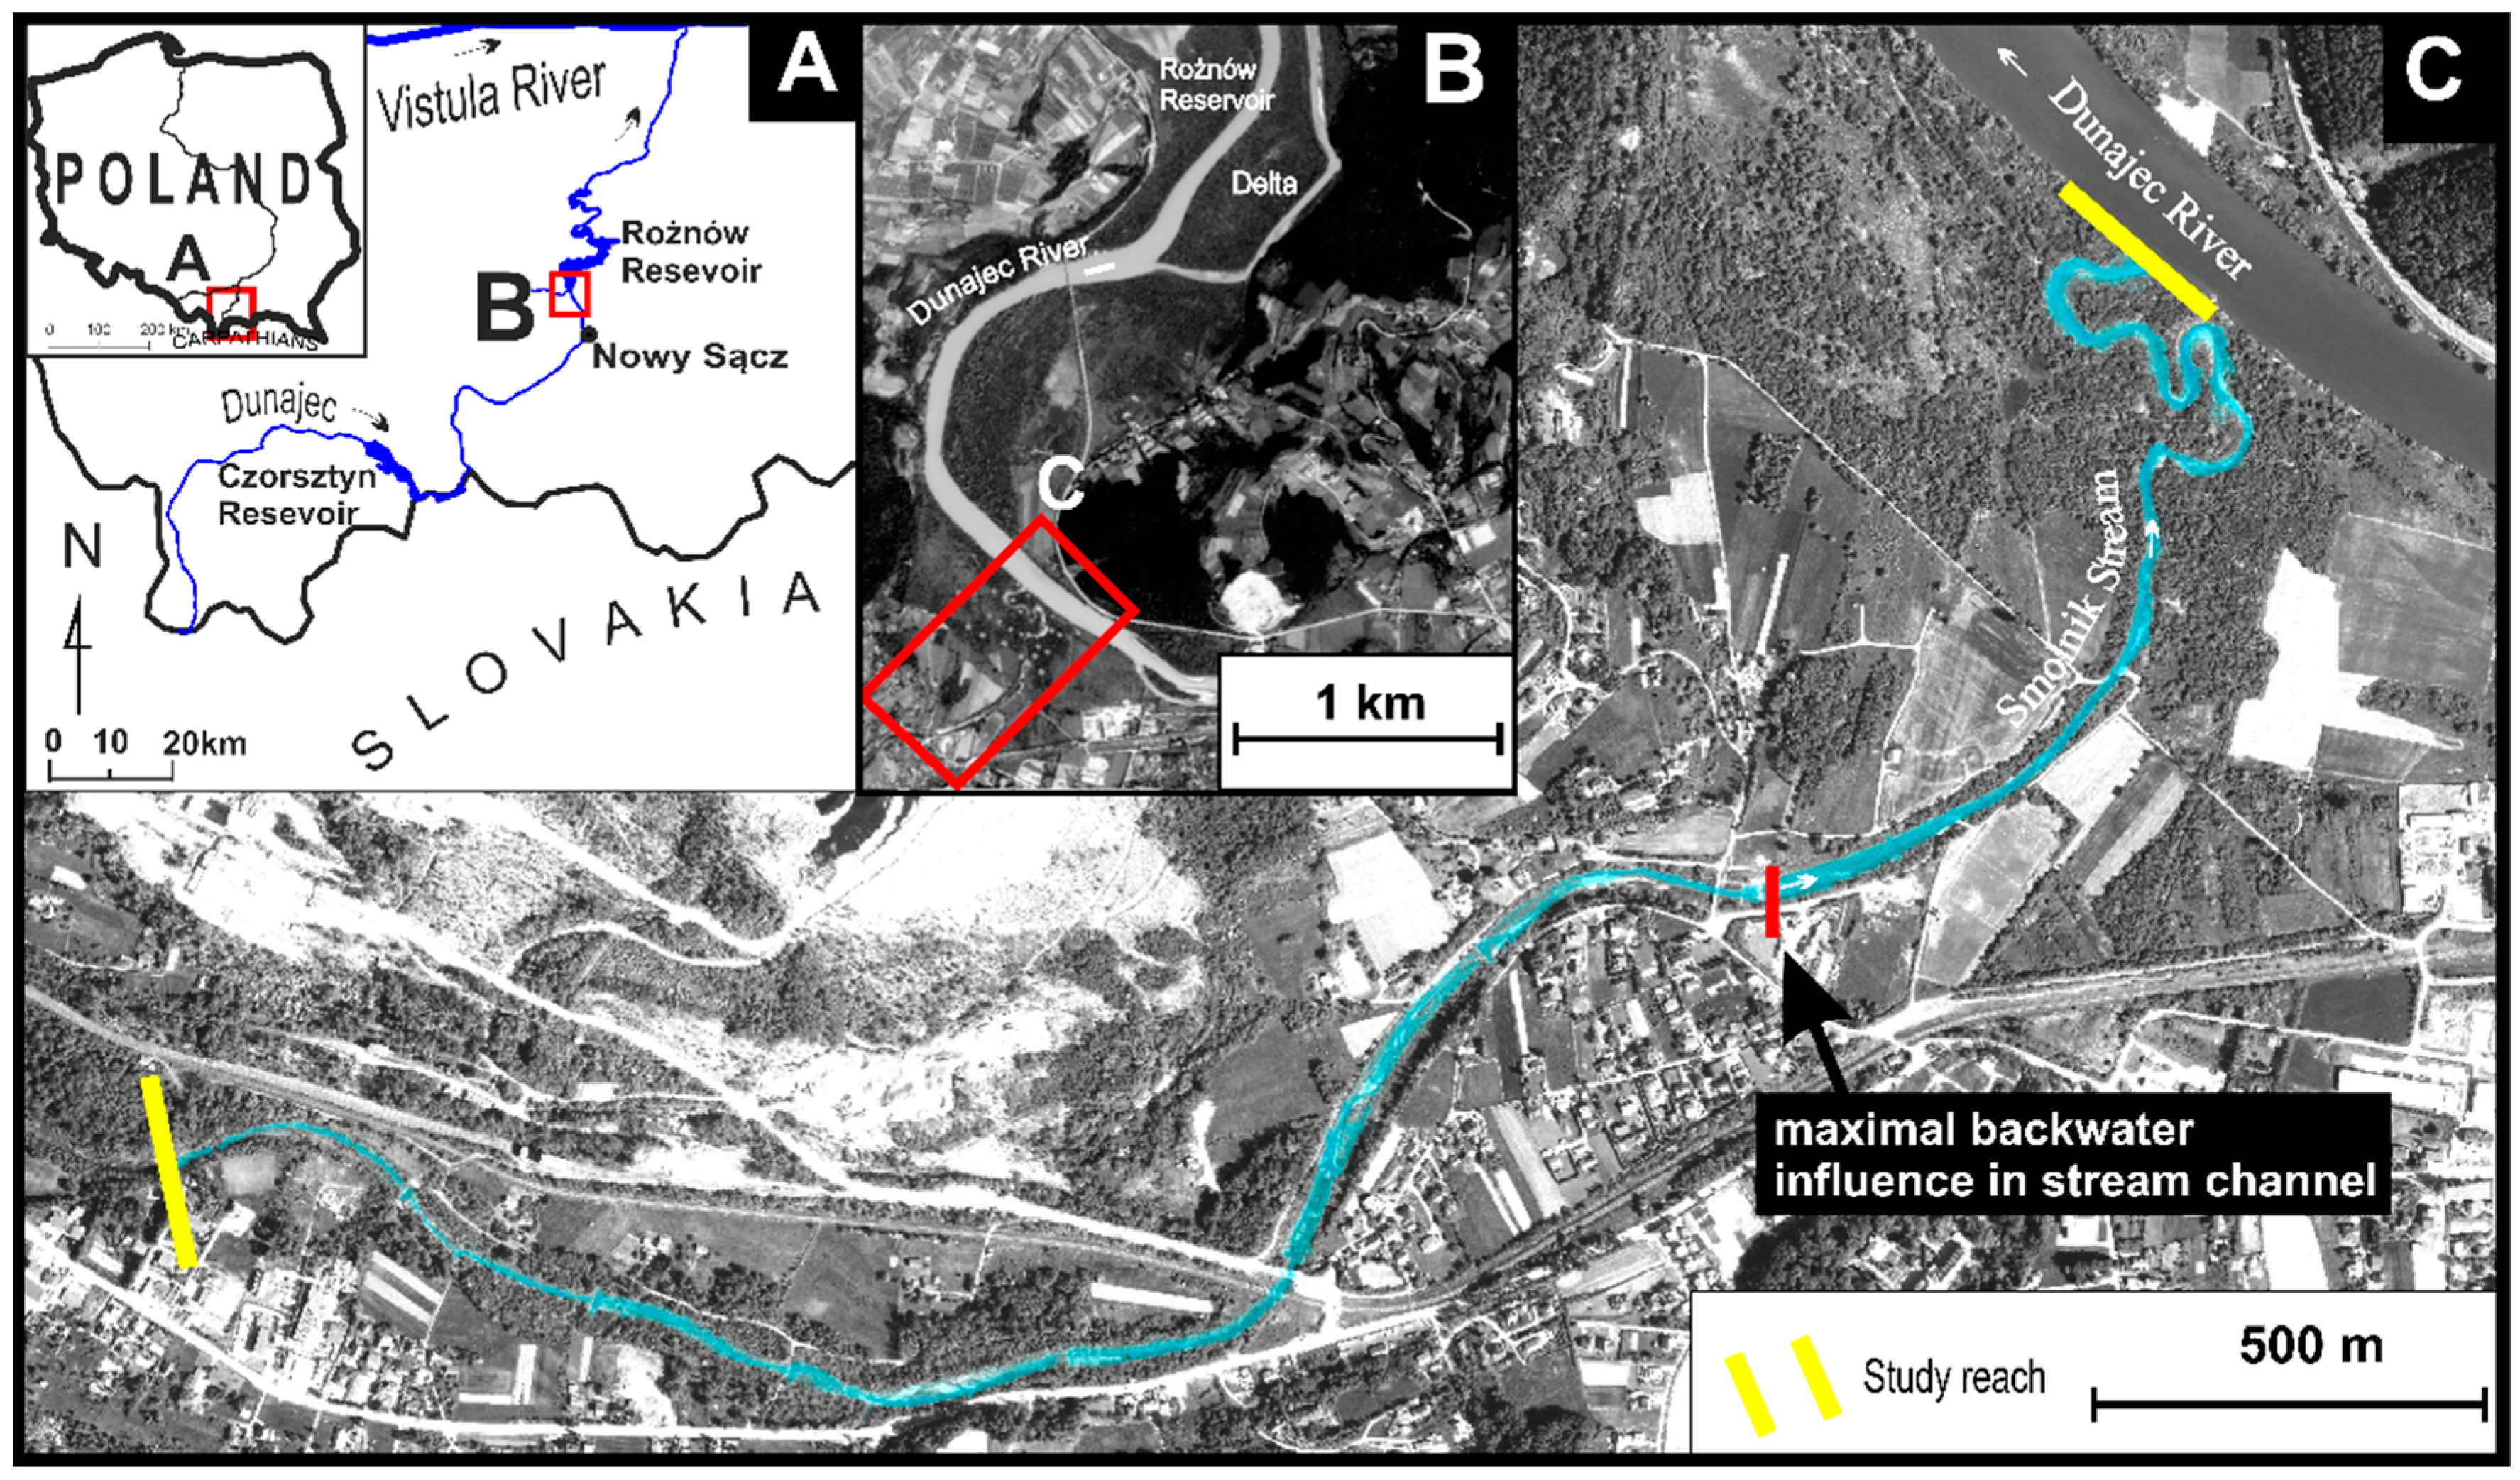
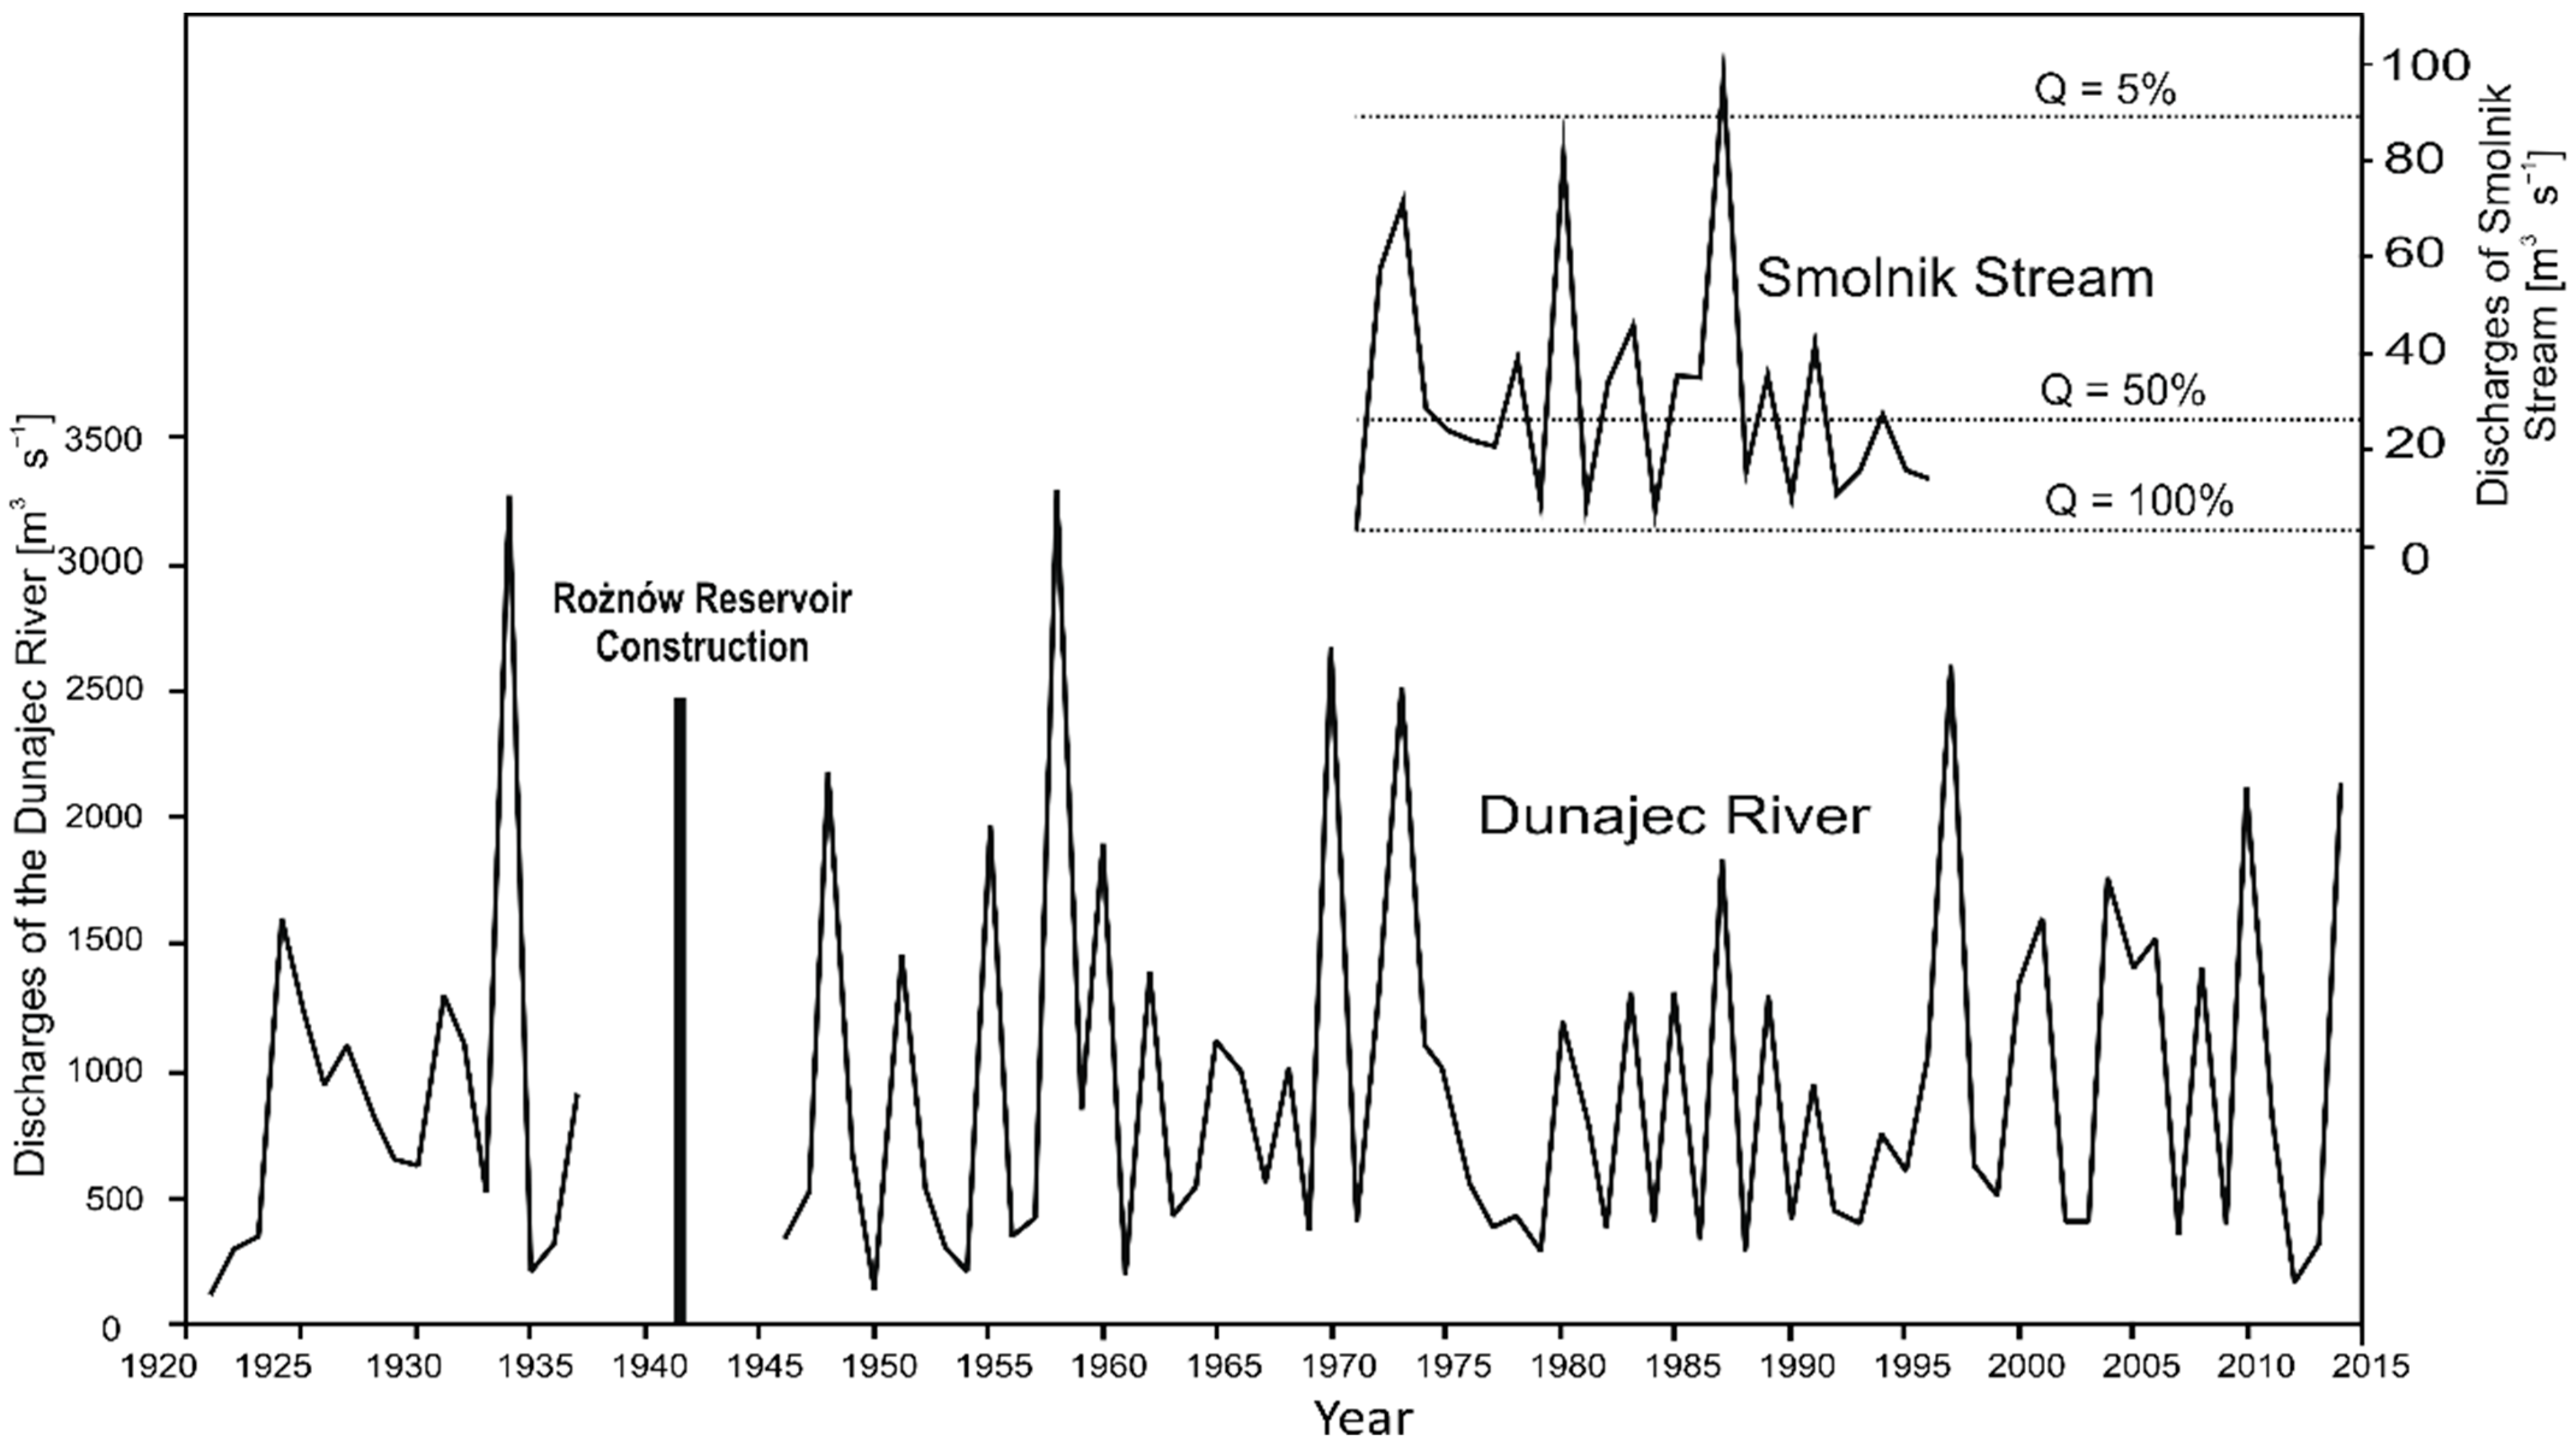
The 15.45-km-long Smolnik Stream drains an area of 64.9 km2 [24] covering mainly the Beskidy middle-mountains, built of sandstone-shale flysch rocks, and partly the intermontane basin, having the bottom filled with gravel and sand-silt deposits (Figure 1). The stream is a left-side tributary of the Dunajec River and the junction of these two watercourses is located in the backwater zone of the Rożnów Dam Reservoir, built in 1942, with an area of around 16 km2 (Figure 1B,C). The average maximum annual discharge of the stream was 30.9 m3 s−1 within the period 1971–1996 (Figure 2A), with the largest floods occurring between May and August. During a large flood that happened in 1997, the gauging stations on the stream have been destroyed and since then it is no longer operating.
Figure 1.
(A) Location of the study site in the Polish Carpathians. (B) Location of the studied section within the delta-backwater zone of the Rożnów Dam Reservoir. (C) The studied section of the Smolnik Stream. Black arrow and red line indicate the maximum extent of backwater influences in the Smolnik Stream channel.

Figure 2.
Maximum annual discharges of the Smolnik Stream (1971–1996) and the Dunajec River (1921–2014). The magnitudes of floods investigated in the hydrodynamic numerical modelling of the Smolnik Stream are indicated by dotted lines (for details see Table 1).
Figure 2.
Maximum annual discharges of the Smolnik Stream (1971–1996) and the Dunajec River (1921–2014). The magnitudes of floods investigated in the hydrodynamic numerical modelling of the Smolnik Stream are indicated by dotted lines (for details see Table 1).


Table 1.
Scenarios used for numerical modelling.
| Scenario Number and Description | 1 Small Flood No Backwater | 2 Small Flood Maximal Backwater | 3 Medium Flood No Backwater | 4 Medium Flood Maximal Backwater | 5 Large Flood No Backwater | 6 Large Flood Maximal Backwater |
|---|---|---|---|---|---|---|
| River discharge [m3 s−1] | 1.8 | 1.8 | 24.5 | 24.5 | 89.5 | 89.5 |
| Recurrence interval of discharge [%, year] | 100 (1-year flood) | 100 (1-year flood) | 50 (2-year flood) | 50 (2-year flood) | 5 (2-year flood) | 5 (2-year flood) |
| Reservoir water level [m asl] | 265 | 270 | 265 | 270 | 265 | 270 |
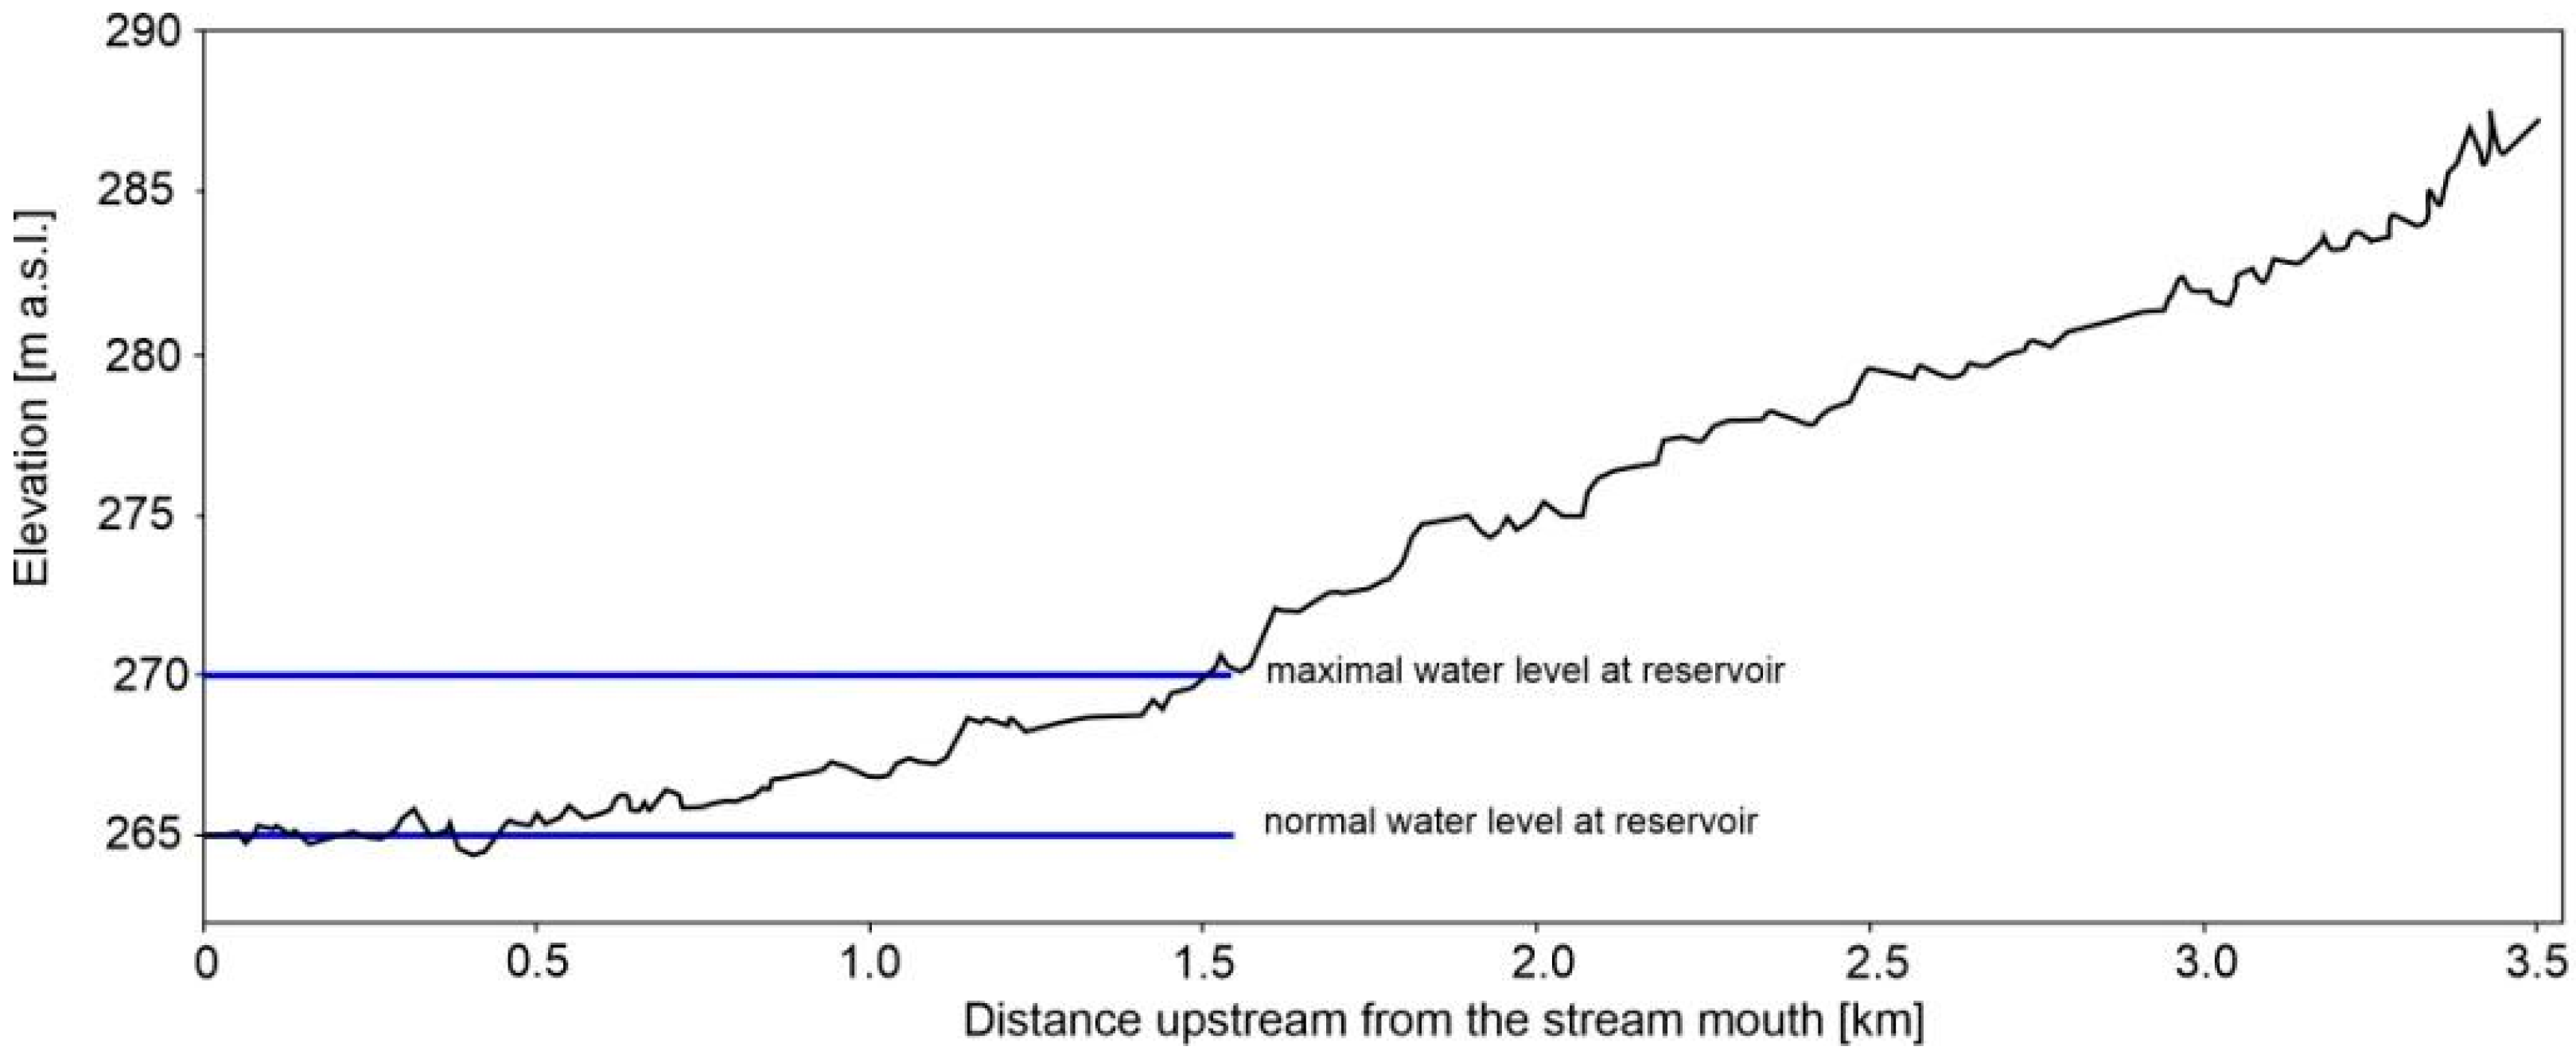
The study was conducted in the 3.5-kilometre-long lowermost section of the stream (Figure 1C). At a distance of about 0–1.5 km from the downstream end, the stream is affected by the backwater fluctuation of the Rożnów Reservoir, occurring between 265 and 270 m a.s.l. (Figure 2 and Figure 3), and this reach will be called hereafter ‘backwater reach’. In this reach (0–1.5 km), the Smolnik Stream flows into the wider and gentler slope bottom of the Dunajec River, underlain by an alluvial fan. Before and slightly after the construction of the Rożnów Dam Reservoir, this morphological configuration had been favouring the existence of a multi-thread stream channel pattern here [25]. Despite the influence of backwater fluctuations, the backwater reach of the Smolnik Stream is also affected by flood inundations from the Dunajec River. The operation of the Rożnów reservoir started in 1942 intending to control flooding, provide recreational opportunities for tourists, and produce hydropower [26]. Generally, between May and August, when large floods usually occur in the Polish Carpathians, the reservoir levels are kept lower than during the rest of the year (Figure 2 and Figure S1). During the maximum water level in the reservoir, the water level in the lowermost part of the stream increases by around five meters and its floodplain is inundated up to a depth of 3 m. In the lower part of the study reach, the stream channel width varies between 8 and 20 m, and its bottom is mainly composed of gravel with a maximum bed grain size of 200 mm in the upper part of the section, and fine gravel mixed with sand and mud in its lower part. The channel slope changes markedly at the intersection of the normal water level at the Rożnów reservoir (265 m a.s.l.) and the channel bed profile at a location of around 150 m upstream from the river mouth, from 0.0002 m m−1 to 0.004 m m−1, and then increases to 0.009 m m−1 at a distance of 1.5–3.5 km from the mouth (Figure 3). At a distance of 500 m upstream of the Smolnik reservoir confluence (measured along a straight line crossing the floodplain), a flood-protection dike has been functioning since the 1940s (Figure 1C). This dike protects local residential areas from reservoir backwater and from flooding by the Dunajec River. Since the construction of the Rożnów reservoir in 1942, the stream valley area downstream of this dike has become more intensively and frequently inundated and remained less managed by humans, which favoured the fast development of a dense riparian forest (composed mostly of Salix spp.) on the abandoned arable lands on the river floodplain and on the bare sediments in the stream channel [25]. In the upper part of the backwater reach (from 1 to 1.5 km upstream of the stream confluence), the channel was straightened in the past and its banks are now partly reinforced [25]. At the upper end of the backwater reach (at a distance of 1.5 km from the stream confluence), a 1-metre-high weir is functioning, which protects the neighbouring bridge from stream bed erosion occurring extensively in the upper and middle course of the stream [27]. The stream is now channelized along the upper part of the study reach (1.5–3.5 km) and a series of nine weirs have been functioning here since the 1970s. These regulations caused the simplification of the previous multi-thread channel pattern and favoured the narrowing and degradation of the river channel. The valley bottom in the upper reach is intensively utilized as building areas, roads and agricultural fields, therefore, a riparian forest covers only a narrow floodplain area nearby the stream channel.
2.2. Methods
2.2.1. Study Design
To quantify the backwater-induced changes of the Smolnik Stream hydrodynamics, we constructed six scenarios with three steady discharges at the inlet, with recurrence intervals of 1 year (1.8 m3 s−1, referred to here as a small flood), 2 years (24.5 m3 s−1; a medium flood), and 20 years (89.5 m3 s−1; a large flood), and two reservoir levels: 265 m a.s.l. (no inundation of the backwater reach by the reservoir water) and 270 m a.s.l. (maximum backwater effect), as outlet boundary conditions. The flooding scenarios were derived from statistical analysis of the maximum annual flows measured during the period 1971–1996. The planar two-dimensional solver Mflow_02 of the freeware suite iRIC version 3.0 (i-ric.org) [28] was used to numerically compute water depth and flow velocity for each scenario. The modelled outputs were then analyzed with GIS software (Quantum GIS 3.18) using automatic measurements along 237 cross-sections (channel zone), delimited at 15 m intervals to cover the entire study area.
2.2.2. Field Data Collection and Mesh Construction
Bathymetric and geodetic surveys were performed within the stream channel zone and combined with a digital elevation model (derived from LiDAR data) for the floodplain zone, to produce a topographic grid that was further used for numerical modelling (Section 2.2.3).
The bathymetric survey was conducted in 2019 within the lowermost part of the study section covering a total length of 150 m, where the water depth was too high to perform a geodetic survey. The geodetic survey was conducted in the same year using a TOPCON GTS-226 total station and was focused mostly on the lower part of the study section, having the most variable bed morphology and dense vegetation cover on the stream banks, which hinders the mapping and proper detection of the stream bed during further uncrewed aerial vehicle (UAV) surveys.
2.2.3. Description of the Two-Dimensional Hydrodynamic Model
The numerical solver iRIC Mflow_02 was developed to calculate unsteady two-dimensional plane flow and riverbed morphodynamics using unstructured meshes and the finite element method in an orthogonal Cartesian coordinate system [29,30]. Thanks to such unstructured meshes, Mflow_02 can compute unsteady flow in areas including hydraulic infrastructures like bridge piers, but can also model flooding events over complex areas such as floodplains or backwater events. In addition, the solver allows for computing stream bed variations as well as bedload and suspended load along the reach via several sediment transport equations [29]. However, since the goal of the present simulations was to evaluate changes in the mean water depth and mean flow velocity for three stream discharges interacting with different backwater inundation levels, only clear water conditions (no sediment transport) were assumed here, imposing constant discharge at the upstream end and a constant water level as a downstream boundary condition.
For the sake of simplicity, only the key parameters of the model are discussed here, while the entire mathematical background can be found in the MFlow_02 manual [28]. The bottom friction was set up using Manning’s roughness coefficient, following the criteria of Chow [30]. This coefficient was first calibrated and then assigned to five roughness-homogenous unit classes (Table 2), which were delineated in the stream and on the floodplain similarly to previous works [17]. Each unit was digitized using GIS software (Quantum GIS) from the orthophoto produced from the aerial photos taken during a UAV mission in 2020. The buildings present in the stream inundation zone were also included in the simulation as obstacles.
MFlow_02 solves the hydrodynamics using a k-ε approach (Equation (1)), where the turbulent energy k derives from the equation proposed by Nezu & Nakagawa [31], as reported in the model manual [31], to which the readers are addressed for more details on the numerical background of the solver.
where ν represents the kinematic eddy viscosity and Cμ is a constant equal to 0.09. The turbulent energy k is here computed following (2) and the energy dissipation rate ε can be evaluated via (3).
where u* represents the bottom friction velocity, computed accounting for Manning’s n coefficient.
where Ce is a constant (0.17) and l indicates the representative length of the turbulence. Based on the previous considerations, the kinematic eddy viscosity ν can be calculated without solving the transport equation of energy dissipation rate ε and turbulent energy k.
Following a sensitivity analysis, to guarantee code stability the domain was discretized with unstructured cells having a maximum area of 50 m2, and the simulations were performed with a time step of 0.01 s. To attain the final conditions, each run lasts 50,000 s (around 14 h). With these parameters, we were able to perform stable simulations, guaranteeing a Courant–Friedrichs–Lewy condition CFL < 1 [32].
2.2.4. Limitations of the Hydrodynamic Model
Two-dimensional models (like the applied iRIC Mflow_02) were previously evaluated as capable of providing accurate simulations of the river and floodplain hydrodynamics, but are also computationally expensive. Despite the limitations, using a 2-D model allows us to consider the transversal variation of hydrodynamic variables, which are usually neglected in 1-D models, but can have a major impact in shallow areas like floodplains. Our test runs indicated that modelled water depths in the floodplain zone are extremely low at the substantial portions of the stream floodplain in the backwater fluctuation zone. Taking into account the fact that such shallow flow areas can be significantly affected by errors resulting from the hydrodynamic model development, we have decided to statistically compare only the modelled values obtained for the stream channel zone, which have substantially higher flow depths during all simulated scenarios.
2.2.5. Data Analysis
To evaluate the direct effects of backwater fluctuation on the water depth and flow velocity of the Smolnik Stream, the scenarios without backwater inundation and with maximum backwater inundation were examined using a non-parametric Wilcoxon signed-rank test. This comparison, conducted in the lowermost part of the study reach affected by backwater fluctuations, used the mean values of these parameters calculated for 54 cross-sections intersecting stream channel zone.
The longitudinal extent of direct and indirect effects of the backwater hydrodynamics fluctuation of the Smolnik Stream was determined using a Pettitt test [33]. For a given flood magnitude, the values of a particular hydraulic parameter under conditions with backwater inundation calculated for the above-mentioned cross-sections represented a data series, which was analyzed to identify the location of a change disrupting its homogeneity. This approach previously allowed for the automatic detection of the location of a change in stream hydrodynamics along the stream longitudinal profile [17].
3. Results
Channel Hydrodynamics
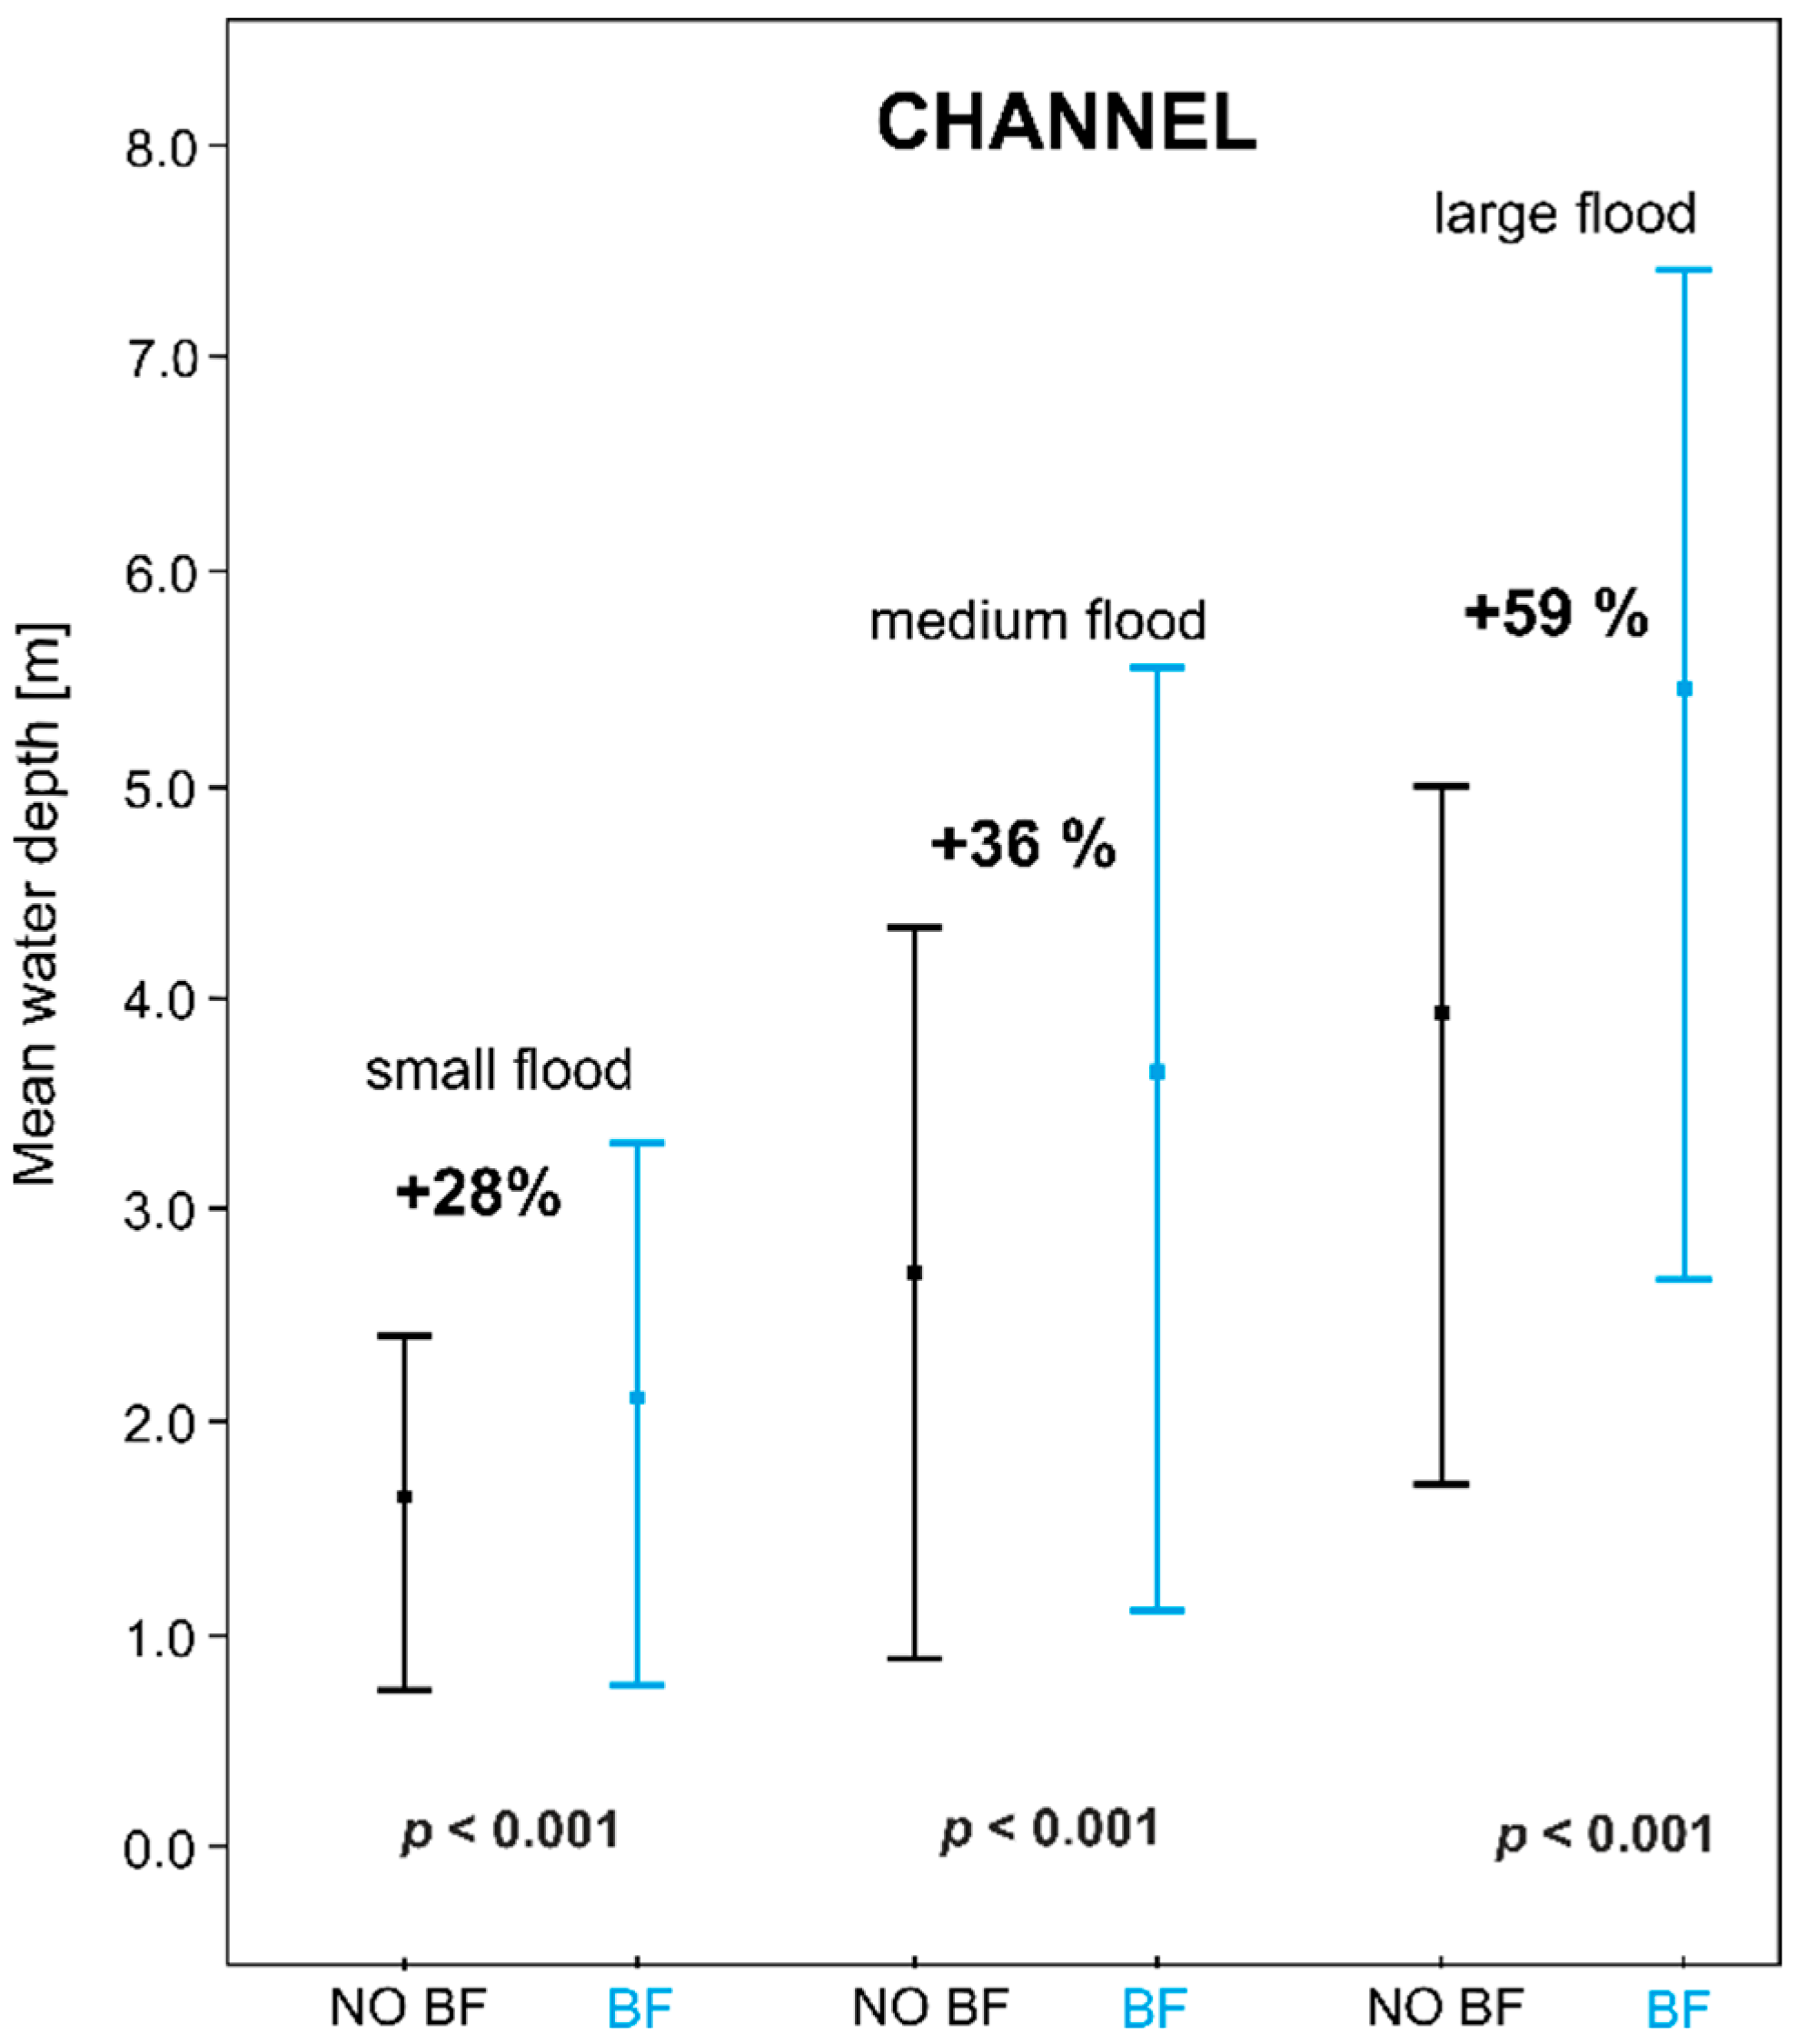
The modelled water depth in the channel zone changed significantly as a result of dam reservoir backwater fluctuations during floods of all considered magnitudes (Figure 4). During a small flood (1.8 m3 s−1), the mean modelled water depth in the channel was 1.62 m without backwater inundation, and increased to 2.07 m during maximal backwater inundation, differing between these two scenarios by 28% (p < 0.001) (Figure 4, Table S1). During a medium flood (24.5 m3 s−1), the same parameter was increased by 36%, from 2.71 m without backwater inundation to 3.60 m during maximal backwater inundation (p < 0.001) (Figure 4, Table S1). Backwater-induced increase in water depth was the highest (59%) during the large flood scenario (89.5 m3 s−1), when water depth increased from 3.46 m to 5.50 m (p < 0.001) (Figure 4, Table S1).
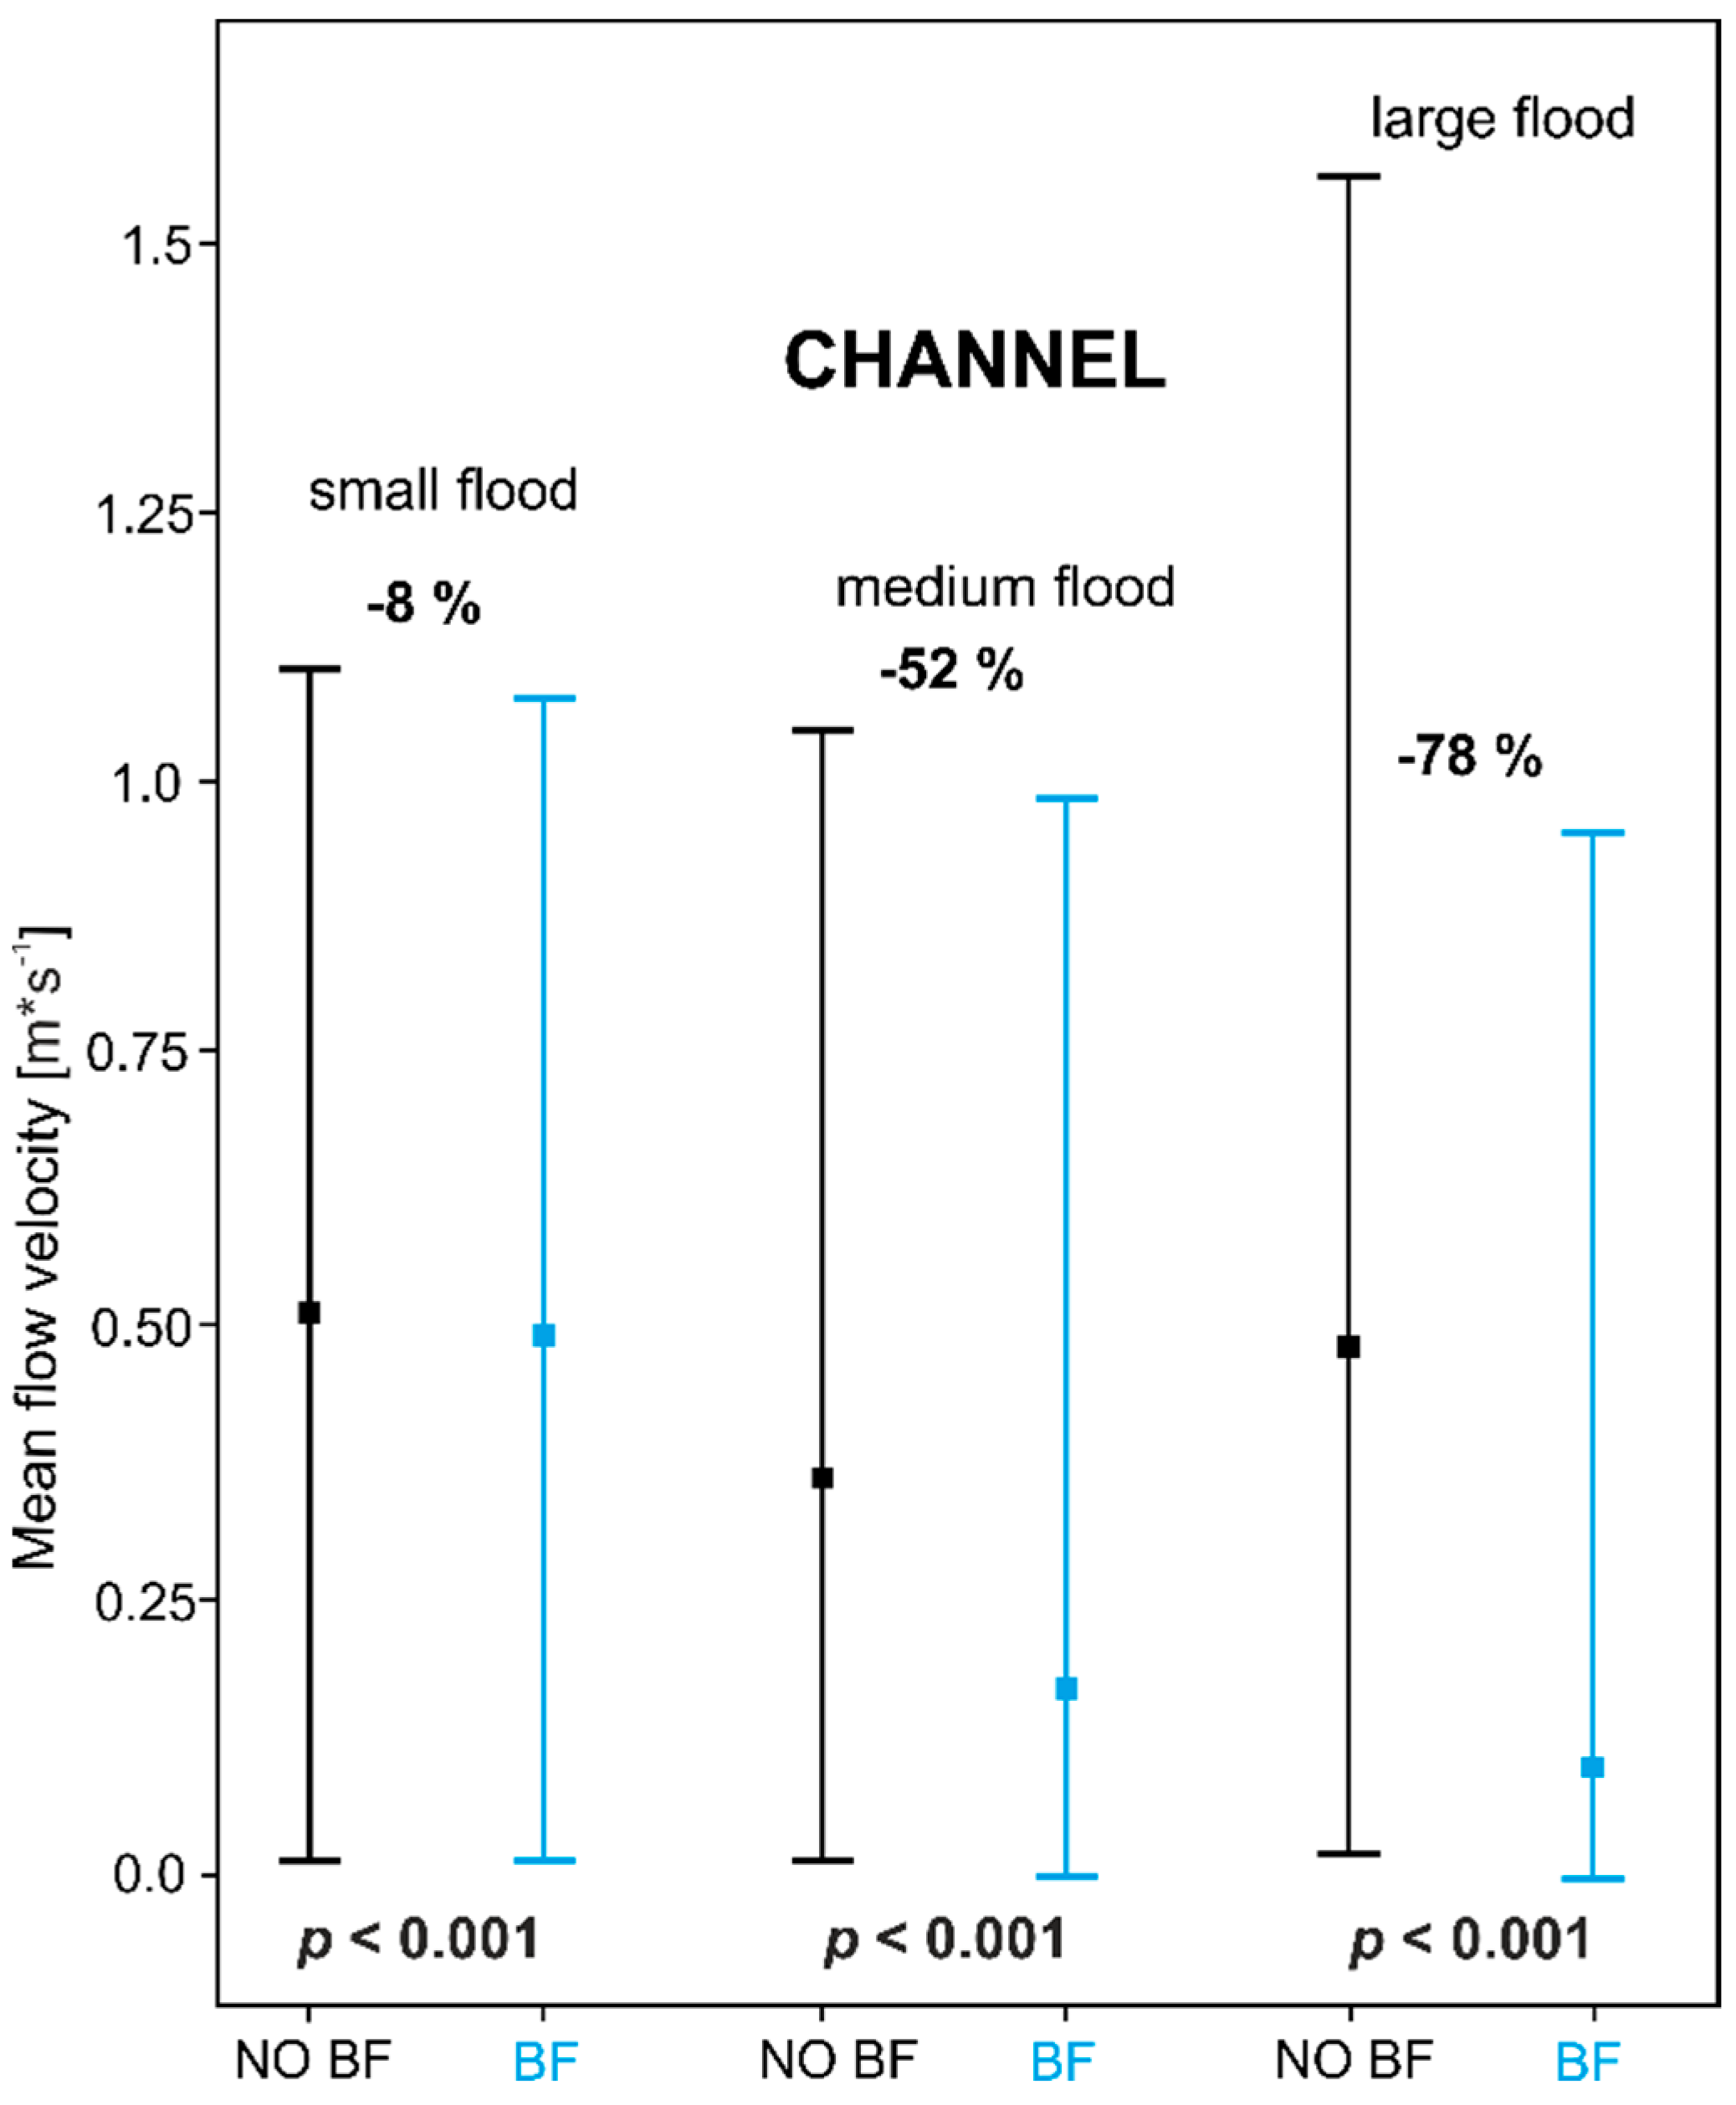
Backwater inundation decreased the average value of the modelled mean flow velocity from 0.52 m s−1 to 0.47 m s−1 during the smallest flooding scenario (−8%) (p < 0.001) (Figure 5, Table S1). In the medium flood scenario, backwater decreased flow velocity by 52%, from 0.37 m s−1 to 0.18 m s−1 (p < 0.001) (Figure 5, Table S1). Backwater-induced decrease in flow velocity was the highest (−78%) in the medium flood scenario, when the flow velocity decreased from 0.49 m s−1 to 0.11 m s−1 (Figure 5, Table S1).
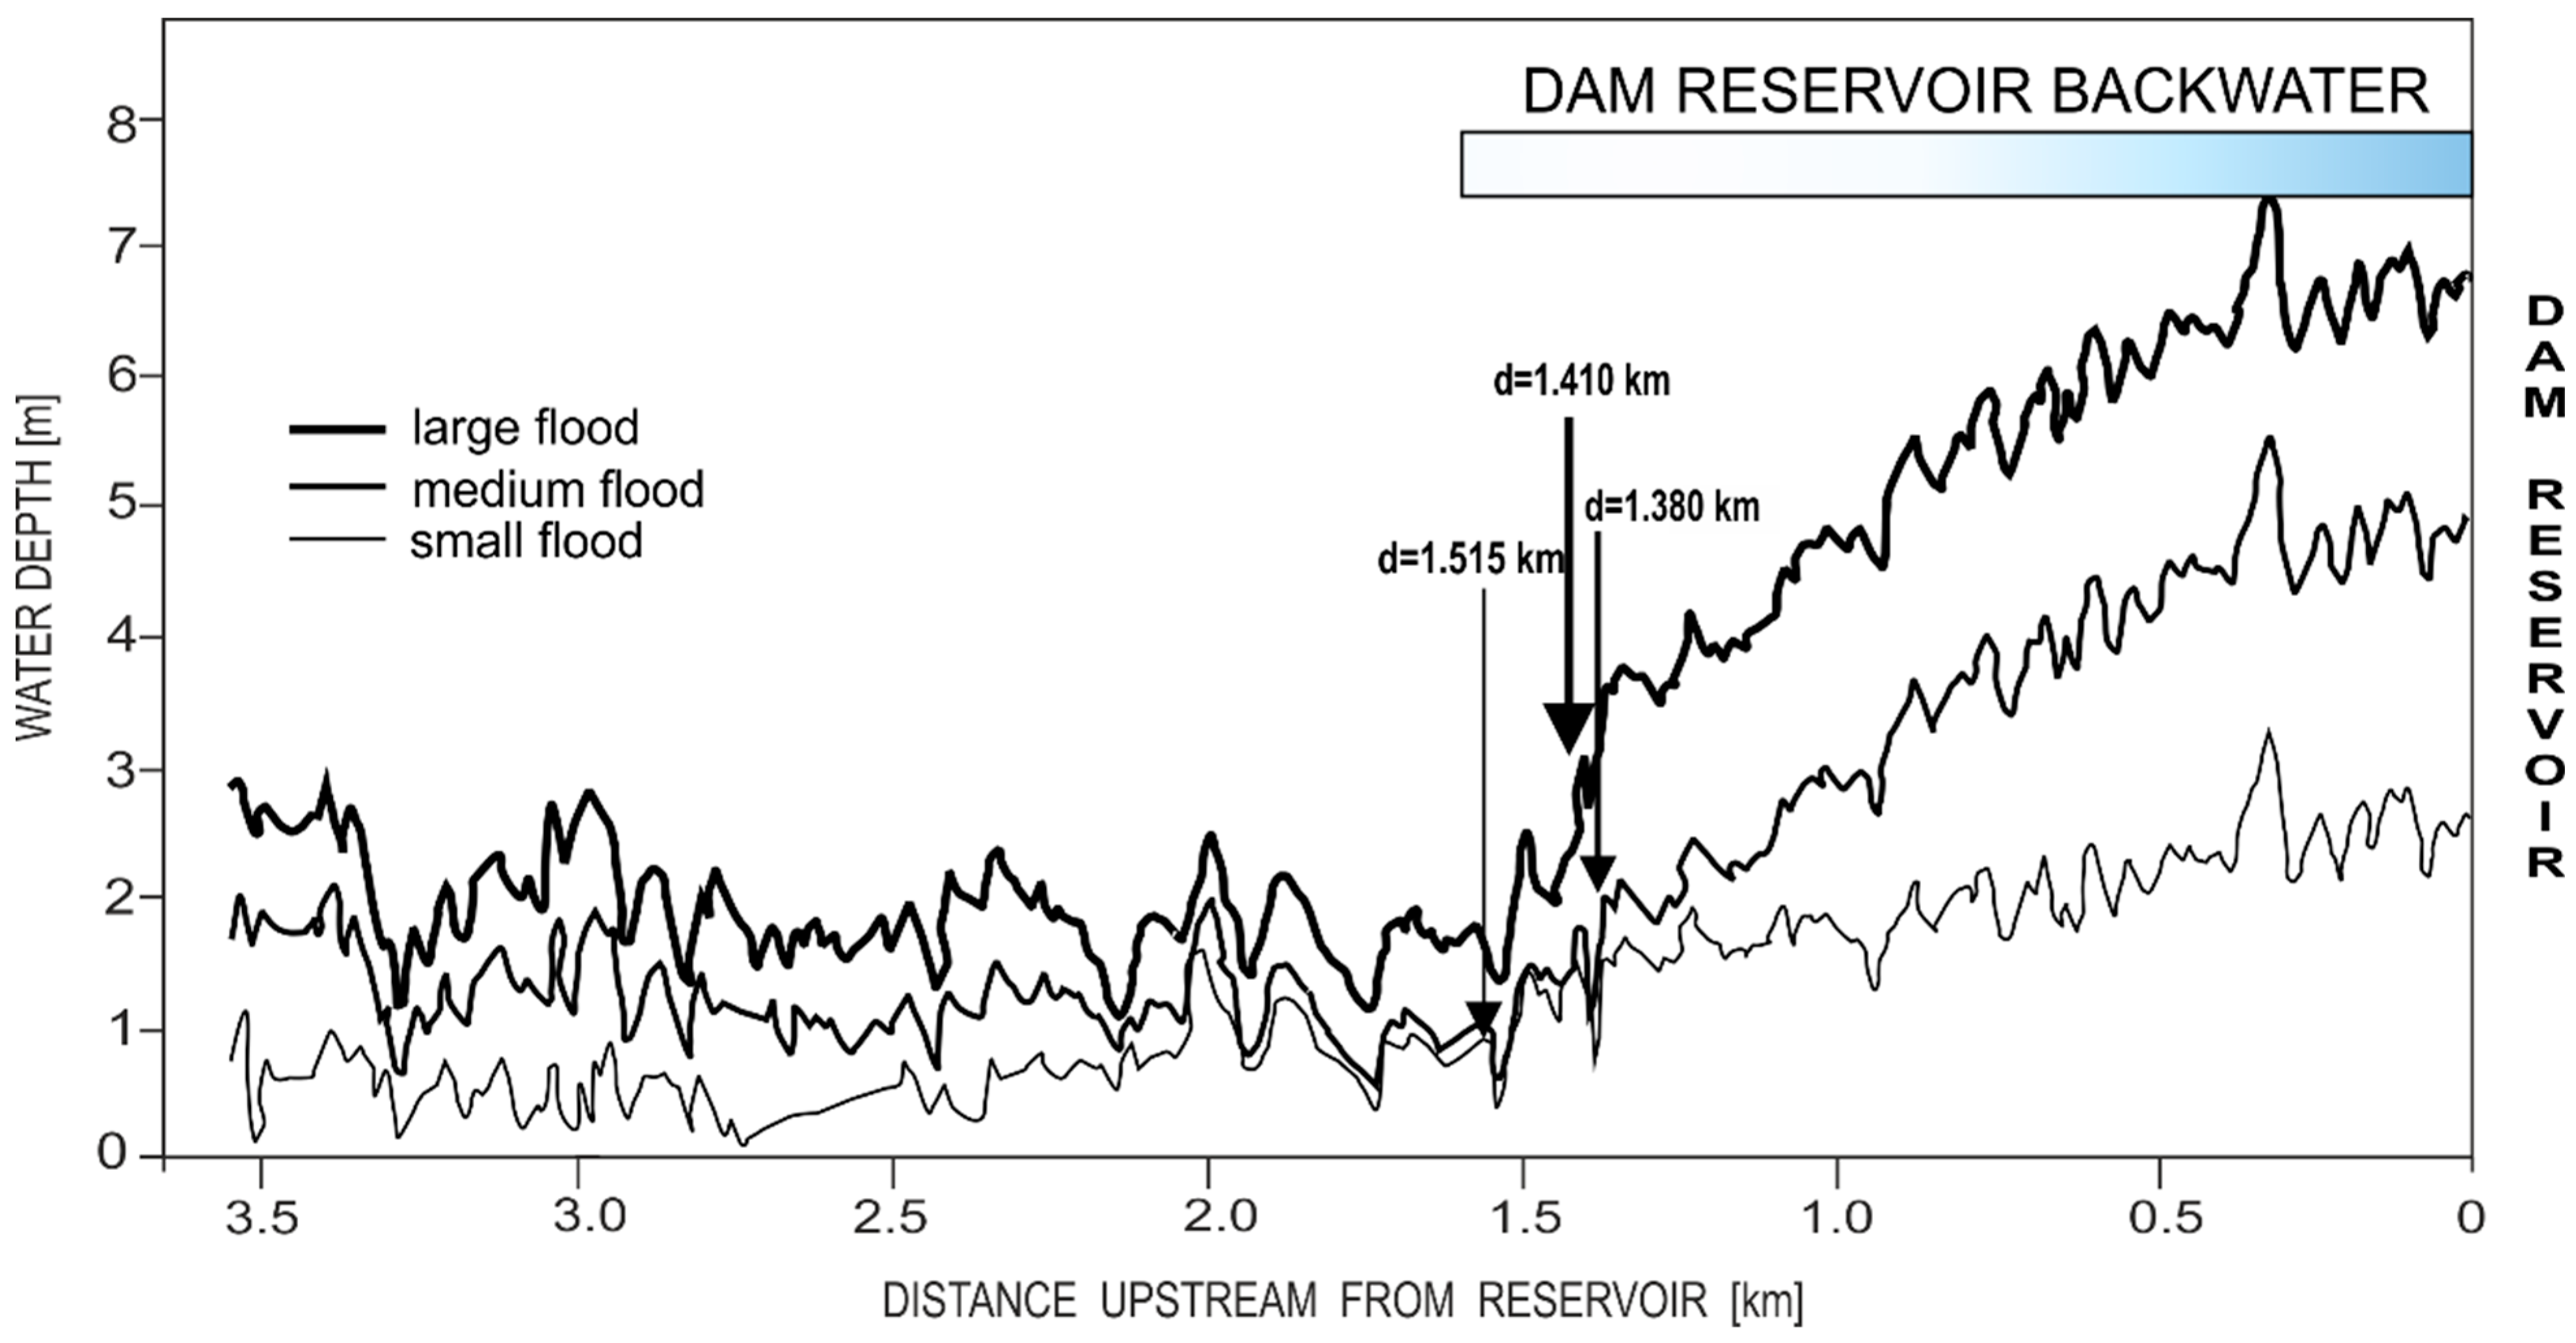
The longitudinal extent of backwater-induced increase in mean water depth in the stream channel was measured from the stream confluence (where the low flow water level corresponds with the normal reservoir level of 265 m a.s.l.) using the Pettit test. During the low flood scenario, this extent reached up to 1.515 km, during a medium flood up to 1.380 km and during a large flood up to 1.410 km upstream from the stream confluence (Figure 6).
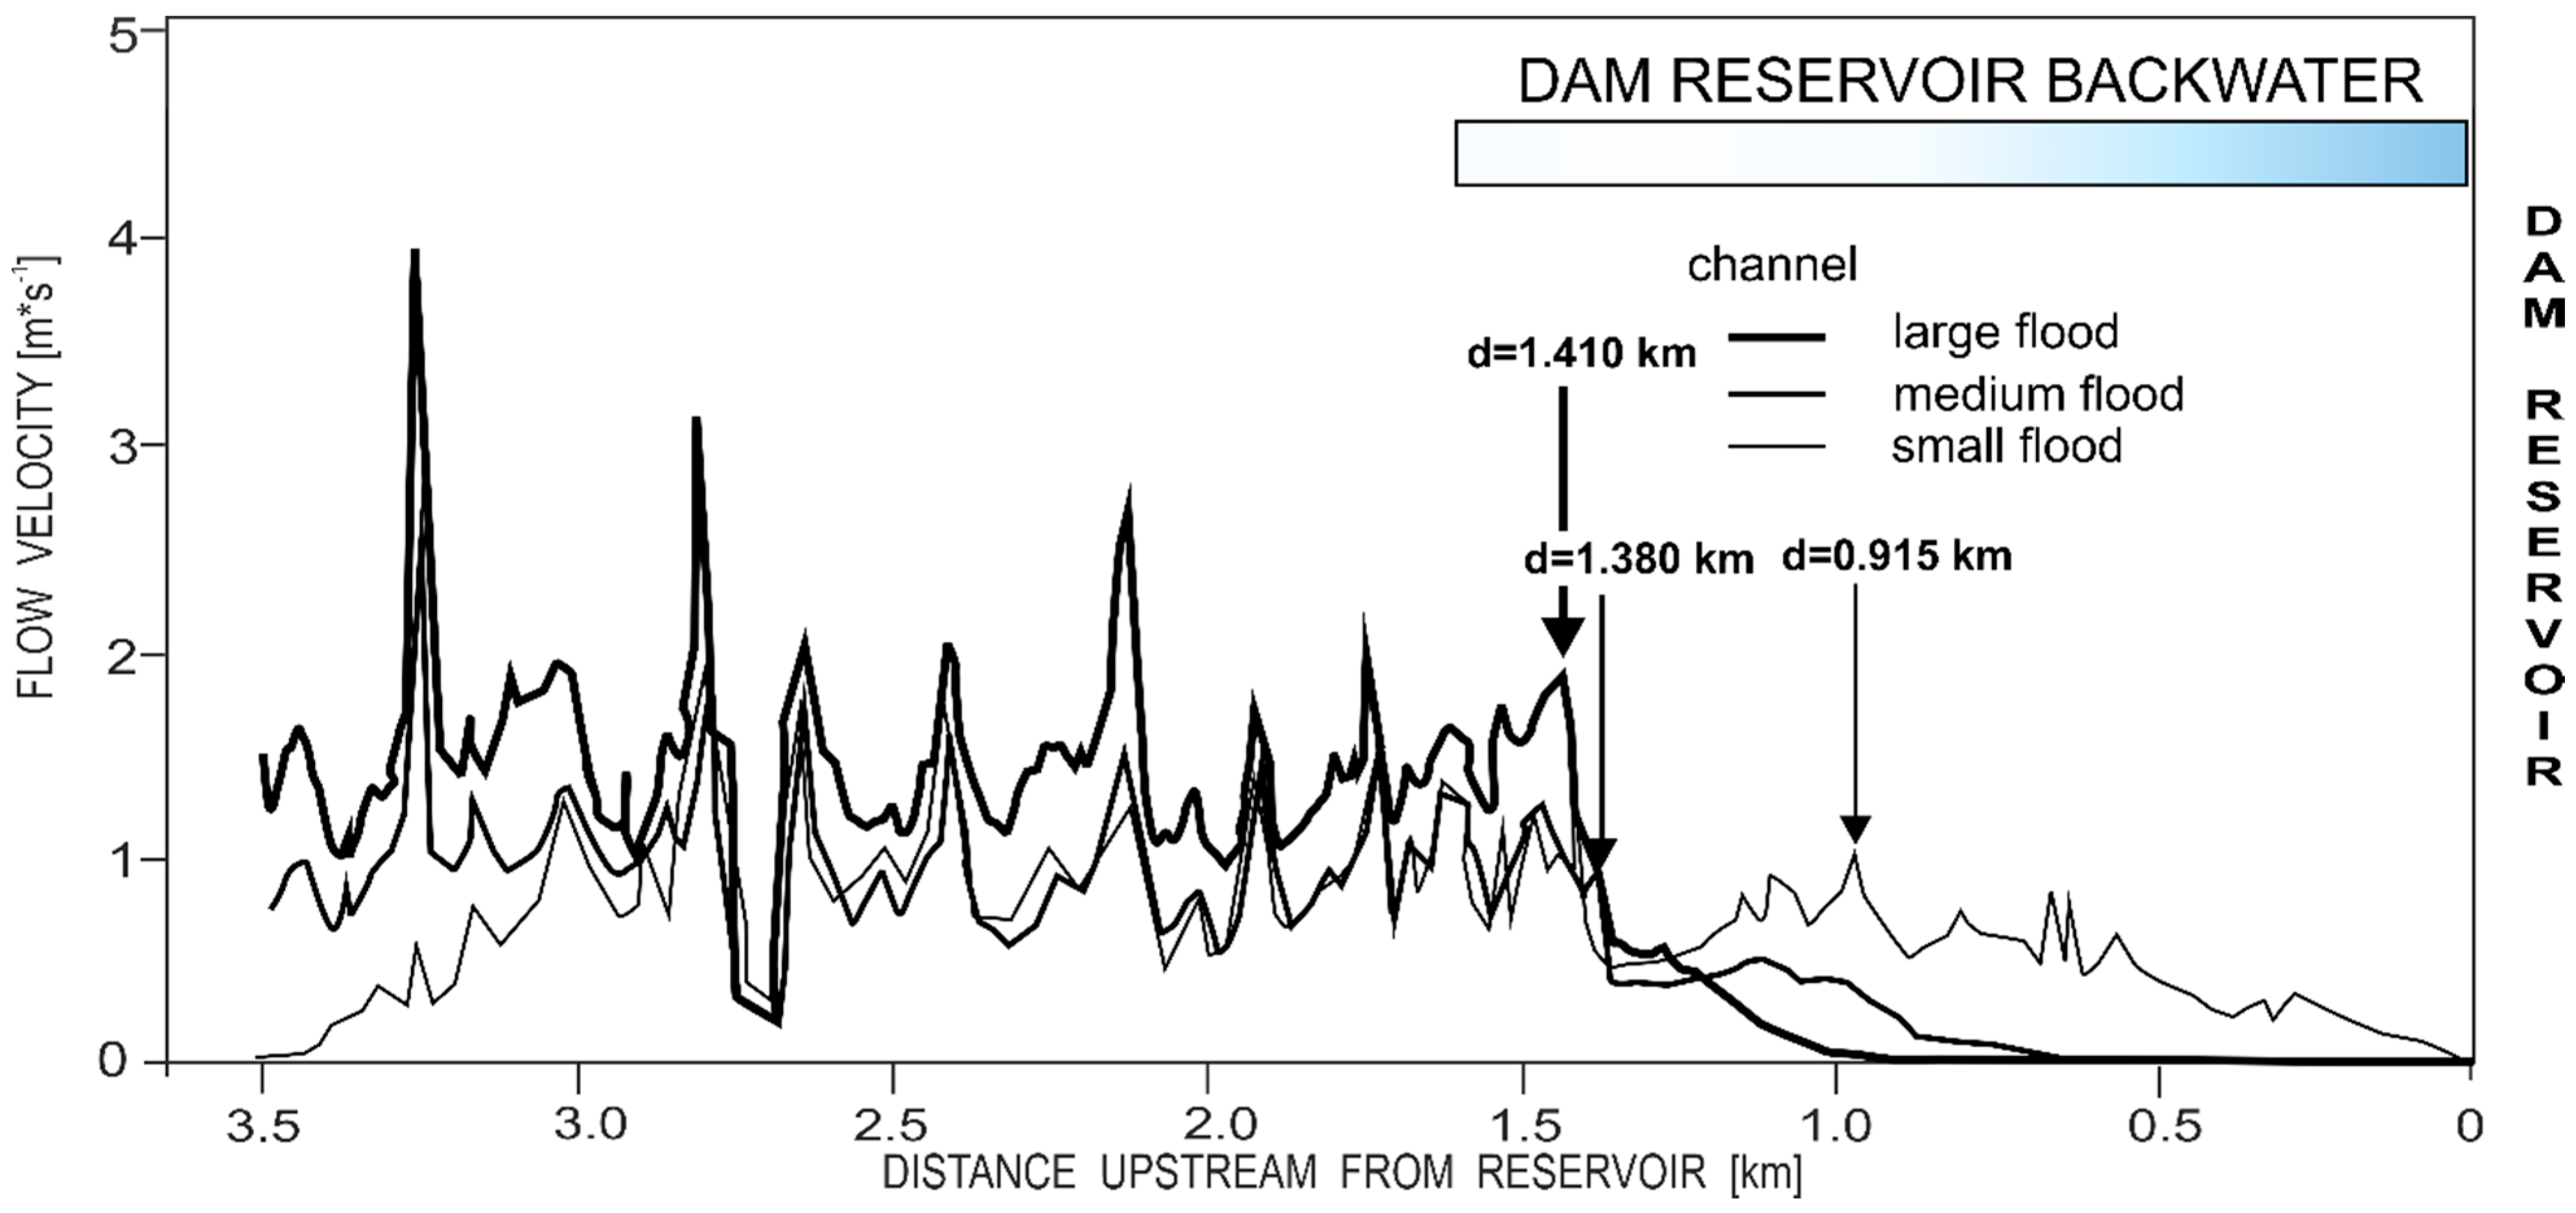
The longitudinal extents of backwater increase in mean flow velocity in the stream channel reach up to 0.915 km during a small flood, 1.380 km during a medium flood, and 1.410 km upstream of the stream confluence during a large flood, respectively (Figure 7).
The extent of increased depth and decreased flow velocity in the stream channel zone (Figure 6, Figure 7, Figure 8 and Figure 9) generally corresponds with the point of intersection of the channel bed and the elevation of the maximum backwater level (270 m asl). Only during the low flow scenario, the extent of the decreased flow velocity in the main channel was smaller (Figure 7 and Figure 9).
4. Discussion
The numerical simulations conducted on the Smolnik Stream upstream from the Rożnów Reservoir in the Polish Carpathians detected a significantly increased water depth and a decreased flow velocity in the stream channel, which can be associated with the reservoir backwater fluctuations. The decrease in stream hydrodynamics in the backwater fluctuation zone had been previously documented in both mountain [17] and lowland streams [1,36,37,38], corroborating the results presented here.
As this work focuses on investigating the hydrodynamics of the river affected by BF, it was demonstrated that the applied solver MFlow_02 can effectively simulate the hydrodynamics typical of riverine environments, also affected by backwater (see e.g., [11]). As also shown in Figure 6, indeed, the Smolnik River presents rather smaller water depths if compared with the average width of the river, allowing us for assuming a planar distribution of the hydrodynamics.
Because of the lack of an operating gauging station (since the flood in 1997) on the studied stream, we were not able to adequately calibrate and validate our numerical model. However, based on information from the local citizens and our observations done in the Smolnik Stream during different water levels at the reservoir as well as sedimentological evidence of a few floods we assumed that our results could illustrate the general direction and magnitude of changes in small mountain streams hydrodynamics in the BF area of large dam reservoirs. Taking into account that the MFlow_02 model is more affected by uncertainty in shallow areas, and the fact that we were not able to calibrate and validate our model in such regions (e.g., floodplain), as discussed in Section 2.2.4, we have focused our research to statistically evaluate only the hydrodynamic parameters for stream channel zone.
The relative disturbance in both analyzed parameters increased with the flood magnitude (Figure 3 and Figure 4), which contrasts with the previous observations made on the Dunajec River in the backwater zone of the Czorsztyn reservoir, where the river has a relatively straight course and an embanked floodplain [17]. Indeed, the Smolnik Stream has a highly sinuous channel and its valley bottom inundated by backwater has specific, flat morphology related to the alluvial fan formed within the Dunajec River valley. Our simulations clearly show that the wide, flat, and gentle slope valley bottom of the Smolnik Stream in the backwater zone, together with the lack of floodplain embankments, and a highly sinuous channel, make the flood inundation zone very wide and freely increasing with the flood magnitude (Figure 7 and Figure 8). In comparison to the mentioned backwater zone of the Dunajec River upstream from the Czorsztyn Reservoir, the larger flood flows on the Smolnik Stream backwater are not concentrated in the narrow embanked floodplain but can increase the extent of floodplain inundations (Figure 8).
The longitudinal extent of the increased water depth (reaching up to 1.380–1.515 km) and of the decreased flow velocity (reaching up to 0.915–1.410 km) refer to the location of the intersection of the river bed profile with the maximum water level at the reservoir (Figure 3, Figure 6 and Figure 7). The maximal, longitudinal extents of the abovementioned disturbances were not related to the flood magnitude. However, it was clearly seen that the aerial extent of stream valley inundations substantially increased as the magnitude of flood flows increased both during the scenarios with and without backwater fluctuations (Figure 7 and Figure 8).
One of the main limitations of our modelling design was that it focused solely on the effects of the Rożnów reservoir backwater fluctuations on the Smolnik Stream hydrodynamics, excluding the hydrodynamic influence of the large Dunajec River. Moreover, we investigated steady-state conditions (three flood scenarios, two reservoir levels, see Table 1), neglecting unsteady smaller fluctuations typical of BF areas. This design was used to simplify our modelling and to allow for an easier evaluation of the stream-backwater relation itself. However, it should be taken into account that, in real conditions, the Dunajec River must have a substantial influence on the hydrodynamics of the Smolnik Stream, both during backwater fluctuations and without them. Indeed, the entire backwater section of the Smolnik Stream is located on the Dunajec River floodplain (Figure 1); thus, the hydrological regime of the Dunajec River is an important factor modulating the Smolnik hydrodynamics itself and the stream-backwater interactions here. A similar mainstream-tributary interaction in the backwater zone had been previously described by Meade et al. [37] and Xu [38]. The flow regime of the Dunajec River is typified by low winter flows and floods typically occurring in the late spring or summer [39]. A comparison of existing flood maps, not including backwater influences [40], shows that during a 10-year flood occurring on the Dunajec River and the Smolnik Stream, the extents and depth of inundation of the studied backwater reach are similar to those presented in our scenario simulating a 2-year flood and maximal backwater effect (Figure 7). Thus, the inundations of the backwater section of the Smolnik Stream, similar in magnitude to those formed by maximal backwater fluctuation, may occur on the Smolnik Stream relatively frequently. In other words, the first source of inundation of the Smolnik valley bottom results from the backwater effects themselves and occurs during the highest water levels at the Rożnów reservoir, which are kept in the winter season (Figure S1), when generally floods do not occur in Polish Carpathians. The latter results from river flooding, which occurs typically between May and August. The first type of inundation ranges from a few weeks to months, whereas the second one is faster, lasting from hours to days. This relatively long duration of winter backwater fluctuation occurs every year in the Smolnik Stream (Figure S1), which could be the main reason for the fast deposition of fine-grained sediments on the stream floodplain observed here [25]. This may also be a factor both supporting the presence of water-resistant species in the local riparian forest, which is dominated by the Salix species, and negatively affecting other species. Moreover, the frequency of inundations which may occur in the Smolnik Stream both in the winter and summer seasons may explain why the channel morphology of this stream transitioned so rapidly from a multi- to single-thread pattern following the dam construction [25].
Previous works highlighted that the decrease in river hydrodynamics observed in dam reservoir backwater zones triggers numerous adjustments in riverine abiotic and biotic components [9,15,18,41,42]. From the above-described pattern of water inundations occurring in the backwater section of the Smolnik Stream, it may be hypothesized that long-term backwater fluctuations occur each year (Figure S1), and may have a larger impact than the occasional flooding from the Dunajec River. Some of these adjustments (e.g., changes in river morphology or riparian vegetation) may permanently affect river hydrodynamics, even during the periods when backwater fluctuations do not occur [16]. Previous reconstructions made for the studied stream demonstrated that following the construction of the Rożnów Dam Reservoir in 1994, the stream channel patterns were rapidly transitioned from the multi- to the single-thread pattern in the backwater zone [25]. A similar transition has been also observed on the lowland rivers affected by backwater fluctuations, which was interpreted as a result of fine sediment deposition and related vegetation expansion, which together interact to develop a narrow and deep channel of high sinuosity [9]. The causes of the morphological changes observed within the backwater reach of the Smolnik Stream had been previously interpreted in the same way [25]. Former investigations from the Dunajec River successfully quantified how the morphological adjustments observed in the first 20-year period after the dam construction modulated river hydrodynamics itself [17]. However, a similar task is difficult to conduct on the studied Smolnik Stream, because most of the stream course upstream from the studied backwater is channelized, which hinders the statistical comparison of stream hydrodynamics in the morphology not affected by backwater influences and similar to those occurring in the backwater section before the dam construction. The present morphology of the backwater section of the Smolnik Stream is characterized by low-slope, deep and narrow channels, naturally developed meanders, and a wide densely vegetated floodplain. In such conditions, channel hydrodynamics completely differ from those occurring in upstream channelized sections (Table S1). Even during the simulations without the backwater fluctuations, the water depths were a few times higher (1.62–3.46 m vs. 0.63–1.92) and stream velocity lower (0.49–0.52 m s−1 vs. 0.86–1.41 m s−1) in the backwater zone than in the upstream channelized reach (Table S1), which demonstrates that indirect effects of backwater influence (e.g., adjustments in river morphology) occurring in the lowermost section of the Smolnik Stream has permanently abrupt long-term functioning of this stream here [16,17].
Moving from the investigation proposed here, future works will be focused on coupling water flow with sediment transport and channel morphodynamics, following the example of Hosseiny & Smith [43]. We also stress a need to better understand what the effects of backwater hydrodynamic disturbance on river sedimentology, geomorphology, and vegetation across different climates.
5. Conclusions
In this study, we have numerically modelled how the hydrodynamics of a small mountain stream (the Smolnik Stream) is affected by the backwater fluctuation of the dam reservoir (the Rożnów reservoir), using a simplified approach. We have found that both water inundation extent and the depth of the stream significantly increased, while flow velocity decreased in the backwater zone, in stark contrast to the high-energy regime of this mountain stream. The hydrodynamic influence of reservoir backwater has been interpreted as a factor which favours the transition of the stream channel pattern from the multi- to the single-thread one, and decreases the potential for floodplain utilization, accelerating the riparian forest expansion in the stream valley. This cause-effect chain initiated by the dam construction and the resulting backwater fluctuation led to the development of homogenous and simplified morphological and vegetation patterns.
Supplementary Materials
The following supporting information can be downloaded at: https://www.mdpi.com/article/10.3390/w14193166/s1, Figure S1, Maximum and minimum monthly water levels at the Rożnów Reservoir (1997–2019); Table S1, Mean and maximum (in parentheses) values of water depth and flow velocity in the channel zone of the control and backwater reaches of the Smolnik Stream, during small (1.8 m3 s−1), medium (24.5 m3 s−1) and large floods (89.5 m3 s−1). For the backwater reach, the values for scenarios with and without backwater inundation by reservoir water are presented. Mann–Whitney test was used to evaluate difference of depth and flow velocity parameters between control and backwater reaches. Statistically significant differences are indicated (* p value <0.01, ** p value < 0.001, *** p value <0.0001, n.s. not statistically significant).
Author Contributions
M.L.: manuscript idea conceptualization, field and numerical work planning, performance of GIS, and statistical analysis, writing the first version of the manuscript, M.N.; planning and performance of numerical modelling, results interpretation, manuscript writing, P.M.; performance of fieldwork (bathymetric measurements), manuscript corrections, K.P.; performance of fieldwork (geodetic measurements), manuscript corrections. All authors have read and agreed to the published version of the manuscript.
Funding
The study was performed within the scope of the Research Project 2015/19/N/ST10/01526 financed by the National Science Centre of Poland and from the statutory funds of the Institute of Nature Conservation, Polish Academy of Sciences. The work of MN was supported by a subsidy from the Polish Ministry of Education and Science for the Institute of Geophysics, Polish Academy of Sciences.
Data Availability Statement
Data are available from the corresponding author.
Acknowledgments
We thank Bartłomiej Wyżga for the discussion and advice during the initiation of this study. We thank Andrzej Leszczyński (“COLLEGE” Foreign Languages Centre) for improving the English style of the manuscript. We thank three anonymous reviewers for their critical comments on the manuscript, which help in better developing our research.
Conflicts of Interest
The authors declare no conflict of interest.
References
- Dynesius, M.; Nilsson, C. Fragmentation and flow regulation of river systems in the northern third of the world. Science 1994, 266, 753–762. [Google Scholar] [CrossRef]
- Best, J. Anthropogenic stresses on the world’s big rivers. Nat. Geosci. 2018, 12, 7–21. [Google Scholar] [CrossRef]
- Grill, G.; Lehner, B.; Thieme, M.; Geenen, B.; Tickner, D.; Antonelli, F.; Babu, S.; Borrelli, P.; Cheng, L.; Crochetiere, H.; et al. Mapping the world’s free-flowing rivers. Nature 2019, 569, 215–221. [Google Scholar] [CrossRef]
- Knighton, D. Fluvial Forms and Processes; A New Perspectives; Arnold: New York, NY, USA, 1998; p. 383. [Google Scholar]
- Brandt, S.A. Classification of geomorphological effects downstream of dams. Catena 2000, 40, 375–401. [Google Scholar] [CrossRef]
- Petts, G.E.; Gurnell, A.M. Dams and geomorphology: Research progress and future directions. Geomorphology 2005, 71, 27–47. [Google Scholar] [CrossRef]
- Grant, G.E. The geomorphic response of gravel-bed rivers to dams: Perspectives and prospects. In Gravel-Bed Rivers: Processes, Tools, Environments; Church, M., Biron, P.M., Roy, A., Eds.; Wiley: Chichester, UK, 2012; pp. 165–181. [Google Scholar] [CrossRef]
- Williams, G.P.; Wolman, M.G. Downstream effects of dams on alluvial rivers. Geol. Surv. Prof. Pap. 1984, 1286, 1–83. [Google Scholar] [CrossRef] [Green Version]
- Xu, J.; Shi, C. The river channel pattern change as influenced by the floodplain geoecosystem: An example from the Hongshan Reservoir. Z. Geomorphol. 1997, 41, 97–113. [Google Scholar] [CrossRef]
- Bao, Y.; Gao, P.; He, X. The water-level fluctuation zone of Three Gorges Reservoir—A unique geomorphological unit. Earth Sci. Rev. 2015, 150, 14–24. [Google Scholar] [CrossRef]
- Maselli, V.; Pellegrini, C.; Del Bianco, F.; Mercorella, A.; Nones, M.; Crose, L.; Guerrero, M.; Nittrouer, J. River morphodynamic evolution under dam-induced backwater: An example from the Po River (Italy). J. Sed. Res. 2018, 88, 1190–1204. [Google Scholar] [CrossRef]
- Volke, M.A.; Scott, M.L.; Johnson, W.C.; Dixon, M.D. The ecological significance of emerging deltas in regulated rivers. BioScience 2015, 65, 598–611. [Google Scholar] [CrossRef] [Green Version]
- Volke, M.A.; Johnson, W.C.; Dixon, M.D.; Scott, M.L. Emerging reservoir delta backwaters: Biophysical dynamics and riparian biodiversity. Ecol. Monogr. 2019, 89, e01363. [Google Scholar] [CrossRef] [Green Version]
- Hanks, R.D. Dams: Anthrome Enablers. Ref. Modul. Earth Syst. Environ. Sci. 2020. [Google Scholar] [CrossRef]
- Łajczak, A. Deltas in dam-retained lakes in the Carpathian part of the Vistula drainage basin. Pr. Geol. 2006, 116, 99–109. [Google Scholar]
- Liro, M. Dam reservoir backwater as a field-scale laboratory of human-induced changes in river biogeomorphology: A review focused on gravel-bed rivers. Sci. Total Environ. 2019, 651, 2899–2912. [Google Scholar] [CrossRef]
- Liro, M.; Ruiz-Villanueva, V.; Mikuś, P.; Wyżga, B.; Castellet, E.B. Changes in the hydrodynamics of a mountain river induced by dam reservoir backwater. Sci. Total Environ. 2020, 744, 140555. [Google Scholar] [CrossRef]
- Zheng, S.; Edmonds, D.A.; Wu, B.; Han, S. Backwater controls on the evolution and avulsion of the Qingshuigou channel on the Yellow River Delta. Geomorphology 2019, 333, 137–151. [Google Scholar] [CrossRef]
- Lamb, M.P.; Nittrouer, J.A.; Mohrig, D.; Shaw, J. Backwater and river plume controls on scour upstream of river mouths: Implications for fluvio-deltaic morphodynamics. J. Geop. Res. Earth Surf. 2012, 117. [Google Scholar] [CrossRef]
- Nittrouer, J.A.; Shaw, J.; Lamb, M.P.; Mohrig, D. Spatial and temporal trends for water-flow velocity and bed-material sediment transport in the lower Mississippi River. Bulletin 2012, 124, 400–414. [Google Scholar] [CrossRef]
- Ganti, V.; Chadwick, A.J.; Hassenruck-Gudipati, H.J.; Lamb, M.P. Avulsion cycles and their stratigraphic signature on an experimental backwater-controlled delta. J. Geop. Res. Earth Surf. 2016, 121, 1651–1675. [Google Scholar] [CrossRef] [Green Version]
- Batalla, R.J.; Gibbins, C.N.; Alcázar, A.; Brasington, J.; Buendia, C.; Garcia, C.; Llena, M.; López, R.; Palau, A.; Rennie, C.; et al. Hydropeaked rivers need attention. Environ. Res. Lett. 2021, 16, 021001. [Google Scholar] [CrossRef]
- Luo, M.; Yu., H.; Huang, E.; Ding, R.; Lu, X. Two-dimensional numerical simulation study on bed-load transport in the fluctuating backwater area: A case-study reservoir in China. Water 2018, 10, 1425. [Google Scholar] [CrossRef] [Green Version]
- Książek, L.; Michalik, A.; Nowak, J.; Połoska-Wróbel, A. Ocena zmian warunków hydrodynamicznych na uregulowanym odcinku potoku Smolnik. Inf. Ekol. Ter. Wiej. 2010, 8, 93–104. (In Polish) [Google Scholar]
- Liro, M. Dam-induced base-level rise effects on the gravel-bed channel planform. Catena 2017, 153, 143–156. [Google Scholar] [CrossRef]
- Sroczyński, W. Jeziora zaporowe w krajobrazie Karpat (Barrier lakes in the Carpathians-selected problems in spatial organization). In Przemiany Krajobrazu Kulturowego Karpat; Wybrane, aspekty; Myga-Piątek, U., Ed.; Komisja Krajobrazu Kulturowego PTG: Sosnowiec, Poland, 2004; pp. 87–98. (In Polish) [Google Scholar]
- Tekielak, T.; Michalik, A.; Bąk, Ł.; Książek, Ł. Wpływ wezbrań na intensywność procesów fluwialnych na przykładzie koryta potoku Smolnik. Inf. Ekol. Ter. Wiej. 2007, 4, 167–178. (In Polish) [Google Scholar]
- iRIC Software. Mflow_02 Solver Manual; iRIC Software: USA, 2014. Available online: https://i-ric.org/en/solvers/mflow02/ (accessed on 7 July 2022).
- Nelson, J.M.; Shimizu, Y.; Abe, T.; Asahi, K.; Gamou, M.; Inoue, T.; Iwasaki, T.; Kakinuma, T.; Kawamura, S.; Kimura, I.; et al. The international river interface cooperative: Public domain flow and morphodynamics software for education and applications. Adv. Water Resour. 2016, 93, 62–74. [Google Scholar] [CrossRef]
- Chow, V.T. Open-Channel Hydraulics; McGraw-Hill: New York, NY, USA, 1959; p. 680. [Google Scholar]
- Nezu, I.; Nakagawa, H. Turbulence in Open-Channel Flow; IAHR Monograph, Belkema: Rotterdam, The Netherlands, 1993. [Google Scholar]
- Courant, R.; Friedrichs, K.; Lewy, H. Über die partiellen Differenzengleichungen der mathematischen Physik. Math. Ann. 1928, 100, 32–74. (In German) [Google Scholar] [CrossRef]
- Leviandier, T.; Alber, A.; Le Ber, F.; Piégay, H. Comparison of statistical algorithms for detecting homogeneous river reaches along a longitudinal continuum. Geomorphology 2012, 138, 130–144. [Google Scholar] [CrossRef] [Green Version]
- Orlowsky, B. iki.dataclim. R Package, Version 1.0; 2014. Available online: https://cran.rproject.org/web/packages/iki.dataclim/iki.dataclim.pdf (accessed on 10 July 2021).
- R Core Team. R: A Language and Environment for Statistical Computing; R Foundation for Statistical Computing: Vienna, Austria, 2019; Available online: https://www.R-project.org (accessed on 10 July 2021).
- Li, X.; Liu, B.; Wang, Y.; Yang, Y.; Liang, R.; Peng, F.; Xu, S.; Zhu, Z.; Li, K. Hydrodynamic and environmental characteristics of a tributary bay influenced by backwater jacking and intrusions from a main reservoir. Hydrol. Earth Syst. Sci. 2020, 24, 5057–5076. [Google Scholar] [CrossRef]
- Meade, R.H.; Rayol, J.M.; Da Conceicão, S.C.; Natividade, J.R. Backwater effects in the Amazon River basin of Brazil. Environ. Geol. Water Sci. 1991, 18, 105–114. [Google Scholar] [CrossRef]
- Xu, J. Adjustment of mainstream-tributary relation upstream from a reservoir: An example from the Laohahe River, China. Z. Geomorphol. 2001, 45, 359–372. [Google Scholar] [CrossRef]
- Kundzewicz, Z.W.; Stoffel, M.; Kaczka, R.J.; Wyżga, B.; Niedźwiedź, T.; Pińskwar, I.; Ruiz Villanueva, V.; Łupikasza, E.; Czajka, B.; Ballesteros-Canovas, J.A.; et al. Floods at the northern foothills of the Tatra Mountains—A Polish–Swiss research project. Acta Geophys. 2014, 62, 620–641. [Google Scholar] [CrossRef]
- ISOK, Flood Risk Map for Poland. Map Sheet Accessed on line. 2009. Available online: https://wody.isok.gov.pl/pdf/M34078/M34078Cd3_ZG_10_2019v1.pdf (accessed on 1 June 2022).
- Xiao, Y.; Yang, F.S.; Su, L.; Li, J.W. Fluvial sedimentation of the permanent backwater zone in the Three Gorges Reservoir, China. Lake Reserv. Manag. 2015, 31, 324–338. [Google Scholar] [CrossRef]
- Beall, C.C.; Dixon, M.D.; Illeperuma, N.D.; Sweeney, M.R.; Johnson, W.C. Expansion of woody vegetation on a Missouri River reservoir delta-backwater. Ecohydrology 2022, 15, e2357. [Google Scholar] [CrossRef]
- Hosseiny, H.; Smith, V. Two dimensional model for backwater geomorphology: Darby Creek, PA. Water 2019, 11, 2204. [Google Scholar] [CrossRef]
Figure 3.
Longitudinal profile of the Smolnik Stream. Blue lines indicate normal and maximal water levels at the Rożnów Reservoir.
Figure 3.
Longitudinal profile of the Smolnik Stream. Blue lines indicate normal and maximal water levels at the Rożnów Reservoir.

Figure 4.
Comparison of mean water depth in the Smolnik Stream channel in the backwater reach between conditions without backwater inundation (NO BF) and with maximum backwater inundation (BF) during small (1-year), medium (2-year) and large (20-year) floods. Whiskers indicate the minimum and maximum values of the parameter among the study cross-sections and points show the means. Percentage differences of the parameter between the two hydraulic situations are indicated and their statistical significance determined with a Wilcoxon test is shown. p-values < 0.05 are indicated in bold.

Figure 5.
Comparison of mean flow velocity in the Smolnik Stream channel in the backwater reach between conditions without backwater inundation (NO BF) and with maximum backwater inundation (BF) during small (1-year), medium (2-year), and large (20-year) floods. Whiskers indicate the minimum and maximum values of the parameter among the study cross-sections and points show the means. Percentage differences of the parameter between the two hydraulic situations are indicated and their statistical significance determined with a Wilcoxon test is shown. p-values < 0.05 are indicated in bold.

Figure 6.
Mean water depth in the channel (237 cross-sections) of the Smolnik Stream upstream from the Rożnów Reservoir during small, medium, and large floods without backwater inundation. The p-values of the Pettitt test indicate the significance of homogeneity of the data series. The location of breaks in data homogeneity and their distance from the reservoir are indicated by arrows. Statistically significant results are indicated in bold.

Figure 7.
Mean flow velocity in the channel (237 cross-sections) of the Smolnik Stream upstream from the Rożnów Reservoir during small, medium, and large floods without backwater inundation. All statistical descriptions are the same as in Figure 6.
Figure 7.
Mean flow velocity in the channel (237 cross-sections) of the Smolnik Stream upstream from the Rożnów Reservoir during small, medium, and large floods without backwater inundation. All statistical descriptions are the same as in Figure 6.

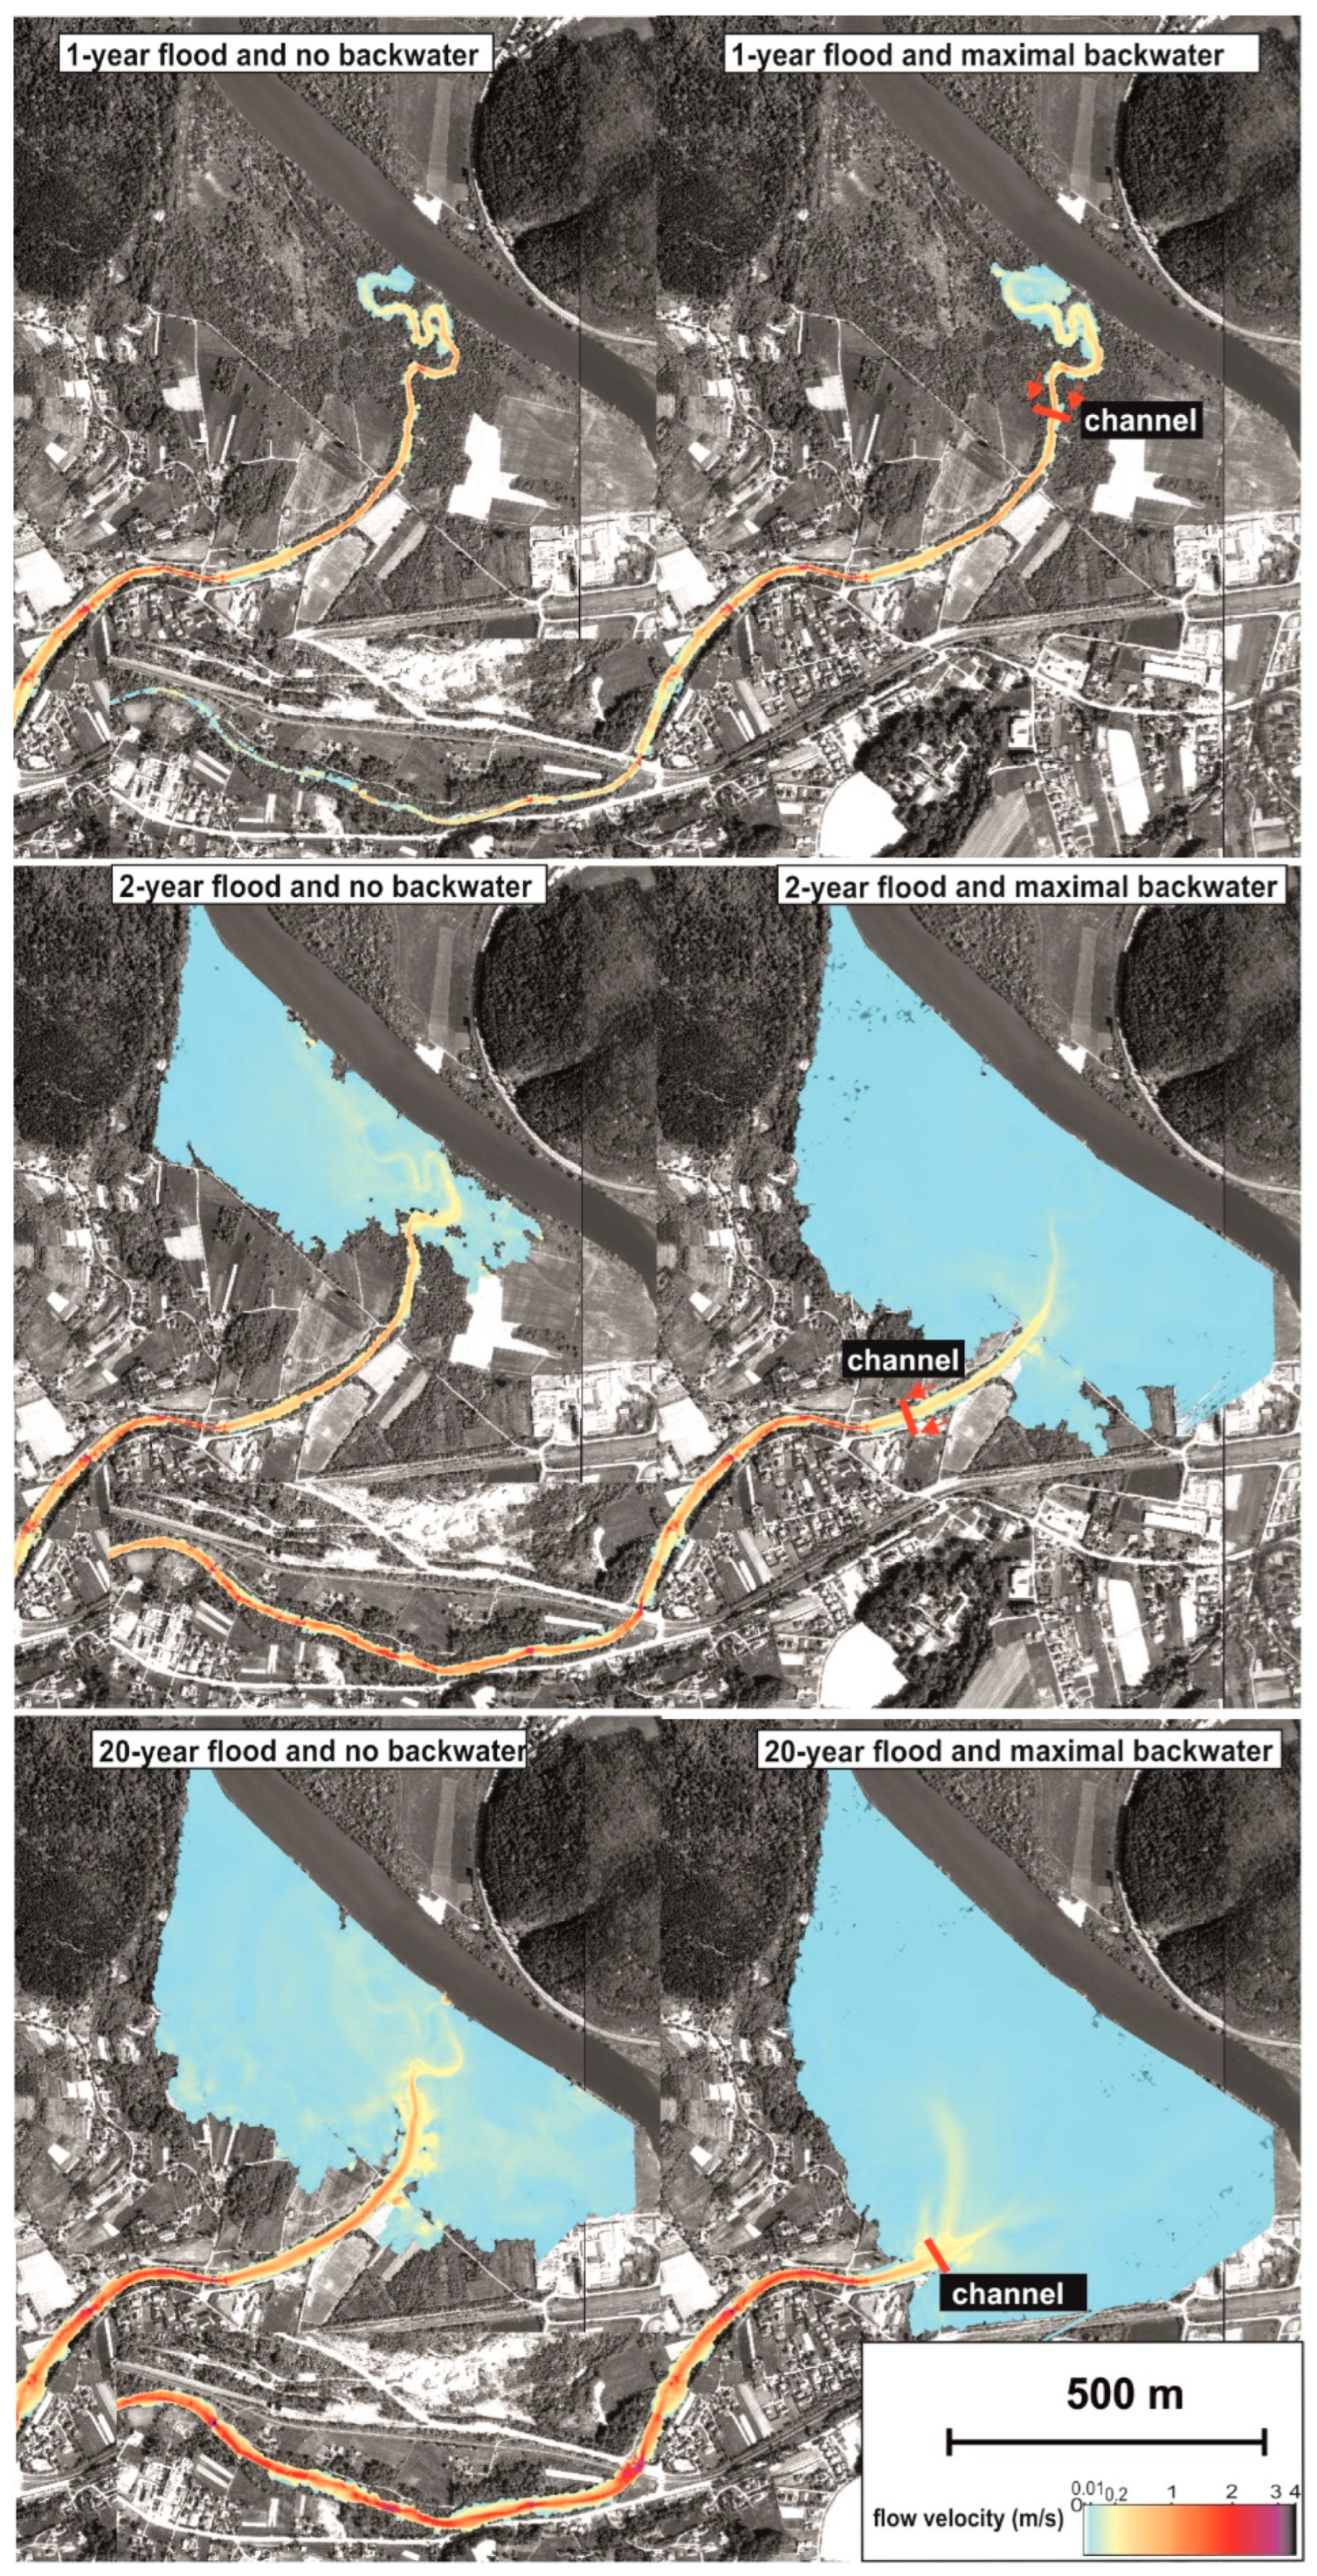
Figure 8.
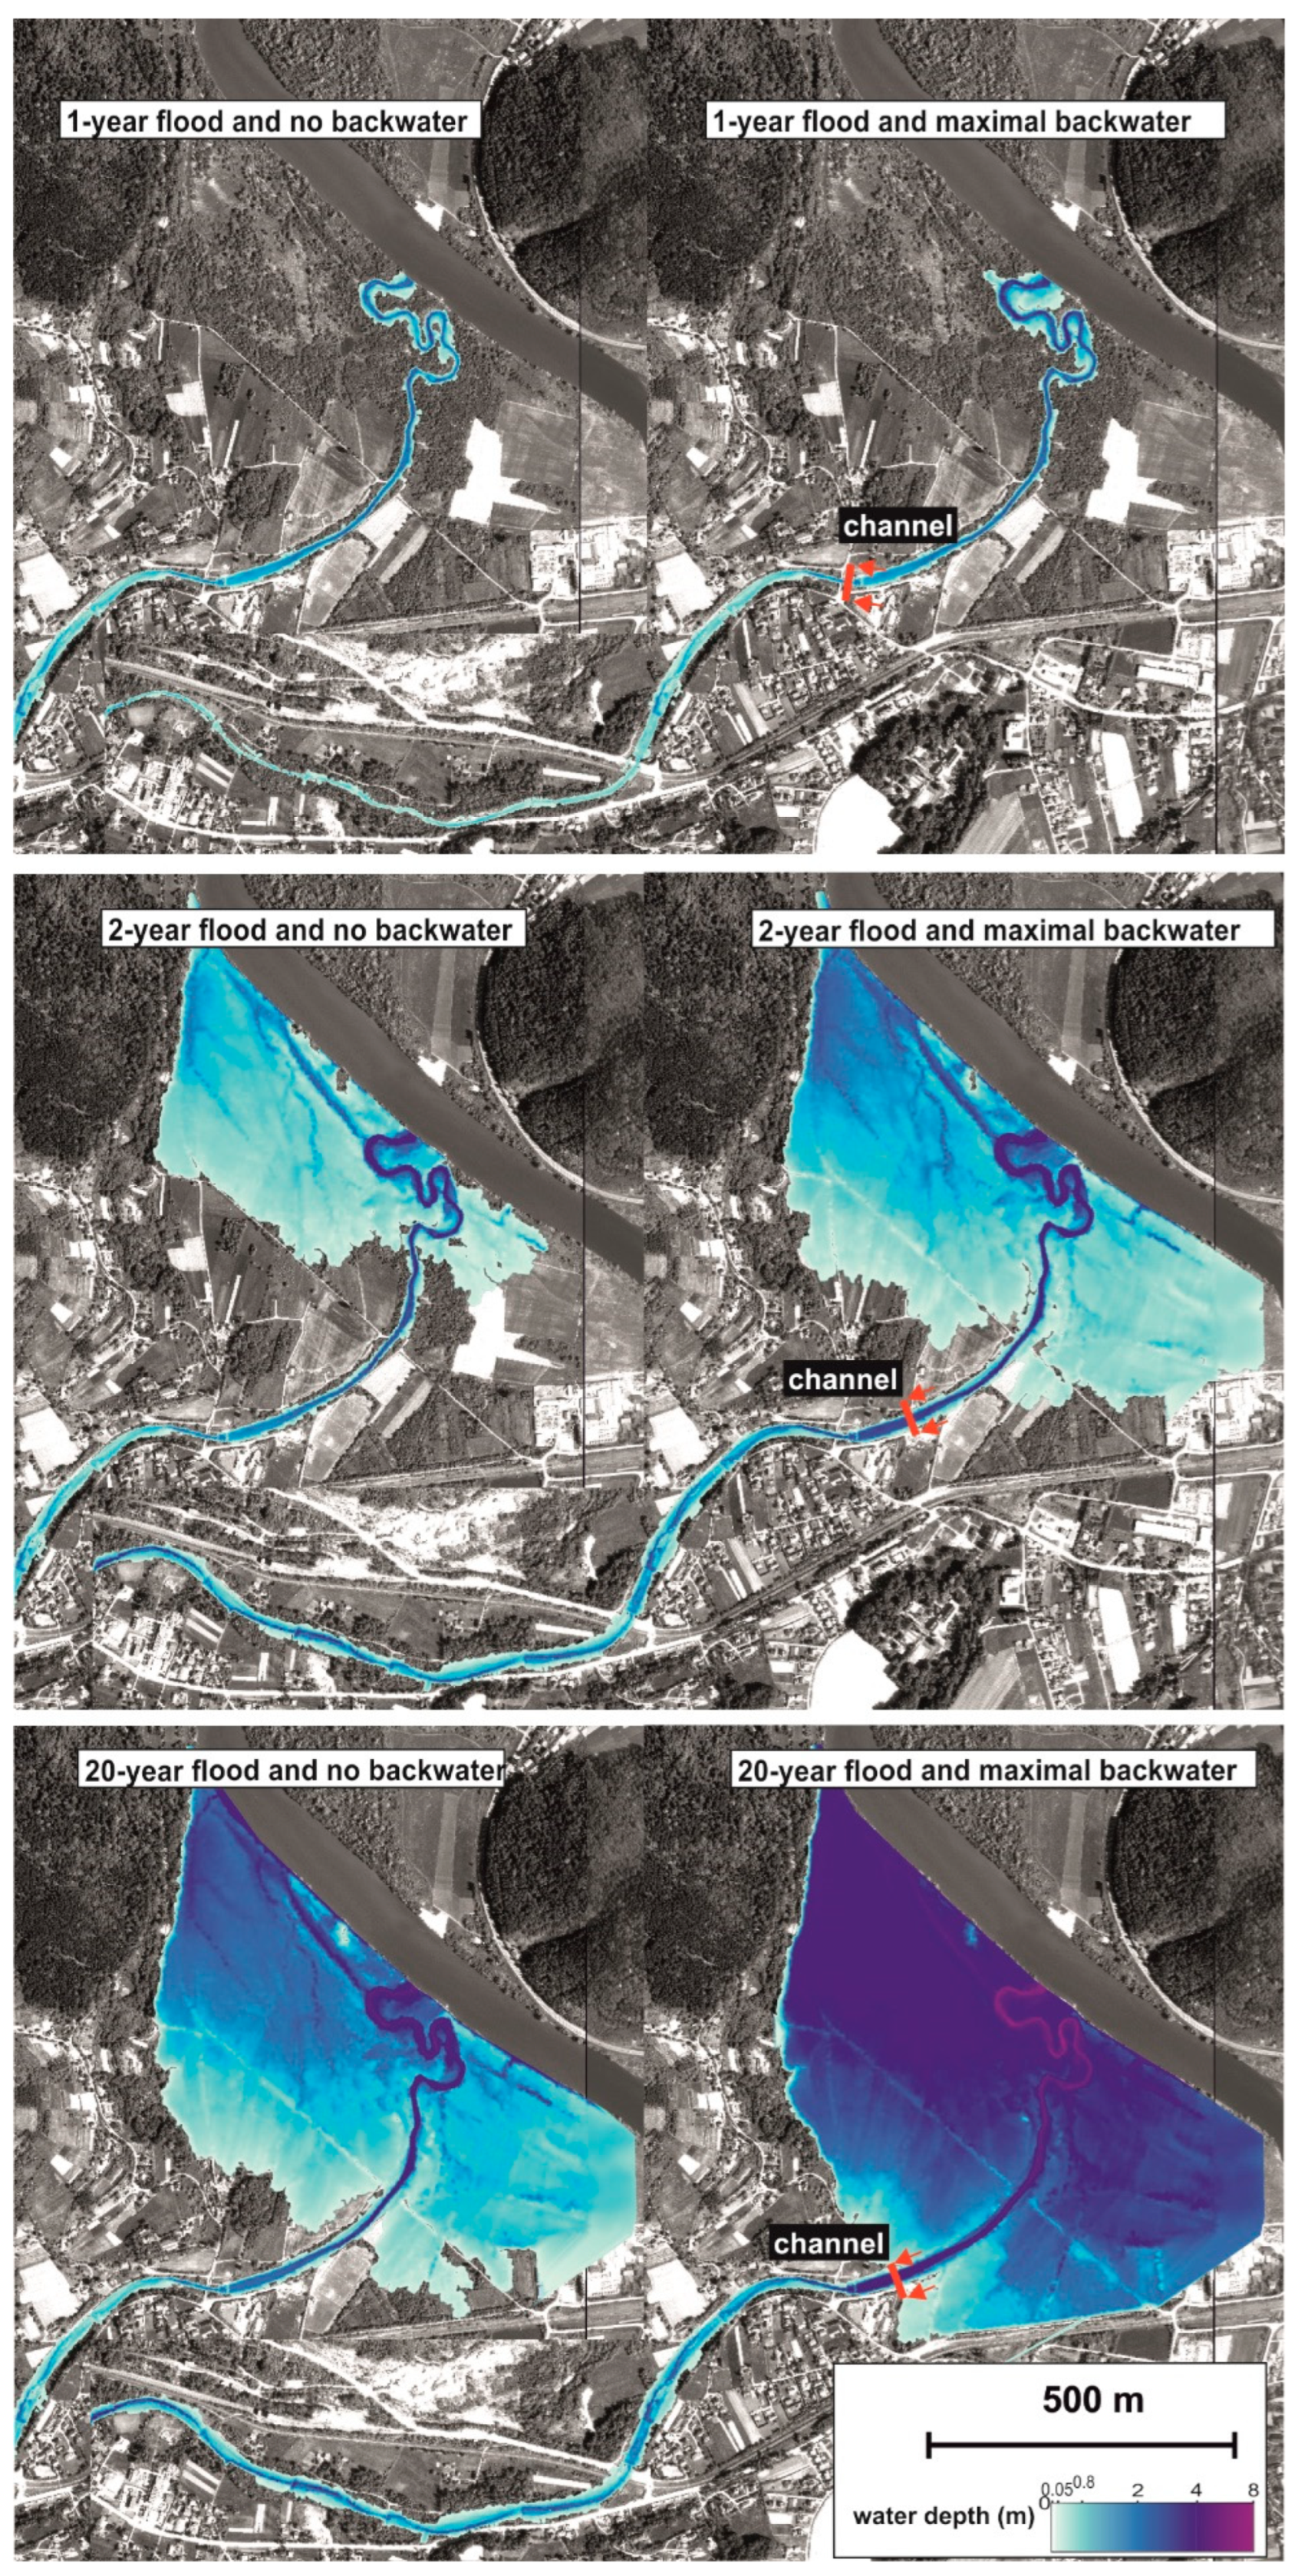
Spatial pattern of water depth in the study section of the Smolnik Stream during small (upper map), medium (middle map), and large (lower map) floods without backwater inundation (left map) and with maximum backwater inundation (right map). Red lines with arrows indicate the longitudinal extent of disturbance in water depth detected using the Pettitt test (see Figure 6).
Figure 8.
Spatial pattern of water depth in the study section of the Smolnik Stream during small (upper map), medium (middle map), and large (lower map) floods without backwater inundation (left map) and with maximum backwater inundation (right map). Red lines with arrows indicate the longitudinal extent of disturbance in water depth detected using the Pettitt test (see Figure 6).

Figure 9.
Spatial pattern of water depth in the study section of the Smolnik Stream during small (upper map), medium (middle map), and large (lower map) floods without backwater inundation (left map), and with maximum backwater inundation (right map). Red lines with arrows indicate the longitudinal extent of disturbance in water depth detected using the Pettitt test (see Figure 7).

Table 2.
Description of roughness homogeneous units (RHU) and the values of Manning’s n coefficient (in m1/2 s−1) used in the model calibration and final hydraulic simulations.
Table 2.
Description of roughness homogeneous units (RHU) and the values of Manning’s n coefficient (in m1/2 s−1) used in the model calibration and final hydraulic simulations.
| Roughness Homogenous Unit | Roughness Coefficient | |||
|---|---|---|---|---|
| Name | Description | Minimum | Maximum | Final |
| Low-flow channel | Gravel riverbed submerged at base flow | 0.02 | 0.08 | 0.03 |
| Gravel bars | Gravel bars without vegetation | 0.05 | 0.09 | 0.06 |
| Alluvial forest | Dense stand of willows and alder | 0.10 | 0.15 | 0.12 |
| Sparse woody vegetation | Cleared land with some tree stumps | 0.07 | 0.10 | 0.09 |
| Agricultural land | Grassland and crops | 0.01 | 0.04 | 0.02 |
| Low-flow channel | Gravelly riverbed submerged at base flow | 0.02 | 0.08 | 0.03 |
Publisher’s Note: MDPI stays neutral with regard to jurisdictional claims in published maps and institutional affiliations. |
© 2022 by the authors. Licensee MDPI, Basel, Switzerland. This article is an open access article distributed under the terms and conditions of the Creative Commons Attribution (CC BY) license (https://creativecommons.org/licenses/by/4.0/).
Share and Cite
MDPI and ACS Style
Liro, M.; Nones, M.; Mikuś, P.; Plesiński, K. Modelling the Effects of Dam Reservoir Backwater Fluctuations on the Hydrodynamics of a Small Mountain Stream. Water 2022, 14, 3166. https://doi.org/10.3390/w14193166
AMA Style
Liro M, Nones M, Mikuś P, Plesiński K. Modelling the Effects of Dam Reservoir Backwater Fluctuations on the Hydrodynamics of a Small Mountain Stream. Water. 2022; 14(19):3166. https://doi.org/10.3390/w14193166
Chicago/Turabian StyleLiro, Maciej, Michael Nones, Paweł Mikuś, and Karol Plesiński. 2022. "Modelling the Effects of Dam Reservoir Backwater Fluctuations on the Hydrodynamics of a Small Mountain Stream" Water 14, no. 19: 3166. https://doi.org/10.3390/w14193166
Note that from the first issue of 2016, this journal uses article numbers instead of page numbers. See further details here.