
Improving Estuarine Flood Risk Knowledge through Documentary Data Using Multiple Correspondence Analysis
by
 , and
, and
Ana Rilo
1,2,*,
Alexandre Oliveira Tavares
3,
Paula Freire
1,
José Luís Zêzere
2,4 and
and
Ivan D. Haigh
5 1
LNEC—National Civil Engineering Laboratory, Estuarine and Coastal Zones Unit, Avenida do Brasil 101, 1700-066 Lisbon, Portugal
2
Centre of Geographical Studies, Institute of Geography and Spatial Planning, Universidade de Lisboa, Edifício IGOT, Rua Branca Edmée Marques, 1600-276 Lisbon, Portugal
3
Centre for Social Studies and Earth Sciences Department, Coimbra University, Rua Sílvio Lima, Pólo II UC, 3030-790 Coimbra, Portugal
4
Associate Laboratory TERRA, Instituto Superior de Agronomia, Tapada da Ajuda, 1349-017 Lisbon, Portugal
5
School of Ocean and Earth Sciences, National Oceanography Centre, University of Southampton, Southampton SO14 3ZH, UK
*
Author to whom correspondence should be addressed.
Water 2022, 14(19), 3161; https://doi.org/10.3390/w14193161
Submission received: 19 August 2022
/
Revised: 27 September 2022
/
Accepted: 28 September 2022
/
Published: 7 October 2022
(This article belongs to the Special Issue Flood and Other Hydrogeomorphological Risk Management and Analysis)
Abstract
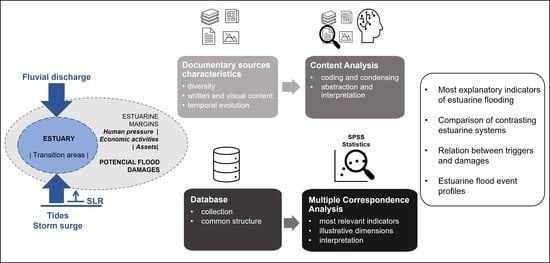
:Estuarine margins are usually heavily occupied areas that are commonly affected by compound flooding triggers originating from different sources (e.g., coastal, fluvial, and pluvial). Therefore, estuarine flood management remains a challenge due to the need to combine the distinct dimensions of flood triggers and damages. Past flood data are critical for improve our understanding of flood risks in these areas, while providing the basis for a preliminary flood risk assessment, as required by European Floods Directive. This paper presents a spin-off database of estuarine flood events built upon previously existing databases and a framework for working with qualitative past flood information using multiple correspondence analysis. The methodology is presented, with steps ranging from a spin-off database building process to information extraction techniques, and the statistical method used was further explored through the study of information acquired from the categories and their relation to the dimensions. This work enabled the extraction of the most relevant estuarine flood risk indicators and demonstrates the transversal importance of triggers, since they are of utmost importance for the characterization of estuarine flood risks. The results showed a relation between sets of triggers and damages that are related to estuarine margin land use, demonstrating their ability to inform flood risk management options. This work provides a consistent and coherent approach to use qualitative information on past floods, as a useful contribution in the context of scarce data, where measured and documentary data are not simultaneously available.
1. Introduction
Estuaries are complex areas located at the confluence of rivers and seas, which are often low-lying and densely populated, and where multiple flood triggers can occur simultaneously, increasing the flood hazard risk [1]. Estuarine flood risk assessment and management are challenging tasks, since they depend on the simultaneous knowledge of both triggers and their related compounding effects [2,3,4], along with diverse impacts that are dependent on the increasingly inhabited and urbanized nature of estuarine margins [5,6,7].
Documentary sources play a significant role in the obtaining of information on past flood triggers and damages [8]. Information on triggers is usually used to inform flood frequency analyses and flood model validations, particularly to assess events that occurred before the instrumental period [9,10]. However, forms of documentary information, ranging from newspapers to reports, are particularly useful in efforts to collect information on damages, since these types of sources commonly provide information on a local scale, with detailed descriptions and details of damage accountability, improving natural hazard inventories [11,12] and flood hazard model validations [13].
Information extracted from documentary sources is frequently organized into databases to assure consistency and support queries and statistical analysis. Regarding natural hazards, a large number of databases exist, with different inclusion criteria, ranging from the multinational scale, such as EM-DAT (https://www.emdat.be/, accessed on 18 June 2022), to the national scale [14,15]. Flood damage databases are useful, since they provide post-event information, enabling analysis to support the flood response and management, spatial planning options and risk management strategies [16].
Flood risk management is mostly conducted by public authorities and involves various steps. In the European context, the European Floods Directive (2007/60/EC) established a framework for the assessment and management of flood risks, including a preliminary flood risk assessment, which is the first screening exercise used to identify flood risk areas based on historic records. Therefore, the existence of past flood records compiled and organized in databases is of the utmost importance. This importance is recognized by the European Environmental Agency, which launched, in collaboration with other European authorities, the project of creating a potential flood impact database [17].
The assessment of past impacts is challenging, since management authorities usually do not collect this information for long-term monitoring purposes in a systematic and coherent manner. Furthermore, past flood event information, especially that related to damages, is scattered across different sources, namely newspapers, media and diverse public authorities, ranging from environmental to civil protection agencies and from the national to local scales [18]. Other constrains are related to the effort required to collect and gather documentary sources, along with the lack of a consistent methodology that can be used to deal with qualitative information and different data sources [18]. However, some efforts were made to introduce quality and uncertainty assessments into the analysis of disaster loss data [19,20]. Despite the abovementioned constraints on our ability to deal with qualitative and diverse documentary information, case studies with scarce past flood data can benefit from the use of documentary sources and improved methodologies.
Qualitative data analysis can be performed using several methods, ranging from cluster analysis to principal component analysis, depending on the study goals and type of data. Multiple correspondence analysis (MCA) is a multivariate statistical analysis method appropriate for dealing with multiple variables of a nominal categorical type [21,22]. The method allows investigators to interpret underlying relations between multiple variables and has been applied in different scientific fields, ranging from environmental studies [23,24] to safety research [25]. The procedure involves transforming qualitative data through a process of quantification, generating optimal quantifications (also called optimal scaling) of each category and object [22] This paper is based on a previously published database of estuarine flood occurrences [20,26] and a database of flood events [27]. The paper describes a spin-off database of estuarine flood events built on the abovementioned three databases and presents an innovative methodology that can be used to deal with qualitative information on flood event damages. This information was mainly retrieved from documentary sources and enables the collection of estuarine flood damages and triggers on a local scale. The objectives of the paper are to: (1) present a methodology that applies to qualitative estuarine flood information, taking advantage of multiple data source types; (2) obtain general indicators of estuarine flood damages and triggers based on local contexts; and (3) discuss the benefits and challenges related to the use of qualitive information. The structure of the paper is as follows: Section 1 presents the case study contexts, Section 2 describes the methods used, Section 3 presents the results, Section 4 offers an overall discussion of the results and Section 5 presents the main conclusions.
1.1. Case Studies: Geographic and Territorial Contexts
There is no single, unanimously adopted definition of an estuary [28,29,30]. The definition adopted in this study follows the one proposed by Davidson et al., (1991) [31] that states: “An estuary is a partially enclosed area of water and soft tidal shore and its surroundings, open to saline water from the sea and receiving fresh water from rivers, land run-off or seepage”. Here, we chose three different estuaries located along the western European coast as case studies due to their contrasting characteristics and flood record and data availability. The three estuaries are the Tagus Estuary (Portugal), the Shannon Estuary (Ireland) and the Solent Estuary (United Kingdom), and these are described in more detail below.
1.1.1. The Tagus Estuary (Portugal)
The Tagus Estuary is located on the Portuguese western coast, shaped by an energetic wave regime and affected by storm surges that increase in the direction from south to north [32], with an extensive flood record [5]. The estuary has a narrow and deep inlet channel and an extensive shallow inner domain, which promotes tidal range amplification due to resonance [33] and simultaneously constrains the propagation of oceanic waves entering into the estuary. Nevertheless, the unique inner domain geometry favors local wind wave generation [34]. Tides range between 0.55 and 3.86 m in the open coast (Cascais tide gauge), being amplified in the estuary interior due to resonance [33].
The main fluvial discharge into the estuary comes from the Tagus River, and fluvial discharge may influence the water levels, particularly in the upstream area [35]. The extreme water levels that promote estuarine margin inundation have two main origins: (1) storm surge conditions (low atmospheric pressure and strong winds) combined with high spring tides; and (2) extreme Tagus and Sorraia River discharges. Nowadays, the estuarine margins are densely occupied, with an extensive urban fabric in both margins, along with industrial, commercial and transport units framing the major metropolitan area of Portugal, with a resident population of more than 3 million people [36]. Upstream, the south margin is formed of heterogenous agriculture areas and pastures (Figure 1). The margins are connected by two bridges, and the daily commuting by road, train and boat is intense. Public and private businesses and critical infrastructures are located near the margins, which are served by a dense road network. There is a set of historical records of flood events with multiple types of impacts. Significant floods include those of 15 February 1941, 2 November 1997 and, more recently, February 2010 [5,37,38].
1.1.2. The Shannon Estuary (Ireland)
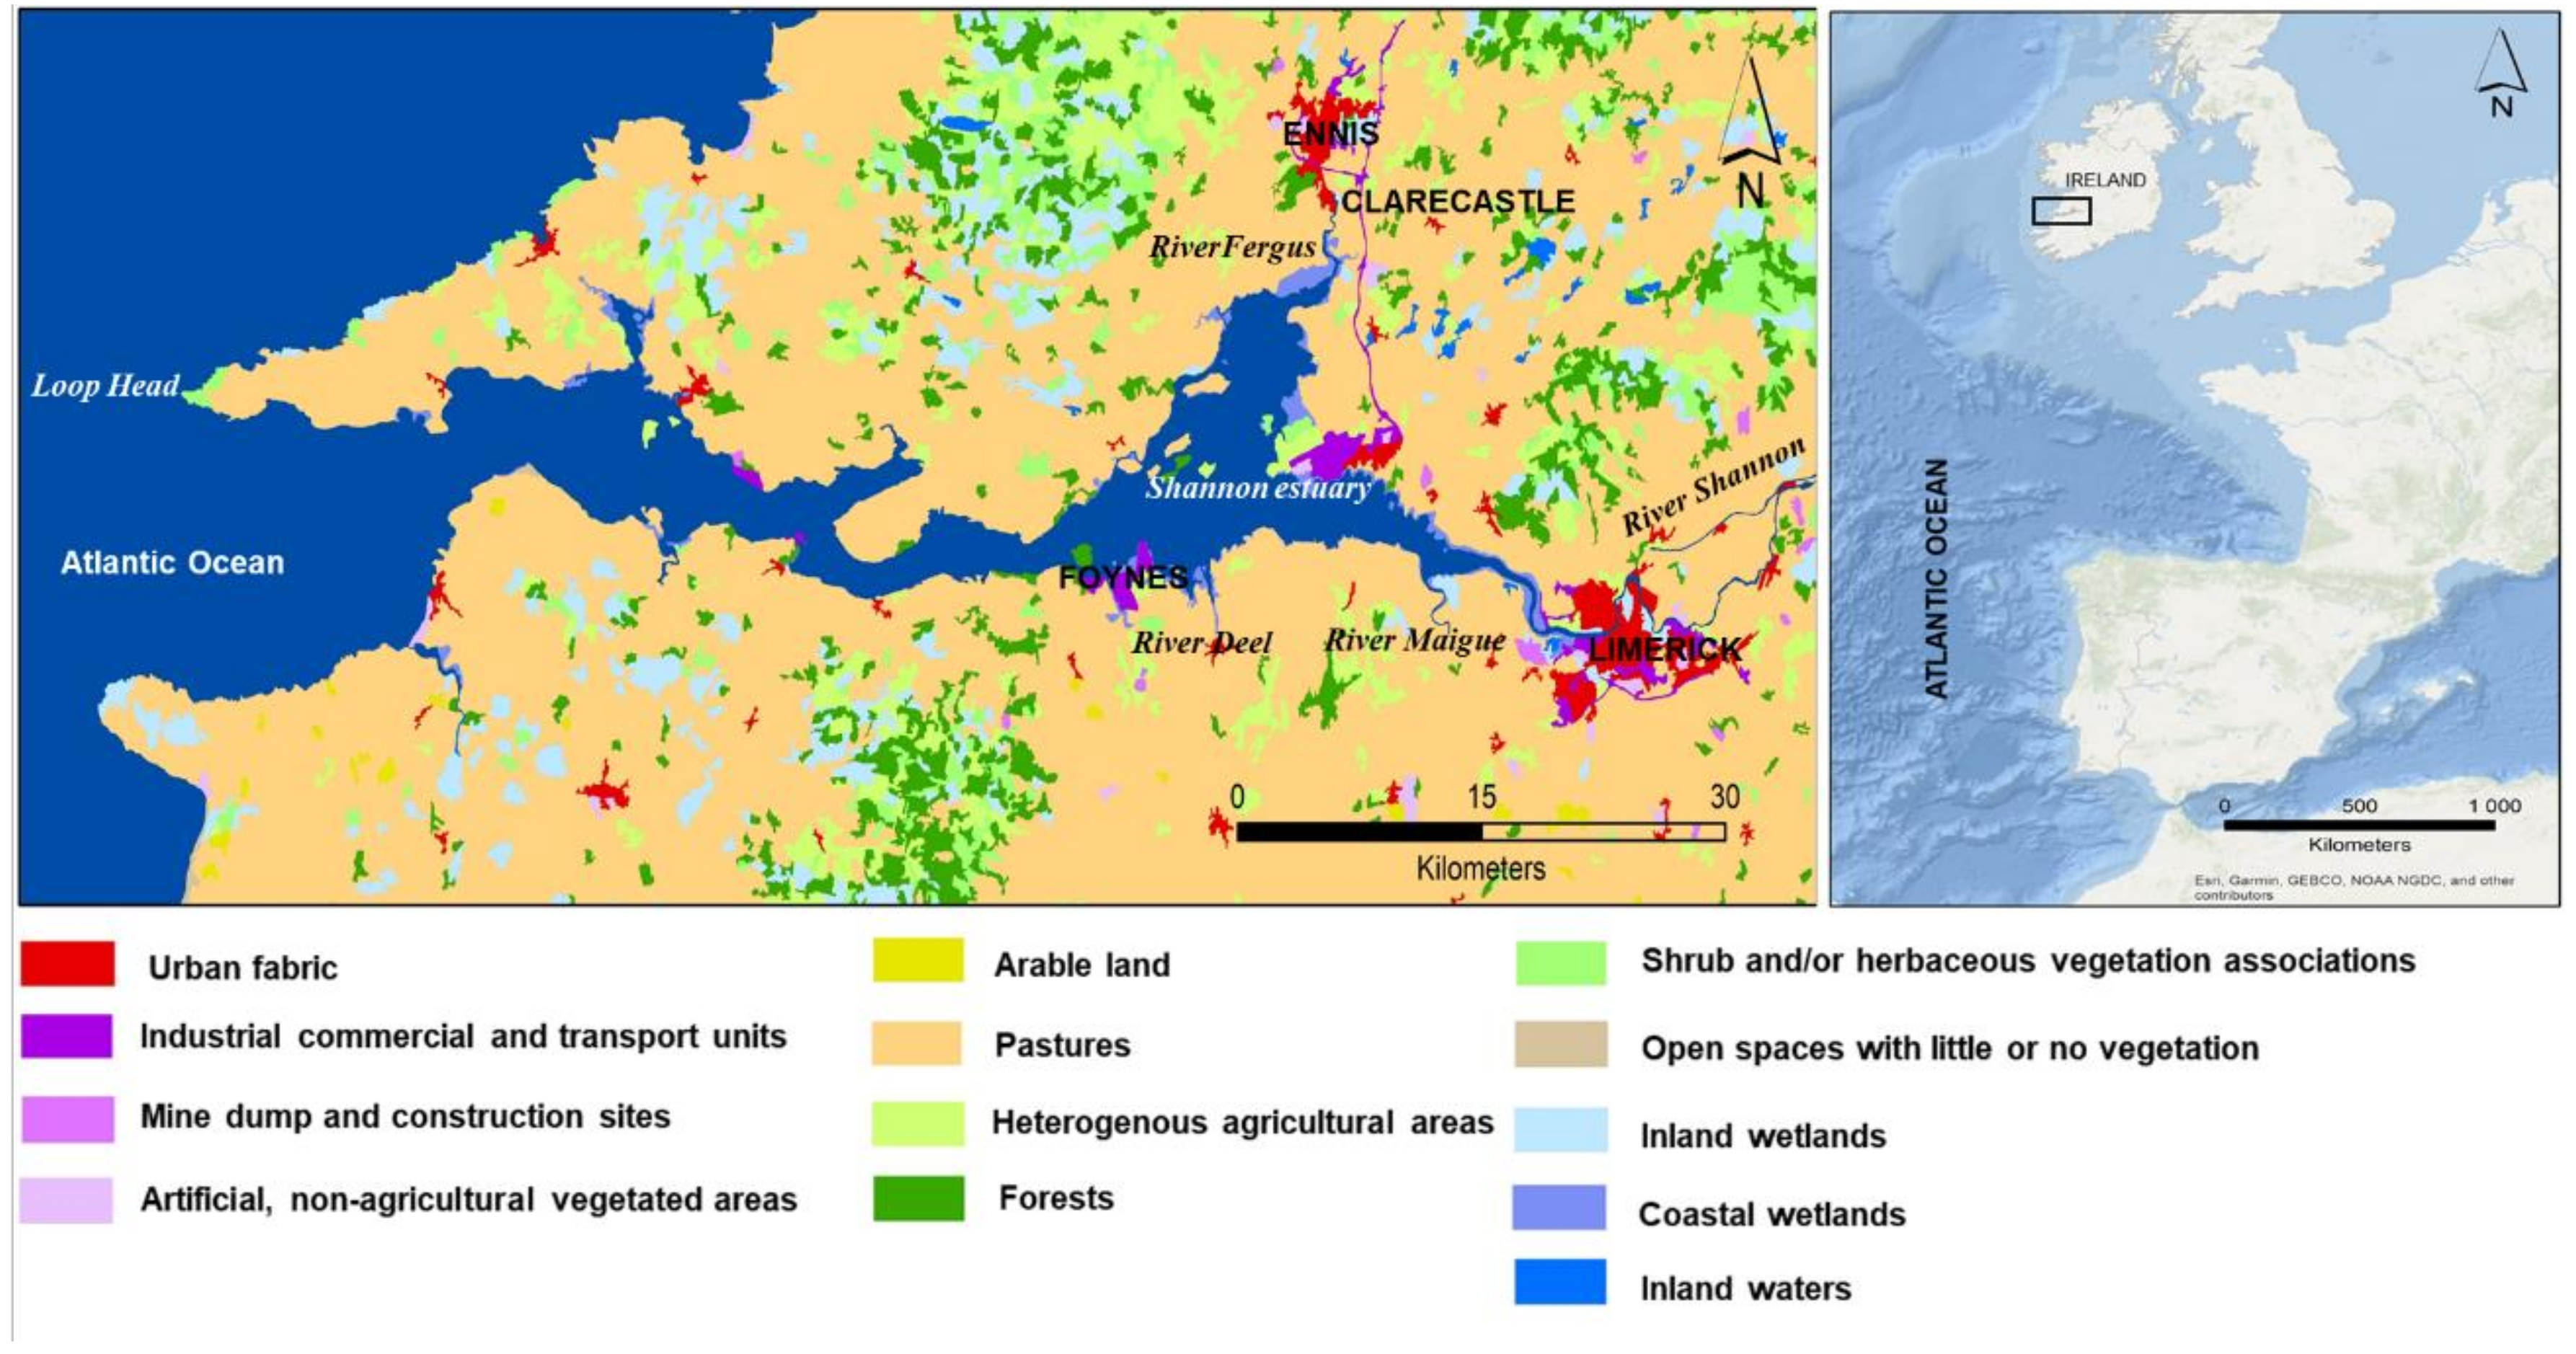
The Shannon Estuary (Figure 2) is located on the west coast of Ireland, shaped by an extremely energetic wave regime. Since Ireland’s west coast is particularly exposed to atmospheric depression tracks, storm surge events are frequent [39], causing floods [40]. The estuarine area encompasses the lower sections of Shannon River between the city of Limerick and the ocean, as well as the River Fergus small estuary, located south of Clarecastle. The estuarine inner section is located east and north of Foynes Island, while the outer section includes the area between Foynes Island and Loop Head [41].
The main fluvial discharge into the estuary comes from River Shannon [42], followed by the Rivers Fergus, Maigue and Deel. The estuary is macrotidal and has the largest tidal range along the Ireland coast [43]. Water depths vary between 37 m (estuary mouth) and 19 m (Fergus confluence), being less than 5m in Limerick, located around the upstream part of the estuary [42]. The mean high water spring tide is ca. 5.44 m (OD, relative to ordnance datum) and the mean high water neap tide is ca. 4.04 m (OD) at the Limerick Docks [41].
Nowadays, the occupation of the estuarine margins consists mostly of agricultural areas (pastures), with ports (Foynes) and industrial facilities, along with dispersed small villages (Figure 2). The city of Limerick is the major urban center, with a population in 2016 of ca. 94 thousand people, followed by Ennis, with ca. 25 thousand [44]. The only bridges connecting the two margins are in the city of Limerick, and the small villages along the estuary margins are linked by a network of national and municipal roads. The region is served by the Shannon international airport, located in the estuarine margin.
1.1.3. The Solent Estuary (United Kingdom)
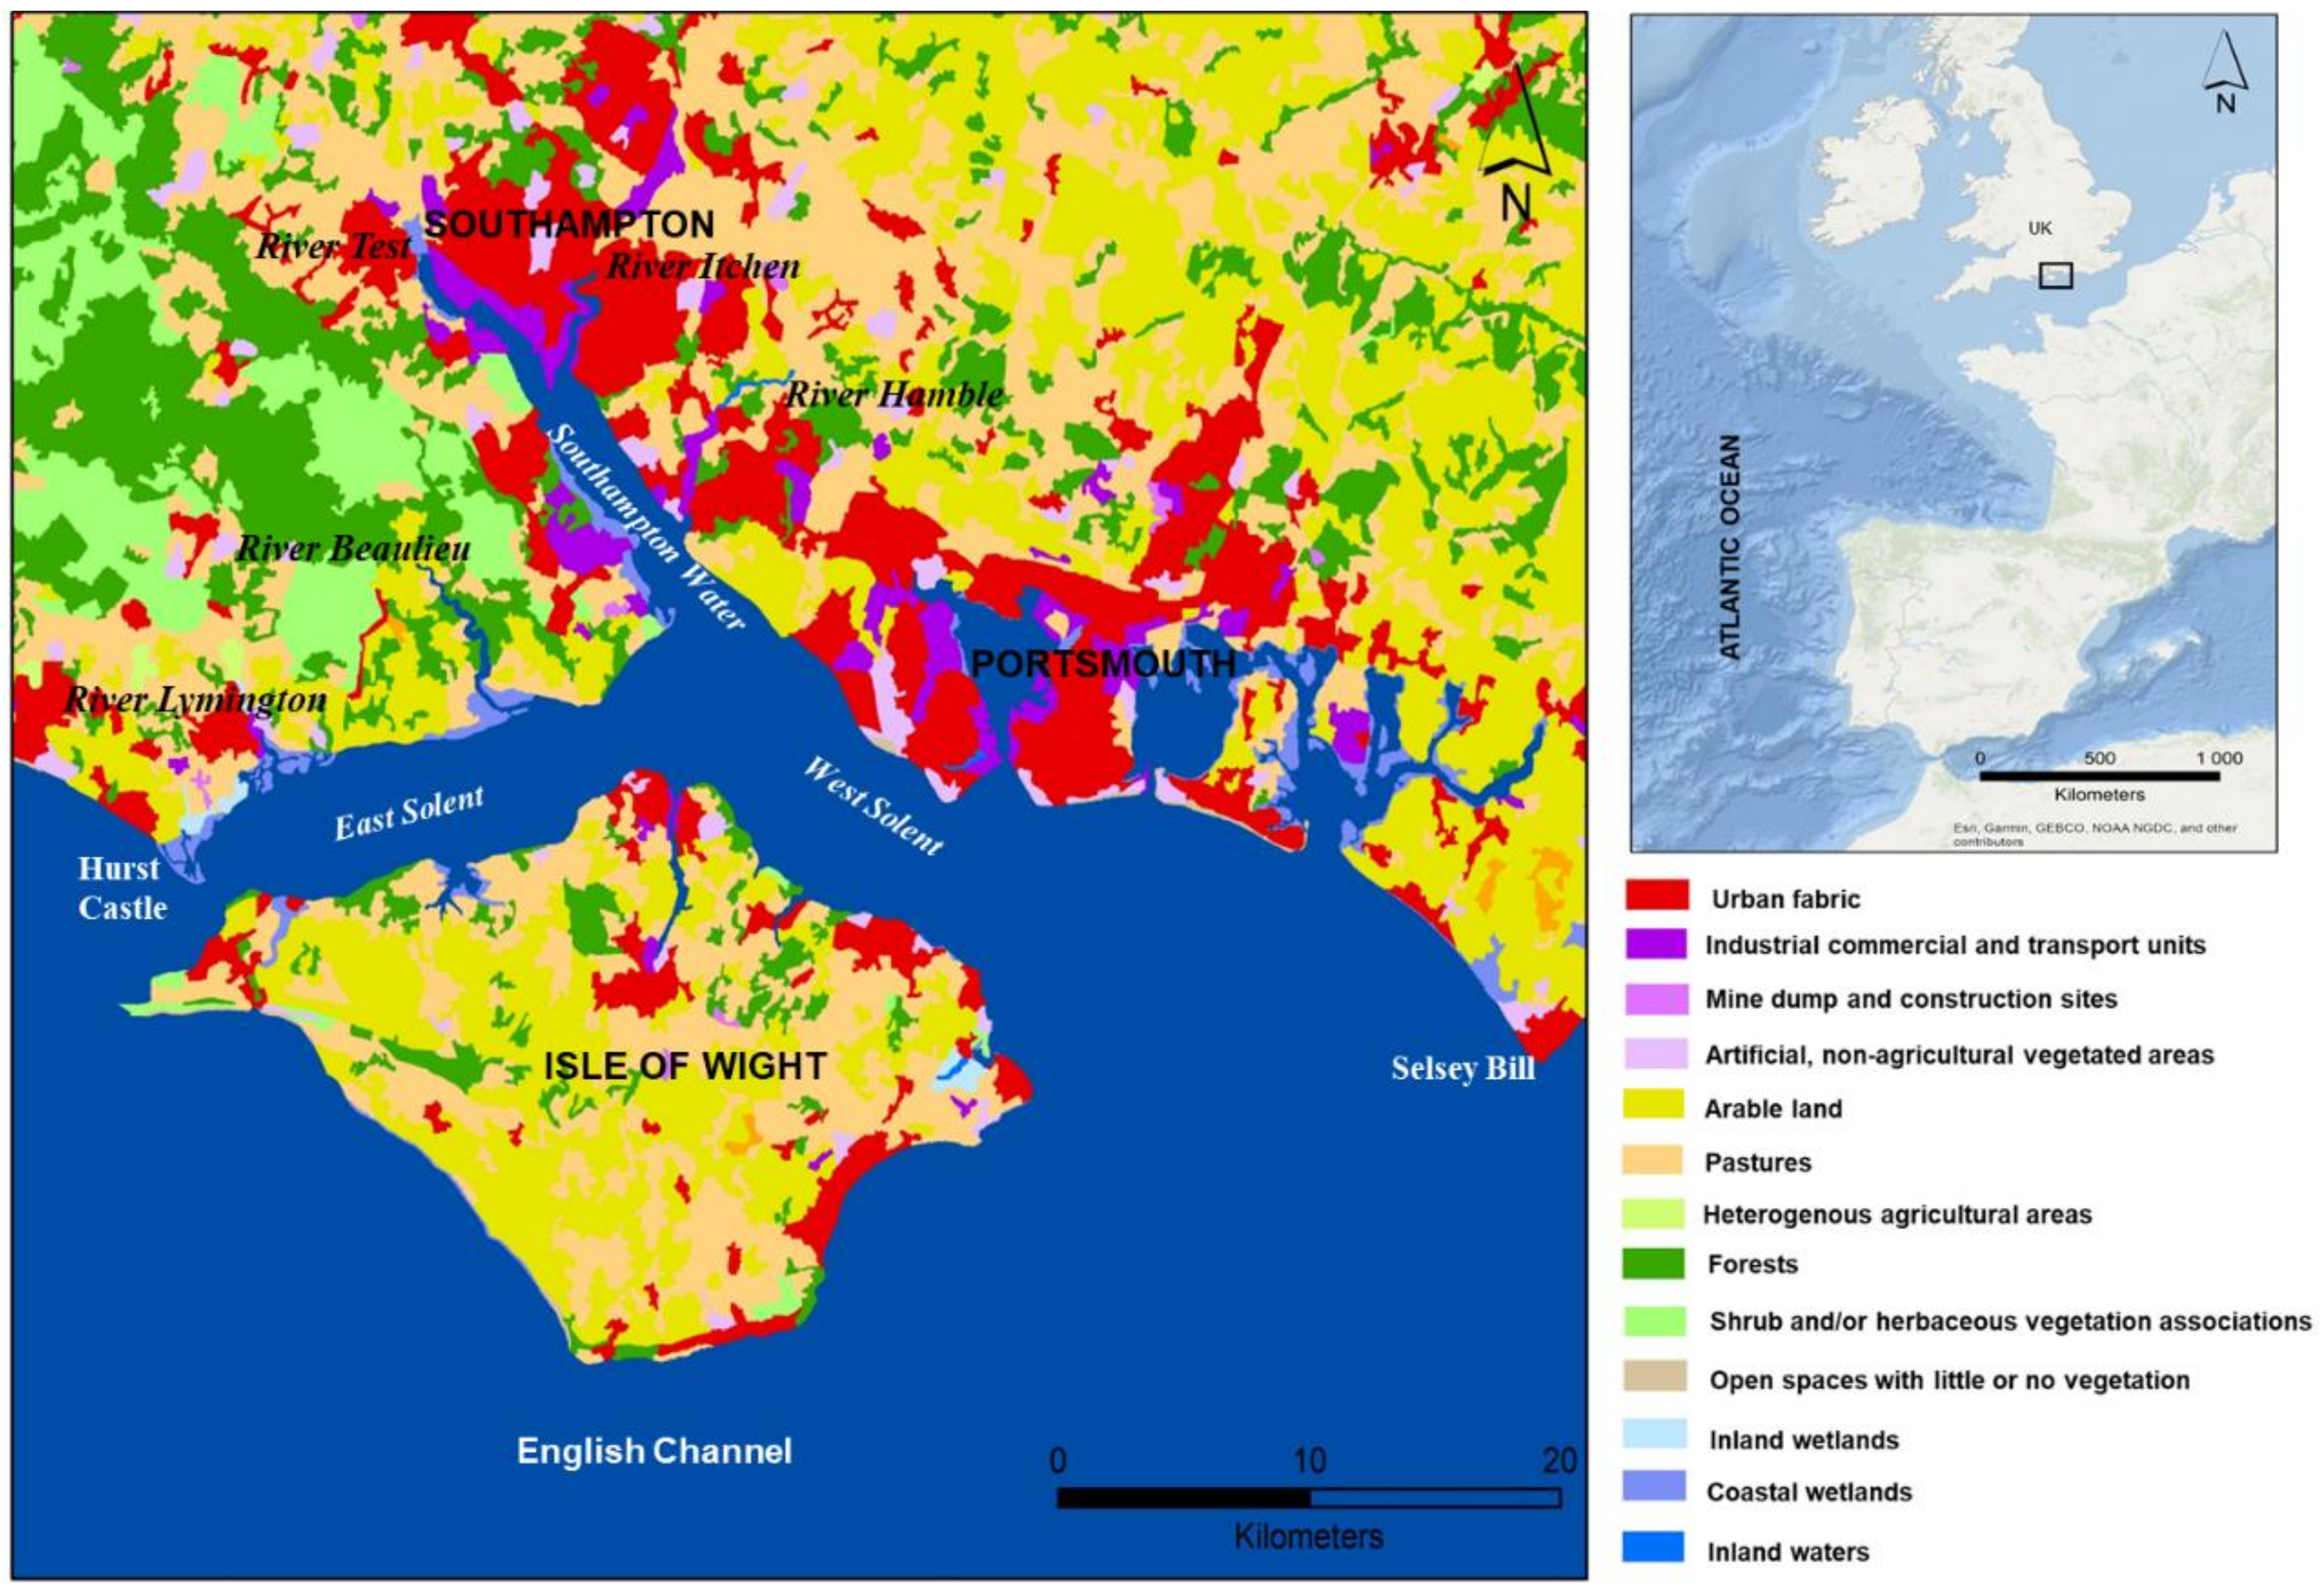
The Solent on the south coast of the UK is a complex estuarine system composed of an estuarine strait (Southampton Water) comprising 12 separate small estuaries [45,46], located between the south coast of England and the Isle of Wight in the English Channel. Although sheltered by the Isle of Wight from south-westerly waves, the Solent is affected by storm surges of heights of up to 1 m, caused by atmospheric depression tracks moving from the Atlantic eastward, along with small surges coming from the North Sea region, which promote flood events [8,47].
Although the twelve small estuaries contribute to fluvial discharge, the Rivers Test and Itchen at the head of Southampton Water account for about 45% of the total inflow into the Solent [48]. The Solent is a mesotidal system, recognized as having complex tides, with a young flood stand and double high waters, which are especially noticeable during spring tides [47]. The mean spring tide ranges between 2 m in the west to ca. 4 m in the east [46], and the water depths favor navigation and vary between 20 m in the more open water and 60 m near Hurst Castle (Hurst Spit) [48].
The Solent margins are densely populated, with up to 1.4 million people living on its margins [49], creating a dense urban fabric along with industrial, commercial and transport units (Figure 3). Southampton and Portsmouth are the major cities, both of which have relevant industrial and port facilities linked with commercial, cruise and shipbuilding activities, along with passenger operations and recreational sailing [45,49]. Major cities and villages are connected by an extensive network of primary and secondary roads.
2. Methods
Documentary sources are analyzed through a systematic procedure of reviewing and the evaluation of the sources of information aimed at gaining an understanding and developing knowledge [50]. The procedure involves examination, reading and interpretation, being an interactive process of content analysis [50]. Due to their structured nature and requirements, databases provide the ideal instrument with which to store and organize information according to a previously defined structure, being widely used on the local and national scales.
For clarity, the concepts used throughout this study are presented here. The spin-off database refers to the common database built within the scope of this study for the three estuaries based on previously compiled sources. Unstructured sources refer to previously compiled stand-alone documents consulted in order to extract information about the estuarine flood events included in the spin-off database. Structured sources refer to previously built databases that were used to extract information for the spin-off database’s creation.
2.1. From Documentary Sources to an Estuarine Flood Events Database
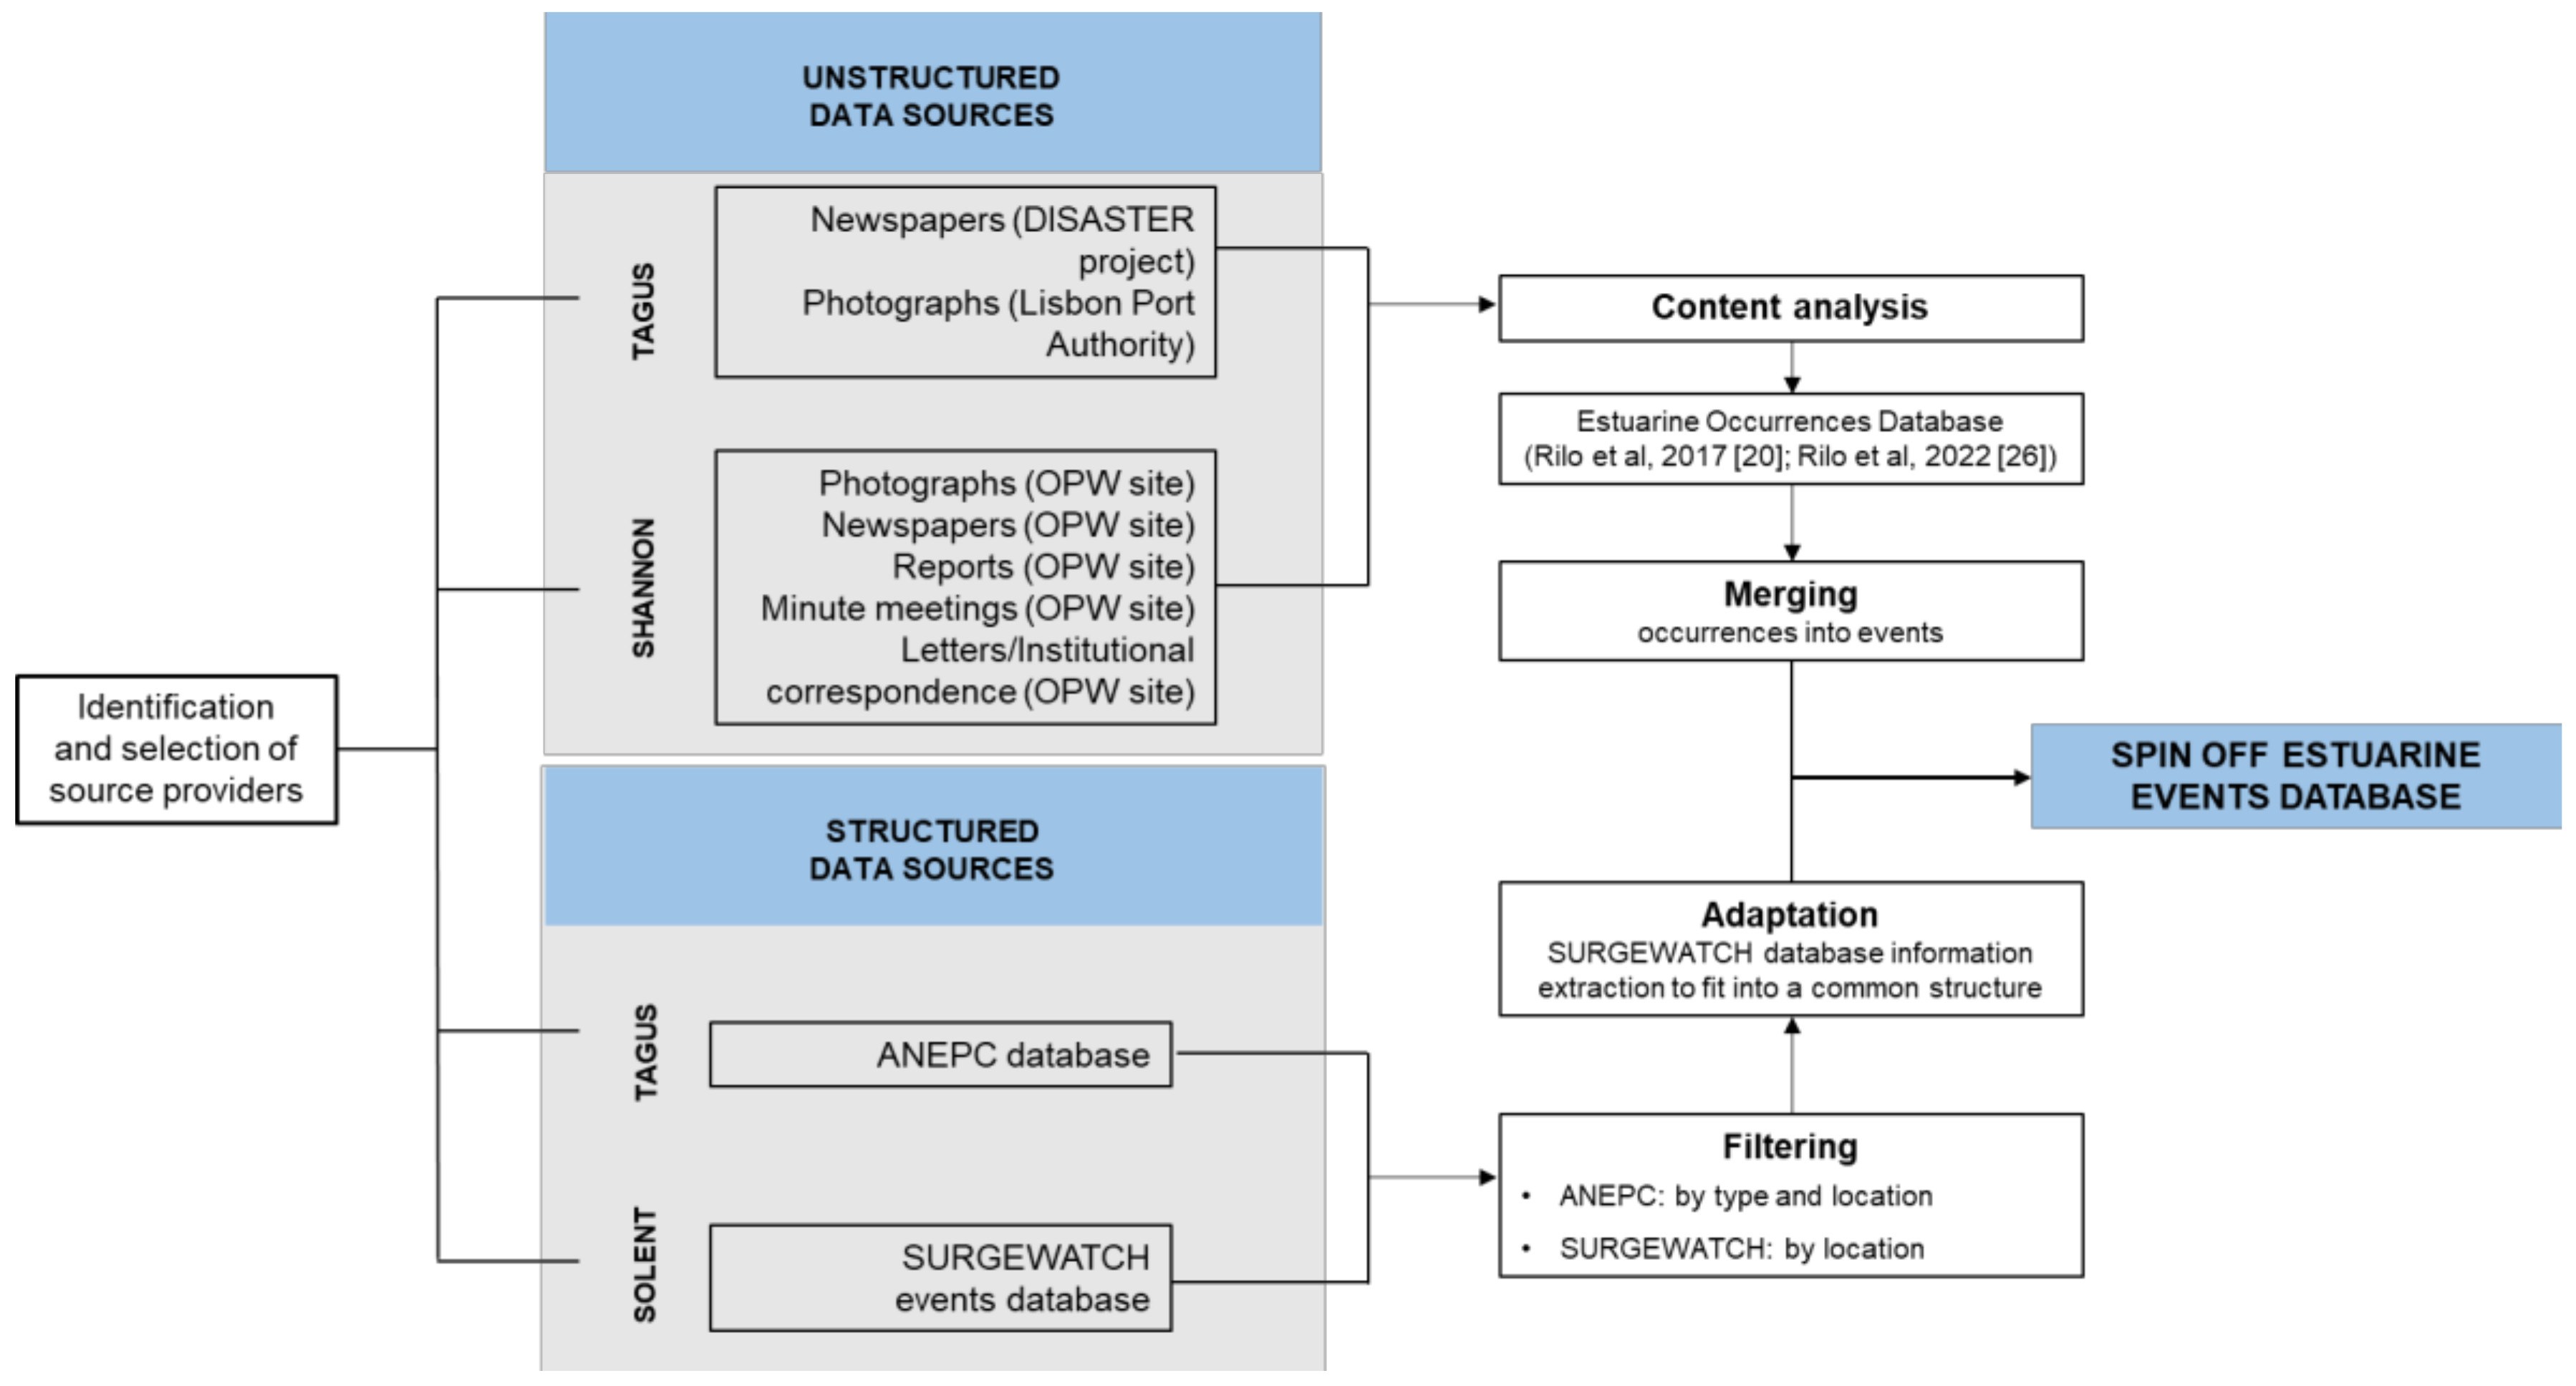
To achieve a comprehensive collection of information on the flood events involving the three estuarine systems, different sources were used for each estuary, and these are listed in Table 1. The construction process of one common flood event database (spin-off database) started with the identification and selection of sources (Figure 4). The identified sources are divided into unstructured (previously compiled stand-alone documents) and structured (other databases), following the approach of [51]. For the Tagus and Shannon Estuaries, a database of flood occurrences was previously built [20,26]. For clarity, the reader should note that an occurrence is defined as a geographically defined place described in the consulted sources as being affected by estuarine flooding, regardless of its severity [20]. Based on those occurrences, a merging process was carried out in order to obtain a set of events (Figure 4). Events form the basis of the analysis presented herein and are defined as a set of occurrences sharing the same date or defined in the sources as belonging to the same flood episode.
Unstructured data sources were available for the Tagus and Shannon Estuaries. In the case of the Tagus Estuary, most data sources were provided by the DISASTER project (http://riskam.ul.pt/disaster, accessed on 18 June 2022), which systematically gathered daily newspapers reporting on hydro-geomorphologic disasters in Portugal between 1865 and 2010. This vast collection of newspapers and, additionally, a small number of historic photographs provided by the Lisbon Port Authority (APL) were filtered according to the Tagus Estuary’s location. The ANEPC database was filtered by the type of flood and location, and two records were retrieved, whose information was integrated into a common framework structure (Figure 5).
The Shannon Estuary documentary sources were transferred from the former Irish Flood Hazard Mapping Website, which migrated to the recent national flood information portal FloodInfo [52]. Herein, only past flood records extending up to the autumn of 2014 were used. The information available on the website was collected by the OPW (Office of Public Works), with the collectors ranging from local authorities and national organizations to members of the public. Users are advised that it does not represent a complete catalogue of all the events. The available sources only describe flood events of fluvial and tidal origins, and the newspaper sources only consider the most severe events of the past 120 years. According to the abovementioned terms, a total of 106 documents were gathered, which include reports, newspapers and photographs.
Structured data sources were available for the Solent estuarine system from the SurgeWatch database (http://www.surgewatch.org/, accessed on 18 June 2022), which constitutes the most comprehensive source of historical records of UK coastal flood events. The database spans from 1915 to 2016 and includes a total of 329 costal flood events, covering the entire UK coastline [27]. We performed a filtration by location to retrieve the events that took place within the Solent estuarine system. Geographically, we considered the coastline between Hurst Spit and Selsey Bill, including the Southampton Water and the Isle of Wight north coast (Figure 3). A total of 79 flood events were retrieved, covering the period between 1916 and 2016, and the information was adapted to fit a previously designed common structured framework (Figure 5).
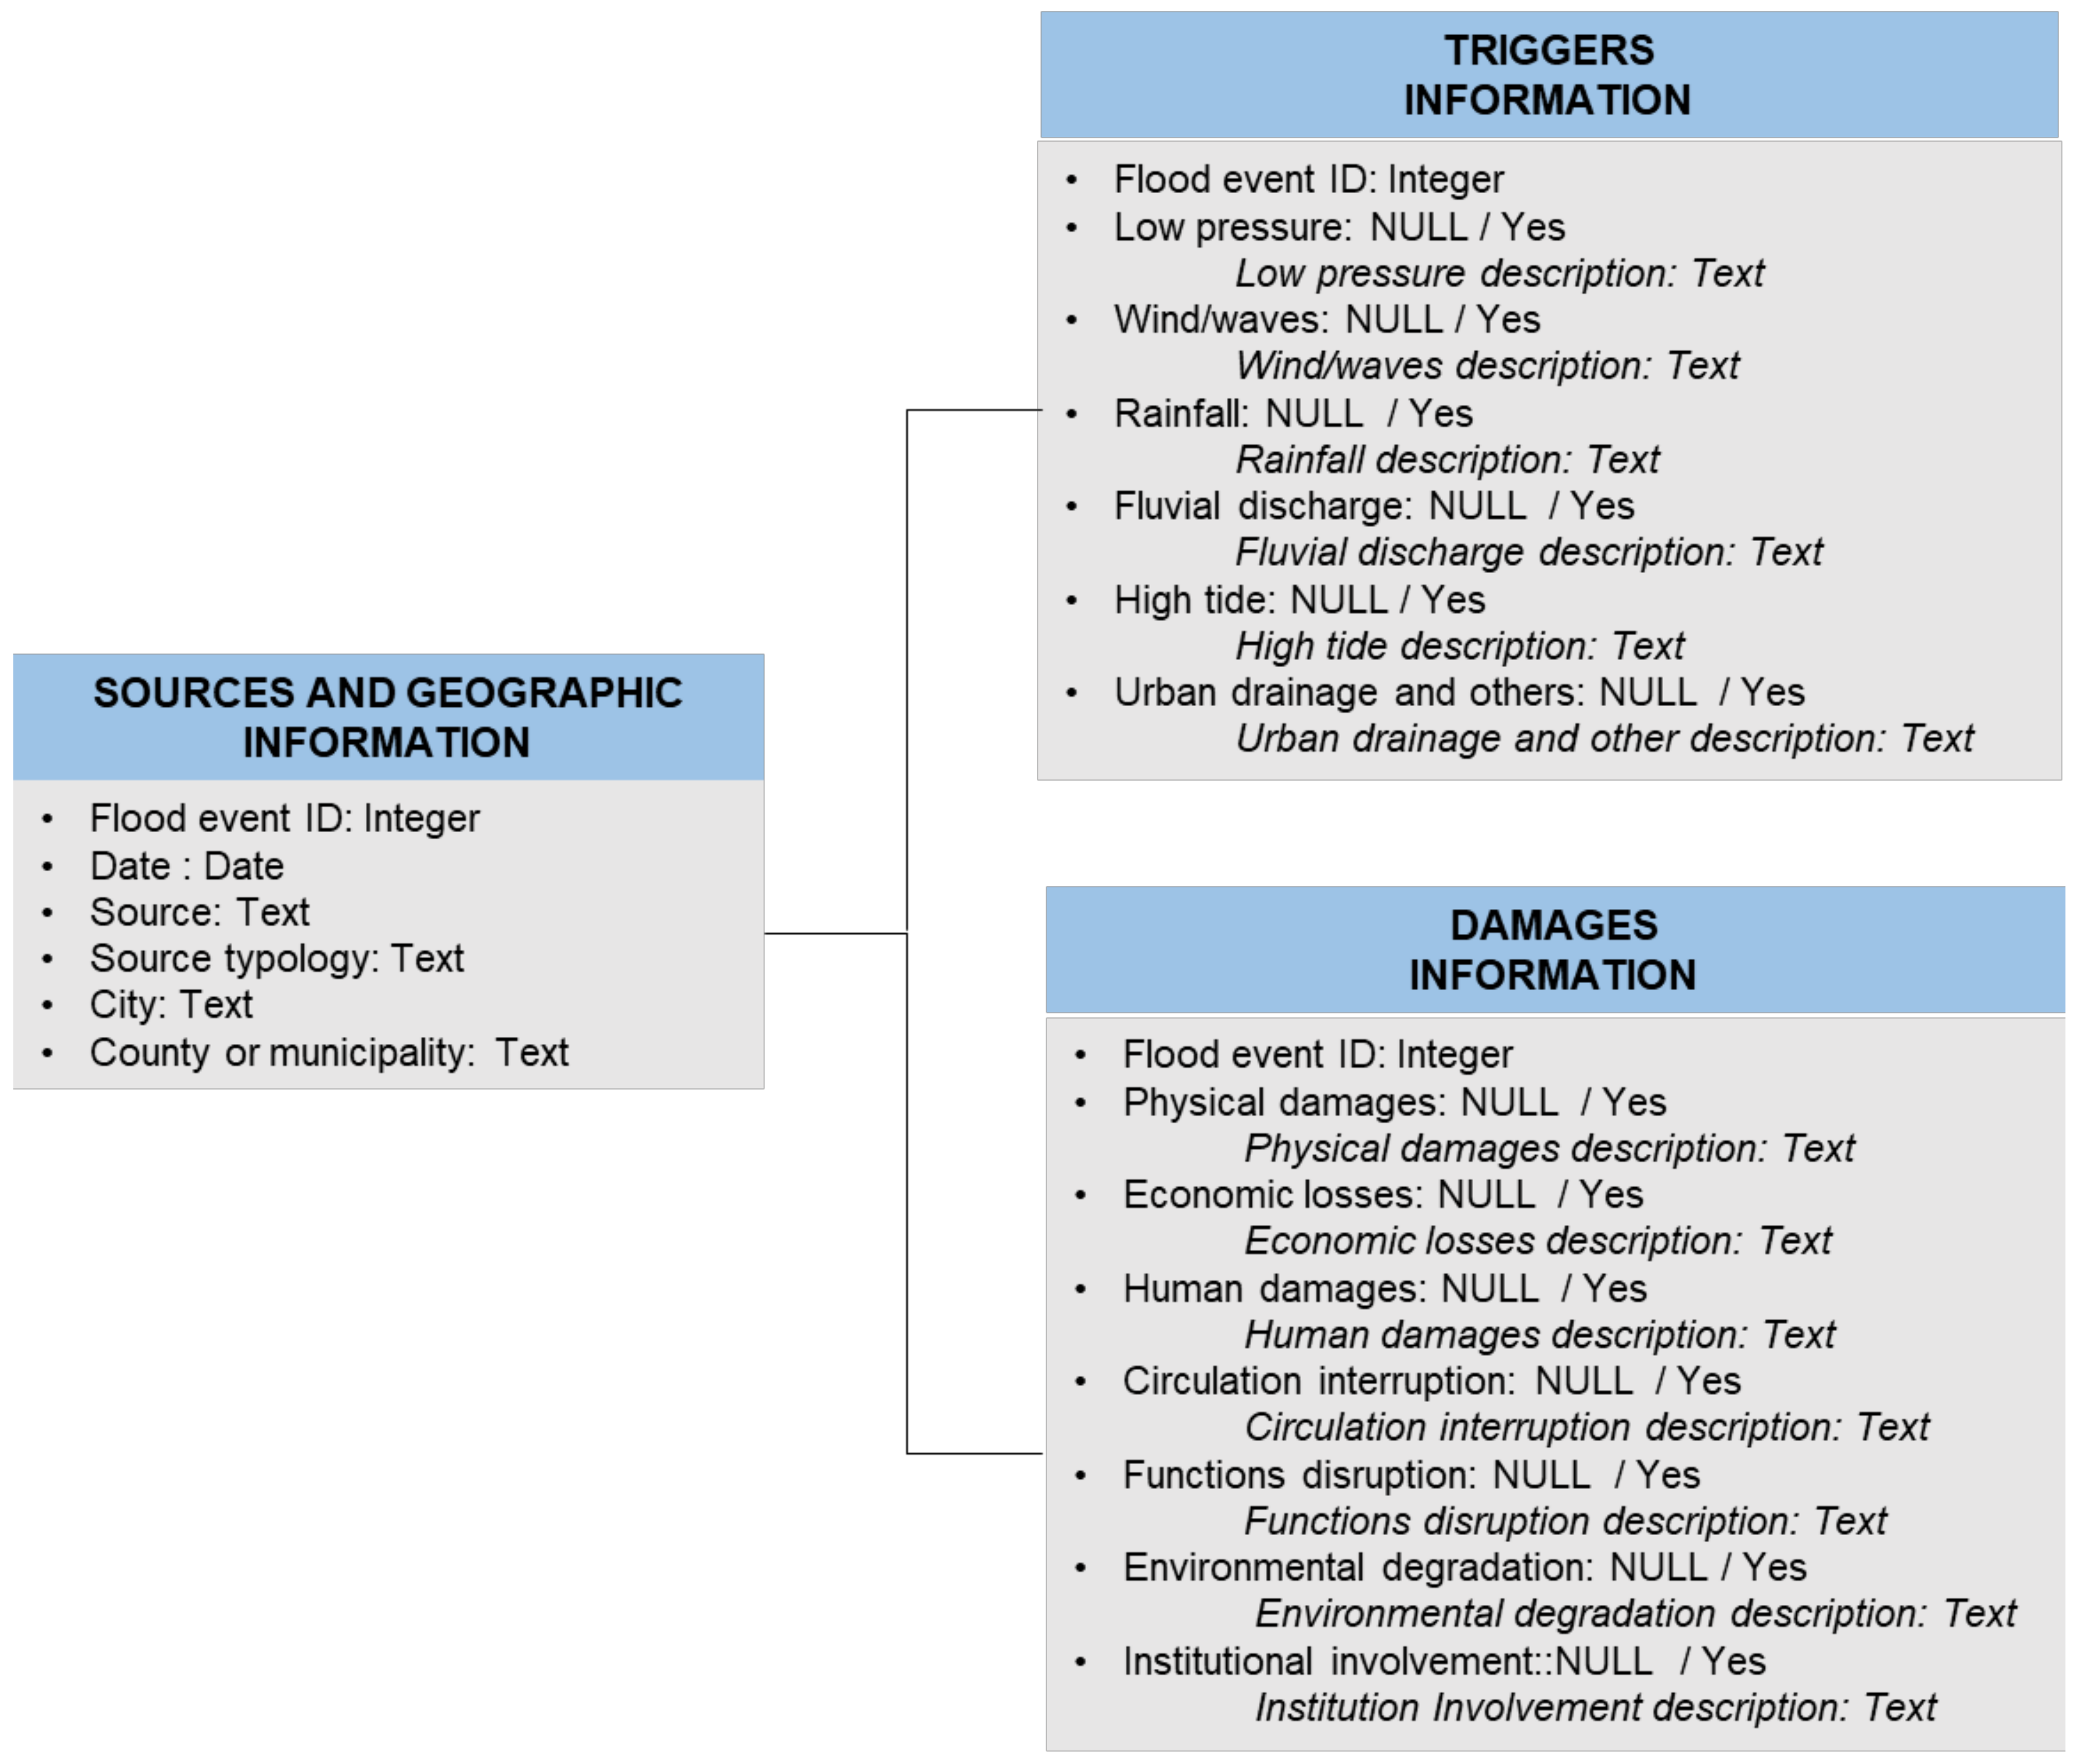
Overall, the final spin-off event database comprises information of the three estuaries and have a total of 149 events between 1865 and 2016. For each event, the date, location and source, along with trigger and damage data, were registered (Figure 5). The triggers group includes six variables: low pressure, wind/waves, rainfall, fluvial discharge and high tide. The damages group includes seven variables: physical damages, economic losses, human damages, circulation interruption, functions disruption, environmental degradation and institutional involvement. For each variable, at least the information regarding the presence or absence of a certain trigger was retrieved, and the appropriate field was filled with YES if present and NULL if absent. When available, a detailed description was registered in the text field (Figure 5). A set of criteria (Table 2) were used to identify estuarine flood events reported in the sources (structured and unstructured) based on geographic constraints, along with other proxies.
2.2. Information Extraction
Unstructured sources were collected and individually treated using content analysis techniques [62,63]. Content analysis comprises a set of techniques that use systematic and objective descriptive procedures applied to message content in order to obtain indicators (quantitative or not), enabling knowledge inference [62]. Among the various techniques, Bardin (2020) [62] explained that categorical analysis is the most generalized and simple, consisting in classifying and counting, following a set of criteria and noting the presence or absence of a certain item/element that constitutes the message of the data source. Following the above-mentioned definition, structured and unstructured sources were extensively analyzed using a common and predefined set of criteria (Table 3), enabling the extraction of relevant information into a common structure.
2.3. Statistical Analysis
The final spin-off estuarine event database, with a total 149 events (corresponding to the number of database entries), was analyzed using a non-linear multivariate analysis method, specifically multiple correspondence analysis (MCA), applying IBM® SPSS® Statistics software. MCA is particularly appropriate for analyzing nominal categorical information [21,22], enabling the detection of underlying data relations (described as dimensions in MCA) and possible associations between data entities and providing a method to support variable exclusion. For the sake of clarity, Table 4 presents the definitions and nomenclature used in the MCA.
The first step in multiple correspondence analysis is the calculation of the maximum number of dimensions that should be retained for the analysis (Equation (1)):
where:
In this case, the number of objects (149) is larger than the number of categories (2); hence, . The database has 13 variables, without non-answers (), with 2 categories each (). The maximum number of dimensions is ; hence, 13 dimensions should be used as a first estimate.
The second step included the analysis of the 13 dimensions and reveled that the first 2 dimensions were the most representative and should be retained to the third step of the analysis. This evaluation is performed using the inertia values (ratio between the eigenvalue and total number of active variables) that vary between 0 and 1. Therefore, higher values explain more of the variance by dimension.
The third step involves running the analysis again with only the two previously retained dimensions and assessing the results. The assessment is performed using the discrimination measure of each variable by dimension. Hence, the discrimination measures quantify the variance in each variable, accomplishing an optimal quantification [22] ranging between 0 and 1. Therefore, higher values that are close to one allow for the identification of the most discriminant variables in a certain dimension, enabling the exclusion of the ones that do not have the capacity to discriminate. After this step, a set of selected variables is obtained, and the analysis is run again to confirm whether there is another variable that can be excluded using the criteria mentioned above. Finally, a stable group of discriminant variables are attained, which enables the thematic interpretation of the dimensions.
A refined interpretation analysis can be performed using categories in order to better discriminate between the objects of analysis, retaining the ones with higher contributions (contribution of point to inertia of dimension) relative to a reference value given by 1/p, where p is the total number of categories.
In summary, according to [22] an interpretative process using multiple correspondence analysis comprises three main steps, namely: (1) preserving the dimensions with higher inertia values; (2) retaining the variables with higher discrimination values in the previously selected dimensions; and (3) retaining the categories with higher contribution values in regard to the previously retained variables.
For the sake of clarity, we note that the nomenclature of “variables” adopted within the scope of multiple correspondence analysis is considered, in this study, as a synonym for indicators, in the sense that indicators are “a set of variables that characterise natural and anthropogenic systems after the hazardous process take place” [26]. Therefore, in the Section 4, “indicators” are used as a synonym for “variables”.
3. Results
3.1. Spin-Off Flood Events Database
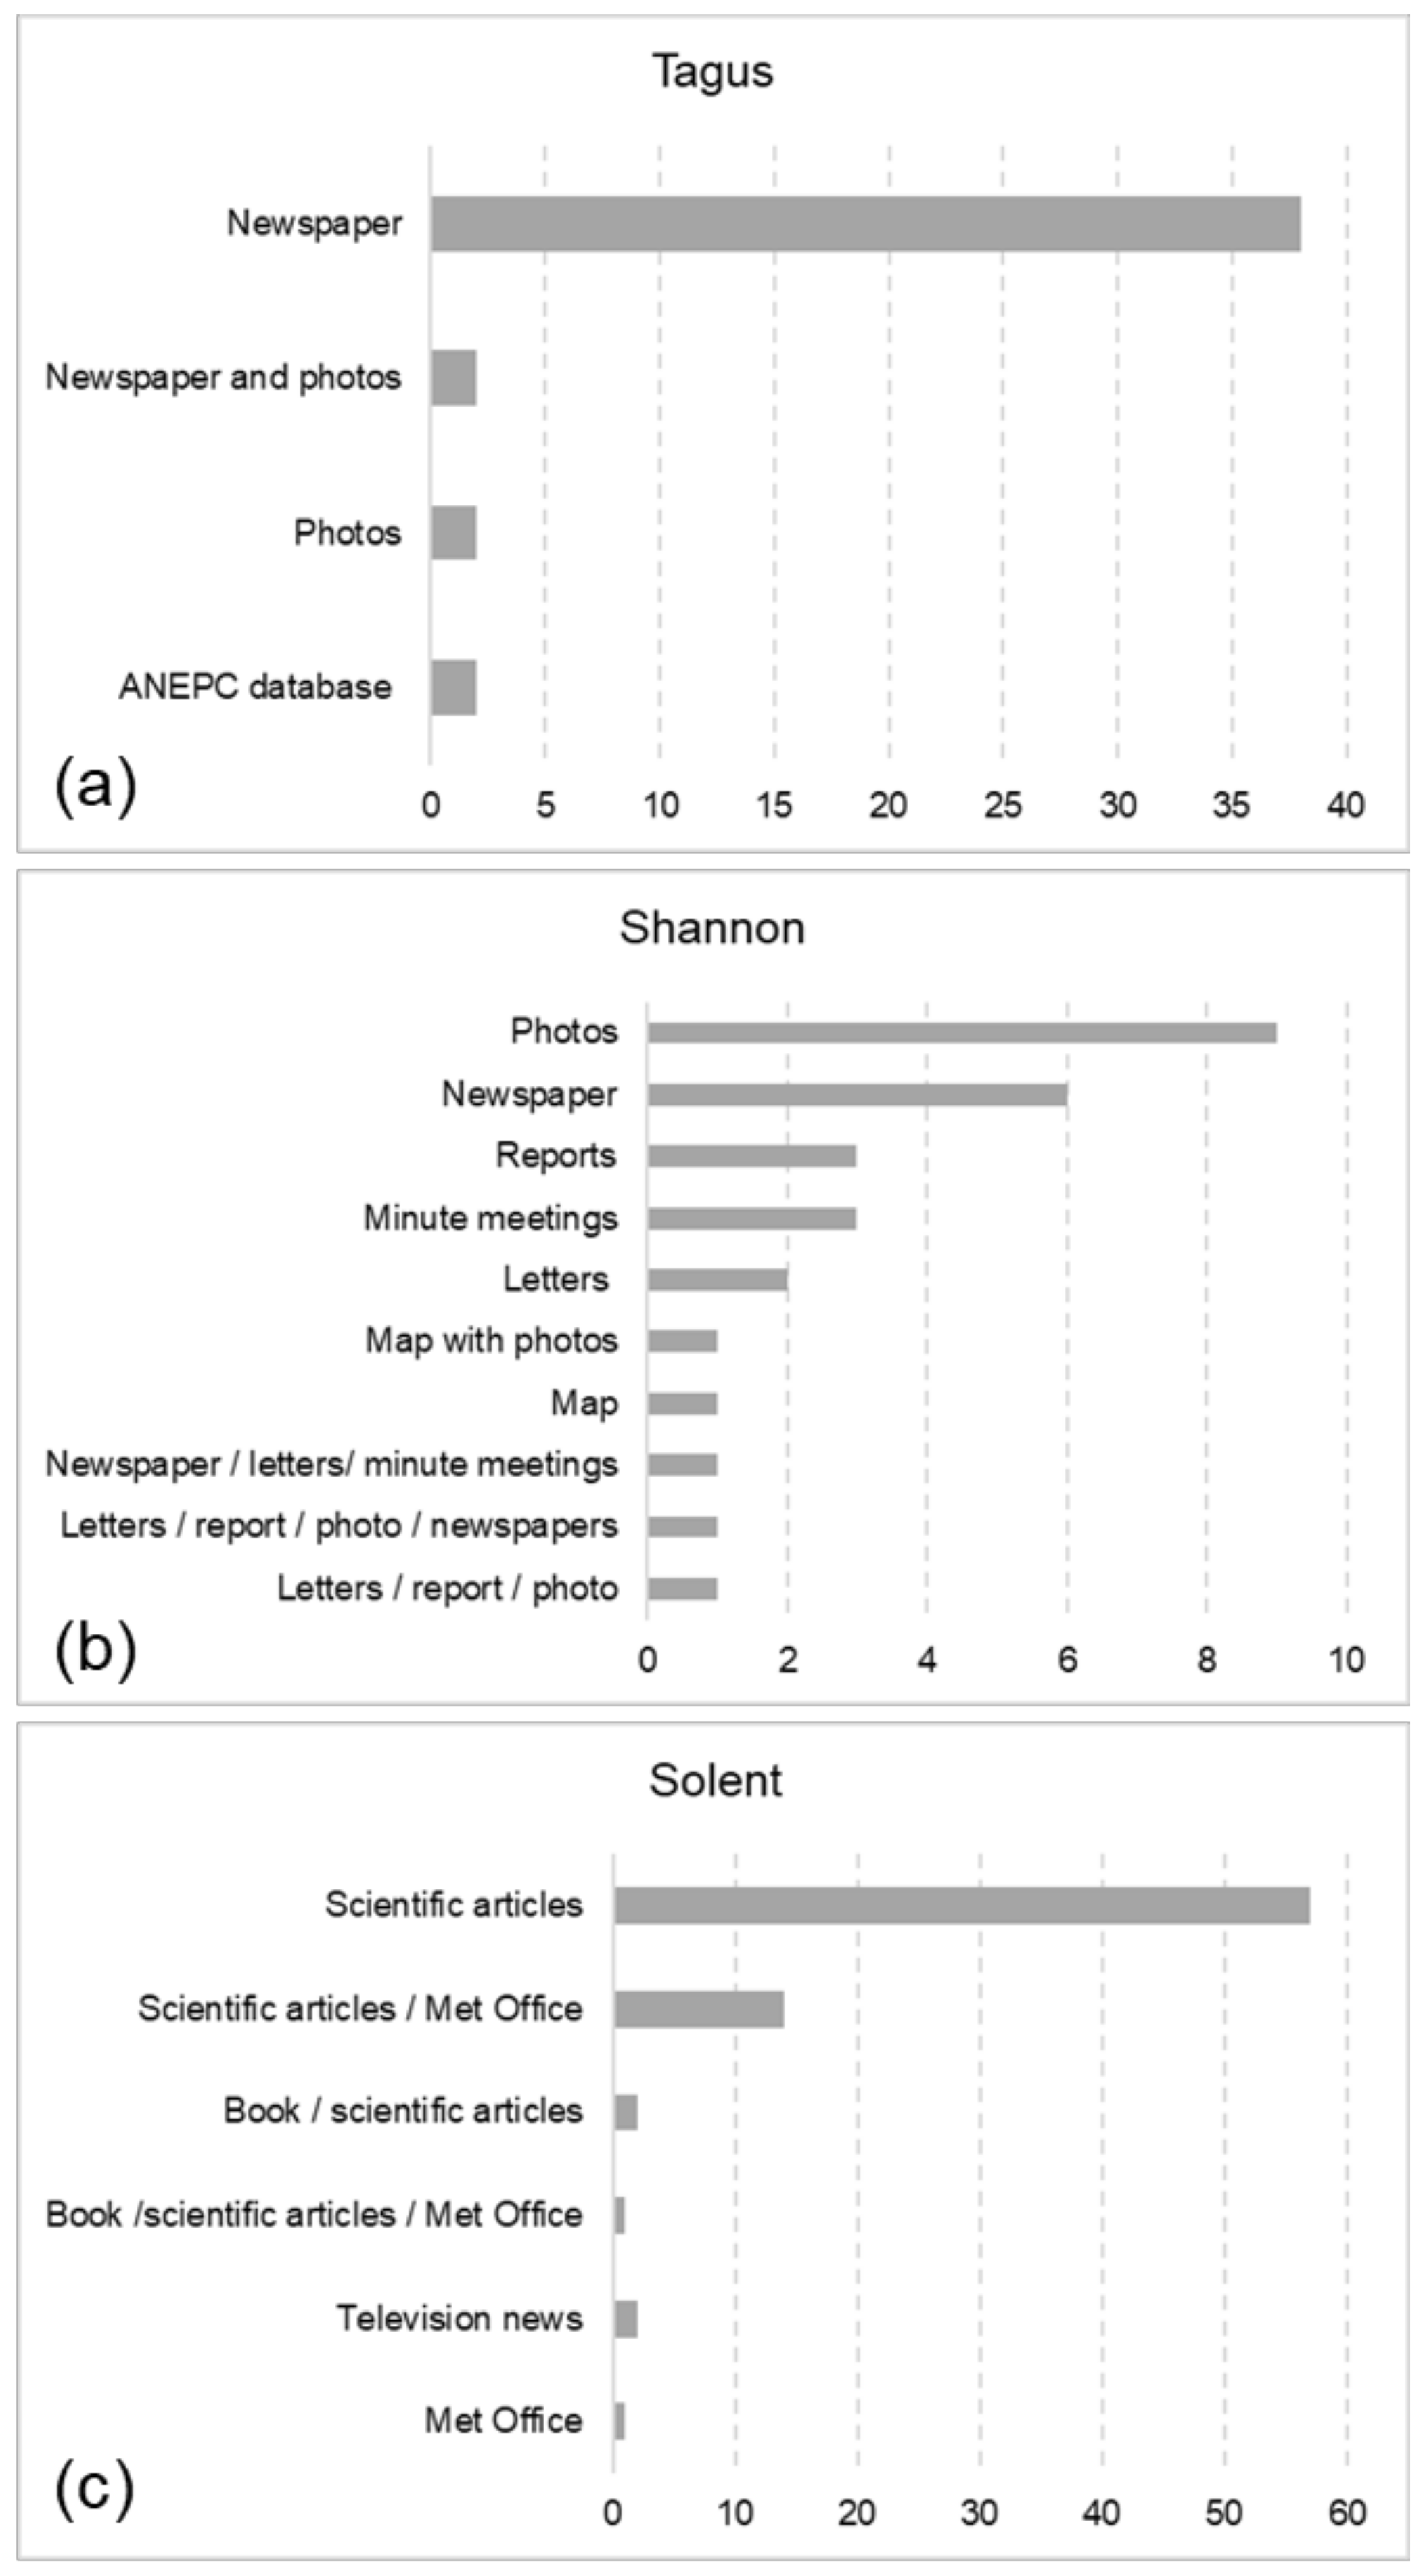
A detailed analysis of the spin-off flood event database including a total of 149 events encompassing the period 1865–2016 (151 years) was carried out. In the case of the Tagus Estuary, most of the consulted sources are newspapers, which account for 38 events (Figure 6a), while the other sources account for 6 out of 44 events. The Shannon Estuary sources are far more diverse, including photographs and newspapers, both accounting for 15 events out of 28, and maps, which account only for 1 event. In addition, a combination of sources described three events (Figure 6b). The case of the Solent is less diverse than that of the Shannon in terms of its sources. Scientific articles account for most of the sources, detailing 57 events out of 77, whereas 17 events are based on a combination of sources (Figure 6c).
The temporal coverage of events according to the estuarine system is shown in Figure 7a and reveals an almost continuous record over time (from 1865 to 2013) in the case of the Tagus Estuary. In contrast, the Shannon records are the sparsest, with more coverage from recent decades, from 1980 onwards. The Solent records are relatively continuous over time from 1916 to 2016. The monthly distribution showed that most events occurred in the autumn and winter months, with the highest number of events in January in the three case studies (Figure 7b).
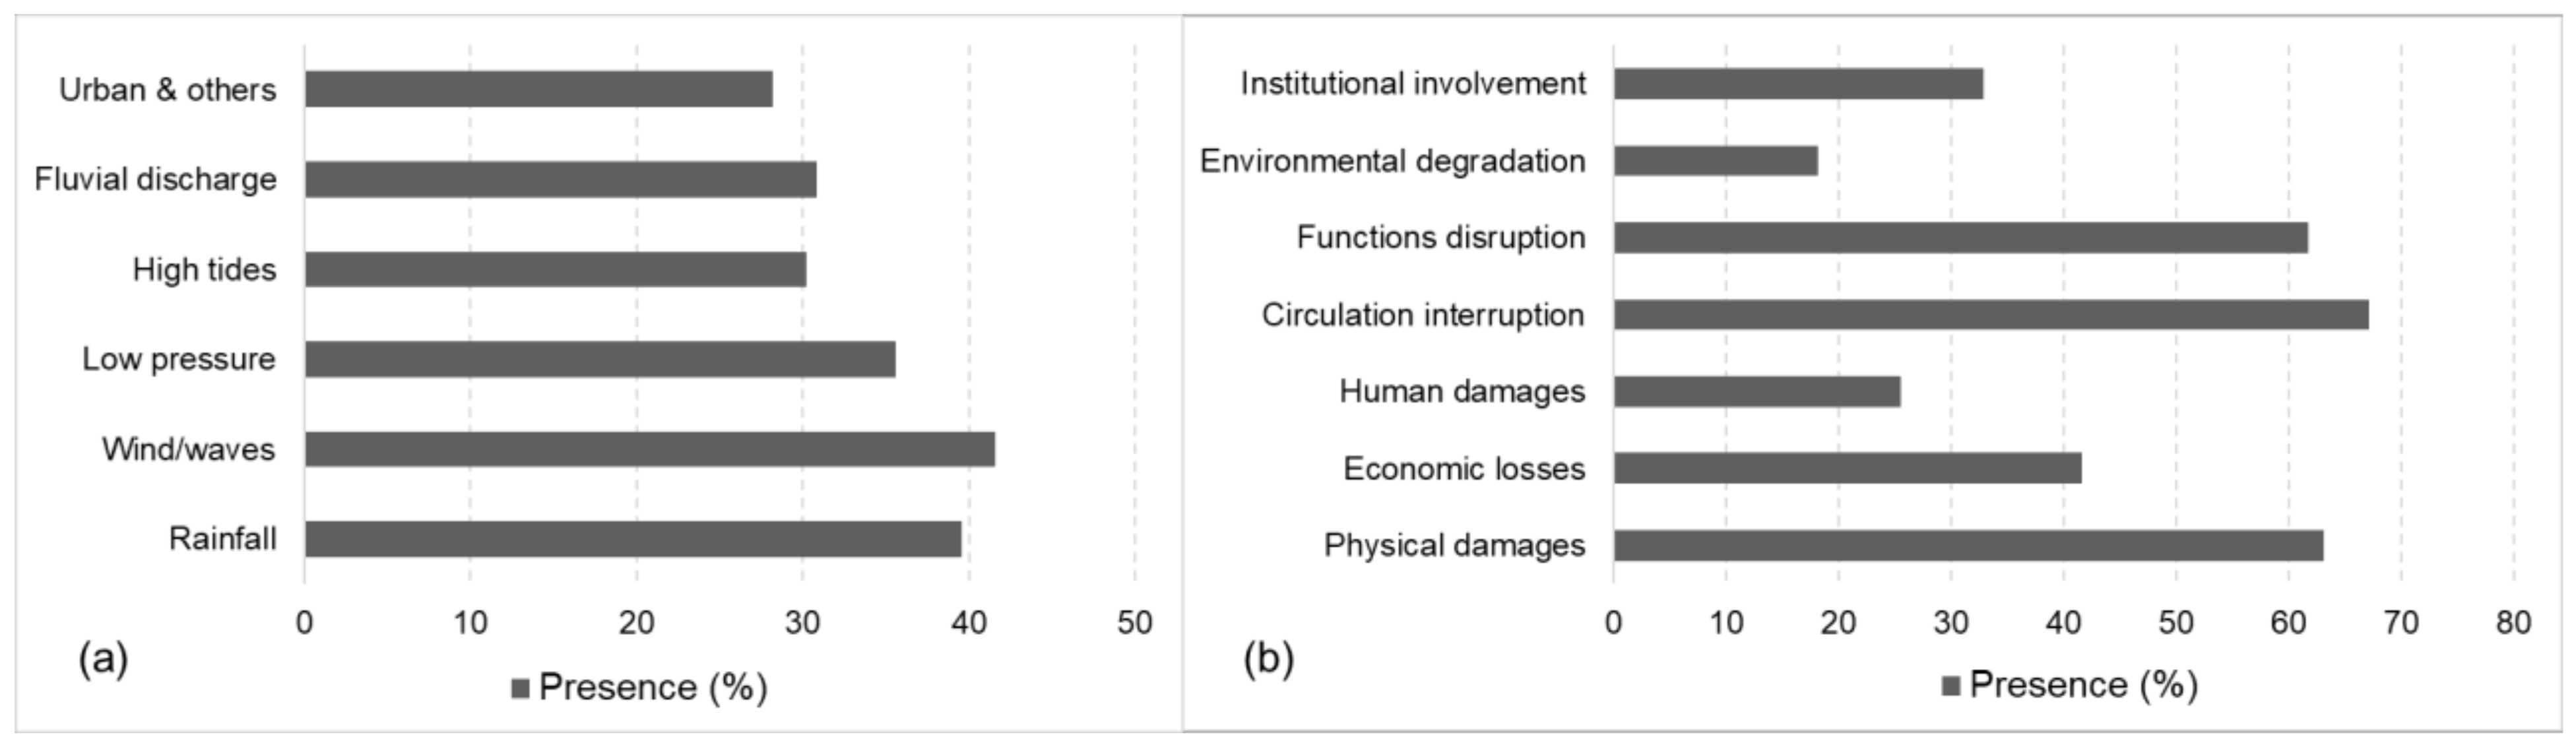
In most cases, several triggers occurred simultaneously. Wind/waves occurred in most cases (42%), followed by rainfall (40%) and low pressure (36%) (Figure 8a). Concerning registered damages, circulation interruption occurred in 67% of events, followed by physical damages and function disruption, which were registered in 63% and 62% of events, respectively (Figure 8b).
3.2. Multiple Correspondence Analysis
The multiple correspondence analysis, applied to the spin-off database, obtained a Cronbach alpha value of 0.75 (Table 5). This value is a widely used measure to assess the internal consistency of a dataset, ranging between 0 and 1. Although the value thresholds necessary to consider alpha as acceptable are debated, some authors (e.g., [64,65]) showed that an acceptable value should be at least 0.70. Therefore, the statistical model was considered appropriate. The two final selected dimensions account for 61% of the model variance.
Considering the 13 initial variables (see Table 3 and Table 4), 3 variables were excluded (high tides, circulation interruption and environmental degradation) due to their low discrimination values, producing a final set of 10 significant variables (Figure 9). The retained dimensions were thematically interpreted using the two groups of variables that better explain each dimension (Figure 9).
Therefore, dimension 1 is associated, in terms of triggers, with rainfall, fluvial discharge and deficient urban drainage conditions, and in terms of damages is related to human damages, function disruption and institutional involvement. This combination of variables are identified as a dimension associated with the influence of the hydrographic basin. In contrast, dimension 2 is related with wind/waves, low pressure, economic losses and physical damages, which are recognized as a combination of variables related to oceanographic influences.
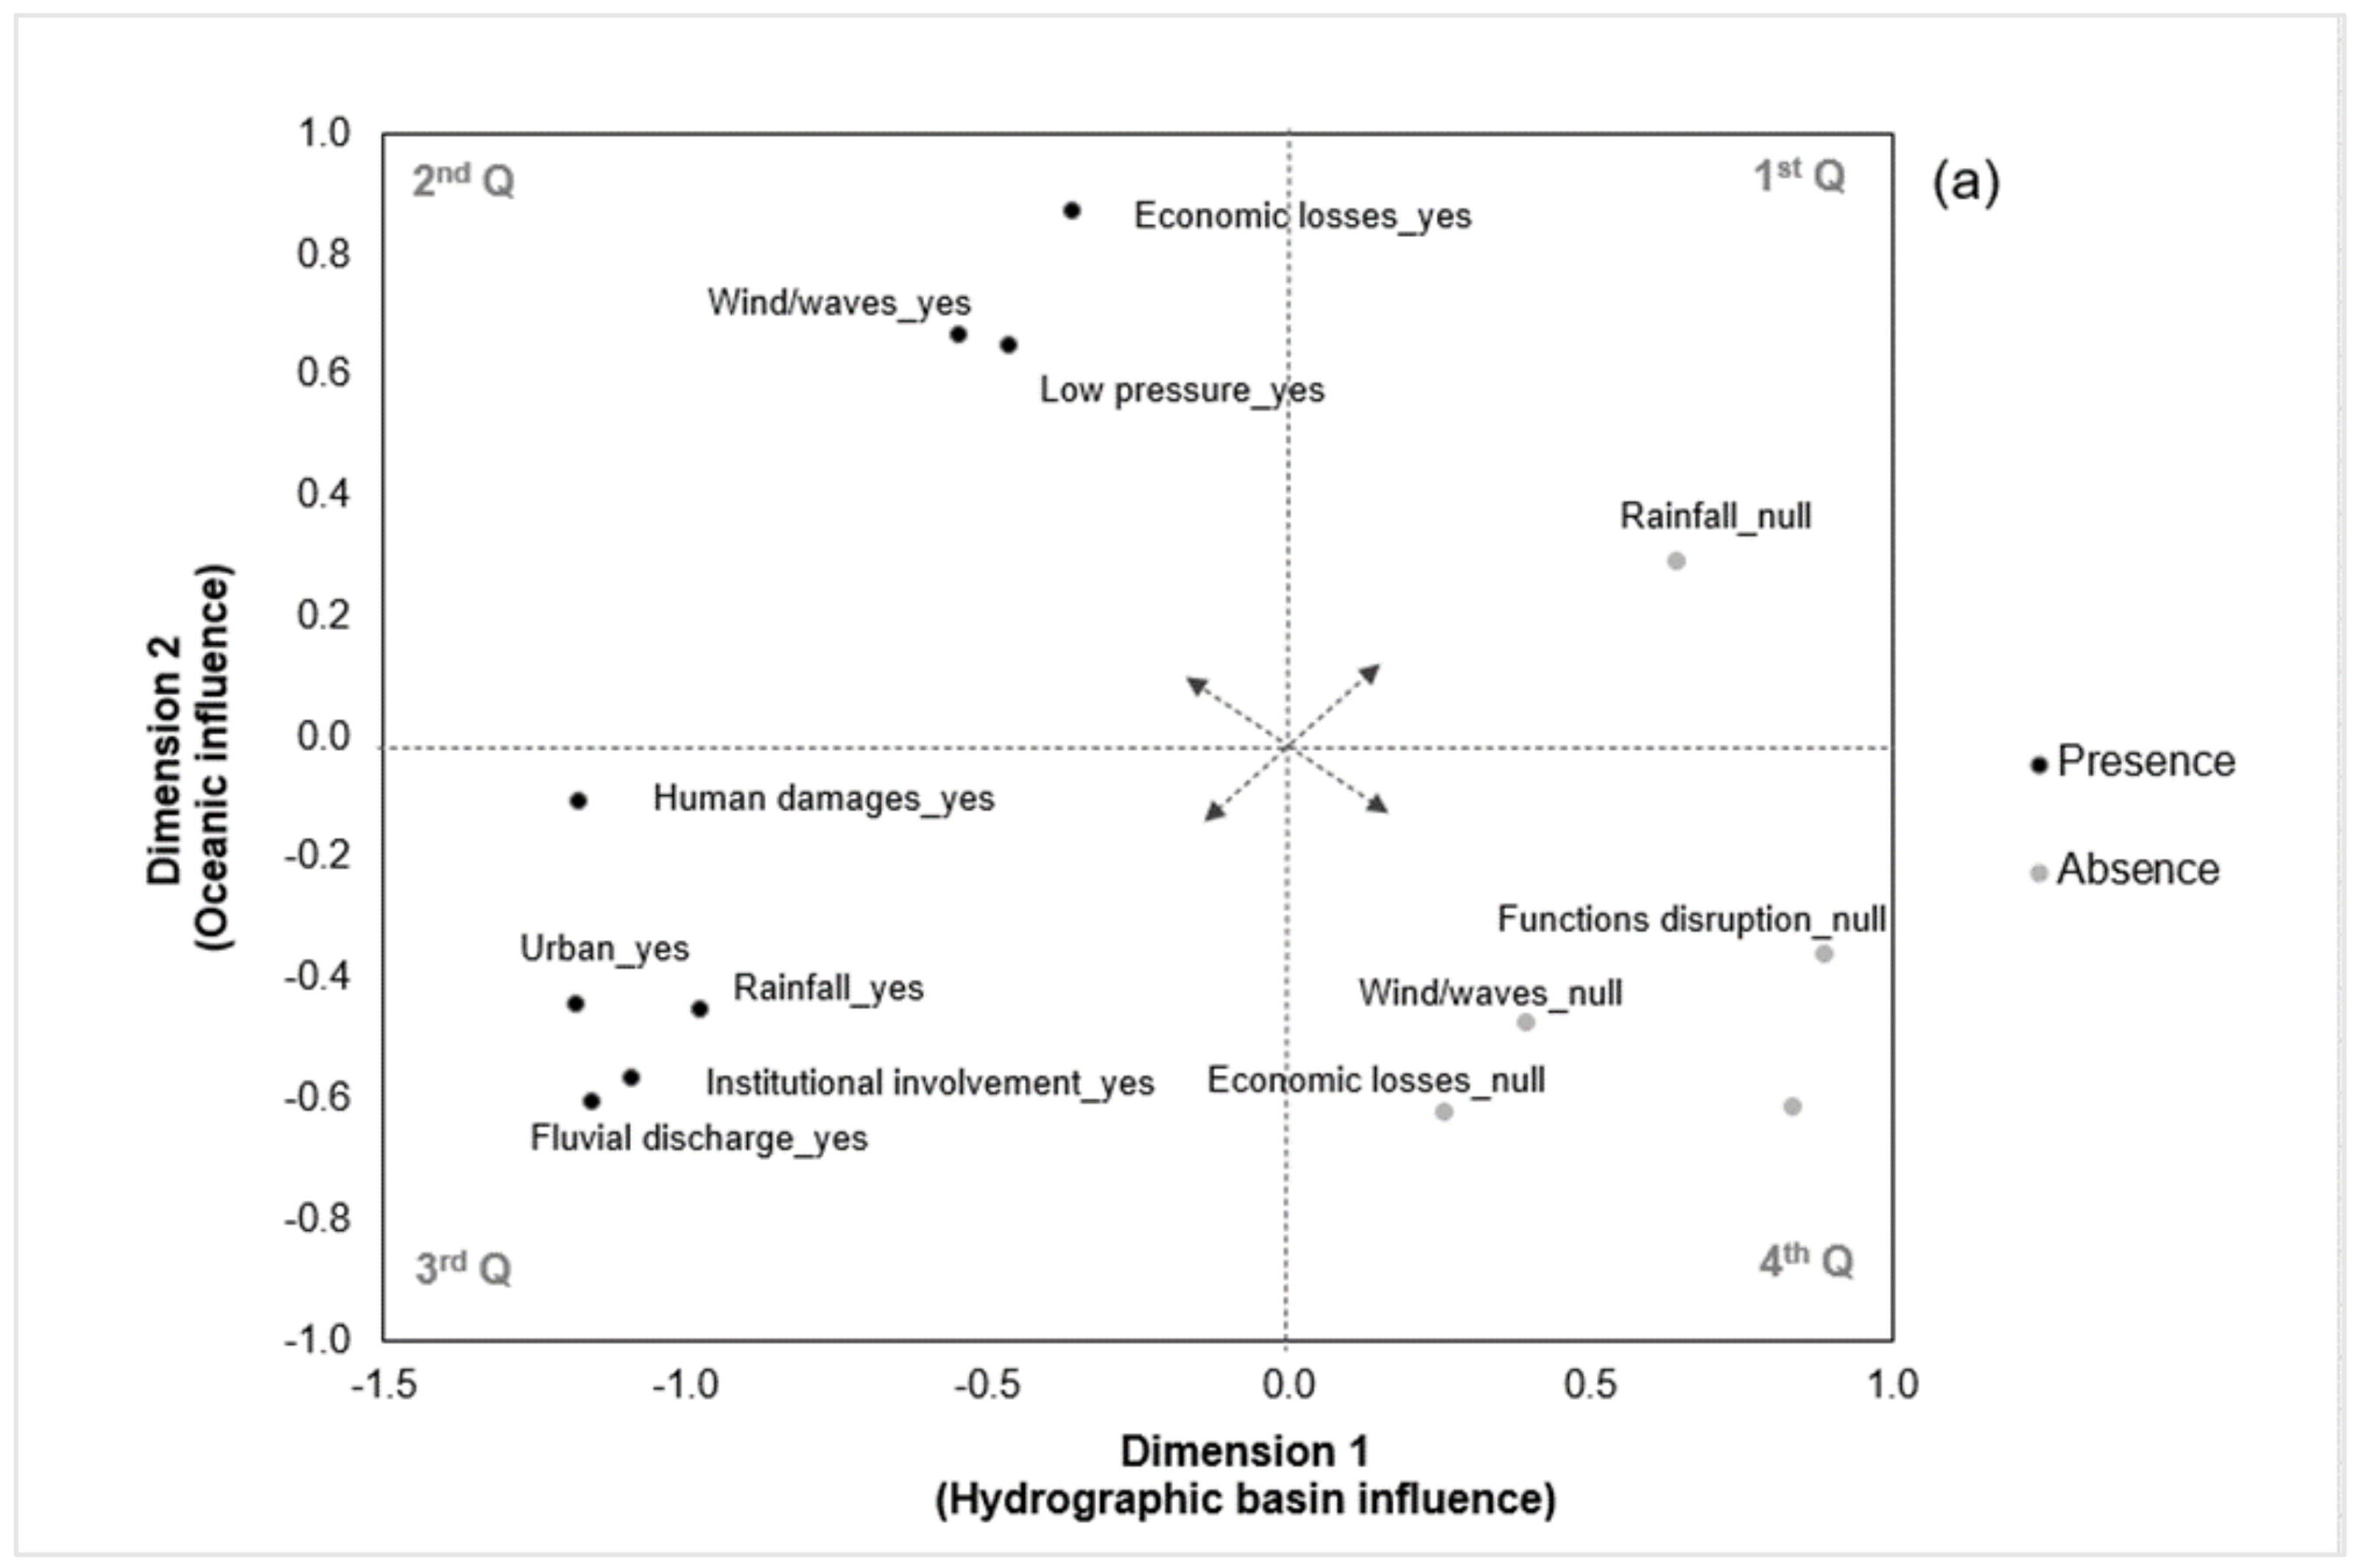
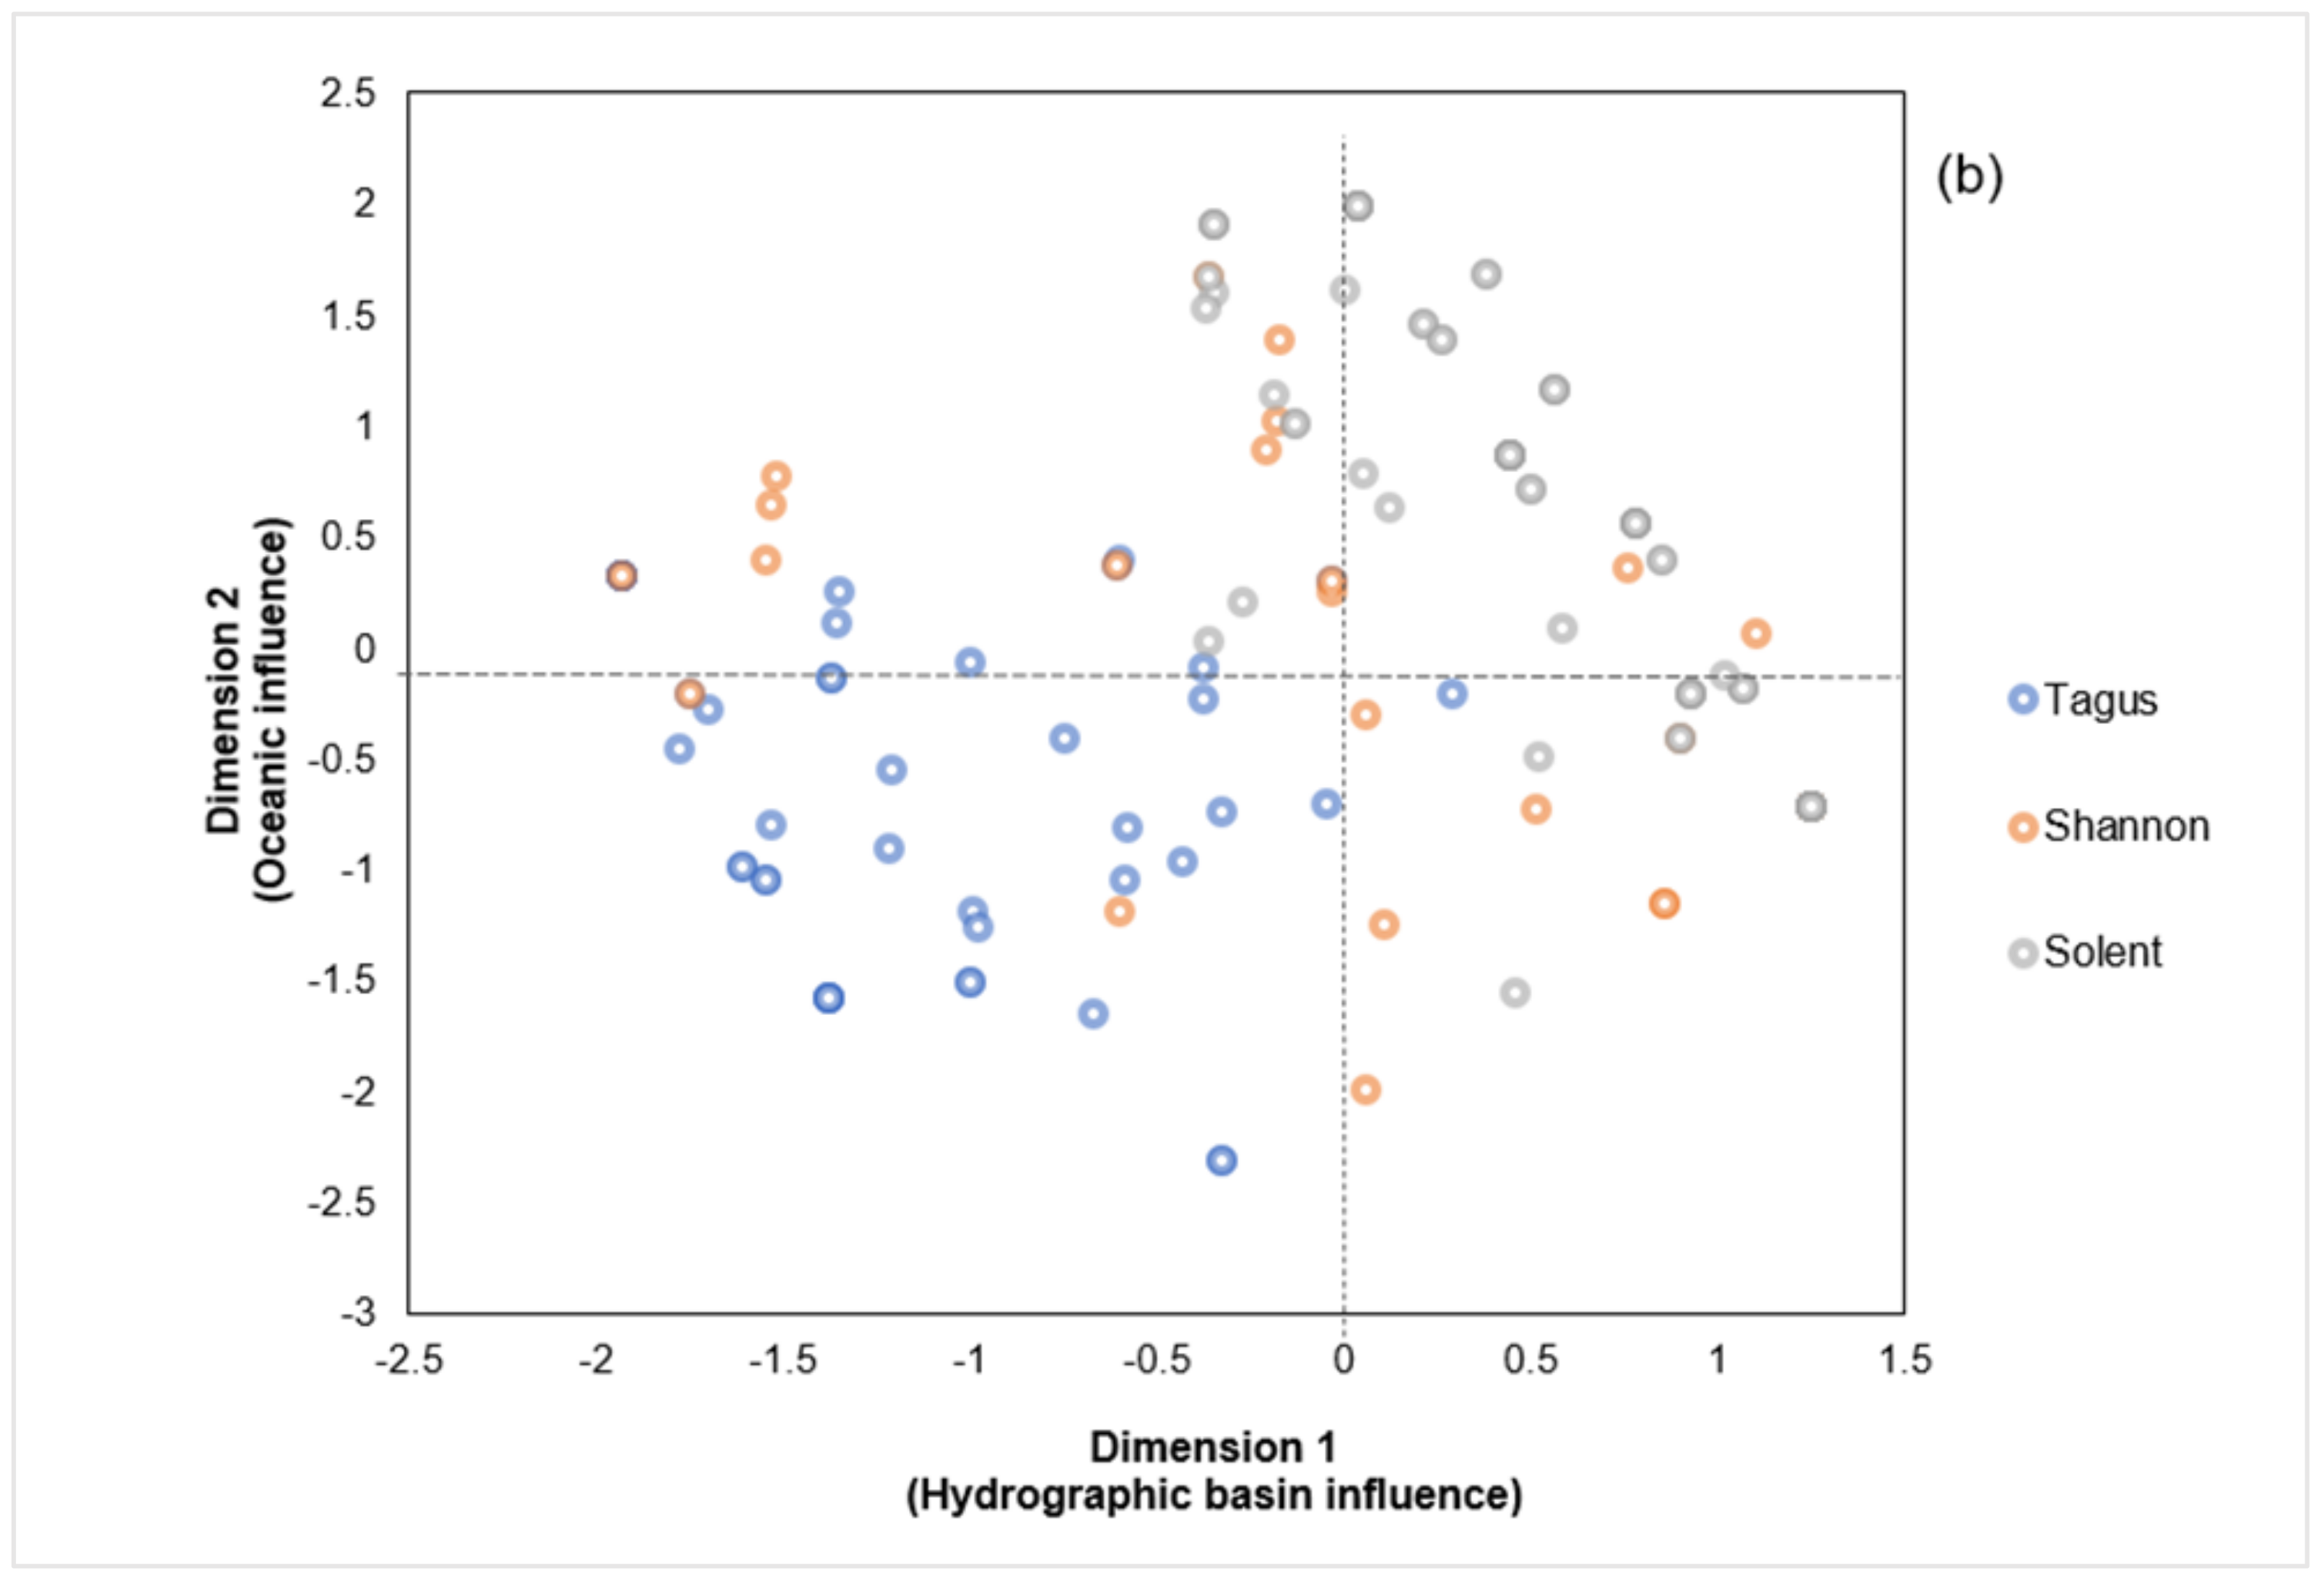
The category analysis (Figure 10a) revealed different combinations of categories representing distinct event profiles. The relative distances between categories were used to identify the event profiles, defined as a set of events sharing similar characteristics. The graphical representation of the events by estuarine system and their relation to both dimensions is shown in Figure 10b, enabling the discovery of associations between event profiles and the identification of the estuarine system.
Hence, events involving the Tagus Estuary are associated with the presence of rainfall, fluvial discharge and deficient urban drainage, as triggers, and with human damages and institutional involvement presence as damages (3rd quadrant). In contrast, most events involving the Solent are associated with the lack of rainfall (1st quadrant), whereas most events involving the Shannon Estuary are related with the presence of low pressure, wind/waves and economic losses (2nd quadrant). The fourth quadrant features denote a set of events, mainly related to the Solent and Shannon, that are characterized by the absence of wind/waves, physical damages, economic losses and function disruption.
4. Discussion
In this paper, a large and diverse set of documentary sources were used to extract flood triggers and damage information in three distinct estuarine systems located in the western European coast with past records of estuarine flooding. As indicated by other studies (e.g., [12,16,66]), documentary sources, also called “soft data” or “historical sources”, proved their usefulness for extracting valuable information regarding flood triggers and damages.
Events involving the Tagus Estuary are largely based on newspaper sources, covering a wide temporal period, with almost all the sources being daily newspapers [20]. The Shannon Estuary is a contrasting case due to the low number of events, which are concentrated in recent years due to missing data. This fact is acknowledged by the source provider (OPW portal), which states that the available list of sources does not represent a complete catalogue of events, and that newspaper sources only reflect the most severe events occurring in the last 120 years. Despite this pitfall, it was possible to register 28 events. Events involving the Solent estuarine system were obtained from a structured source (SurgeWatch; [27]). This fact explains its consistency over time, since SurgeWatch originates from the merging of sea level observations from tide gauge records along the UK coastline with “soft data” sources, particularly a set of selected scientific articles [27]. The obtained spin-off database demonstrates the capacity of researchers to merge and adapt distinct source typologies (structured and unstructured) so as to obtain a regional damage assessment model record that is able to inform public policy options and directives from the local to transnational levels.
The seasonal distribution of events is in accordance with storm and flood occurrences along the western coast of Europe, with a higher frequency of events in the autumn and winter months [67], when atmospheric conditions are prone to storm surge occurrence, wind-generated waves and more abundant precipitation periods, generating a high fluvial discharge. As already observed in other studies (e.g., [18,66]), documentary data, in general, can be a valuable source of information on damages. In contrast, information on flood triggers is more scarce and often limited and unreliable, particularly when newspapers are used as data sources, since this specific type of source usually tends to focus on the description of the damages and accountability rather than on the description of triggers [20]. Although the spin-off database was based on a multiplicity of data sources, the overall results are in line with previous studies [20,38], showing the importance of physical damages, circulation interruption and function disruption as major estuarine flood damage typologies and the presence of rainfall, wind/waves and low pressure as potential indicators of estuarine flood triggers.
The multiple correspondence analysis enabled the exclusion of less significant variables that do not contribute to explaining the final model. Although reported in the sources, especially in the case of Shannon (please refer to Figure S1), high tides were excluded. This is interpreted as a “background” presence in the case of estuaries and therefore is not distinctive as an indicator of flooding.
Regarding damages, the model excluded environmental degradation and circulation interruption. The first influenced a relatively low number of events involving the Solent (please refer to Figure S1), where this type of damage is residual. Circulation interruption, on the other hand, was excluded due to its close relation to function disruption, since they often overlap. Thus, the model exclusion is explained by variable redundancy.
The results revealed two distinct dimensions, enabling a thematic interpretation of the model. Dimension 1 is characterized by a set of indicators closely related to the watershed draining into the estuarine systems, whereas dimension 2 is characterized by indicators related to oceanographic conditions. However, it is noteworthy that trigger indicators are the cornerstone of the interpretation of the thematic meaning of the overall dimensions. These results are in accordance with previous work on the Tagus and Shannon Estuaries [26].
The events involving the Tagus and Solent Estuaries exhibit a distinct pattern, forming different profiles. Events involving the Tagus Estuary are associated with the presence of rainfall, fluvial discharge and deficient urban drainage, as triggers, which have been observed previously by other authors [20,35] as determinants to fully understand the flooding of this estuarine system. The Tagus Estuary is a widely urbanized system, where rainfall patterns in the hydrographic basin, along with the coincidence of short-term rainfall episodes, high tide and a limited capacity for urban drainage, can induce estuarine flooding [68,69,70]. Moreover, fluvial discharge is a relevant flood trigger in the upstream area of the estuary [35]. The presence of human damages and function disruption are in line with the observations of [20].
Events involving the Solent Estuary are characterized mostly by the absence of rainfall, which is in accordance with previous work reporting on the region (e.g., [8,47]), and flooding is mostly related to extreme sea level events caused by low pressure conditions that trigger storm surges. Nevertheless, a recent analysis by [71] of the entire UK coast, assessing the characteristics and drivers of compound flooding events, confirmed the joint occurrence of a high storm surge and high river discharge on the southwestern coast of the UK. Not surprisingly, the spin-off database does not reflect this fact, as the Solent Estuary data are derived from the SurgeWatch database, which primarily seeks to describe coastal flood events linked with high sea levels [27,72]. The limited characterization of the Solent’s profile (lack of rainfall), associated with the absence of any damage as a flood indicator, is explained by the source provider’s intrinsic characteristics (SurgeWatch database) and the fact that it contains limited descriptions of damages in the case of the Solent.
Even though it is affected by a sparsity of data, events involving the Shannon Estuary are mostly characterized by the presence of low pressure and wind waves, along with economic losses. The Irish coast is commonly affected by storms and strong winds [73]. Recently, [40] presented a revised and updated catalogue of extreme wave events along the entire Irish coast, where storm surges also occur, highlighting coastal flooding events due to storm surges in the Shannon Estuary.
Although past flood information is of limited use for the forecasting of future scenarios involving climate change that might affect these areas, the presented profiles are a relevant outcome because they constitute a basis for the diagnosis and management of flood risks. This knowledge can inform tailored measures for application to each estuarine system so as to increase awareness of the potential risks; support resource allocation through early warning systems, emergency preparedness and response situations; and assist with spatial planning activities to reduce exposure to risks. Furthermore, information on past flood events has demonstrated its usefulness for the validation of flood forecasting tools [74].
A critical comment should be made regarding the capacity of the sources to fully explain the abovementioned results. In the case of the Solent, using structured sources as a previously built database to assess the presence of triggers or damages in regard to an estuarine flood event might be reductive and give origin to incomplete outcomes. As already pointed out, the absence of information in the sources prevents us from drawing more extensive and detailed conclusions. Additionally, the previously built database’s content (database fields), along with the primary objective of its creation, influence the type and amount of information that can be extracted.
As other authors have suggested (e.g., [8,75,76]), the most suitable approach to the identification of both triggers and damages, reducing bias and increasing reliability, should combine long-term measured records (e.g., tide gauge data, hydrologic datasets) with documentary sources (e.g., newspapers, reports). Nevertheless, the benefit of this combination is lacking in most cases due to the difficulty involved in simultaneously obtaining measured data for all types of estuarine flood triggers and documentary evidence that is available and consistent over time.
Despite the abovementioned limitations, we can argue that: (i) past flood information is of limited use for the forecasting of future scenarios involving climate change; (ii) the intrinsic characteristics of data sources affect the results; and (iii) the most suitable approach should combine measured records with documentary sources. The presented methodology is proven to be effective for extracting reliable flood event information regarding triggers and damages from a multiplicity of documentary data sources, combining them into a common database and extracting the best explanatory indicators of estuarine flooding. Moreover, the methodology was also able to provide estuarine profiles, offering a comprehensive synthesis of the most important indicators of each system. This outcome is of major importance to flood risk managers, enabling a knowledge basis for the creation of flood risk management options, since it offers information on the types of damages and triggers that are critical for tailored and sustainable estuarine flood management.
It is also relevant that the trigger typology is related to a set of impact typologies that are closely associated with estuarine physical features and the land use of margins. Furthermore, the use of qualitative documentary sources and the multiple correspondence analysis enabled the comparison of contrasting estuarine systems. The approach brought to light a common set of indicators, regardless of the estuarine system, that are crucial in informing flood risk management and prevention though structural and non-structural actions, along with mitigation measures related to estuarine margin spatial planning.
5. Conclusions
This study presented a methodology that can be used to obtain qualitative information extracted from multiple documentary structured and unstructured sources. The approach started with a documentary data gathering exercise and spin-off database construction using content analysis techniques. A multiple correspondence analysis technique was applied to the variables stored in the database, namely flood damages and triggers, and enabled us to explore the information acquired from the categories and their relationships with the dimensions, allowing us to obtain distinct event profiles.
The statistical analysis enabled the extraction of the most relevant indicators regarding estuarine flood triggers and damages. The results revealed that the estuarine flood risk is driven by two distinct dimensions, namely the influence of the hydrographic basin and oceanographic influences, demonstrating the transversal effects of triggers in characterizing the estuarine flood risk. Another relevant outcome was the recognition of distinct estuarine profiles, which are valuable as a means to inform more tailored flood risk measures. A critical analysis was performed on the challenges of using documentary sources, showing that, despite the limitations, qualitative information is useful and valuable data, especially in the context of data scarcity. The combined approach of using qualitive documentary sources and the multiple correspondence analysis enabled the comparison of contrasting estuarine systems and identification of relationships between a set of triggers and a set of damages that are related to land use and estuarine margins’ physical characteristics.
The methodology proved its effectiveness in extracting reliable flood event information from a diverse set of documentary data sources, combining them into a common database structure (spin-off database). Furthermore, it allowed us to obtain the best explanatory indicators of estuarine flooding, regardless of the estuarine system. Additionally, the estuarine profiles offered a comprehensive synthesis and a knowledge basis for estuarine flood risk characterization, and they are valuable as a means to inform tailored and integrated flood risk management options.
Supplementary Materials
The following supporting information can be downloaded at: https://www.mdpi.com/article/10.3390/w14193161/s1, Figure S1 Reported presence and absence of all considered variables before MCA application for each estuarine system. Tagus comprises 44 events, Shannon comprises 27 and Solent comprises 77. Overall, the total number of events are 149.
Author Contributions
Conceptualization, A.R. and A.O.T.; data curation, A.R.; formal analysis, A.R.; funding acquisition, A.O.T., P.F. and J.L.Z.; investigation, A.R.; methodology, A.R. and A.O.T.; project administration, A.O.T., P.F. and J.L.Z.; resources, P.F., J.L.Z. and I.D.H.; supervision, A.O.T., P.F. and J.L.Z.; visualization, A.R.; writing—original draft, A.R.; writing—review & editing, A.R., A.O.T., P.F., J.L.Z. and I.D.H. All authors have read and agreed to the published version of the manuscript.
Funding
This work was funded by national funds through the FCT, the Portuguese Foundation for Science and Technology, I.P. and by the Research Units UIDB/00295/2020 and UIDP/00295/2020. The work was also supported by project MOSAIC.pt (Multi-Source Flood Risk Analysis for Safe Coastal Communities and Sustainable Development (PTDC/CTA-AMB/28909/2017)), funded by the Portuguese Foundation for Science and Technology (FCT), Portugal. The first author benefits from a doctoral grant funded by the Portuguese Foundation for Science and Technology (FCT) (SFRH/BD/111166/2015).
Institutional Review Board Statement
Not applicable.
Informed Consent Statement
Not applicable.
Data Availability Statement
The database described is available upon reasonable request.
Acknowledgments
The authors thank the Administração do Porto de Lisboa (APL), Autoridade Nacional de Emergência e Proteção Civil (ANEPC) and the DISASTER Project (PTDC/CS-GEO/103231/2008), funded by the FCT, for the data provided. The authors would also like to acknowledge the OPW (Office of Public Works, Ireland): contains Office of Public Works information. © Office of Public Works.
Conflicts of Interest
The authors declare no conflict of interest.
References
- Harrison, L.M.; Coulthard, T.J.; Robins, P.E.; Lewis, M.J. Sensitivity of Estuaries to Compound Flooding. Estuaries Coast. 2021, 45, 1250–1269. [Google Scholar] [CrossRef]
- Lee, C.; Hwang, S.; Do, K.; Son, S. Increasing flood risk due to river runoff in the estuarine area during a storm landfall. Estuar. Coast. Shelf Sci. 2019, 221, 104–118. [Google Scholar] [CrossRef]
- Wu, W.; Westra, S.; Leonar, M. Estimating the probability of compound floods in estuarine regions. Hydrol. Earth Syst. Sci. 2021, 25, 2821–2841. [Google Scholar] [CrossRef]
- Del-Rosal-Salido, J.; Folgueras, P.; Bermúdez, M.; Órtega-Sanchez, M.; Losada, M.A. Flood management challenges in transitional environments: Assessing the effects of sea -level rise on compound flooding in the 21st century. Coast. Eng. 2021, 103872. [Google Scholar] [CrossRef]
- Freire, P.; Tavares, A.O.; Sá, L.; Oliveira, A.; Fortunato, A.B.; Dos Santos, P.P.; Rilo, A.; Gomes, J.L.; Rogeiro, J.; Pablo, R.; et al. A local scale approach to estuarine flood risk management. Nat. Hazards 2016, 84, 1705–1739. [Google Scholar] [CrossRef]
- Dritsas, S.E. The effect of sea level rise on coastal populations: The case of Gironde (estuaries of Gironde). Econ. Anal. Policy 2020, 66, 41–50. [Google Scholar] [CrossRef]
- Rodrigues, C.; Fidélis, T. Distinctive features of spatial planning nearby estuaries—An exploratory analysis of water-related rules in municipal master plans in Portugal. Estuar. Coast. Shelf Sci. 2021, 107352. [Google Scholar] [CrossRef]
- Ruocco, A.; Nicholls, R.J.; Haigh, I.D.; Wadey, M.P. Reconstructing coastal flood occurrence combining sea level media sources: A case study of the Solent, UK since 1935. Nat. Hazards 2011, 59, 1773–1796. [Google Scholar] [CrossRef]
- Baart, F.; Bakker, M.A.J.; van Dongeren, A.; den Heijer, C.; van Hateren, S.; Smit, M.W.J.; van Koningsveld, M.; Pool, A. Using 18th century storm-surge data from the Dutch coast to improve the confidence in flood risk estimates. Nat. Hazard. Earth Syst. Sci. 2011, 11, 2791–2801. [Google Scholar] [CrossRef] [Green Version]
- Kjeldsen, T.; Macdonald, N.; Lang, M.; Mediero, L.; Albuquerque, T.; Bogdanowicz, E.; Brázdil, R.; Castellarin, A.; David, V.; Fleig, A.; et al. Documentary evidence of past floods in Europe and their utility in flood frequency estimation. J. Hydrol. 2014, 17, 963–973. [Google Scholar] [CrossRef]
- Taylor, F.E.; Malamud, B.D.; Freeborough, K.; Demeritt, D. Enriching Great Britain’s National Landslide Database by searching newspaper archives. Geomorphology 2015, 249, 52–68. [Google Scholar] [CrossRef] [Green Version]
- Zêzere, J.L.; Pereira, S.; Tavares, A.O.; Bateira, C.; Trigo, R.M.; Quaresma, I.; Santos, P.P.; Santos, M.; Verde, J. DISASTER: A GIS database on hydro-geomorphologic disasters in Portugal. Nat. Hazards 2014, 72, 503–532. [Google Scholar] [CrossRef]
- Escobar, M.P.; Vinogradova, M.; Demeritt, D. Using Newspapers as a Source of Data to Assess Flood Impacts: Methodology Note; Department of Geography, Kings College: London, UK, 2016; Available online: http://www.naturalhazardspartnership.org.uk/wp-content/uploads/2016/10/Methodology-note-on-impact-scoring-final.pdf (accessed on 18 June 2022).
- Llasat, M.C.; Llasat-Botija, M.; López, L. A press database on natural risks and its application in the study of floods in Northeastern Spain. Nat. Hazards Earth Syst. Sci. 2009, 9, 2049–2061. [Google Scholar] [CrossRef] [Green Version]
- Hilker, N.; Badoux, A.; Hegg, C. The Swiss flood and landslide damage database 1972–2007. Nat. Hazards Earth Syst. Sci. 2009, 9, 913–925. [Google Scholar] [CrossRef] [Green Version]
- Santos, P.P.; Tavares, A.O.; Zêzere, J.L. Risk analysis for local management from hydro-geomorphologic disaster databases. Environ. Sci. Policy 2014, 40, 85–100. [Google Scholar] [CrossRef]
- ETC-CCA Towards a Potential European Flood Impact Database; EEA–JRC–ETC/CCA Joint Technical Paper. Version: 5.0.; ETC/CCA: Bologna, Italy, 2013; 41p, Available online: https://www.eionet.europa.eu/etcs/etc-cca/products/etc-cca-reports/eea_jrc_etc-cca-20jtp (accessed on 18 June 2022).
- Ibsen, M.L.; Brunsden, D. The nature, use and problems of historical archives for the temporal occurrence of landslides, with specific reference to the south coast of Britain, Ventnor, Isle of Wight. Geomorphology 1996, 15, 241–258. [Google Scholar] [CrossRef]
- Romão, X.; Paupério, E. A framework to assess quality and uncertainty in disaster loss data. Nat. Hazards 2016, 83, 1077–1102. [Google Scholar] [CrossRef] [Green Version]
- Rilo, A.; Tavares, A.; Freire, P.; Santos, P.P.; Zêzere, J.L. The contributions of historical information to flood risk management in the Tagus estuary. Int. J. Disaster Risk Reduct. 2017, 25, 22–35. [Google Scholar] [CrossRef]
- Marôco, J. Statistical Analysis Using SPSS, 6th ed.; ReportNumber: Pêro Pinheiro, Portugal, 2014; 990p. (In Portuguese) [Google Scholar]
- Carvalho, H. Multivariate Analysis of Qualitative Data. Using Multiple Correspondence Analysis with SPSS, 2nd ed.; Edições Sílabo: Lisboa, Portugal, 2017; 260p. (In Portuguese) [Google Scholar]
- Ali, F.; Dissanayake, D.; Bell, M.; Farrow, M. Investigating car users attitudes to climate change using multiple correspondence analysis. J. Transp. Geogr. 2018, 72, 237–247. [Google Scholar] [CrossRef]
- Ayala, D.H.F.; Alberton, A.; Ersoy, A. Urban living labs: Pathways of sustainability transitions towards innovative city systems from a circular economy perspective. Sustainability 2022, 14, 9831. [Google Scholar] [CrossRef]
- Silva, S.A.; Carvalho, H.; Oliveira, M.J.; Fialho, T.; Guedes Soares, C.; Jacinto, C. Organizational practices for learning with work accidents throughout their information cycle. Saf. Sci. 2017, 99, 102–114. [Google Scholar] [CrossRef]
- Rilo, A.; Tavares, A.; Freire, P.; Zêzere, J.L. Dealing with Multisource Information for Estuarine Flood Risk Appraisal in Two Western European Coastal Areas. Int. J. Disaster Risk Sci. 2022, 13, 199–213. [Google Scholar] [CrossRef]
- Haigh, I.D.; Ozsoy, O.; Wadey, M.P.; Nicholls, R.; Gallop, S.L.; Wahl, T.; Brown, J. An improved database of coastal flooding in the United Kingdom from 1915 to 2016. Sci. Data 2017, 4, 170100. [Google Scholar] [CrossRef] [PubMed] [Green Version]
- Pritchard, D.W. What is an estuary: Physical viewpoint. In Estuaries; Lauff., G.H., Ed.; American Association for the Advancement of Science Publication: Washington, DC, USA, 1967; Volume 83, pp. 3–5. [Google Scholar]
- Dalrymple, R.W.; Zaitlin, B.A.; Boyd, R. Estuarine facies model: Conceptual basis and stratigraphic implications. J. Sediment. Petrol. 1992, 62, 1130–1146. [Google Scholar] [CrossRef]
- Dyer, K.R. Estuaries—A Physical Introduction, 2nd ed.; Wiley: Chichester, UK, 1997; 195p. [Google Scholar]
- Davidson, N.C.; Laffoley, D.A.; Doody, J.P.; Way, L.S.; Gordon, J.; Key, R.; Pienkowsky, M.W.; Mitchell, R.; Duff, K. Nature Conservations and Estuaries in Great Britain, 1st ed.; Joint Nature Conservation Committee: Peterborough, UK, 1991; 422p. [Google Scholar]
- Fortunato, A.; Li, K.; Bertin, X.; Rodrigues, M.; Miguez, B.M. Determination of extreme sea levels along the Iberian Atlantic coast. Ocean Eng. 2016, 111, 471–482. [Google Scholar] [CrossRef] [Green Version]
- Guerreiro, M.; Fortunato, A.B.; Freire, P.; Rilo, A.; Taborda, R.; Freitas, M.C.; Andrade, C.; Silva, T.; Rodrigues, M.; Bertin, X.; et al. Evolution of the hydrodynamics of the Tagus estuary (Portugal) in the 21st century. Revista de Gestão Costeira Integrada. J. Integr. Coast. Zone Manag. 2015, 15, 65–80. [Google Scholar] [CrossRef]
- Freire, P.; Andrade, C. Wind-induced sand transport in Tagus estuarine beaches–First results. Aquat. Ecol. 1999, 33, 25–233. [Google Scholar] [CrossRef]
- Vargas, C.I.C.; Oliveira, F.S.B.F.; Oliveira, A.; Charneca, N. Análise da vulnerabilidade de uma praia estuarina à inundação: Aplicação à restinga do Alfeite (estuário do Tejo). Rev. Gestão Costeira Integr. J. Integr. Coast. Zone Manag. 2008, 8, 25–43. [Google Scholar] [CrossRef] [Green Version]
- INE (National Statistics Institute). Área Metropolitana de Lisboa in figures–2017; INE: Lisboa, Portugal, 2019; pp. 13–14. Available online: https://www.ine.pt/ine_novidades/RN2017/lisboa/2/ (accessed on 18 June 2022)(In Portuguese and English).
- Muir-Wood, R. The 1941 February 15th Windstorm in the Iberian Peninsula. Treból 2011, 56, 4–13. Available online: https://app.mapfre.com/mapfrere/docs/html/revistas/trebol/n56/docs/Articulo1en.pdf (accessed on 18 June 2022).
- Rilo, A.; Tavares, A.O.; Freire, P.; Zêzere, J.L.; Haigh, I.D. Enhancing estuarine flood risk management: Comparative analysis of three estuarine systems. J. Coast Res. 2020, 95, 935–939. [Google Scholar] [CrossRef]
- MacClenahan, P.; McKenna, J.; Cooper, A.; O’Kane, O. Identification of highest magnitude coastal storm events over western Ireland on the basis of wind speed and duration thresholds. Int. J. Climatol. 2001, 21, 829–842. [Google Scholar] [CrossRef]
- O’Brien, L.; Renzi, E.; Dudley, J.M.; Clancy, C.; Dias, F. Catalogue of extreme wave events in Ireland: Revised and updated for 14680 BP to 2017. Nat. Hazards Earth Syst. Sci. 2018, 18, 729–758. [Google Scholar] [CrossRef] [Green Version]
- Healy, M. The Shannon estuary wetlands complex, Western Ireland: Conservation and conflicts. In Proceedings of the Littoral 2002, 6th International Symposium Proceedings: A Multi-disciplinary Symposium on Coastal Zone Research, Management and Planning, Porto, Portugal, 22–26 September 2002; Gomes, F.V., Taveira Pinto, F., das Neves, L., Eds.; EUCC/EUROCOAST: Porto, Portugal, 2002; Volume 2, pp. 229–233. [Google Scholar]
- Wheeler, A.; Healy., M. Coastal landscapes and environmental change in the Shannon estuary. In Foragers, Farmers and Fishers in a Coastal Landscape: An Intertidal Archaeological Survey of the Shannon Estuary, 1st ed.; O’Sullivan, A., Ed.; The Royal Irish Academy: Dublin, Ireland, 2001; pp. 40–54. [Google Scholar]
- Sheehan, T.L.; Healy, M.G. Sub-recent changes in annual average water level in the Shannon estuary, Western Ireland. J. Coast Res. 2006, 39, 193–197. Available online: https://www.jstor.org/stable/25741560 (accessed on 18 June 2022).
- CSO (Central Statistics Office). Census 2016 Summary Results—Part 1. In Central Statistics Office, Ireland; 2017; 107p., Available online: https://www.cso.ie/en/media/csoie/newsevents/documents/census2016summaryresultspart1/Census2016SummaryPart1.pdf (accessed on 18 June 2022).
- Fletcher, S.; Johnson, D.; Hewett, T. Coastal management in the Solent: An introduction. Mar. Policy 2007, 31, 585–590. [Google Scholar] [CrossRef]
- Ozsoy, O.; Haigh, I.; Wadey, M.; Nicholls, R.J.; Wells, N.C. High-frequency Sea level variations and implications for coastal flooding: A case study of the Solent. Cont. Shelf Res. 2016, 122, 1–13. [Google Scholar] [CrossRef] [Green Version]
- Wadey, M.P.; Nicholls, R.J.; Haigh, I. Understanding a coastal flood event. The 10th March 2008 storm surge event in the Solent, UK. Nat. Hazards 2013, 67, 829–854. [Google Scholar] [CrossRef]
- Webber, N.B. Hydrography and water circulation in the Solent. In The Solent Estuarine System: An Assessment of Present Knowledge; NERC, The Natural Environment Research Council: Swindon, UK, 1980. [Google Scholar]
- Foster, N.M.; Hudson, M.D.; Bray, S.; Nicholls, R.J. Research, policy and practice for the conservation and sustainable use of intertidal mudflats and saltmarshes in the Solent from 1800–2016. Environ. Sci. Policy 2014, 38, 59–71. [Google Scholar] [CrossRef]
- Bowen, G.A.; Rowley, J.; Healy, M.; Perry, C. Document Analysis as a Qualitative Research Method. Qual. Res. J. 2009, 9, 27–40. [Google Scholar] [CrossRef] [Green Version]
- Haltas, I.; Yildirim, E.; Oztas, F.; Demir, I. A comprehensive flood event specification and inventory: 1930-2020. Turkey case study. Int. J. Disaster Risk Reduct. 2021, 56, 102086. [Google Scholar] [CrossRef]
- OPWs National Flood Information Portal, Providing Location Specific Access to Flood Risk and Flood Management Information. 2022. Available online: http://www.floodinfo.ie/ (accessed on 18 June 2022).
- Rilo, A.; Freire, P.; Nogueira Mendes, R.; Ceia, R.; Catalão, J.; Taborda, R.; Melo, R.; Caçador, M.I.; Freitas, M.C.; Fortunato, A.B.; et al. Methodological framework for the definition and demarcation of the highest astronomical tide line in estuaries: The case of Tagus Estuary (Portugal). Rev. Gestão Costeira Integr. J. Integr. Coast. Zone Manag. 2014, 14, 95–107. (In Portuguese) [Google Scholar] [CrossRef] [Green Version]
- JACOBS. Unit of Management 24: Shannon Estuary South. Flood History and Key Environmental Issues. Strategic Environmental Assessment–Scoping Report [Consultation Draft]–Annex II. Ireland: Office of Public Works. 2012. Available online: https://s3-eu-west-1.amazonaws.com/docs.floodinfo.opw/floodinfo_docs/Shannon_CFRAM/UOM24/10_SEAStatement/SEAS_Final2018_RiverBasin_24.pdf (accessed on 22 June 2022).
- JACOBS. Unit of Management 25–26: Shannon Estuary Upper & Lower. Flood History and Key Environmental Issues. Strategic Environmental Assessment–Scoping Report [Consultation Draft]–Annex III. Ireland: Office of Public Works. 2012. Available online: http://shannoncframstudy.jacobs.com/docs/sea/TD_ENVT_0317_V1_C_JAC_Env_Scoping_AnnexIII_UoM25-26_120919.pdf (accessed on 22 June 2022).
- JACOBS. Unit of Management 27–28: Shannon Estuary North and Mal Bay. Flood History and Key Environmental Issues. Strategic Environmental Assessment–Scoping Report [Consultation Draft]–Annex IV. Ireland: Office of Public Works. 2012. Available online: http://shannoncframstudy.jacobs.com/docs/sea/TD_ENVT_0318_V1_C_JAC_EnvScopingAnnexIV_UoM27-28_120919.pdf (accessed on 22 June 2022).
- New Forest District Council 2012 Update of Carter, D., Bray, M., & Hooke, J., 2004 SCOPAC Sediment Transport Study. 2017. Available online: https://www.scopac.org.uk/sts/ (accessed on 22 June 2022).
- Chun, D. The River Hamble: A History, 2nd ed.; The History Press: Gloucestershire, UK, 2014; 128p. [Google Scholar]
- NRA National Rivers Authority. River Test Catchment Management Plan Phase 1; NRA Southern 17; NRA National Rivers Authority Southern Region: Bristol, UK, 1991; 133p.
- CEFAS Centre for Environment Fisheries & Aquaculture Science. Review of the Beaulieu River 2009 Sanitary Survey. In Cefas Report on behalf of the Food Standards Agency, to Demonstrate Compliance with the Requirements for Classification of Bivalve Mollusc Production Areas in England and Wales under EC Regulation No. 854/2004; CEFAS: Lowestoft, UK, 2015; 49p, Available online: https://www.cefas.co.uk/media/2lbf22m3/beaulieu-river-sanitary-survey-review-2015-final-table-issue-dj.pdf (accessed on 23 June 2021).
- CEFAS Centre for Environment Fisheries & Aquaculture Science. Sanitary Survey of Lymington Estuary. In Cefas Report on behalf of the Food Standards Agency, to Demonstrate Compliance with the Requirements for Classification of Bivalve Mollusc Production Areas in England and Wales under EC regulation No. 854/2004; CEFAS: Lowestoft, UK, 2013; 83p, Available online: https://www.cefas.co.uk/media/iajibg2w/lymington-sanitary-survey-report-final-passed-dj.pdf (accessed on 23 June 2021).
- Bardin, L. Content Analysis, 4th ed.; Edições 70: Lisboa, Portugal, 2020; 279p. (In Portuguese) [Google Scholar]
- Krippendorff, K. Content Analysis: An Introduction to Its Methodology, 2nd ed.; Sage Publications, Inc.: Thousand Oaks, CA, USA, 2004. [Google Scholar]
- Nunnaly, J.C. Psychometric Theory, 2nd ed.; MacGraw-Hill: New York, NY, USA, 1978; 700p. [Google Scholar]
- Kaplan, R.D.; Saccuzzo, D.P. Psychological Testing: Principles, Applications and Issues; Brooks/Cole Publishing Company: Monterey, CA, USA, 1982. [Google Scholar]
- Williams, A.; Archer, D. The use of historical information in the English midlands to improve risk assessment. Hydrol. Sci. J. 2002, 47, 67–76. [Google Scholar] [CrossRef]
- Hall, J.; Blöschl, G. Spatial patterns and characteristics of flood seasonality in Europe. Hydrol. Earth Syst. Sci. 2018, 22, 3883–3901. [Google Scholar] [CrossRef]
- Ramos, C.; Reis, E. Floods in southern Portugal: Their physical and human causes, impacts and human response. Mitig. Adapt. Strateg. Glob. Chang. 2002, 7, 267–284. [Google Scholar] [CrossRef] [Green Version]
- Trigo, R.M.; Varino, F.; Ramos, A.M.; Valente, M.A.; Zêzere, J.L.; Vaquero, J.M.; Gouveia, C.M.; Russo, A. The record precipitation and flood event in Iberia in December 1876: Description and synoptic analysis. Front. Earth Sci. 2014, 2, 3. [Google Scholar] [CrossRef] [Green Version]
- Cardoso, M.A.; Almeida, M.C.; Brito, R.S.; Beceiro, P. Modelação integrada da drenagem urbana em zonas estuarinas: Avaliação da inundação para cenários climatéricos. In Proceedings of the 10th Encontro Nacional de Entidades Gestoras de Água e Saneamento, Porto, Portugal, 1–4 December 2015. (In Portuguese). [Google Scholar]
- Hendry, A.; Haigh, I.; Nicholls, R.; Winter, H.; Neal, R.; Wahl, T.; Joly-Laugel, A.; Darby, S. Assessing the characteristics and drivers of compound flooding events around the UK coast. Hydrol. Earth Syst. Sci. 2019, 23, 3117–3139. [Google Scholar] [CrossRef] [Green Version]
- Haigh, I.D.; Wadey, M.P.; Gallop, S.; Loehr, H.; Nicholls, R.; Horsburgh, K.; Brown, J.; Bradshaw, E. A user-friendly database of coastal flooding in the United Kingdom from 1915–2014. Sci. Data 2015, 2, 150021. [Google Scholar] [CrossRef] [PubMed] [Green Version]
- O’Brien, L.; Dudley, M.J.; Dias, F. Extreme wave events in Ireland: 14680 BP–2012. Nat. Hazards Earth Syst. Sci. 2013, 13, 625–648. [Google Scholar] [CrossRef] [Green Version]
- Fortunato, A.B.; Freire, P.; Bertin, X.; Rodrigues, M.; Ferreira, J.; Liberato, M.L.R. A numerical study of the February 15, 1941 storm in the Tagus estuary. Cont. Shelf Res. 2017, 144, 50–64. [Google Scholar] [CrossRef]
- Macdonald, N. An Underutilized Resource: Historical Flood Chronologies a Valuable Resource in Determining Periods of Hydro-Geomorphic Change. In Proceedings of the IAHS/ICCE International Symposium on Sediment Dynamic and the Hydromorphology of Fluvial Systems, Dundee, Scotland, 3–7 July 2006; Dundee University: Dundee, Scotland, 2006; Volume 306, pp. 120–126. Available online: https://iahs.info/uploads/dms/13541.19-120-126-25-306-Macdonald.pdf (accessed on 18 June 2022).
- Macdonald, N.; Black, A.R. Reassessment of flood frequency using historical information for the river ouse at York, UK (1200-2000). Hydrol. Sci. J. 2010, 55, 1152–1162. [Google Scholar] [CrossRef]
Figure 1.
Tagus Estuary geographical context (right panel). Land use cover map retrieved from Corine Land Cover 2018, level 2 disaggregation, with the color scheme chosen by the authors (left panel). © European Union, Copernicus Land Monitoring Service 2018, European Environment Agency (EEA).
Figure 1.
Tagus Estuary geographical context (right panel). Land use cover map retrieved from Corine Land Cover 2018, level 2 disaggregation, with the color scheme chosen by the authors (left panel). © European Union, Copernicus Land Monitoring Service 2018, European Environment Agency (EEA).

Figure 2.
Shannon Estuary geographical context (right panel). Land use cover map retrieved from Corine Land Cover 2018, level 2 disaggregation, with the color scheme chosen by the authors (left panel). © European Union, Copernicus Land Monitoring Service 2018, European Environment Agency (EEA).
Figure 2.
Shannon Estuary geographical context (right panel). Land use cover map retrieved from Corine Land Cover 2018, level 2 disaggregation, with the color scheme chosen by the authors (left panel). © European Union, Copernicus Land Monitoring Service 2018, European Environment Agency (EEA).

Figure 3.
Solent estuarine system geographical context (right panel). Land use cover map retrieved from Corine Land Cover 2018, level 2 disaggregation, with the color scheme chosen by the authors (left panel). © European Union, Copernicus Land Monitoring Service 2018, European Environment Agency (EEA).

Figure 4.
Spin-off estuarine flood event database construction process.

Figure 5.
Spin-off estuarine flood event database structure and model data. NULL/YES nomenclature stands the for absence or presence of certain information.
Figure 5.
Spin-off estuarine flood event database structure and model data. NULL/YES nomenclature stands the for absence or presence of certain information.

Figure 6.
Number of events by source type for the Tagus Estuary (a), Shannon Estuary (b) and Solent estuarine system (c).
Figure 6.
Number of events by source type for the Tagus Estuary (a), Shannon Estuary (b) and Solent estuarine system (c).

Figure 7.
(a) Spin-off database temporal coverage by estuarine system (some years contain more than one event, which is not show in figure). For the temporal coverage and number of events by estuary, please refer to Table 1 in Section 3. (b) Characterization of the spin-off database distribution by month and by estuarine system.

Figure 8.
Presence of information in the spin-off database: (a) trigger types and (b) damage types.

Figure 9.
Model graphical representation showing the final dimensions, along with discrimination measures, for the considered variables.
Figure 9.
Model graphical representation showing the final dimensions, along with discrimination measures, for the considered variables.

Figure 10.
(a) Graphical representation of the most informative categories and their relationships with the dimensions. (b) Graphical representation of objects (events) by estuarine system and their relationship with the dimensions.
Figure 10.
(a) Graphical representation of the most informative categories and their relationships with the dimensions. (b) Graphical representation of objects (events) by estuarine system and their relationship with the dimensions.


Table 1.
Documentary sources and typology for each estuarine system. Number of events and temporal coverage by estuarine system.
Table 1.
Documentary sources and typology for each estuarine system. Number of events and temporal coverage by estuarine system.
| Estuarine System | Data Source Providers | Source Typology | Events (n) | Temporal Period (Years) |
|---|---|---|---|---|
| Tagus | DISASTER project; National Authority for Emergency and Civil Protection (ANEPC); Lisbon Port Authority | Mainly national newspapers; photographs; ANEPC database | 44 | 1865–2013 |
| Shannon | Irish National Flood Hazard Mapping Website (www.floodmaps.ie, accessed on 18 June 2022), OPW site | Reports, newspapers, minute meetings, photographs, letters/institutional correspondence | 28 | 1927–2014 |
| Solent | SURGEWATCH database (https://www.surgewatch.org/, accessed on 18 June 2022) | Soft data: articles, newspapers, reports Hard data: tide gauge data | 77 | 1916–2016 |
Table 2.
Criteria used to identify estuarine flood events in the documentary sources.
| Location | Criteria |
|---|---|
| Tagus Estuary | Geographic constraint: area between Oeiras and Vila Franca de Xira (upstream limit of the salt intrusion) and between the highest astronomical tide line [53] the upper limit of the intertidal domain and 20 m above mean sea level [20]. |
| Shannon Estuary | First step: we removed documents that were not related to estuarine floods. This extraction was performed using additional documentary proxies [54,55,56] and the OPW website (http://www.floodinfo.ie/map/floodmaps/) accessed on 18 June 2022. Geographic constraint: area between Loop Head and the city of Limerick (tidal limit), whose description is clearly connected with estuarine flooding. |
| Solent estuarine system | Geographic constraint: area between Hurst Spit and Selsey Bill, including Southampton Water and the north coast of the Isle of Wight. Were considered inland limits as the locations near the tidal limit of the major rivers that discharge into Solent, namely: River Itchen—Woodlmill bridge [57]; River Hamble—Botley [58]; River Test—Testwood [59]; River Beaulieu—Beaulieu village [60]; and river Lymington—tidal gates at Lymington [61]. |
Table 3.
Information groups and description of coding variables.
| Group | Variables | Description |
|---|---|---|
| Documentary sources and geographic information | ID | Unique identifier |
| Date | Day, month, and year when available. Other options include month and year | |
| Source typology | Newspaper, report, letter, minute meeting, photograph, scientific article, book | |
| Source name | Newspaper name, title of report/minute meeting or letter | |
| City/village/location name | Specify the location referenced in the sources | |
| County or municipality | Specify the county or municipality | |
| Trigger information | Low pressure | Specify whether the source refers to low pressure or a storm surge during the event. It is assumed that, if there is a storm surge, low pressure conditions must exist |
| Wind/waves | Specify whether the source refers to strong wind or waves during the event (e.g., gale force winds, severe gusts, wave action) | |
| Rainfall | Specify whether the source refers to rainfall occurrence prior or during the event. | |
| Fluvial discharge | Specify whether the source refers to fluvial discharge prior to or during the event | |
| High tide | Specify whether the source refers to high tides during the event | |
| Urban drainage and other anthropogenic factors | Specify whether the source refers to deficient urban drainage during the event. (e.g., sewer failure) or other factors, such as breaking walls | |
| Damage information | Physical damages | Specify whether the source refers to damage to built infrastructure (e.g., houses, garages, walls, sidewalks, etc.) |
| Economic losses | Specify whether the source refers to direct economic costs in euros or another currency | |
| Human damages | Specify whether the sources refers to human damage (human damage typology: deceased, missing people, injured, evacuated, displaced, confined and homeless) | |
| Circulation interruption | Specify whether the source refers to any typology of circulation interruption (e.g., roads, railways, boat, airports) | |
| Functions disruption | Specify whether the source refers to any social function interruption (e.g., roads closed, power failures, telephone wires down, schools or public services closed) | |
| Environmental degradation | Specify whether the source refers to environmental degradation left by the event, namely, gravel, sand, debris, wreckage | |
| Institutional involvement | Specify whether the source refers to institutional involvement during or after the event (e.g., fire brigades, civil protection services, municipalities) |
Table 4.
Nomenclature used in multiple correspondence analysis and their correspondence with the data.
Table 4.
Nomenclature used in multiple correspondence analysis and their correspondence with the data.
| Nomenclature in MCA | Description | Characterization |
|---|---|---|
| Objects | Objects are the database entries, in this case, the flood events | 149 objects |
| Variables | Variables correspond to the database fields (e.g., low pressure, wind/waves, rainfall, physical damages, human damages, etc.) | 13 variables |
| Categories | Correspond to the presence or absence of certain information | The 2 categories are YES if present/NULL if absent |
Table 5.
Model summary and discrimination measures.
| Model Summary | ||||
|---|---|---|---|---|
| Dimensions | Cronbach’s Alpha | Variance Accounted for | ||
| Total (Eigenvalue) | Inertia | % of Variance | ||
| 1 | 0.843 | 4.146 | 0.415 | 41.461 |
| 2 | 0.534 | 1.924 | 0.192 | 19.244 |
| Total | 6.071 | 0.607 | ||
| Mean | 0.745a | 3.035 | 0.304 | 30.353 |
| a. Mean Cronbach’s alpha is based on the mean eigenvalue. | ||||
| Discrimination Measures | ||||
| Dimension | Mean | |||
| 1 | 2 | |||
| Rainfall | 0.625 | 0.132 | 0.378 | |
| Wind/waves | 0.214 | 0.316 | 0.265 | |
| Low pressure | 0.120 | 0.233 | 0.177 | |
| Fluvial discharge | 0.598 | 0.164 | 0.381 | |
| Urban & others | 0.547 | 0.076 | 0.312 | |
| Physical damages | 0.407 | 0.219 | 0.313 | |
| Economic losses | 0.092 | 0.544 | 0.318 | |
| Human damages | 0.476 | 0.004 | 0.240 | |
| Function disruption | 0.486 | 0.080 | 0.283 | |
| Institutional involvement | 0.581 | 0.156 | 0.369 | |
| Total active | 4.146 | 1.924 | 3.035 | |
| % of variance | 41.461 | 19.244 | 30.353 | |
Publisher’s Note: MDPI stays neutral with regard to jurisdictional claims in published maps and institutional affiliations. |
© 2022 by the authors. Licensee MDPI, Basel, Switzerland. This article is an open access article distributed under the terms and conditions of the Creative Commons Attribution (CC BY) license (https://creativecommons.org/licenses/by/4.0/).
Share and Cite
MDPI and ACS Style
Rilo, A.; Tavares, A.O.; Freire, P.; Zêzere, J.L.; Haigh, I.D. Improving Estuarine Flood Risk Knowledge through Documentary Data Using Multiple Correspondence Analysis. Water 2022, 14, 3161. https://doi.org/10.3390/w14193161
AMA Style
Rilo A, Tavares AO, Freire P, Zêzere JL, Haigh ID. Improving Estuarine Flood Risk Knowledge through Documentary Data Using Multiple Correspondence Analysis. Water. 2022; 14(19):3161. https://doi.org/10.3390/w14193161
Chicago/Turabian StyleRilo, Ana, Alexandre Oliveira Tavares, Paula Freire, José Luís Zêzere, and Ivan D. Haigh. 2022. "Improving Estuarine Flood Risk Knowledge through Documentary Data Using Multiple Correspondence Analysis" Water 14, no. 19: 3161. https://doi.org/10.3390/w14193161
Note that from the first issue of 2016, this journal uses article numbers instead of page numbers. See further details here.