
Hydrogeochemical Characteristics of a Multi-Layer Groundwater System in a Coal Mine Area: A Case Study


1
School of Resources and Geosciences, China University of Mining and Technology, Xuzhou 221116, China
2
Beijing Exploration Resources Technology Co., Ltd., Beijing 100160, China
3
Shandong Energy Group Yanzhou Coal Mining Company Limited Dongtan Coal Mine, Zoucheng 273512, China
*
Authors to whom correspondence should be addressed.
Water 2022, 14(19), 3146; https://doi.org/10.3390/w14193146
Submission received: 1 September 2022
/
Revised: 29 September 2022
/
Accepted: 1 October 2022
/
Published: 6 October 2022
(This article belongs to the Special Issue The Research on Effects of Coal Mining on Groundwater Environment and System)
Abstract
:The Yanzhou coalfield is an important coal production base in north China, wherein a huge amount of mine drainage has occurred; however, there has been relatively little research on the multi-layer groundwater system. In this study, the Dongtan Coal Mine was considered as the research object and a total of 95 samples were collected. Furthermore, hydrogeochemical and statistical methods were employed to better understand the hydrogeochemical characteristics of the groundwater system in the Yanzhou coalfield. The results show that the groundwater in the area is alkaline. The Ordovician limestone aquifer is quite different from the other aquifers, and the karst herein shows regional distribution characteristics. During the hydrogeochemical evolution of the groundwater, more carbonate and sulfate dissoluted, more cation exchanged, and a lesser extent of silicate weathering and halite dissolution occurred. A conceptual hydrogeological model was created. It shows that the changes in the drainage conditions further resulted in the water chemistry being complex, and induced the hydrogeochemical evolution. The changes in the groundwater dynamic field and the hydrochemical field should be studied to better understand the evolution of the hydrogeochemical properties and accordingly make preparations for preventing mine water disasters and environmental pollution.
1. Introduction
China is a major coal producer, and in the coming decades, coal will remain an important economic source in China [1,2,3]. However, China has limited water resources and its average per capita water resource is about 30% of the world’s average; therefore, studies on the development and scientific use of the groundwater in China are urgently required. It is known that a large amount of mine water is discharged in the process of mining [4,5]; however, poor quality water from mining operations can degrade fresh water resources and potentially impact sensitive environments and ecosystems. Nonetheless, after simple treatment, most of it is used only for fire control and dusting spray, which results in significant waste. Moreover, unpredictable water inrushes in mines also bring significant safety risks to coal mine production and can cause serious economic losses and casualties [6,7,8,9,10,11]. Therefore, it is of great practical significance to study the hydrogeochemical properties of groundwater in mines [12]. Reghunath et al. [13] proposed Q- and R-mode factor and cluster analysis to study the hydrochemical evolution of the Nethravathi river basin’s groundwater and showed that an exchange of water occurred between the river water and the adjacent groundwater. Moreover, they also illustrated the usefulness of statistical analysis to improve the understanding of groundwater systems. Cidu et al. [14] carried out hydrogeochemical surveys to investigate the impact of past mining activities on the quality of groundwater in SW Sardinia (Italy). They showed that mine drainage exhibited a certain impact on the external water quality, and proposed means to strengthen the attention paid to mine drainage. Li et al. [15] conducted a hydrogeochemical study in the Dongsheng Coalfield, Ordos Basin, China, by using Tri-linear diagrams, principal component analysis, and correlation analysis, and concluded that the shallow groundwater that was affected by the chemical weathering of rock-forming minerals was generally suitable for agricultural use and human consumption. Arkoc [16] compared the chemical composition, trace metal, and microbiological quality of some water samples following international directives and found that the surface and groundwater within the study area were not polluted by coal mining operations. Qiao et al. [17] investigated the trace element content and evolution of the mine drainage water at the Xinglongzhuang Coal Mine in the Shandong Province of China with an ion analysis, multivariate statistical techniques, and correlation analyses and also proposed a potential model outlining the hydrogeochemical evolution of the groundwater in the study area. Qiu et al. [18] proposed a fuzzy analytical hierarchy process (AHP) that combined a fuzzy analysis model and an AHP model to quantitatively evaluate the water quality of shallow groundwater and mid-layer groundwater in the Sulin coal-mining district. However, although many research methods and achievements have been reported for the groundwater systems affected by mining [19,20,21,22,23,24,25], a comprehensive understanding of the hydrogeochemical properties of groundwater is still lacking in general [26,27].
The Yanzhou coalfield is an important coal production base in northern China. The mined coal seam is mainly located in the Carboniferous-Permian coalfields. The Carboniferous Taiyuan group multi-layer limestone aquifer and the Ordovician limestone aquifers are rich in water content, and the hydraulic connection between them is complex; therefore, it is a research focus in mine water disaster prevention and control. Over the years, the research on Yanzhou coalfield has mainly focused on the hydrogeology and hydrochemical characteristics of Jurassic red strata [28,29], Ordovician limestone aquifer [30,31,32,33,34,35,36,37], or the prediction of floor water inrush at the deep karst [38,39,40]. The Dongtan Coal Mine is located in the core and deep part of the Yanzhou syncline, and it not only represents the characteristics of the geological structure of the Yanzhou Coal field, but also exhibits its own particular characteristics. In this study, traditional hydrogeochemical research methods and multivariate data statistical methods were utilized to gain a more comprehensive understanding of the groundwater system in the mining area. Moreover, this study provides a reference to understand the chemical evolution of the water and aids in understanding mine water hazard and environmental pollution prevention.
2. Study Area
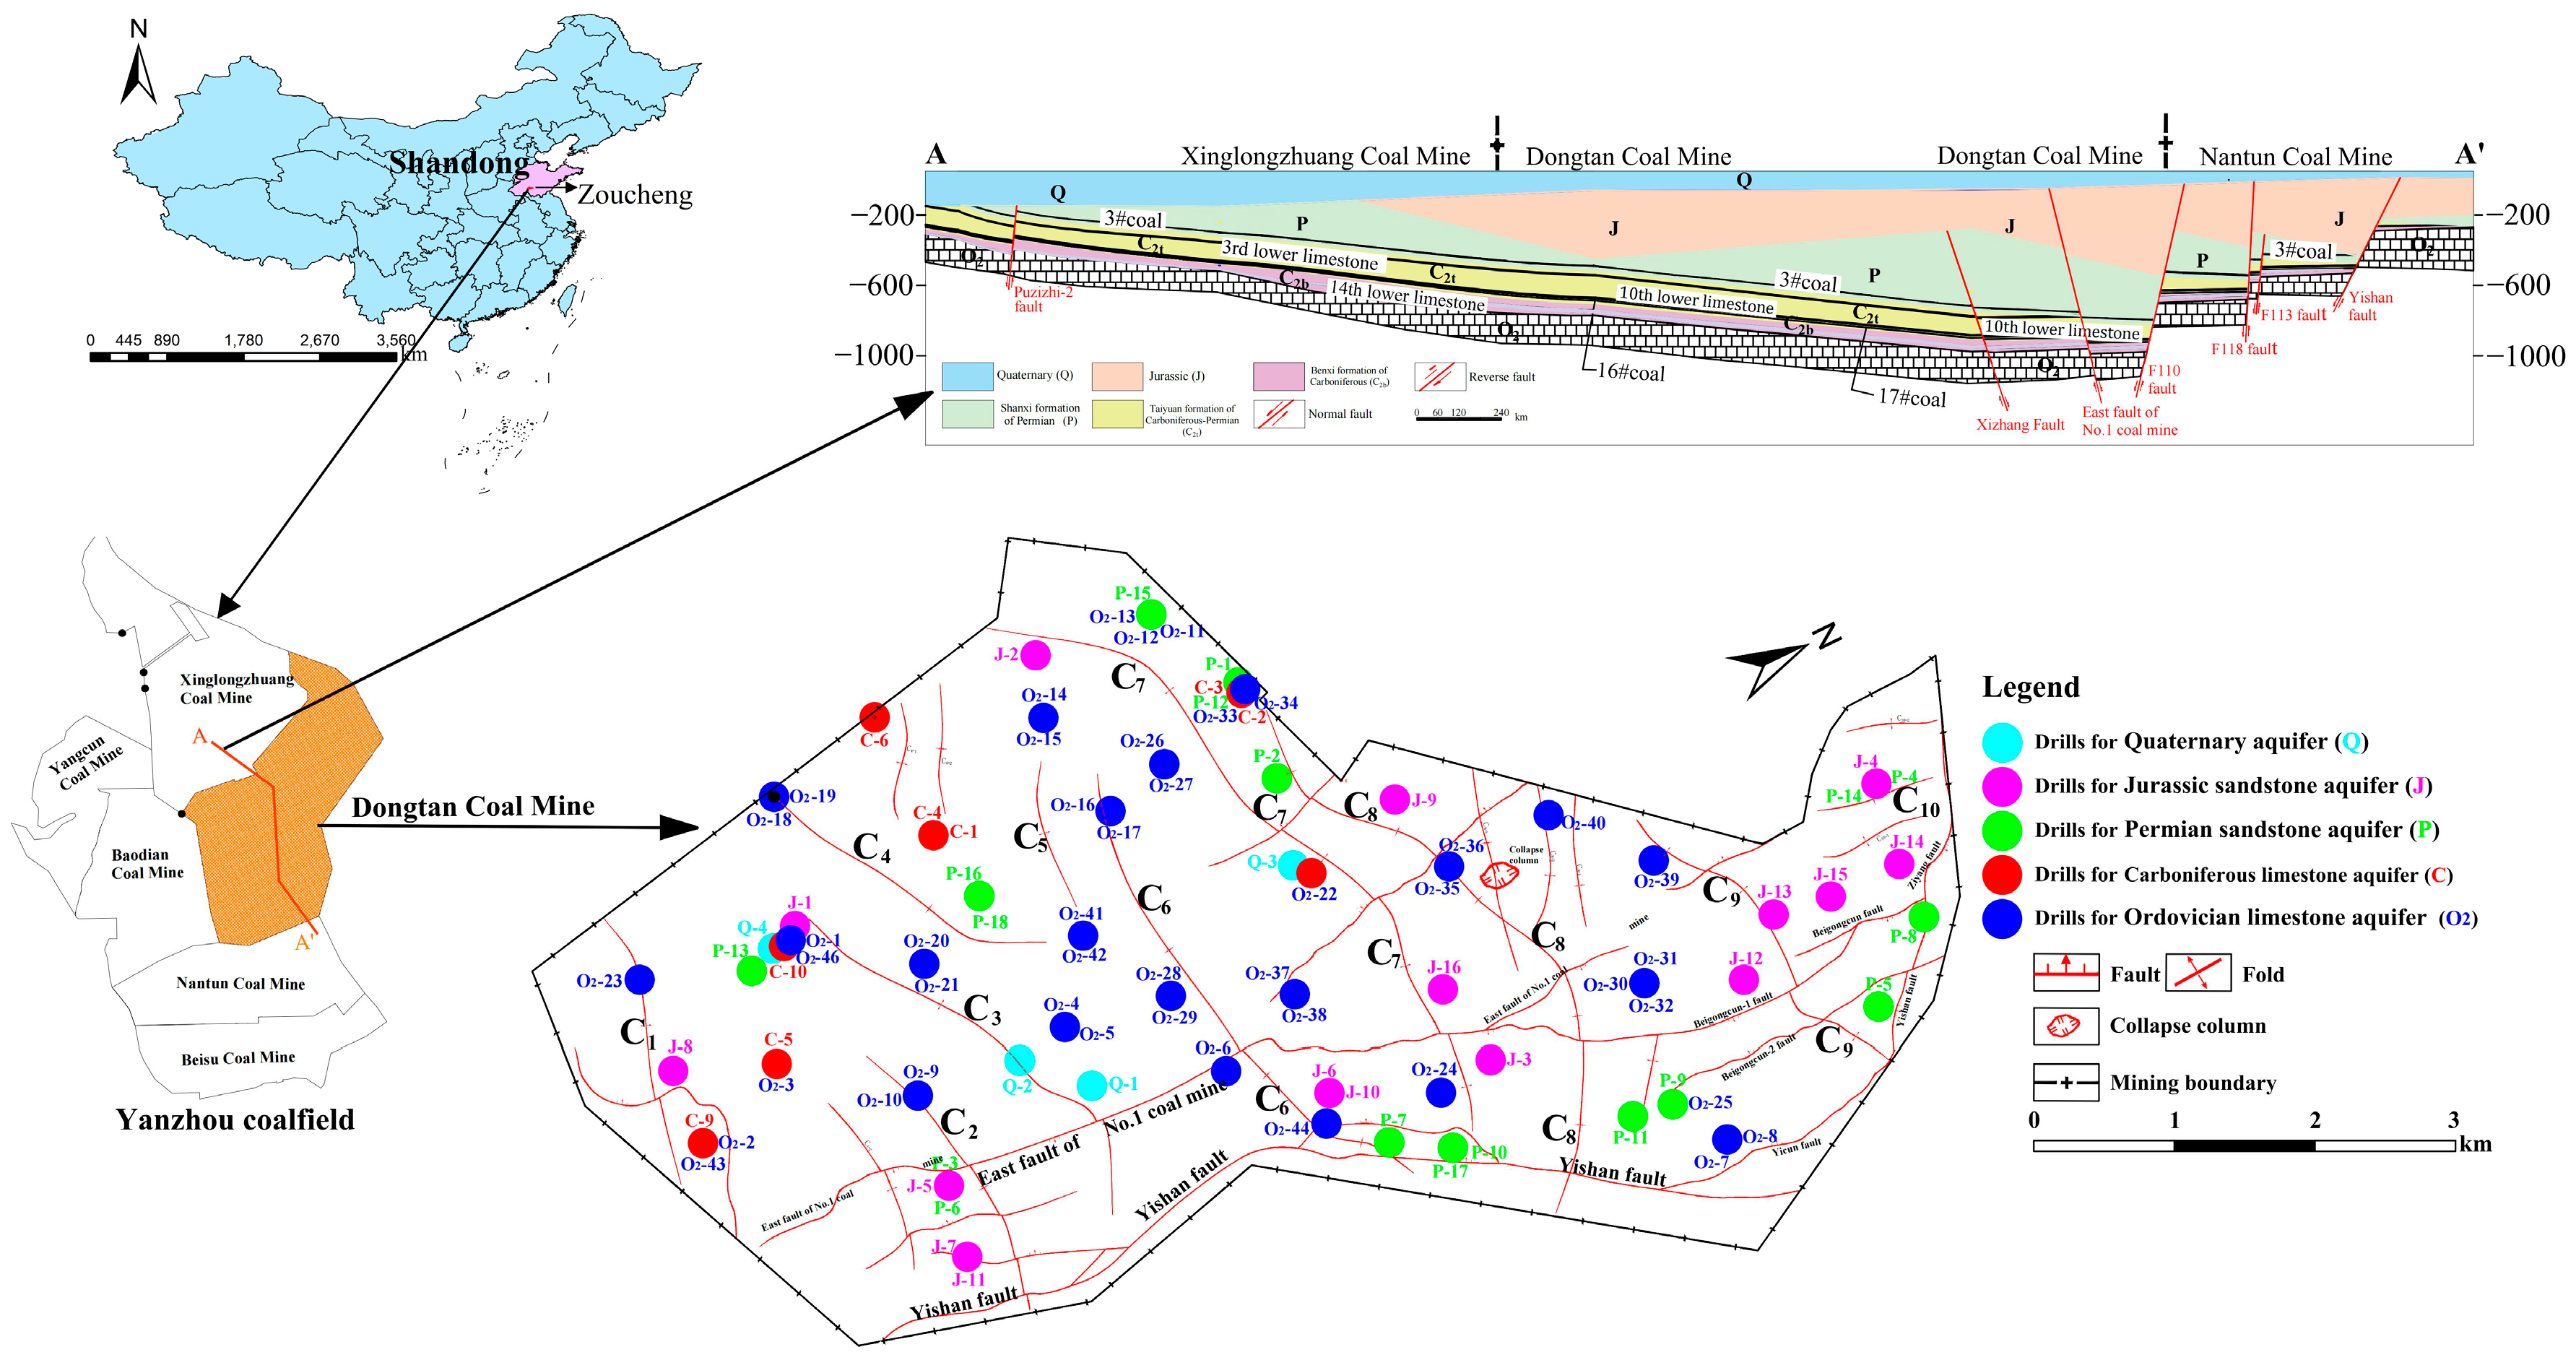
This study focused on the Dongtan Coal Mine, located in Zoucheng City, Shandong Province. It is about 12.5 km long, 4.8 km wide in the E–W direction, and has an area of 59.9606 km2 and a mining elevation of 49.85 to −1350 m. The Dongtan Coal Mine is located in the eastern Yanzhou coalfield, which is an incomplete, inclined basin (Figure 1). Composed of a wide, gentle fold and multiple fault structures, the Dongtan Coal Mine is located in the core of the Yanzhou syncline. The strata in the coalmine dip gently, except in areas with secondary folding. It primarily strikes north 30–60° east, with an inclination to the northwest or southeast, in the range of 3–9°, with an average of 7°, maximum of 37° (except in fault zones), and a minimum of close to horizontal. Coal-bearing strata in this mine belong to a Carboniferous-Permian system, specifically the Taiyuan formation and Shanxi formation, with a total thickness of 267.59 m. At present, the 3# coal seam is being primarily mined in the Dongtan Coal Mine.
The main aquifers in this mining area are Quaternary upper, lower sand and gravel, Jurassic sandstone, Shanxi 3# coal seam top and bottom sandstone, Taiyuan 3rd, 10th lower limestone, Benxi 13th, 14th limestone, and Ordovician limestone. The direct water-filled aquifer is located in the Jurassic sandstone (near the denudation outcrop of 3# coal seam), the top and bottom sandstone of the Shanxi formation, as well as the 3rd and 10th lower limestone of the Taiyuan formation (Figure 1). The aquifer is composed of clay, siltstone, aluminum mudstone, and mudstone. The shallow Quaternary sand and gravel layer receives direct replenishment from atmospheric precipitation and surface water. The Jurassic sandstone can be replenished by the overlying Quaternary water. Each coal series aquifer can receive replenishment from the overlying aquifer or using Ordovician water via the eastern Xiaoshan fault. In order to directly display the chemical properties of water in each aquifer, the upper, middle, and lower Quaternary sand layer are collectively called the Quaternary sandstone aquifer, the 3# coal seam roof sandstone aquifer and the 10th limestone aquifer are called the Permian aquifer, and the 13th and 14th limestone aquifers are called the Carboniferous aquifer. Figure 1 shows the section map of the Yanzhou coalfield (A-A′); part of the 13th limestone is missing and is not shown in the Figure 1.
3. Sample Collection and Analysis
For this study, 95 water samples were obtained from 2010 to 2020, including four samples from the Quaternary (Q) aquifer, 16 samples from the Jurassic (J) aquifer, 18 samples from the Permian (P) aquifer, 11 samples from the Carboniferous (C) aquifer, and 46 samples from the Ordovician limestone (O2) aquifer (Figure 1).
All samples were collected in polyolefin bottles that were washed 3–4 times before sampling. The bottles were then sealed and sent to the laboratory for physico-chemical analysis within 24 h. The analysis indexes mainly included pH and main ions (K+, Na+, Ca2+, Mg2+, HCO3−, SO42−, Cl−). All these ions were tested by performing ion chromatography (Instrument model: Aquion, detection limit: 1 µg·L−1). Further, pH was tested using portable meters (Instrument model: HQ Series, HQ40D, detection limit: 0.01), and the measurement error limit was ±1%. All analyses were performed in the laboratory of the Geological Engineering Survey Institute of South Shandong following standard procedures recommended by the Chinese Ministry of Land and Resources (CMLR), National Environmental Protection Standards of the People’s Republic of China (HJ812-2016, HJ84-2016, GB/T 5750-2006, DZ/T 0064-1993).
Total hardness (TH) was expressed as the equivalent of CaCO3 (molecular weight: 100), obtained by calculation. The amount of total dissolved solid (TDS) was calculated by adding the concentrations of all the cations and anions followed by subtracting one-half of HCO3− concentration in mg·L−1. Notably, the concentrations of Fe3+, NO3−, NH4+ and NO2− in the groundwater of the study area were very low; therefore, they were not considered in the scope of this discussion and are not listed in Table 1. According to the Shoka Lev classification method, cations and anions with a milligram equivalent percentage (MEQ%) > 25% were combined to classify water chemistry types.
4. Results and Discussion
4.1. Analysis of the Hydrogeochemical Properties
The values of the conventional ion concentration, pH, TDS, TH, hydrochemistry type, and partial soluble mineral saturation in the water samples from the Dongtan Coal Mine are listed in Table 1 and Table 2 (owing to the low K+ concentration, Na+ represents the Na+ + K+ concentration). The pH of all the water samples ranged from 6.00 to 12.90, with an average of 8.27, indicating that the groundwater in the Dongtan Coal Mine is generally alkaline. The O2 aquifer was the most acidic, and some water samples showed a pH of as low as 6.00. The TDS values ranged from 119.43 to 3751.28 mg·L−1, with average values of 549.31, 646.66, 1004.96, 919.15, and 2231.44 mg·L−1 for the Q, J, P, C, and O2 aquifers, respectively. The value of TDS increased with increasing aquifer depth, while in the O2 aquifer the TDS value was the highest (3751.28 mg·L−1), indicating that the water–rock interaction gradually enhanced with the increase in the formation depth. The TH was in the range of 0.84–2237.52 mg·L−1, and for the five aquifers (Q, J, P, C, and O2 aquifers), the averages were 322.33, 86.37, 155.61, 177.17, and 1200.16 mg·L−1, respectively. Overall, the TDS and TH of O2 were the highest, presumably due to the unique geological structure and the low pH of the aquifer, which were favorable for mineral dissolution.
A comparative analysis with the Xinglongzhuang coal mine indicates that the groundwater in both mines was alkaline, and the pH of water in the O2 aquifer was lower than those in the other aquifers; moreover, the TDS increased with the increase in the aquifer depth [17]. The difference was that the groundwater pH of the Dongtan Coal Mine was larger, and the pH of 15.8% of the water samples was above 9.0. Further, the maximum TDS value of the O2 aquifer was above 3500 mg·L−1, which is much higher than that of the Xinglongzhuang Coal Mine. Clearly, affected by the geological structure, the Dongtan Coal Mine has unique water chemical characteristics.
In all the water samples, the concentration range of the conventional ions was large, and the order of the major cations and anions in each aquifer was as follows: Q: Ca2+ > Na+ > Mg2+, HCO3− > SO42− > Cl−, J: Na+ > Ca2+ > Mg2+, SO42− > HCO3− > Cl−; and both P and C: Na+ > Ca2+ > Mg2+, and HCO3− > Cl− > SO42−, indicating that the hydrogeological properties of the two are similar and that a certain hydraulic relationship exists between them. The O2 aquifer exhibited the order of Ca2+ > Na+ > Mg2+, SO42− > HCO3− > Cl−. The higher relative concentration of HCO3−, Ca2+, and Na+ may primarily derive from the dissolution of carbonate minerals (calcite and dolomite), evaporite (gypsum and halite), and weathering of silicate [17,19,41]. Moreover, SO42− might have primarily derived from gypsum dissolution and pyrite oxidation [42,43,44].
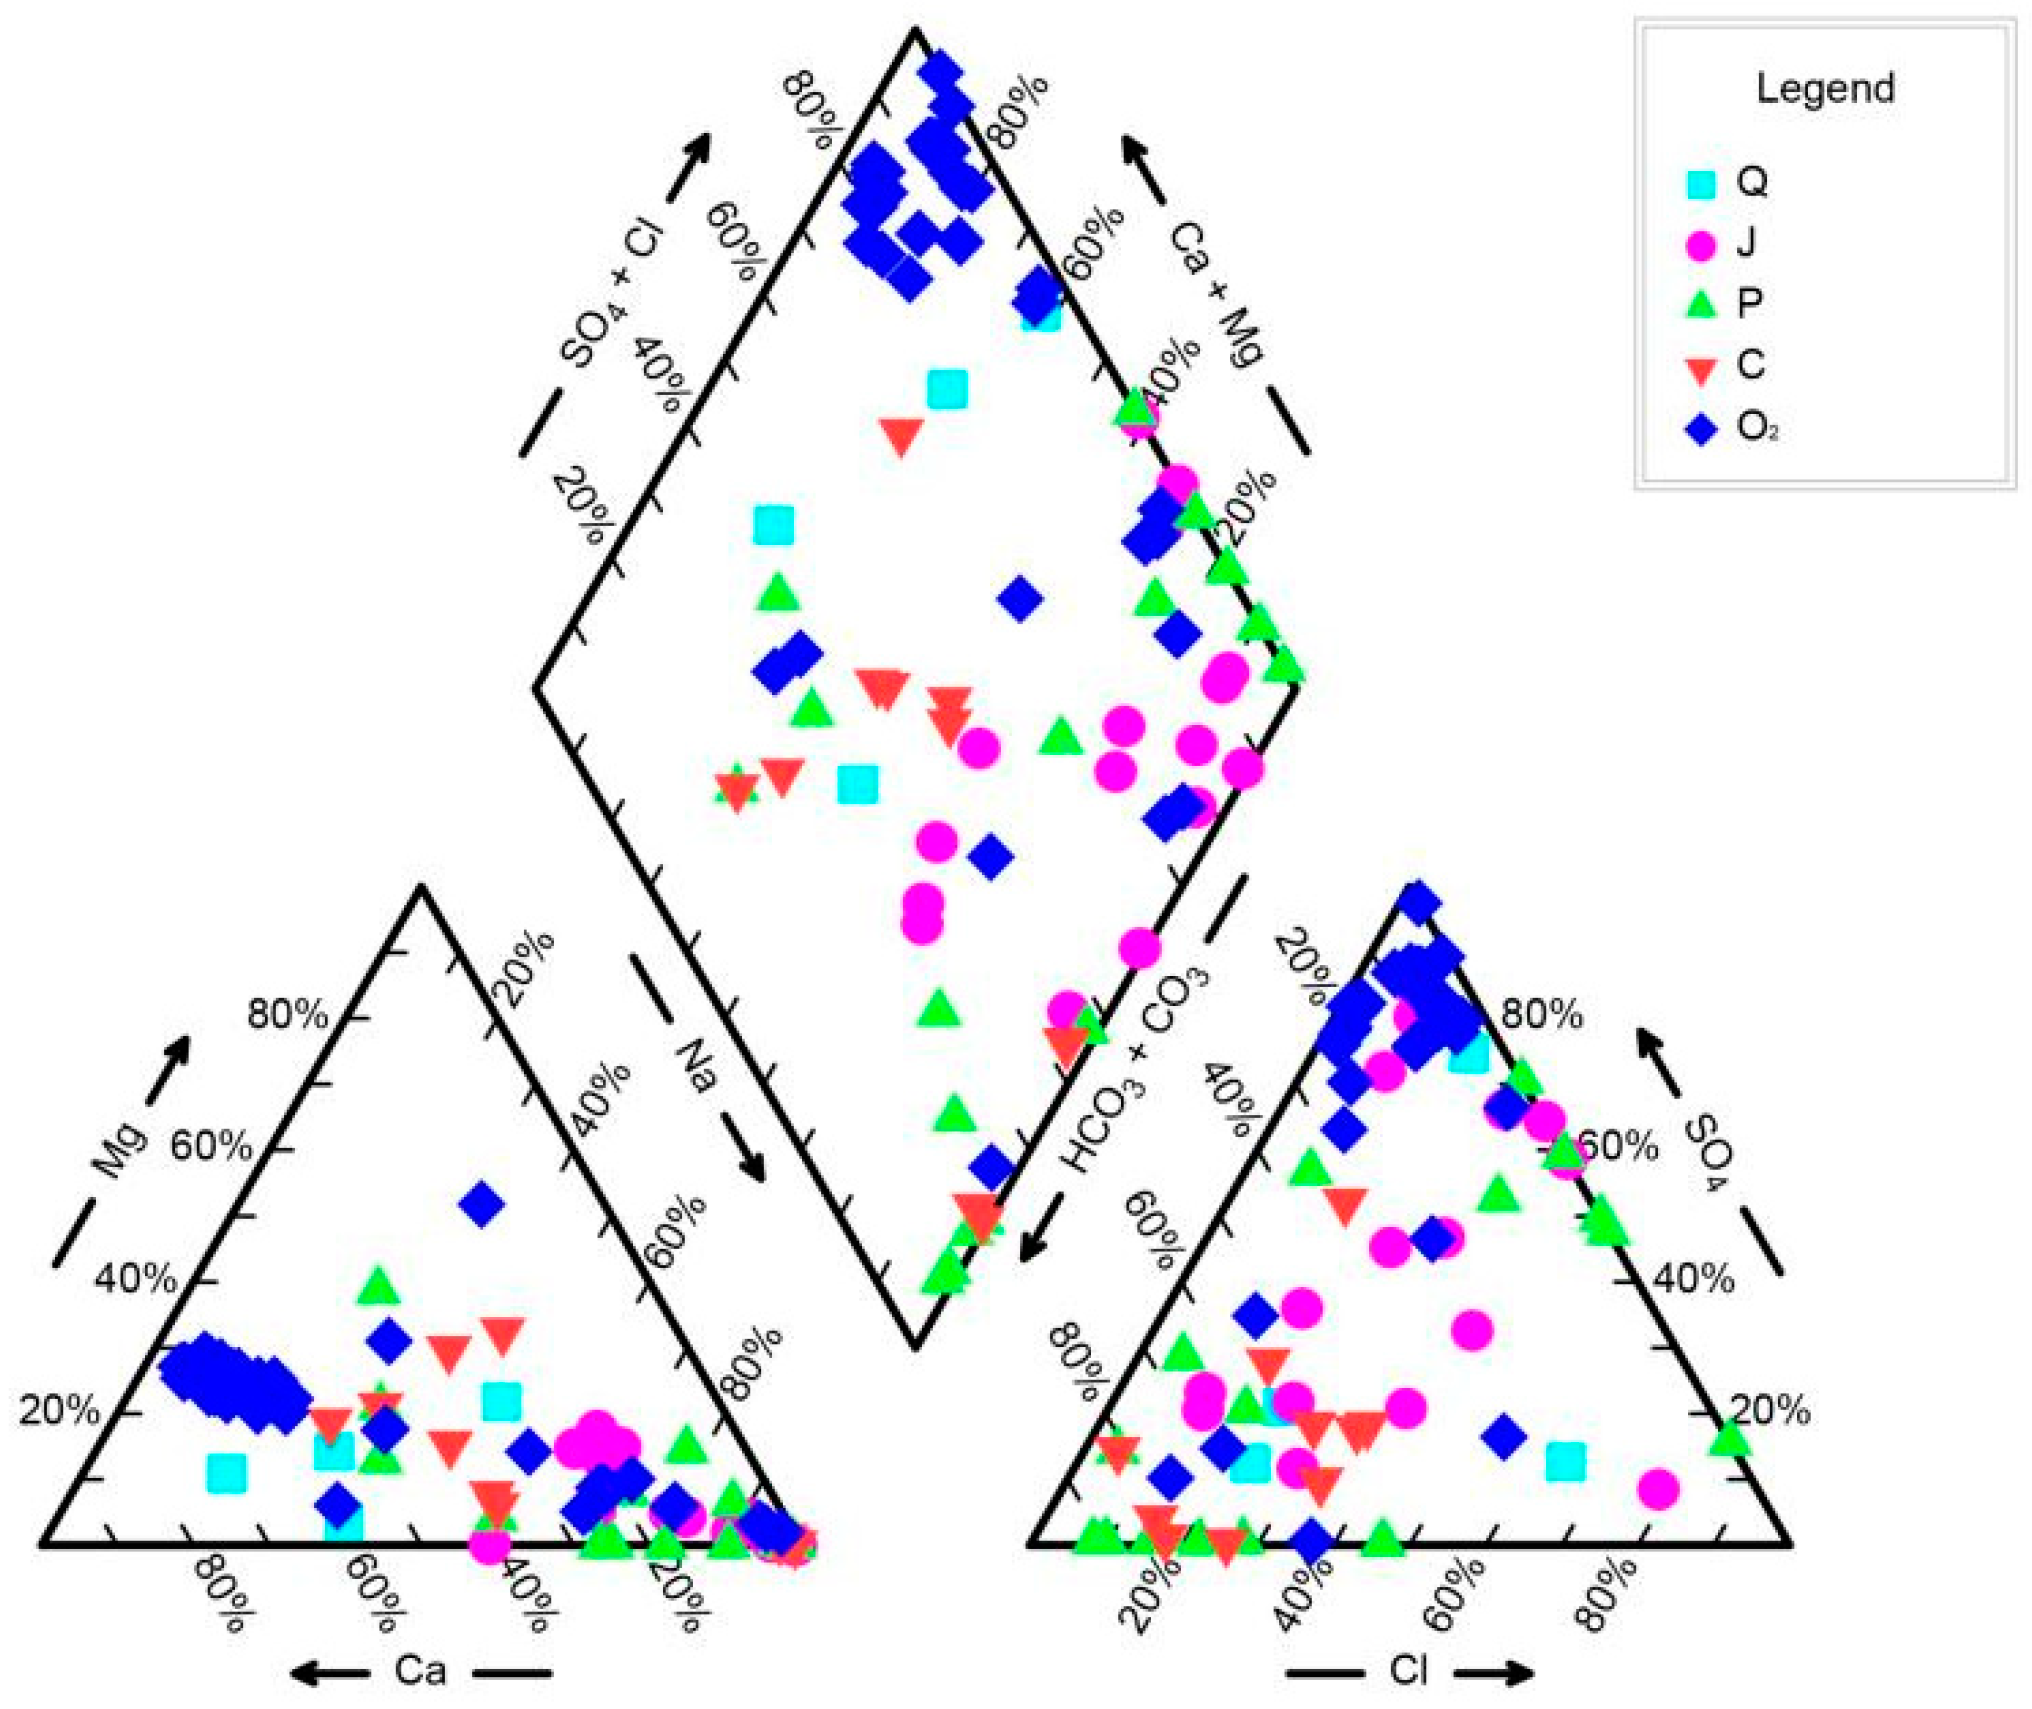
In the cation triangle in the Piper diagram, the water samples consist of the cations close to the Na end member when the groundwater is affected by evaporite and silicate weathering, and close to the Ca–Mg end member when it is affected by carbonate [45,46,47]. Figure 2 exhibits that the samples from J and P aquifers are close to the Na end member, indicating that the water quality of these two aquifers is significantly affected by evaporite and silicate weathering. The water samples from Q, C, and O2 aquifers are close to the Ca end member, indicating that these aquifers have been significantly affected by carbonate dissolution. In the anion triangulation diagram, most of the samples from the O2 aquifer are concentrated near the SO42− end member, showing that this aquifer was affected by evaporite (gypsum) dissolution and pyrite oxidation.
4.2. Multivariate Statistical Analysis
Groundwater systems are complex, making a comprehensive evaluation difficult; thus, multivariate data analysis has received significant research interest as a potential solution [48,49]. Cluster analysis is a multivariate statistical method that is classified step by step according to the similarity between samples or variables [50,51]. It plays a significant role in the classification of water chemistry, analysis of hydration characteristics, evaluation of water quality, and discrimination of water inrush sources.
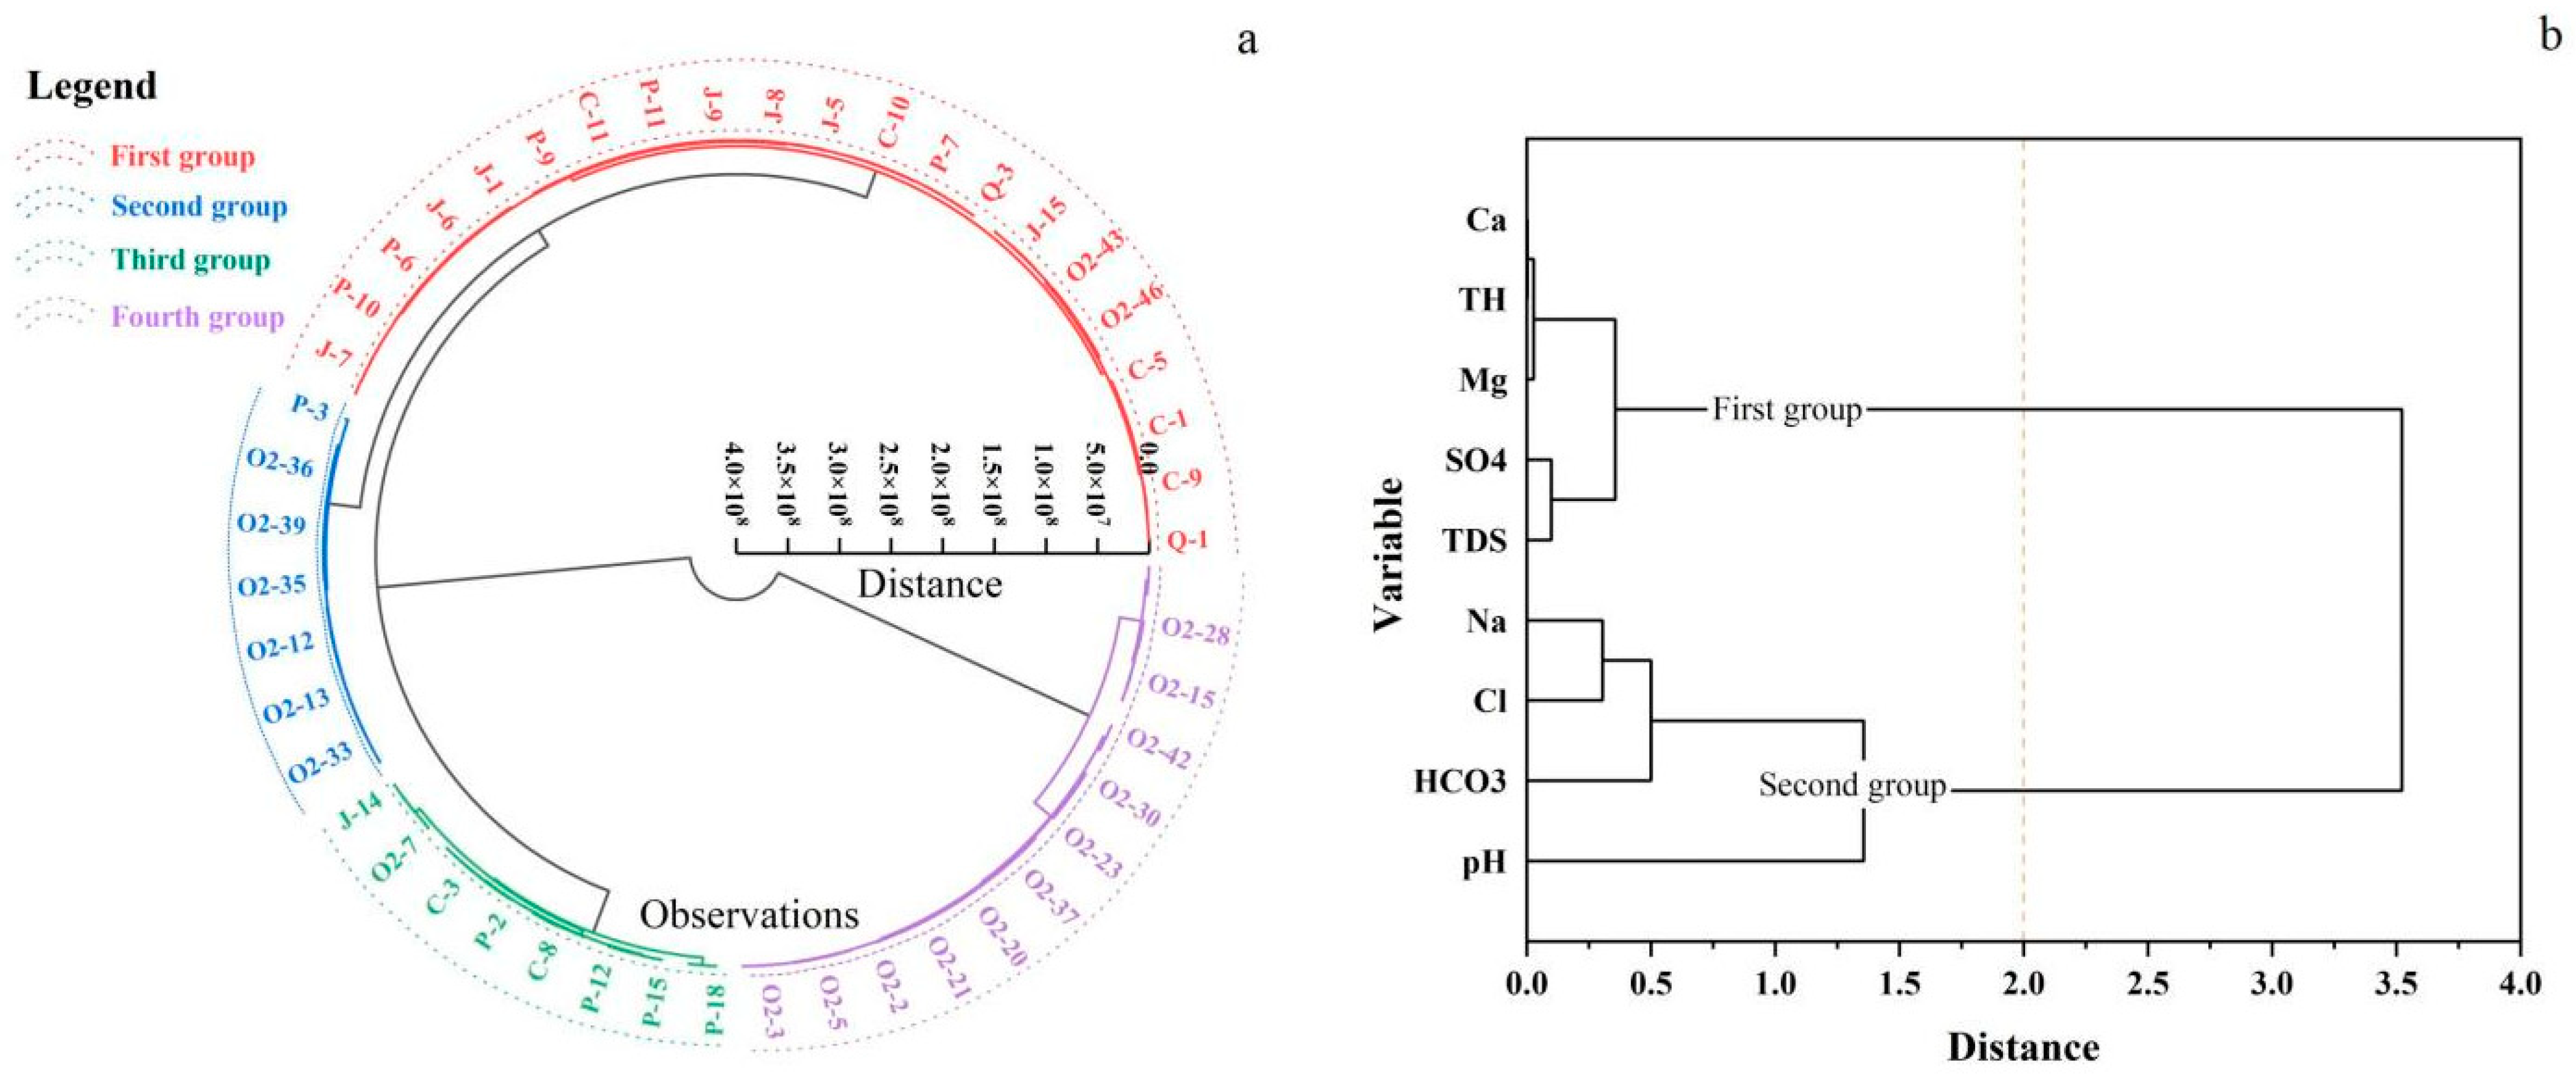
In this study, the Origin 2021 software was mainly used to cluster the water samples under two Hierarchical Cluster Analysis (HCA) modes [52], namely, Q cluster analysis and R cluster analysis. Figure 3a and Table 3 demonstrate that the 95 water samples were clustered into four groups by Q cluster analysis.
The water samples in the first and third groups were from Q, J, P, C, and O2 aquifers, and samples in the second and fourth group except for one were all from an O2 aquifer, accounting for 82.6% of all the samples from the O2 aquifer, indicating that the water quality of the O2 aquifer was significantly different from that of the others aquifers. Moreover, most of the samples in the third group were from P and C aquifers, indicating that the hydraulic connection between P and C aquifers is particularly strong.
The clustering results exhibit a certain relationship with the sampling borehole location (Figure 1, Table 3). The boreholes of the first group of water samples were widely distributed and primarily affected by the East fault of coal mine No.1, the Yishan fault, and the Beigongcun fault, as well as some synclines and anticlines. The formation depth was shallow and the groundwater runoff conditions were better; therefore, the hydrochemical characteristics of the water samples in the first group were similar. The highest TDS value was only about 1000 mg·L−1. The second group of water samples was primarily distributed north of the mine near the C8 syncline and their TDS was in the range of 1000–1500 mg·L−1, indicating that the runoff conditions in this area were good (Table 1). The fourth group of water samples was primarily distributed in the southern half of the mining area, with a TDS in the range of 2600–3800 mg·L−1, indicating that the karst development in this area was not strong and the groundwater runoff condition was poor. However, for the third group, the distribution of boreholes was relatively dispersed. Except for two samples, the TDS values of most water samples were in the range of 1100–1800 mg·L−1. According to the above-mentioned analysis, the use of hydrochemical characteristics of groundwater can better reflect the groundwater runoff and characteristics of the geological structure. The difference in the TDS values between the second group and the fourth group further indicates that the Ordovician limestone aquifer is rich in local karst and exhibits good local water-rich properties.
Figure 3b shows that an R cluster analysis was applied to cluster the variables. The results show that nine variables were divided into two groups. The first group included Ca2+, Mg2+, SO42−, TH, and TDS, indicating the occurrence of sulphate dissolution; and Ca2+, Mg2+, and SO42− showed greater influence on the hardness and salinity of the groundwater. The second group included Na+, Cl−, HCO3−, and pH, indicating the dissolution of carbonate, sodium silicate, and halite.
A correlation analysis was used to further analyze the hydrochemical characteristics of each aquifer. The hydrochemical correlation coefficients for Mg2+ and Ca2+ was 0.973, for HCO3− and Na+ it was 0.605, for SO42− and Ca2+ it was 0.871, for SO42− and Mg2+ it was 0.883, and for Cl− and Na+ it was 0.696 (Table 4). This positive correlation indicates that during the hydrogeochemical evolution of the groundwater, there was more dissolution of carbonate and sulfate and lesser silicate weathering and halite dissolution. The correlation coefficients of TDS with Ca2+, Mg2+, and SO42− were all greater than 0.7, and those for TH with Ca2+, Mg2+, and SO42− were all greater than 0.8, indicating that these three ions contributed significantly to the salinity and hardness of all the aquifers. Moreover, pyrite crystals are common in the Ordovician fractures in the Dongtan Coal Mine, and the free H2SO4 from oxidized pyrite can accelerate the dissolution of calcite and dolomite, leading to an increase in the concentration of Ca2+ and Mg2+ in the O2 aquifer. This is consistent with the high correlation coefficient of TH with Ca2+, Mg2+, and SO42− and further verifies the influence of pyrite in th O2 aquifer on the water quality as well as the decreased pH.
4.3. Hydrogeochemical Evolution
The dissolution of calcite, dolomite, gypsum, and halite as well as the reaction of pyrite oxidation are shown in (1)–(7). If all the ions in groundwater are composed of ions dissolved by calcite, the molar ratio of [HCO3−]/[Ca2+] is 2, and if the dissolution of dolomite is the primary cause, the ratio is 4 [17,21]. Based on the analysis, there are two main sources of SO42−. One is the dissolution of sulfate, such as the dissolution of gypsum, and the other is the oxidation of pyrite. Before being affected by mining activities, aquifers are mainly in a reduction environment. After being affected by coal mining, some areas acquire a semi-open oxidation environment. Under the oxidation action of oxygen and Fe3+, pyrite is oxidized, and SO42− is generated [53,54].
Calcite: CaCO3 + CO2(g) + H2O = Ca2+ + 2HCO3−
Dolomite: CaMg(CO3)2 + 2CO2(g) + 2H2O = Ca2+ + Mg2+ + 4HCO3−
Gypsum: CaSO4·2H2O = Ca2+ + SO42− + 2H2O
Halite: NaCl = Na+ + Cl−
Oxidation of pyrite:
FeS2 + 3.5O2 + H2O = Fe2+ + 2SO42− + 2H+
4Fe2+ + O2 + 4H+ = 4Fe3+ + 2H2O
FeS2 + 14Fe3+ + 8H2O = 15Fe2+ + 2SO42− + 16H+
Ca2+ + 2Na-EX = 2Na+ + Ca-EX
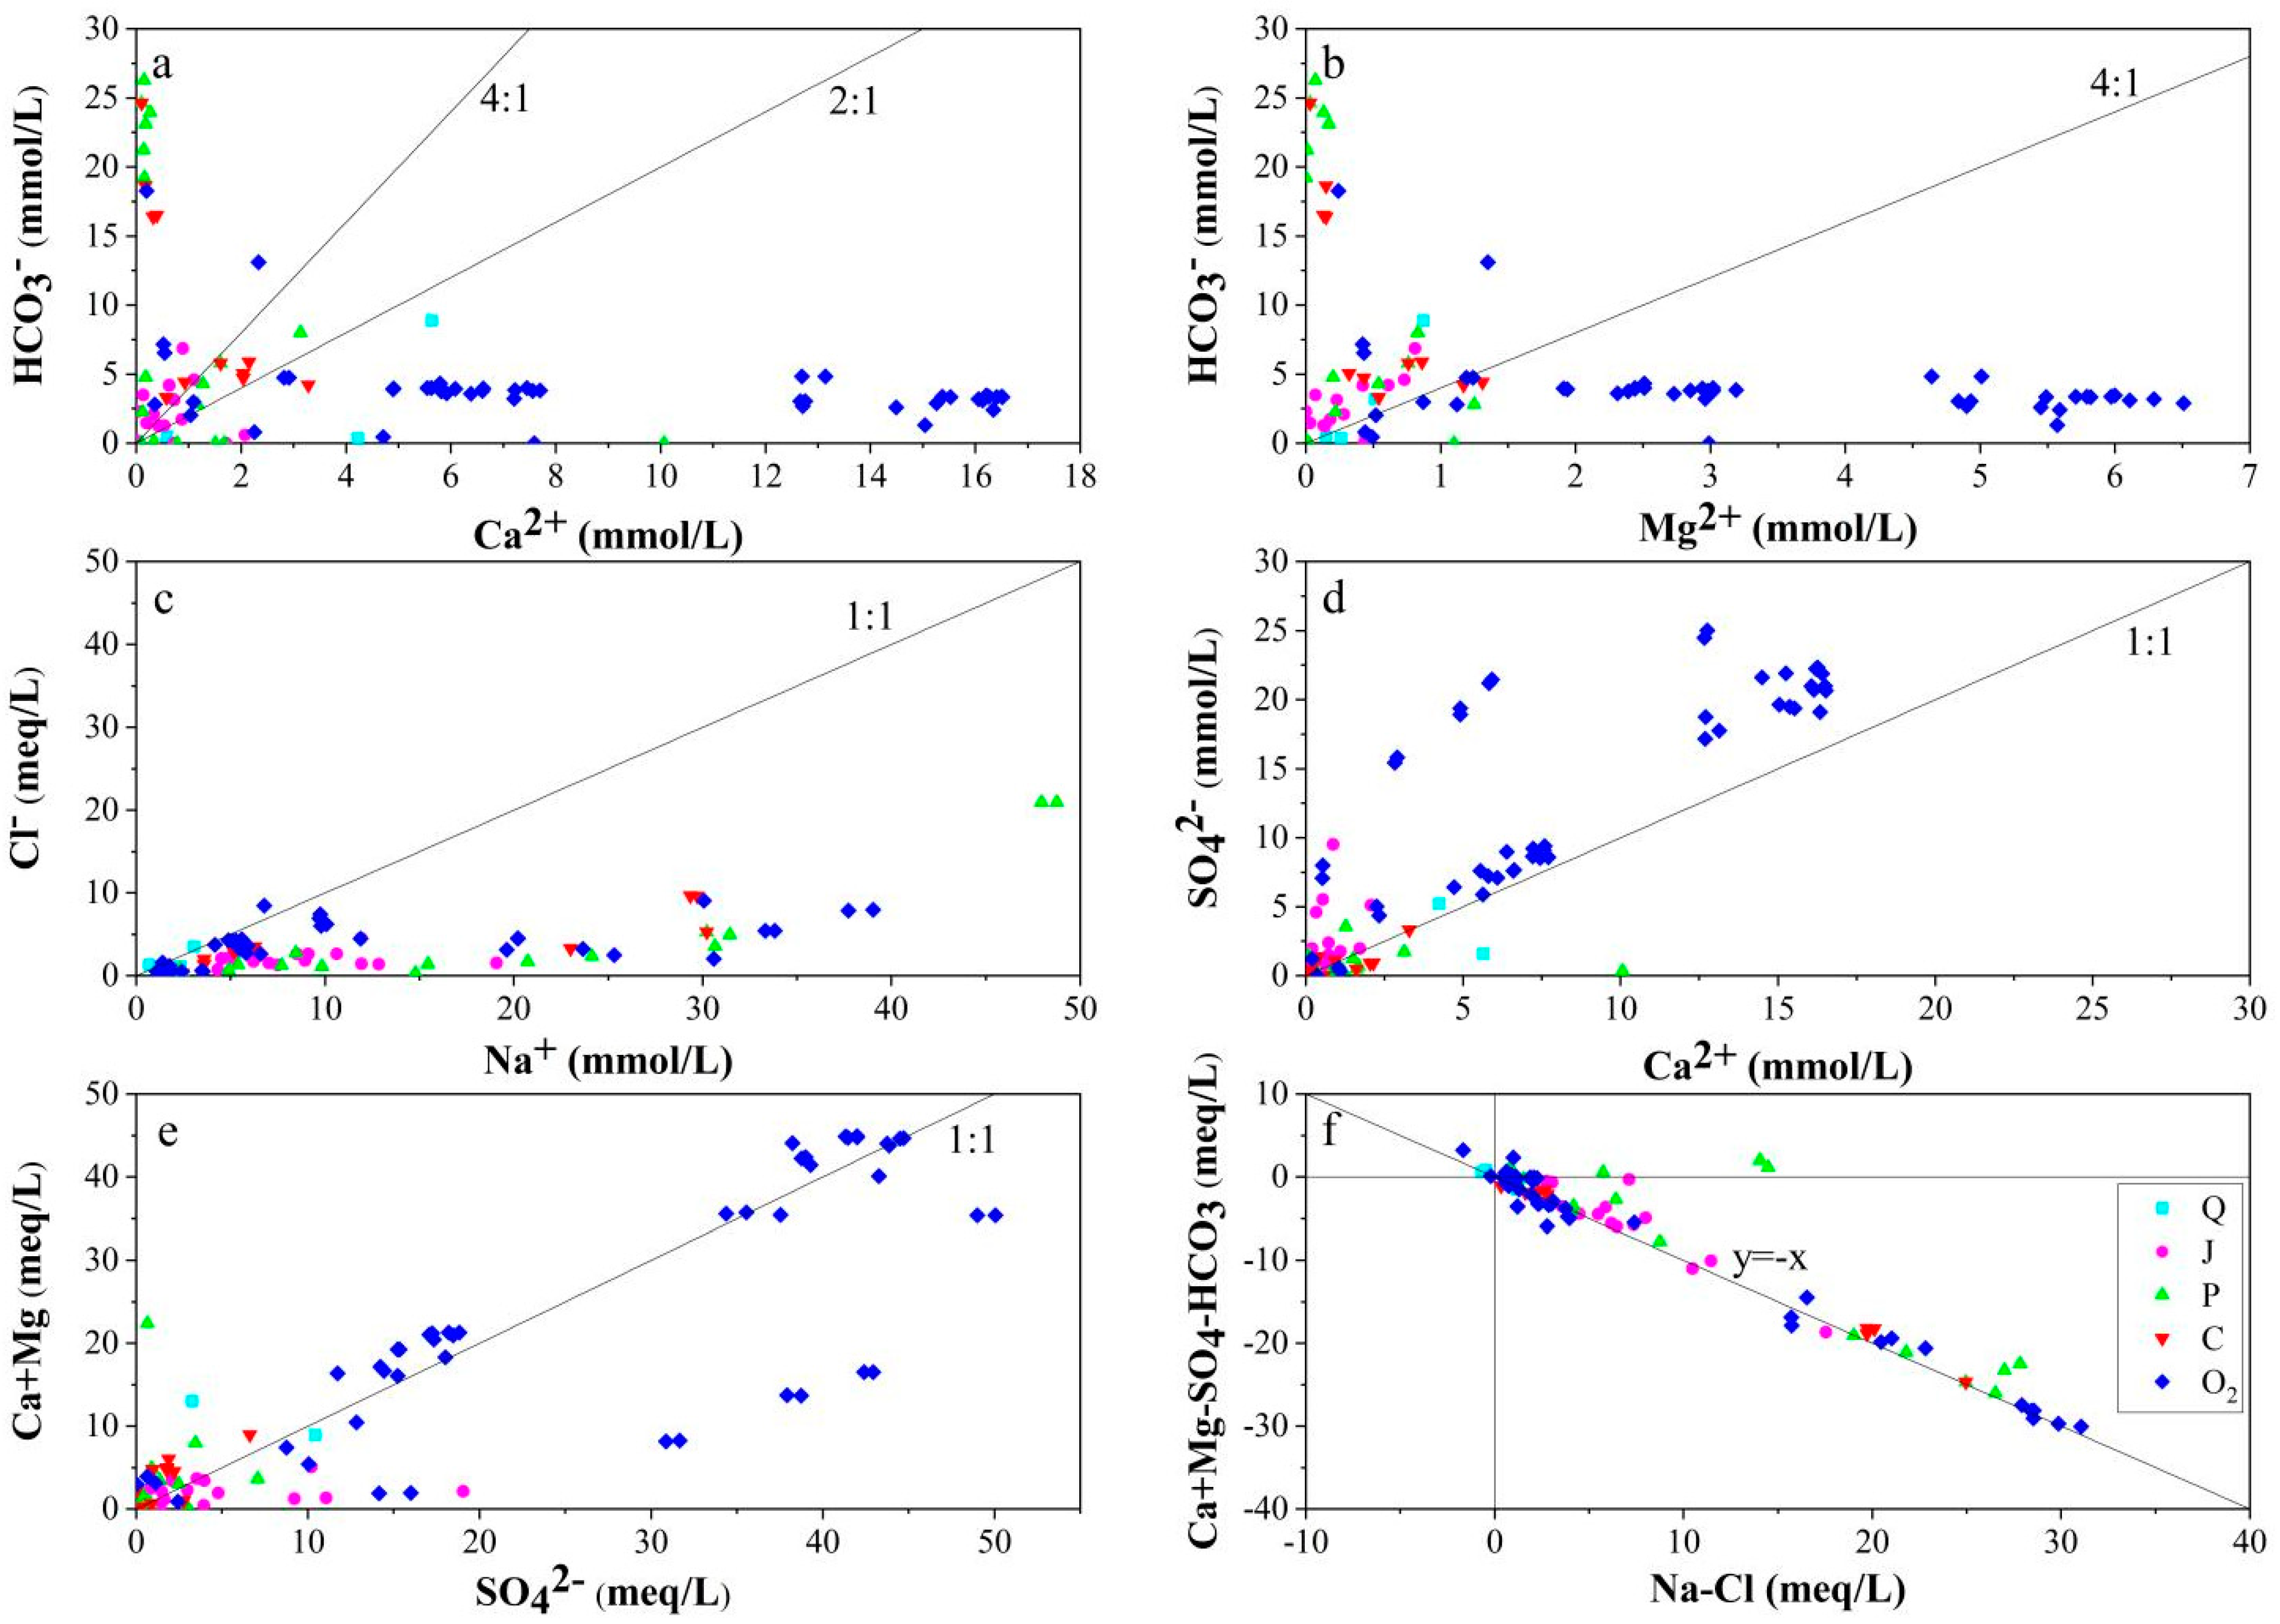
The relationship between Ca2+ and HCO3− in the water samples is shown in Figure 4a, where the distribution is scattered and divided into three zones. The zone above the 4:1 line represents the exchange of cations, that between the 2:1 and 4:1 line indicates the dissolution of calcite and dolomite or cation exchange, and that below the 2:1 line indicates a deficiency of HCO3− [17]. Figure 4a illustrates that except for the dissolution of calcite and dolomite, the cation exchange in J, P, and C aquifers is significant, and the samples from O2 aquifer are mostly below the 2:1 line, indicating that the HCO3− content was low (as reflected in Figure 4b) and illustrating that the precipitation dissolution of calcite and dolomite was strong except in the O2 aquifer. If Na+ and Cl− derive only from the dissolution of halite, the molar ratio of [Na+]/[Cl−] is 1:1. However, Figure 4c demonstrates that except two Q and two O2 samples, all the samples are under the 1:1 line, indicating that the content of Na+ is much greater than that of Cl−. The Na+ derived not only from the dissolution of halite, but also from the cation exchange reaction. The weathering of silicate can also contribute to an increase in the Na+ concentration; thus, the correlation coefficients between Na+ and Cl−, and HCO3− and Na+ are around or below 0.7 [15,33,55]. If Ca2+ and SO42− come only from the dissolution of gypsum, the molar ratio of [Ca2+]/[SO42−] is 1:1. However, most of the samples are above the 1:1 line in Figure 4d, indicating that gypsum was not the only source of SO42−. When Ca2+, Mg2+, and SO42− mainly originate from the dissolution of sulfate, γ(Ca2+ + Mg2+)/γ(SO42−) = 1. When γ(Ca2+ + Mg2+)/γ(SO42−) > 1, Ca2+ and Mg2+ can be obtained from other sources as well, such as the dissolution of carbonate. When γ(Ca2+ + Mg2+)/γ(SO42−) < 1, SO42− has other sources, such as dissolution of pyrite [56]. Figure 4e illustrates that the water samples of each aquifer are all on the line or nearby, indicating that the dissolution of sulfate was not the only source of Ca2+, Mg2+, and SO42−. Some water samples from the J and O2 aquifers are obviously located below the 1:1 line, indicating that the SO42− in these two aquifers may have originated from the oxidation of pyrite. The O2 aquifer consists of locally developed high-angle fissures, with common pyrite crystals on the fissure surface. Under the influence of mining activities, pyrite is easily oxidized to form SO42− (Equations (5)–(7)). Free H2SO4 can release Ca2+ from carbonate, resulting in an increase in Ca2+, SO42−, and TDS [44]. Figure 4f shows that most of the water samples are distributed along y = −x, further illustrating that most of the ions are derived from the dissolution of calcite, dolomite, gypsum, and cation alternate adsorption (Equation (8)). However, some samples are located far from y = −x, demonstrating that there are other sources of the ions, such as pyrite oxidation and the weathering of silicate. In general, the hydrogeochemistry gradually evolved under the influence of dissolution filtration, oxidation, cation exchange, and mixing [57].
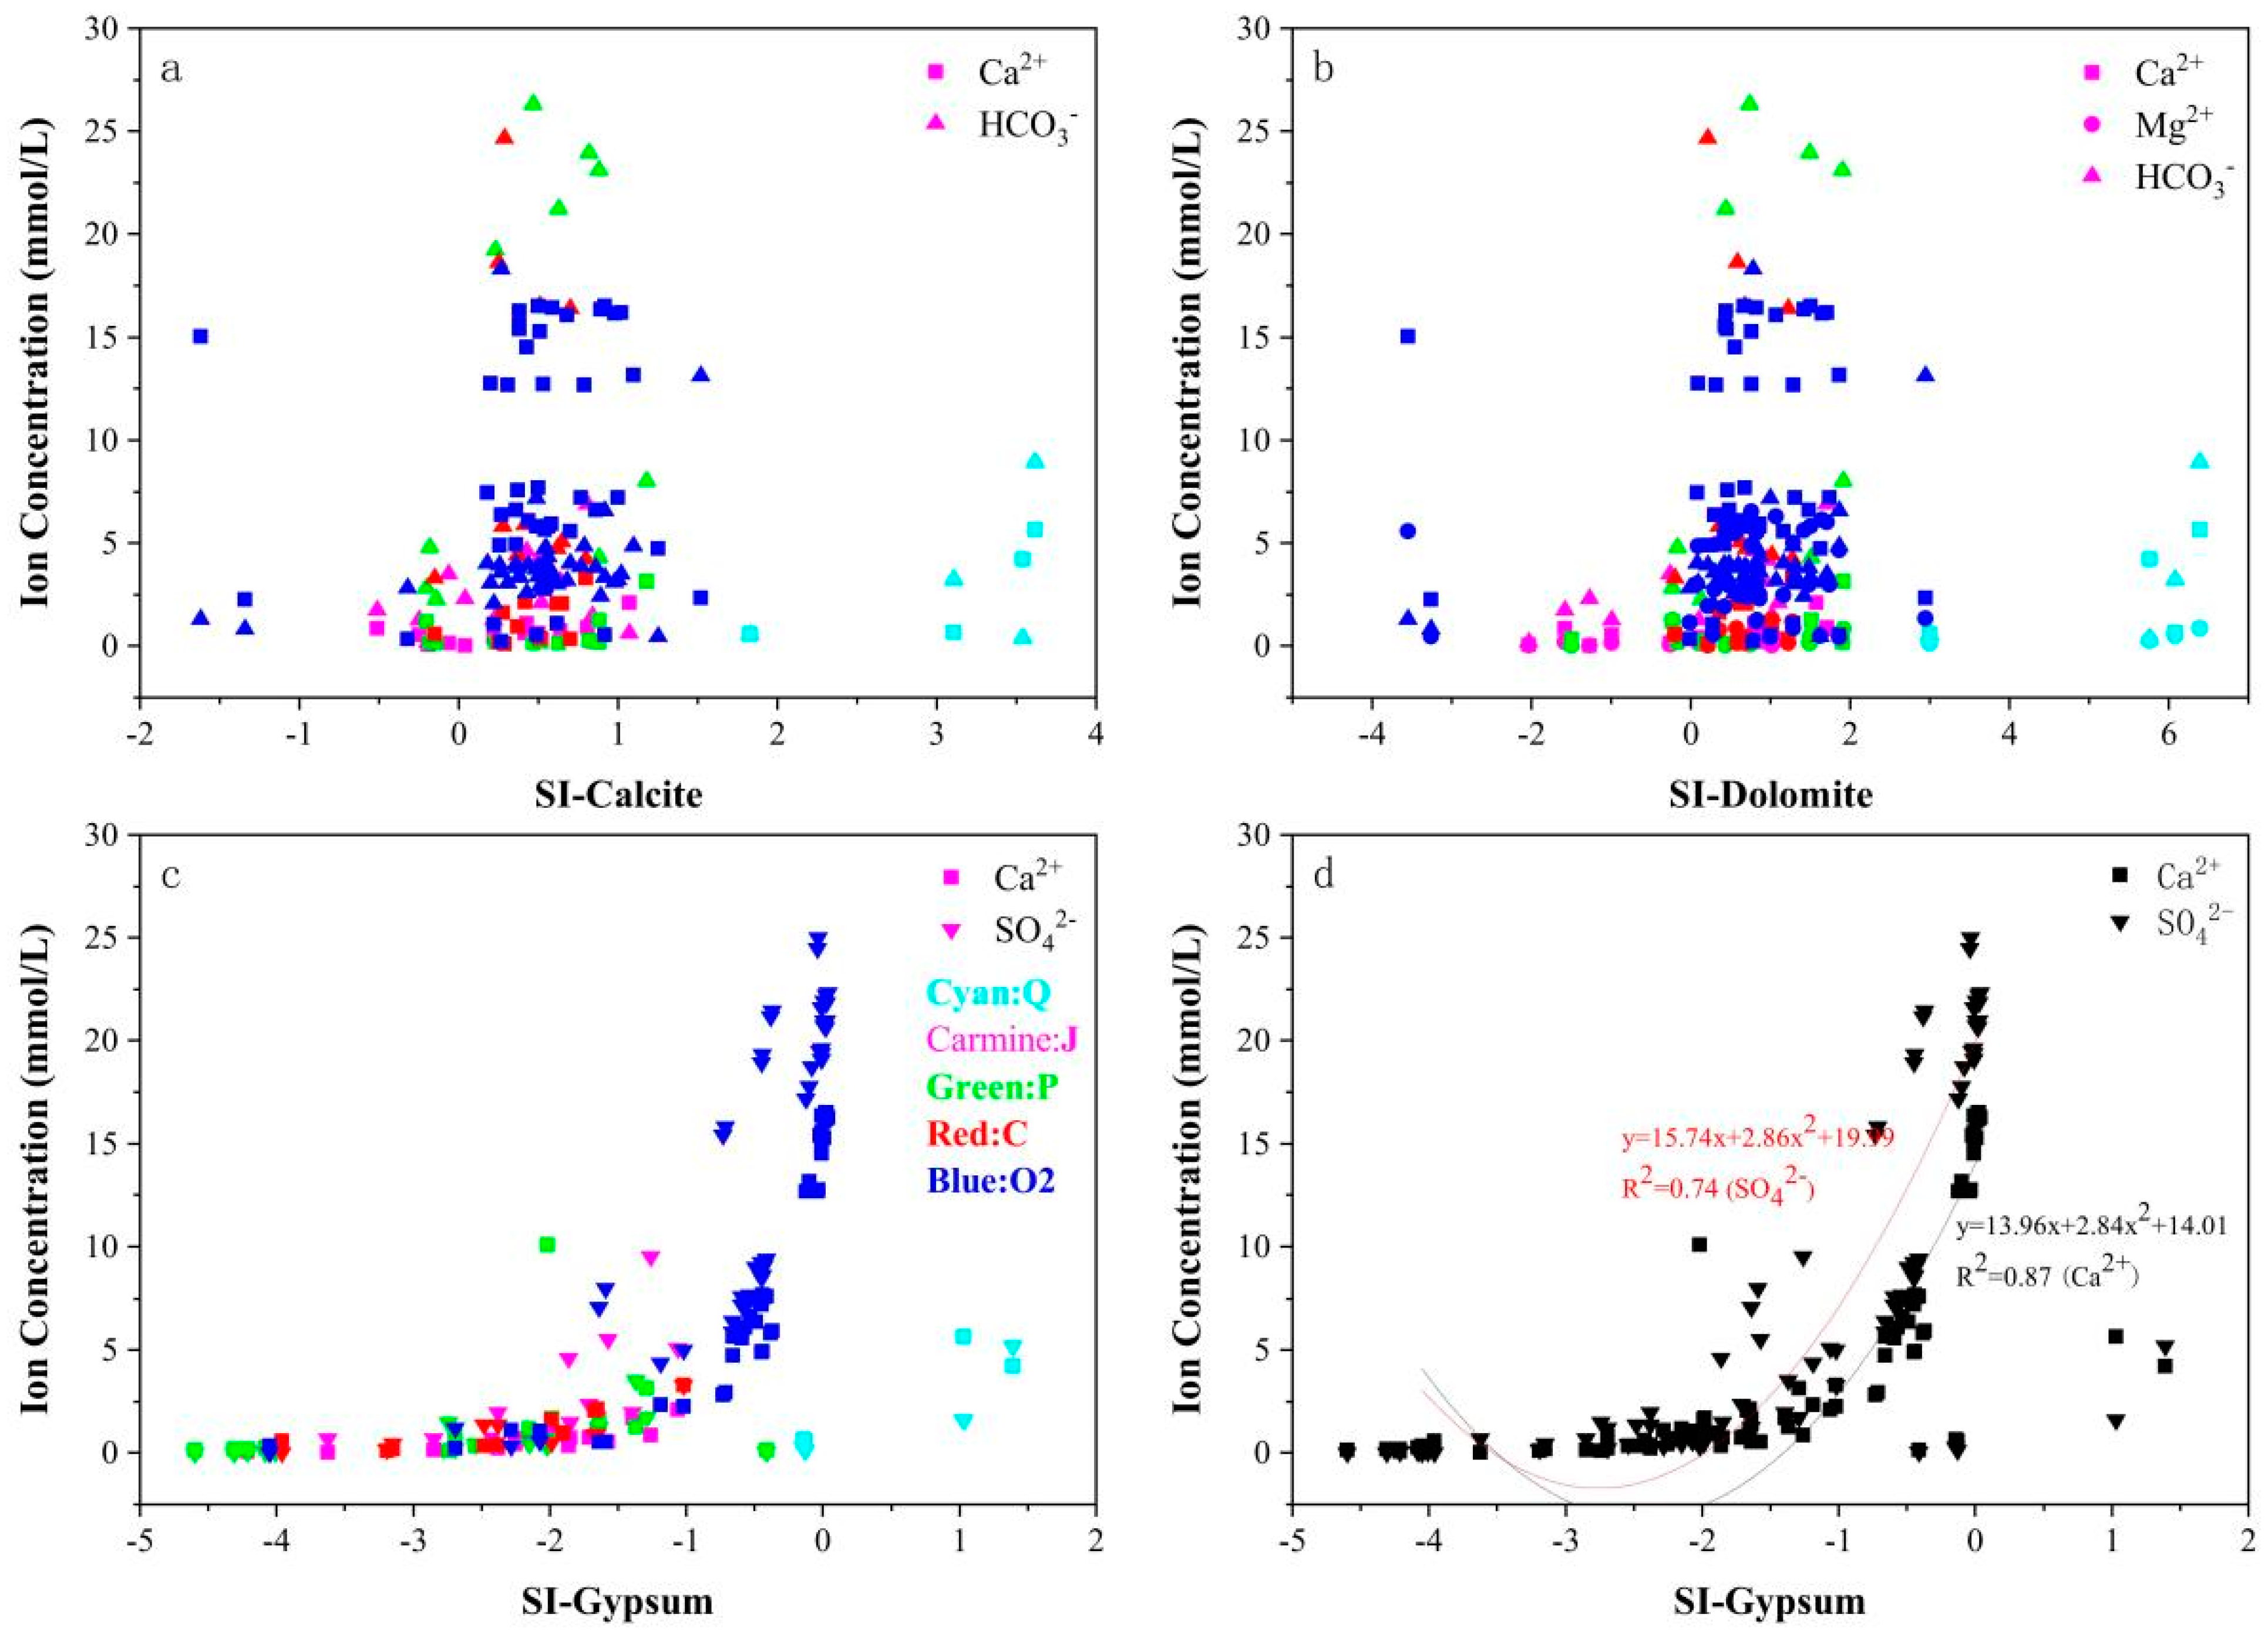
To further reveal the groundwater and rock interaction in the mining area, the saturation indexes (SI) of calcite, dolomite, gypsum, and halite in each aquifer were calculated by using PHREEQC (Table 1). The results reveal that the saturation indexes of calcite (SIcalcite) and dolomite (SIdolomite) in the five main aquifers are mostly greater than zero, indicating that the dissolution of these two minerals was affected by an obvious precipitation trend [58]. Conversely, except for in the Q aquifer, the gypsum saturation index (SIgypsum) in the aquifers was below zero, reflecting the dissolution state of gypsum, and these results are also similar to those provided for the Xionglongzhuan Coal Mine [17]. Figure 5 exhibits that the SIcalcite and SIdolomite in each aquifer have little correlation with ion concentration; however, SIgypsum shows a positive correlation with Ca2+ and Mg2+ concentration, further indicating that the dissolution of gypsum is one of the major sources of Ca2+ and SO42−. Besides gypsum dissolution, pyrite oxidation reactions also occurred, resulting in an increase in the SO42− content. Since SICalcite > 0, SIDolomite > 0, and the calcite dissolution rate is much greater than that of dolomite, it is speculated that the calcite may be saturated in the groundwater, while the dolomite is not saturated. In other words, the Ca2+ in the groundwater did not derive from calcite dissolution and dolomite dissolution was an important source of Ca2+ and Mg2+.
4.4. Hydrogeochemical Characteristics of the Ordovician Limestone Aquifer
Figure 6 exhibits the TDS equivalent diagram of the O2 aquifer. The results indicate that the overall TDS of the northern Dongtan Coal Mine (Part A) was low, being generally below 2000 mg·L−1, while the mineralization degree of the southern area (Part B) was higher. Moreover, the TDS of some water samples exceeded 3600 mg·L−1 and there was a clear transition zone (AB line) between the two regions. In Part A, the C7′s (anticline) axial length is 7000 m and the C8′s (syncline) axial length is 5500 m. The area surrounding the two has a poor north–south permeability and good east–west permeability, and strong karst development means the water content in Part A is greater than that in Part B. This was also confirmed by Mao Deqiang’s team who recognized that the transmissivity (T) and storativity (S) in the north were relatively higher due to water-conducting structures, such as the C7 and C8 segments [59]. As a result, more attention should be paid to this region, which may become an area of water inrush incidents. Such accidents also occurred in October 1999, when water inrush occurred from the 143upper 09 (east) transport roadway at the synclinal axis of C8, with a maximum water inflow of 500 m3⋅h−1. In February 2004, the 1304 transport trench was excavated to the south wing of the C8 syncline. When advance exploration and drainage were carried out, the maximum drainage volume of the borehole was 69.5m3⋅h−1. In January 2013, a collapse column that was developed in the Ordovician limestone stratum and located in the C8 synclinal axis region was found in the 1306 working face. Owing to its lengthy development age, there was no sign of water seepage; however, a certain impact on the mining activity of the lower coal group was demonstrated. As a result, further detection and more systematic explorations are needed. This is consistent with the previous results of the Q cluster analysis.
Figure 7 exhibits that the water level of Part D and Part E is high, and the groundwater flows from Part D and E to Part C. Part C is in the intersection area of C7, C8, the East fault of the No.1 coal mine, and the Yishan fault; therefore, the tectonic development is rich with a good runoff condition and small TDS. The structure of Part A is significantly more complex than that of Part B, and the underground runoff conditions and water chemistry vary greatly in Part A under the multiple effects of C7, C8, the East fault of the No.1 coal mine, and the fault of Beigong cun-1.
Thus, it can be deduced that the conditions for groundwater recharge exhibit a remarkable influence on the hydrochemical properties of the groundwater, and when the mine is closed, the flow of groundwater between aquifers becomes higher [60,61]. Thus, the investigation of the hydrochemical characteristics of groundwater has a certain guiding role in the prevention and control of mine water disasters.
4.5. Hydrogeological Conceptual Model
The strata in the Dongtan Coal Mine are covered with the Q and J aquifers, and the overall coalfield is an incomplete syncline basin with an axial direction of north by northeast. Since 2006, the No. 3 coal seam has been the mining layer, and the P aquifer is the main source of water.
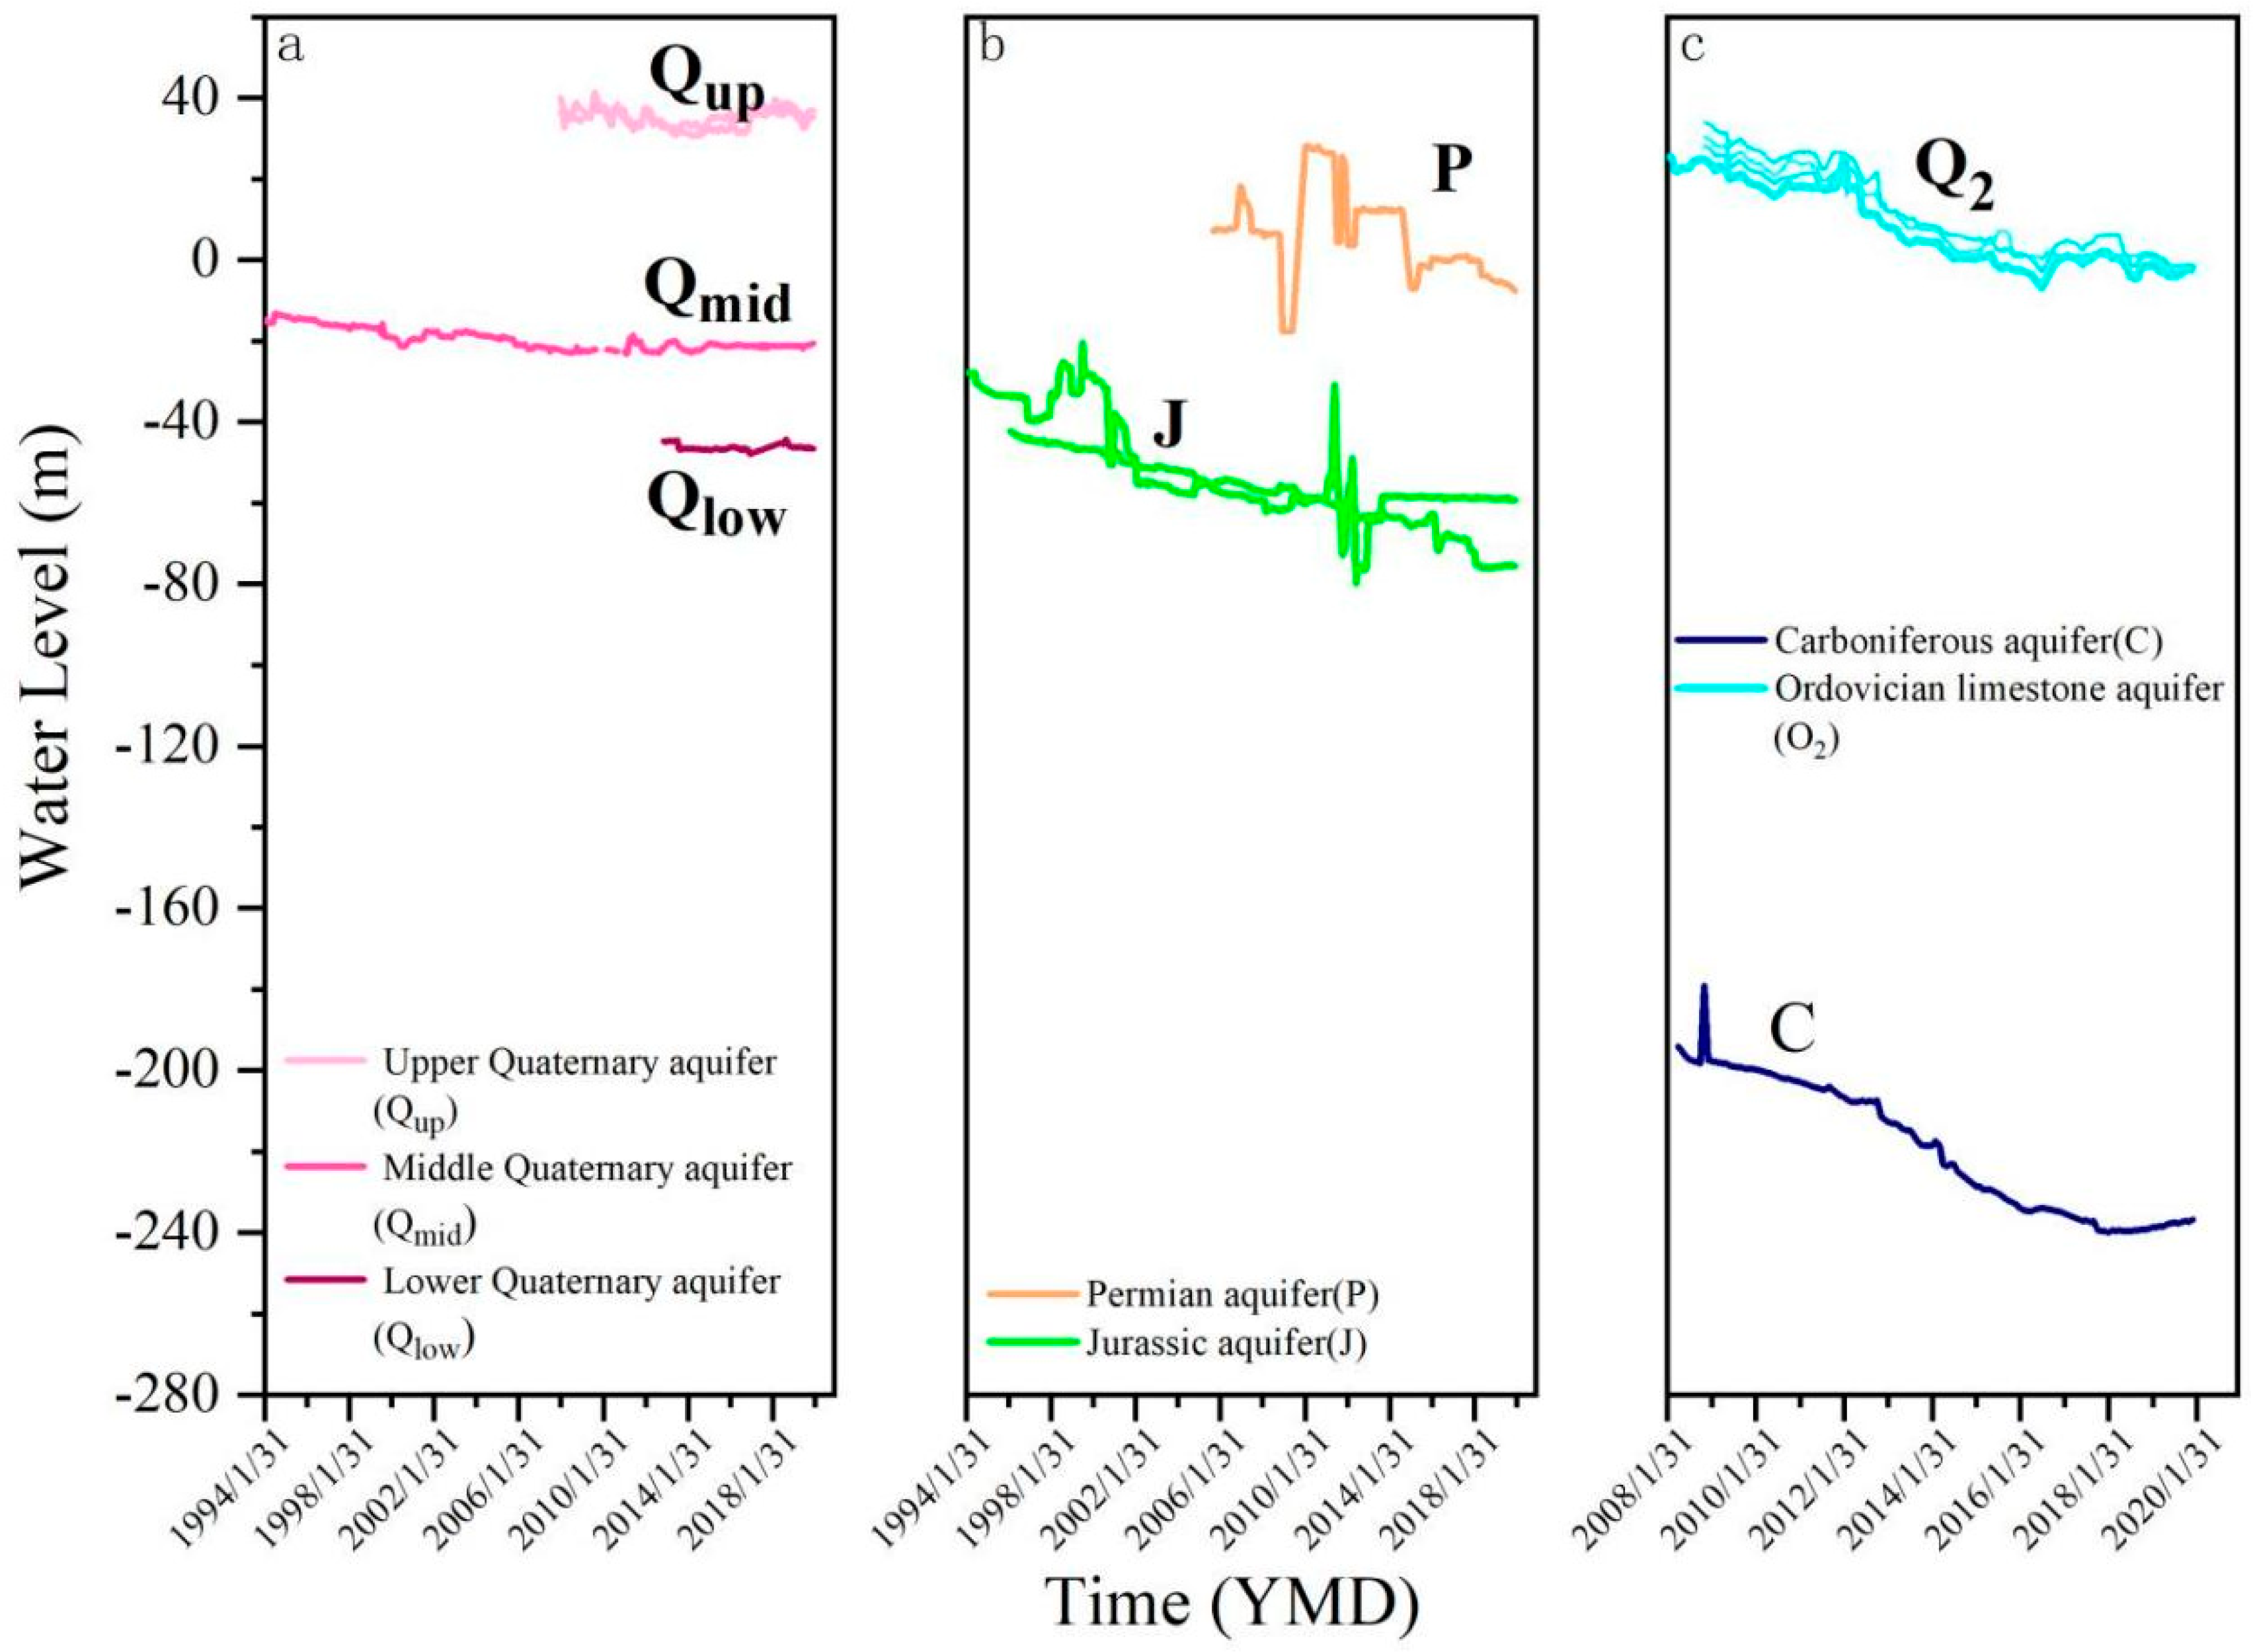
The Q aquifer in the Dongtan Coal Mine is divided into upper (Qup), middle (Qmid) and lower (Qlow) groups, among which the middle group is mainly composed of clay and sandy clay with good water insulation that can better prevent the supply of material from the upper group to the lower group. Figure 8a,b demonstrate that the water level of the Q aquifer, in particular Qlow, is relatively stable, while the water level of the J and P aquifers decreases obviously, indicating that the hydraulic connection between the Q and J aquifers is weak and the chemical evolution of the water between each aquifer is less affected. The J aquifer is an indirect water-filling aquifer in the coal mine, and years of drainage have caused the water level to fall far below that of the P aquifer, with increasingly less influence on the hydrogeochemical properties. The above-mentioned analysis shows that the hydrochemical properties of the P and C aquifers are similar. Figure 8b,c exhibit that the water level of the two are also similar, further indicating that the hydraulic connection between the P and C aquifers is relatively good. Figure 1 exhibits that the Dongtan Coal Mine is located in the core and deep part of the Yanzhou syncline, and the O2 aquifer is deeply buried. The water pressure of the O2 aquifer is high; therefore, the water level is much higher than that of the Carboniferous system. Since the O2 aquifer is an indirect water-filling aquifer of coal 17#, it may be hydraulically connected to coal 17# through faults and other structural fracture zones, resulting in the pyrite in coal 17# flowing into the O2 aquifer along with the groundwater, and subsequently increasing the concentration of SO42− in the O2 aquifer.
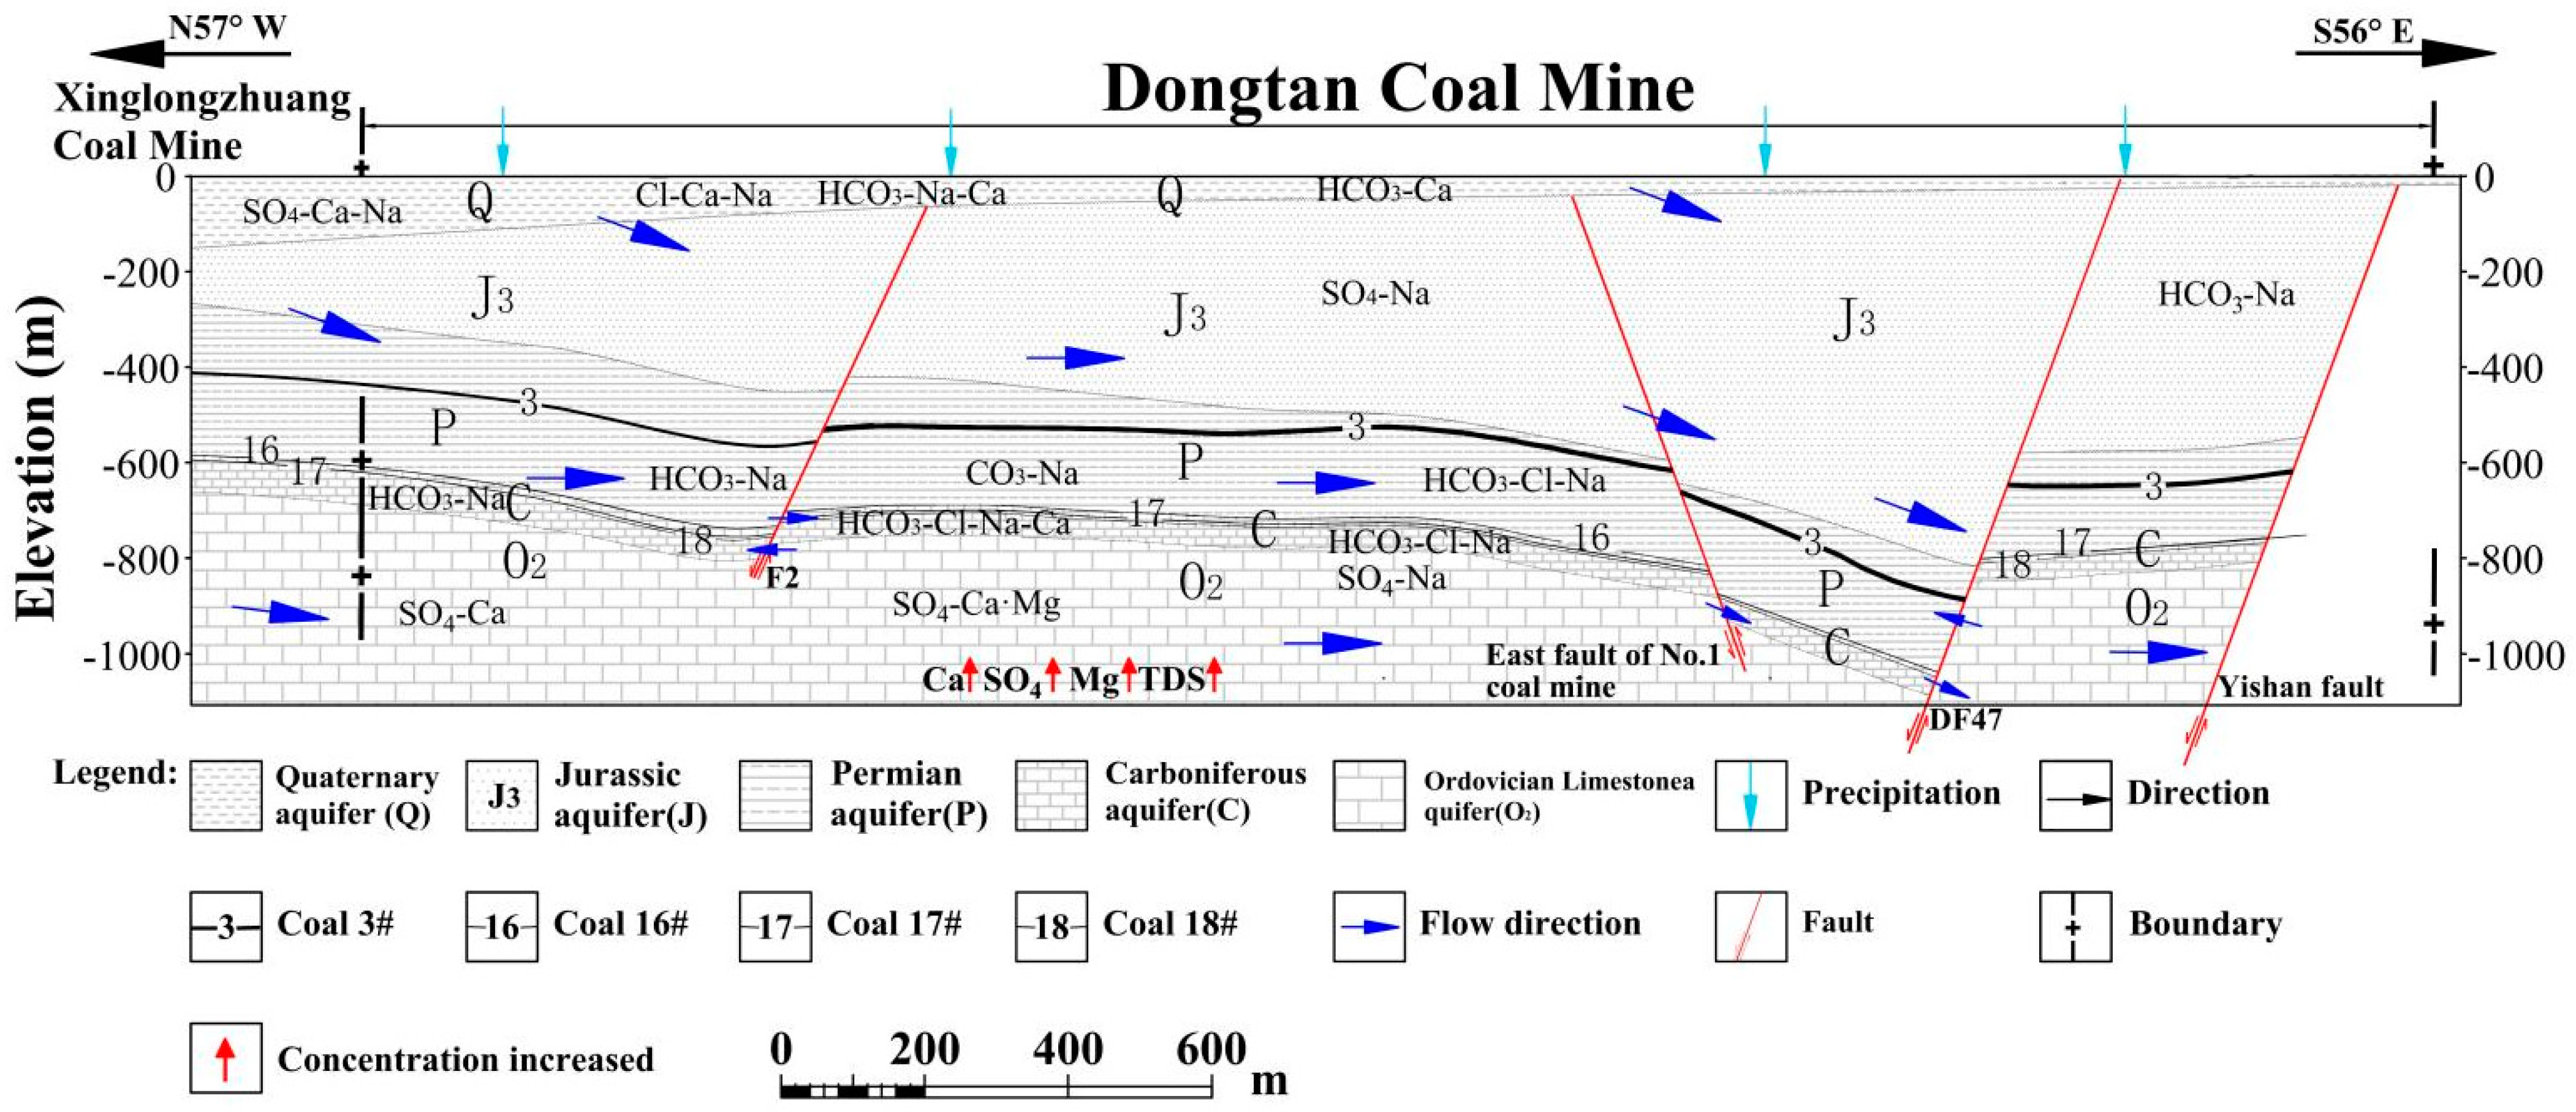
Based on the above analysis, a hydrogeological conceptual model of the Dongtan Coal Mine was established (Figure 9). Owing to the better water-repellent properties of Qmid, although the Q aquifer was recharged by precipitation, its recharging effect on the J and P aquifers was low, and correspondingly, the hydrochemical influence was low. The P aquifer was affected by the dissolution of calcite and dolomite, and cation exchange; therefore, the Na+ and HCO3− content in the aquifer was high. The P and C aquifers exhibit a strong hydraulic connection, meaning that the ion concentration relationship between them is the same, with the hydrochemical types being mainly HCO3-Na and HCO3·Cl-Na. Figure 9 shows that the faults with large fault throws, such as the East fault of the No.1 coal mine and the Yishan fault, can directly connect the overlying aquifers with the O2 aquifer. Although the water level of the O2 aquifer decreased year by year, it could be replenished with atmospheric precipitation, and once connected with the faults, water inrush from O2 could easily occur under pressure. This brings a significant hidden danger to coal mining activity in the area.
5. Conclusions
In this study, the hydrogeochemical characteristics of the multi-layer groundwater system in the Dongtan Coal Mine in the Shandong Province of China were investigated. The study was conducted by investigating hydrogeochemical and statistical methods, which aided in the development of a conceptual hydrogeological model. The following conclusions can be summarized from the results of these investigations.
- The groundwater in the Dongtan Coal Mine is generally alkaline. The soluble minerals, which affect the hydrogeochemical properties of the groundwater, include calcite, dolomite, gypsum, and halite. Moreover, the groundwater was subject to the effects of silicate weathering, cation exchange, and pyrite oxidation. Dolomite dissolution is an important source of Ca2+ and Mg2+, while the weathering of silicate and dissolution of halite are the main sources of Na+. SO42− exhibits the greatest influence on the mineralization and hardness of the groundwater, and it is mainly derived from the dissolution of gypsum and secondarily from pyrite oxidation; the O2 aquifer especially contains pyrite crystals, and the pyrite from the 17# coal seam can also affect the groundwater quality through cracks.
- Q-mode analysis and R-mode clustering analyses were carried out. The Q-mode analysis shows that the water quality of the O2 aquifer is quite different from that of the other aquifers particularly because of the local karst development. The other four aquifers, especially P and C, exhibit similar hydrochemical properties, and the water quality characteristics are related to the distribution of the drill holes of the water samples. The R-mode analysis shows the occurrence of carbonate dissolution, the weathering of silicate, and halite dissolution in the aquifers; and Ca2+, Mg2+, SO42− exhibited the greatest influence on the hardness and salinity of the groundwater. In the future, the O2 aquifer will have a significant impact on the chemical properties of the groundwater in the Dongtan Coal Mine and attention must be paid to it. The results of the correlation analysis are consistent with those of the cluster analysis.
- To ensure the safety of coal mining, a large amount of mine water was discharged from the Dongtan Coal Mine, which resulted in a decrease in the water level of each aquifer to varying degrees. The Q aquifer was replenished by atmospheric precipitation; however, due to the water-repellent effect of Qmid, it had little influence on the recharge effect and chemical properties of the water in the aquifers below it, resulting in a relatively stable water level. Under the influence of mining the 3# coal seam, there exists a good hydraulic connection between the J and P aquifers and the P and C aquifers, and the water chemistry of these aquifers is similar. The Dongtan Coal Mine is located in the core and deep part of the Yanzhou syncline, and the O2 aquifer is deeply buried. Owing to the uneven karst development, regional water-rich distribution, and high water pressure, the O2 aquifer exhibits a significant influence on coal mining activity in the area. The complex geological and drainage conditions in coal mines are also an important cause of the chemical evolution of groundwater. Therefore, preventive measures must be taken in advance to guarantee the safety of coal mining and ensure that the environment is free from pollution.
Author Contributions
Conceptualization, W.Q.; methodology, W.Q. and K.X.; formal analysis, K.X. and Z.W.; investigation, G.Z. and L.F.; resources, G.Z. and L.F.; writing—original draft preparation, K.X.; writing—review and editing, K.X., W.Q., G.Z., L.F., Z.W. and W.L.; supervision, W.Q. and W.L.; funding acquisition, W.Q. All authors have read and agreed to the published version of the manuscript.
Funding
This research was funded by the Fundamental Research Funds of the National Natural Science of China (Grant No, 41772302) and the Priority Academic Program Development of Jiangsu Higher Education Institutions.
Data Availability Statement
Not applicable.
Acknowledgments
The authors are grateful to the people who participated in this study, Wenbin Sun for collaborating on data collection and question development, and Xianggang Cheng, Yuliang Zhang and Shiye Xu for suggestions on an early version of this manuscript. The authors also thankful to the reviewers for their helpful comments.
Conflicts of Interest
The authors declare no conflict of interest.
References
- Chen, S.; Gui, H.R. Hydrogeochemical characteristics of groundwater in the limestone aquifers of the Taiyuan Group and its geological significance in the Suxian mining area. Hydrogeol. Eng. Geol. 2016, 43, 33–41. [Google Scholar] [CrossRef]
- Dong, S.N.; Zheng, L.W.; Tang, S.L.; Shi, P.Z. A Scientometric Analysis of Trends in Coal Mine Water Inrush Prevention and Control for the Period 2000–2019. Mine Water Environ. 2020, 39, 3–12. [Google Scholar] [CrossRef]
- Zhang, S.Y.; Wang, H.; He, X.W.; Guo, S.Q.; Xia, Y.; Zhou, Y.X. Research progress, problems and prospects of mine water treatment technology and resource utilization in China. Crit. Rev. Env. Sci. Tech. 2020, 50, 331–383. [Google Scholar] [CrossRef]
- Agartan, E.; Yazicigil, H. Assessment of water supply impacts for a mine site in western Turkey. Mine Water Environ. 2012, 31, 112–128. [Google Scholar] [CrossRef]
- Luan, J.K.; Zhang, Y.Q.; Tian, J.; Meresa, H.; Liu, D.F. Coal mining impacts on catchment runoff. J. Hydrol. 2020, 589, 125101. [Google Scholar] [CrossRef]
- Zhang, J.C. Investigations of water inrushes from aquifers under coal seams. Int. J. Rock Mech. Min. 2005, 42, 350–360. [Google Scholar] [CrossRef]
- Meng, Z.P.; Li, G.Q.; Xie, X.T. A geological assessment method of floor water inrush risk and its application. Eng. Geol. 2012, 143, 51–60. [Google Scholar] [CrossRef]
- Ma, D.; Cai, X.; Li, Q.; Duan, H.Y. In-Situ and Numerical Investigation of Groundwater Inrush Hazard from Grouted Karst Collapse Pillar in Longwall Mining. Water 2018, 10, 1187. [Google Scholar] [CrossRef] [Green Version]
- Ma, L.; Qian, J.Z.; Zhao, W.D.; Curtis, Z.; Zhang, R.G. Hydrogeochemical analysis of multiple aquifers in a coal mine based on nonlinear PCA and GIS. Environ. Earth Sci. 2016, 75, 716. [Google Scholar] [CrossRef]
- Wu, C.; Wu, X.; Zhu, G.; Qian, C. Predicting mine water inflow and groundwater levels for coal mining operations in the Pangpangta coalfield, China. Environ. Earth Sci. 2019, 78, 130. [Google Scholar] [CrossRef]
- Li, X.; Dong, D.; Liu, K.; Zhao, Y.; Li, M. Identifification of Mine Mixed Water Inrush Source Based on Genetic Algorithm and XGBoost Algorithm: A Case Study of Huangyuchuan Mine. Water 2022, 14, 2150. [Google Scholar] [CrossRef]
- Wu, Q. Progress, problems and prospects of prevention and control technology of mine water and reutilizationin China. J. China Coal Soc. 2014, 39, 795–805. [Google Scholar] [CrossRef]
- Reghunath, R.; Sreedhara Murthy, T.R.; Raghavan, B.R. The utility of multivariate statistical techniques in hydrogeochemical studies:an example from Karnataka, India. Water Res. 2002, 36, 2437–2442. [Google Scholar] [CrossRef]
- Cidu, R.; Biddau, R.; Fanfani, L. Impact of past mining activity on the quality of groundwater in SW Sardinia (Italy). J. Geochem. Explor. 2009, 100, 125–132. [Google Scholar] [CrossRef]
- Li, P.Y.; Qian, H.; Wu, J.H.; Zhang, Y.Q.; Zhang, H.B. Major Ion Chemistry of Shallow Groundwater in the Dongsheng Coalfifield, Ordos Basin, China. Mine Water Environ. 2013, 32, 195–206. [Google Scholar] [CrossRef]
- Arkoc, O.; Ucar, S.; Ozcan, C. Assessment of impact of coal mining on ground and surface waters in Tozakh coal field, Kirklareli, northeast of Thrace, Turkey. Environ. Earth Sci. 2016, 75, 514. [Google Scholar] [CrossRef]
- Qiao, W.; Li, W.P.; Zhang, S.C.; Niu, Y.F. Effects of coal mining on the evolution of groundwater hydrogeochemistry. Hydrogeol. J. 2019, 27, 2245–2262. [Google Scholar] [CrossRef]
- Qiu, H.L.; Gui, H.R.; Fang, P.; Li, G.P. Hydrogeochemistry and Quality Assessment of Groundwater Based on Fuzzy Analytical Hierarchy Process: A Case Study from Sulin Coal-Mining District in Northern Anhui, China. Pol. J. Environ. Stud. 2021, 30, 3203–3211. [Google Scholar] [CrossRef]
- Singh, A.K.; Mahato, M.K.; Neogi, B.; Singh, K.K. Quality assessment of mine water in the Raniganj coalfeld area, India. Mine Water Environ. 2010, 29, 248–262. [Google Scholar] [CrossRef]
- Utom, A.U.; Odoh, B.I.; Egboka, B.C.E. Assessment of hydrogeochemical characteristics of groundwater quality in the vicinity of Okpara coal and Obwetti freclay mines, near Enugu town, Nigeria. Appl. Water Sci. 2013, 3, 271–283. [Google Scholar] [CrossRef]
- Wu, J.H.; Li, P.Y.; Qian, H.; Duan, Z.; Zhang, X.D. Using correlation and multivariate statistical analysis to identify hydrogeochemical processes affecting the major ion chemistry of waters: A case study in Laoheba phosphorite mine in Sichuan, China. Arab J. Geosci. 2014, 7, 3973–3982. [Google Scholar] [CrossRef]
- Wang, W.; Qiang, Y.X.; Wang, Y.; Sun, Q.M.; Zhang, M. Impacts of Yuyang coal mine on groundwater quality in Hongshixia water source, Northwest China: A physicochemical and modeling research. Expo. Health 2016, 8, 431–442. [Google Scholar] [CrossRef]
- Li, P.Y.; Tian, R.; Xue, C.Y.; Wu, J.H. Progress, opportunities, and key fields for groundwater quality research under the impacts of human activities in China with a special focus on western China. Environ. Sci. Pollut. Res. 2017, 24, 13224–13234. [Google Scholar] [CrossRef] [PubMed]
- Kumar, P.; Singh, A.K. Hydrogeochemistry and quality assessment of surface and sub-surface water resources in Raniganj coalfield area, Damodar Valley, India. Int. J. Environ. Anal. Chem. 2020, 2, 9653. [Google Scholar] [CrossRef]
- Hao, C.M.; Huang, Y.; Ma, D.J.; Fan, X. Hydro-geochemistry evolution in Ordovician limestone water induced by mountainous coal mining: A case study from North China. J. Mt. Sci. 2020, 17, 5485. [Google Scholar] [CrossRef]
- Gao, X.B.; Wang, Y.X.; Ma, T.; Hu, Q.H.; Xing, X.L.; Yu, Q. Anthropogenic impact assessment of Niangziguan karst water. Water Manag. 2011, 164, 495–510. [Google Scholar] [CrossRef] [Green Version]
- Lin, Y.; Ren, H.X.; Wu, Y.Z.; Cao, F.L.; Jia, F.J.; Qu, P.C. The evolution of hydrogeochemical characteristics of a typical piedmont karst groundwater system in a coal-mining area, Northern China. Environ. Earth Sci. 2019, 78, 557. [Google Scholar] [CrossRef]
- Cao, D.T. A hydrogeological property of Jurassic red strata in Yanzhou coal mining area. Coal Geol. Explor. 2007, 35, 54–57. [Google Scholar]
- Hu, Z.X.; Han, B.P.; Wang, X.Y. Occurrence Features and Hydrogeotogical significance of Red Bed in Yanzhou Coal Field. Coal Sci. Technol. Mag. 2002, 1, 15–17. [Google Scholar]
- Liu, R.X. Analysison Features of Ordovician LimestoneWatery in Yanzhou Coalfield. Coal Sci. Technol. 2009, 37, 112–115. [Google Scholar] [CrossRef]
- Wu, Q.; Jia, X.; Cao, D.T.; Liang, Y.P. Impermeability evaluation method and its application on the ancient weathering crust of carbonatite in middle ordovician system in North China coalfild. J. China Coal Soc. 2014, 39, 1735–1741. [Google Scholar] [CrossRef]
- Bian, Y.Y.; Zhao, D.; Han, Y. Hydrochemical Characteristics and Formation Mechanism of Ordovician Limestone Groundwater in the Yanzhou Coalfield. Acta Geosci. Sin. 2017, 38, 236–242. [Google Scholar] [CrossRef]
- Han, Y.; Wang, G.C.; Charles, A.C.; Hu, W.Y.; Bian, Y.Y.; Zhang, Z.W.; Liu, Y.Y. Hydrogeochemical evolution of Ordovician limestone groundwater in Yanzhou, North China. Hydrol. Process 2013, 27, 2247–2257. [Google Scholar] [CrossRef]
- Li, K. Study on hydrogeologic conditions of Ordovician limestone aquifer in medium deep section of Yanzhou Coal Field. Coal Sci. Technol. 2016, 44, 146–149. [Google Scholar] [CrossRef]
- Qiao, W.; Howard, K.W.F.; Li, W.P.; Zhang, S.C.; Zhang, X.; Niu, Y.F. Coordinated exploitation of both coal and deep groundwater resources. Environ. Earth Sci. 2020, 79, 120. [Google Scholar] [CrossRef]
- Hou, J.H.; Xie, C.L.; Zhang, D. Hydrochemical Characteristics and Genesis of Underground Water of Ordovician Limestone in Dongtan Mine. Shandong Coal Sci. Technol. 2021, 10, 177–180. [Google Scholar] [CrossRef]
- Xiang, X.R. Study on Hydro-Chemical Characteristics and Evolution of Groundwater and Discriminating Models of Water Brusting in Xinglongzhuang Coalmine; North China Institute of Science & Technology: Langfang, China, 2016. [Google Scholar]
- Niu, Y.F.; Qiao, W.; Lei, L.J.; Tian, Y. Research of floor water inrush risk near water-bearing fault under high crustal stress. J. Eng. Geol. 2016, 24, 756–764. [Google Scholar] [CrossRef]
- Dong, J.; Wang, H.; Qin, S.; Fu, F.C.; Sun, N.H.; Meng, Q.J.; Feng, Q.Y. Evolution of water environment under the influence of mining in Yanzhou coalfield. China Min. Mag. 2020, 29, 127–132. [Google Scholar] [CrossRef]
- Zhang, X. Water Abundance Law of Ordovician and Water Inrush Forecast in Yanzhou Mine Area. Ph.D. Thesis, China of Mining and Technology University, Xuzhou, China, 2016. [Google Scholar]
- Xu, H.; Hou, Z.H.; An, Z.S.; Liu, X.Y.; Dong, J.B. Major ion chemistry of waters in Lake Qinghai catchments, NE Qinghai-Tibet plateau, China. Quatern Int. 2010, 212, 37–41. [Google Scholar] [CrossRef]
- Jiang, Y.J.; Wu, Y.X.; Groves, C.; Yuan, D.X.; Kambesis, P. Natural and anthropogenic factors affecting the groundwater quality in the Nandong karst underground river system in Yunan, China. J. Contam. Hydrol. 2009, 109, 49–61. [Google Scholar] [CrossRef]
- Singh, A.K.; Mahato, M.K.; Neogi, B.; Mondal, G.C.; Singh, T.B. Hydrogeochemistry, elemental flux, and quality assessment of mine water in the Pootkee-Balihari Mining Area, Jharia coalfield, India. Mine Water Environ. 2011, 30, 197. [Google Scholar] [CrossRef]
- Adhikari, K.; Mal, U. Application of multivariate statistics in the analysis of groundwater geochemistry in and around the open cast coal mines of Barjora block, Bankura district, West Bengal, India. Environ. Earth Sci. 2019, 78, 72. [Google Scholar] [CrossRef]
- Hu, C.H.; Zhou, W.B.; Xia, S.Q. characteristics of major ions and the influence factors in poyang lake catchment. Environ. Chem. 2011, 30, 1620–1626. [Google Scholar]
- Zhang, R.X.; Wu, P.; Ye, H.J.; Li, X.X. Hydrogeochemical Characteristics and Quality Assessment of Mine Water in Coalfeld Area, Guizhou Province, Southwest China. Bull. Environ. Contam. Toxicol. 2021, 107, 1087–1094. [Google Scholar] [CrossRef] [PubMed]
- Qin, S.Y.; Li, Z.Q.; Xu, M. Groundwater Chemical Characteristics and Recharge Source Identification of Heilongtan Spring Area. Yellow River 2020, 42, 63–67. [Google Scholar] [CrossRef]
- Gad, M.; Elsayed, S.; Moghanm, F.S.; Almarshadi, M.H.; Alshammari, A.S.; Khedher, K.M.; Eid, E.M.; Hussein, H. Combining Water Quality Indices and Multivariate Modeling to Assess Surface Water Quality in the Northern Nile Delta, Egypt. Water 2020, 12, 2142. [Google Scholar] [CrossRef]
- Touche, G.D.L.; Alexander, S.; Birch, J.; Gwynn, X. Application of Multivariate Statistical Methods to Hydrogeological Property Parameterisation from Geotechnical and Geophysical Data. Mine Water Environ. 2019, 38, 695–699. [Google Scholar] [CrossRef]
- Spanos, T.; Ene, A.; Xatzixristou, C.; Papaioannou, A. Assessment of groundwater quality and hydrogeological profile of Kavala area, Northern Greece. Rom. J. Phys. 2015, 60, 1139–1150. [Google Scholar] [CrossRef]
- Liu, H.H.; Yang, J.; Ye, M.; Tang, Z.H.; Jie, D.; Xing, T.J. Using one-way clustering and co-clustering methods to reveal spatio-temporal patterns and controlling factors of groundwater geochemistry. J. Hydrol. 2021, 603, 127085. [Google Scholar] [CrossRef]
- Li, P.Y.; Tian, R.; Liu, R. Solute Geochemistry and Multivariate Analysis of Water Quality in the Guohua Phosphorite Mine, Guizhou Province, China. Expo. Health 2019, 11, 81–94. [Google Scholar] [CrossRef]
- Acharya, B.S.; Kharel, G. Acid mine drainage from coal mining in the United States–An overview. J. Hydrol. 2020, 588, 125061. [Google Scholar] [CrossRef]
- Heidel, C.; Tichomirowa, M. The isotopic composition of sulfate from anaerobic and low oxygen pyrite oxidation experiments with ferric iron—New insights into oxidation mechanisms. Chem. Geol. 2011, 281, 305–316. [Google Scholar] [CrossRef]
- Chen, Y.; Zhu, S.Y.; Xiao, S.J. Discussion on controlling factors of hydrogeochemistry and hydraulic connections of groundwater in diferent mining districts. Nat. Hazards 2019, 99, 689–704. [Google Scholar] [CrossRef]
- Narany, T.S.; Ramli, M.F.; Aris, A.Z.; Sulaiman, W.N.A.; Juahir, H.; Fakharian, K. Identification of the Hydrogeochemical Processes in Groundwater Using Classic Integrated Geochemical Methods and Geostatistical Techniques, in Amol-Babol Plain, Iran. Sci. World J. 2014, 5, 1–15. [Google Scholar] [CrossRef] [Green Version]
- Ren, F.H.; Shen, Z.L. Hydrogeochemistry; Encyclopaedia of China Publishing House: Beijing, China, 1993. [Google Scholar]
- Wang, L.H.; Dong, Y.H.; Xu, Z.F.; Qiao, X.J. Hydrochemical and isotopic characteristics of groundwater in the northeastern Tennger Desert, northern China. Hydrogeol. J. 2017, 25, 2363. [Google Scholar] [CrossRef]
- Ma, M.; Liu, Z.B.; Ma, X.M.; Zhao, R.J.; Mao, D.Q. Exploration of Ordovician limestone aquifer heterogeneity with tomographic water releasing tests. J. Hydrol. 2022, 608, 127655. [Google Scholar] [CrossRef]
- Jeong, S.W.; Wu, Y.H.; Cho, Y.C.; Ji, S.W. Flow behavior and mobility of contaminated waste rock materials in the abandoned Imgi mine in Korea. Geomorphology 2018, 301, 79–91. [Google Scholar] [CrossRef]
- Sun, Y.J.; Zhang, L.; Xu, Z.M.; Chen, G.; Zhao, X.M.; Li, X.; Gao, Y.T.; Zhang, S.G.; Zhu, L.L. Multi-field action mechanism and research progress of coal mine water quality formation and evolution. J. China Coal Soc. 2022, 47, 423–437. [Google Scholar] [CrossRef]
Figure 1.
Map of the study area and water sample locations (A-A′ is geological cross section of the Yanzhou coal field).
Figure 1.
Map of the study area and water sample locations (A-A′ is geological cross section of the Yanzhou coal field).

Figure 2.
Piper Diagram.

Figure 3.
Cluster analysis pedigree: (a) Q cluster analysis; (b) R cluster analysis.

Figure 4.
Relationship between ions: (a) Ca2+/HCO3−; (b) Mg2+/HCO3−; (c) Ca2+/SO42−; (d) Na+/Cl−; (e) (SO4)/(Ca+Mg); (f) (Na-Cl)/(Ca+Mg-SO4-HCO3).
Figure 4.
Relationship between ions: (a) Ca2+/HCO3−; (b) Mg2+/HCO3−; (c) Ca2+/SO42−; (d) Na+/Cl−; (e) (SO4)/(Ca+Mg); (f) (Na-Cl)/(Ca+Mg-SO4-HCO3).

Figure 5.
Relationship between different mineral saturation and ion concentration: (a) Calcite; (b) Dolomite; (c,d) Gypsum.
Figure 5.
Relationship between different mineral saturation and ion concentration: (a) Calcite; (b) Dolomite; (c,d) Gypsum.

Figure 6.
TDS Equivalent Diagram of the Ordovician aquifer in the Dongtan Coal Mine.

Figure 7.
Water level Equivalent Diagram of the Ordovician aquifer in the Dongtan Coal Mine.

Figure 8.
Water level-time relationship diagram of the Dongtan Coal Mine: (a) Quaternary aquifer (Qup, Qmid, Qlow); (b) Jurassic and Permian aquifer (J and P); (c) Carboniferous and Ordovician limestone aquifer (C and O2).
Figure 8.
Water level-time relationship diagram of the Dongtan Coal Mine: (a) Quaternary aquifer (Qup, Qmid, Qlow); (b) Jurassic and Permian aquifer (J and P); (c) Carboniferous and Ordovician limestone aquifer (C and O2).

Figure 9.
Hydrogeological conceptual model of the Dongtan Coal Mine.


Table 1.
Groundwater samples from the Dongtan Coal Mine (all indices are expressed in mg·L−1 except pH and Saturation Index (SI)).
Table 1.
Groundwater samples from the Dongtan Coal Mine (all indices are expressed in mg·L−1 except pH and Saturation Index (SI)).
| No. | Sample Location | Label | Ca2+ | Mg2+ | Na+ | HCO3− | SO42− | Cl− | pH | TDS | TH | Type | SI (Calcite) | SI (Dolomite) | SI (Gypsum) | SI (Halite) |
|---|---|---|---|---|---|---|---|---|---|---|---|---|---|---|---|---|
| 1 | Quaternary aquifer | Q-1 | 225.55 | 21.14 | 70.05 | 543.88 | 155.09 | 125.13 | 7.80 | 874.36 | 650.32 | HCO3-Ca | 3.62 | 6.39 | 1.03 | −4.07 |
| 2 | Q-2 | 169.14 | 6.23 | 126.32 | 23.61 | 500.32 | 102.01 | 10.60 | 931.30 | 448.05 | SO4-Ca·Na | 3.54 | 5.76 | 1.39 | −3.95 | |
| 3 | Q-3 | 23.20 | 3.66 | 15.41 | 31.56 | 12.85 | 48.14 | 7.54 | 119.43 | 73.01 | Cl-Ca·Na | 1.83 | 3 | −0.13 | −4.95 | |
| 4 | Q-4 | 26.81 | 12.38 | 53.61 | 196.97 | 30.03 | 40.60 | 8.38 | 272.13 | 117.94 | HCO3-Na·Ca | 3.11 | 6.08 | −0.14 | −4.57 | |
| 5 | Jurassic aquifer | J-1 | 68.39 | 0.22 | 113.05 | 0.00 | 189.41 | 77.42 | 11.38 | 499.33 | 171.69 | SO4·Cl-Na·Ca | −1.39 | −6.65 | ||
| 6 | J-2 | 44.15 | 17.73 | 143.11 | 280.83 | 168.72 | 62.34 | 7.90 | 577.19 | 10.27 | HCO3·SO4-Na | 0.43 | 0.8 | −1.65 | −6.64 | |
| 7 | J-3 | 83.13 | 10.80 | 273.57 | 36.42 | 488.99 | 161.01 | 9.38 | 1103.55 | 252.07 | SO4·Cl-Na·Ca | 1.07 | 1.58 | −1.06 | −5.98 | |
| 8 | J-4 | 13.21 | 6.77 | 295.37 | 126.68 | 442.06 | 49.49 | 9.00 | 911.82 | 60.87 | SO4-Na | 0.52 | 1.1 | −1.86 | −6.45 | |
| 9 | J-5 | 16.83 | 3.42 | 105.32 | 76.03 | 78.20 | 74.23 | 8.60 | 365.40 | 56.12 | Cl·SO4-Na | 0.22 | 0.1 | −2.25 | −6.68 | |
| 10 | J-6 | 1.51 | 0.02 | 205.70 | 9.71 | 9.56 | 64.97 | 11.19 | 475.64 | 3.78 | Cl-Na | −0.19 | −2.03 | −4.21 | −6.44 | |
| 11 | J-7 | 8.02 | 0.73 | 243.94 | 89.07 | 188.51 | 93.41 | 9.80 | 580.34 | 23.03 | SO4·Cl-Na | 0.84 | 1.02 | −2.38 | −6.24 | |
| 12 | J-8 | 5.15 | 1.68 | 161.54 | 212.74 | 67.37 | 54.72 | 8.40 | 421.60 | 19.77 | HCO3-Na | −0.06 | −0.26 | −2.85 | −6.63 | |
| 13 | J-9 | 25.34 | 14.89 | 103.85 | 256.28 | 39.85 | 74.01 | 8.10 | 392.34 | 124.56 | HCO3-Na | 0.42 | 0.96 | −2.42 | −6.69 | |
| 14 | J-10 | 28.96 | 10.36 | 118.36 | 0.00 | 142.41 | 74.41 | 11.60 | 443.61 | 114.99 | SO4·Cl-Na | −1.85 | −6.64 | |||
| 15 | J-11 | 1.10 | 0.02 | 195.45 | 140.81 | 66.68 | 93.04 | 9.53 | 488.89 | 2.76 | Cl·HCO3-Na | 0.04 | −1.27 | −3.62 | −6.32 | |
| 16 | J-12 | 35.52 | 19.62 | 171.98 | 419.40 | 100.26 | 45.77 | 8.20 | 603.72 | 169.49 | HCO3-Na | 0.81 | 1.71 | −1.97 | −6.7 | |
| 17 | J-13 | 25.09 | 10.14 | 99.35 | 255.15 | 71.15 | 26.34 | 8.20 | 365.52 | 104.40 | HCO3-Na | 0.5 | 0.97 | −2.17 | −7.16 | |
| 18 | J-14 | 34.97 | 4.49 | 438.71 | 105.39 | 914.16 | 54.75 | 7.70 | 1501.42 | 105.82 | SO4-Na | −0.51 | −1.58 | −1.26 | −6.26 | |
| 19 | J-15 | 21.40 | 3.24 | 274.19 | 77.27 | 530.55 | 51.48 | 8.20 | 943.74 | 66.78 | SO4-Na | −0.25 | −0.99 | −1.57 | −6.47 | |
| 20 | J-16 | 28.91 | 5.68 | 209.55 | 190.22 | 229.28 | 93.84 | 8.50 | 672.57 | 95.58 | SO4·HCO3-Na | 0.64 | 0.93 | −1.71 | −6.3 | |
| 21 | Permian sandstone aquifer | P-1 | 5.43 | 0.33 | 555.08 | 1295.01 | 7.00 | 83.43 | 8.50 | 1320.49 | 0.84 | HCO3-Na | 0.63 | 0.44 | −0.41 | −5.96 |
| 22 | P-2 | 6.25 | 0.00 | 476.54 | 1172.54 | 6.17 | 60.03 | 8.00 | 1135.50 | 0.87 | HCO3-Na | 0.23 | −4.01 | −6.16 | ||
| 23 | P-3 | 403.20 | 26.69 | 704.65 | 0.00 | 31.28 | 124.60 | 12.90 | 1390.03 | 1117.00 | Cl-Na·Ca | −2.02 | −5.78 | |||
| 24 | P-4 | 125.57 | 20.12 | 112.52 | 488.77 | 165.87 | 25.67 | 8.00 | 726.66 | 396.53 | HCO3·SO4-Ca·Na | 1.18 | 1.92 | −1.29 | −7.15 | |
| 25 | P-5 | 13.78 | 0.02 | 47.73 | 7.28 | 39.17 | 19.40 | 10.34 | 196.20 | 34.42 | SO4·Cl-Na | 0.51 | −1.49 | −2.54 | −7.58 | |
| 26 | P-6 | 31.10 | 0.02 | 339.73 | 0.00 | 19.88 | 10.11 | 11.87 | 621.03 | 77.67 | SO4·Cl-Na | −2.69 | −7.06 | |||
| 27 | P-7 | 4.68 | 5.30 | 53.58 | 138.38 | 1.00 | 31.58 | 8.46 | 179.49 | 33.49 | HCO3·Cl-Na | −0.14 | 0.13 | −4.6 | −7.32 | |
| 28 | P-8 | 64.59 | 18.53 | 56.65 | 354.17 | 46.14 | 10.66 | 7.44 | 374.18 | 237.61 | HCO3-Ca·Na | 0.28 | 0.36 | −1.99 | −7.8 | |
| 29 | P-9 | 46.90 | 30.34 | 37.12 | 170.71 | 41.75 | 27.40 | 7.40 | 415.37 | 242.02 | HCO3-Mg·Ca | −0.2 | −0.23 | −2.15 | −7.57 | |
| 30 | P-10 | 60.64 | 0.00 | 194.30 | 0.00 | 118.54 | 96.28 | 11.60 | 643.10 | 151.48 | SO4·Cl-Na·Ca | −1.64 | −6.32 | |||
| 31 | P-11 | 7.07 | 4.76 | 123.82 | 291.34 | 1.53 | 47.75 | 7.97 | 339.13 | 37.27 | HCO3-Na | −0.18 | −0.17 | −4.31 | −6.8 | |
| 32 | P-12 | 4.18 | 0.76 | 694.79 | 1502.97 | 15.01 | 186.79 | 8.20 | 1654.72 | 13.56 | HCO3-Na | 0.29 | 0.22 | −3.19 | −5.53 | |
| 33 | P-13 | 67.19 | 0.13 | 355.29 | 0.00 | 66.68 | 49.90 | 12.23 | 661.02 | 168.32 | Cl-Na | −1.98 | −6.38 | |||
| 34 | P-14 | 50.78 | 13.13 | 226.11 | 262.45 | 339.98 | 38.50 | 8.40 | 832.26 | 180.92 | SO4·HCO3-Na | 0.88 | 1.52 | −1.37 | −6.67 | |
| 35 | P-15 | 6.12 | 1.59 | 723.03 | 1603.52 | 8.38 | 174.53 | 8.20 | 1718.26 | 21.83 | HCO3-Na | 0.47 | 0.74 | −4.01 | −5.54 | |
| 36 | P-16 | 7.31 | 4.17 | 1121.08 | 1408.82 | 6.19 | 742.25 | 8.70 | 2699.54 | 35.44 | HCO3·Cl-Na | 0.88 | 1.91 | −4.21 | −4.75 | |
| 37 | P-17 | 4.01 | 0.49 | 176.73 | 0.00 | 143.65 | 44.49 | 12.00 | 488.09 | 12.01 | SO4-Na | −2.74 | −6.7 | |||
| 38 | P-18 | 10.75 | 3.13 | 1102.25 | 1461.38 | 5.15 | 742.25 | 8.40 | 2694.18 | 39.74 | HCO3·Cl-Na | 0.82 | 1.49 | −4.08 | −4.75 | |
| 39 | Carboniferous aquifer | C-1 | 81.73 | 7.83 | 144.57 | 307.66 | 85.57 | 124.10 | 7.80 | 679.87 | 236.29 | HCO3·Cl-Na·Ca | 0.65 | 0.63 | −1.67 | −6.34 |
| 40 | C-2 | 4.18 | 0.76 | 694.79 | 1502.97 | 15.01 | 186.79 | 8.20 | 1654.72 | 13.56 | HCO3-Na | 0.29 | 0.22 | −3.19 | −5.53 | |
| 41 | C-3 | 6.99 | 3.71 | 529.00 | 1136.86 | 42.95 | 117.06 | 8.00 | 1269.69 | 32.74 | HCO3-Na | 0.25 | 0.59 | −3.15 | −5.83 | |
| 42 | C-4 | 81.73 | 10.43 | 141.84 | 288.43 | 86.60 | 124.10 | 7.80 | 669.43 | 247.03 | HCO3·Cl-Na·Ca | 0.62 | 0.7 | −1.67 | −6.35 | |
| 43 | C-5 | 86.03 | 20.87 | 118.53 | 358.93 | 90.72 | 103.66 | 7.50 | 659.57 | 300.74 | HCO3·Cl-Na·Ca | 0.42 | 0.58 | −1.65 | −6.51 | |
| 44 | C-6 | 12.90 | 3.65 | 674.83 | 999.89 | 131.96 | 341.88 | 8.30 | 1668.39 | 47.26 | HCO3·Cl-Na | 0.7 | 1.23 | −2.48 | −5.28 | |
| 45 | C-7 | 37.47 | 31.81 | 82.74 | 269.76 | 105.77 | 49.21 | 7.90 | 445.61 | 224.56 | HCO3·SO4-Na·Mg | 0.37 | 1.02 | −1.9 | −6.98 | |
| 46 | C-8 | 15.48 | 3.13 | 683.12 | 1007.58 | 132.99 | 340.45 | 8.00 | 1682.28 | 51.55 | HCO3·Cl-Na | 0.51 | 0.68 | −2.38 | −5.27 | |
| 47 | C-9 | 131.62 | 28.43 | 82.65 | 256.38 | 317.52 | 69.90 | 7.90 | 786.77 | 445.73 | SO4·HCO3-Ca·Na | 0.8 | 1.28 | −1.02 | −6.85 | |
| 48 | C-10 | 23.03 | 13.19 | 32.65 | 201.51 | 1.02 | 38.65 | 7.62 | 220.15 | 111.83 | HCO3-Na·Ca·Mg | −0.15 | −0.2 | −3.96 | −7.46 | |
| 49 | C-11 | 64.59 | 18.53 | 56.65 | 354.17 | 46.14 | 10.66 | 7.44 | 374.18 | 237.61 | HCO3-Ca·Na | 0.28 | 0.36 | −1.99 | −7.8 | |
| 50 | Ordovician limestone aquifer | O2-1 | 580.81 | 132.56 | 223.08 | 158.00 | 2076.93 | 245.65 | 7.40 | 3338.57 | 1996.09 | SO4-Ca | 0.43 | 0.56 | −0.01 | −5.96 |
| 51 | O2-2 | 655.10 | 135.90 | 156.17 | 147.42 | 1835.03 | 299.56 | 7.80 | 3156.12 | 2195.38 | SO4-Ca | 0.89 | 1.42 | −0.01 | −6.02 | |
| 52 | O2-3 | 657.83 | 133.57 | 224.00 | 202.97 | 2100.52 | 261.92 | 7.40 | 3480.86 | 2192.58 | SO4-Ca | 0.59 | 0.82 | 0.03 | −5.93 | |
| 53 | O2-4 | 649.51 | 145.94 | 128.51 | 211.96 | 2135.44 | 155.15 | 7.80 | 3321.10 | 2222.73 | SO4-Ca | 1.02 | 1.71 | 0.03 | −6.39 | |
| 54 | O2-5 | 651.59 | 145.18 | 128.69 | 205.53 | 2145.42 | 155.98 | 7.20 | 3330.19 | 2224.81 | SO4-Ca | 0.38 | 0.44 | 0.04 | −6.39 | |
| 55 | O2-6 | 611.52 | 158.25 | 136.17 | 176.90 | 2105.74 | 128.88 | 7.40 | 3229.56 | 2178.58 | SO4-Ca·Mg | 0.51 | 0.76 | 0.01 | −6.45 | |
| 56 | O2-7 | 20.88 | 10.13 | 691.31 | 436.76 | 678.64 | 320.33 | 8.30 | 2044.45 | 93.86 | SO4·Cl-Na | 0.49 | 1.0 | −1.64 | −5.31 | |
| 57 | O2-8 | 265.33 | 71.57 | 38.89 | 242.79 | 736.48 | 18.17 | 7.30 | 1252.33 | 957.22 | SO4-Ca·Mg | 0.36 | 0.48 | −0.53 | −7.79 | |
| 58 | O2-9 | 93.26 | 32.82 | 451.39 | 799.02 | 420.10 | 110.11 | 8.40 | 1540.59 | 368.03 | HCO3·SO4-Na | 1.52 | 2.95 | −1.19 | −5.95 | |
| 59 | O2-10 | 602.78 | 135.46 | 112.38 | 79.64 | 1885.73 | 151.29 | 6.00 | 2928.48 | 2062.88 | SO4-Ca | −1.62 | −3.55 | −0.01 | −6.45 | |
| 60 | O2-11 | 304.21 | 72.75 | 34.04 | 0.00 | 903.88 | 17.08 | 7.20 | 1332.96 | 1059.14 | SO4-Ca·Mg | −0.41 | −7.88 | |||
| 61 | O2-12 | 308.52 | 69.34 | 31.91 | 233.95 | 827.35 | 9.35 | 7.40 | 1363.81 | 1055.91 | SO4-Ca·Mg | 0.5 | 0.68 | −0.44 | −8.17 | |
| 62 | O2-13 | 289.11 | 71.96 | 32.50 | 196.01 | 832.52 | 19.52 | 8.00 | 1343.93 | 1018.20 | SO4-Ca·Mg | 1.0 | 1.74 | −0.46 | −7.84 | |
| 63 | O2-14 | 196.70 | 46.39 | 703.33 | 241.80 | 1859.54 | 72.78 | 7.60 | 3002.73 | 682.17 | SO4-Na | 0.36 | 0.42 | −0.44 | −5.98 | |
| 64 | O2-15 | 196.26 | 47.18 | 703.33 | 239.26 | 1819.73 | 71.96 | 7.50 | 2961.30 | 684.35 | SO4-Na | 0.26 | 0.22 | −0.45 | −5.98 | |
| 65 | O2-16 | 233.16 | 58.07 | 867.32 | 228.66 | 2035.66 | 278.60 | 7.70 | 3587.89 | 821.31 | SO4-Na | 0.49 | 0.71 | −0.38 | −5.32 | |
| 66 | O2-17 | 237.32 | 56.05 | 897.23 | 220.95 | 2060.60 | 282.77 | 7.80 | 3646.95 | 823.39 | SO4-Na | 0.58 | 0.87 | −0.37 | −5.3 | |
| 67 | O2-18 | 646.93 | 148.45 | 130.37 | 188.84 | 1990.50 | 134.39 | 7.80 | 3145.23 | 2,226.60 | SO4-Ca | 0.98 | 1.65 | 0.01 | −6.45 | |
| 68 | O2-19 | 643.87 | 152.95 | 130.37 | 193.97 | 2016.69 | 129.32 | 7.50 | 3170.39 | 2237.52 | SO4-Ca·Mg | 0.68 | 1.07 | 0.01 | −6.46 | |
| 69 | O2-20 | 661.17 | 140.64 | 121.34 | 205.11 | 2015.70 | 150.56 | 7.30 | 3192.25 | 2230.01 | SO4-Ca | 0.5 | 0.67 | 0.03 | −6.43 | |
| 70 | O2-21 | 662.00 | 141.39 | 117.39 | 203.82 | 1983.77 | 149.73 | 7.70 | 3156.62 | 2235.21 | SO4-Ca | 0.92 | 1.5 | 0.02 | −6.45 | |
| 71 | O2-22 | 255.71 | 66.27 | 80.17 | 218.89 | 864.30 | 22.40 | 7.30 | 1400.83 | 911.38 | SO4-Ca·Mg | 0.27 | 0.3 | −0.49 | −7.39 | |
| 72 | O2-23 | 509.51 | 119.04 | 151.25 | 164.43 | 1801.70 | 92.97 | 7.50 | 2757.91 | 1762.39 | SO4-Ca | 0.53 | 0.76 | −0.08 | −6.53 | |
| 73 | O2-24 | 43.56 | 21.13 | 39.10 | 182.54 | 31.32 | 28.71 | 8.20 | 341.71 | 195.78 | HCO3-Ca·Mg·Na | 0.62 | 1.29 | −2.28 | −7.52 | |
| 74 | O2-25 | 289.43 | 77.57 | 43.26 | 235.23 | 886.20 | 20.45 | 7.70 | 1439.59 | 1042.11 | SO4-Ca·Mg | 0.77 | 1.31 | −0.45 | −7.7 | |
| 75 | O2-26 | 7.87 | 5.83 | 544.01 | 1115.63 | 116.29 | 113.68 | 8.00 | 1349.28 | 43.66 | HCO3-Na | 0.27 | 0.78 | −2.69 | −5.84 | |
| 76 | O2-27 | 113.21 | 30.22 | 766.09 | 289.03 | 1482.40 | 191.44 | 7.90 | 2731.79 | 407.12 | SO4-Na | 0.54 | 0.83 | −0.73 | −5.52 | |
| 77 | O2-28 | 116.71 | 28.89 | 777.85 | 289.03 | 1519.06 | 191.44 | 7.90 | 2782.55 | 410.39 | SO4-Na | 0.55 | 0.82 | −0.71 | −5.51 | |
| 78 | O2-29 | 508.62 | 121.80 | 225.04 | 295.46 | 1649.54 | 213.64 | 7.50 | 2866.78 | 1771.54 | SO4-Ca | 0.79 | 1.29 | −0.12 | −6 | |
| 79 | O2-30 | 526.75 | 112.88 | 231.72 | 295.46 | 1706.60 | 220.26 | 7.80 | 2946.50 | 1805.04 | SO4-Ca | 1.1 | 1.87 | −0.1 | −5.98 | |
| 80 | O2-31 | 21.58 | 10.47 | 581.86 | 399.61 | 767.36 | 88.63 | 8.80 | 1705.42 | 96.97 | SO4-Na | 0.92 | 1.87 | −1.59 | −5.94 | |
| 81 | O2-32 | 243.80 | 59.40 | 27.33 | 240.27 | 682.56 | 15.45 | 7.40 | 1151.00 | 853.35 | SO4-Ca·Mg | 0.44 | 0.6 | −0.57 | −8.01 | |
| 82 | O2-33 | 303.00 | 73.50 | 24.82 | 231.23 | 873.53 | 17.02 | 7.30 | 1407.91 | 1059.25 | SO4-Ca·Mg | 0.37 | 0.46 | −0.43 | −8.02 | |
| 83 | O2-34 | 298.68 | 73.50 | 26.78 | 244.07 | 819.58 | 17.96 | 7.10 | 1359.48 | 1048.44 | SO4-Ca·Mg | 0.18 | 0.08 | −0.45 | −7.96 | |
| 84 | O2-35 | 225.59 | 61.04 | 40.65 | 244.07 | 563.55 | 42.54 | 7.50 | 1078.72 | 814.62 | SO4-Ca·Mg | 0.54 | 0.84 | −0.66 | −7.39 | |
| 85 | O2-36 | 264.63 | 72.35 | 33.76 | 231.23 | 730.95 | 19.38 | 7.80 | 1237.56 | 958.69 | SO4-Ca·Mg | 0.86 | 1.48 | −0.53 | −7.82 | |
| 86 | O2-37 | 622.54 | 133.39 | 124.63 | 202.97 | 1861.16 | 118.16 | 7.20 | 2963.07 | 2,103.70 | SO4-Ca | 0.38 | 0.43 | −0.01 | −6.52 | |
| 87 | O2-38 | 616.03 | 138.91 | 128.11 | 205.53 | 1871.56 | 117.69 | 7.20 | 2977.19 | 2,110.20 | SO4-Ca | 0.38 | 0.45 | −0.02 | −6.51 | |
| 88 | O2-39 | 232.02 | 60.90 | 55.83 | 263.34 | 693.02 | 17.02 | 7.50 | 1195.75 | 830.10 | SO4-Ca·Mg | 0.56 | 0.87 | −0.59 | −7.66 | |
| 89 | O2-40 | 222.46 | 59.33 | 81.44 | 244.07 | 731.40 | 18.43 | 7.70 | 1236.81 | 799.84 | SO4-Ca·Mg | 0.7 | 1.17 | −0.59 | −7.46 | |
| 90 | O2-42 | 511.60 | 117.77 | 464.86 | 186.27 | 2402.27 | 158.90 | 7.20 | 3751.28 | 1762.39 | SO4-Ca·Na | 0.2 | 0.09 | −0.03 | −5.83 | |
| 91 | O2-43 | 90.30 | 10.76 | 273.10 | 48.56 | 482.40 | 158.41 | 6.79 | 1043.04 | 269.83 | SO4·Cl-Na·Ca | −1.34 | −3.26 | −1.02 | −5.99 | |
| 92 | O2-44 | 13.98 | 27.30 | 32.07 | 172.37 | 1.48 | 56.91 | 7.74 | 222.08 | 147.31 | HCO3·Cl-Mg·Na | −0.32 | −0.01 | −4.05 | −7.3 | |
| 93 | O2-45 | 41.84 | 12.65 | 95.59 | 124.62 | 54.07 | 131.94 | 8.00 | 400.27 | 156.58 | Cl-Na·Ca | 0.22 | 0.28 | −2.07 | −6.48 | |
| 94 | O2-46 | 188.78 | 11.92 | 134.07 | 27.96 | 616.31 | 97.52 | 9.39 | 1073.82 | 520.53 | SO4-Ca·Na | 1.25 | 1.63 | −0.66 | −6.51 |
Table 2.
Water quality testing parameters of each aquifer in the Dongtan Coal Mine (except for pH, units of other parameter are mg·L−1).
Table 2.
Water quality testing parameters of each aquifer in the Dongtan Coal Mine (except for pH, units of other parameter are mg·L−1).
| Sample Location | Cl− | HCO3− | SO42− | Na+ | Ca2+ | Mg2+ | TDS | TH | pH | |
|---|---|---|---|---|---|---|---|---|---|---|
| Quaternary aquifer | Min | 40.60 | 23.61 | 12.85 | 15.41 | 23.20 | 3.66 | 119.43 | 73.01 | 7.54 |
| Max | 125.13 | 543.88 | 500.32 | 126.32 | 225.55 | 21.14 | 931.30 | 650.32 | 10.60 | |
| Mean | 78.97 | 199.01 | 174.57 | 66.35 | 111.18 | 10.85 | 549.31 | 322.33 | 8.58 | |
| Jurassic aquifer | Min | 26.34 | 0.00 | 9.56 | 99.35 | 1.10 | 0.02 | 365.40 | 2.76 | 7.70 |
| Max | 161.01 | 419.40 | 914.16 | 438.71 | 83.13 | 19.62 | 1501.42 | 252.07 | 11.60 | |
| Mean | 71.95 | 142.25 | 232.95 | 197.07 | 27.61 | 6.86 | 646.66 | 86.37 | 9.11 | |
| Permian sandstone aquifer | Min | 10.11 | 0.00 | 1.00 | 37.12 | 4.01 | 0.00 | 179.49 | 0.84 | 7.40 |
| Max | 742.25 | 1603.52 | 339.98 | 1121.08 | 403.20 | 30.34 | 2699.54 | 1117.00 | 12.90 | |
| Mean | 139.76 | 564.30 | 59.08 | 394.50 | 51.09 | 7.20 | 1004.96 | 155.61 | 9.37 | |
| Carboniferous aquifer | Min | 10.66 | 201.51 | 1.02 | 32.65 | 4.18 | 0.76 | 220.15 | 13.56 | 7.44 |
| Max | 341.88 | 1502.97 | 317.52 | 694.79 | 131.62 | 31.81 | 1682.28 | 445.73 | 8.30 | |
| Mean | 136.95 | 607.65 | 96.02 | 294.67 | 49.61 | 12.94 | 919.15 | 177.17 | 7.86 | |
| Ordovician limestone aquifer | Min | 9.35 | 0.00 | 1.48 | 24.82 | 7.87 | 5.83 | 222.08 | 43.66 | 6.00 |
| Max | 320.33 | 1115.63 | 2402.27 | 897.23 | 662.00 | 158.25 | 3751.28 | 2237.52 | 9.39 | |
| Mean | 119.43 | 242.42 | 1304.93 | 250.17 | 346.60 | 81.16 | 2231.44 | 1200.16 | 7.61 |
Table 3.
Q Cluster Analysis Results.
| Group | Water Samples |
|---|---|
| First | Q-1, Q-2, Q-4, Q-3, J-1, J-8, J-11, J-5, J-10, J-6, J-4, J-15, J-3, J-7, J-16, J-2, J-12, J-13, P-4, P-14, J-9, P-8, P-5, P-7, P-6, P-13, P-10, P-17, P-9, P-11, C-11, C-9, C-7, C-1, C-4, C-10, C-5, O2-45, O2-44, O2-24, O2-43, O2-46. |
| Second | O2-8, O2-36, O2-32, O2-39, O2-40, O2-35, O2-12, O2-34, O2-13, O2-25, O2-33, O2-22, O2-11, P-3. |
| Third | P-16, P-18, J-14, O2-31, O2-7, P-12, C-2, P-15, C-3, O2-26, P-2, P-1, C-6, C-8, O2-9. |
| Fourth | O2-27, O2-28, O2-14, O2-15, O2-16, O2-17, O2-41, O2-42, O2-18, O2-19, O2-20, O2-21, O2-4, O2-5, O2-6, O2-1, O2-3, O2-29, O2-30, O2-37, O2-38, O2-10, O2-23, O2-2. |
Table 4.
General Element Correlation.
| Interdependency | Ca2+ | Mg2+ | Na+ | HCO3− | SO42− | Cl− | TDS | TH | pH |
|---|---|---|---|---|---|---|---|---|---|
| Ca2+ | 1.000 | 0.973 | −0.207 | −0.277 | 0.871 | 0.106 | 0.766 | 0.998 | −0.371 |
| Mg2+ | 1.000 | −0.235 | −0.252 | 0.883 | 0.078 | 0.763 | 0.985 | −0.483 | |
| Na+ | 1.000 | 0.605 | 0.063 | 0.696 | 0.424 | −0.214 | 0.110 | ||
| HCO3− | 1.000 | −0.269 | 0.494 | 0.112 | −0.271 | −0.166 | |||
| SO42− | 1.000 | 0.177 | 0.901 | 0.879 | −0.432 | ||||
| Cl− | 1.000 | 0.522 | 0.100 | −0.058 | |||||
| TDS | 1.000 | 0.770 | −0.385 | ||||||
| TH | 1.000 | −0.402 | |||||||
| pH | 1.000 |
Publisher’s Note: MDPI stays neutral with regard to jurisdictional claims in published maps and institutional affiliations. |
© 2022 by the authors. Licensee MDPI, Basel, Switzerland. This article is an open access article distributed under the terms and conditions of the Creative Commons Attribution (CC BY) license (https://creativecommons.org/licenses/by/4.0/).
Share and Cite
MDPI and ACS Style
Xu, K.; Qiao, W.; Zhu, G.; Feng, L.; Wang, Z.; Li, W. Hydrogeochemical Characteristics of a Multi-Layer Groundwater System in a Coal Mine Area: A Case Study. Water 2022, 14, 3146. https://doi.org/10.3390/w14193146
AMA Style
Xu K, Qiao W, Zhu G, Feng L, Wang Z, Li W. Hydrogeochemical Characteristics of a Multi-Layer Groundwater System in a Coal Mine Area: A Case Study. Water. 2022; 14(19):3146. https://doi.org/10.3390/w14193146
Chicago/Turabian StyleXu, Kaiqing, Wei Qiao, Guanghui Zhu, Lushun Feng, Zhiwen Wang, and Wenping Li. 2022. "Hydrogeochemical Characteristics of a Multi-Layer Groundwater System in a Coal Mine Area: A Case Study" Water 14, no. 19: 3146. https://doi.org/10.3390/w14193146
Note that from the first issue of 2016, this journal uses article numbers instead of page numbers. See further details here.