
Quantifying the City-Scale Impacts of Impervious Surfaces on Groundwater Recharge Potential: An Urban Application of WRF–Hydro

Lawrence Berkeley National Laboratory, Earth and Environmental Sciences Area, Climate and Ecosystem Sciences Division, Berkeley, CA 94720, USA
*
Author to whom correspondence should be addressed.
Water 2022, 14(19), 3143; https://doi.org/10.3390/w14193143
Submission received: 30 August 2022
/
Revised: 29 September 2022
/
Accepted: 1 October 2022
/
Published: 6 October 2022
(This article belongs to the Section Hydrogeology)
Abstract
:Decades of urbanization have created sprawling, complex, and vulnerable cities, half of which are located in water-scarce areas. With the looming effects of climate change, including increasing droughts and water shortages, there is an urgent need to better understand how urbanization impacts the water cycle at city scale. Impervious surfaces disrupt the natural flow of water, affecting groundwater recharge in water-scarce cities, such as Los Angeles, looking to harness local water resources. In the face of growing water demand, informing on opportunities to maximize potential groundwater recharge can help increase cities’ resilience. WRF–Hydro, a physics-based hydrological modeling system, capable of resolving atmospheric, land surface, and hydrological processes at city scale, is adapted to represent urban impervious surfaces. The modified model is used to assess the hydrological implications of historical urbanization. Pre- and post-urban scenarios are used to quantify the impacts of impervious surfaces on the local water budget. Our results show that urbanization in LA has vastly decreased the potential for groundwater recharge, with up to half of the water inflow being redirected from infiltration in highly urbanized watersheds, while doubling surface runoff’s share of the city’s water budget, from ~15% to 30%. This study not only sheds light on the role of imperviousness on groundwater recharge in water-scarce cities, but also offers a robust and transferable tool for the management of urban land and water resources.
1. Introduction
Urbanization is known to be one of the most disruptive forms of land use and land cover change. The development of the built environment has not only been linked with increased flood risk [1], but also with a decrease in the availability of water resources [2]. As urban landscapes continue to expand, with close to 70% and 90% of the global and United States population, respectively, expected to reside in urban areas by 2050 [3], there is an urgent need to carefully understand the processes that control urban hydrology and the associated risks cities face under a changing climate.
Many previous studies have emphasized the importance of impervious surfaces in predicting urban water balance [4]. Paved roads or sidewalks, roofs, and compacted soil are examples of widespread surfaces in urban areas that limit the absorption of stormwater. Replacing natural pervious land with impervious surfaces has been shown to decrease infiltration and evapotranspiration [5], as well as to lead to more frequent flash flooding of urban streams, with increased discharge volume and peak flow [6,7]. The decrease in infiltration can jeopardize groundwater recharge and access to valuable local water resources for cities. In regions such as California, where urbanization trends have coincided with water scarcity and increased competition for water resources, it has become a priority for cities to harness water received during rare precipitation events.
Los Angeles is one of the most populated and highly urbanized cities in the US. Like many other cities of its size, LA faces challenges related to increasing water demands across sectors and relies on costly imported water. One of LA’s strategic goals as part of the Sustainable Groundwater Management Act (SGMA) is to source 50% of its water supply locally by 2035 by increasing the capture of storm water. While adaptive measures to promote groundwater recharge have gained momentum, the development of urban impervious surfaces remains a barrier for harnessing local water resources. LA is faced with an ongoing drought and water shortage that threatens the city’s resilience. The region indeed receives on average only 36 cm of precipitation per year [8], the large majority of which occurs during wet winter months.
Land use policies seeking to regulate Total Impervious Area (TIA) have become a key feature of stormwater management strategies. Local governments have, for example, introduced TIA thresholds, hydraulically disconnected impervious surfaces, from sewers and stream networks [9], or deployed green infrastructure to facilitate infiltration [10], as ways to manage TIA. Assessing and informing the effectiveness of such approaches at the city scale requires a detailed understanding of the role of TIA in urban hydrological processes. An important first step to increasing urban resilience is to determine how urbanization has impacted the water budget partitioning in cities. The success of such adaptive strategies will, moreover, rely on being able to inform on the potential for groundwater recharge at metropolitan scale.
Urban environments are highly complex and heterogeneous systems where both natural and anthropogenic processes interact at various spatial and temporal scales. While greater computational capabilities and the availability of spatially distributed remotely sensed data have contributed to improving the conceptual detail of urban hydrological models, these tools continue to face significant trade-offs. Models used for flood protection or storm drainage design, such as the Storm Water Management Model (SWMM) [11] and HEC–RAS [12], are able to represent highly complex local dynamics of water flow [13,14,15], but are poorly suited to answer questions at the city or regional scale and tend to under-represent land surface processes and land–atmosphere interactions [16]. On the other hand, catchment-scale analyses evaluating impervious cover and land use changes [17] tend to neglect the physics of water flow through the surface, subsurface, or channels.
Recent developments in integrated hydrological models have presented opportunities to better understand the multi-scale interactions between atmospheric, land, and subsurface processes that drive urban hydrology. The Weather Research and Forecasting (WRF)–Hydro modeling system [18] is an open-source, fully distributed, modular, physical-based hydrometeorological modeling architecture that couples land–atmosphere dynamics with hydrological routing schemes. WRF–Hydro allows for the modeling of land surface and hydrological dynamics at various scales using nested grids at different spatial resolutions, while reflecting the lateral flow of—and interaction between—surface and subsurface water. WRF–Hydro has notably been used to develop the National Water Model (NWM), a continental scale forecasting system for the US and has been widely tested over a range of applications, from the prediction of streamflow [19], to the modeling of floods [20] and droughts [21]. Still, few studies have applied WRF–Hydro over urban areas [22,23], and while these applications have emphasized the need for fine resolution data in an urban context, they do not explicitly represent urban impervious surfaces in a physics based and distributed approach.
The primary objective of this study is to better understand and quantify the impacts that changes in TIA associated with urbanization have on urban hydrology at city scale. By adapting WRF–Hydro to urban areas, this study looks to assess the potential for further groundwater recharge by investigating the role that urban imperviousness has had in altering the partitioning of the water budget between surface runoff and infiltration. Potential groundwater recharge is defined as water infiltrating in the soil and percolating below a 2 m soil layer—as opposed to flowing over the surface—and made available for the actual recharge of groundwater resources, which occurs at greater depth and longer time frames. A secondary objective is to provide a roadmap to transform WRF–Hydro into a potent urban hydrological tool that can inform on city-scale land, water, and flood risk management in an urbanization, water scarcity, and climate change era. To achieve these objectives, we used the Los Angeles metropolitan area as a case study and aimed to investigate the city-scale effects of urban imperviousness on the urban water budget by comparing the pre- and post-urban development hydrological response to an intense precipitation event.
2. Data and Methods
2.1. Study Area
A region of approximately 12,000 km2 covering the LA metropolitan area was chosen as the testbed for this study (Figure 1). Three watersheds within the metropolitan area were selected along Ballona Creek (195 km2), Brea Creek (80 km2), and the Arroyo Seco (50 km2) for validation and additional analysis. Hourly streamflow was obtained from the US Geological Survey at stream gauging stations at Brea and Arroyo, while daily mean streamflow at Ballona was obtained from the Los Angeles County Department of Public Works. The percentage of impervious surfaces over the study area—or impervious fraction—was obtained at 30 m horizontal resolution from the National Land Cover Database (NLCD) [24]. The three watersheds were chosen for their different levels of impervious cover and level of development. The Ballona Creek watershed is highly urbanized with ~60% impervious surfaces, while impervious surfaces account for 15% of the Brea Creek watershed. Arroyo Seco is almost entirely pervious and vegetated.
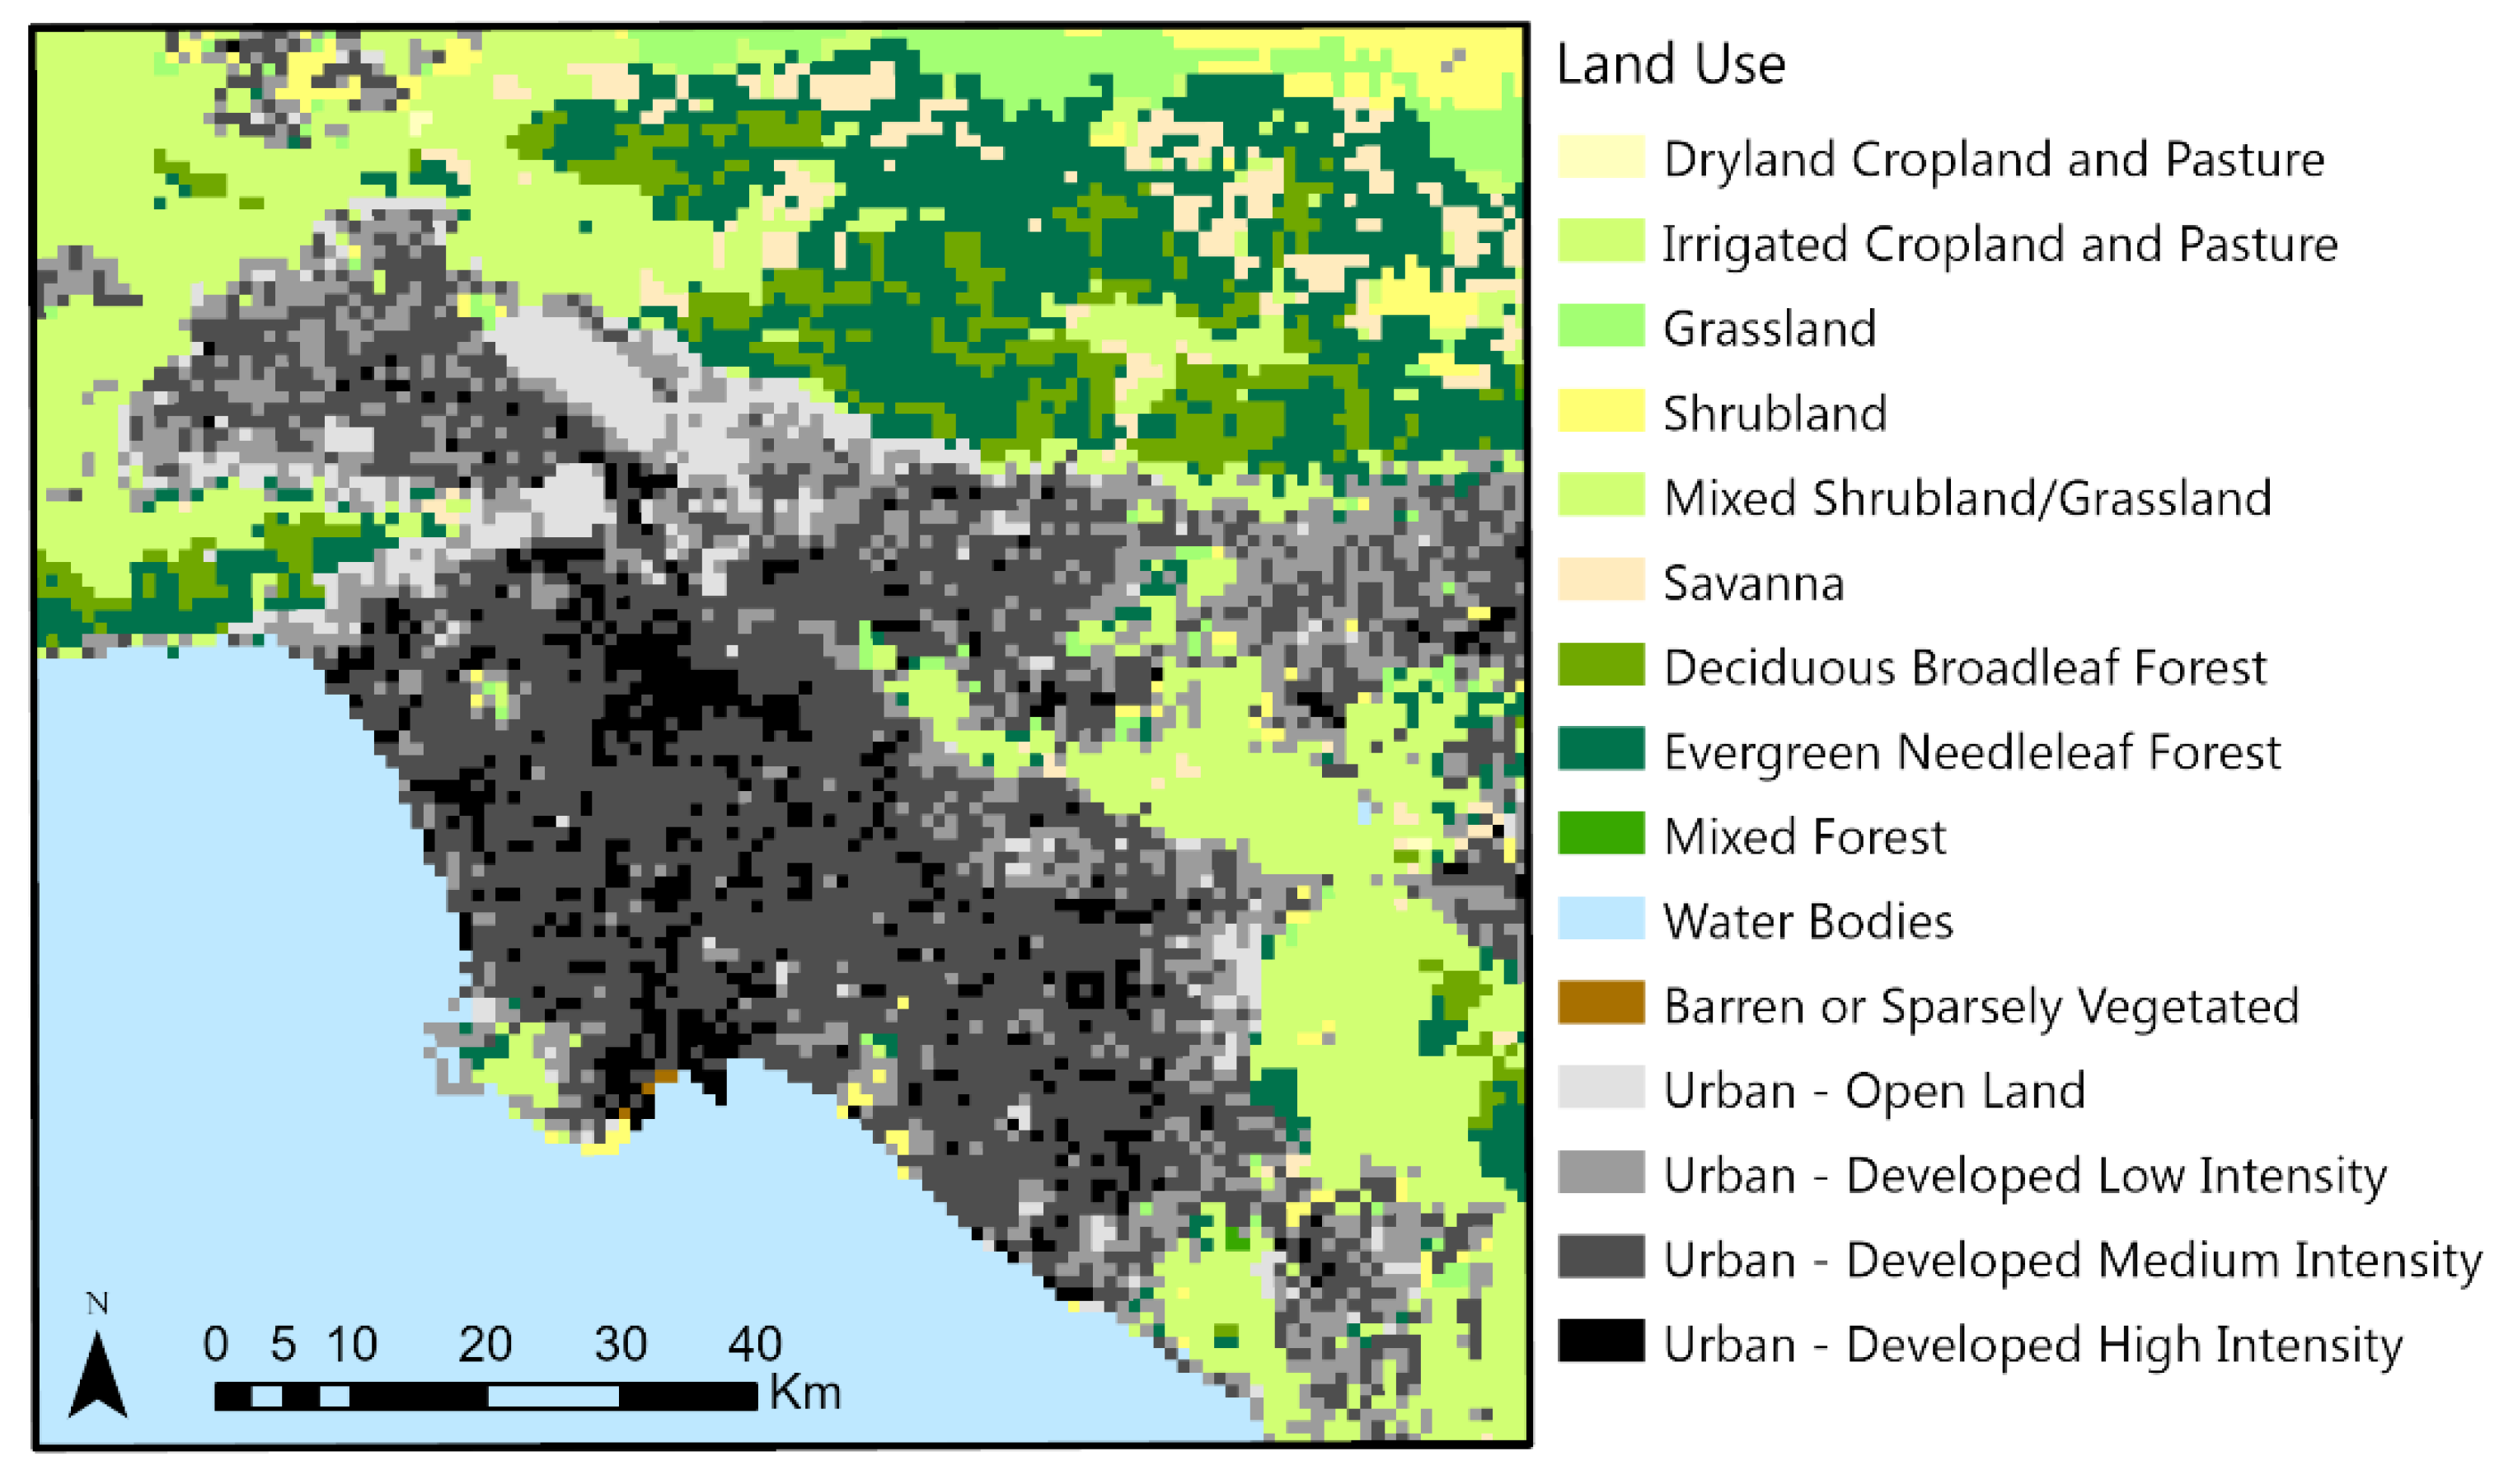
Land use and cover data are provided by the USGS 24–type Land Use Land Cover product (Figure 2), as commonly used in WRF. As the USGS land cover classification only contains 1 class for urban land type, the land cover data was refined using the NLCD product. Urban land cover was thereby depicted in greater detail under four subclasses, with varying levels of impervious cover (Table 1). Grid cells classified as urban in the USGS data but that did not fall as either Developed Low, Medium, or High Intensity in NLCD were considered to be “Urban—Open Land”.
WRF–Hydro’s preprocessing tool was used to derive channel grid cells and stream Strahler order. To accomplish this, a 30 m resolution Digital Elevation Model (DEM) was obtained from the National Hydrography Dataset Plus (NHDPlus). The preprocessing tool pit-fills the DEM and defines channels using a flow direction/accumulation method. The DEM was manually adjusted to ensure channel grids followed existing artificial urban channels when these differed from natural flow paths. Finally, to constrain the uncertainties in WRF–Hydro, the model is run uncoupled to an atmospheric model and provided with meteorological forcing data. The required variables include incoming shortwave and longwave radiation, specific humidity, air temperature, surface pressure, near-surface wind components, and liquid water precipitation rate. Hourly data were obtained from the North American Land Data Assimilation System (NLDAS-2) and regridded to match the model’s domain and spatial resolution.
2.2. The Modified WRF–Hydro Modeling System
The WRF–Hydro version 5.1.1 [18] used in this study calls on the Noah–MP (with multi-parameterization) land surface model (LSM) [25] to resolve vertical fluxes within the soil column and exchanges with the atmosphere.
Noah–MP is a single column model, which includes four soil layers within a 2 m soil column. The LSM uses an infiltration-excess parameterization to represent surface runoff and a gravitational drainage parameterization for runoff percolating below the bottom soil layer as deep drainage, referred to as “underground runoff” [26]. Surface runoff () is calculated as:
where is the rate at which water reaches the soil surface and is the maximum rate of infiltration. is calculated as:
where is the soil moisture () deficit term integrated across soil layers () on time interval :
and the variable is calculated as a function of the parameter (REFKDT) and the ratio of the saturated hydraulic conductivity () and its reference value REFDK ():
Underground runoff (), or “deep-drainage” percolating out of the bottom LSM soil layer is calculated as:
where is a scaling factor between 0 and 1 and is the hydraulic conductivity of the bottom layer.
REFKDT and REFDK are important calibration parameters that can impact the runoff-infiltration partition [27]. Smaller values of REFKDT and larger values of REFDK are associated with higher surface runoff, which is typical of land modified by human activities [28]. In their default configuration, Noah–MP and WRF–Hydro do not explicitly differentiate between pervious and impervious surfaces. To account for urban impervious surfaces, a correction coefficient is introduced in this study to the calculation of , such that:
where is the grid cell’s impervious fraction. In this study we use a quasi-fully distributed urban fraction that corresponds to the average impervious fraction by urban land cover (as shown in Table 1). Moreover, as WRF–Hydro does not represent underground drainage pipes, we introduce an additional scaling parameter , alongside REFKDT and REFDK, with values between 0 and 1 to account for impervious surfaces that are directly connected to stormwater sewers.
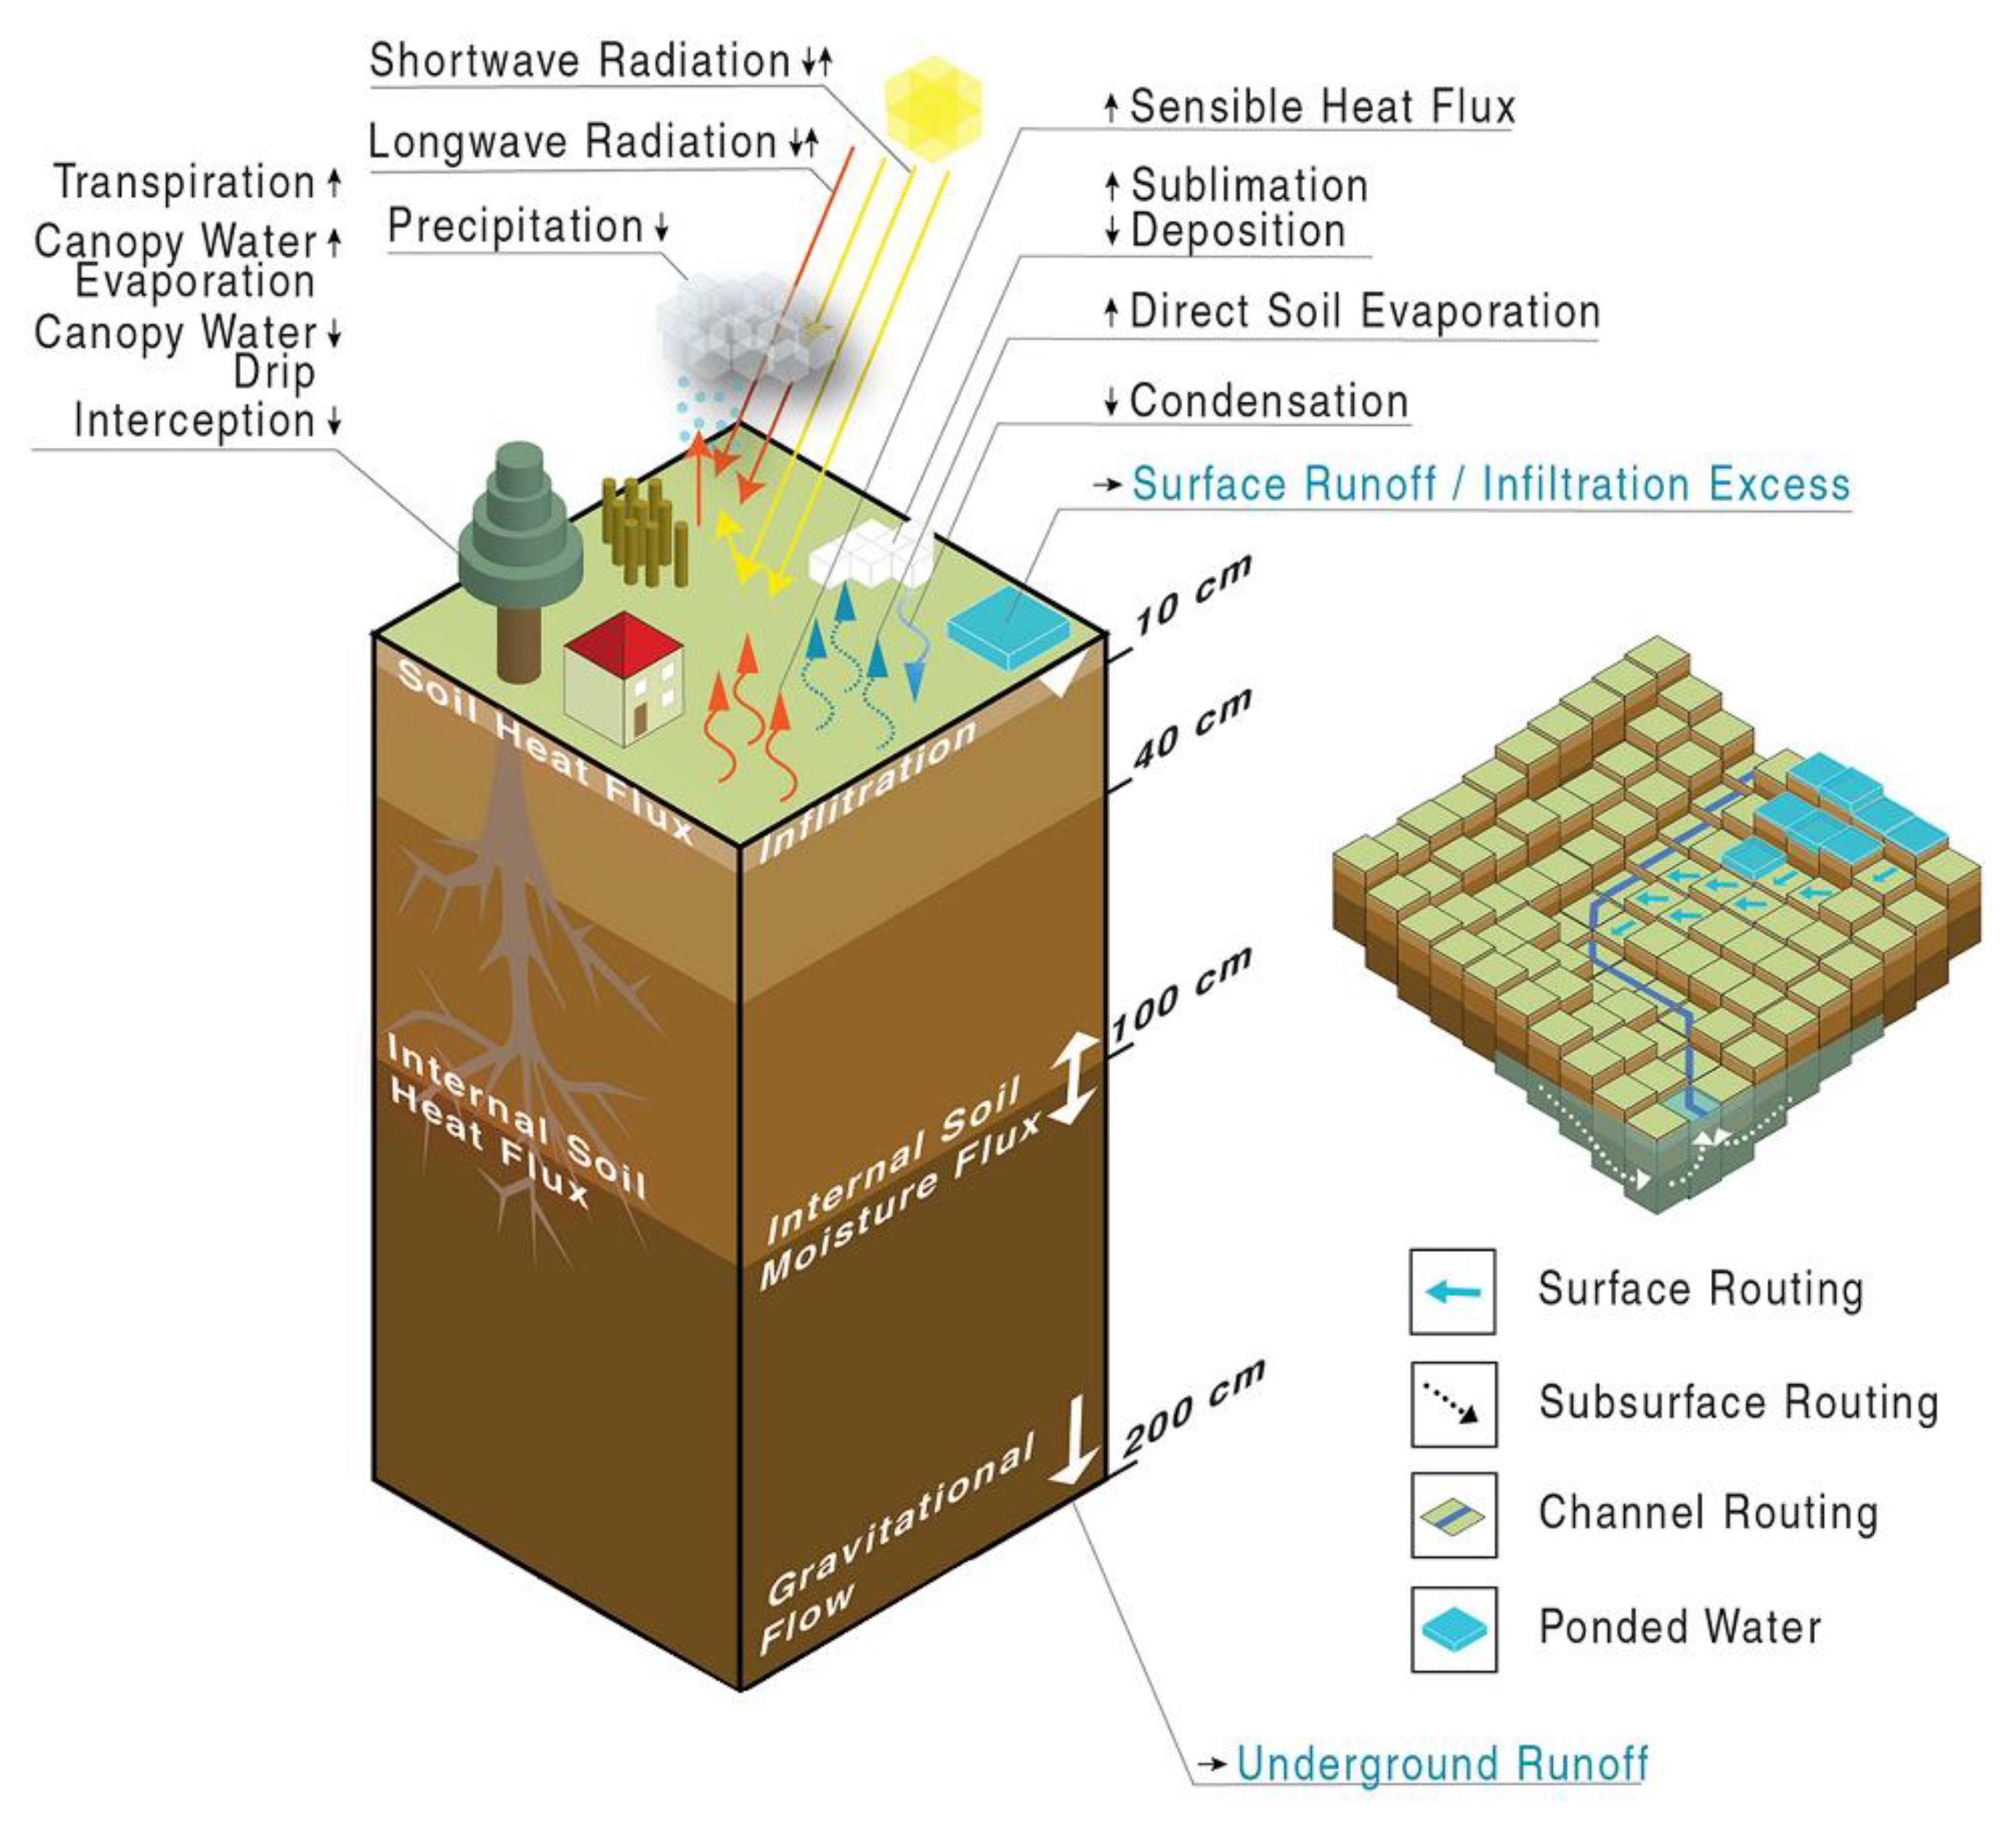
Without routing, Noah–MP removes surface runoff from the system. WRF–Hydro allows for a major improvement in depicting the 2D lateral redistribution of water as surface and subsurface flow in specific routing modules (Figure 3). Water derived as infiltration excess in the LSM is allowed to remain within the system as ponded water. Overland flow is then calculated using a fully unsteady, explicit, finite-difference diffusive wave formulation. This routing module is implemented in a steepest-descent (or “D8”) method using a simplification of the St. Venant equations of continuity and momentum for a shallow water wave [18].
The lateral flow of saturated soil moisture employs a quasi-three-dimensional flow representation, which include the effects of topography, statured soil depth, and saturated hydraulic conductivity [18]. Subsurface flow is calculated before the surface flow routing to allow for exfiltration from a supersaturated soil column. Exfiltration is added to the infiltration excess from the LSM and updates the amount of “ponded water” to be used for the routing of overland flow.
Stream channel inflow is received from overland flow and occurs when the depth of ponded water is greater than a predefined channel grid cell retention depth. In its current version, the channel routing module in WRF–Hydro is unidirectional and therefore does not account for overbank flow conditions. The channel flow is derived using an explicit, one-dimensional, variable time-stepping diffusive wave formulation, which is a simplification of the more general St. Venant equations for shallow water wave flow.
The above routing modules represent processes that typically require a finer spatial resolution than traditional LSMs. This is particularly the case over highly variable terrain, which can be a feature of complex urban systems. To resolve this mismatch, WRF–Hydro disaggregates Noah–MP’s outputs of infiltration excess, ponded water depth, and soil moisture using a time-step weighted method [29], and passes the results to the subsurface and surface routing modules. Once updated, the fine-grid values of soil moisture and ponded water are aggregated back to the coarser LSM grid. Here, resolutions of 900 and 30 m were chosen for the LSM and routing grids, respectively, with an aggregation factor of 30.
2.3. Model Calibration
The performance of the model was evaluated using river discharge at Arroyo Seco, as the most natural catchment and, therefore, the least likely to be influenced by urban impervious surfaces. The goal was to first calibrate WRF–Hydro in a nearby non-urban watershed within the same domain before introducing urban impervious surfaces in more developed watersheds. Modeled streamflow values were compared to observations and evaluated with the Nash–Sutcliffe Efficiency (NSE) coefficient [30]:
where and are the model simulated and observed discharge at each time step , and is the average observed discharge.
A stepwise approach, as recommended by [31], was adopted to calibrate the modeling system. Previous sensitivity analyses of WRF–Hydro have found the runoff-infiltration parameter REFKDT to be the most important in dictating the calculated water budget, and, more specifically, the total volume of generated runoff [32]. A reasonable approximation of REFKDT was therefore first obtained before testing the model for a range of values of REFDK.
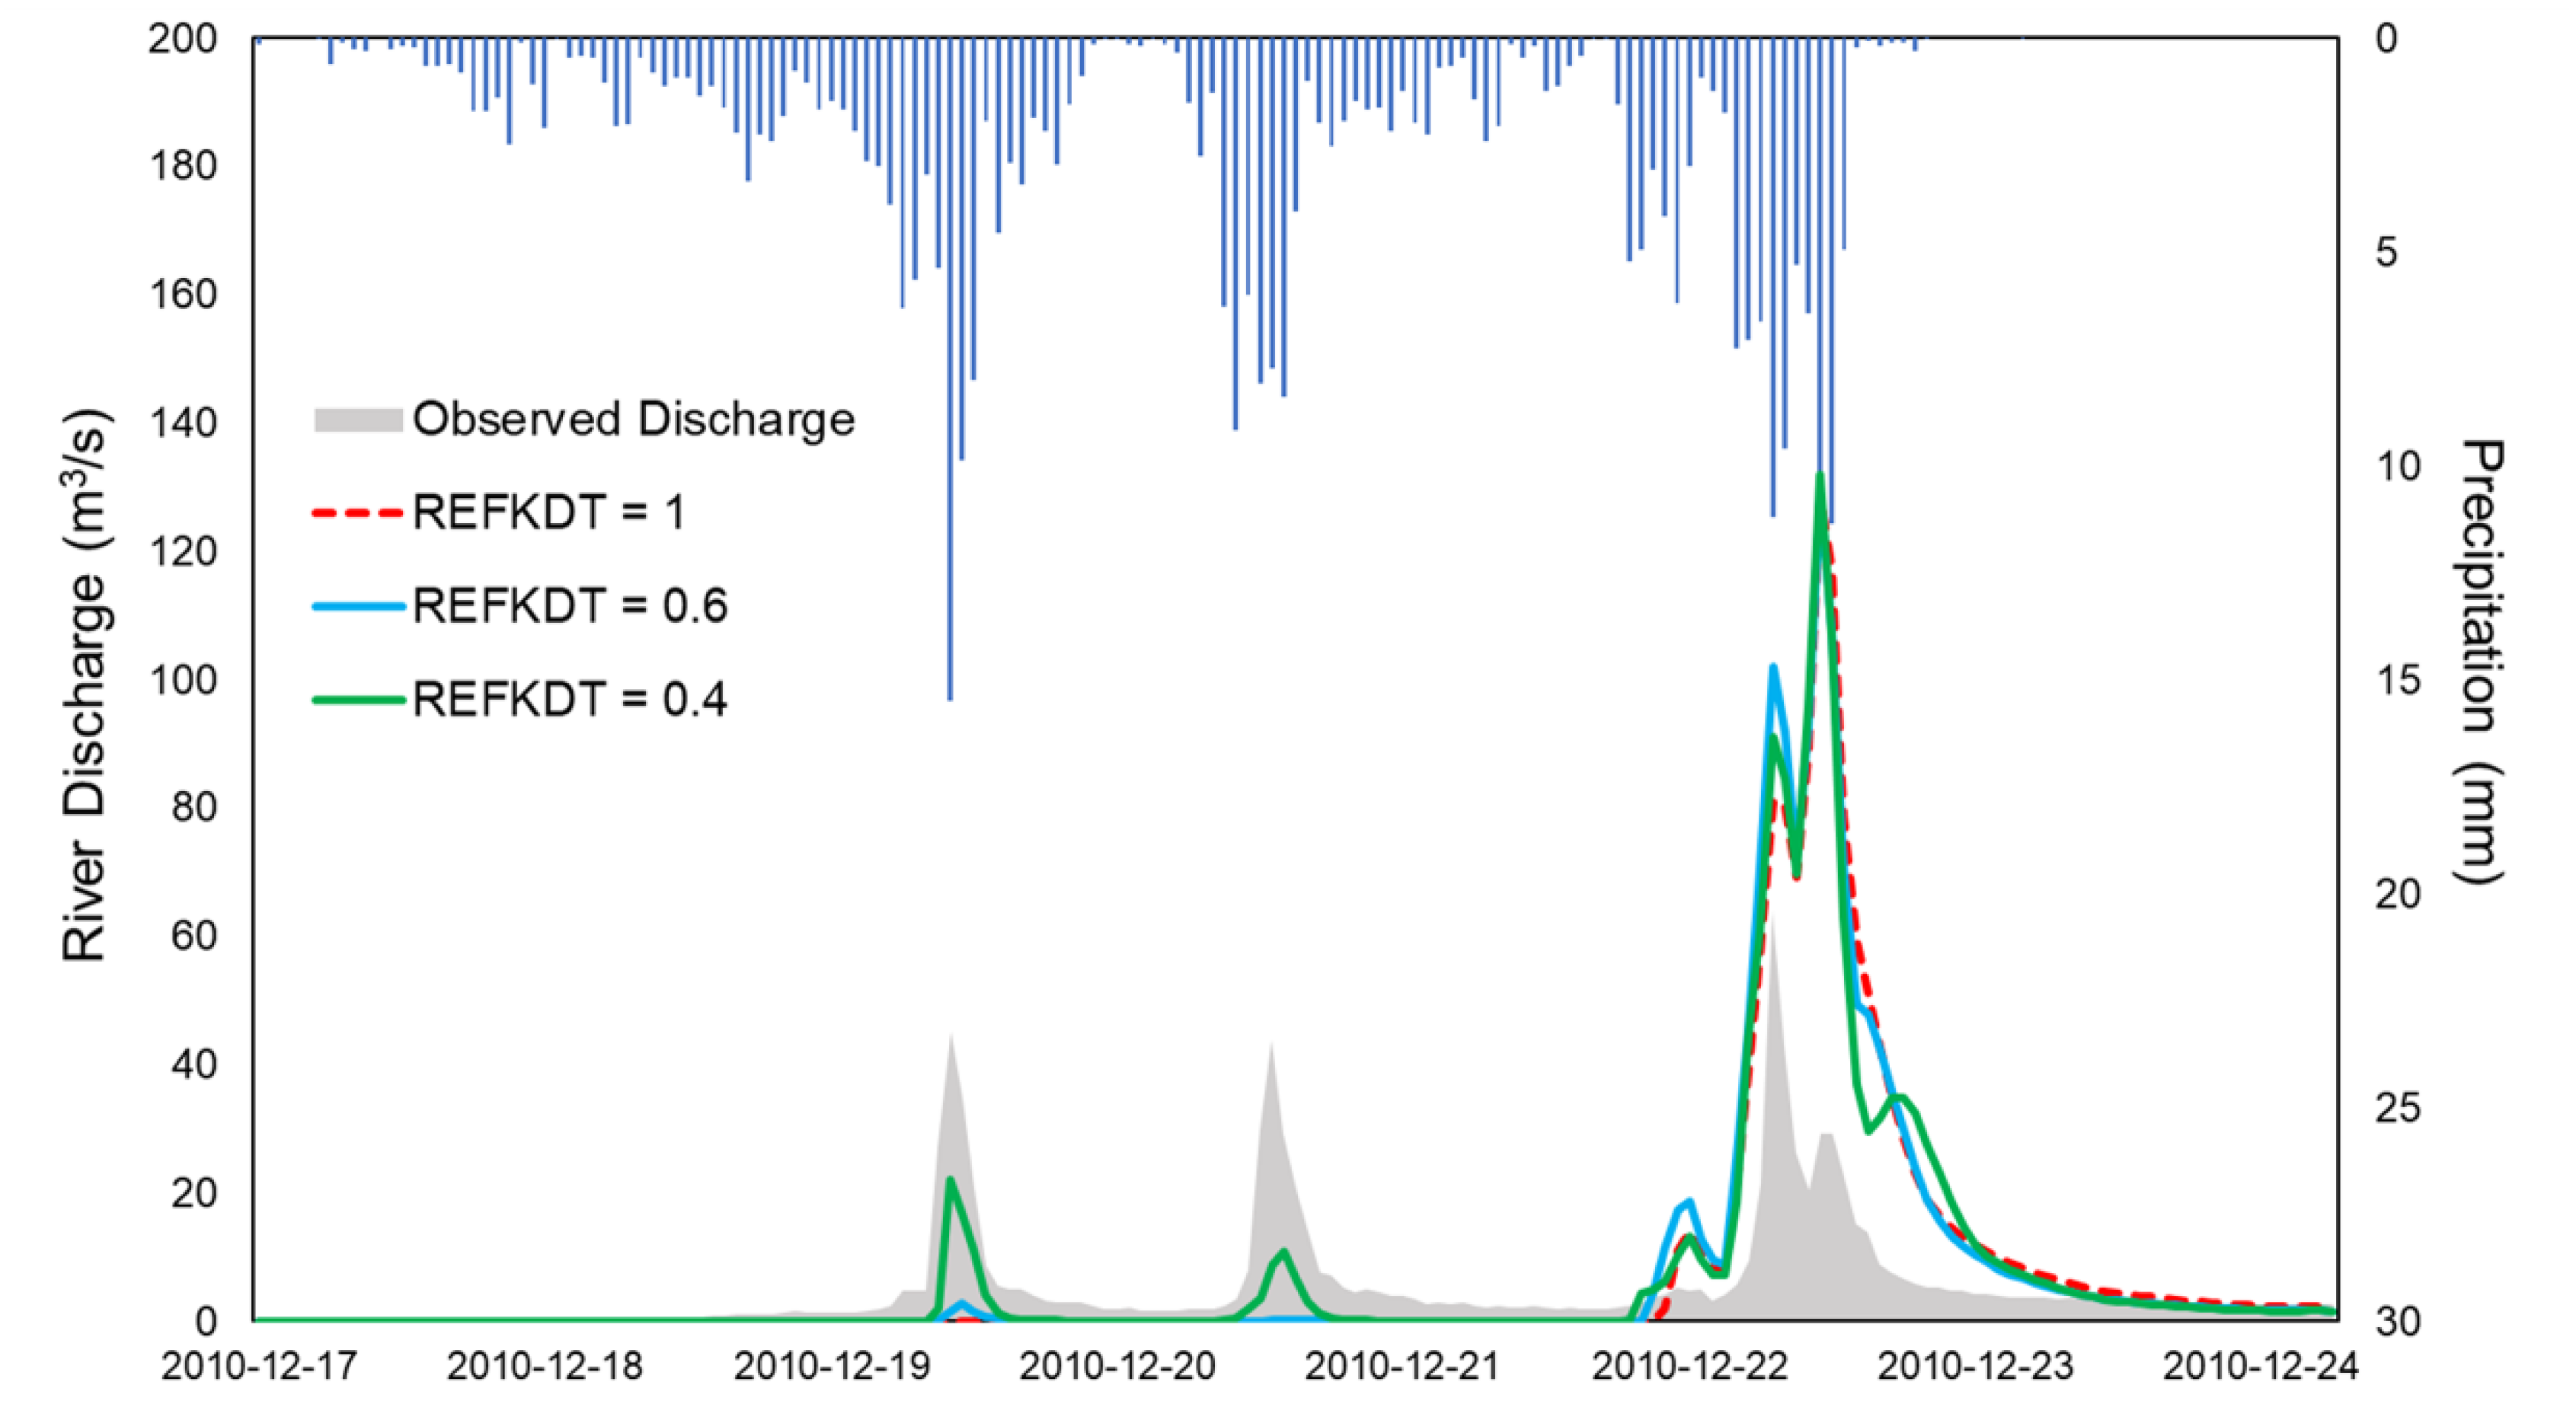
The infiltration capacity scaling parameter REFKDT can be tuned with values ranging from 0.1 to 10, with 3 being its default value in WRF–Hydro. However, it was found that above a value of 0.6, the model showed little to no response to precipitation for the first two peaks of the event in Arroyo Seco, while overestimating the last peak (Figure 4). NSE values of −0.26 and −0.32 were obtained with REFKDT values of 0.6 and 1 respectively. REFKDT = 0.4 provided the best results with an NSE of 0.34 and was subsequently used in the testing of REFDK.
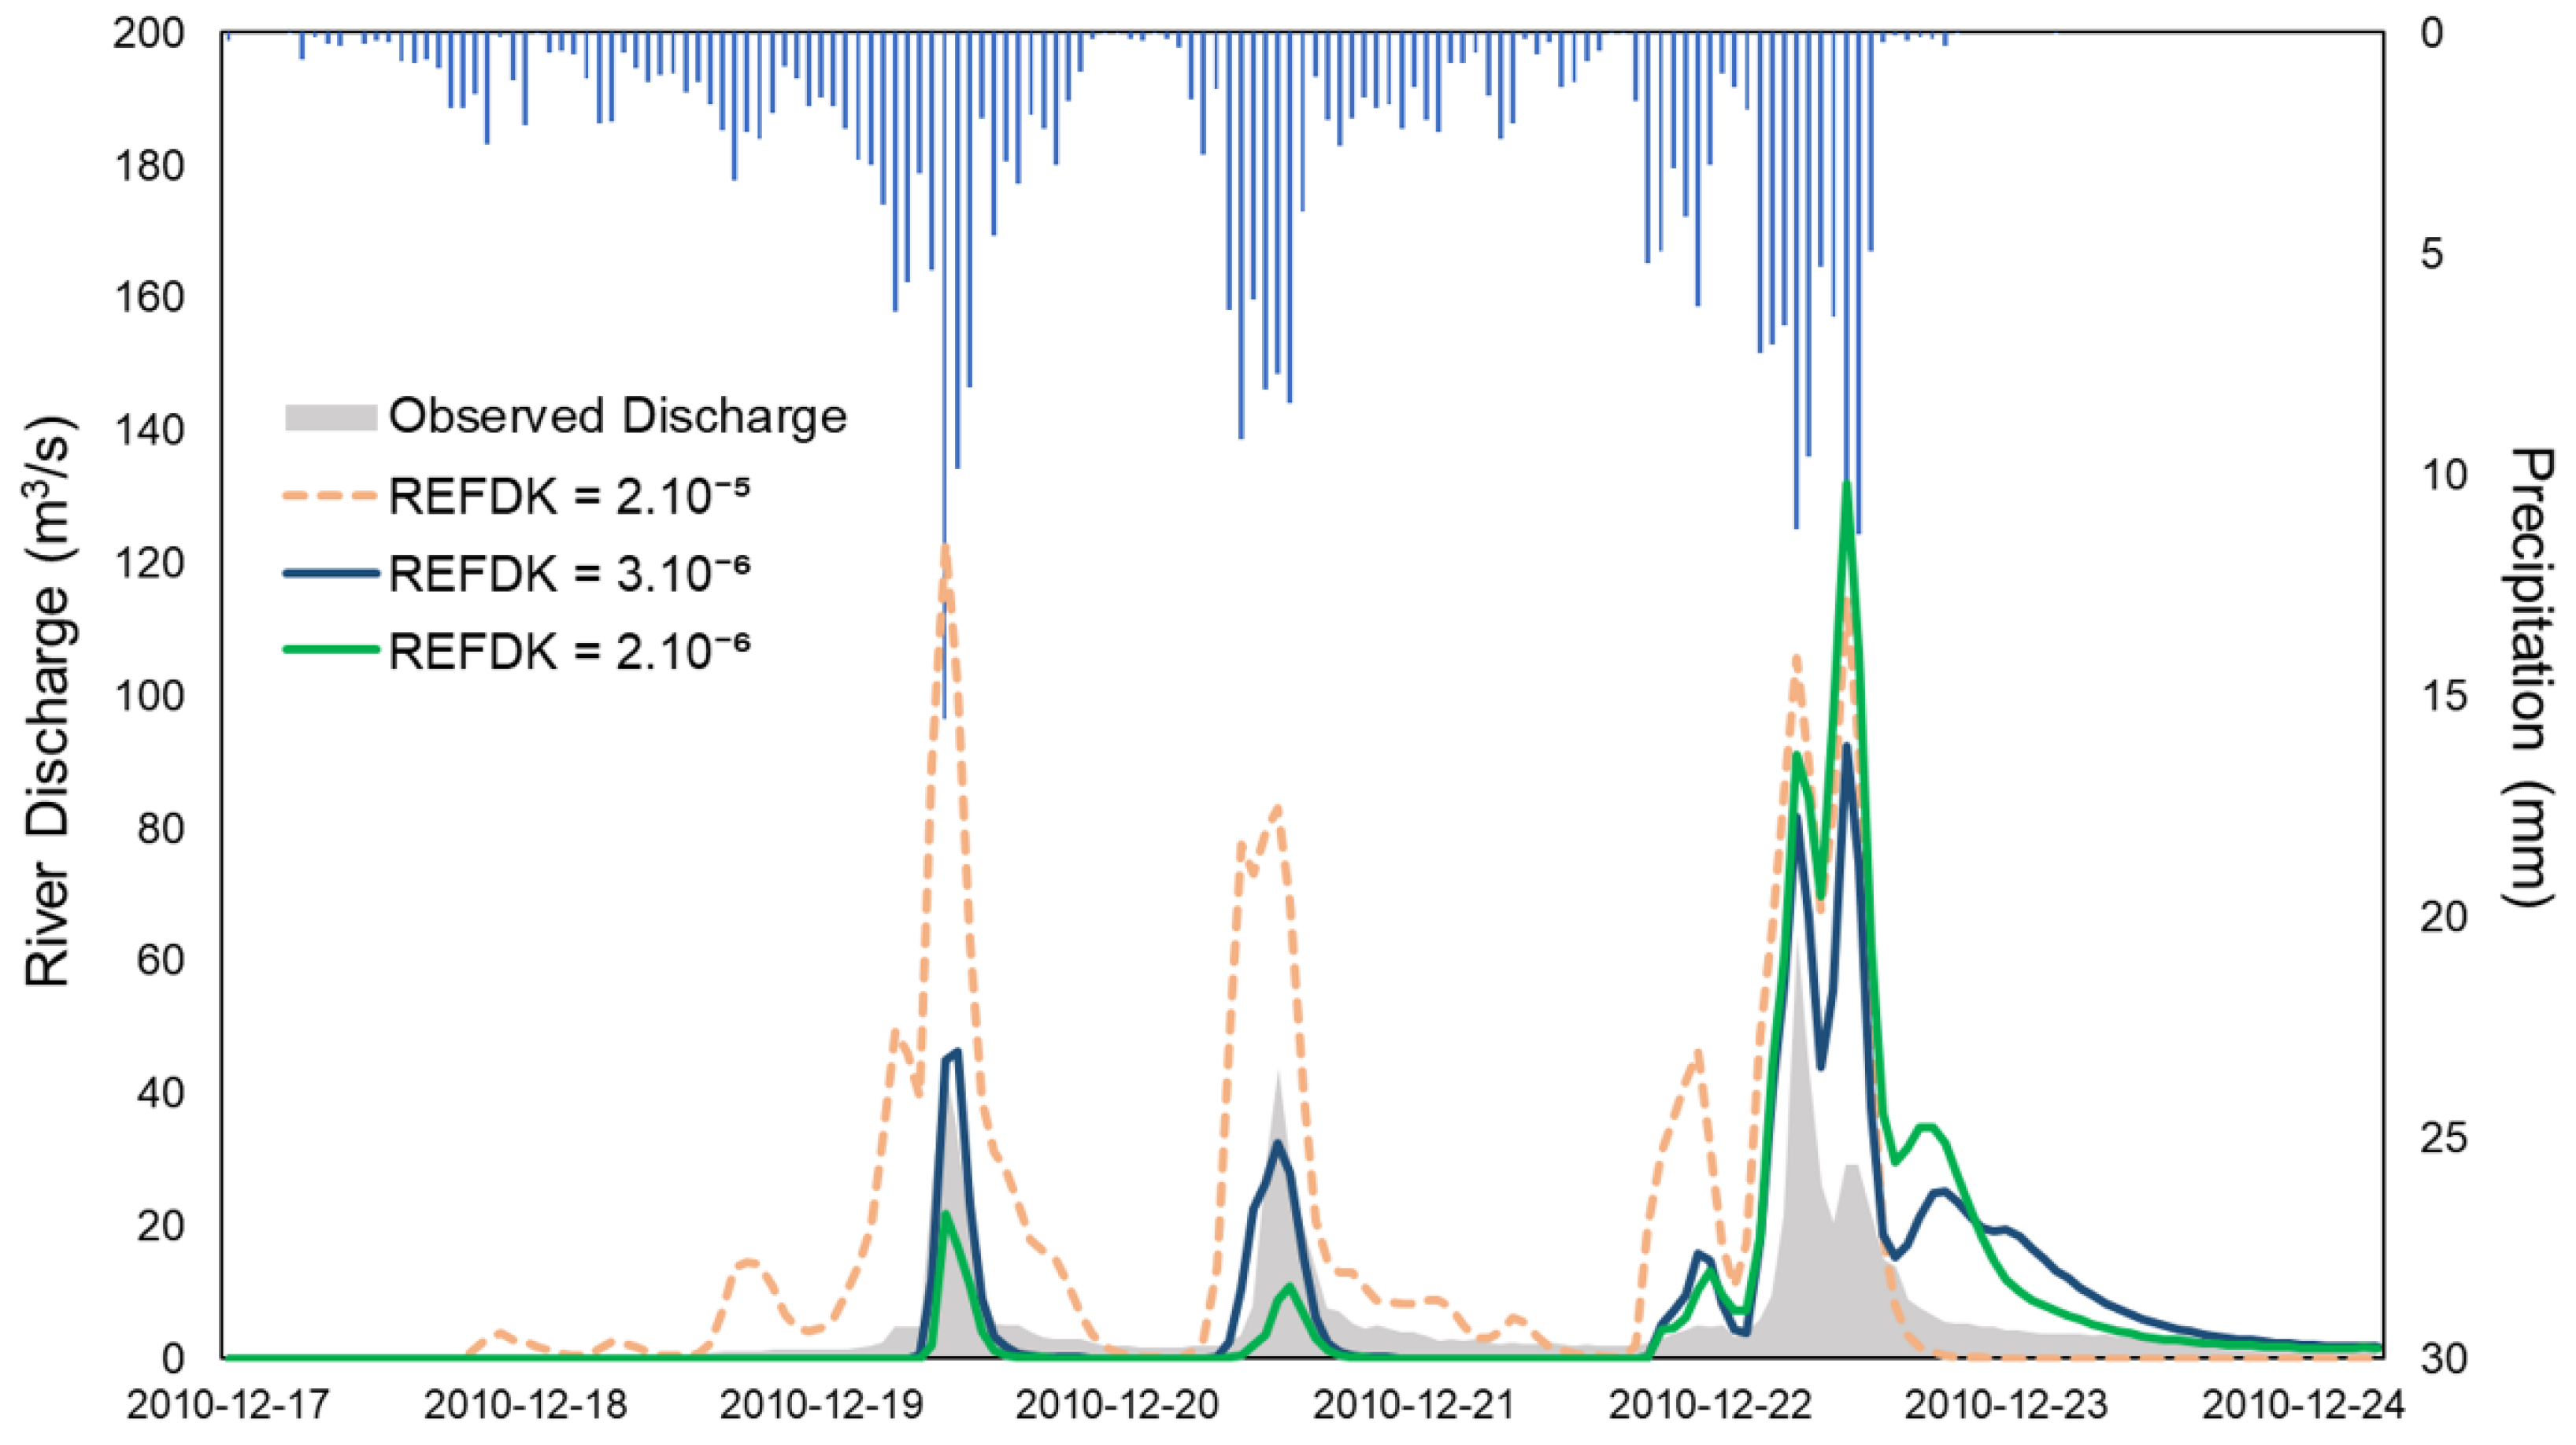
The default value for REFDK, which influences the saturation hydraulic conductivity, is 2 × 10⁻⁶ m/s and is set for the entire model domain. Increasing REFDK to 3 × 10⁻⁶ m/s helped to better capture the first two peaks of the observed hydrograph, with an NSE of 0.83 (Figure 5). While the last peak was still overestimated, the simulated values were improved and the model was able to adequately portray the overall response to precipitation. The timing of the hydrograph peaks was well simulated, providing confidence in WRF–Hydro’s ability to model the local hydrology.
Remaining discrepancies between modeled and observed discharge can result from bias in the modeled precipitation or model uncertainties of soil and land processes. Differences can also result from potentially inadequate values for soil and land surface parameters, which in this version of WRF–Hydro are not fully spatially distributed and depend on soil classes [33].
2.4. Experimental Design
WRF–Hydro was run in its standalone mode, uncoupled from the WRF atmospheric model, with NLDAS forcing. The chosen model configurations are summarized in Table 2. WRF–Hydro can be run with a baseflow bucket model that collects underground runoff and reallocates it to channels to provide additional river flow. However, as discussed by [34], this option is more relevant for long-term simulations, with little impact on short-term events, and was turned off in this study. Underground runoff, therefore, flows out of the model system in this configuration.
The channel’s Manning roughness coefficient (Manning’s n) can also affect the shape of output hydrographs. In WRF–Hydro, Manning’s n describes the roughness on a channel grid and is defined as a function of Strahler stream order. Concrete or cemented channels tend to have a lower roughness coefficient than natural channels found upstream in the model domain, which can be obstructed by vegetation. Downstream channels in the urbanized parts of LA tend to be highly engineered and were assigned a lower Manning’s n, with values based on classifications by [35] (Table 3).
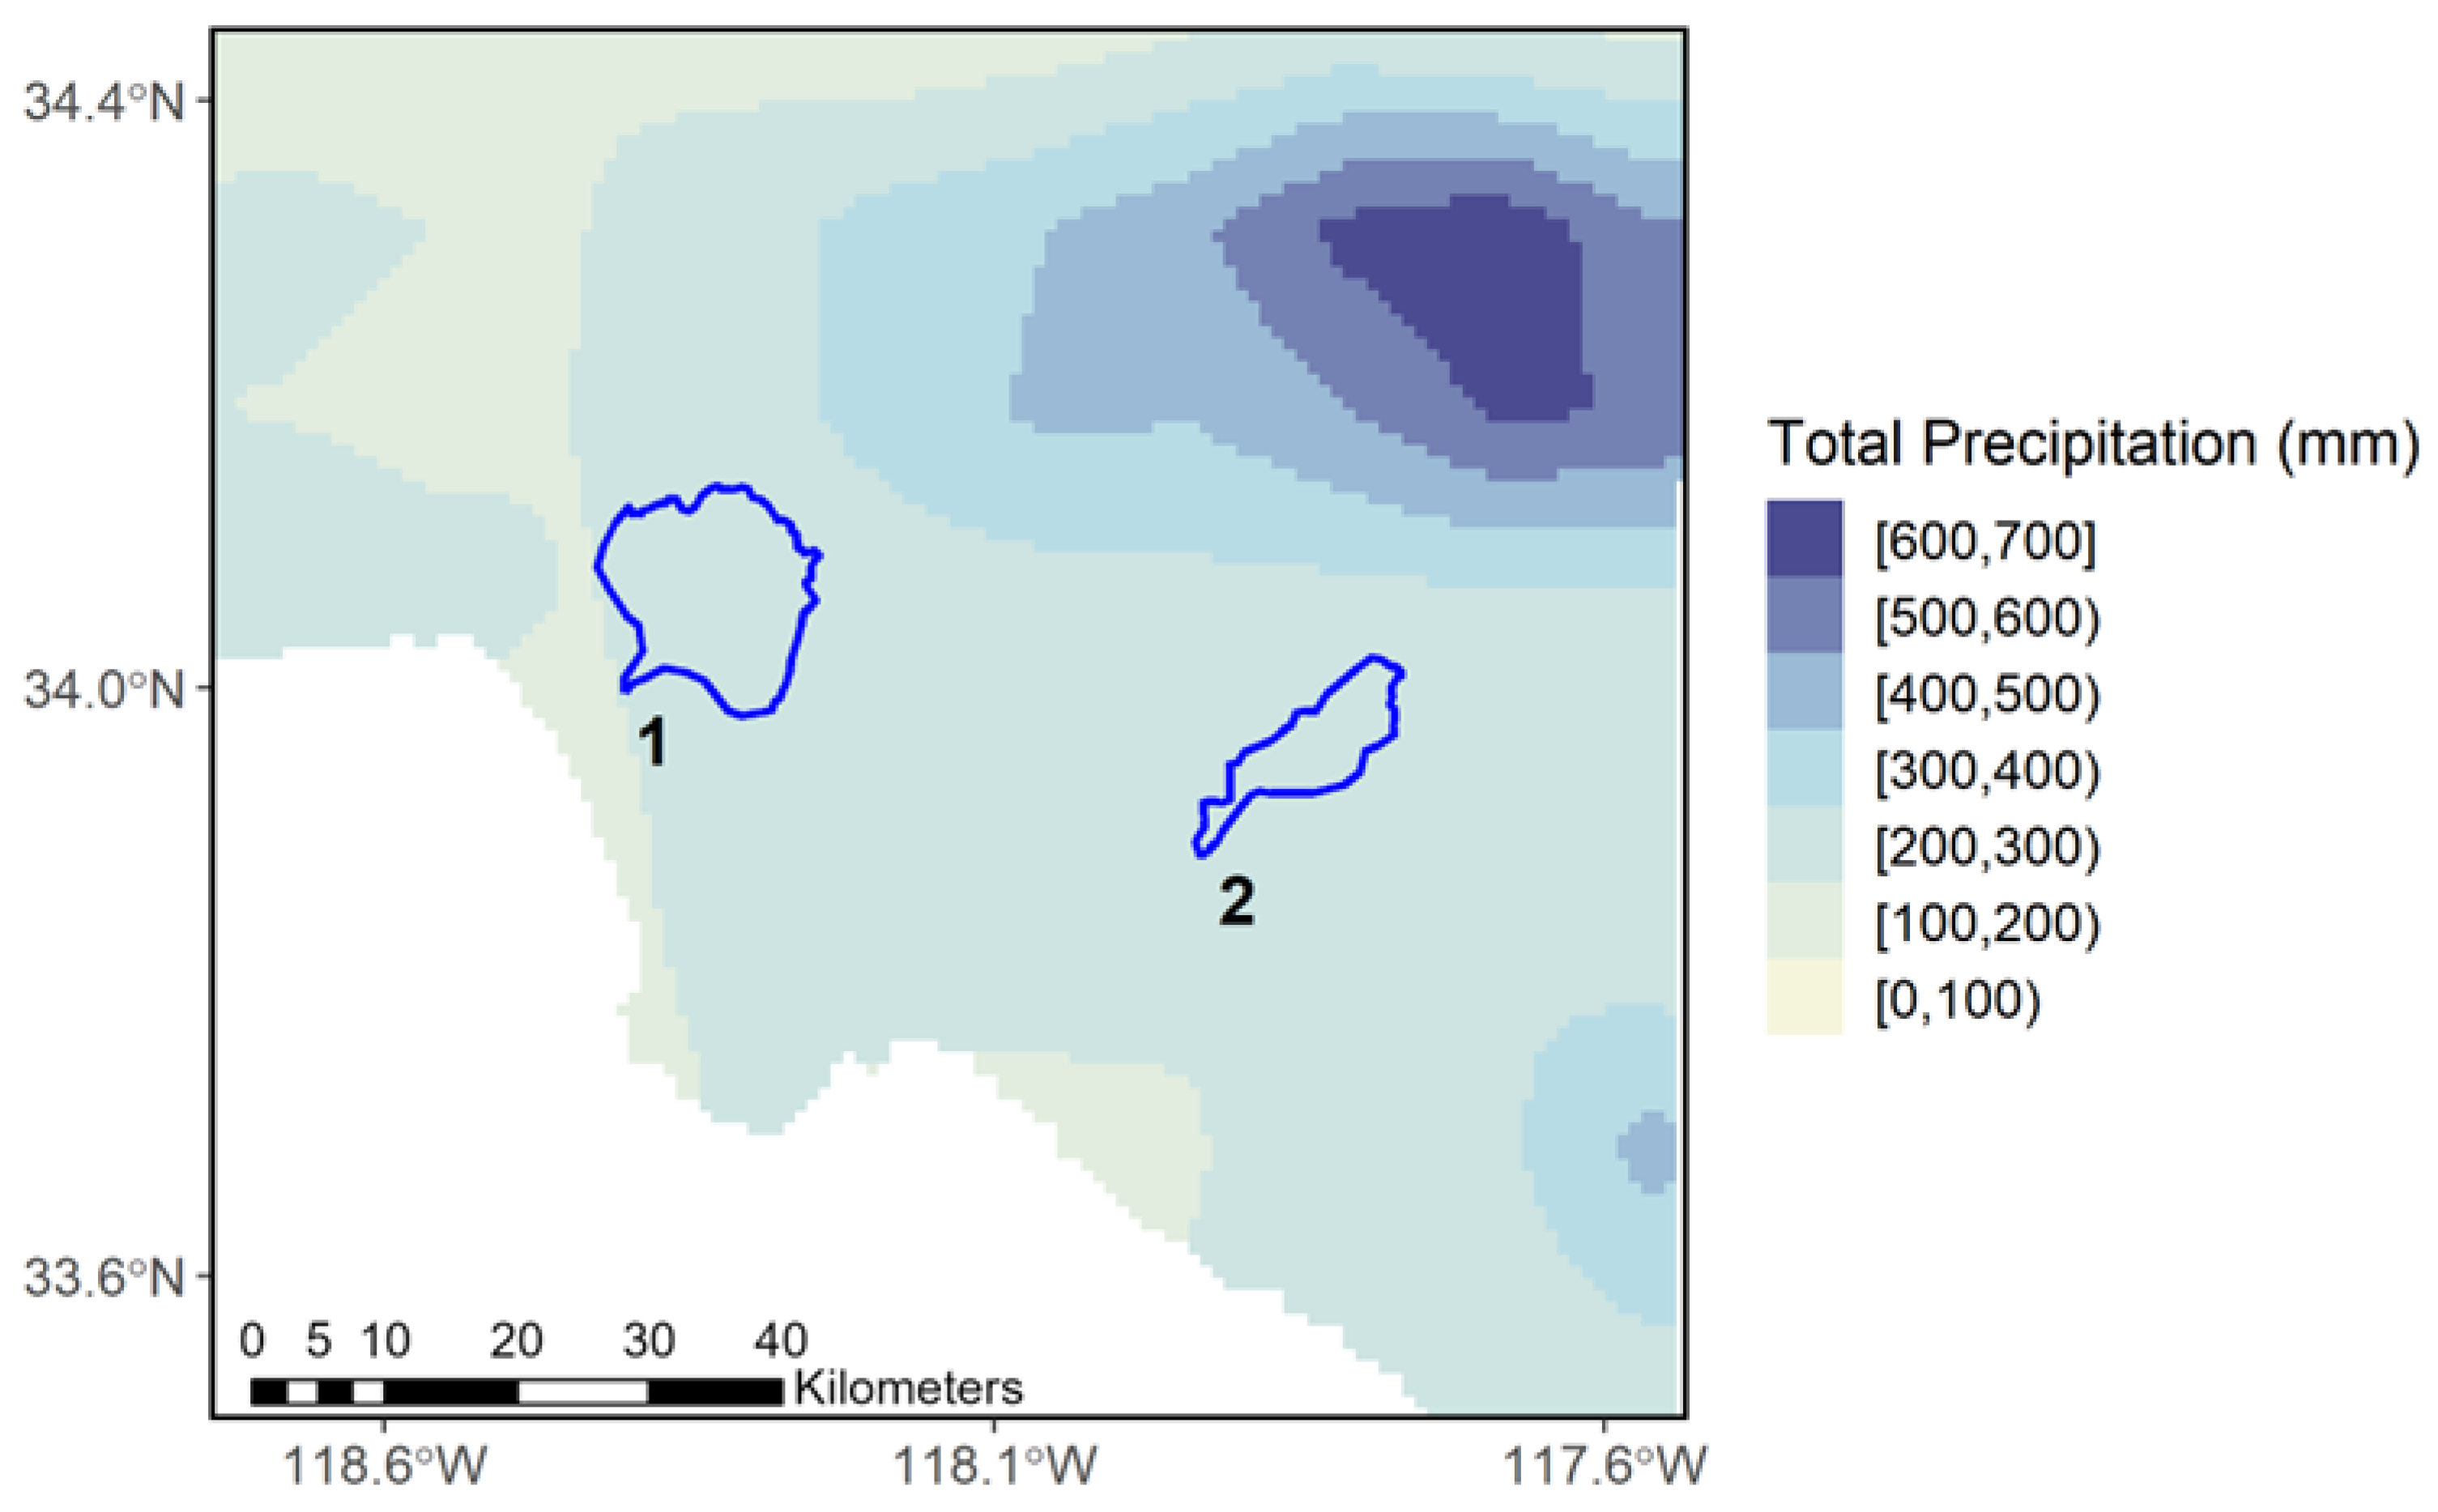
A 7-day precipitation event between 17–24 December 2010was chosen for this study (Figure 6). The event was identified as the most intense storm the LA region had experienced in recent decades with over 300 mm of rain falling over a relatively short period of time. Continuous periods of heavy rain were the result of a large upper-level low pressure system in the northeastern Pacific moving an atmospheric river of moisture over most of Southern California. The model simulations included a 3-month spin-up to allow for soil moisture fields to come to an equilibrium.
Two scenarios were compared under the same meteorological conditions described above:
- The first scenario represented pre-urban development in the absence of urban impervious surfaces.
- The second scenario represented the current urban development and the existing coverage of urban imperviousness using the modified WRF-Hydro and NLCD data of TIA for different urban land use types.
3. Results
3.1. Hydrograph Response to the Introduction of Urban Impervious Surfaces
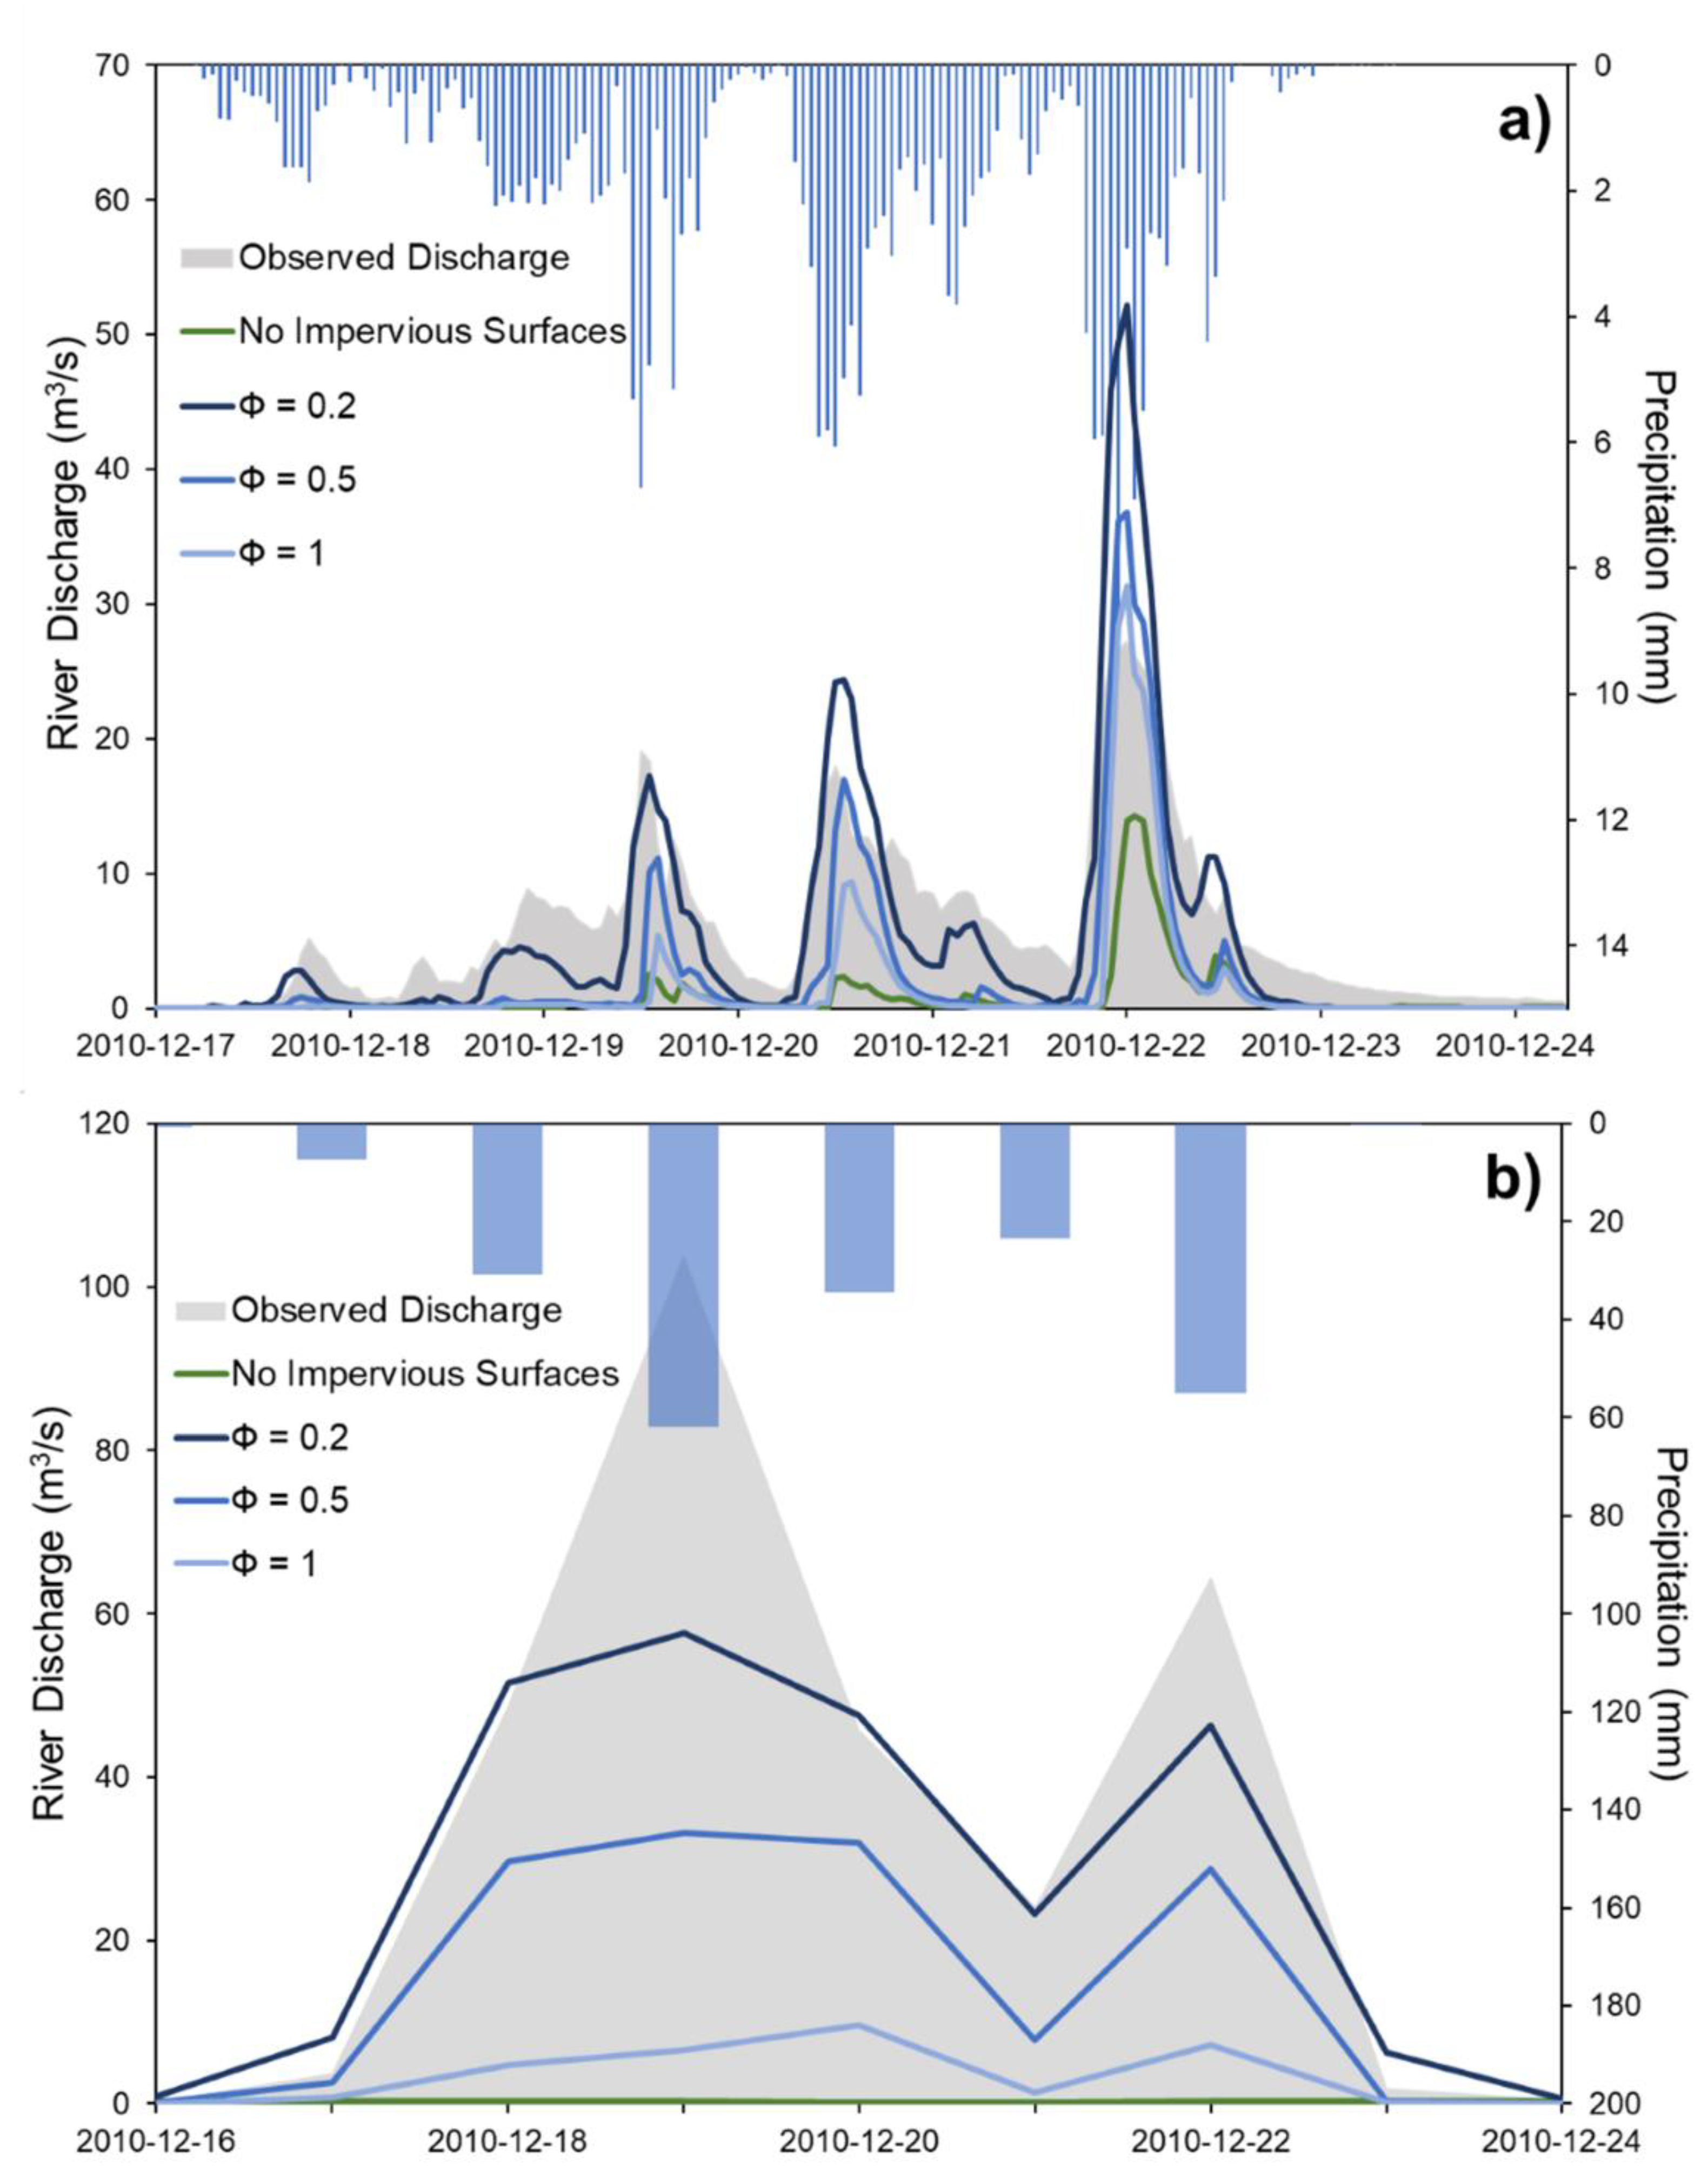
The calibrated values for REFKDT and REFDK in the non-urban watershed at Arroyo Seco can be used over the rest of the modeling domain to simulate pre-urban development conditions. Today, Brea Creek and Ballona Creek are watersheds that are moderately and highly developed, respectively, with a significant TIA. Without urban impervious surfaces, however, the hydrological response to an intense precipitation event in these watersheds is far less compared to observations (Figure 7). At Brea Creek (Figure 7a), the pre-urban development scenario shows overall smaller volumes of river discharge, as well as lower peaks: 2.49, 2.36, and 14.26 m3/s compared to observations of 19.03, 17.92, and 27.18 m3/s. The timing of the peaks is also slightly shifted with a 1 h difference leading to a slower hydrological response in pre-urban conditions. The Ballona Creek watershed, by comparison, shows almost no response in river discharge in the pre-urban development scenario (Figure 7b). This can be explained by differences in soil type between the two watersheds, which play an important role in controlling the hydrological response in the absence of urban impervious surfaces. Brea Creek is largely composed of clay/loam while Ballona Creek’s soil is sand or loamy sand.
The introduction of TIA in the calculation of surface runoff and infiltration in WRF–Hydro to represent post-urban development helps to generate hydrographs that are closer to observations. As could be expected, the intensity of peaks in river discharge is increased due to impervious surfaces in both Brea Creek and Ballona Creek watersheds. The timing of the hydrological response is also closer to observations with faster peak river discharge. Differences in river discharge between pre- and post-urban development scenarios show the impact that impervious surfaces have in driving urban watersheds’ hydrological responses and adding strain to drainage systems and other flood risk management measures. This is particularly noticeable in highly urbanized catchments, such as Ballona Creek, made up mostly of medium- to high-intensity land cover (Figure 7b).
The introduction of urban impervious surfaces in WRF–Hydro alone was not sufficient to explain observed river discharge. As Figure 7 shows, simulations with Φ = 1 performed better in recreating observed river discharge in Brea Creek compared to Ballona Creek, where river discharge was underestimated. The scaling factor was able to provide adequate representations of river discharge compared to observations (Table 4). Subsequent results of the impacts of TIA on water budget partitioning are shown for Φ = 0.2, as the simulation providing the closest estimates of observed river discharge in both urban catchments.
3.2. Implications of Urban Impervious Surfaces on the Water Budget Partitioning
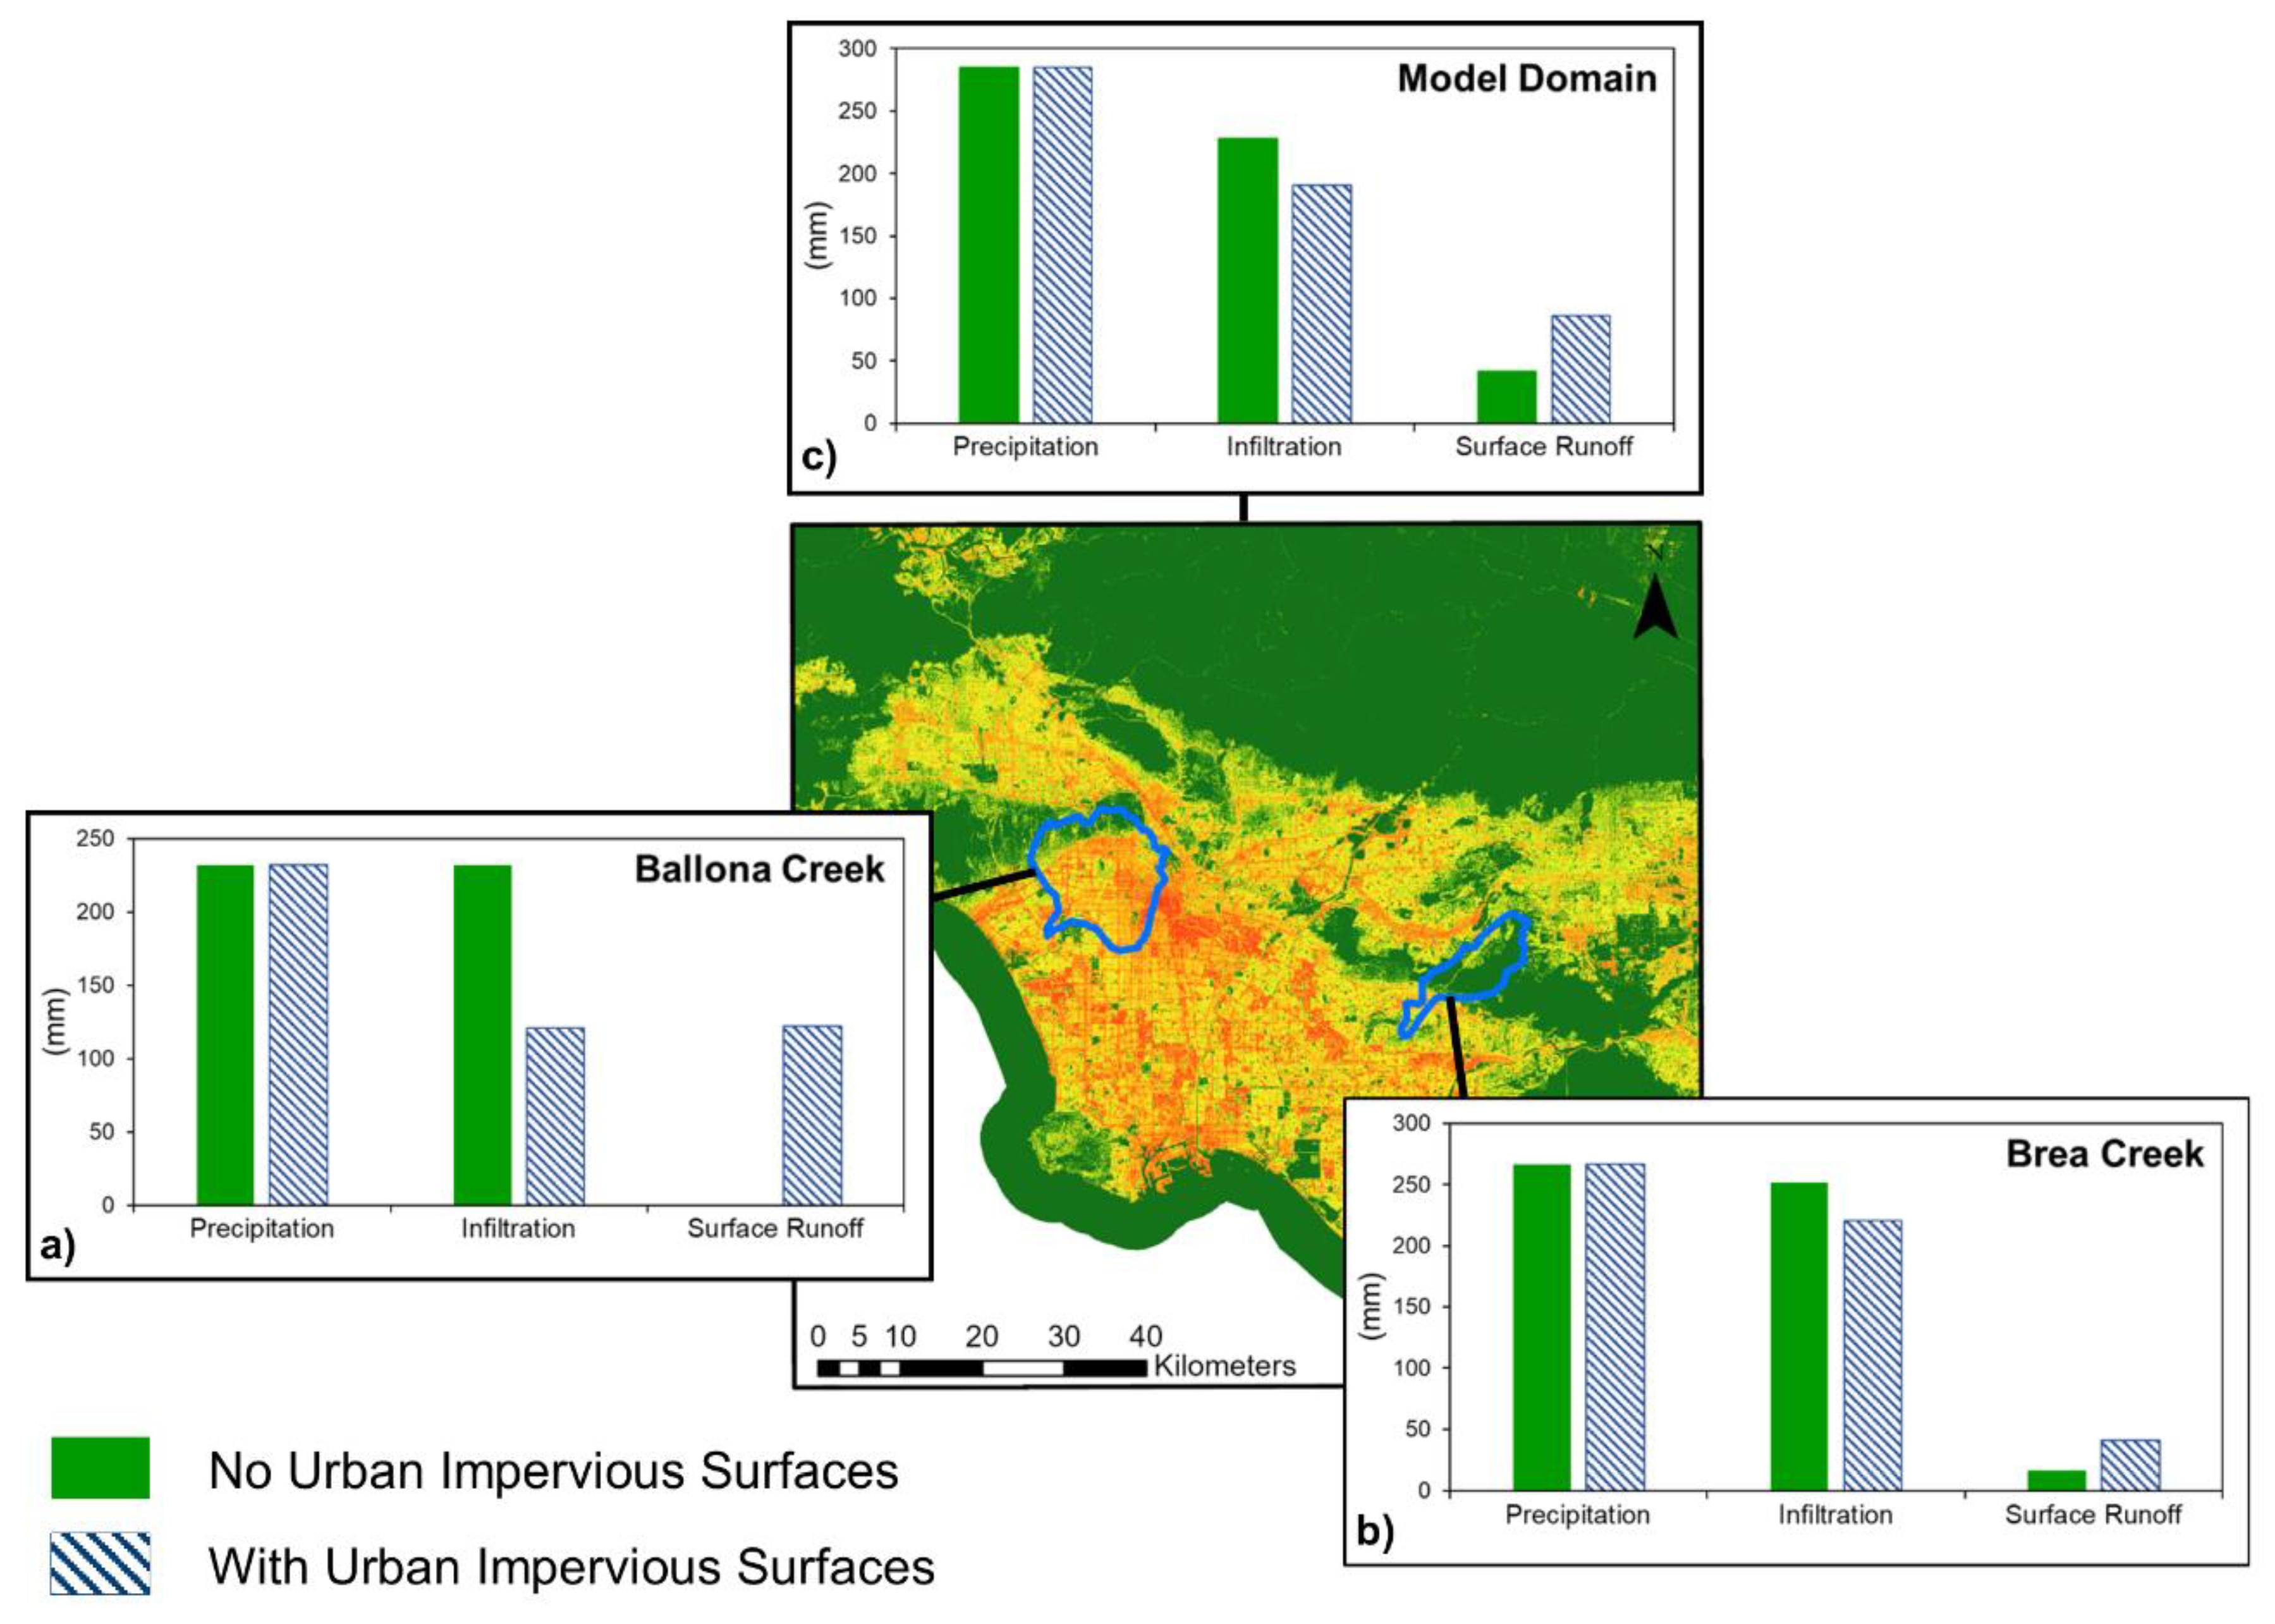
An important benefit of an integrated modeling system such as WRF–Hydro is to be able to analyze changes in the water budget at city scale, while retaining the level of precision required to depict processes such as subsurface and overland flow. The inclusion of TIA in WRF–Hydro allowed us to compare the water budget over the LA metropolitan area under pre- and post-urban development scenarios. Figure 8 shows a summary of the main components of the water budget before and after the widespread development of urban impervious surfaces. Evapotranspiration is not represented in the following results as it had low values during the modeled event and was not highly affected by TIA. This is due to the high humidity conditions during the simulated storm. The water budget is instead dominated by surface runoff and infiltration.
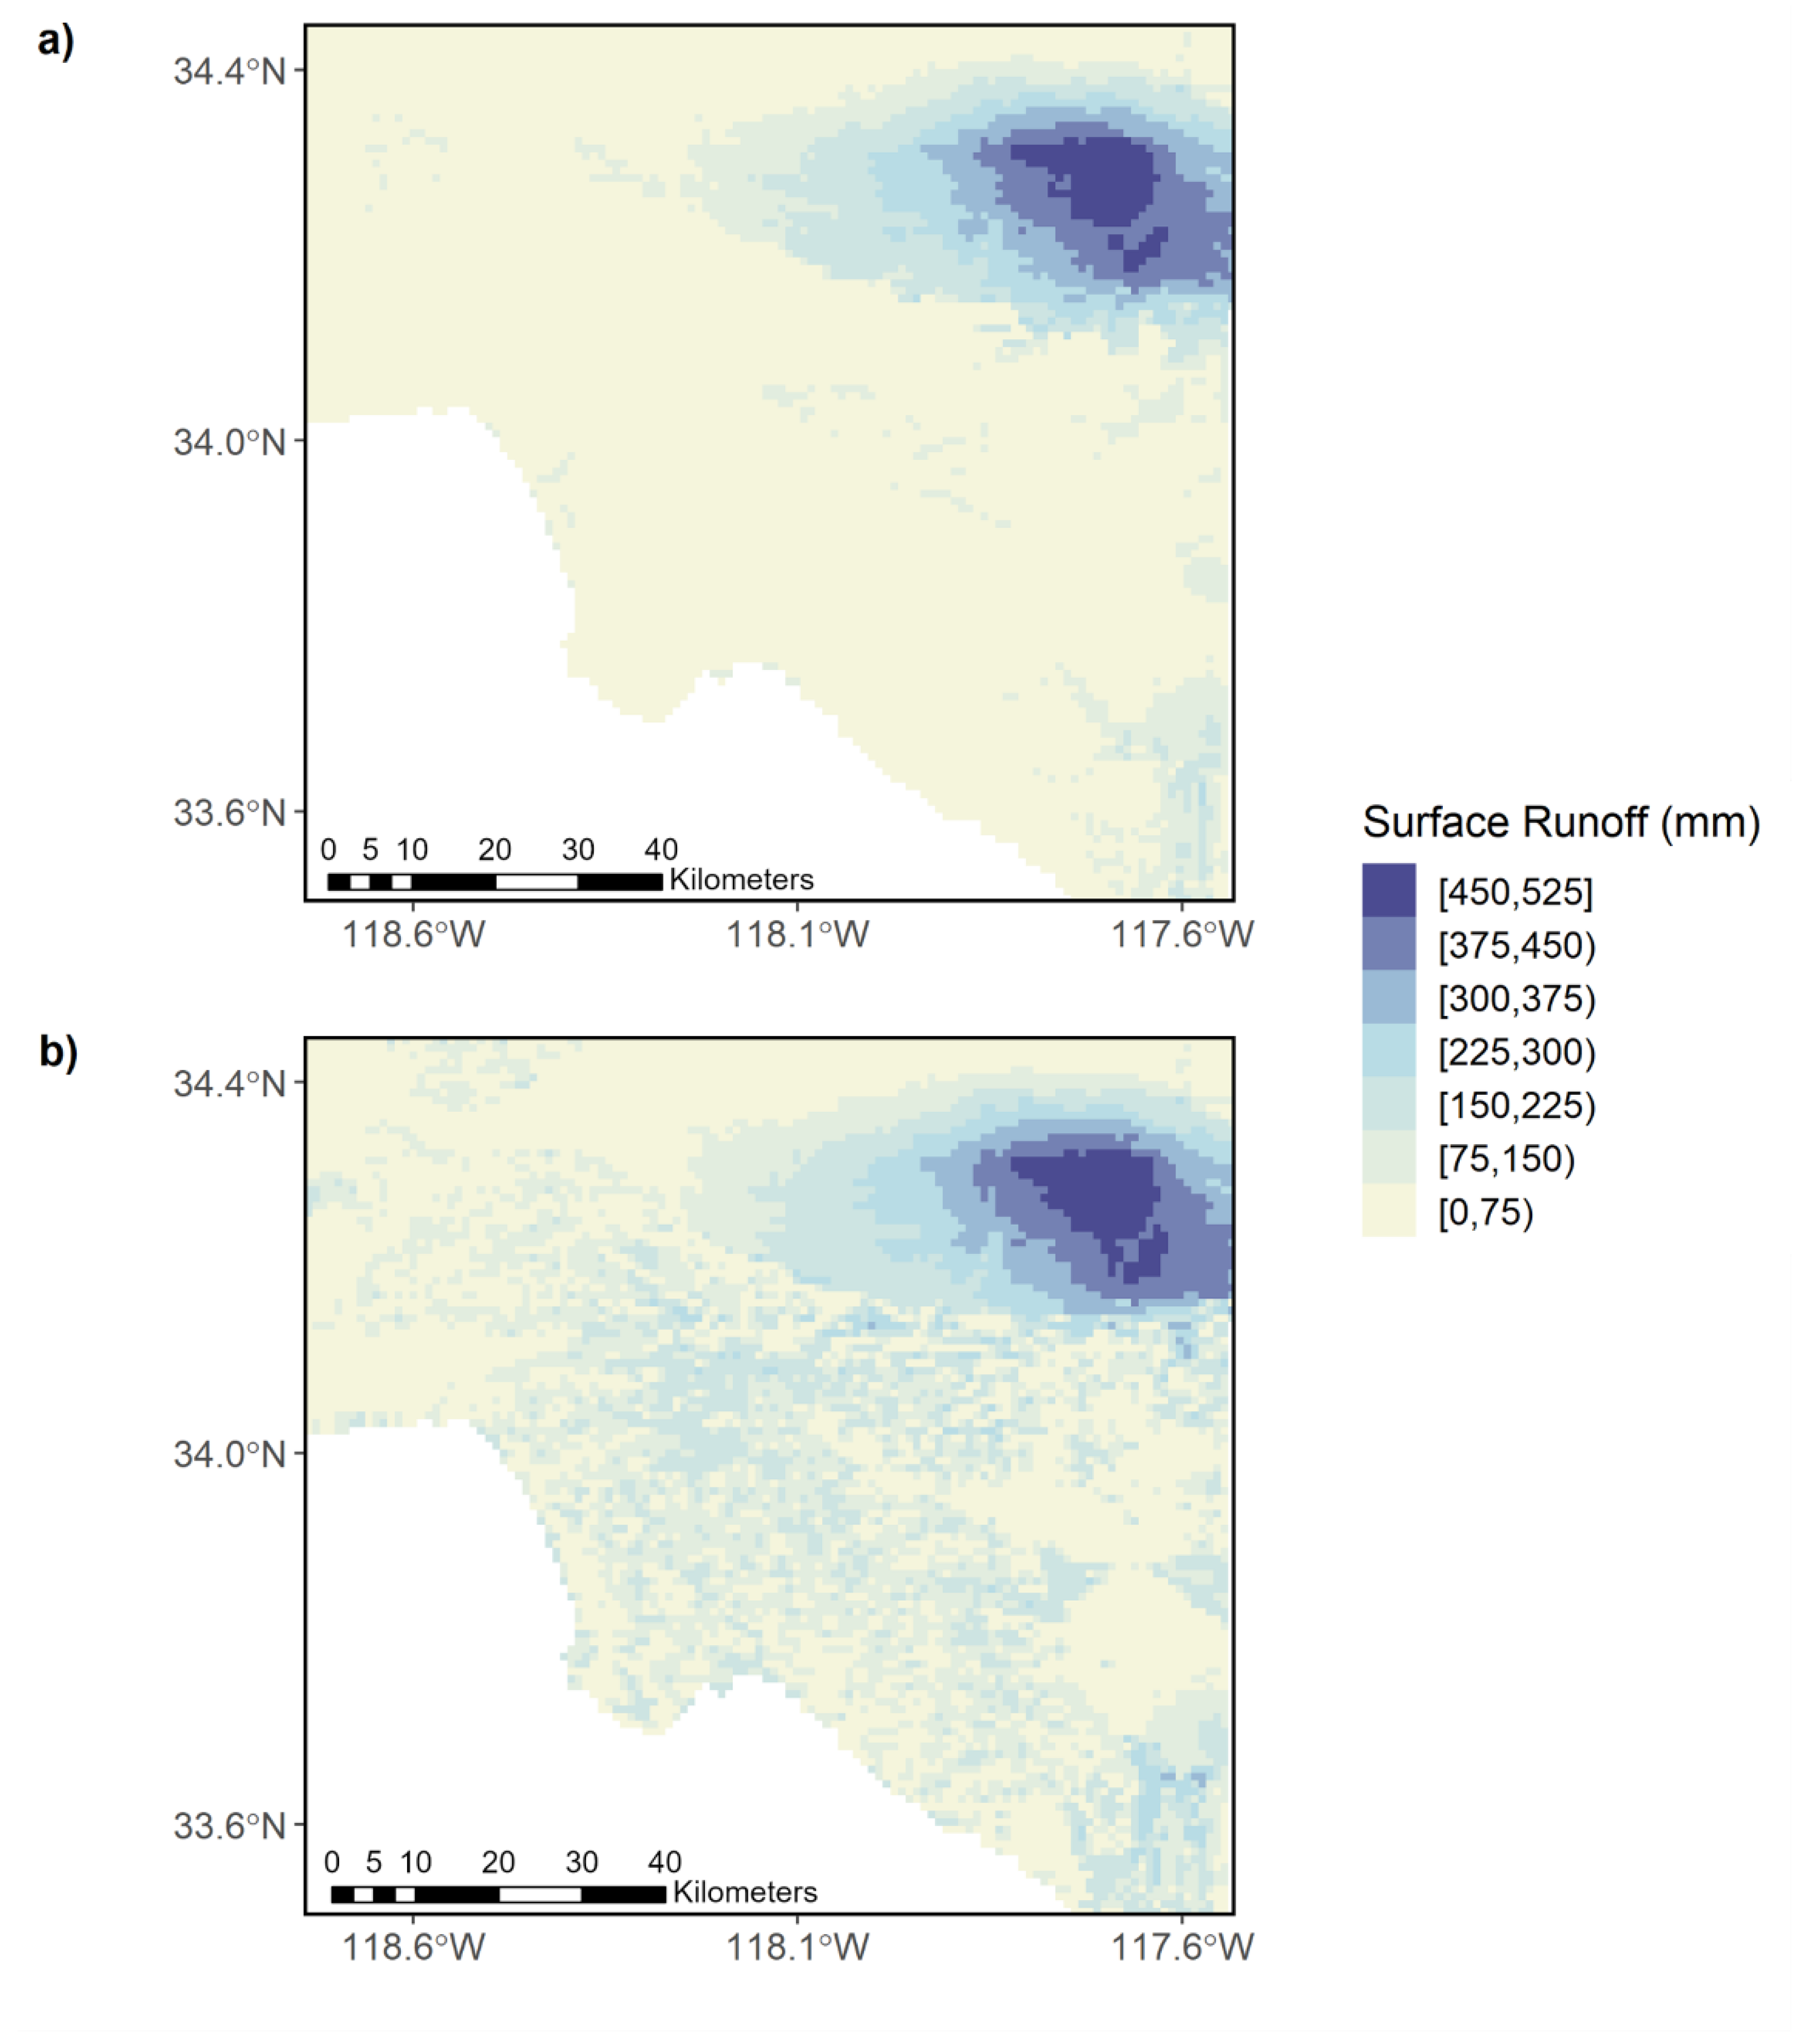
It is well established that impervious surfaces can lead to greater risks of flooding in urban areas by increasing the generation of surface runoff during extreme rainfall events (e.g., [9]). It remains a challenge to identify areas where that risk has most been increased due to urbanization and, therefore, where efficient improvements could be made to reduce urban imperviousness. As shown in Figure 6, the highest levels of precipitation during the December 2010 event fell in the non-urbanized northeastern part of the model domain. While this area, made up mostly of loamy soil, is where the highest surface runoff was found in both scenarios, important differences in surface runoff were found over urbanized areas. The share of incoming precipitation derived as surface runoff during the event increased from 6% to 15% in Brea Creek, and from 15% to 30% over the model domain with impervious surfaces (Figure 9). In both cases, the largest source of storage remained the soil column. The impact of imperviousness was more noticeable over highly urbanized parts of the study domain. In the Ballona Creek watershed, very little surface runoff was generated under pre-urban development conditions. With urban impervious surfaces however, there was a drastic increase in surface runoff in the post-urban development scenario, with it now representing 53% of the incoming precipitation and dominating the water budget.
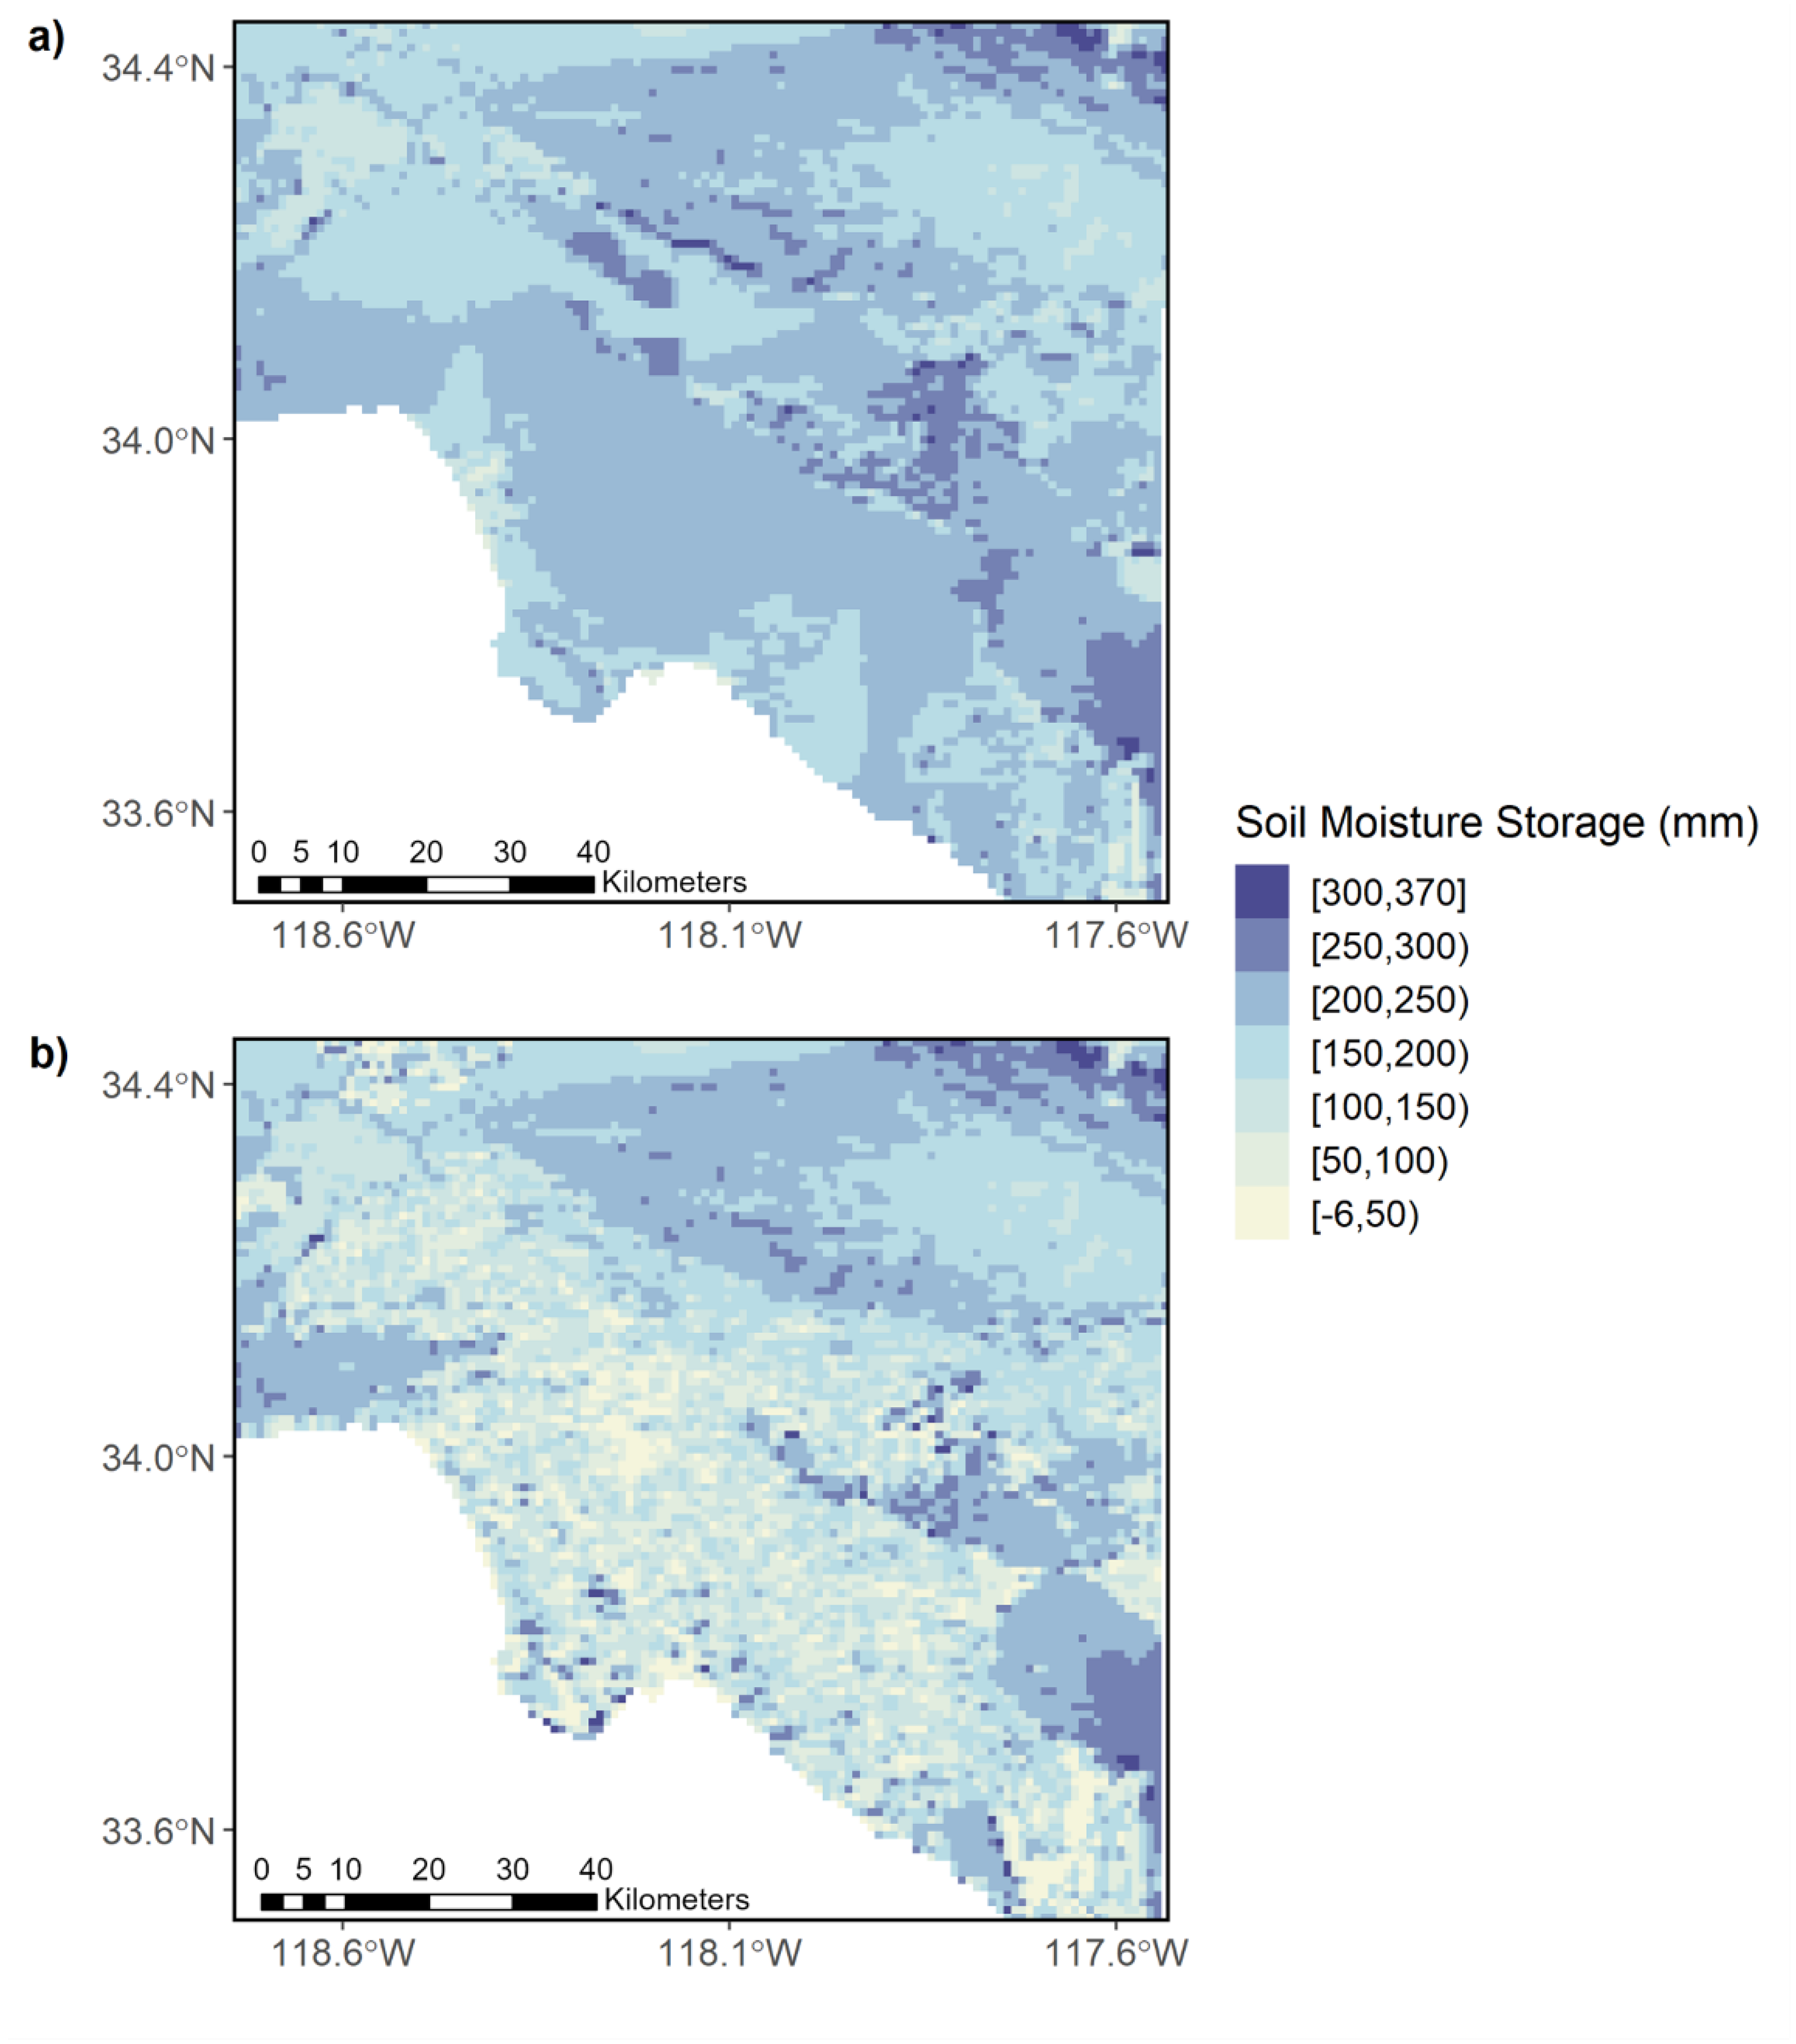
To help understand how groundwater recharge may have been disrupted by urbanization and the spread of urban impervious surfaces, soil moisture content and deep drainage (water flow below the 2 m soil column of the LSM) are mapped separately. The combination of these two terms makes up total infiltration, as represented in Figure 8. Figure 10 shows the spatial distribution of the change in soil moisture content for the entire soil column between 17–24 December 2010. Under the first modeled scenario’s pre-urban development conditions, soil moisture is mainly driven by the soil characteristics of different soil types (Figure 10a). Impervious surfaces not only reduce the total amount of infiltration, but also increase the spatial heterogeneity of soil moisture over the study domain (Figure 10b).
The effects of urban imperviousness on soil moisture are greater in high-urban-intensity areas with high TIA. While soil moisture storage under post-urban development conditions decreased by 17% in the entire model domain compared to the pre-urban development scenario, it decreased by 95% in the Ballona Creek watershed. In downtown Los Angeles, for example, over 200 mm of water was stored in the soil column during the event under pre-urban development conditions. This value dropped to approximately 35 mm with the introduction of impervious surfaces. While water stored in the soil column is still susceptible to exfiltration and does not necessarily correspond to available water resources, the comparison of the presented scenarios shows the extent to which the partitioning of the water budget over highly urbanized areas is disrupted by impervious surfaces.
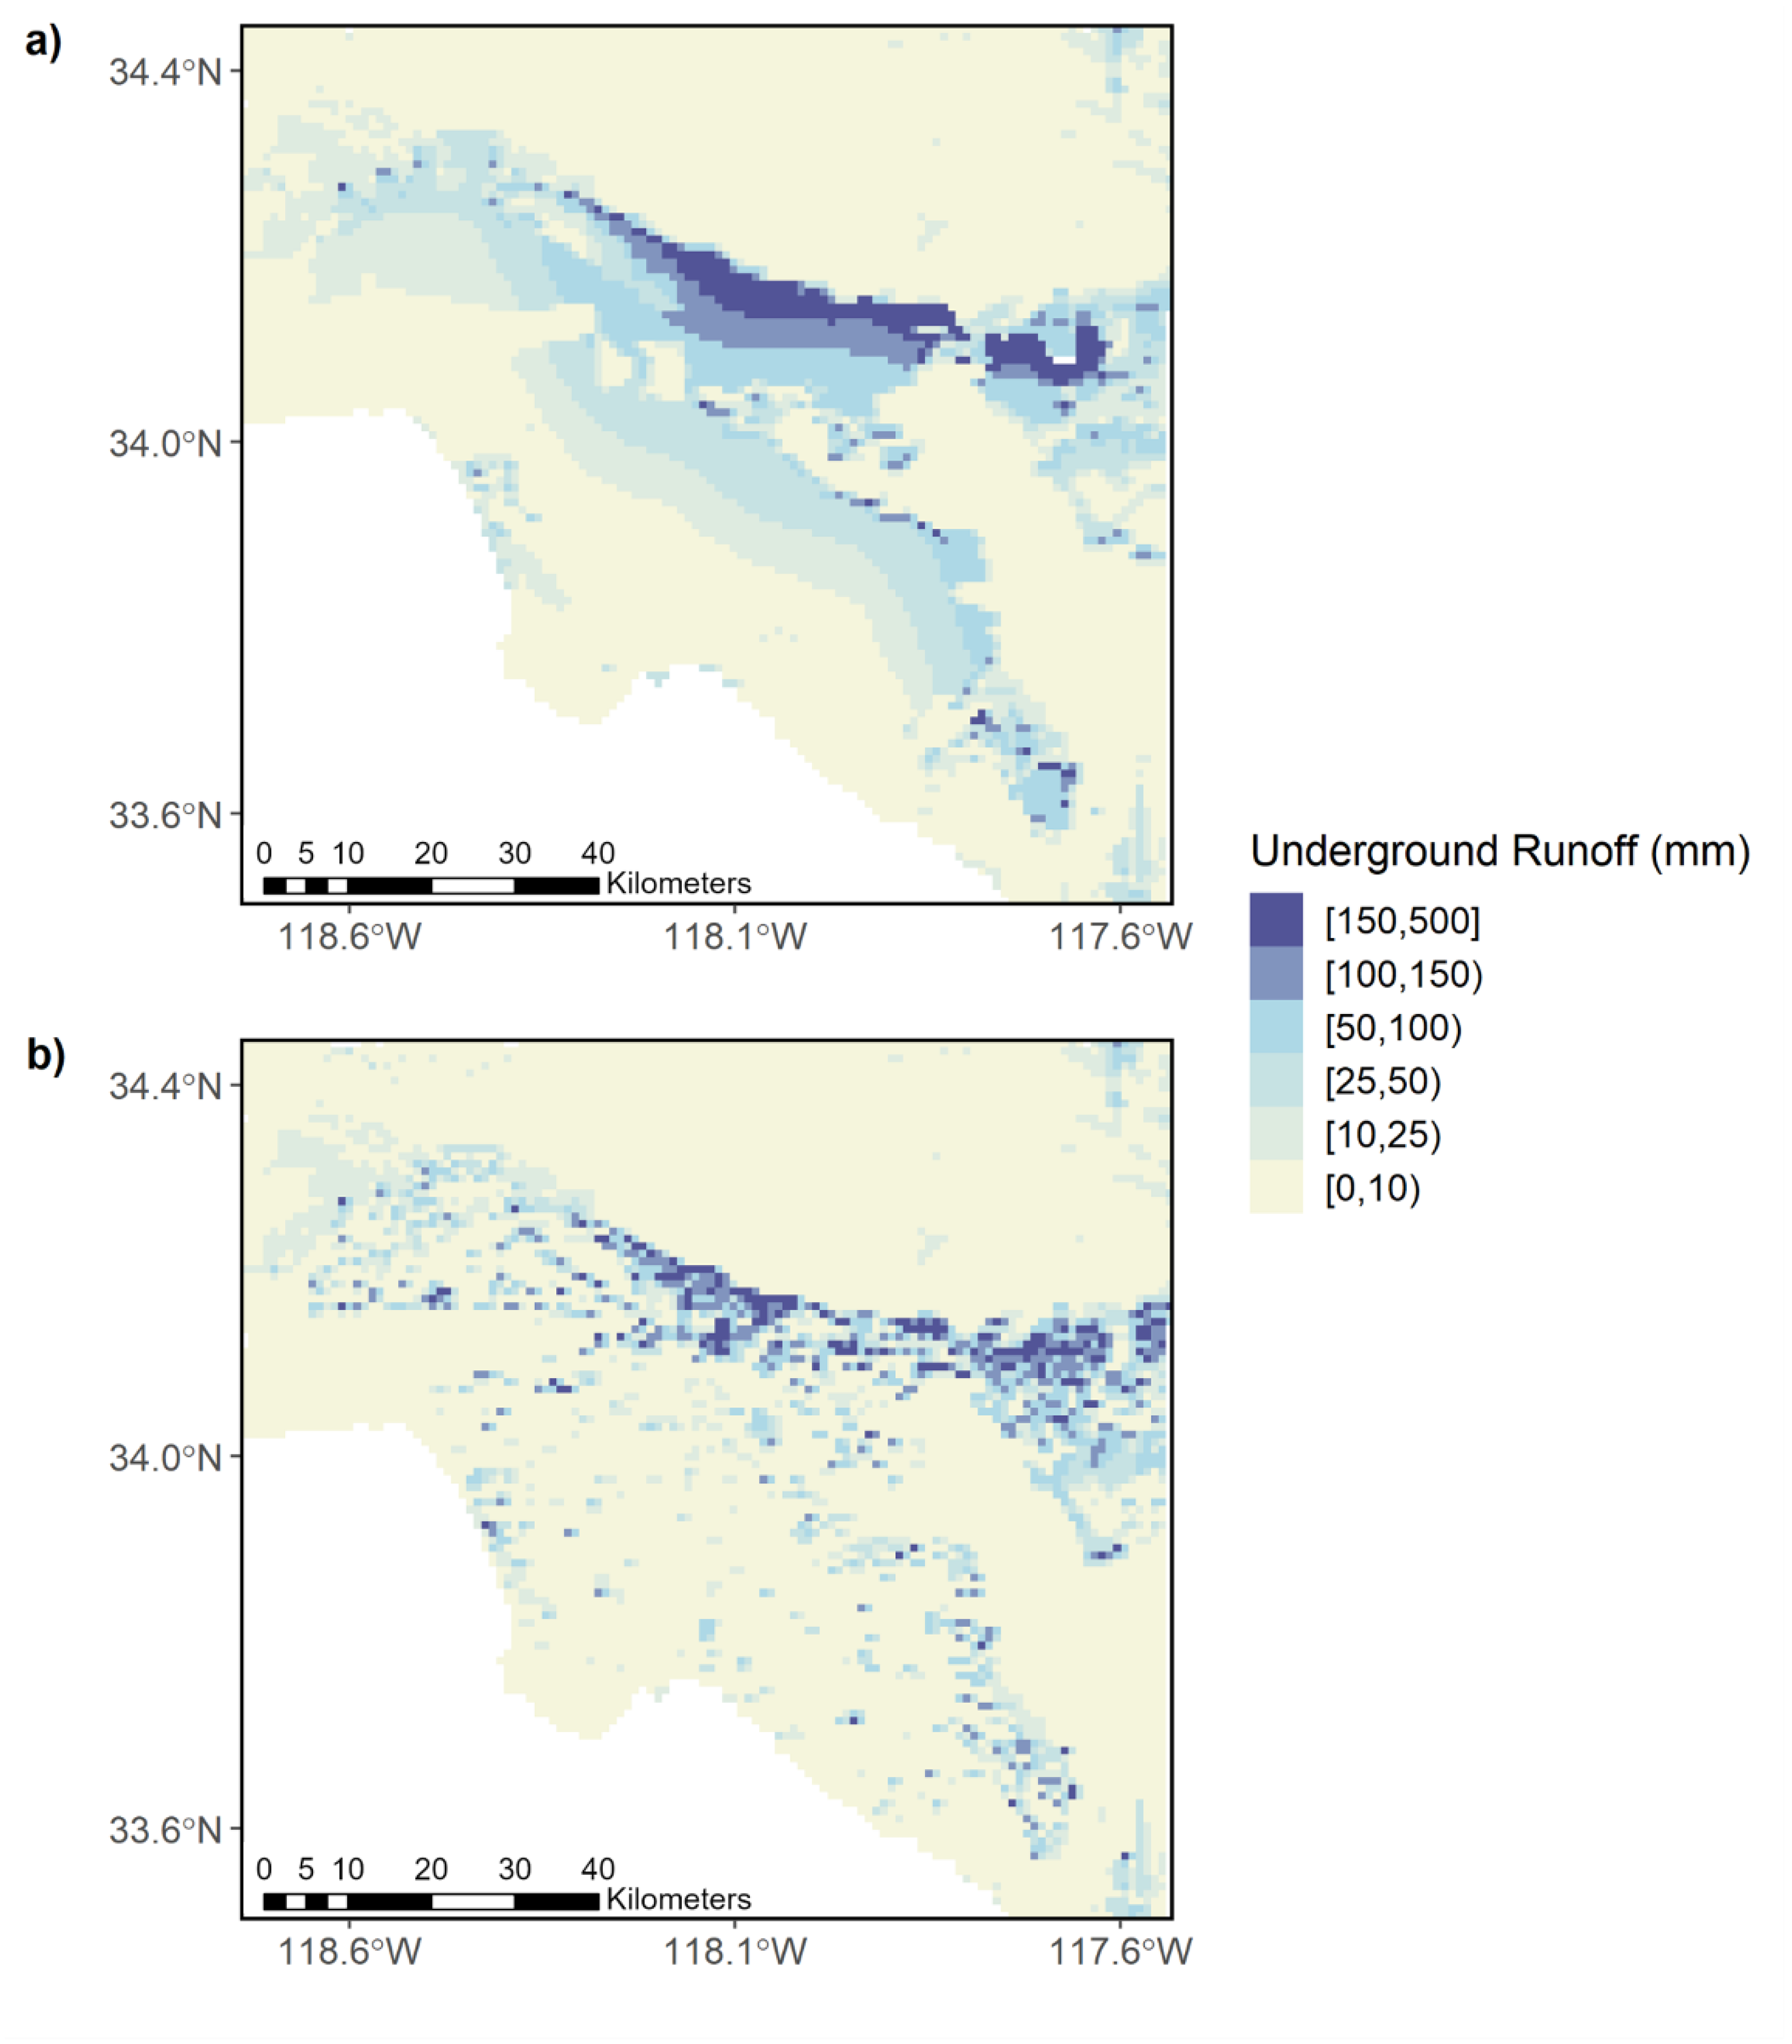
As with surface runoff and soil moisture content, deep drainage (or “underground runoff”) is influenced by soil type and incoming precipitation. The highest values of deep drainage in both scenarios can be found in the northern part of the domain where important amounts of precipitation fell on sandy soil (Figure 11). Deep drainage only contributed to ~8% of the total water budget over the model domain under pre-urban development conditions, with the majority of the incoming precipitation remaining within the top 2 m soil column over the short 7-day simulation period. Still, deep drainage was 47% and 68% greater before the introduction of impervious surfaces over the model domain and in the Ballona Creek watershed, respectively.
4. Discussion
A modified version of the WRF–Hydro modeling framework was used to simulate and compare the city-scale partitioning of storm water in the Los Angeles metropolitan area under pre- and post-urban development scenarios. WRF–Hydro was adapted to consider spatially distributed data of TIA in urban land use types of different intensity in the calculation of infiltration and surface runoff. A 7-day precipitation event in December 2010 was chosen to quantify the impact that the increase in urban imperviousness has had on the city’s hydrology, water budget partitioning, and the potential for groundwater recharge. Different watersheds in LA were chosen to assess the sensitivity of their hydrological responses to varying levels of urban development.
The simulations show that the most urbanized areas of the LA metropolitan region shifted from a water budget largely dominated by infiltration under pre-urban development conditions to one where more than half of the incoming precipitation is derived as surface runoff. Although this study focused on water scarcity, the findings can also inform on flood risk as the addition of impervious surfaces led to a doubling of total surface runoff over the entire model domain. While the overall impact of impervious surfaces on the water budget of urban areas is well understood, the presented methodology allows for a spatially distributed account of these impacts at city scale. This approach therefore highlights the disparate impacts of impervious surfaces on potential groundwater recharge over a large metropolitan region.
The findings are consistent with existing research showing the hydrological impacts of urbanization and land use change, where peak streamflow and surface runoff increase while infiltration decreases due to the development of urban impervious surfaces [36,37]. For example, using the MIKE-SHE model for an urban watershed, [38] associated a 10% increase in urbanization with a 24.8% increase in overland flow. Using a daily precipitation-runoff model in the Los Angeles Basin, [39] found comparable values for LA’s current water budget, with a minimum evapotranspiration rate of 0 mm.yr−1 over impervious areas, 26% of water inflow derived as surface runoff, and only 8% contributing to groundwater recharge.
Few previous studies have applied WRF–Hydro in an urban context and the ones that have resorted to using calibrated values of the model’s non-urban parameters REFDK and REFKDT to represent differences in infiltration over urban areas [22,39]. One of the advantages of the presented physics-based approach is the incorporation of the value of impervious cover with a scaling factor to control the surface runoff/infiltration partitioning. Another key contribution of the modified WRF–Hydro model is the multi-scale representation of both land surface and hydrological processes. Previous studies have indeed found that the inclusion of high-resolution surface and subsurface flow in WRF–Hydro leads to more accurate calculations of soil moisture compared to standalone LSMs [34].
While this method can help assess the impact of urbanization on the water cycle, other studies in urban hydrology have argued that identifying the fraction of TIA that is directly physically connected to storm networks or streams can improve the representation of the hydrological response of urban watersheds [40]. Uncertainties of scale remain, moreover, and while a 900 m LSM resolution can be considered to be a fine resolution compared to most WRF–Hydro applications, lowering this value can improve the accuracy of simulations of river discharge and the water budget [23].
One of this study’s key limitations is the lack of representation of underground piped drainage systems. These systems not only play a central role the urban water cycle; studies have shown that their management can influence groundwater recharge. Previous research has, for example, found that leakages in the sewerage or water distribution systems can compensate for the increase in runoff and even lead to an increase in groundwater recharge [41,42]. While the addition of such infrastructure represents an important future improvement to the modified WRF–Hydro model, this study was interested in depicting the land surface processes that control the potential for increased groundwater recharge in a water-scarce city such as LA that currently manages a water resource deficit.
Other studies have also underlined the importance of urban irrigation and its contribution to the urban water budget and microclimate in cities such as LA [43,44,45]. In this precipitation event-based approach, urban irrigation was not considered but would have to be included in a longer-term simulation of LA’s hydrology. A longer-term simulation would, moreover, allow for the assessment of actual groundwater recharge. In the current approach, potential groundwater recharge is determined based on infiltration and deep drainage below 2 m, the LSM soil column depth. Actual aquifer dynamics further depend on the horizontal movement of water within the deeper ground, as well as withdrawal from human activity, and could be determined with the use of dedicated three-dimensional groundwater flow models such as ParFlow [46]. Still, the focus on land surface processes at metropolitan scale can help water-scarce cities maximize infiltration and fully harness water resources during rare rainfall events.
5. Conclusions
The proposed approach shows how an integrated modeling system such as WRF–Hydro can be adapted to investigate land surface processes in an urban context and at city scale while retaining the necessary level of detail to depict the physics of surface and subsurface flow. The approach was used to quantify the potential for groundwater recharge in LA by comparing pre- and post-urban development scenarios, showing the spatially distributed impact of urban impervious surfaces on the city’s water budget. While there are many ways in which urbanization alters the water cycle in cities other than the spread of impervious surfaces, and further research should look to include critical features such as underground sewer systems, our findings help assess the multi-scale land surface processes that can limit the potential recharge of groundwater resources in water-scarce regions.
Like LA, many cities around the world are increasingly faced with the threats of flooding and droughts. The introduction of urban imperviousness was built on WRF–Hydro’s physics-based modeling capability, allowing for further applications in other cities with limited need for parameterization. When modified to fit urban environments, WRF-Hydro’s multi-scale capabilities could further assist urban adaptation efforts to identify areas to prioritize for measures such as green infrastructure. Moreover, WRF–Hydro’s modular structure offers further opportunities for hydrometeorological research with the two-way coupling of the WRF atmospheric model [34]. Previous research has, for example, found a statistical link between urbanization and more pronounced rainfall events in the US [47], which could be physically tested using the modified WRF–Hydro system coupled to WRF. The presented approach can provide a valuable tool to inform on urban land use management and the development of adaptive urban solutions, helping to increase the resilience of cities.
Author Contributions
Conceptualization, U.P., P.V and A.D.J.; methodology, U.P. and P.V.; software, U.P.; validation, U.P. and P.V.; formal analysis, U.P.; investigation, U.P.; resources, P.V. and A.D.J.; data curation, U.P.; writing—original draft preparation, U.P.; writing—review and editing, U.P., P.V. and A.D.J.; visualization, U.P.; supervision, P.V. and A.D.J.; project administration, P.V.; funding acquisition, P.V. and A.D.J. All authors have read and agreed to the published version of the manuscript.
Funding
This research was funded by the Laboratory Directed Research and Development Program of Lawrence Berkeley National Laboratory under U.S. Department of Energy Contract No. DE–AC02–05CH11231 and by the Regional and Global Climate Modeling Program (RGCM) program under “the Calibrated and Systematic Characterization, Attribution and Detection of Extremes (CASCADE)” Science Focus Area (award no. DE-AC02-05CH11231). Analysis and model simulations were performed using the National Energy Research Scientific Computing Center (NERSC), specifically Cori-KNL supercomputing facilities (contract number DE-AC02-05CH11231).
Data Availability Statement
The code for the WRF–Hydro modeling system is available at https://ral.ucar.edu/projects/wrf_hydro/model-code (accessed on 1 October 2020). The DEM is available at https://www.epa.gov/waterdata/nhdplus-national-hydrography-dataset-plus (accessed on 1 October 2020). Geographical data is available with WRF’s Preprocessing System at https://www2.mmm.ucar.edu/wrf/users/download/get_sources_wps_geog.html (accessed 1 October 2020). Additional NLCD land cover data is available at https://www.mrlc.gov/data (accessed 1 January 2021). The climate forcing data used in this study is available from https://ldas.gsfc.nasa.gov/nldas/v2/forcing (accessed 1 January 2021).
Conflicts of Interest
The authors declare no conflict of interest.
References
- Feng, B.; Zhang, Y.; Bourke, R. Urbanization Impacts on Flood Risks Based on Urban Growth Data and Coupled Flood Models. Nat. Hazards 2021, 106, 613–627. [Google Scholar] [CrossRef]
- McGrane, S.J. Impacts of Urbanisation on Hydrological and Water Quality Dynamics, and Urban Water Management: A Review. Hydrol. Sci. J. 2016, 61, 2295–2311. [Google Scholar] [CrossRef] [Green Version]
- United Nations World Urbanization Prospects: The 2018 Revision; United Nations, Department of Economic and Social Affairs, Population Division: New York, NY, USA, 2019.
- Li, C.; Sun, G.; Caldwell, P.V.; Cohen, E.; Fang, Y.; Zhang, Y.; Oudin, L.; Sanchez, G.M.; Meentemeyer, R.K. Impacts of Urbanization on Watershed Water Balances Across the Conterminous United States. Water Resour. Res. 2020, 56, e2019WR026574. [Google Scholar] [CrossRef]
- Locatelli, L.; Mark, O.; Mikkelsen, P.S.; Arnbjerg-Nielsen, K.; Deletic, A.; Roldin, M.; Binning, P.J. Hydrologic Impact of Urbanization with Extensive Stormwater Infiltration. J. Hydrol. 2017, 544, 524–537. [Google Scholar] [CrossRef] [Green Version]
- Guan, M.; Sillanpää, N.; Koivusalo, H. Storm Runoff Response to Rainfall Pattern, Magnitude and Urbanization in a Developing Urban Catchment. Hydrol. Process. 2016, 30, 543–557. [Google Scholar] [CrossRef]
- Rosburg, T.T.; Nelson, P.A.; Bledsoe, B.P. Effects of Urbanization on Flow Duration and Stream Flashiness: A Case Study of Puget Sound Streams, Western Washington, USA. J. Am. Water Resour. Assoc. 2017, 53, 493–507. [Google Scholar] [CrossRef]
- Arguez, A.; Durre, I.; Applequist, S.; Vose, R.S.; Squires, M.F.; Yin, X.; Heim, R.R.; Owen, T.W. NOAA’s 1981–2010 U.S. Climate Normals: An Overview. Bull. Am. Meteorol. Soc. 2012, 93, 1687–1697. [Google Scholar] [CrossRef]
- Sohn, W.; Kim, J.-H.; Li, M.-H.; Brown, R.D.; Jaber, F.H. How Does Increasing Impervious Surfaces Affect Urban Flooding in Response to Climate Variability? Ecol. Indic. 2020, 118, 106774. [Google Scholar] [CrossRef]
- Lim, T.C.; Welty, C. Effects of Spatial Configuration of Imperviousness and Green Infrastructure Networks on Hydrologic Response in a Residential Sewershed. Water Resour. Res. 2017, 53, 8084–8104. [Google Scholar] [CrossRef]
- Rossman, L.A. Storm Water Management Model User’s Manual, Version 5.0; United States Environmental Protection Agency: Washington, DC, USA, 2010. [Google Scholar]
- Brunner, G.W. HEC–RAS River Analysis System, 2D Modeling User’s Manual; US Army Corps of Engineers Institute for Water Resources Hydraulic Engineering Center: Davis, CA, USA, 2016. [Google Scholar]
- Leandro, J.; Martins, R. A Methodology for Linking 2D Overland Flow Models with the Sewer Network Model SWMM 5.1 Based on Dynamic Link Libraries. Water Sci. Technol. 2016, 73, 3017–3026. [Google Scholar] [CrossRef] [Green Version]
- Fan, Y.; Ao, T.; Yu, H.; Huang, G.; Li, X. A Coupled 1D-2D Hydrodynamic Model for Urban Flood Inundation. Adv. Meteorol. 2017, 2017, 2819308. [Google Scholar] [CrossRef] [Green Version]
- Rangari, V.A.; Umamahesh, N.V.; Bhatt, C.M. Assessment of Inundation Risk in Urban Floods Using HEC RAS 2D. Model. Earth Syst. Environ. 2019, 5, 1839–1851. [Google Scholar] [CrossRef]
- Salvadore, E.; Bronders, J.; Batelaan, O. Hydrological Modelling of Urbanized Catchments: A Review and Future Directions. J. Hydrol. 2015, 529, 62–81. [Google Scholar] [CrossRef]
- Verbeiren, B.; Van De Voorde, T.; Canters, F.; Binard, M.; Cornet, Y.; Batelaan, O. Assessing Urbanisation Effects on Rainfall-Runoff Using a Remote Sensing Supported Modelling Strategy. Int. J. Appl. Earth Obs. Geoinf. 2013, 21, 92–102. [Google Scholar] [CrossRef]
- Gochis, D.J.; Barlage, M.; Dugger, A.; FitzGerald, K.; Karsten, L.; McAllister, M.; McCreight, J.; Mills, J.; RafieeiNasab, A.; Read, L.; et al. The WRF-Hydro Modeling System Technical Description, Version 5.0; Geological Survey: Reston, VA, USA, 2018; Available online: https://ral.ucar.edu/sites/default/files/public/WRF-HydroV5TechnicalDescription.pdf (accessed on 29 August 2022).
- Zhang, J.; Lin, P.; Gao, S.; Fang, Z. Understanding the Re-Infiltration Process to Simulating Streamflow in North Central Texas Using the WRF-Hydro Modeling System. J. Hydrol. 2020, 587, 124902. [Google Scholar] [CrossRef]
- Sun, M.; Li, Z.; Yao, C.; Liu, Z.; Wang, J.; Hou, A.; Zhang, K.; Huo, W.; Liu, M. Evaluation of Flood Prediction Capability of the WRF-Hydro Model Based on Multiple Forcing Scenarios. Water 2020, 12, 874. [Google Scholar] [CrossRef] [Green Version]
- Lee, J.; Kim, Y.; Wang, D. Assessing the Characteristics of Recent Drought Events in South Korea Using WRF-Hydro. J. Hydrol. 2022, 607, 127459. [Google Scholar] [CrossRef]
- Silver, M.; Karnieli, A.; Ginat, H.; Meiri, E.; Fredj, E. An Innovative Method for Determining Hydrological Calibration Parameters for the WRF-Hydro Model in Arid Regions. Environ. Model. Softw. 2017, 91, 47–69. [Google Scholar] [CrossRef]
- Kim, S.; Shen, H.; Noh, S.; Seo, D.-J.; Welles, E.; Pelgrim, E.; Weerts, A.; Lyons, E.; Philips, B. High-Resolution Modeling and Prediction of Urban Floods Using WRF-Hydro and Data Assimilation. J. Hydrol. 2021, 598, 126236. [Google Scholar] [CrossRef]
- Dewitz, J. National Land Cover Database (NLCD) 2019 Products. 2021. Available online: https://data.usgs.gov/datacatalog/data/USGS:60cb3da7d34e86b938a30cb9 (accessed on 29 August 2022).
- Niu, G.-Y.; Yang, Z.-L.; Mitchell, K.E.; Chen, F.; Ek, M.B.; Barlage, M.; Kumar, A.; Manning, K.; Niyogi, D.; Rosero, E.; et al. The Community Noah Land Surface Model with Multiparameterization Options (Noah-MP): 1. Model Description and Evaluation with Local-Scale Measurements. J. Geophys. Res. Atmos. 2011, 116. [Google Scholar] [CrossRef]
- Schaake, J.C.; Koren, V.I.; Duan, Q.-Y.; Mitchell, K.; Chen, F. Simple Water Balance Model for Estimating Runoff at Different Spatial and Temporal Scales. J. Geophys. Res. Atmos. 1996, 101, 7461–7475. [Google Scholar] [CrossRef]
- Arnault, J.; Wagner, S.; Rummler, T.; Fersch, B.; Bliefernicht, J.; Andresen, S.; Kunstmann, H. Role of Runoff–Infiltration Partitioning and Resolved Overland Flow on Land–Atmosphere Feedbacks: A Case Study with the WRF-Hydro Coupled Modeling System for West Africa. J. Hydrometeorol. 2016, 17, 1489–1516. [Google Scholar] [CrossRef]
- Rummler, T.; Arnault, J.; Gochis, D.; Kunstmann, H. Role of Lateral Terrestrial Water Flow on the Regional Water Cycle in a Complex Terrain Region: Investigation With a Fully Coupled Model System. J. Geophys. Res. Atmos. 2019, 124, 507–529. [Google Scholar] [CrossRef]
- Gochis, D.; Chen, F. Hydrological Enhancements to the Community Noah Land Surface Model; University Corporation for Atmospheric Research: Boulder, CO, USA, 2003; Available online: https://opensky.ucar.edu/islandora/object/technotes:373.
- Nash, J.E.; Sutcliffe, J.V. River Flow Forecasting through Conceptual Models Part I—A Discussion of Principles. J. Hydrol. Amst. 1970, 10, 282–290. [Google Scholar] [CrossRef]
- Yucel, I.; Onen, A.; Yilmaz, K.K.; Gochis, D.J. Calibration and Evaluation of a Flood Forecasting System: Utility of Numerical Weather Prediction Model, Data Assimilation and Satellite-Based Rainfall. J. Hydrol. 2015, 523, 49–66. [Google Scholar] [CrossRef] [Green Version]
- Liu, Y.; Liu, J.; Li, C.; Yu, F.; Wang, W.; Qiu, Q. Parameter Sensitivity Analysis of the WRF-Hydro Modeling System for Streamflow Simulation: A Case Study in Semi-Humid and Semi-Arid Catchments of Northern China. Asia-Pac. J. Atmos. Sci. 2021, 57, 451–466. [Google Scholar] [CrossRef]
- Arnault, J.; Wei, J.; Rummler, T.; Fersch, B.; Zhang, Z.; Jung, G.; Wagner, S.; Kunstmann, H. A Joint Soil-Vegetation-Atmospheric Water Tagging Procedure With WRF-Hydro: Implementation and Application to the Case of Precipitation Partitioning in the Upper Danube River Basin. Water Resour. Res. 2019, 55, 6217–6243. [Google Scholar] [CrossRef]
- Wang, W.; Liu, J.; Li, C.; Liu, Y.; Yu, F.; Yu, E. An Evaluation Study of the Fully Coupled WRF/WRF-Hydro Modeling System for Simulation of Storm Events with Different Rainfall Evenness in Space and Time. Water 2020, 12, 1209. [Google Scholar] [CrossRef]
- Phillips, J.V.; Tadayon, S. Selection of Manning’s Roughness Coefficient for Natural and Constructed Vegetated and Non-Vegetated Channels, and Vegetation Maintenance Plan Guidelines for Vegetated Channels in Central Arizona; Scientific Investigations Report; Geological Survey: Reston, VA, USA, 2006; p. 49. Available online: https://pubs.er.usgs.gov/publication/sir20065108.
- Jat, M.K.; Khare, D.; Garg, P.K. Urbanization and Its Impact on Groundwater: A Remote Sensing and GIS-Based Assessment Approach. The Environmentalist 2008, 29, 17. [Google Scholar] [CrossRef]
- Puno, R.C.C.; Puno, G.R.; Talisay, B.A.M. Hydrologic Responses of Watershed Assessment to Land Cover and Climate Change Using Soil and Water Assessment Tool Model. Glob. J. Environ. Sci. Manag. 2019, 5, 71–82. [Google Scholar] [CrossRef]
- Im, S.; Kim, H.; Kim, C.; Jang, C. Assessing the Impacts of Land Use Changes on Watershed Hydrology Using MIKE SHE. Environ. Geol. 2009, 57, 231–239. [Google Scholar] [CrossRef]
- Hevesi, J.A.; Johnson, T.D. Estimating Spatially and Temporally Varying Recharge and Runoff from Precipitation and Urban Irrigation in the Los Angeles Basin, California; Scientific Investigations Report; U.S. Geological Survey: Reston, VA, USA, 2016; p. 208. [Google Scholar]
- Sytsma, A.; Bell, C.; Eisenstein, W.; Hogue, T.; Kondolf, G.M. A Geospatial Approach for Estimating Hydrological Connectivity of Impervious Surfaces. J. Hydrol. 2020, 591, 125545. [Google Scholar] [CrossRef]
- Tam, V.T.; Nga, T.T.V. Assessment of Urbanization Impact on Groundwater Resources in Hanoi, Vietnam. J. Environ. Manag. 2018, 227, 107–116. [Google Scholar] [CrossRef] [PubMed]
- Minnig, M.; Moeck, C.; Radny, D.; Schirmer, M. Impact of Urbanization on Groundwater Recharge Rates in Dübendorf, Switzerland. J. Hydrol. 2018, 563, 1135–1146. [Google Scholar] [CrossRef] [Green Version]
- Vahmani, P.; Jones, A.D. Water Conservation Benefits of Urban Heat Mitigation. Nat. Commun. 2017, 8, 1072. [Google Scholar] [CrossRef] [PubMed] [Green Version]
- Vahmani, P.; Ban-Weiss, G. Climatic Consequences of Adopting Drought-Tolerant Vegetation over Los Angeles as a Response to California Drought. Geophys. Res. Lett. 2016, 43, 8240–8249. [Google Scholar] [CrossRef]
- Vahmani, P.; Hogue, T.S. Urban Irrigation Effects on WRF-UCM Summertime Forecast Skill over the Los Angeles Metropolitan Area. J. Geophys. Res. Atmos. 2015, 120, 9869–9881. [Google Scholar] [CrossRef]
- Barnes, M.L.; Welty, C.; Miller, A.J. Impacts of Development Pattern on Urban Groundwater Flow Regime. Water Resour. Res. 2018, 54, 5198–5212. [Google Scholar] [CrossRef]
- Singh, J.; Karmakar, S.; PaiMazumder, D.; Ghosh, S.; Niyogi, D. Urbanization Alters Rainfall Extremes over the Contiguous United States. Environ. Res. Lett. 2020, 15, 074033. [Google Scholar] [CrossRef]
Figure 1.
WRF–Hydro modeling domain in the LA Metropolitan area. The coverage of impervious surfaces is shown for the (1) Arroyo Seco, (2) Brea Creek, and (3) Ballona Creek watersheds.
Figure 1.
WRF–Hydro modeling domain in the LA Metropolitan area. The coverage of impervious surfaces is shown for the (1) Arroyo Seco, (2) Brea Creek, and (3) Ballona Creek watersheds.

Figure 2.
Land Use in model domain with USGS land classes edited to include more detailed urban sub–classes.
Figure 2.
Land Use in model domain with USGS land classes edited to include more detailed urban sub–classes.

Figure 3.
The WRF–Hydro modeling architecture coupling Noah–MP land surface processes with hydrological routing (adapted from [28]). Adapted with permission from Ref. [28]. 2019 Thomas Rummler.

Figure 4.
Simulated hydrographs at Arroyo Seco with sensitivity tests of REFKDT.

Figure 5.
Simulated hydrographs at Arroyo Seco with sensitivity tests of REFDK with REFKDT = 0.4.

Figure 6.
Total precipitation over the LA metropolitan area during the December 2010 rainfall event. The Ballona Creek (1) and the Brea Creek (2) watersheds received 232 and 266 mm of precipitation, respectively, over the 7-day event.
Figure 6.
Total precipitation over the LA metropolitan area during the December 2010 rainfall event. The Ballona Creek (1) and the Brea Creek (2) watersheds received 232 and 266 mm of precipitation, respectively, over the 7-day event.

Figure 7.
Observed and simulated hydrographs at (a) Brea Creek (hourly), and (b) Ballona Creek (daily) with and without impervious surfaces. The lower the scaling parameter Φ, the more the impact of TIAs on surface runoff is amplified.
Figure 7.
Observed and simulated hydrographs at (a) Brea Creek (hourly), and (b) Ballona Creek (daily) with and without impervious surfaces. The lower the scaling parameter Φ, the more the impact of TIAs on surface runoff is amplified.

Figure 8.
Impact of impervious surfaces on main water budget components in (a) Ballona Creek, (b) Brea Creek, and (c) for the LA metropolitan area. Infiltration combines water stored in the soil and deep drainage. The error term was less than 5% of the total budget in all simulations. Accumulated evapotranspiration was close to 0 mm in both scenarios due to high humidity conditions.

Figure 9.
Accumulated surface runoff in the LA metropolitan area over the December 2010 precipitation event for (a) the pre-urban development scenario without impervious surfaces and (b) the post-urban development scenario under present imperviousness conditions.
Figure 9.
Accumulated surface runoff in the LA metropolitan area over the December 2010 precipitation event for (a) the pre-urban development scenario without impervious surfaces and (b) the post-urban development scenario under present imperviousness conditions.

Figure 10.
Soil moisture storage (2 m soil column) in the LA metropolitan area over the December 2010 precipitation event for (a) the pre-urban development scenario without impervious surfaces and (b) the post-urban development scenario under present imperviousness conditions.
Figure 10.
Soil moisture storage (2 m soil column) in the LA metropolitan area over the December 2010 precipitation event for (a) the pre-urban development scenario without impervious surfaces and (b) the post-urban development scenario under present imperviousness conditions.

Figure 11.
Accumulated water flow out of the bottom LSM soil layer as deep drainage (or “underground runoff”) in the LA metropolitan area over the December 2010 precipitation event for (a) the pre-urban development scenario without impervious surfaces and (b) the post-urban development scenario under present imperviousness conditions.


Table 1.
Impervious fraction of urban land use classes in the LA metropolitan area.
| Land Use Class | Impervious Fraction |
|---|---|
| Urban—Open Land | 13% |
| Urban—Developed Low Intensity | 42% |
| Urban—Developed Medium Intensity | 67% |
| Urban—Developed High Intensity | 90% |
Table 2.
WRF-Hydro model configurations.
| Chosen Option | |
|---|---|
| Forcing input interval | 1 h |
| Subsurface flow routing | On |
| Overland flow routing | On |
| Channel routing | Gridded routing using diffusive wave |
| Baseflow bucket model | Off |
| LSM | NoahMP |
| LSM grid resolution | 900 m |
| Routing grid resolution | 30 m |
| Routing model time step | 3 s |
Table 3.
Manning roughness coefficients by Strahler stream order.
| Stream Order | Manning’s n |
|---|---|
| 1 | 0.075 |
| 2 | 0.05 |
| 3 | 0.035 |
| 4 | 0.025 |
| 5 | 0.01 |
| 6 | 0.01 |
Table 4.
NSE coefficients for simulated hydrographs of the December 2010 event in the Brea Creek and Ballona Creek watersheds.
Table 4.
NSE coefficients for simulated hydrographs of the December 2010 event in the Brea Creek and Ballona Creek watersheds.
| Brea Creek | Ballona Creek | |
|---|---|---|
| = 1 | 0.32 | −0.29 |
| = 0.5 | 0.51 | 0.38 |
| = 0.2 | 0.60 | 0.80 |
Publisher’s Note: MDPI stays neutral with regard to jurisdictional claims in published maps and institutional affiliations. |
© 2022 by the authors. Licensee MDPI, Basel, Switzerland. This article is an open access article distributed under the terms and conditions of the Creative Commons Attribution (CC BY) license (https://creativecommons.org/licenses/by/4.0/).
Share and Cite
MDPI and ACS Style
Pasquier, U.; Vahmani, P.; Jones, A.D. Quantifying the City-Scale Impacts of Impervious Surfaces on Groundwater Recharge Potential: An Urban Application of WRF–Hydro. Water 2022, 14, 3143. https://doi.org/10.3390/w14193143
AMA Style
Pasquier U, Vahmani P, Jones AD. Quantifying the City-Scale Impacts of Impervious Surfaces on Groundwater Recharge Potential: An Urban Application of WRF–Hydro. Water. 2022; 14(19):3143. https://doi.org/10.3390/w14193143
Chicago/Turabian StylePasquier, Ulysse, Pouya Vahmani, and Andrew D. Jones. 2022. "Quantifying the City-Scale Impacts of Impervious Surfaces on Groundwater Recharge Potential: An Urban Application of WRF–Hydro" Water 14, no. 19: 3143. https://doi.org/10.3390/w14193143
Note that from the first issue of 2016, this journal uses article numbers instead of page numbers. See further details here.