Article

Permeability and Porosity Changes in Sandstone Reservoir by Geothermal Fluid Reinjection: Insights from a Laboratory Study

1
The Institute of Hydrogeology and Environmental Geology, Chinese Academy of Geological Sciences, Shijiazhuang 050061, China
2
Technology Innovation Center for Geothermal & Hot Dry Rock Exploration and Development, Ministry of Natural Resources, Shijiazhuang 050061, China
3
Hebei Province Key Laboratory of Sustained Utilization and Development of Water Resources, School of Water Resources and Environment, Hebei GEO University, Shijiazhuang 050031, China
4
Shandong Provincial Lubei Geo-Engineering Exploration Institute, Dezhou 253000, China
*
Author to whom correspondence should be addressed.
Water 2022, 14(19), 3131; https://doi.org/10.3390/w14193131
Submission received: 9 September 2022 / Revised: 27 September 2022 / Accepted: 29 September 2022 / Published: 4 October 2022
(This article belongs to the Section Soil and Water)

Abstract

:
Geothermal energy is a clean and environmentally friendly energy source that can be used sustainably; however, attention towards geothermal energy has been intermittent during the last 40 years as a function of the crisis of oil price. However, geothermal reinjection and clogging has been a challenge limiting geothermal development and utilization. In China, widely distributed sandstone geothermal reservoirs have reduced production due to technical constraints such as excessive reinjection pressure and blockage. In this paper, we took the Binzhou sandstone geothermal field in North China as an example and conducted displacement experiments under different temperature and flow rate conditions by collecting in situ geothermal fluid and core rock to obtain changes in sandstone permeability. By comparing the variation in geochemical and mineral composition of geothermal fluids and cores before and after the experiments, combined with a water–rock interaction simulation, we investigated the reasons for the changes in permeability and porosity. The results show that high temperature and low flow rate have relatively minimal displacement pressure, and a flow rate of 1.0 mL/min at 45 °C shows a minimal effect on permeability, while 1.0 mL/min at 55 °C and 0.5 mL/min at 45 °C show a minimal effect on porosity. Flow rate is the main factor controlling permeability, while temperature demonstrated a relatively minor effect. The shift in permeability and porosity is mainly caused by the precipitation of quartz and the conversion of albite to montmorillonite. The injection of fluids at 55 °C may have dissolved additional minerals with a minimal change in porosity. However, the permeability reduction at 55 °C is greater than that at 45 °C, indicating that the blockage, which led to the permeability reduction, contains multiple causes, such as chemical and physical blockages. From the laboratory studies, we recommended that reinjected geothermal water be cooled or kept below the reservoir temperature before reinjection and at moderate flow conditions.

1. Introduction

Geothermal energy is an abundant, stable, and reliable renewable energy [1,2,3,4]. As of 2021, 88 countries reported their direct applications of geothermal energy, with 107,727 MW and 1,020,887 TJ/yr of installed capacity and thermal energy currently available globally [5]. The utilization of a sandstone geothermal reservoir is widely exploited in major basins, such as the North China Basin, Songliao Basin, Guanzhong Basin, Sichuan Basin, and Xining Basin [6,7,8,9,10,11]. However, numerous problems have emerged with the increase in mining activities, such as the continuous decline of the geothermal water level and temperature, and the environmental issues caused by the uncontrolled discharge of geothermal water into surface water [12,13,14,15]. The reinjection of geothermal water is useful to improve or restore the heat production capacity of the reservoir and maintain the geothermal fluid pressure of the geothermal fields [16,17,18]. However, for the sandstone reservoirs, the reinjection capacity is significantly reduced due to formation blockage, which severely restricts the efficient and economic utilization of geothermal energy [19,20]. The decline in the reinjection capacity of sandstone geothermal reservoirs is widespread, mainly resulting in particularly low injection rates [21,22,23].
The complex causes of reinjection blockage mainly include physical, biological, chemical, and gas blockages after the change in the geothermal fluid occurrence environment [2,17,18,24,25]. For a physical blockage, suspended matter blockage is the most common physical blockage mechanism, which can reach 50% of the whole blockage [26]. Suspended particle size, concentration, pore structure, and permeation rate have significant effects on the deposition and migration characteristics of particles in porous media [27,28]. The pore blockage caused by the precipitation of solid particles was the main factor for the weakening of reinjection capacity [25]. Gas adheres to the hydrophobic base of the particles, reducing the permeability of the porous media and causing air blockage, which accounts for 10% of all blockages [29]. Hydrogeochemical reactions in the reinjection process may cause sediment accumulation and chemical blockage, accounting for 10% of all blockages [26]. For instance, the influence of chemical blocking was the main blocking factor in the Xianyang geothermal field and accounted for 38.2% of the total blockage [6]. The effect of Fe2+ concentration on the clogging rate is critical, as Fe2+ is the main metal ion that produces chemical precipitation [14,30]. Temperature also demonstrates a significant effect on chemical blockage, as increased temperature decreases the solubility of carbonate precipitation [17].
Injection of CO2 and CO2 storage has been a hot topic recently. Researchers have carried out CO2–water sandstone displacement experiments under different conditions, which resulted in different conclusions concerning the effects of CO2 injection on the permeability and porosity of sandstone rock [2,31,32]. In addition, displacement experiments of supercritical CO2 found the precipitation of secondary montmorillonite but no precipitation of carbonates [33]. Machine learning was applied to predict the sequestration performance of CO2 injection into saline aquifers (brine systems) within the last five years, such as predicting the interfacial tension (IFT) based on various robust AI models [34] and investigating the link between carbon trapping efficiency and influencing factors [35], as well as exploring the potential of oil formations storage capacity for CO2 injection [36].
For the sandstone geothermal reservoir, studies on the Triassic sandstone in the UK suggested that pore-scale permeability becomes progressively dominant with an increasing lithostatic load, and permeability development is controlled by dissolution of calcite–dolomite in correspondence with fractures [37,38]. Because the mineral maturity of original sediments defines genetic variability in a variety of ways, the porosity and permeability reduce with burial depth [39]. In addition, flow rate has a direct relationship to permeability and porosity [40]. Mineral dissolution precipitation analysis suggests that the first phase is the precipitation of the thermodynamically least stable polymorph in a disordered (amorphous) form [41]. These chemical changes alter the petrophysical properties of the rock (such as porosity and permeability), thereby changing the flow path and the mechanical integrity of the system [42,43]. At present, researchers have made efforts to understand pore blockage from reinjected water, but there is a lack of systematic research on permeability changes concerning in situ geothermal fluids and rocks in the geothermal reservoir under different conditions.
In this study, we obtained in situ geothermal water and sandstone cores from boreholes in the Binzhou Geothermal Field in China. Different temperature and flow conditions were set to obtain the permeability variation through geothermal fluid displacement of core rocks. In addition, water–rock element migration analysis and water–rock interaction simulations were used to investigate the causes of permeability and porosity variations. On this basis, we present suggestions to optimize the temperature and flow rate for reinjection of geothermal fluids into sandstone geothermal reservoir.

2. Methods

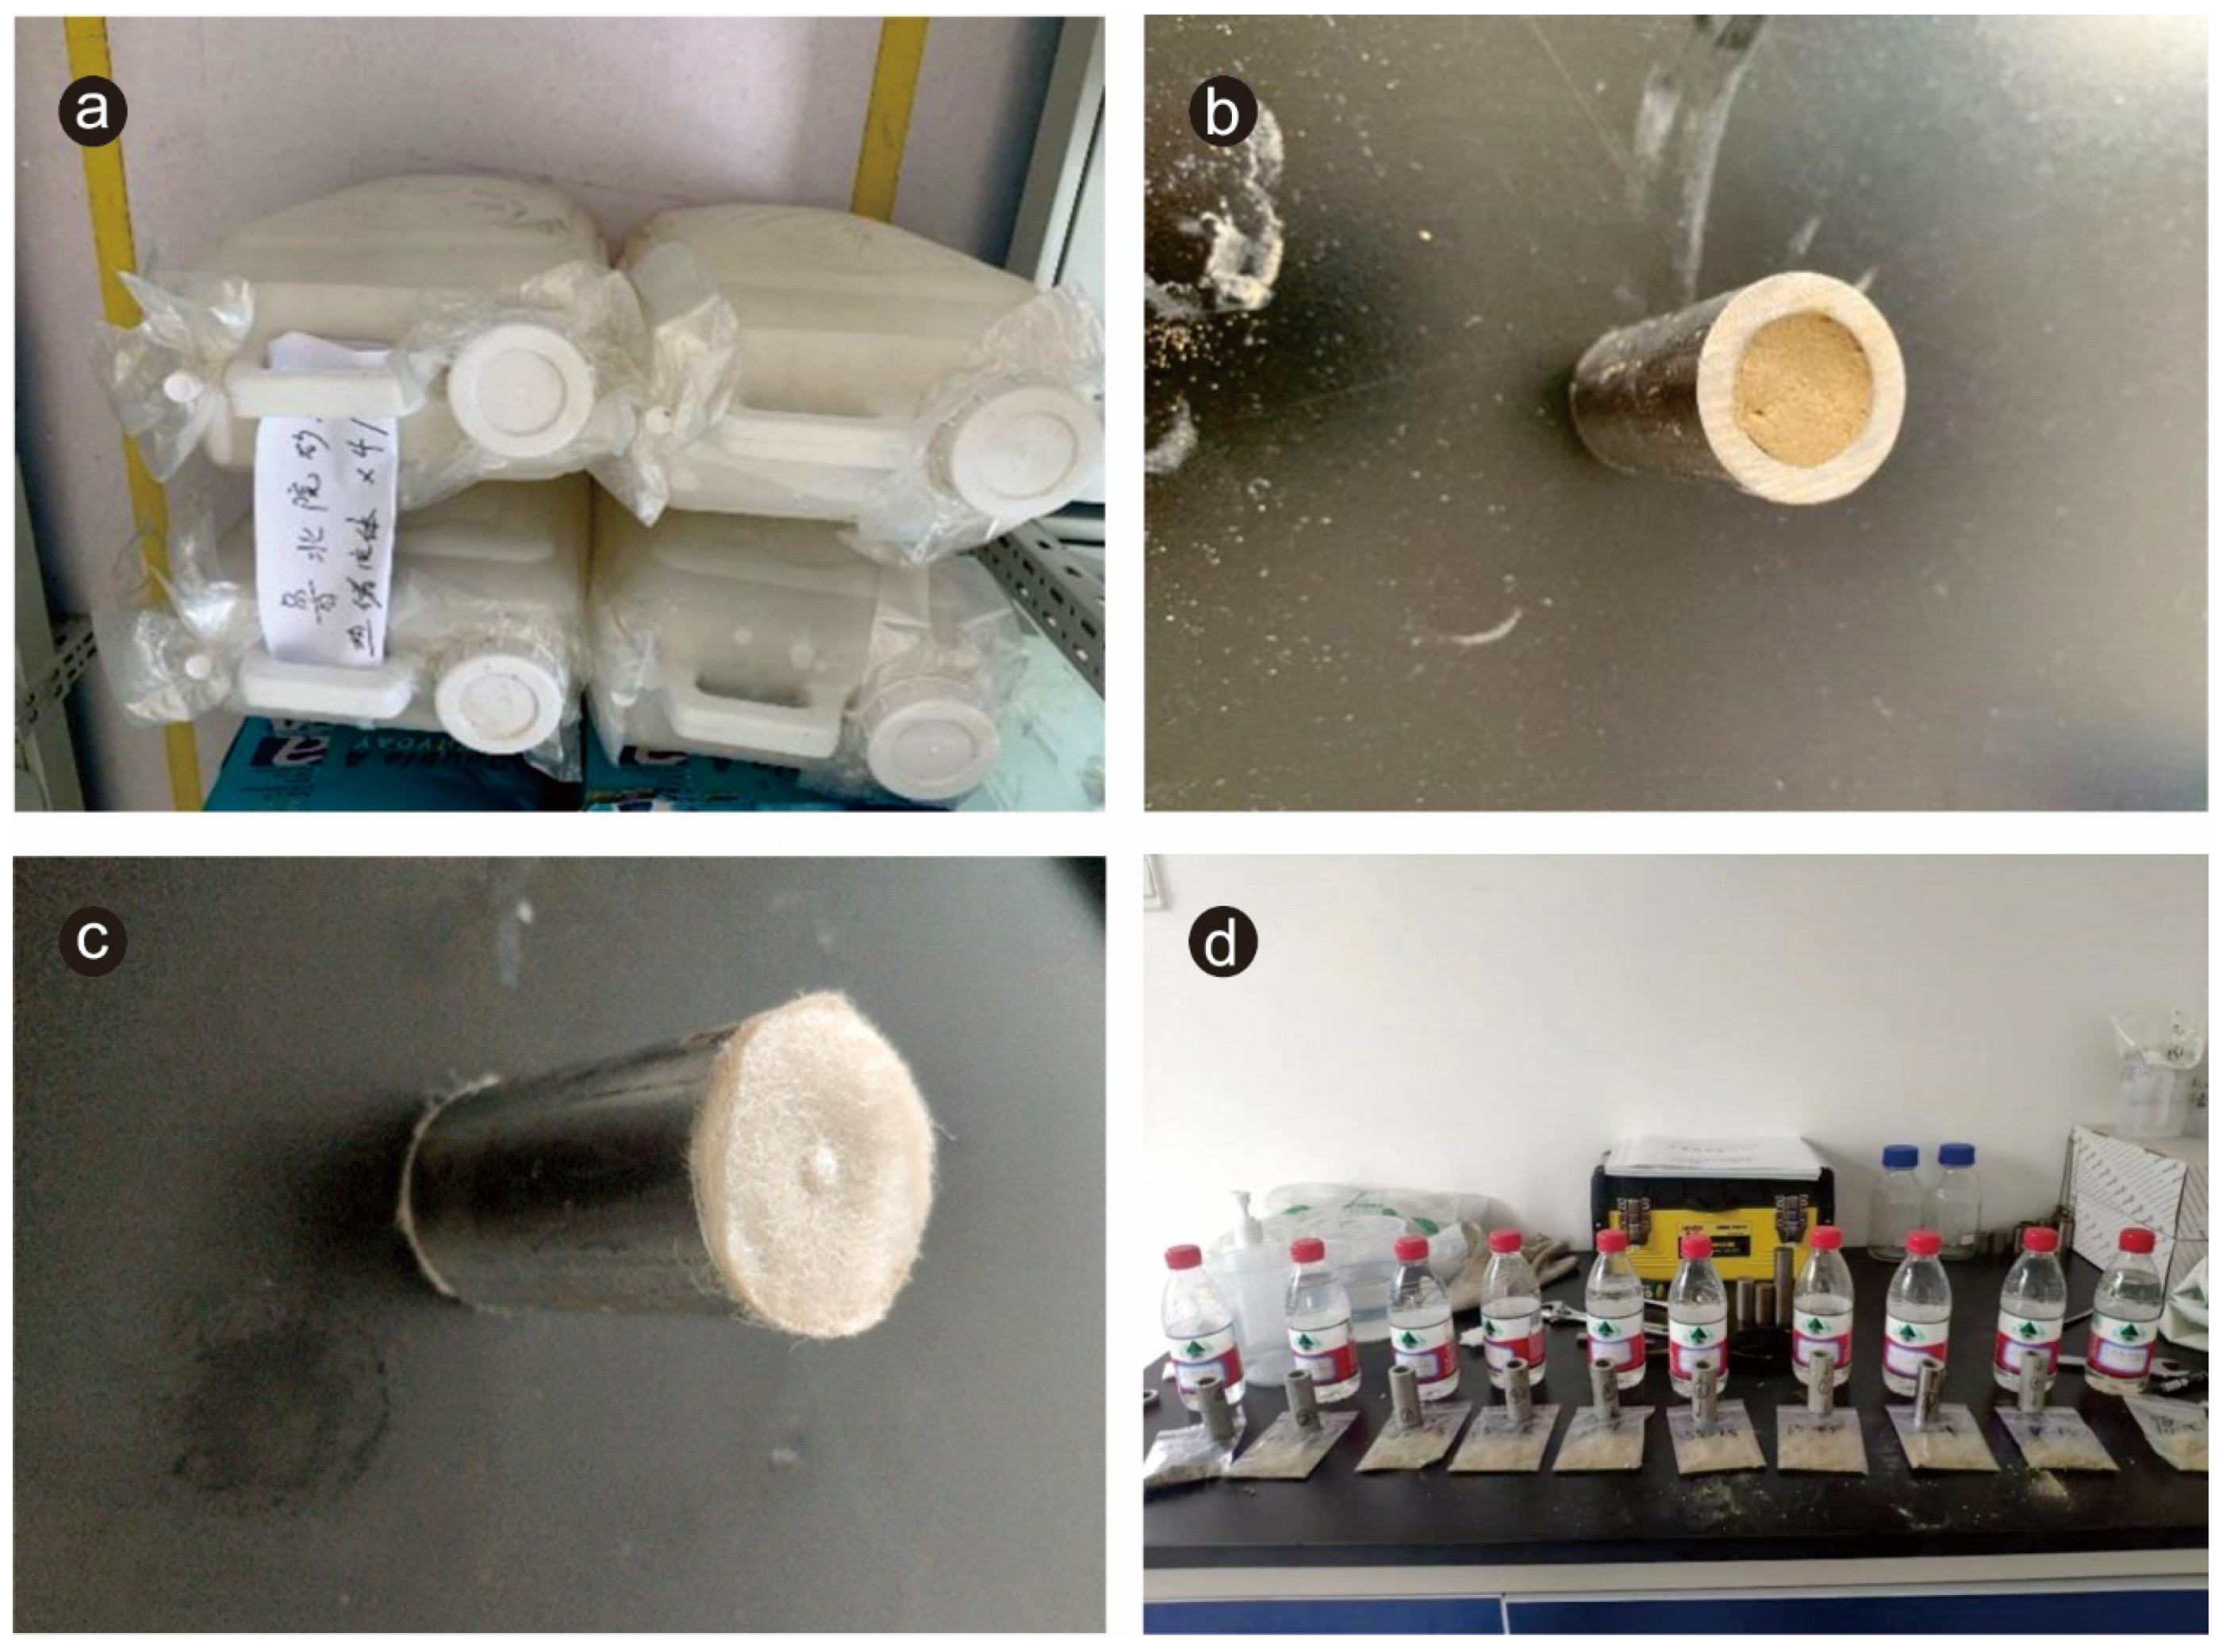
2.1. Sample Preparation

The Neoproterozoic Guantao Formation is the main exploited geothermal reservoir in the Binzhou Geothermal Field. The logging data of local geothermal boreholes show that the temperatures of the geothermal water in the Guantao Formation geothermal reservoir are usually less than 90 °C, the main water chemistry type is Na-Cl, and the total dissolved solids (TDS) are 8–11 g/L [44]. The water sample used in this study was collected from the geothermal borehole ZR1 in Binzhou (Figure 1a) with a TDS of 11 g/L. The outlet water temperature was 52 °C. The geothermal water was heated in an incubator to 55 °C (reservoir temperature, which was revealed by logging data from the borehole [44]), then mixed evenly and distributed into 9 groups.
The representative core samples, weakly consolidated loose rock with bedding, were taken from the sandstone reservoir in the same geothermal borehole at Binzhou at a depth of 1153 m. The core was initially crushed with a grinder and then sifted with a 50-mesh sieve. After mixing homogeneously, the core was divided into 9 parts and filled into a 6-cm-long stainless-steel tube (Figure 1b). To prevent fine grains of sand from entering the conduit pipe and blocking the equipment, the ends of the stainless-steel pipe were blocked with filtering cotton (Figure 1c), so that the fluid could pass while the grains of sand could not.

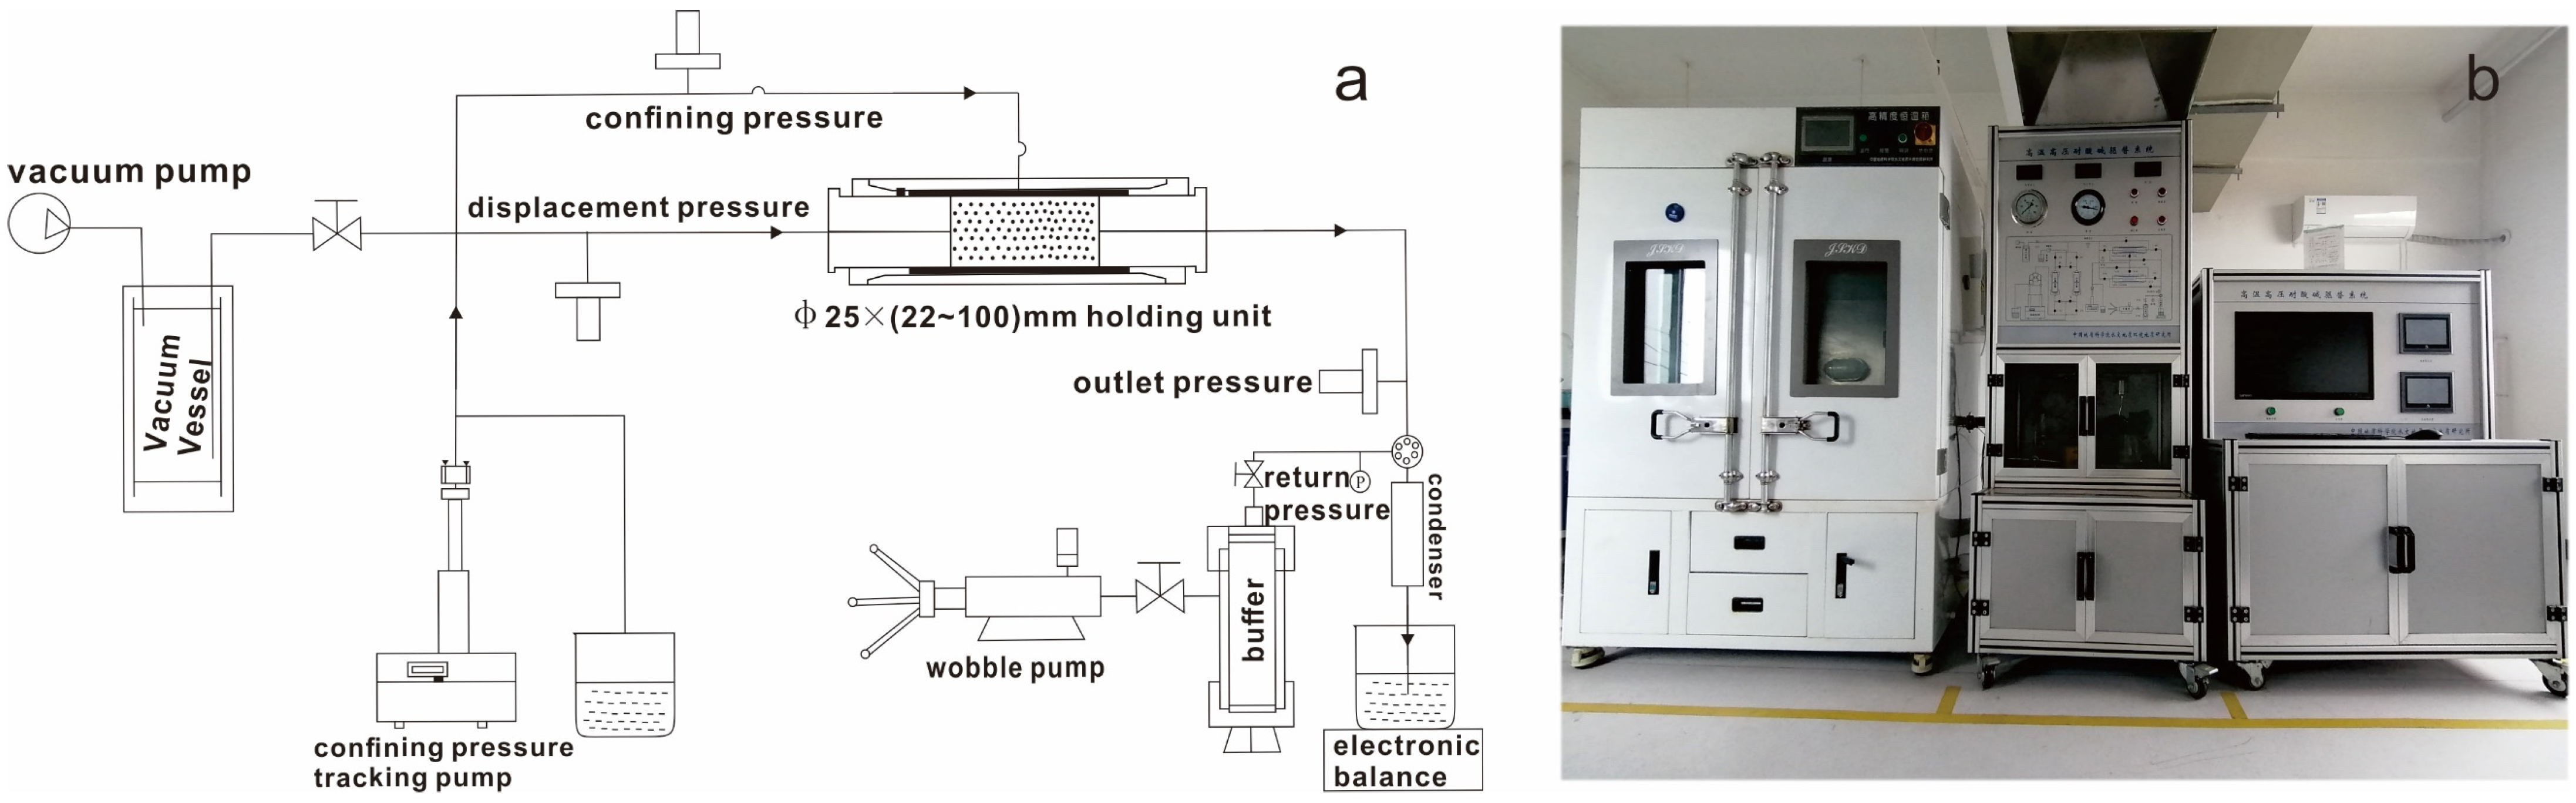
2.2. Experimental Design

Experiments were set up to analyze the change in core sample permeability under different flow and temperature conditions, and nine groups were tested. The confining pressure was set at 1–2 MPa above the displacement pressure. The detailed design is shown in Table 1.
We installed the core-filled stainless-steel pipe into the core holder and tightened the screw knobs at both ends (inlet and outlet) to prevent leakage. The pure water was prepared for loading in the confining pressure. The geothermal fluid was prepared to flow through the core in the holder. A beaker and a balance were placed at the end of the water outlet to measure the water quantity (Figure 2). We opened the displacement experiment software and set the core-rock size, fluid viscosity, and density (Table 2). After starting, we observed the pressure, flow rate, and permeability changes on the screen, and then stopped injecting when the permeability stabilized (approximately 8 h). After the experiments, the core and geothermal fluid samples were tested for principal elements and mineral compositions (Figure 1d), which were used to analyze the water–rock interaction and element migration during the displacement process. The geochemical and mineralogical results from the initial geothermal fluids and cores refer to a separate paper [45].

2.3. Major Elements and Mineral Analysis of Water and Ground Sandstone Specimens

The mineralogical composition and major element contents of the ground sandstone specimens was determined by X-ray diffraction (XRD) and X-ray fluorescence spectroscopy (XRF). XRD was carried out with a D/max-rA at the Beidazhihui Microstructure Analysis and Testing Center in Beijing. The concentrations of the major cations in water were found with an ICP-OES (iCAP 7200 Dui, ThermoFisher Scientific, Waltham, MA, USA). The anions were determined using ion chromatography (ICS3000, ThermoFisher Scientific). XRF was performed with an XRF-1500 to determine the whole-rock major element contents of the ground sandstone specimens. The accuracy of the analytical method was better than 5% for the elemental contents greater than 1 ppm. The analytical uncertainty was 10% for elements with an abundance ≤10 ppm and approximately 5% for elements with an abundance ≥10 ppm.

2.4. Calculation of Mineral Volume and Porosity Changes

The specific mineral volume changes before and after the displacement experiments were calculated using the following equation:
Δ V i = Δ A i D i
where Δ V i and Δ A i are the individual mineral volume change and mass change, respectively; D i is the density of the individual mineral.
The total mineral volume change is calculated as follows:
Δ V t o t a l = Δ A i D i = A t o t a l × Δ X i D i
where Δ V t o t a l is the total mineral volume change; A t o t a l is the total mass amount; Δ X i is the percentage change in mass of individual mineral.
In the calculations, the total mass amount was set to 100 g. The percentage change in the mineral mass can be obtained from the XRD measurements. The density data of the minerals are referenced in the National Infrastructure of Mineral, Rock and Fossil for Science and Technology (http://www.nimrf.net.cn, accessed on 14 September 2022).
The rock porosity changes before and after the displacement experiments are calculated using the following equation:
Δ = Δ A i D i × 1 r / A t o t a l D r
where Δ is the rock porosity change; r is the rock porosity before the experiments, 29.58%; D r is the rock density before the experiments, 1.88 g/cm3.

2.5. Inversion Simulation of Water-Rock Interaction

The geochemical compositions of water samples changed after the displacement experiments [33]. Understanding how minerals are dissolved and precipitated is essential for studying the blockage mechanism during reinjection. Therefore, simulating the water chemistry processes that are inversely occurring is important in the experiments. In this study, USGS PHREEQC [46] was used to perform the calculations. PHREEQC is capable of describing and inverting multiple geochemical processes in a one-dimensional groundwater system, to derive the dissolution and precipitation of minerals and to provide dissolution and precipitation amounts [46,47].
Since the water–rock interaction is susceptible to change due to multiple factors, this results in multiple solutions for the simulation. This makes it a difficult task for the researcher to find the most appropriate solution from the many simulation results, which must, first, be in accordance with the thermodynamic principle [47], and second, in accordance with chemical principles. For example, the hydrolysis reaction of feldspar or mica is an unequal total dissolution reaction, which is irreversible [48]. Third, the hydrogeological conditions should be matched, such as evaporation and dilution conditions, cation exchange conditions, and redox conditions. Moreover, the order of magnitude of the simulation results should be appropriate.

3. Results

3.1. Pressures Variation

The confining pressure, displacement pressure (inlet pressure), and outlet pressure were recorded during the experiments. The confining pressure was greater than the displacement pressure, which was greater than the outlet pressure. The range of displacement pressure after stabilization was 5.6–8.05 MPa, the variation of displacement pressure between pre-reaction and stabilization was −0.01–1.13 MPa, and the pressure difference between displacement pressure and outlet pressure after stabilization was −0.03–0.32 MPa. The flow rate is not a unique factor affecting the displacement pressure, but the temperature also exhibits a considerable influence on the displacement pressure. Under the same flow rate, the stable displacement pressure showed a rough pattern of 45 °C > 55 °C > 65 °C (Figure S1).

3.2. Mineral and Element Changes during the Displacement Process

3.2.1. Major Elements Composition in Water and Ground Sandstone Specimens

The main element contents of the geothermal water (Table 3) and ground sandstone specimens (Table 4) and mineral composition of ground sandstone specimens (Table 5) of the displacement experiments were found. The Yuan-1 (water) and the yuan (rock) donated initial water and ground sandstone specimens before the experiments, respectively. The pH of the water samples before and after the experiment were all greater than 7, and the main element contents were Na, Cl, and SO4 (Table 3). Yuan-1 (water) exhibited the maximum Na, HCO3, and SO4 content, and Yuan-1 (rock) exhibited the maximum Al, Ca, and minimum Mg, Ti, Fe, and Cl content (Table 4).

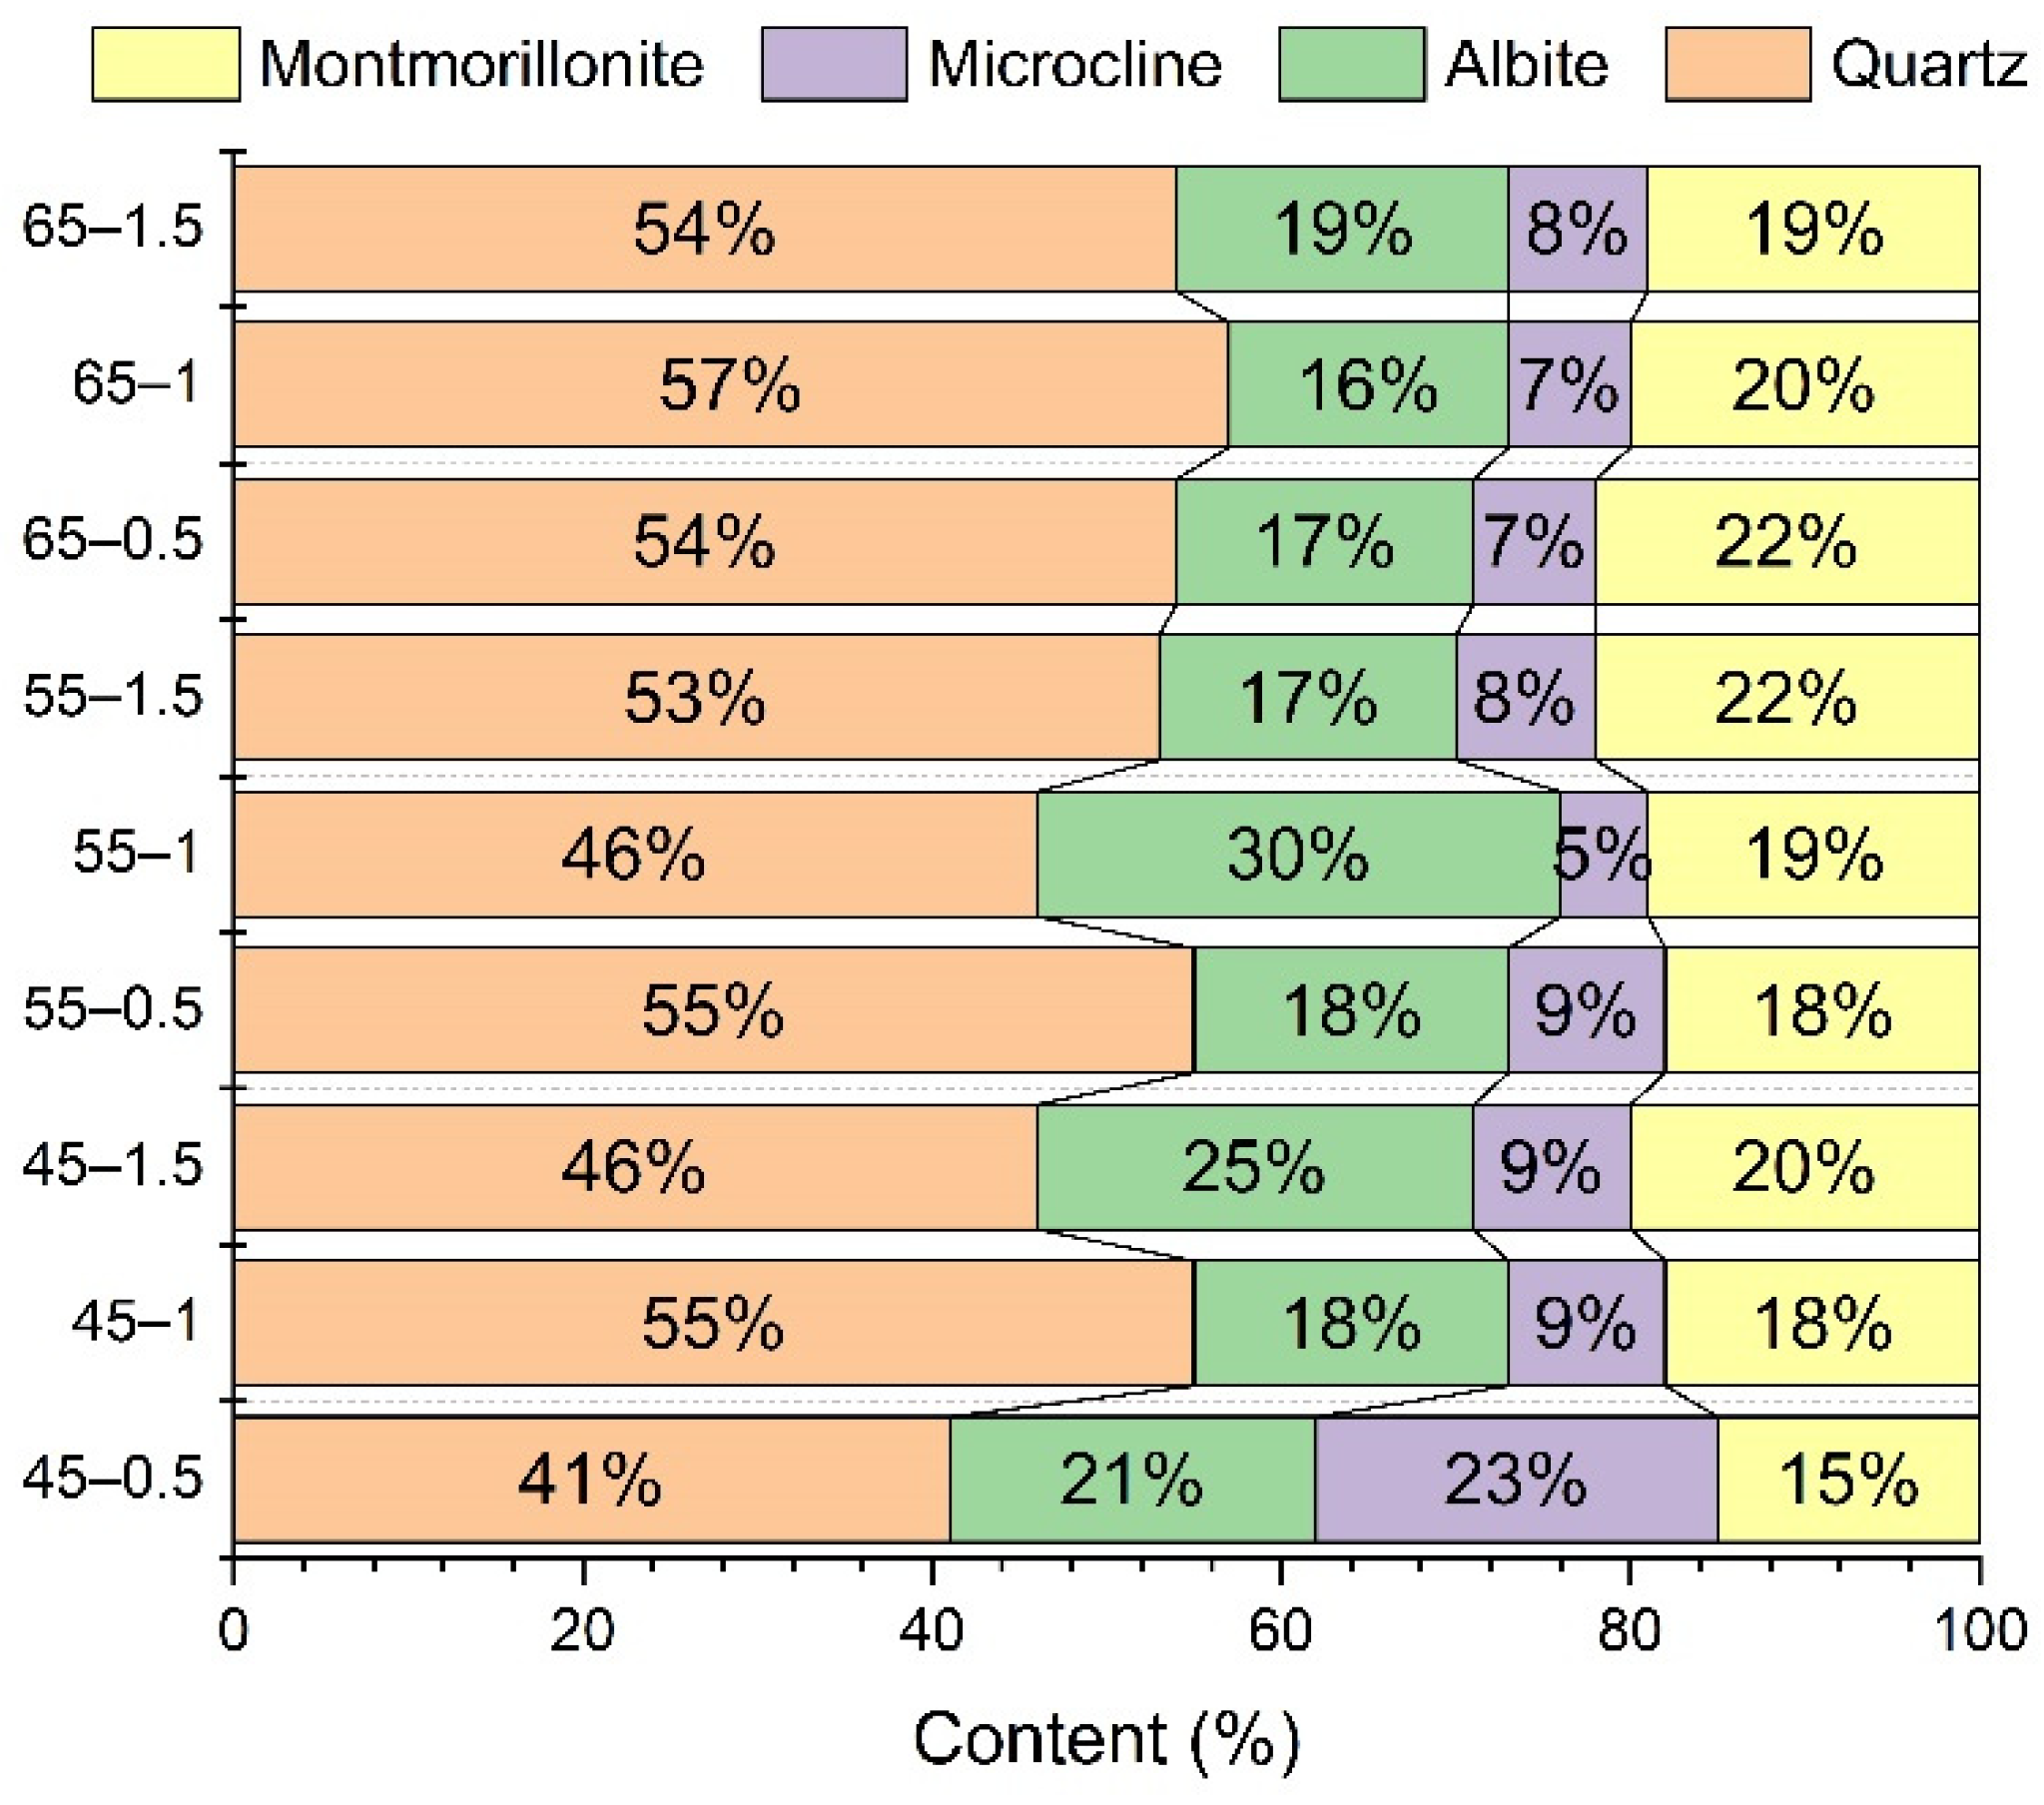
3.2.2. Mineral Composition Changes of Ground Sandstone Specimens

Concerning the mineral composition, the original rock before the experiment contained the maximum quartz content but without montmorillonite, while the ground sandstone specimens after the experiment did not contain calcite and muscovite, but montmorillonite was produced at different temperatures and flow conditions (Table 5). The montmorillonite content formed at different temperatures and flow rates ranged from 15–22%, showing an approximate trend of increasing montmorillonite content with increasing temperature (Figure 3; Table 5). Under the same temperature conditions, both at 45 °C and 55 °C, showed an increase in montmorillonite content with increasing flow rate, while 65 °C showed a decrease in montmorillonite content with increasing flow rate.
The formation of montmorillonite is probably due to the alteration of albite during the experiment, and the chemical reaction formula is presumed to be as follows:
Albite + H2O + Ca + H + Mg → (K, Na) + SiO2 + Montmorillonite
Since the conversion of albite to montmorillonite requires the removal of SiO2 and the quartz content is reduced compared to the rock before the displacement, we presume that SiO2 is dissolved from the rock into the water.

3.3. Permeability and Porosity Changes during the Displacement Process

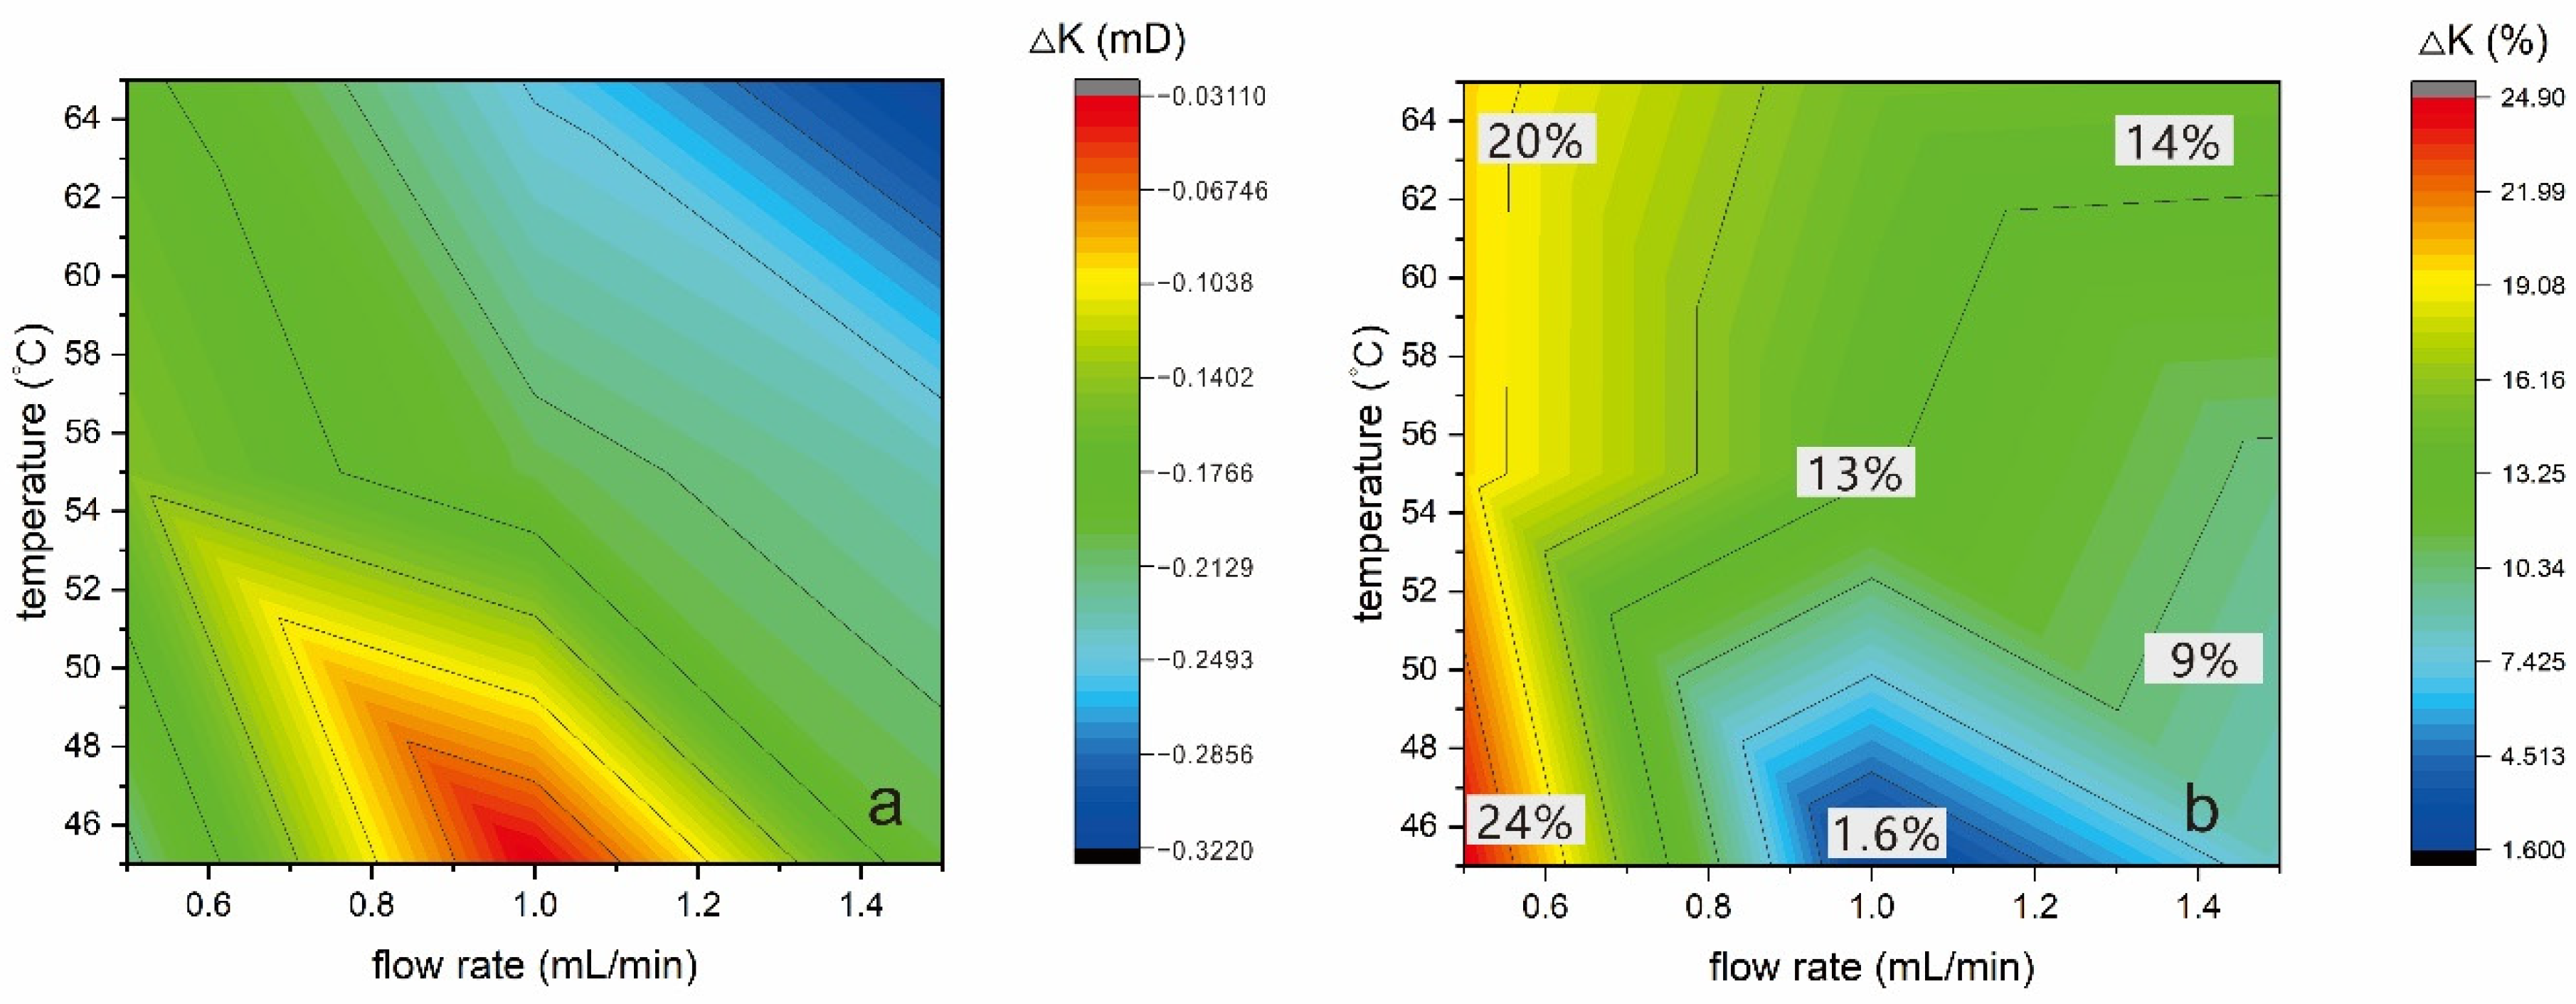
3.3.1. Permeability Changes

Under different flow rate and temperature conditions, compared with the original rock permeability, there are different degrees of permeability reduction (Figure S1). The sandstone samples exhibit the characteristics of being influenced by the flow rate, with both the initial permeability and the post-experimental permeability increasing with the flow rate, and the increase in permeability being essentially consistent with the increase in flow rate. A flow rate of 1.5 mL/min is 2.7–3.5 times more permeable than a flow rate of 0.5 mL/min at the same temperature, while the change in permeability at the same flow rate is relatively small.
From the displacement pressure change (∆P) between the initial pressure of the experiments and the stable pressure at the end of the experiments (Figure S2), the trend of increasing displacement pressures are shown during the experiments under different conditions. The displacement process showed a minimal effect on low flow rate conditions at 55 °C and a maximal effect on high flow rate conditions at 45 °C. The general effect under low flow rate conditions was less than under high flow conditions, indicating that the increase in flow rate significantly increased the ∆P, and the ∆P under temperature conditions similar to the reservoir temperature was relatively small. The high temperature and low flow rate conditions exhibited a minimal displacement pressure and also a relatively minor ∆P, which seems to indicate less damage to the reservoir. However, the low temperature and high flow rate conditions displayed higher displacement pressure and ∆P increase (Figure S2).
From the 9 sets of controlled experiments, the flow rate was the main factor controlling the permeability, while the effect of temperature was relatively slight, and high flow rate exhibited a relatively large permeability. The experiments showed that the permeability variation exhibited the minimum variation value at 45 °C and 1.0 mL/min (Figure 4a) and the maximum permeability variation value at higher temperature and higher flow rate, indicating that passing the sandstone samples at 1.0 mL/min at 45 °C showed a minimal effect on the permeability. The percentage changes relative to the initial permeability varied from 1.6 to 24% under different conditions (Figure 4b). Especially at 45 °C, the effect on permeability decreased rapidly with the increase in flow rate and reached a minimum around 1.0 mL/min.

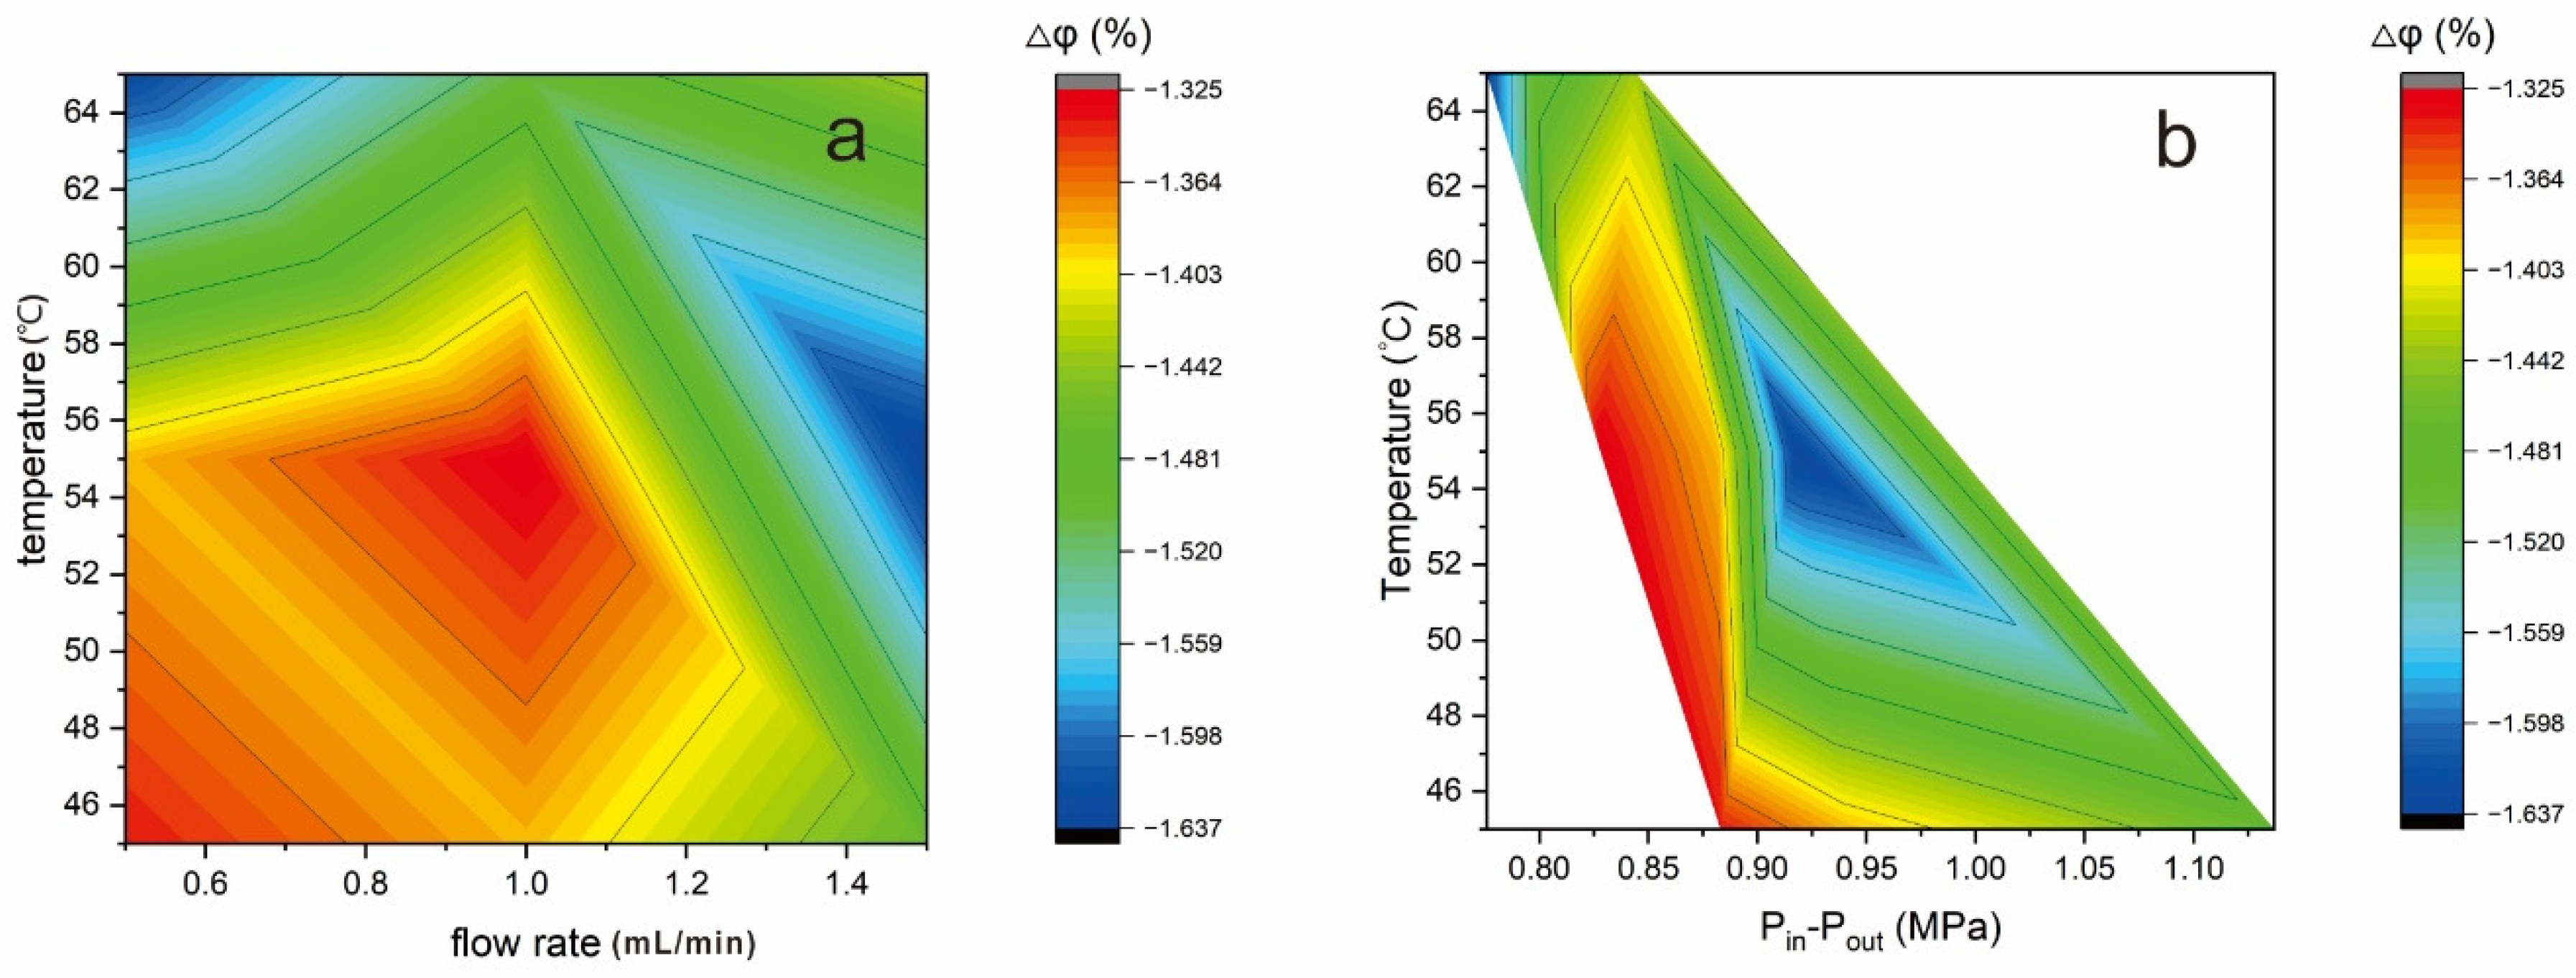
3.3.2. Porosity Changes

The results show that the volume change of the individual mineral after the experiment at different temperature and flow rate conditions varied. The total volume change of minerals was basically concentrated in the range of 1.001~1.236 cm3/100 g (Table 6). The porosity decreased under different temperature and flow rate conditions, mainly concentrated in the range of −1.34 to −1.63%.
The volume variation of the minerals composing the rock is closely related to the porosity, meanwhile the characteristics of the volume variation of single minerals can also be identified [49]. The total volume change of minerals varied significantly for different temperature and flow conditions, but all were greater than 1% (Table 6). Low temperature with low flow rate conditions caused a relatively minor change in the total volume of minerals, while high temperature or high flow rates led to an increase in the total volume of minerals. In general, there is an increasing trend in the total volume variation of minerals with increasing temperature. The maximum total volume change of 1.236% was achieved at 55 °C and 1.5 mL/min flow rate, while the minimum total volume change of 1.001% was achieved at 1.0 mL/min flow rate.
Although the total volume change was minimal at 55 °C and 1.0 mL/min flow rate conditions, the volume changes of individual minerals varied significantly. For example, the volume increase in montmorillonite and albite reached 8.085% and 7.076%, the corresponding volume change of quartz was −7.547%, and muscovite and calcite also showed different degrees of volume reduction (Figure S3). Considering the characteristics of the permeability change, we demonstrate that the minimal total volume change does not represent the maximal permeability, which is probably caused by the newly generated minerals blocking the pore space and reducing the permeability. In general, quartz and albite decreased in volume (except for the increase in volume of albite at 55 °C and 1.0 mL/min), and the volume changes were negatively correlated under different temperature and flow rate conditions, which may indicate a negative correlation between quartz and albite in the process of water–rock displacement. In addition, microcline and montmorillonite generally show volume increases.
The porosity showed the smallest reduction, under 55 °C—1.0 mL/min and 45 °C—0.5 mL/min conditions (Figure 5a), while the porosity decreased more under high temperature conditions. Therefore, medium to low temperature and flow rate conditions are likely to have a better reinjection effect.
By calculating the difference between the stabilized displacement pressure and the outlet pressure, the differential pressure (Pin-Pout) between the inlet and outlet of the displacement experiment can be obtained. Considering the porosity variation under temperature and differential pressure conditions (Figure 5b), the effect of differential pressure on porosity variation is higher than that of temperature. The special phenomenon is that at 55 °C, there is a significant contrast in porosity change near the differential pressure of 0.9 MPa, which shows the minimum porosity change below 0.9 MPa and the maximum porosity change above 0.9 MPa. The porosity variation tends to decrease with increasing differential pressure.

3.4. Water–Rock Interaction Simulation

The selection of mineral phases is an essential aspect of the inversion simulation, and the difference in chemical composition between the water samples after the experiment and the initial water shows that Na, Cl, and SO4 are the three most variable ions (Table 3). In this simulation, halite was used to reflect the precipitation dissolution of Na and Cl. Gypsum was used as a typical sulfate mineral to reflect changes in SO4. Montmorillonite was the product of the hydrolysis reaction of feldspar under alkaline conditions [50,51], and all the water samples in this experiment were weakly alkaline, thus, montmorillonite could be used to reflect the changes of Ca and Si. Quartz, albite, and calcite were critical components of the ground sandstone specimens in this experiment (Table 5; Figure 3). Therefore, albite and quartz were used to reflect the variation of silicate minerals, and calcite was used to reflect the variation of carbonate minerals. The reaction equation for each mineral is as follows:
  • Halite: NaCl = Cl + Na+
  • Gypsum: CaSO4·2H2O = Ca2+ + SO 4 2 + 2H2O
  • Calcite: CaCO3 = CO 3 2 + Ca2+
  • Albite: NaAlSi3O8 + 8H2O = Na+ + Al ( OH ) 4 + 3H4SiO4
  • Quartz: SiO2 + 2H2O = H4SiO4
  • Ca-montmorillonite: Ca0.165Al2.33Si3.67O10(OH)2 + 12H2O = 0.165Ca2+ + 2.33 Al ( OH ) 4 + 3.67H4SiO4 + 2H+
For our replacement experiment, a total of nine sets of inversion simulations were required to represent the variability of the minerals at different temperatures and flow rates. Taking the 65 °C—0.5 mL/min group as an example, the results of the inverse simulation showed a total of 20 dissolved precipitation schemes (see Table S2). Among them, Scheme 15 coincided with the measured XRD results (Table 5), thus, we chose Scheme 15 as the most appropriate inversion result for the 65 °C—0.5 mL/min group. The simulation and selection procedures are the same for the remaining groups, and the results of the inversion simulations for each group are shown in Table S3.
Note that the simulation results show that calcite was also the dominant precipitating mineral (Table S3, Figure 6), but possibly because the precipitated calcite did not enter the mineral, making it less abundant in the mineral than could be detected by XRD. In addition, the minimal amount of chemical precipitation was observed at 55 °C, which is consistent with the previous results of the highest element content at 55 °C (Table 3, Figure 6).

4. Discussion

4.1. Analysis of the Causes of Permeability and Porosity Changes

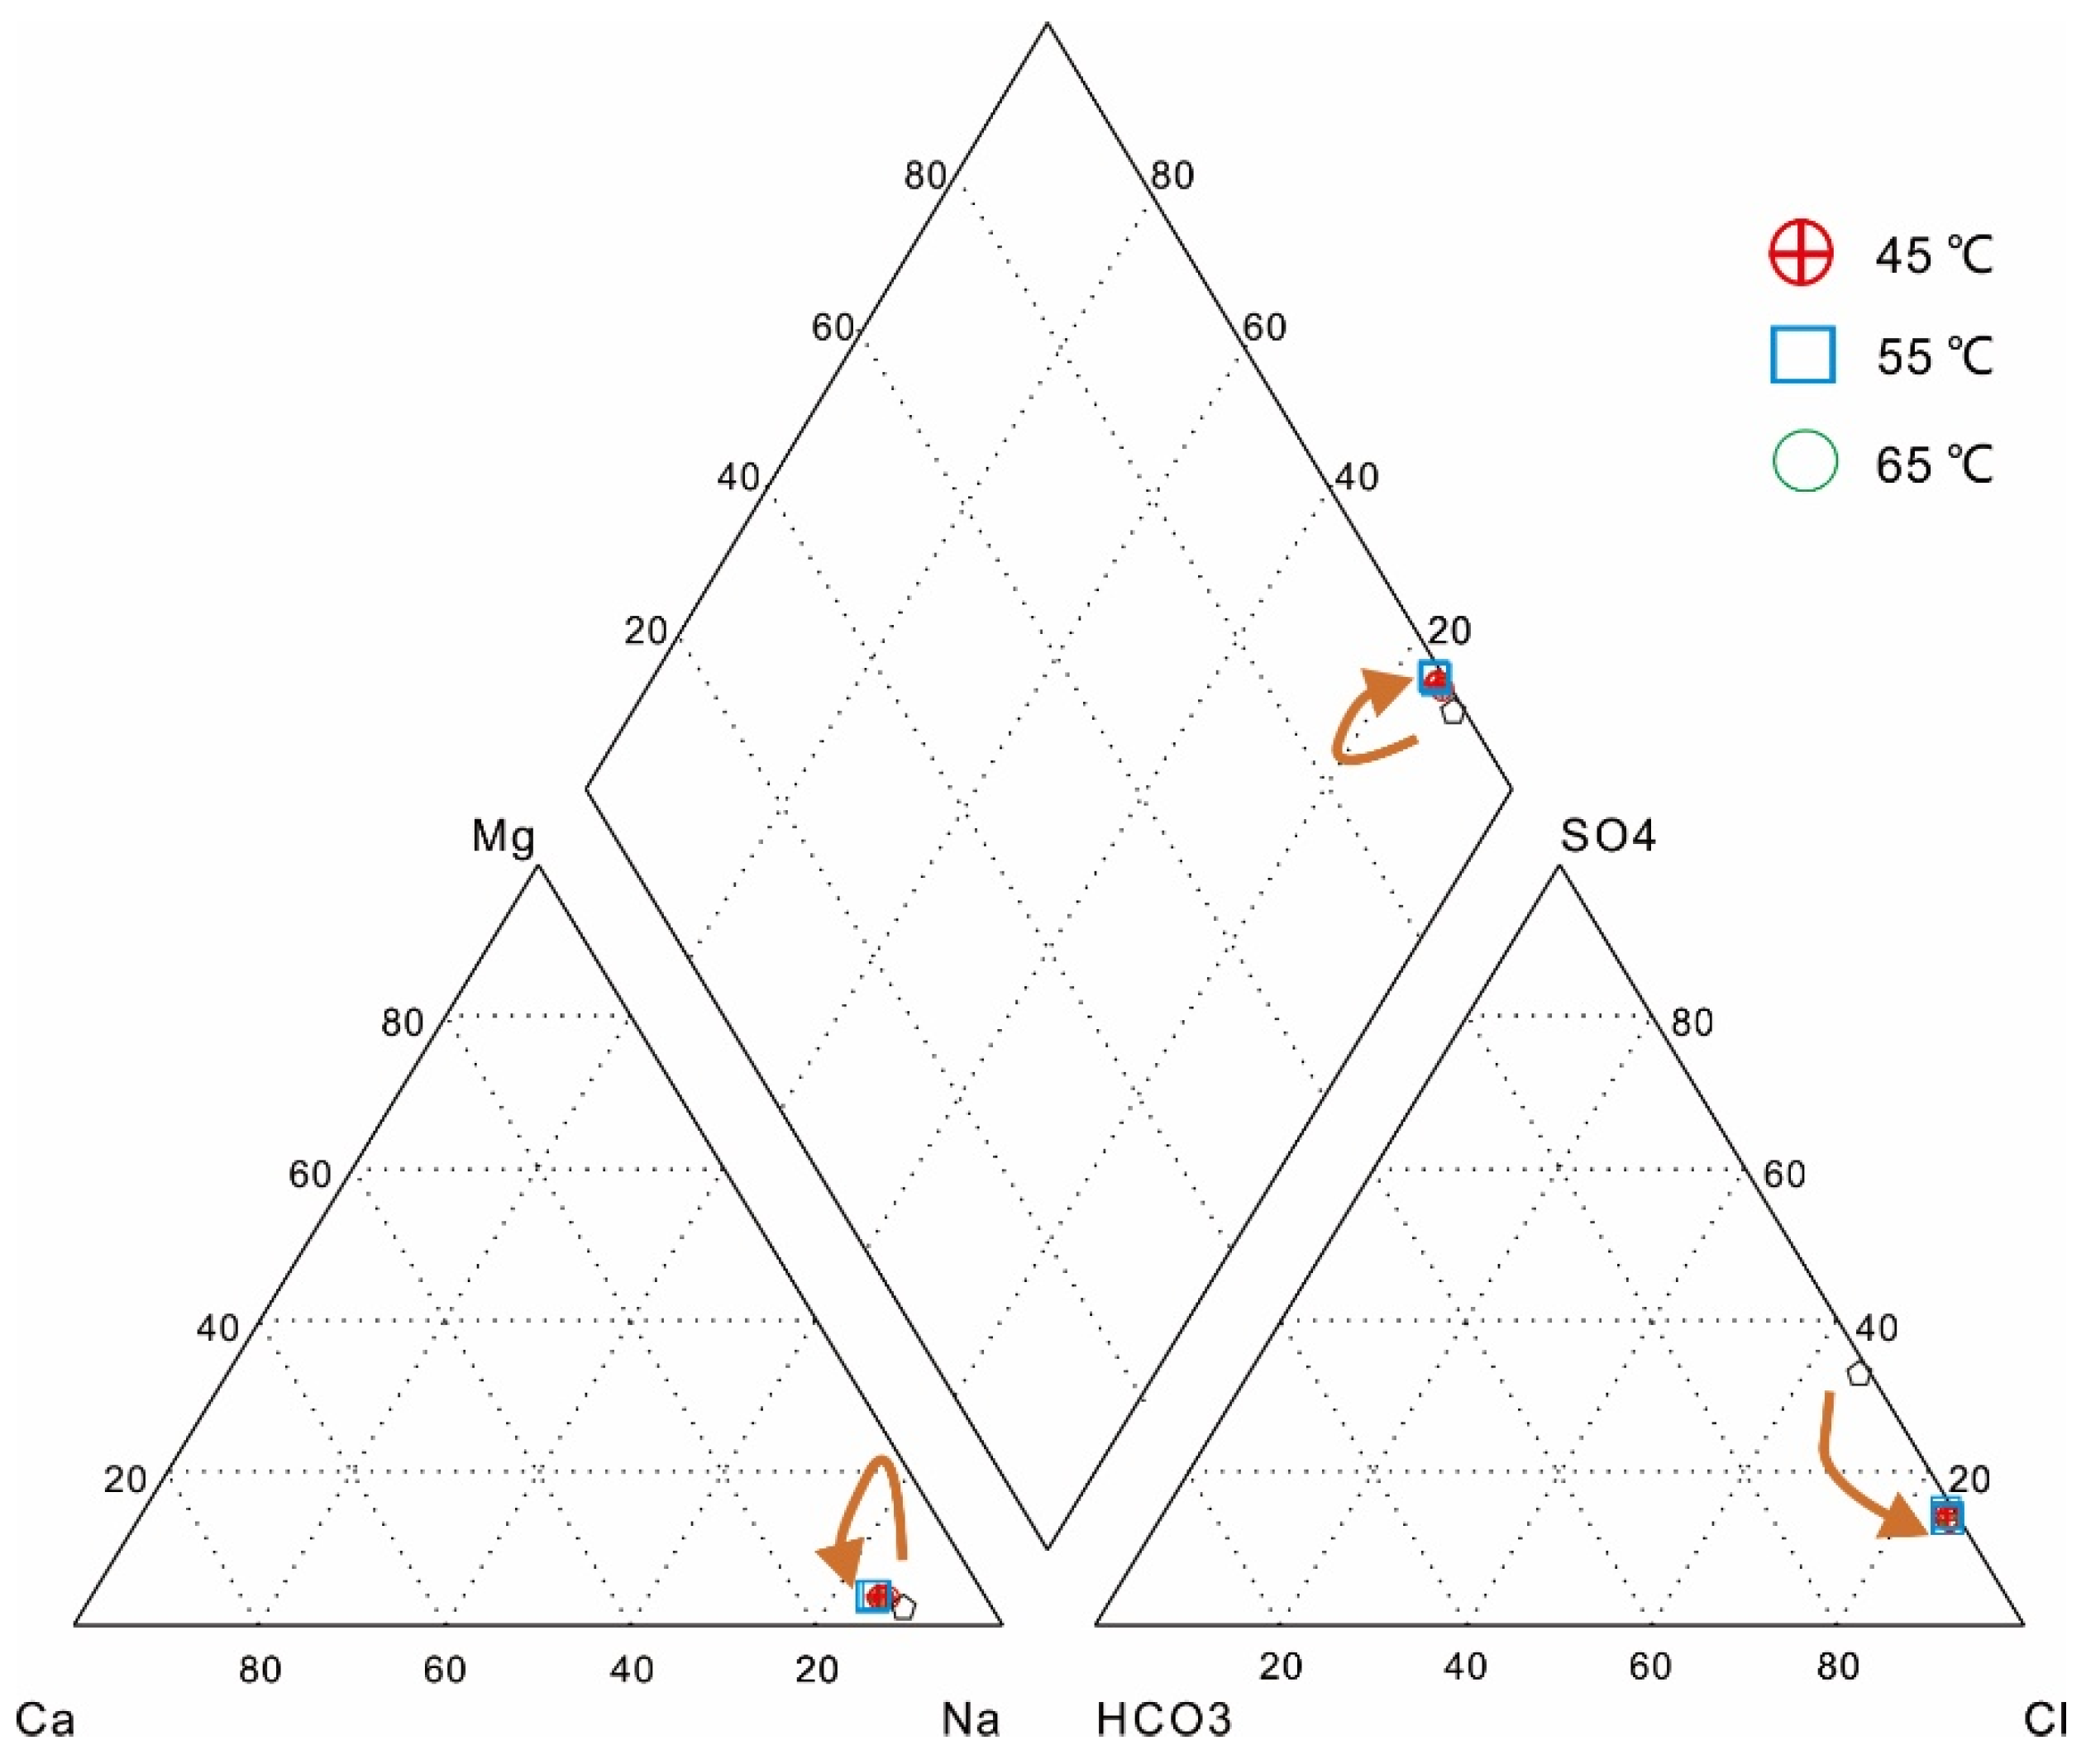
4.1.1. Hydrochemistry Characteristics

The hydrochemical compositions of 9 sets of samples are shown in Table 3. The hydrochemical types after the experiments were all the Na-Cl type, while the initial water samples were the Na-Cl-SO4 type (Figure 7). After the displacement, the anions of the water moved towards Cl. This could be due to the precipitation of SO4 in the water caused by an increase in temperature or a change in flow rate or the dissolution of Cl-rich minerals, resulting in an increase in the water’s Cl content.
After the displacement experiment, the ionic composition of the water sample changed. By analyzing the major element changes in water samples of the initial and after displacement, the contents of Ca, Mg, and Si increased gradually with the increase in temperature under the same flow rate with different temperature conditions (Table 3; Table S1). Note that, except for the K, which remained approximately unchanged, the content of other ions gradually increased from 45 °C to 55 °C but gradually decreased beyond 55 °C. The reason is probably because the minerals were dissolved at 45–55 °C, and therefore, the ions moved into the water. Under the condition of 55~65 °C, partial precipitation of ions in the water occurred.

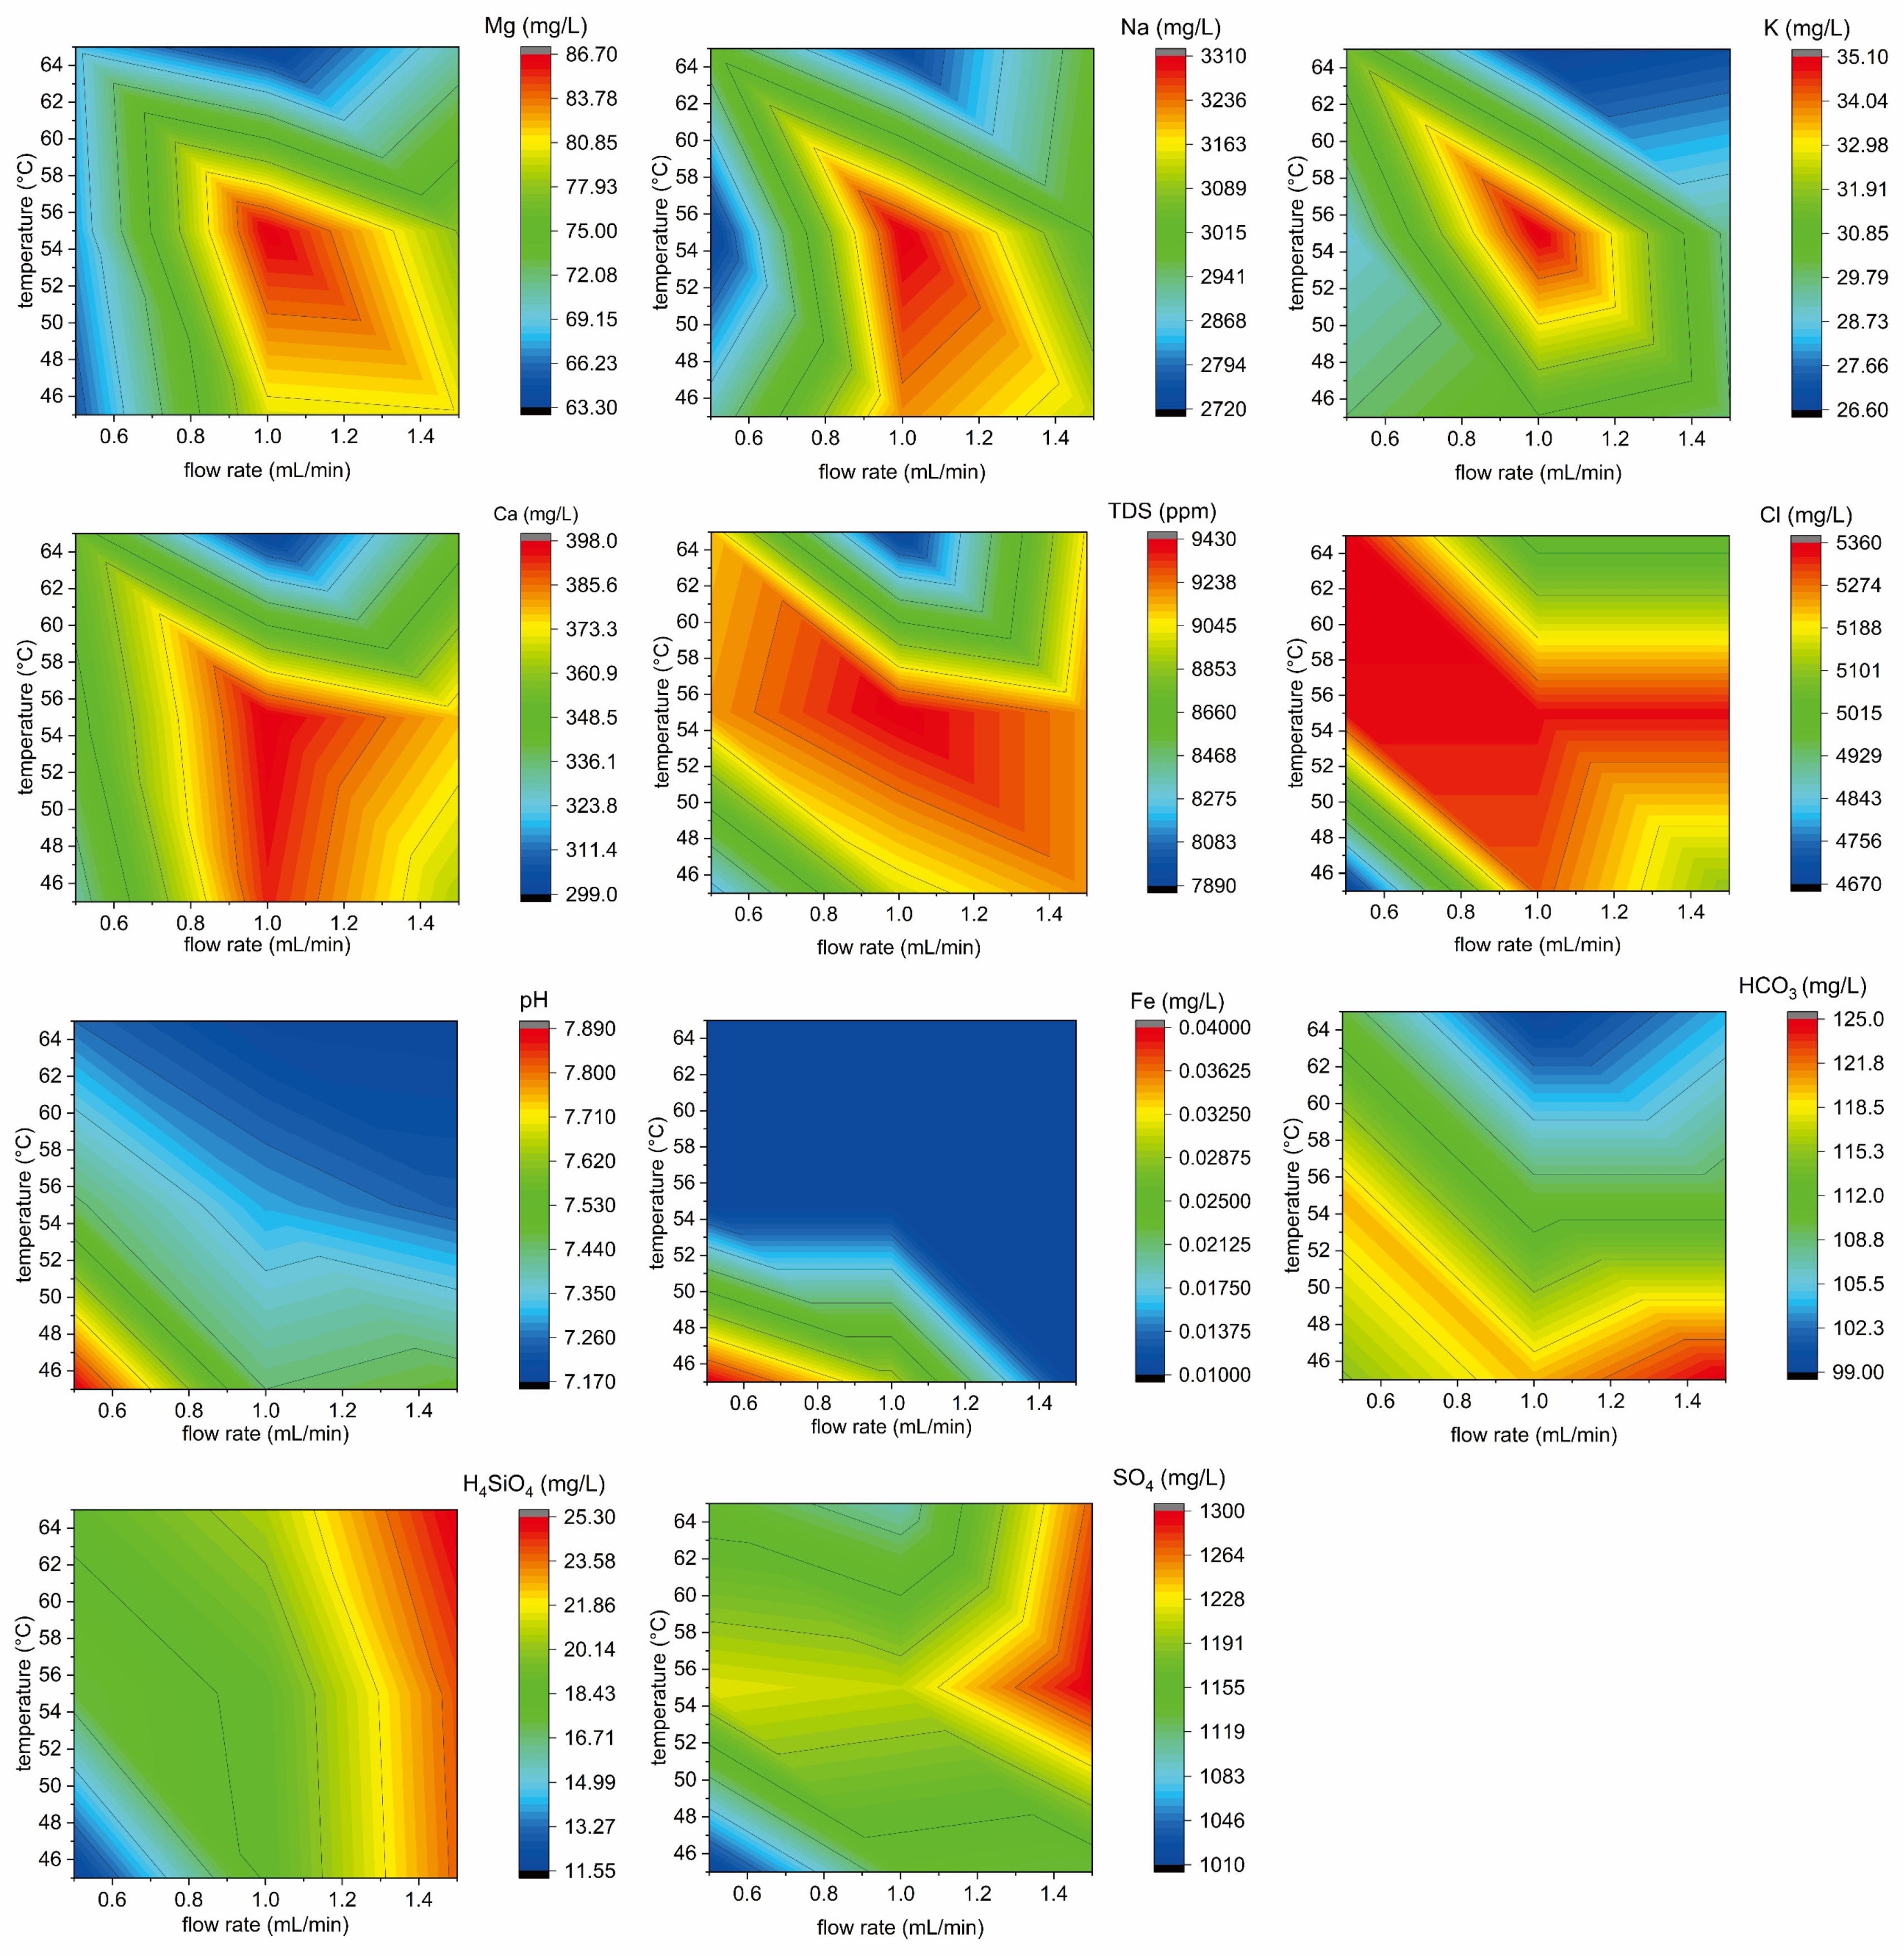
4.1.2. Comparison of Major Elements in Water Samples under Different Temperature and Flow Rate Conditions

The higher Fe content in water under low temperature and low flow rate conditions indicates that water under these conditions may have obtained relatively more Fe from the rocks (Figure 8). The higher K, Ca, Na, and Mg content in water at low to medium temperatures and medium to high flow rates conditions indicates that more minerals may be dissolved in water at higher temperatures and flow rates, resulting in increased ion content. This is also supported by the increase in TDS (Figure 8; Table 3). HCO3 is enriched in water under low temperature conditions, probably because calcite shows higher solubility at low temperatures. H4SiO4 exhibits enrichment at high flow rates and exhibits a moderate tendency to increase in content with increasing temperature, presumably related to the solubility of quartz. The mineralogical compositions of our experiments have shown that sulfides such as gypsum are not present in the core rock, so the enrichment of SO4 is presumed to be caused by the partial adsorption of SO4 from water by the core.

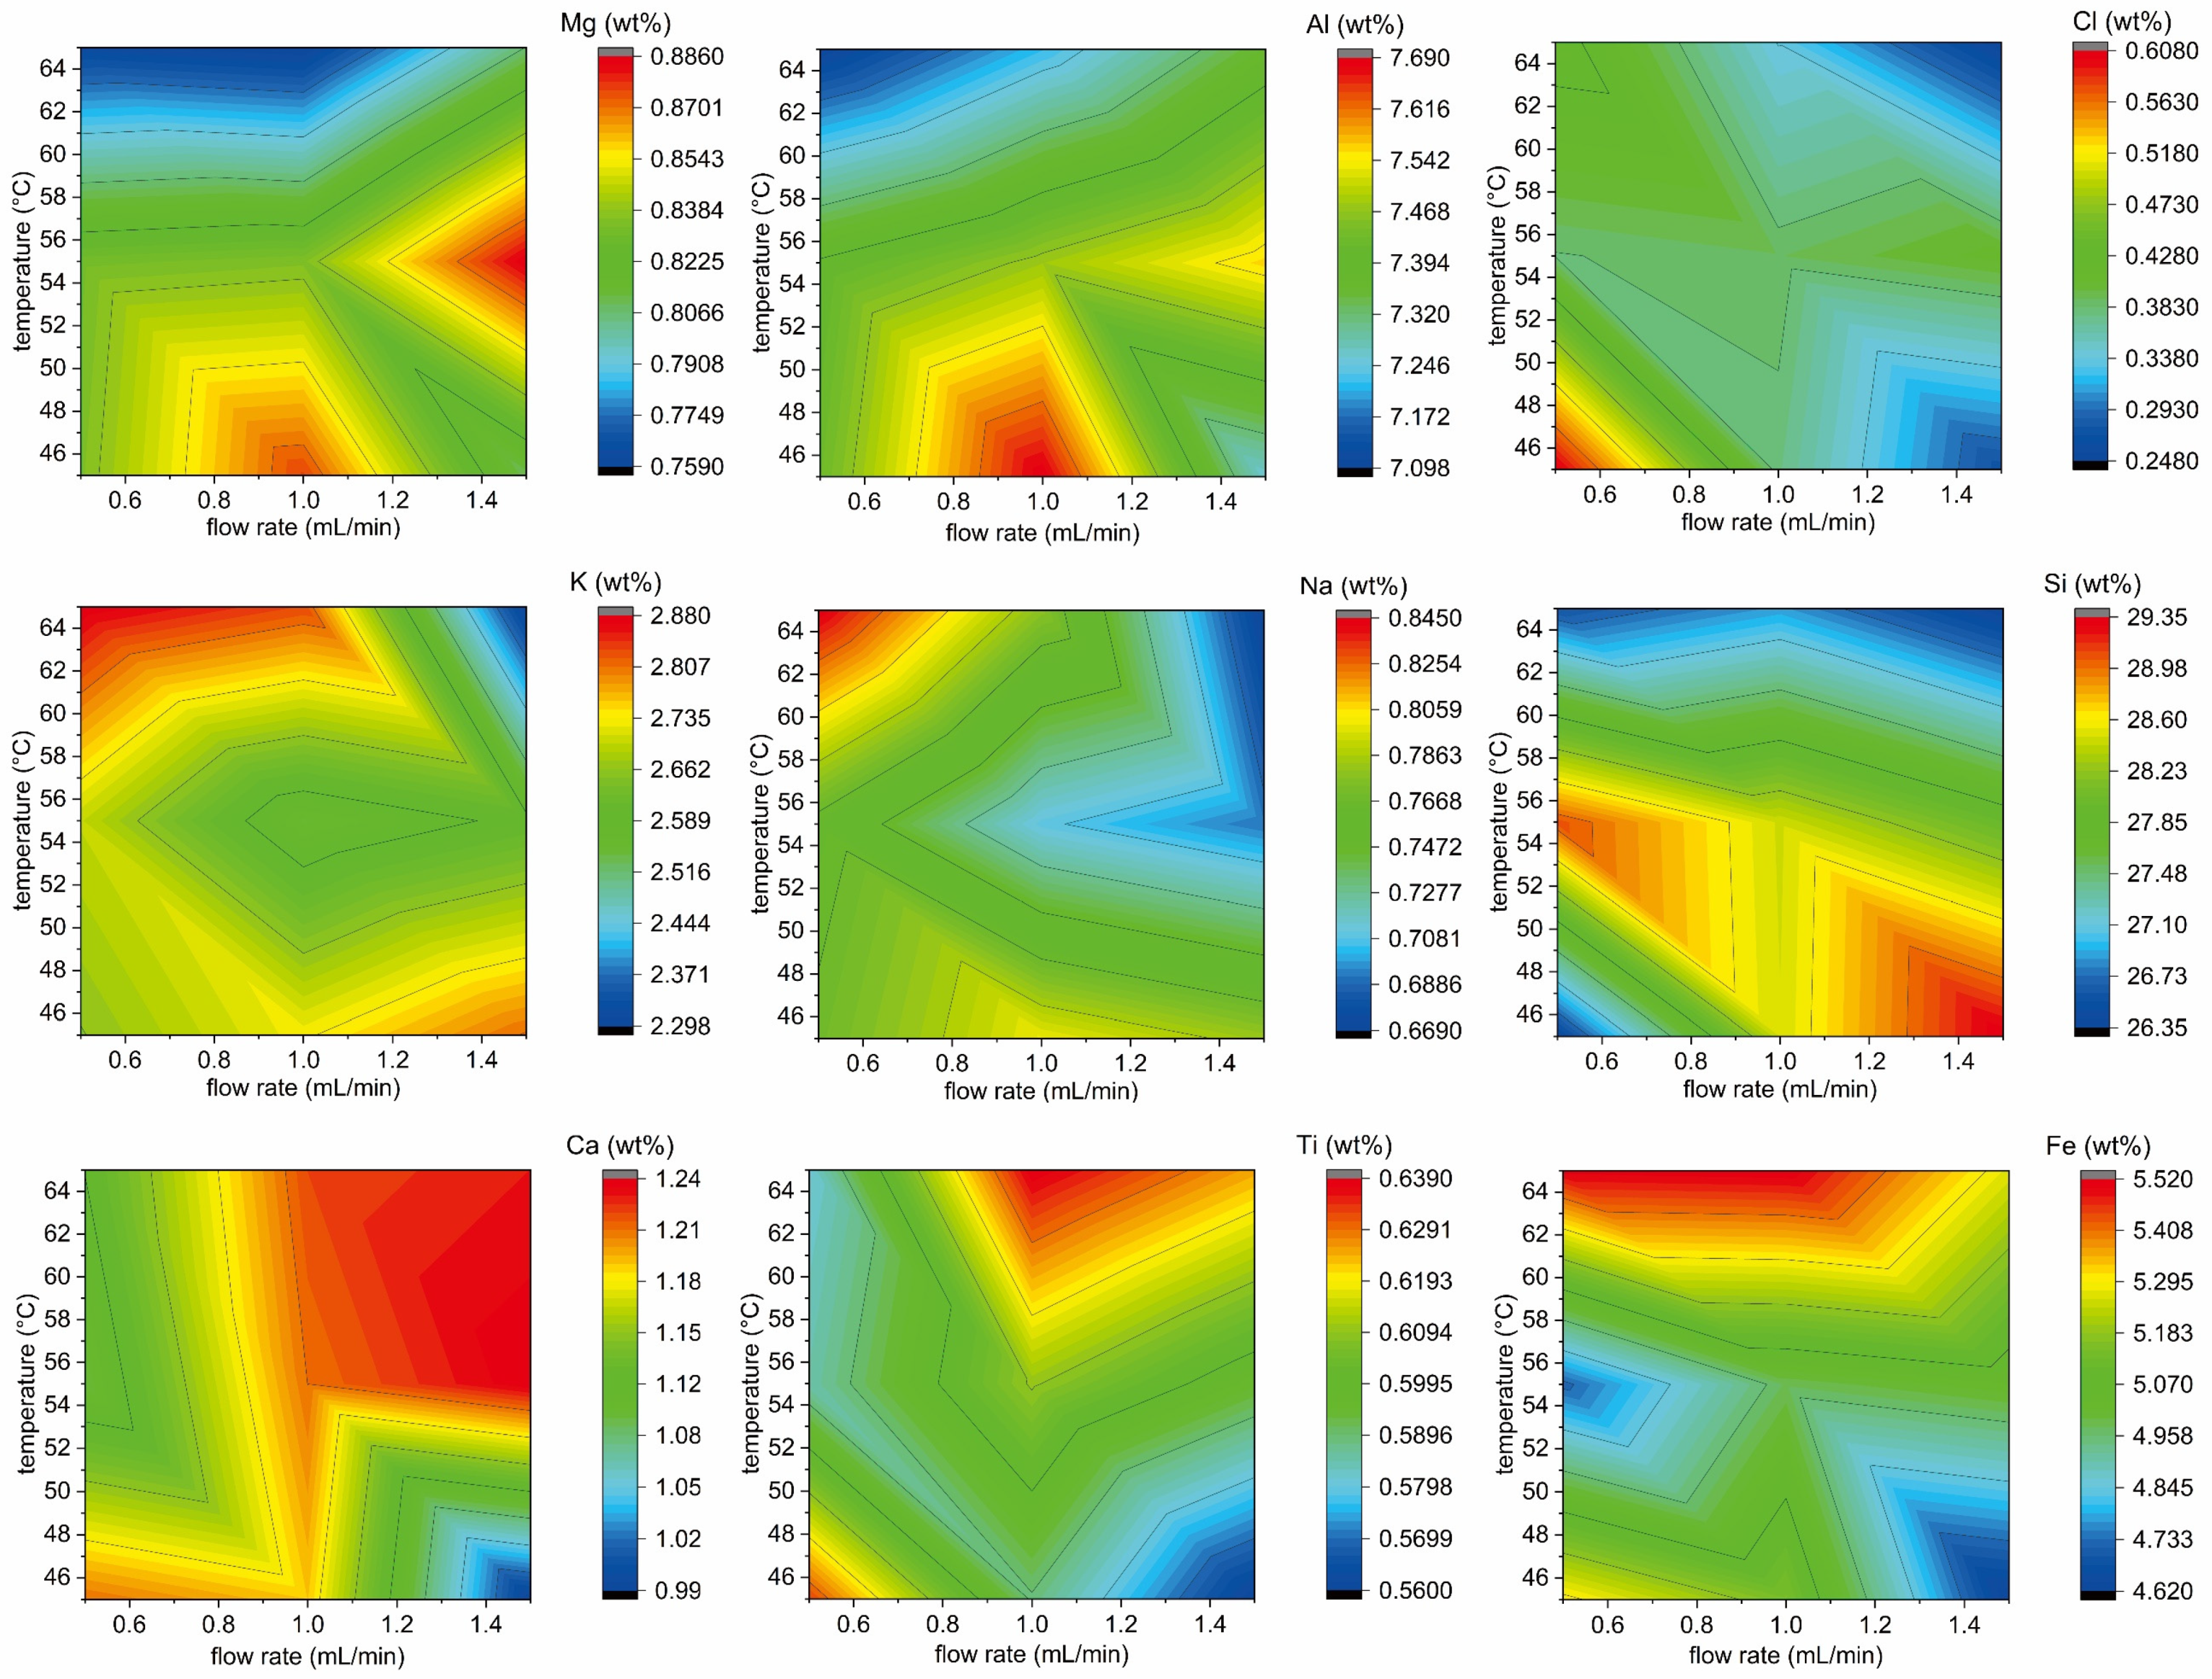
4.1.3. Comparison of Major Elements in Ground Sandstone Specimens under Different Temperature and Flow Rate Conditions

The enrichment of Cl bearing minerals occurs in rocks under low temperature and low flow conditions (Figure 9), corresponding to the low Cl content in water under these conditions. Mg and Al shows enrichment at low temperatures with medium flow rates and medium temperatures with high flow rates, which may indicate the precipitation correlation of Mg and Al elements. Na and K show enrichment at low temperature and high flow rate, complementing the ion enrichment trend in geothermal fluids, while Ca, Ti, and Fe show enrichment under low temperature-low flow rate and high temperature-high flow rate conditions (Figure 9) and exhibit similar enrichment characteristics of the elements.

4.1.4. Comparison of the Major Elemental Composition between Water and Ground Sandstone Specimens

Comparing the major elemental compositions in water and ground sandstone specimens under different temperature and flow rate conditions (Figure 8 and Figure 9), Mg, Na, and K exhibited more obvious water–rock complementary characteristics. Ca appeared to be enriched in fluids at low and medium temperatures and in rocks at high and medium temperatures. Si did not exhibit water–rock complementary characteristics but rather exhibited characteristics that were flow rate controlled in water and temperature controlled in ground sandstone specimens. In addition, Fe content in water is low and generally decreases under different temperature and flow rate conditions compared to the initial geothermal fluid, indicating that Fe is adsorbed by the rock. Correspondingly, Fe content in the ground sandstone specimens generally increased. This was more pronounced in high-temperature conditions, and it was speculated that high temperatures may have facilitated the precipitation of Fe from the fluid into the rock.

4.1.5. Possible Reasons for Permeability and Porosity Changes

A comparison before and after the experiment showed that the reduction in permeability reached 1.6~24%, while the reduction in porosity was only 4.48~5.53% (Figure 4 and Figure 5). This indicates that the permeability decreases significantly during displacement, while the porosity is slightly decreased. The reason for this phenomenon may be the deformation of the rock structure, which causes a decrease in permeability through intergranular migration [7,15]. The slight decrease in porosity may be caused by minor deformations due to the collisions of mineral particles or by changes in mineral volume due to mineral dissolution and precipitation. Considering that the porosity of the original rock reached 29.58%, it is difficult to deform the particles by collision and extrusion under the test pressure condition; therefore, we think the reduction in porosity is caused by chemical dissolution precipitation. Considering that the porosity of the original rock reached 29.58%, which means relatively adequate space for compression, it is difficult for particle collision and extrusion deform to occur under displacement pressure conditions. Therefore, the reduction in porosity that we propose is due to chemical dissolution precipitation.
From the above analysis, we speculate that the reason for the changes in permeability and porosity are mainly due to the precipitation of quartz and the conversion of albite to montmorillonite. The total volume of minerals showed an increase, although the volume of individual minerals changed under different temperature and flow rate conditions. The possible reason for the decrease in the permeability and porosity, on the one hand, is that the precipitated quartz and montmorillonite occupy a certain pore volume. On the other hand, the mineral particles could migrate, or new minerals could block the pore throat during the displacement process [15,28].

4.2. Implications for Sandstone Reinjection Blockage Reduction

Because of the complexities of natural geological conditions, the characteristics of geothermal fields are not uniform [52,53]. The “optimal” reinjection water might be complicated to find [54]. Experiments on sandstone replacement through the reinjection of geothermal fluid are the result of a combination of chemical and physical blockages. In this study, we provide references to blockage reduction in sandstone reinjection from the integrated blockage perspective. Previous experiments on sandstone geothermal reservoir reinjection suggested that the reinjection effect of a low temperature water source is theoretically better than that of a high temperature [55], and the total precipitation increased with increasing temperature [13]. The replacement experiments indicate that higher temperature and flow rate conditions may have dissolved more minerals into the water, causing an increase in the water element content.
The rock permeability displayed minimal changes at 45 °C—1 mL/min and the rock porosity exhibited minimal changes at 45 °C and 55 °C with low to medium flow rates (or low to medium differential pressure), indicating that the reinjection of geothermal fluid displayed a minimal influence on the sandstone geothermal reservoir under such conditions. Therefore, combined with the variation in permeability and porosity, we believe that reinjection at low temperatures with medium flow rates may have a better effect. For the Binzhou sandstone geothermal reservoir with a reservoir temperature of 55 °C, a reinjection fluid at 45 °C with a low to medium flow rate exhibits a better reduction in blockage. In summary, from the laboratory studies, we recommended lowering or maintaining the temperature of the reinjection fluid below the reservoir temperature before reinjection, and at low to moderate flow rate conditions.
Notably, the present study was conducted in the laboratory and on ground sandstone specimens. However, the inferences drawn are believed to extend to the real situation concerning sandstone geothermal reservoirs.

5. Conclusions

We have conducted experiments on the reinjection of geothermal water through sandstone at 45 °C, 55 °C, and 65 °C and 0.5 mL/min, 1 mL/min, 1.5 mL/min, and obtained the following main conclusions:
  • The high temperature with low flow rate exhibited the minimum displacement pressure. Flow rate is the main factor controlling permeability, while temperature has a relatively minor effect. Displacement at 45 °C—1.0 mL/min showed a minimal influence on permeability. Furthermore, 55 °C—1.0 mL/min and 45 °C—0.5 mL/min conditions showed a minimal amount of porosity decrease.
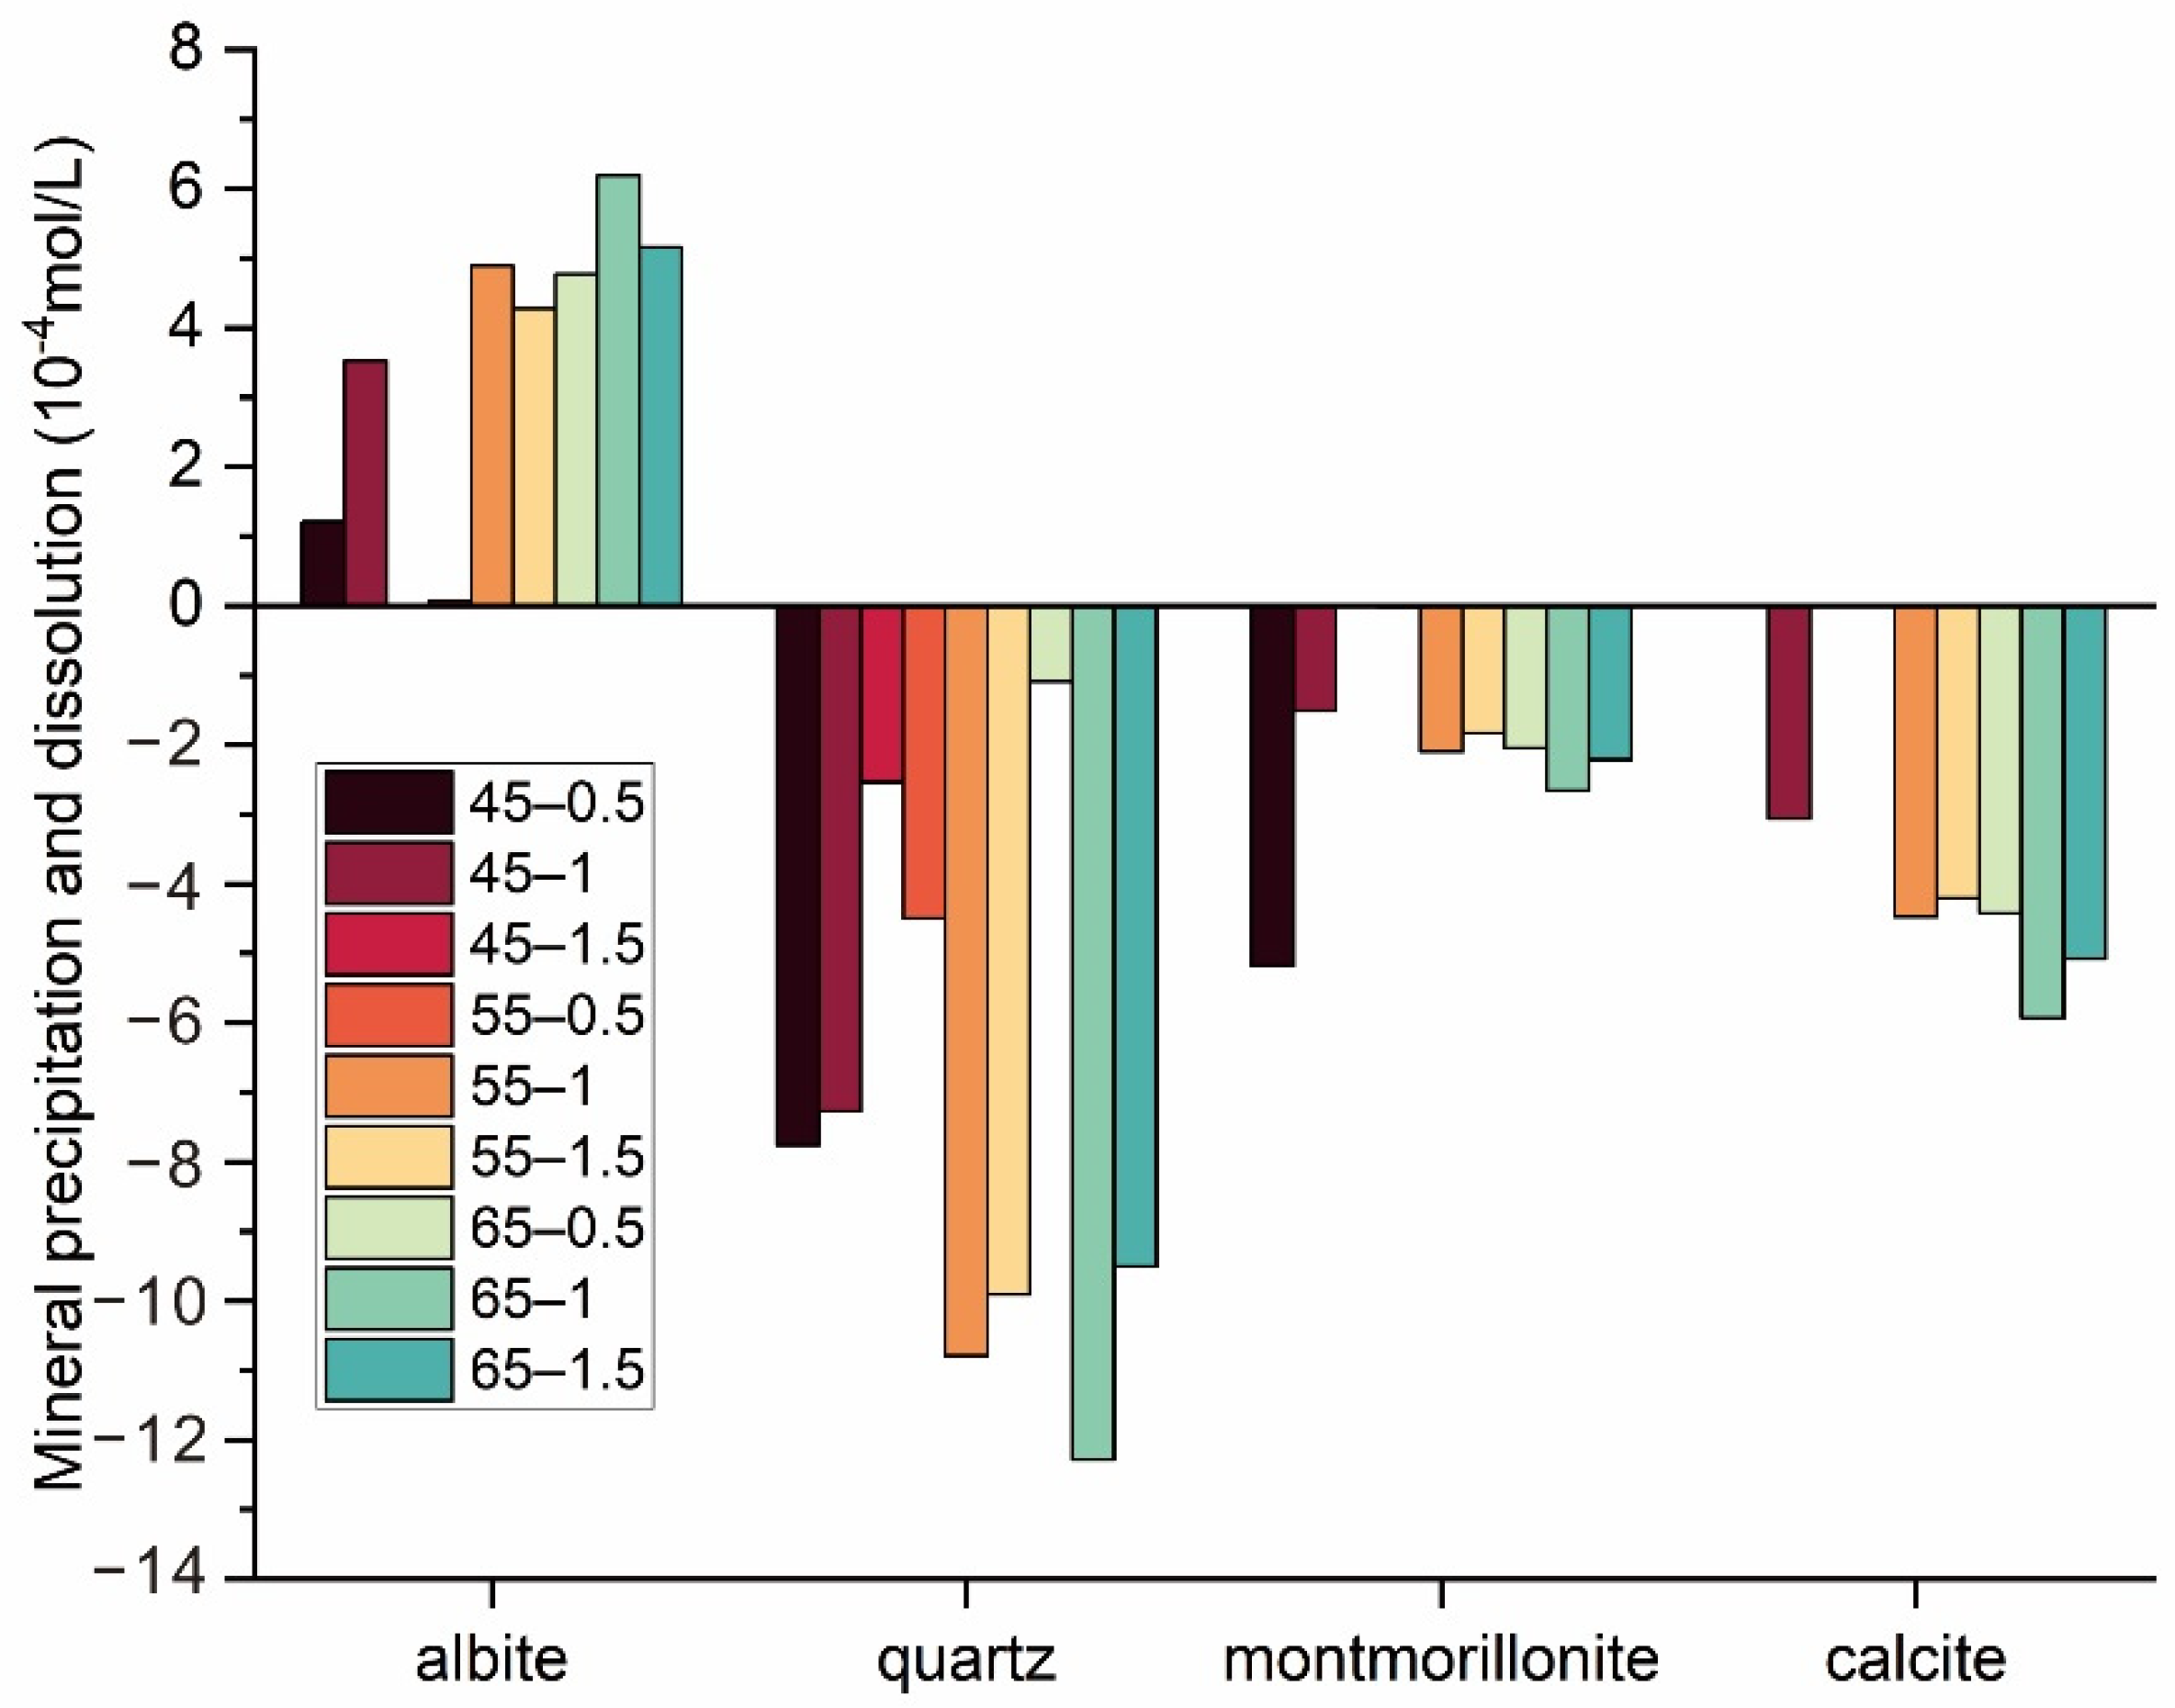
  • During the experiments, quartz precipitated, albite and microcline dissolved, and montmorillonite was newly formed. A high temperature or high flow rate both led to an increase in the total volume change of minerals.
  • The inversion simulation shows that albite is the main dissolved mineral and quartz, montmorillonite, and calcite are the main precipitated minerals. The injection process of geothermal fluids at 55 °C may have dissolved more minerals. However, the permeability reduction at 55 °C is greater than that at 45 °C. Therefore, the integrated blockage leading to permeability reduction contains multiple causes.

Supplementary Materials

The following supporting information can be downloaded at: https://www.mdpi.com/article/10.3390/w14193131/s1, Figure S1: Displacement pressure at different temperature and flow rate conditions; Figure S2: Contour plots of initial pressure and the stable pressure at the end of the experiment difference (ΔP) under different temperature and flow rate conditions; Figure S3: Individual mineral volume changes under different temperature and flow rate conditions; Table S1: Changes of major ions in water before and after the displacement experiments; Table S2: Scheme for simulating dissolution and precipitation for the 65 °C—0.5 mL/min group; Table S3: Simulated precipitation and dissolution of minerals after displacement.

Author Contributions

Conceptualization, H.G. and Z.L. (Zhiming Liu); validation, G.W. and Y.L.; methodology, X.W.; software, Y.Z.; investigation, J.Z. and Z.L. (Zhitao Liu). All authors have read and agreed to the published version of the manuscript.

Funding

This research was funded by the National Key Research and Development Program of China (2019YFB1504203).

Data Availability Statement

Not applicable.

Acknowledgments

This study was supported by the National Key Research and Development Program of China (2019YFB1504203). We are grateful for the comments from the editor and anonymous reviewers that helped improve this manuscript.

Conflicts of Interest

The authors declare no conflict of interest.

References

  1. Stefansson, V. Geothermal Reinjection Experience. Geothermics 1997, 26, 99–139. [Google Scholar] [CrossRef]
  2. Kaya, E.; Zarrouk, S.J.; O’Sullivan, M. Reinjection in Geothermal Fields: A Review of Worldwide Experience. Renew. Sustain. Energy Rev. 2011, 15, 47–68. [Google Scholar] [CrossRef]
  3. Wang, G.; Lin, W. Main Hydro-Geothermal Systems and Their Genetic Models in China. Acta Geol. Sin. 2020, 94, 1923–1937. (In Chinese) [Google Scholar]
  4. Long, X.; Xie, H.; Deng, X.; Wen, X.; Ou, J.; Ou, R.; Wang, J.; Fei, L.; Hu, D. Geological and Geochemical Characteristics of the Geothermal Resources in Rucheng, China. Lithosphere 2021, 2021, 1357568. [Google Scholar] [CrossRef]
  5. Lund, J.W.; Huttrer, G.W.; Toth, A.N. Characteristics and Trends in Geothermal Development and Use, 1995 to 2020. Geothermics 2022, 105, 102522. [Google Scholar] [CrossRef]
  6. Chen, Z. Modeling Water-Rock Interaction of Geothermal Reinjection in the Tanggu Low-Temperature Field, Tianjin. Earth Sci. J. China Univ. Geosci. 1998, 23, 513–518. (In Chinese) [Google Scholar]
  7. Xu, G.; Ma, Z.; Zhou, X.; Xi, L.; Sun, C. Study on the Mechanism of Chemical Clog for the Recharging of Geopressured Thermal Water—Taking the Recharging Well No. 1 In Xianyang as the Example. Geotechnol. Investig. Surv. 2013, 7, 40–44. (In Chinese) [Google Scholar]
  8. Zhao, Z.; Qin, G.; Luo, Y.; Yao, J.; Geng, S.; Zhang, L. Characteristics of Geothermal Water in the Xining Basin and Risk of Reinjection Scaling. Hydrogeol. Eng. Geol. 2021, 48, 193–204. (In Chinese) [Google Scholar] [CrossRef]
  9. Yuan, R.; Zhang, W.; Gan, H.; Liu, F.; Wei, S.; Liu, L. Hydrochemical Characteristics and the Genetic Mechanism of Low–Medium Temperature Geothermal Water in the Northwestern Songliao Basin. Water 2022, 14, 2235. [Google Scholar] [CrossRef]
  10. Hou, J.; Cao, M.; Liu, P. Development and Utilization of Geothermal Energy in China: Current Practices and Future Strategies. Renew. Energy 2018, 125, 401–412. [Google Scholar] [CrossRef]
  11. Ullah, J.; Luo, M.; Ashraf, U.; Pan, H.; Anees, A.; Li, D.; Ali, M.; Ali, J. Evaluation of the Geothermal Parameters to Decipher the Thermal Structure of the Upper Crust of the Longmenshan Fault Zone Derived from Borehole Data. Geothermics 2021, 98, 102268. [Google Scholar] [CrossRef]
  12. Liu, J. The Status of Geothermal Reinjection. Hydrogeol. Eng. Geol. 2003, 30, 100–104. (In Chinese) [Google Scholar]
  13. Ma, Z.; Hou, C.; Xi, L.; Yun, H.; Sun, C. Reinjection Clogging Mechanism of Used Geothermal Water in a Super-Deep-Porous Reservoir. Hydrogeol. Eng. Geol. 2013, 40, 133–139. (In Chinese) [Google Scholar]
  14. Zheng, L.; Ma, Z.; Zheng, H.; He, D.; Li, Y. Comparison of Clogging Mechanism of Pore-Type Heat Storage Tail Water Recharge in Xi’an and Xianyang. Water Resour. Prot. 2015, 31, 40–45. (In Chinese) [Google Scholar]
  15. Zhang, L.; Geng, S.; Yang, L.; Wen, R.; He, C.; Zhao, Z.; Qin, G. Formation Blockage Risk Analysis of Geothermal Water Reinjection: Rock Property Analysis, Pumping and Reinjection Tests, and Long-Term Reinjection Prediction. Geosci. Front. 2021, 13, 101299. [Google Scholar] [CrossRef]
  16. Rybach, L. Geothermal Energy: Sustainability and the Environment. Geothermics 2003, 32, 463–470. [Google Scholar] [CrossRef]
  17. Song, W.; Liu, X.; Zheng, T.; Yang, J. A Review of Recharge and Clogging in Sandstone Aquifer. Geothermics 2020, 87, 101857. [Google Scholar] [CrossRef]
  18. Kamila, Z.; Kaya, E.; Zarrouk, S.J. Reinjection in Geothermal Fields: An Updated Worldwide Review 2020. Geothermics 2020, 89, 101970. [Google Scholar] [CrossRef]
  19. Seibt, P.; Kellner, T. Practical Experience in the Reinjection of Cooled Thermal Waters Back into Sandstone Reservoirs. Geothermics 2003, 32, 733–741. [Google Scholar] [CrossRef]
  20. Rosenbrand, E.; Haugwitz, C.; Jacobsen, P.S.M.; Kjøller, C.; Fabricius, I.L. The Effect of Hot Water Injection on Sandstone Permeability. Geothermics 2014, 50, 155–166. [Google Scholar] [CrossRef]
  21. Lin, J.; Zhao, S. An Analysis of the Reinjection Attenuation of the Guantao Group Geothermal Reservoir in the Tianjin Area. Hydrogeol. Eng. Geol. 2010, 37, 133–136. (In Chinese) [Google Scholar]
  22. Wu, J.; Zhang, J.; Li, X.; Shi, F.; Zhang, P.; Bai, M. Experiment on Artificial Pressure Reinjection of Geothermal Water in Xian Suburb. J. Water Resour. Water Eng. 2014, 25, 215–218. (In Chinese) [Google Scholar]
  23. Su, Y.; Yang, F.; Wang, B.; Jia, Z.; Duan, Z. Reinjection of Cooled Water into Sandstone Geothermal Reservoirs in China: A Review. Geosci. J. 2017, 22, 199–207. [Google Scholar] [CrossRef]
  24. Gao, B.; Zeng, M. Causes and Prevention Measures of Clogging in the Reinjection Well of a Geothermal Double-Well System. Hydrogeol. Eng. Geol. 2007, 34, 75–80. (In Chinese) [Google Scholar]
  25. Liu, X.; Zhu, J. A study of Clogging in Geothermal Reinjection Wells in the Neogene Sandstone Aquifer. Hydrogeol. Eng. Geol. 2009, 5, 138–141. (In Chinese) [Google Scholar]
  26. Bouwer, H. Artificial Recharge of Groundwater: Hydrogeology and Engineering. Hydrogeol. J. 2002, 10, 121–142. [Google Scholar] [CrossRef] [Green Version]
  27. Rinck-Pfeiffer, S.; Ragusa, S.; Sztajnbok, P.; Vandevelde, T. Interrelationships Between Biological, Chemical, and Physical Processes as an Analog to Clogging in Aquifer Storage and Recovery (ASR) wells. Water Res. 2000, 34, 2110–2118. [Google Scholar] [CrossRef]
  28. Fetzer, J.; Holzner, M.; Plötze, M.; Furrer, G. Clogging of an Alpine Streambed by Silt-Sized Particles–Insights from Laboratory and Field Experiments. Water Res. 2017, 126, 60–69. [Google Scholar] [CrossRef]
  29. Yuhara, K.; Maruyama, H. Model Experiment of Effects of Air Bubbles on the Decrease of the Ability of the Reinjection Well. J. Geotherm. Res. Soc. Jpn. 1996, 8, 201–217. [Google Scholar] [CrossRef]
  30. Pan, J.; Song, J.; Ye, M. Experimental Study on Influencing Factors of Chemical Plugging of Iron and Manganese in Groundwater Source Heat Pump. J. Shenyang Jianzhu Univ. (Nat. Sci.) 2017, 33, 953–960. [Google Scholar]
  31. Li, Y.; Pang, Z.; Yang, F. CO2-EATER Model on Guantao Formation of Beitang Sag. Sci. Technol. Rev. 2013, 31, 15–20. (In Chinese) [Google Scholar]
  32. Tutolo, B.M.; Luhmann, A.J.; Kong, X.-Z.; Saar, M.O.; Seyfried, W.E. CO2 Sequestration in Feldspar-Rich Sandstone: Coupled Evolution of Fluid Chemistry, Mineral Reaction Rates, and Hydrogeochemical Properties. Geochim. Cosmochim. Acta 2015, 160, 132–154. [Google Scholar] [CrossRef]
  33. Wigand, M.; Carey, J.; Schütt, H.; Spangenberg, E.; Erzinger, J. Geochemical Effects of CO2 Sequestration in Sandstones Under Simulated in Situ Conditions of Deep Saline Aquifers. Appl. Geochem. 2008, 23, 2735–2745. [Google Scholar] [CrossRef]
  34. Safaei-Farouji, M.; Thanh, H.V.; Dashtgoli, D.S.; Yasin, Q.; Radwan, A.E.; Ashraf, U.; Lee, K.-K. Application of Robust Intelligent Schemes for Accurate Modelling Interfacial Tension of CO2 Brine Systems: Implications for Structural CO2 Trapping. Fuel 2022, 319, 123821. [Google Scholar] [CrossRef]
  35. Alalimi, A.; AlRassas, A.M.; Thanh, H.V.; Al-Qaness, M.A.A.; Pan, L.; Ashraf, U.; Al-Alimi, D.; Moharam, S. Developing the Efficiency-Modeling Framework to Explore the Potential of CO2 Storage Capacity of S3 Reservoir, Tahe Oilfield, China. Géoméch. Geophys. Geo-Energy Geo-Resour. 2022, 8, 1–23. [Google Scholar] [CrossRef]
  36. Safaei-Farouji, M.; Thanh, H.V.; Dai, Z.; Mehbodniya, A.; Rahimi, M.; Ashraf, U.; Radwan, A.E. Exploring the Power of Machine Learning to Predict Carbon Dioxide Trapping Efficiency in Saline Aquifers for Carbon Geological Storage Project. J. Clean. Prod. 2022, 372, 133778. [Google Scholar] [CrossRef]
  37. Medici, G.; West, L.J.; Mountney, N.P. Characterization of a Fluvial Aquifer at a Range of Depths and Scales: The Triassic St Bees Sandstone Formation, Cumbria, UK. Appl. Hydrogeol. 2017, 26, 565–591. [Google Scholar] [CrossRef] [Green Version]
  38. Medici, G.; West, L.J.; Mountney, N.P.; Welch, M. Permeability of Rock Discontinuities and Faults in the Triassic Sherwood Sandstone Group (UK): Insights for Management of Fluvio-Aeolian Aquifers Worldwide. Appl. Hydrogeol. 2019, 27, 2835–2855. [Google Scholar] [CrossRef] [Green Version]
  39. Weibel, R.; Olivarius, M.; Vosgerau, H.; Mathiesen, A.; Kristensen, L.; Nielsen, C.M.; Nielsen, L.H. Overview of Potential Geothermal Reservoirs in Denmark. Neth. J. Geosci. 2020, 99, e3. [Google Scholar] [CrossRef] [Green Version]
  40. Weibel, R.; Kristensen, L.; Olivarius, M.; Hjuler, M.L.; Mathiesen, A.; Nielsen, L.H. Investigating Deviations from Overall Porosity–Permeability Trends. In Proceedings of the 36th Workshop on Geothermal Reservoir Engineering, Stanford, CA, USA, 30 January–1 February 2012; Volume 16. [Google Scholar]
  41. Stumm, W.; Morgan, J.J. Aquatic Chemistry-Chemical Equilibria and Rates in Natural Waters, 3rd ed.; John Wiley & Sons: New York, NY, USA, 1996. [Google Scholar]
  42. Orywall, P.; Drüppel, K.; Kuhn, D.; Kohl, T.; Zimmermann, M.; Eiche, E. Flow-Through Experiments on the Interaction of Sandstone with Ba-Rich Fluids at Geothermal Conditions. Geotherm. Energy 2017, 5, 1–24. [Google Scholar] [CrossRef] [Green Version]
  43. Dávila, G.; Dalton, L.; Crandall, D.M.; Garing, C.; Werth, C.J.; Druhan, J.L. Reactive Alteration of a Mt. Simon Sandstone Due to CO2-Rich Brine Displacement. Geochim. Cosmochim. Acta 2020, 271, 227–247. [Google Scholar] [CrossRef]
  44. Shandong Provincial Territorial Spatial Ecological Restoration Center. Report on the Project of Geothermal Tailwater Reinjection to Sandstone Geothermal Reservoir, Huimin County, Shandong, China. 2022; unpublished work. [Google Scholar]
  45. Gan, H.; Liu, Z.; Wang, X.; Zhang, Y.; Liao, Y.; Zhao, G.; Zhao, J.; Liu, Z. Effect of Temperature and Acidification on Reinjection of Geothermal Water into Sandstone Geothermal Reservoirs: Laboratory Study. Water 2022, 14, 2955. [Google Scholar] [CrossRef]
  46. Parkhurst, D.L.; Appelo, C.A.J. Description of Input and Examples for PHREEQC Version 3—A Computer Program for Speciation, Batch-Reaction, One-Dimensional Transport, and Inverse Geochemical Calculations; USGS Techniques and Methods: Denver, CO, USA, 2013. [Google Scholar]
  47. Liu, Z. Study on the Groundwater Circulation and the Hydrogeological Environment Evolution in the Southern Junggar Basin. Ph.D. Thesis, Nanjing University, Nanjing, China, 2007. [Google Scholar]
  48. Shen, Z. Hydrogeochemistry; Geological Publishing House: Beijing, China, 1984. (In Chinese) [Google Scholar]
  49. Ashraf, U.; Zhang, H.; Anees, A.; Ali, M.; Zhang, X.; Shakeel Abbasi, S.; Nasir Mangi, H. Controls on Reservoir Heterogeneity of a Shallow-Marine Reservoir in Sawan Gas Field, SE Pakistan: Implications for Reservoir Quality Prediction Using Acoustic Impedance Inversion. Water 2020, 12, 2972. [Google Scholar] [CrossRef]
  50. Le, C. Petrology; Geological Publishing House: Beijing, China, 1984. (In Chinese) [Google Scholar]
  51. Feng, B.; Song, D.; Fu, L.; Zhang, S.; Chen, M.; Jiang, Z. Formation Laws of Hydrothermal Alteration Minerals and the Genesis of Travertine in the Zhacang Geothermal Field, Guide Basin. Natur. Gas Ind. 2019, 39, 133–142. (In Chinese) [Google Scholar]
  52. Li, J.; Yang, G.; Sagoe, G.; Li, Y. Major Hydrogeochemical Processes Controlling the Composition of Geothermal Waters in the Kangding Geothermal Field, Western Sichuan Province. Geothermics 2018, 75, 154–163. [Google Scholar] [CrossRef]
  53. Lin, W.; Wang, G.; Gan, H.; Zhang, S.; Zhao, Z.; Yue, G.; Long, X. Heat Source Model for Enhanced Geothermal Systems (EGS) under Different Geological Conditions in China. Gondwana Res. 2022. [Google Scholar] [CrossRef]
  54. Rivera Diaz, A.; Kaya, E.; Zarrouk, S.J. Reinjection in Geothermal Fields−A Worldwide Review Update. Renew. Sustain. Energy Rev. 2016, 53, 105–162. [Google Scholar] [CrossRef]
  55. He, M.; Zhang, L.; Yuan, Y.; Zhang, J.; Gao, Y. Study on the Relationship between Re-injection Volume and Temperature of Sandstone Geothermal Reservoir in Nanzhan Area of Dongying City. Shandong Land Resour. 2018, 34, 44–48. (In Chinese) [Google Scholar]
Figure 1. Preparation of water and rock samples. (a) Geothermal fluid collected from the sandstone geothermal reservoir; (b) Ground sandstone specimens filling stainless-steel pipes; (c) Stainless-steel pipe ends are blocked with filtered cotton; (d) Sandstone samples and fluid samples after the experiment for major elements and mineral analysis.
Water 14 03131 g001
Figure 2. Experimental setting for water–rock displacement. (a) diagram for displacement instrument; (b) photo demonstration of replacement equipment.
Water 14 03131 g002
Figure 3. Mineral composition under different temperature and flow rate conditions.
Water 14 03131 g003
Figure 4. Contour plot of permeability variation for different temperatures and flow conditions. (a) Contour of permeability change values; (b) Percentage change in permeability after the experiment compared to the initial permeability. Note that all contour plots in this study are drawn using OriginPro 2022b and interpolated using the default algorithm, copyright © 1991–2022 OriginLab Corporation.
Water 14 03131 g004
Figure 5. Contour plot of porosity variation under different conditions. (a) Porosity variation under different temperature and flow rate conditions; (b) Porosity variation under different temperature and differential pressure conditions.
Water 14 03131 g005
Figure 6. Mineral precipitation and dissolution under different temperature and flow conditions. Positive numbers indicate mineral dissolution; negative numbers indicate precipitation.
Water 14 03131 g006
Figure 7. Piper diagram of water samples in the displacement experiment. Orange arrows represent the move trend of major ions.
Water 14 03131 g007
Figure 8. Contour plots of the major elemental compositions of water after the displacement experiment under different temperature and flow conditions.
Water 14 03131 g008
Figure 9. Contour plots of major elemental compositions of ground sandstone specimens after the displacement experiment under different temperature and flow conditions.
Water 14 03131 g009
Table 1. Experimental design of variables for core sample displacement experiments.
Temperature (°C)Flow Rate (mL/min)Length of Core Sample
(cm)
Displacement Fluid
450.56in situ geothermal fluid
451.06in situ geothermal fluid
451.56in situ geothermal fluid
550.56in situ geothermal fluid
551.06in situ geothermal fluid
551.56in situ geothermal fluid
650.56in situ geothermal fluid
651.06in situ geothermal fluid
651.56in situ geothermal fluid
Table 2. Experimental program setting related parameters.
ParameterValue
core length (cm)6
core diameter (cm)1.6
fluid viscosity (mPa. s)0.595
fluid density (g/cm3)0.991
Table 3. Contents of major elements in water before and after displacement experiments. a Referenced in [45]; b 45—05 denotes 45 °C and 0.5 mL/min condition.
Sample IDTypepHKNaCaMgClSO4HCO3Si
mg/L
yuan-1 (water) aNa-Cl-SO47.7338.8403035170.14210272013921.88
45—0.5 bNa-Cl7.8929.8290033165.4467010101157.22
45—1Na-Cl7.4430.8322039380.25290114012012.29
45—1.5Na-Cl7.4829.8313036580.75100113012515.67
55—0.5Na-Cl7.4528.8272034567.55340122012011.15
55—1Na-Cl7.335.1331039886.75340121011012.53
55—1.5Na-Cl7.2429.5301037877.85360130011015.69
65—0.5Na-Cl7.2631.5299035468.54980114011012.03
65—1Na-Cl7.1826.6274029963.4489011009913.45
65—1.5Na-Cl7.1727.1298034370.65410127010416.62
Table 4. Contents of major elements in ground sandstone specimens before and after water–rock interaction (in wt%). a Referenced in [45]; b 45—05 denotes 45 °C and 0.5 mL/min condition.
Sample IDSiAlFeKCaMgTiNaCl
yuan-1 (rock) a26.6510.912.872.0710.910.5520.4410.7510.0895
45—0.5 b26.437.435.312.661.210.8350.6330.7690.608
45—128.487.695.152.731.190.8760.5890.80.377
45—1.529.357.264.622.810.9990.810.560.7820.273
55—0.529.077.44.722.71.10.8320.5850.7620.382
55—128.467.484.982.551.210.8350.610.710.39
55—1.527.987.565.032.61.240.8860.5950.6920.409
65—0.526.597.15.512.881.120.7630.5810.8450.44
65—126.877.225.522.831.220.7590.6390.7780.337
65—1.526.357.365.272.31.230.8070.6250.6690.248
Table 5. Mineral composition in ground sandstone specimens before and after displacement experiment (in %). a Referenced in [45]; b 45—05 denotes 45 °C and 0.5 mL/min condition.
Sample IDQuartzAlbiteMicroclineMontmorilloniteCalciteMuscovite
yuan-1 (rock) a0.660.110.0700.10.06
45—0.5 b0.410.210.230.1500
45—10.550.180.090.1800
45—1.50.460.250.090.200
55—0.50.550.180.090.1800
55—10.460.30.050.1900
55—1.50.530.170.080.2200
65—0.50.540.170.070.2200
65—10.570.160.070.200
65—1.50.540.190.080.1900
Table 6. Mineral volume and porosity change under different conditions. a. Referenced in the National Infrastructure of Mineral, Rock and Fossil for Science and Technology (http://www.nimrf.net.cn, accessed on 14 September 2022). a 45—05 denotes 45 °C and 0.5 mL/min condition.
Sample IDMineral Volume Change (cm3/100 g)Total Volume Change (cm3/100 g)Porosity Change
(%)
QuartzAlbiteMicroclineMuscoviteMontmorilloniteCalcite
45—0.5 a−9.433.7246.178−2.151−3.6906.3831.014.52
45—1−4.1512.6070.772−2.151−3.6907.6601.0474.69
45—1.5−7.5475.2140.772−2.151−3.6908.5111.1094.96
55—0.5−4.1512.6070.772−2.151−3.6907.6601.0474.69
55—1−7.5477.076−0.772−2.151−3.6908.0851.0014.48
55—1.5−4.9062.2350.386−2.151−3.6909.3621.2365.53
65—0.5−4.5282.2350−2.151−3.6909.3621.2285.50
65—1−3.3961.8620−2.151−3.6908.5111.1365.08
65—1.5−4.5282.980.386−2.151−3.6908.0851.0824.84
Density a2.65 g/cm3average 2.685 g/cm3average 2.59 g/cm3average 2.79 g/cm3average 2.35 g/cm32.71 g/cm3--
Publisher’s Note: MDPI stays neutral with regard to jurisdictional claims in published maps and institutional affiliations.

