
Relationship between Chlorophyll a and Environmental Factors in Lakes Based on the Random Forest Algorithm
by
 ,
,
Hanjie Huang
1,
Wei Wang
1,
Junping Lv
1,
Qi Liu
1,
Xudong Liu
1,
Shulian Xie
1,
Fei Wang
2,* and
Jia Feng
1,* 1
Shanxi Key Laboratory for Research and Development of Regional Plants, School of Life Science, Shanxi University, Taiyuan 030006, China
2
School of Physical Education, Shanxi University, Taiyuan 030006, China
*
Authors to whom correspondence should be addressed.
Water 2022, 14(19), 3128; https://doi.org/10.3390/w14193128
Submission received: 2 September 2022
/
Revised: 23 September 2022
/
Accepted: 30 September 2022
/
Published: 4 October 2022
(This article belongs to the Special Issue Water Pollution and Its Impact on Human Health)
Abstract
:Chlorophyll a concentration is an important indicator to characterize phytoplankton biomass, which further reflects the water quality of lakes. Based on the data of chlorophyll a concentration and environmental factors extracted from the ChlaData, HydroLAKES, and HELLAKES databases for Chinese lakes for three years (2000, 2005, and 2010), we used the random forest model and the generalized linear model to analyze the relationship between chlorophyll a concentration and environmental factors in Chinese lakes and predict the chlorophyll a concentration. The results showed that the relative importance of environmental factors for chlorophyll a was as follows: nutrient salt concentration > longitude and latitude > monthly mean precipitation > altitude > annual average temperature. The coefficient of determination of the random forest model was 0.9997 (R2 = 0.9997), and the root-mean-square error was 0.0010 (RMSE = 0.0010), with high prediction accuracy. The random forest model and the generalized linear model both showed that TP was the main influencing factor of chlorophyll a concentration. The validation results based on the measured data show that the models are reliable. By making more accurate predictions of chlorophyll a concentrations, we can facilitate the prevention, control, and treatment of lake blooms.
1. Introduction
Lake eutrophication is a global problem, which seriously affects people’s lives and health. With the continuous development of society and the advancement of industrialization, the content of nitrogen and phosphorus in lakes exceeds the norm, which promotes the rapid growth of phytoplankton such as algae, destroys the ecological balance of lakes, and causes the deterioration of lake water quality.
Chlorophyll a is the core photosynthetic pigment for photosynthesis of phytoplankton, which exists in all phytoplankton, and the content is relatively stable. By measuring the concentration of chlorophyll a in water, it can be used to characterize the biomass of phytoplankton, preliminarily determine the eutrophication degree of water, and reflect the water quality of lakes [1,2]. Chlorophyll a concentration is closely related to environmental factors. In recent years, there have been many reports on the spatial and temporal distribution of chlorophyll a and its relationship with environmental factors. Most studies have shown that nutrients such as nitrogen and phosphorus, water temperature, precipitation, and longitude and latitude of lakes are the main factors affecting chlorophyll a concentration. In addition to environmental factors, natural properties of lakes, physicochemical properties of water, and human activities have direct or indirect effects on chlorophyll a concentration [3,4,5]. However, there is no generally accepted conclusion on the relationship between chlorophyll a concentration and environmental factors.
In recent years, many scholars have begun to try to use machine learning methods for the inversion of chlorophyll a concentration because machine learning can predict the target variable with high prediction accuracy by training the dataset and continuously mining data to adjust the model’s parameters and improve the model’s performance. Nisaul et al. predicted chlorophyll a concentration in a tropical reservoir by combining band ratios with machine learning [6]. Tang and Huang predicted the chlorophyll a concentration in East Lake based on machine learning [7]. Deng et al. constructed a statistical model correlating chlorophyll a concentration with the key driving variables based on multiple linear regression [2]. Xu et al. found that random forests had better predictions for low sample size data when they inverted the chlorophyll a concentrations in Taihu Lake [8]. The prediction results of chlorophyll a concentration in the Miyun Reservoir using the support vector machine and random forest models of Liao et al. also showed that random forests have a better predictive power [9]. Hang et al. conducted the inversion of chlorophyll a concentration in Taihu Lake based on the random forest algorithm [10]. Liu and Luo also used the random forest algorithm to build a model for the warning of water bloom [11]. In addition, the GLM can establish relationships between response variables and predictor variables by means of functions without changing the natural measure of the data. It has moderate data requirements and is suitable for use in data analysis where ecological and hydrological data are more abundant [12]. Therefore, this paper uses random forest models and generalized linear models to jointly predict the relationship between chlorophyll a concentrations in freshwater lake bodies and environmental factors.
With the increase in detection sites, the available monitoring data of lakes are also increasing. At the same time, more datasets, such as meteorological and geographical attributes, are published. In this paper, the data of chlorophyll a concentration and some environmental factors were collected from three databases, ChlaData, HydroLAKES, and HELLAKES, which were used for the following: (1) using the random forest model’s objective ranking of parameter importance, ranking the importance of environmental factors and analyzing the degree of influence of different environmental factors on chlorophyll a concentration; (2) modelling of the correlation between chlorophyll a concentration and environmental factors for the prediction of chlorophyll a concentration; (3) using the GLM on the predicted results of the random forest, further analysis of the relationship between chlorophyll a concentration and environmental factors. Through the prediction of chlorophyll a concentration, the relationship between chlorophyll a concentrations and environmental factors can be further understood to provide a reference for phytoplankton monitoring and lake water blooms.
2. Materials and Methods
2.1. Data Source
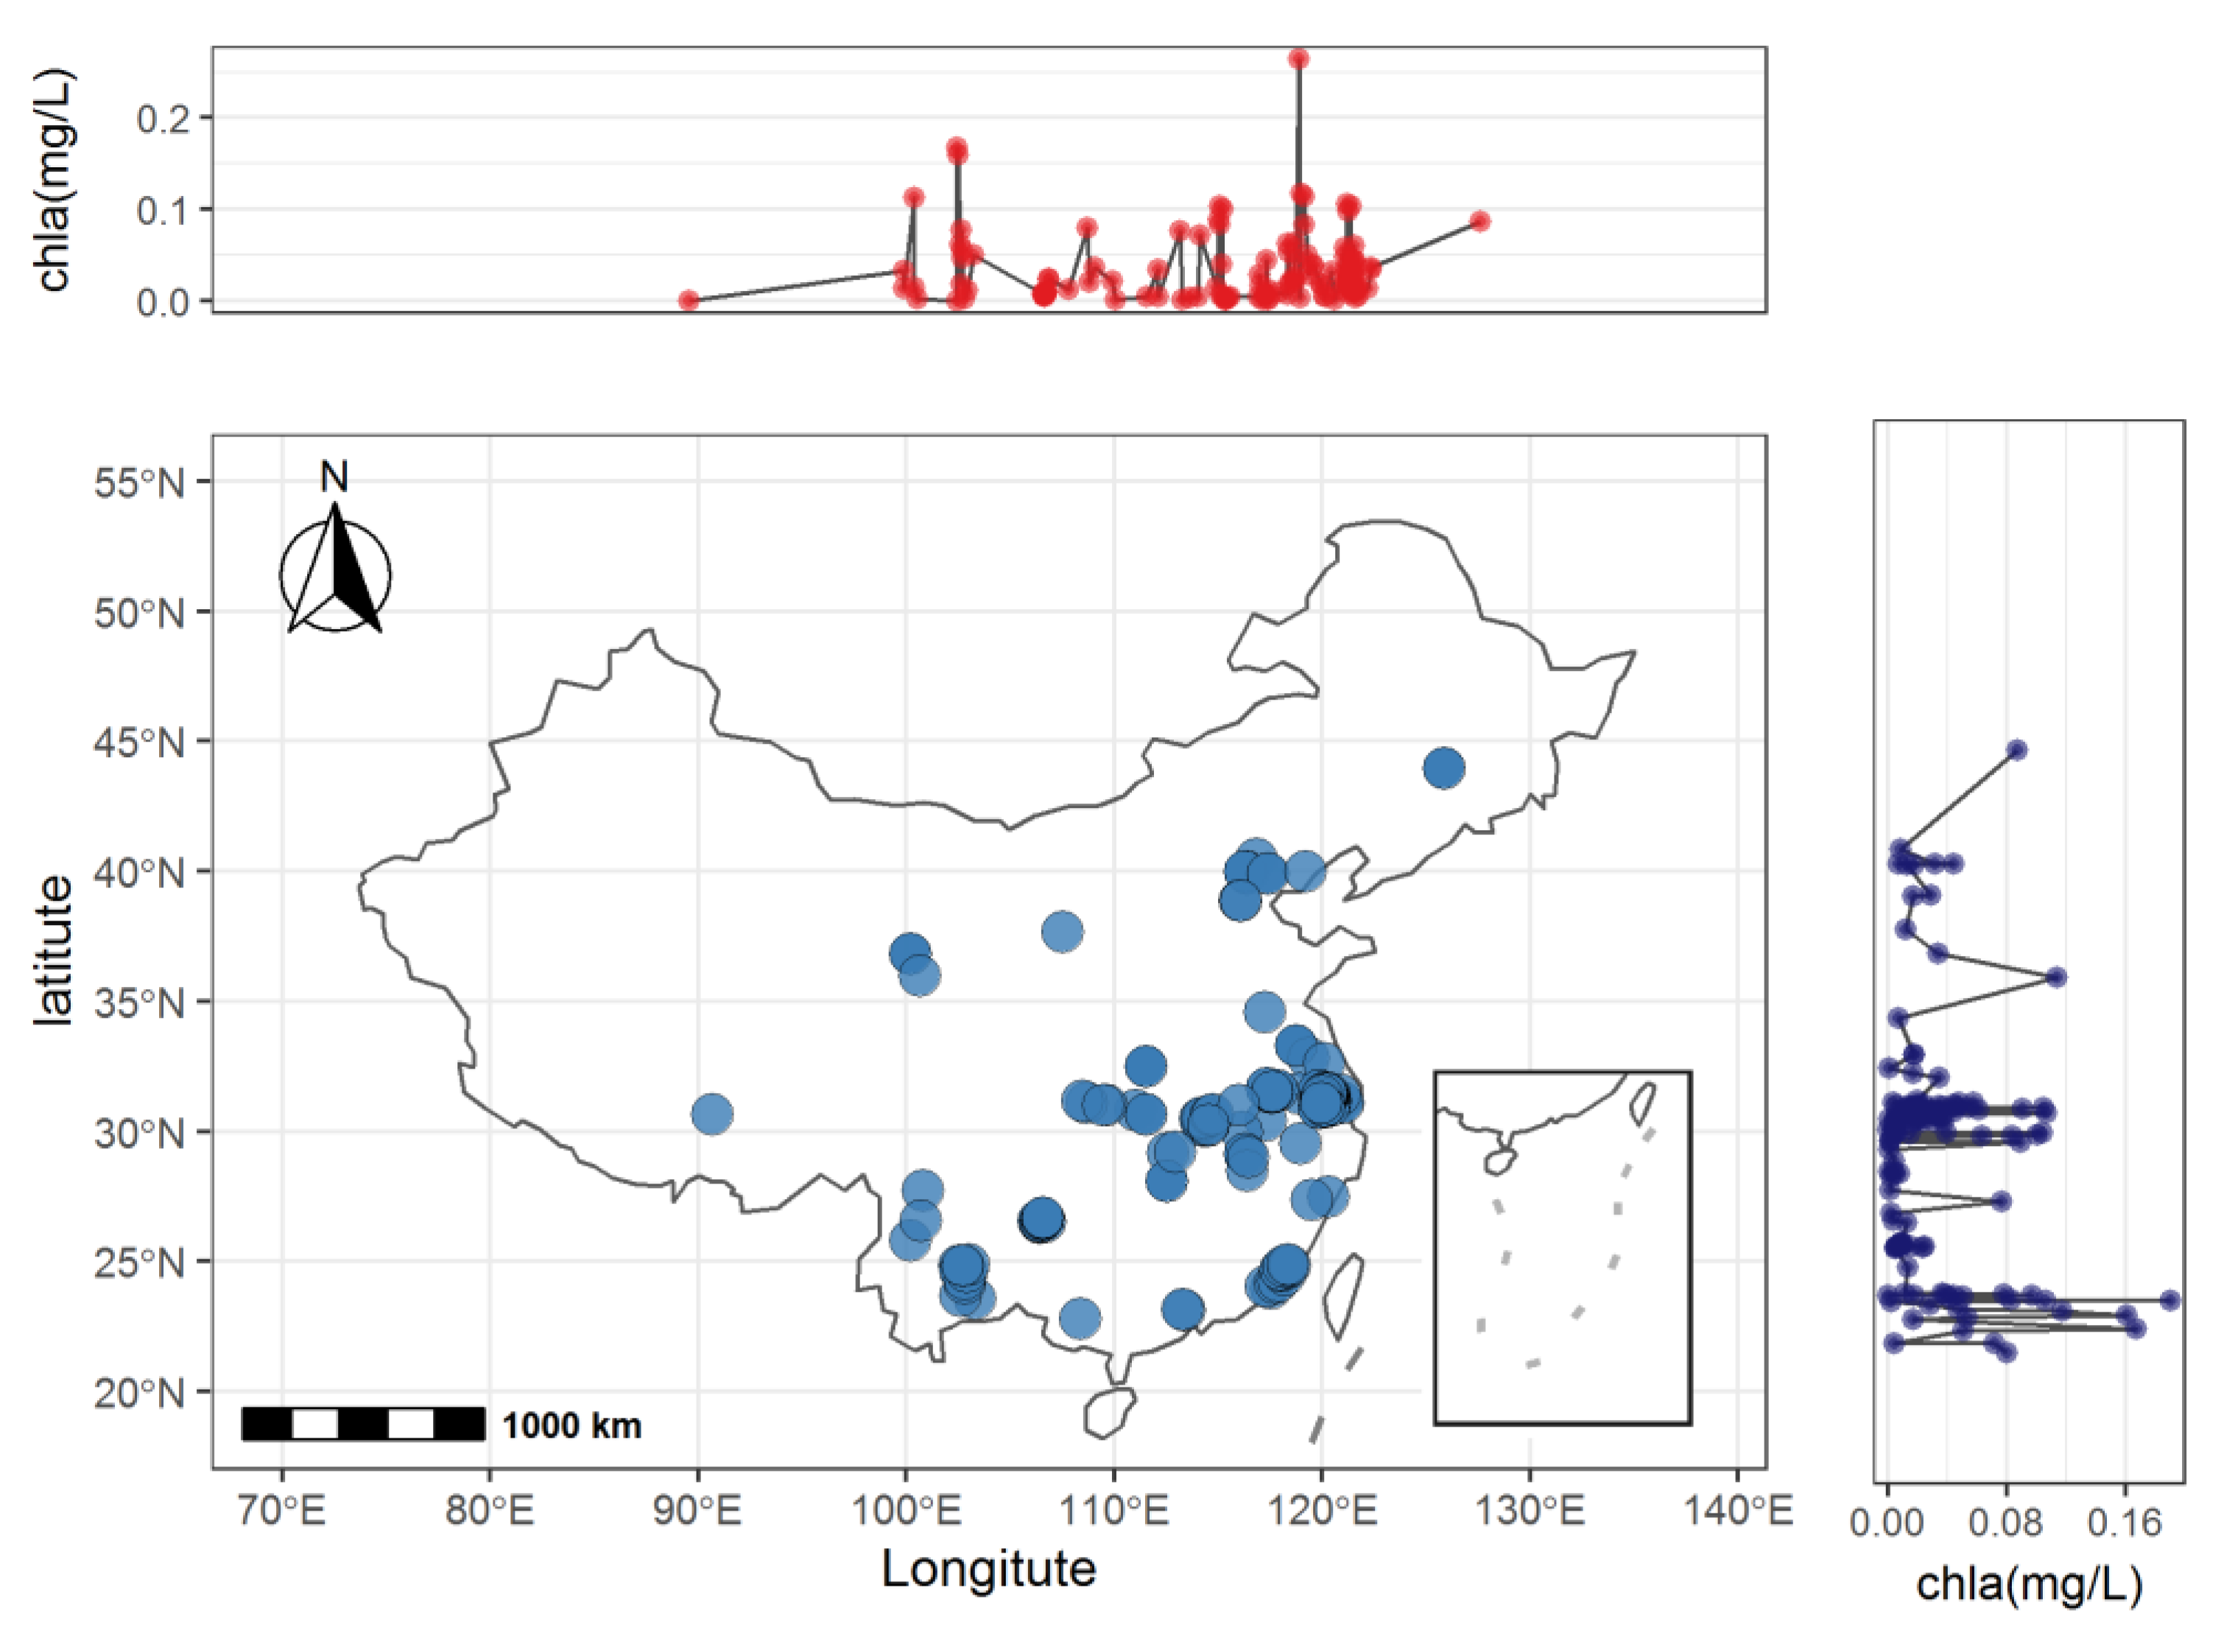
The average concentration of chlorophyll a in freshwater lakes (Chla), the year the lake was surveyed (Year), the latitude and longitude of the surveyed lakes (Lat, Long), and the average concentration of total phosphorus and total nitrogen in freshwater lakes (TP, TN) were obtained through the ChlaData.csv dataset in the Scientific Data database [13]. Chlorophyll a concentrations were all collected in freshwater lakes and measured using both satellite remote sensing and field sampling. The chlorophyll a values used are combined statistics (mean or median) obtained from multiple sampling at multiple depths in the water column at different points in the same lake or at the same location. Physicochemical data such as TP and TN were obtained by spectrophotometry, fluorescence photometry, or multiparameter water quality probes. The distribution of lakes is also indicated on the map (Figure 1).
The mean monthly basin-level precipitation (Precip_month), total annually accumulated basin-level precipitation (Precip_year), mean annual basin-level temperature (Temp_year), total basin-level human population (Pop_sum) (statistics obtained at five-year intervals since 2000), permanent water area (Permanent_km2), seasonal water area (Seasonal_km2), and total water area (Total_km2) were collected through the HydroLAKES database [14]. The precipitation and the average annual temperature were generated by using the GEOS atmospheric data assimilation system. The population data were consistent with the national census and population registration conducted at five-year intervals since 2000. Permanent, seasonal, and total water volumes were quantified with over 3 million Landsat images at a resolution of 30 m.
Through the HELLAKES database (obtained by combining the literature review with a constructed geostatistical model) [14,15], the lake surface area (Lake_area) (area of lake waters in the 30, 60, 90, and 120 m buffer zones at five-year intervals between 1995 and 2015), the length of the shoreline (Shore_len), the ratio between the shoreline length and the circumference of a circle with the same area (Shore_dev), the total lake volume (Vol_total), the average depth of the lake (Depth_avg), the long-term average flow through the lake (Dis_avg), the average residence time of the lake water (Res_time), the elevation of the lake surface (Elevation), the average slope within a 100 m buffer zone around the lake polygon (Slope_100), and the area of the watershed associated with the lake (Wshe_area) were obtained. The detailed description of the data can be found in the literature mentioned in the text. The datasets collected were combined and extracted to the dataset we needed (Supplementary Materials, data_all.csv). After cleaning the dataset and removing the missing values before modelling, a total of 192 data units (Supplementary Materials, data_model.csv) were collected for the years 2000, 2005, and 2010 for the analysis of the data in this experiment.
2.2. Machine Learning Method
The random forest model is a machine learning method based on the decision tree, which has high prediction accuracy, high tolerance to outliers, and a good fitting effect [16]. The basic principles of random forests are as follows [17]: (1) to determine the original sample dataset D and the number of variables M; (2) based on the original sample dataset D, to use the bootstrap resampling method to extract N sample units (Ntree) from it with the same number of samples in D as in the sub-training set to build Ntree decision trees (dataset not extracted as a test sample); (3) to determine the number of variables in tree nodes Mtry (m < M), where Mtry represents the number of variables used in making decisions at the decision tree nodes; (4) to let each tree grow to the maximum, generate all the decision trees in their entirety, and perform multiple iterations to obtain a random forest of n decision trees; (5) the final result of a random forest is the average of the results of each decision tree. The accuracy of the random forest model depends on Ntree and Mtry, with Ntree determining the overall size of the random forest and Mtry determining the growth of individual trees and both determining the accuracy of the random forest model at the macro- and microlevels.
The chlorophyll a concentration values in data_model.csv were used as output variables, and the rest of the variables were used as input variables. The bootstrap resampling method was used to extract 80% of the data collected and repeated 1000 times to obtain a total of 1000 decision trees for the construction of the random forest model; the data that were not extracted were used for cross-validation. The strength and relevance of the random forest model depend on the size of the Mtry value; if the Mtry value is sufficiently small, the relevance of the tree tends to decrease. Since the value of the parameter Mtry is fixed, the larger the value of the parameter Ntree, the smaller or more stable the error of the model and the higher the accuracy of the model. By adjusting the values of Mtry and Ntree to optimize the model, the final set of the three random forest model hyperparameters were Mtry = 18; Ntree = 1000; Min-n = 5.
The GLM [18] is based on the standard linear model and was developed to overcome the shortcomings of the standard linear model. The GLM can establish a relationship between the mathematical expectation of the response variable and the linear combination of predictor variables through a linking function without changing the natural measure of the data. The model assumes that the response variable is no longer confined to normal distribution. In addition, the GLM can be applied to nonlinear data, so this study used the GLM for further analysis based on the results of the random forest model. Confidence intervals for the effect estimates of the model’s variables were estimated from the effect values and p-values for each group of models obtained after 1000 times resampling.
In this study, Origin 2021 was used for violin plotting and correlation matrix plotting, and R 4.1.3 was used for the construction and analysis of the random forest model and the GLM. The collected data for each parameter were standardized using the log2 value, and dummy variables were used for non-numerical variables.
3. Results
3.1. Descriptive Statistics
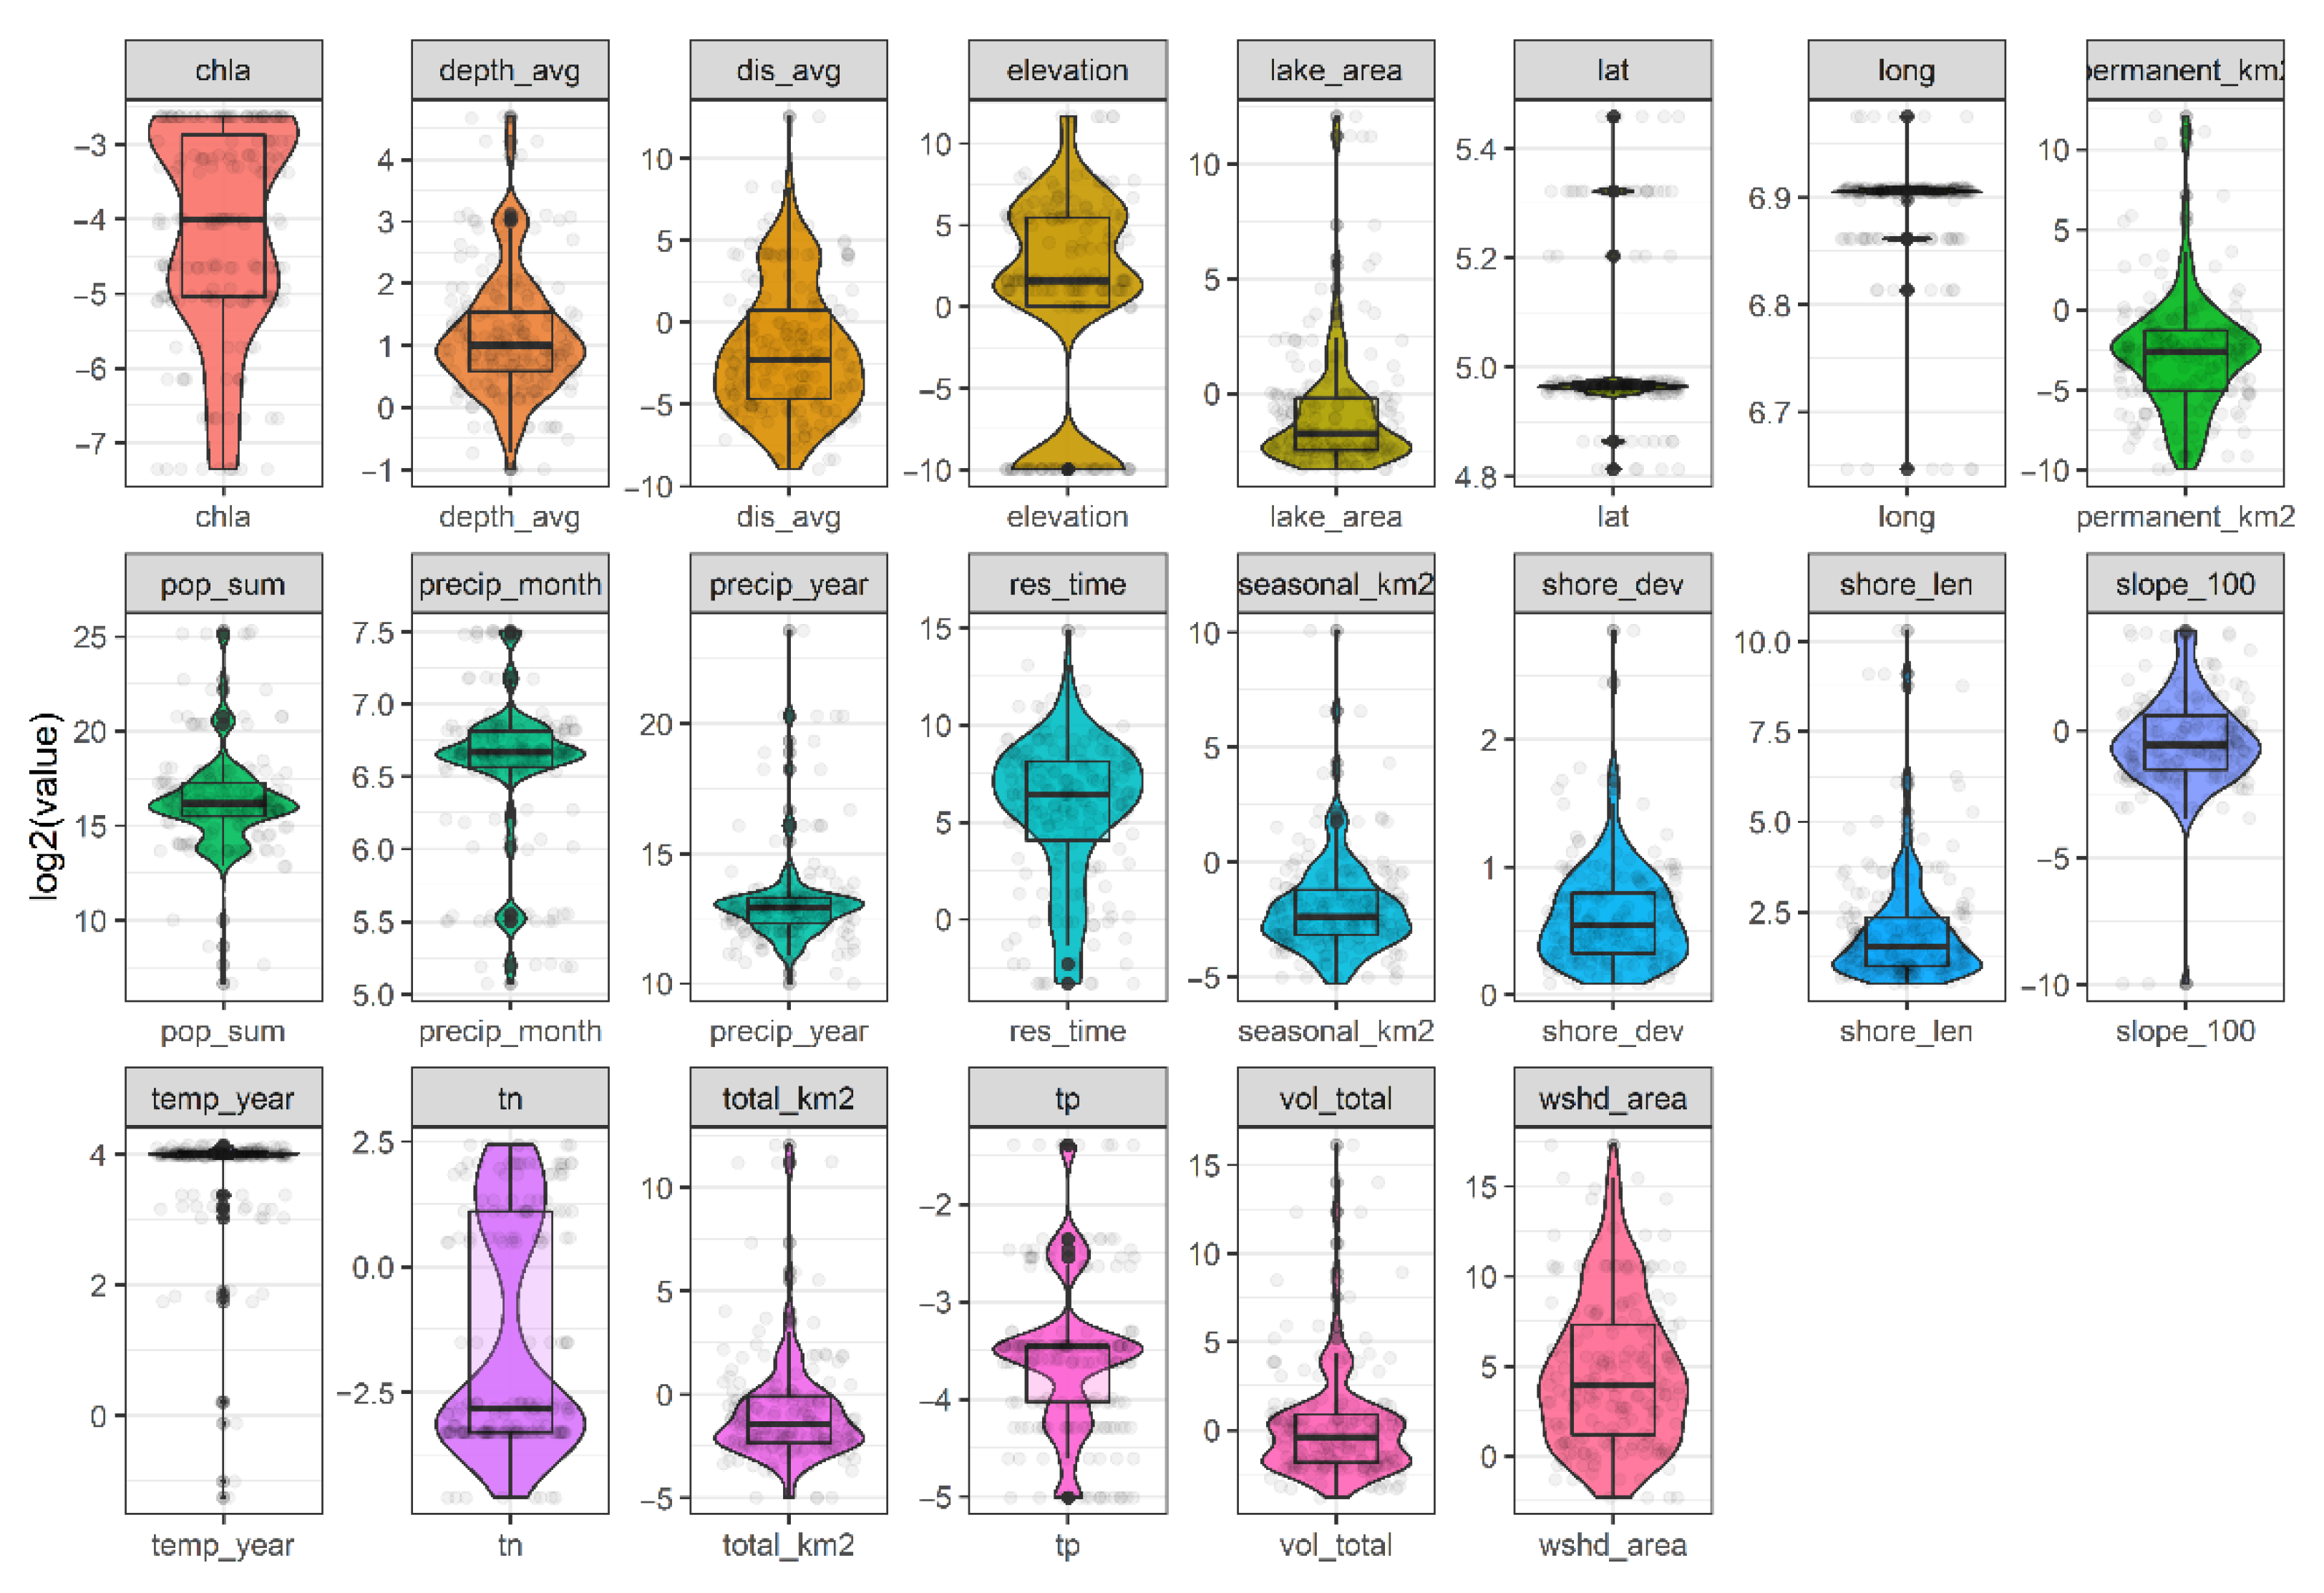
A violin diagram (Figure 2) was drawn to reflect the data distribution characteristics of each parameter. The values of chlorophyll a concentration ranged from 0.0051 mg/L to 0.168 mg/L, and the most frequent values were between 0.0071 and 0.0588 mg/L; the concentration values of TP were concentrated between 0.03–0.09 mg/L; the distribution range of TN concentration values was wider than that of TP, ranging from 0.04 to 5.4 mg/L, but still concentrated between 0.1 and 0.14 mg/L. The annual average temperature values were between 15.667 and 17.578 °C, but the annual average minimum temperature was −1.35 °C, and the annual average maximum temperature was 17.578 °C; the values of monthly precipitation ranged from 94.722 to 112.238 mL; the longitude and latitude values of the collected lakes ranged from 100°1898′ E to 125°065′ E and from 28°1121′ N to 43°9635′ N, and the elevation values of the lakes ranged from 3 to 44 m.
3.2. Correlation Analysis
Through the visual matrix diagram of the correlation between each parameter (Figure 3), it was found that the main factors affecting the concentration of chlorophyll a are TP, TN, Long, Lat, lake average depth, altitude, slope, and annual average temperature. The concentration of chlorophyll a had an extremely significant positive correlation with TP and lake longitude and an extremely significant negative correlation with TN (p < 0.001). It was significantly negatively correlated with altitude, lake latitude, lake average depth, and altitude, and also significantly positively correlated with annual average temperature (p < 0.01).
3.3. Quantitative Analysis
3.3.1. Random Forest Model Analysis
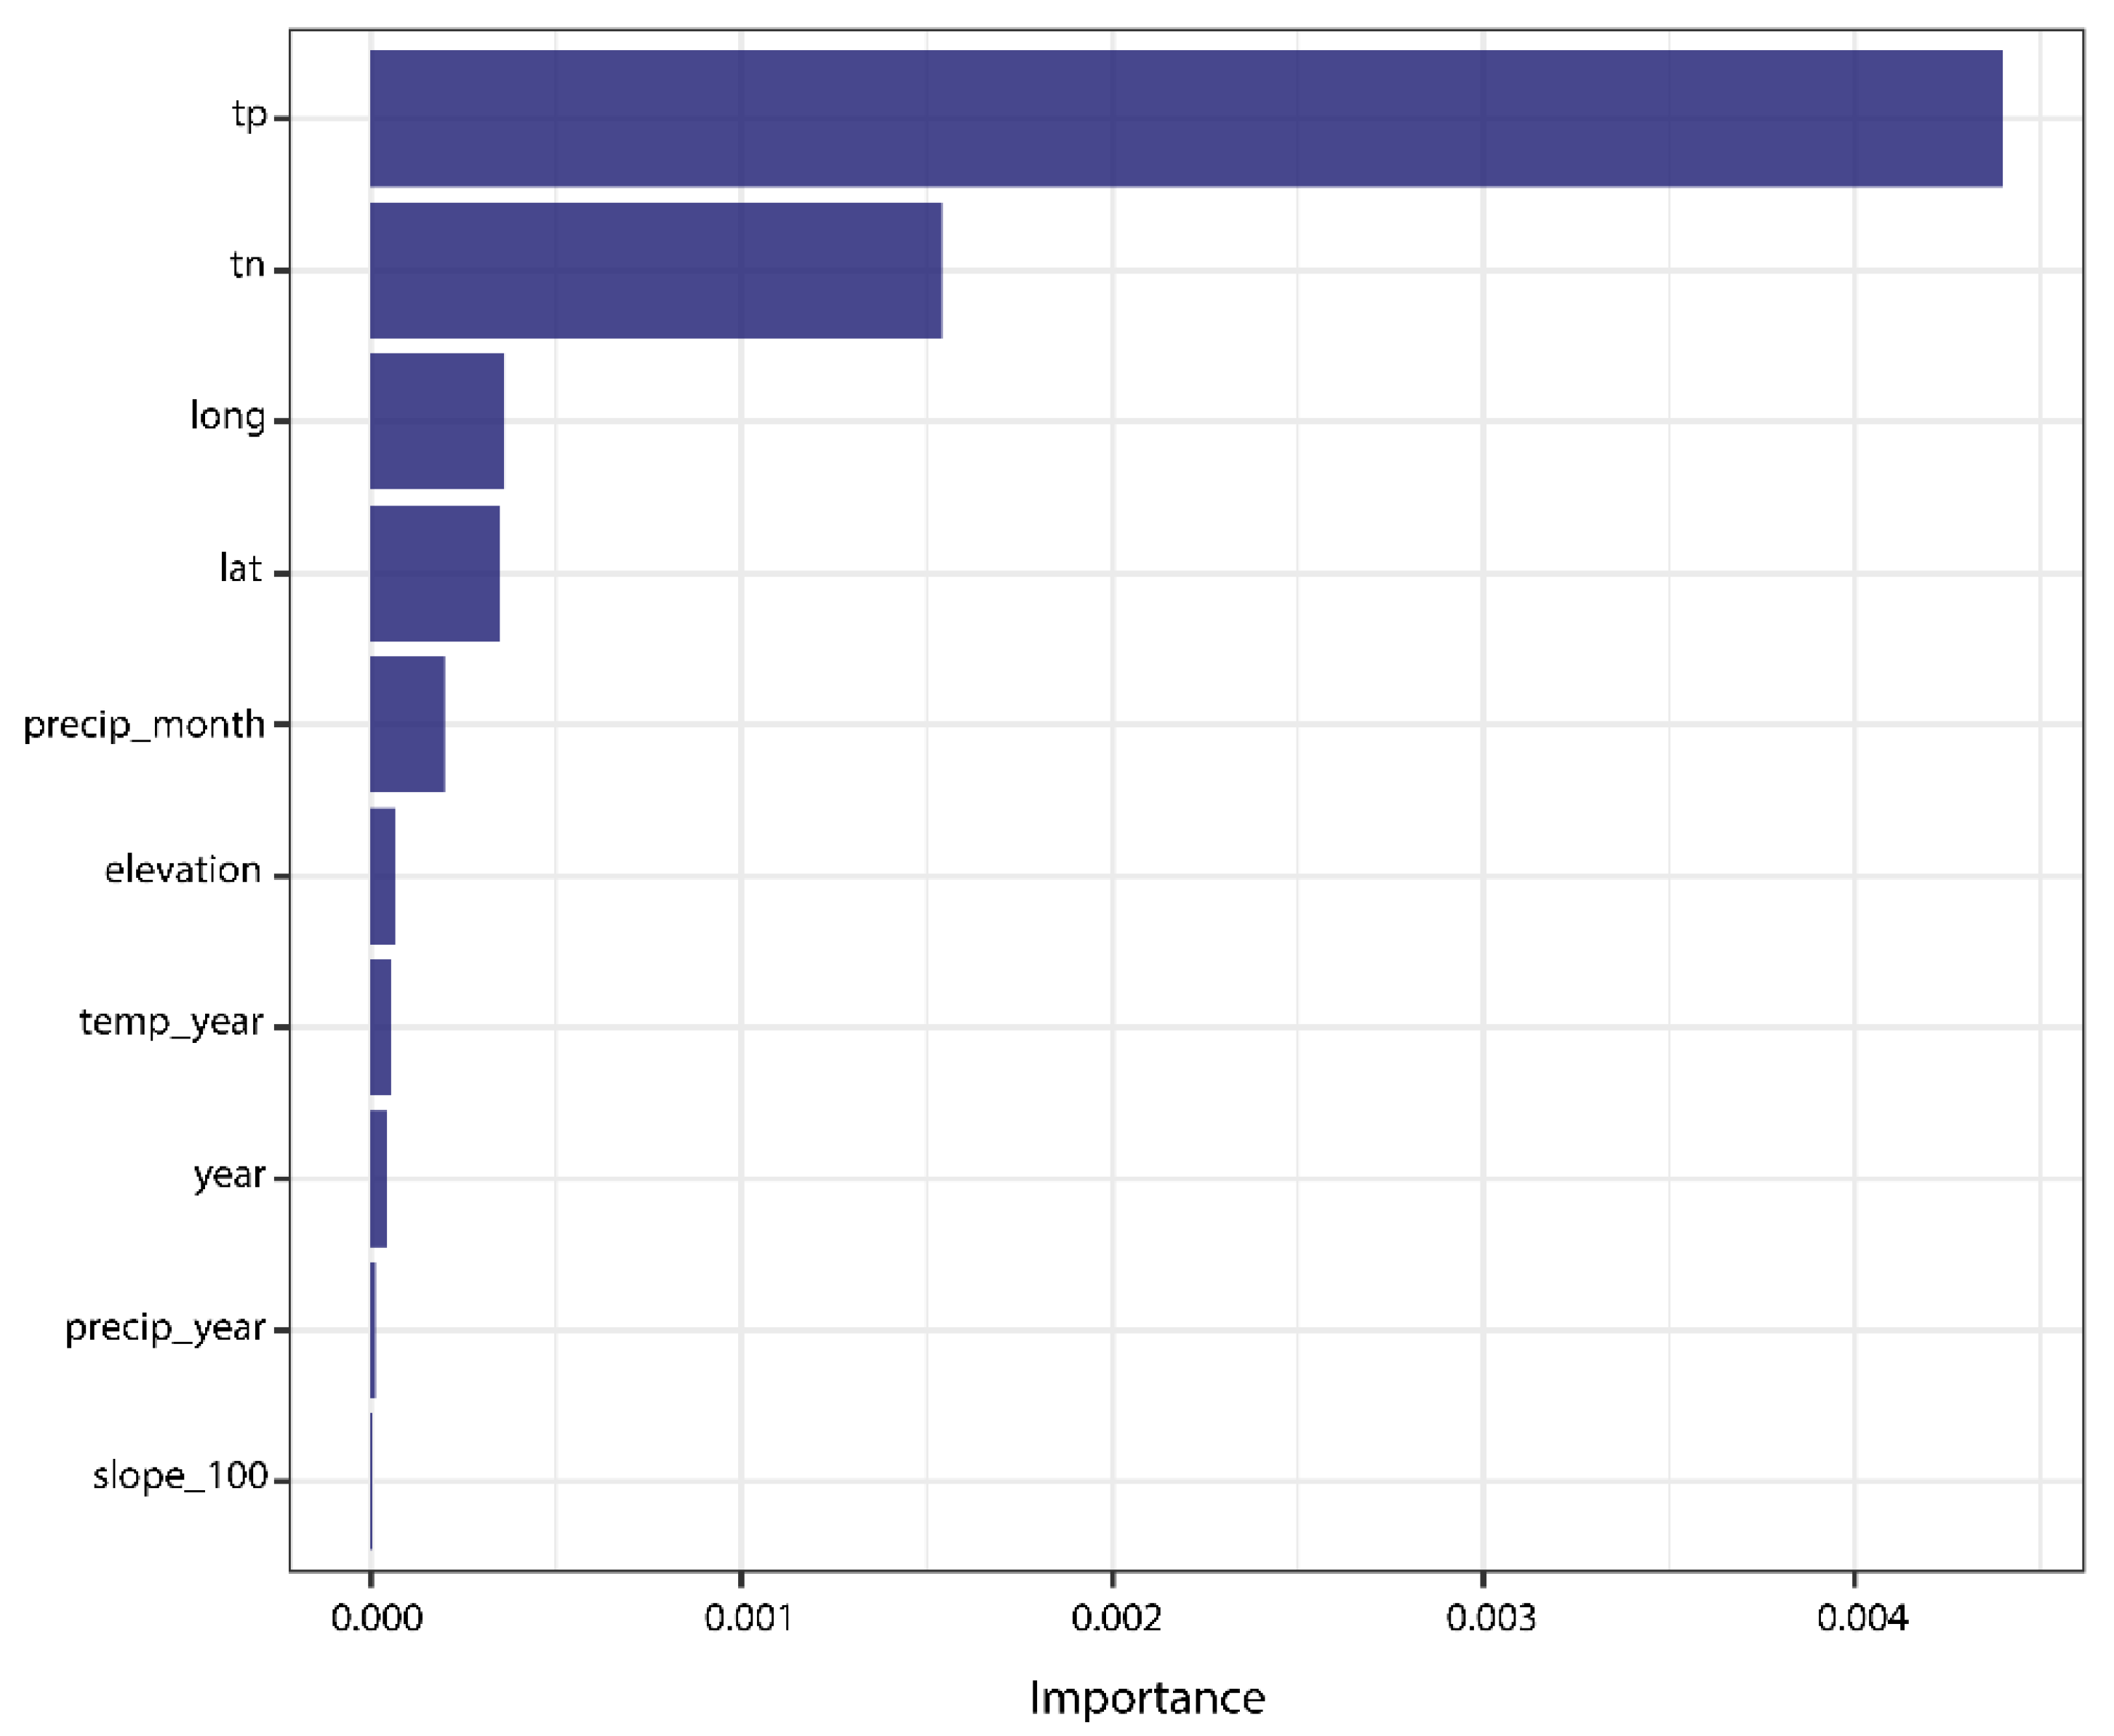
To reveal the relative importance of different parameters for chlorophyll a concentration, we ranked the relative importance of the parameters in the random forest model. The results of the random forest showed that TP and TN were the most important environmental factors, and the relative importance of TP was much greater than that of TN, followed by the longitude and latitude of the lake and the monthly mean precipitation. The altitude of the lake and the annual mean temperature also affected the concentration of chlorophyll a, but they did not play a major role (Figure 4).
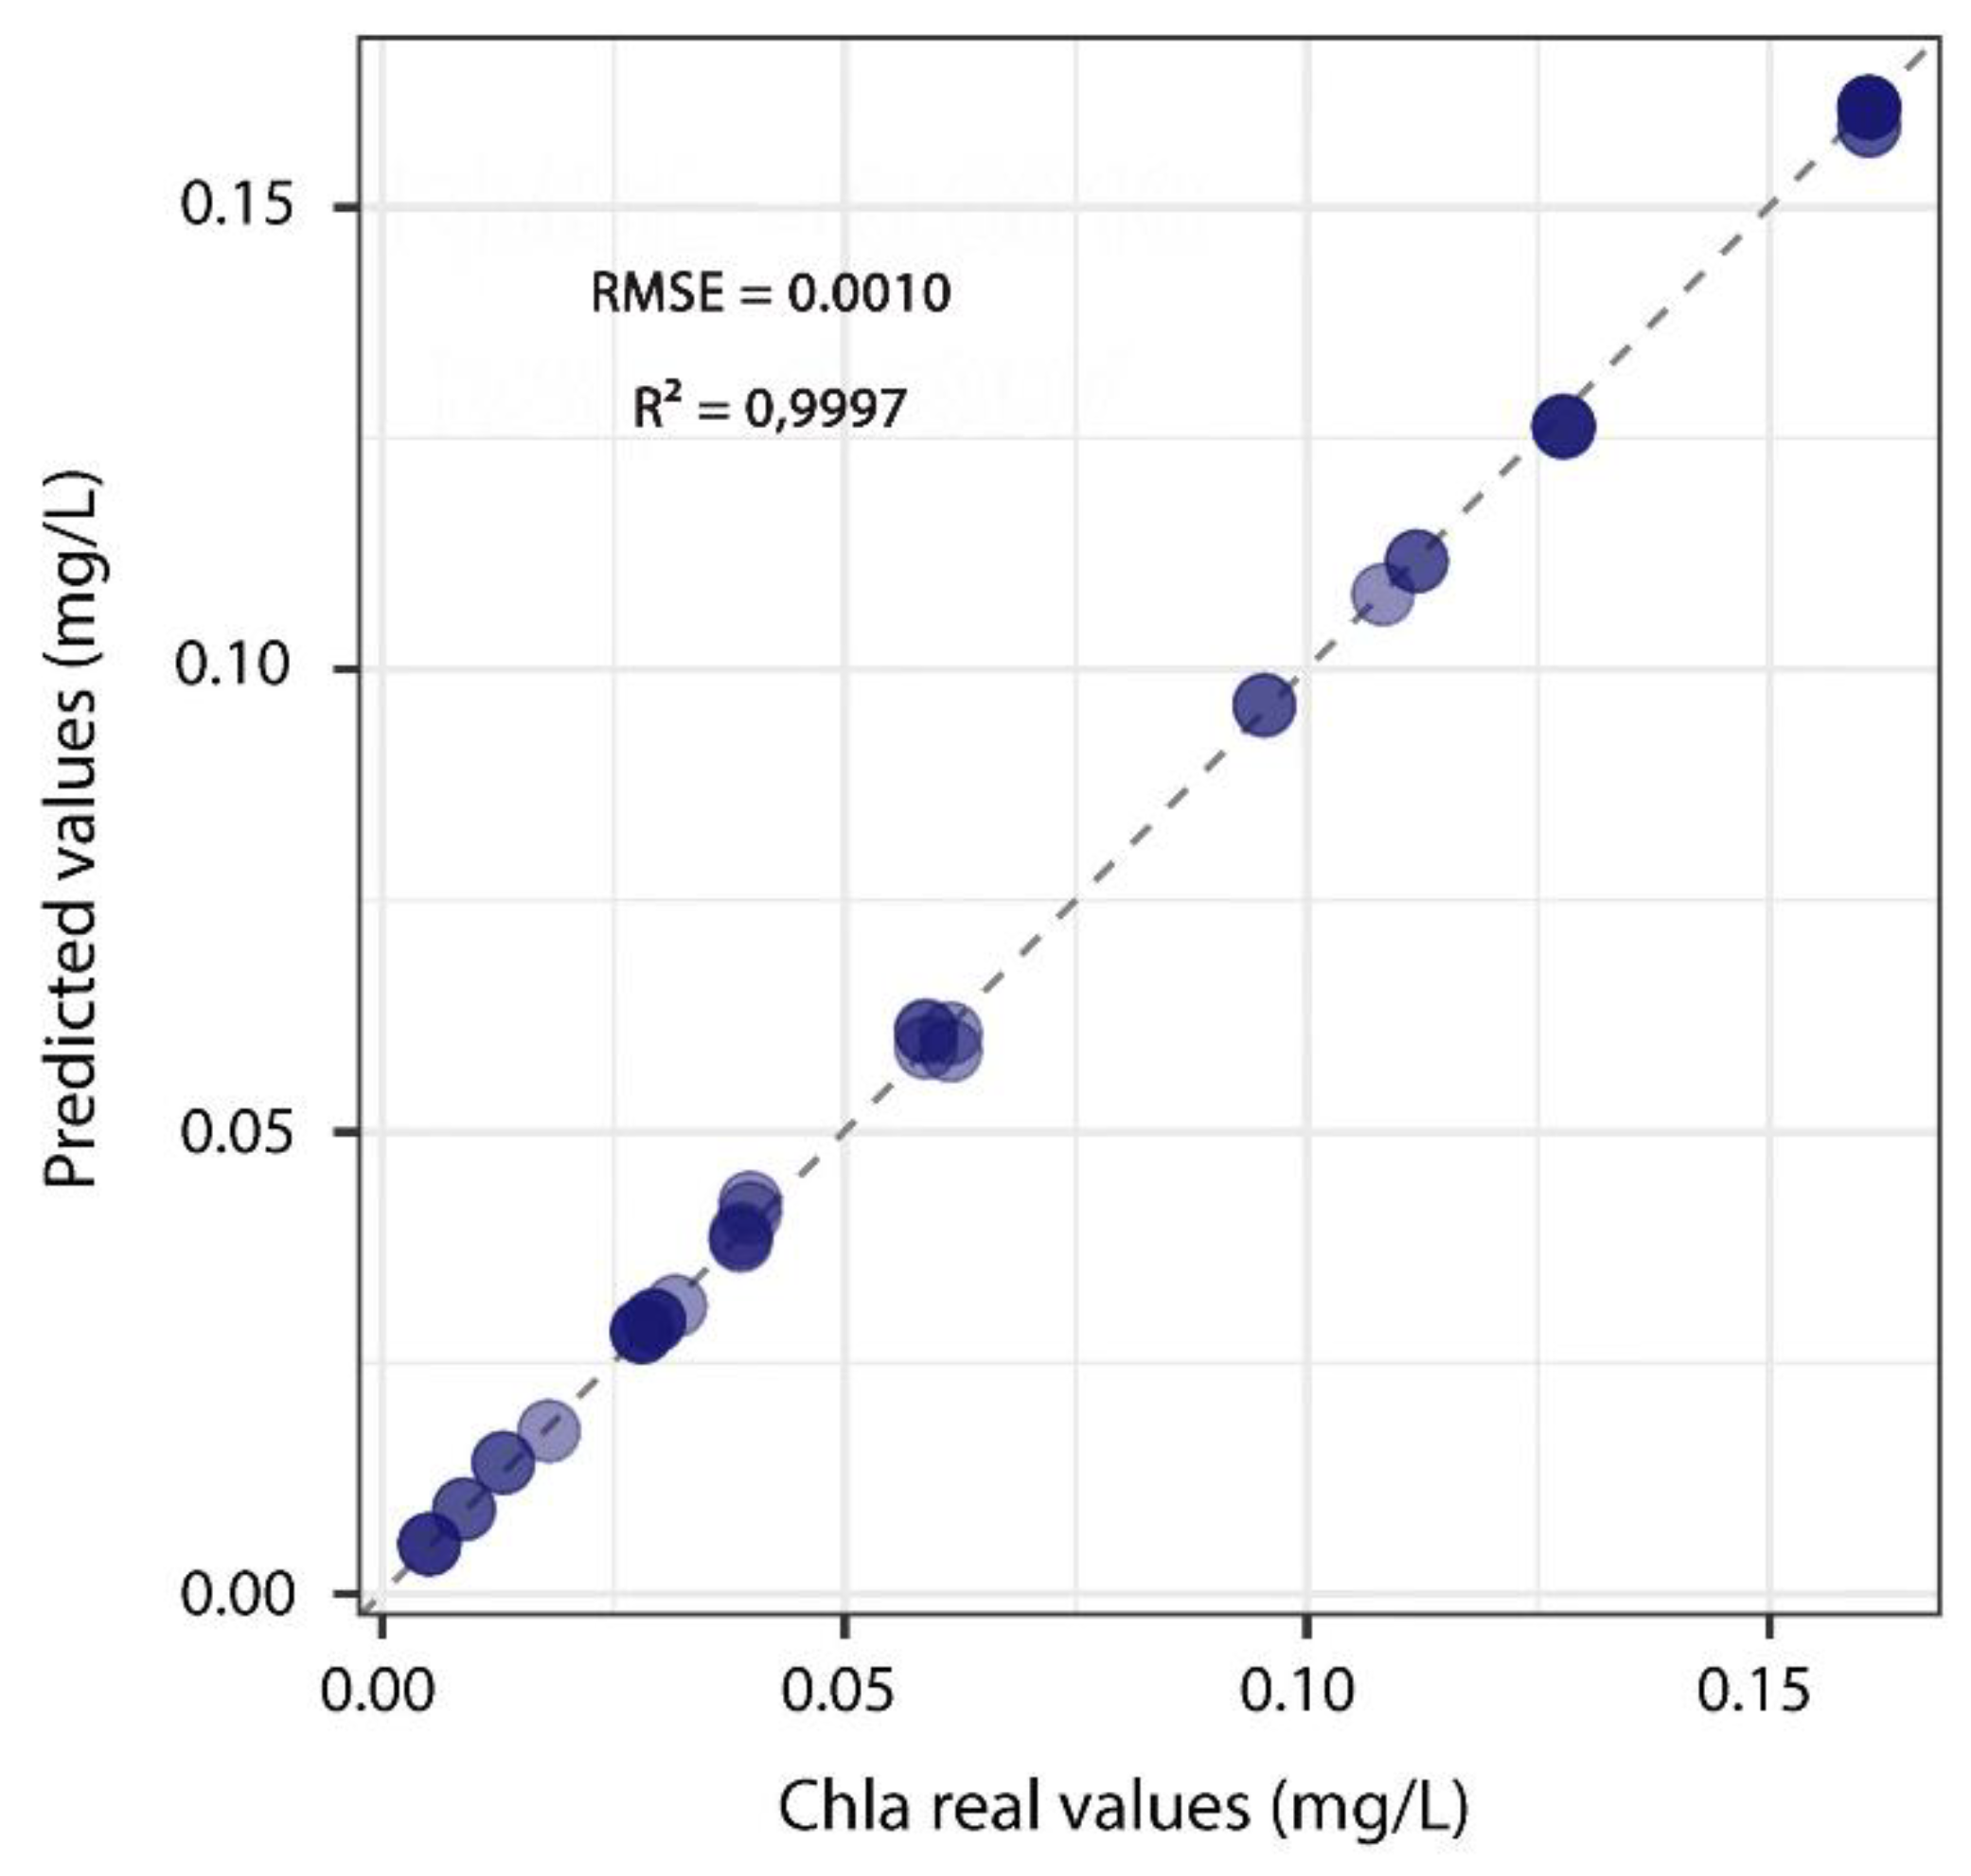
To further verify the prediction accuracy of the random forest model, the chlorophyll a concentration predicted using the cross-validation model was compared with the actual measured value. It can be seen that the performance of the model was very good. The root-mean-square error (RMSE) was low, with a value of 0.0010, and the correlation coefficient (R2) reached the level of 0.9997. The fitting degree was high (Figure 5), which also reflected the characteristics of high prediction accuracy of the random forest.
3.3.2. Analysis of Generalized Linear Model
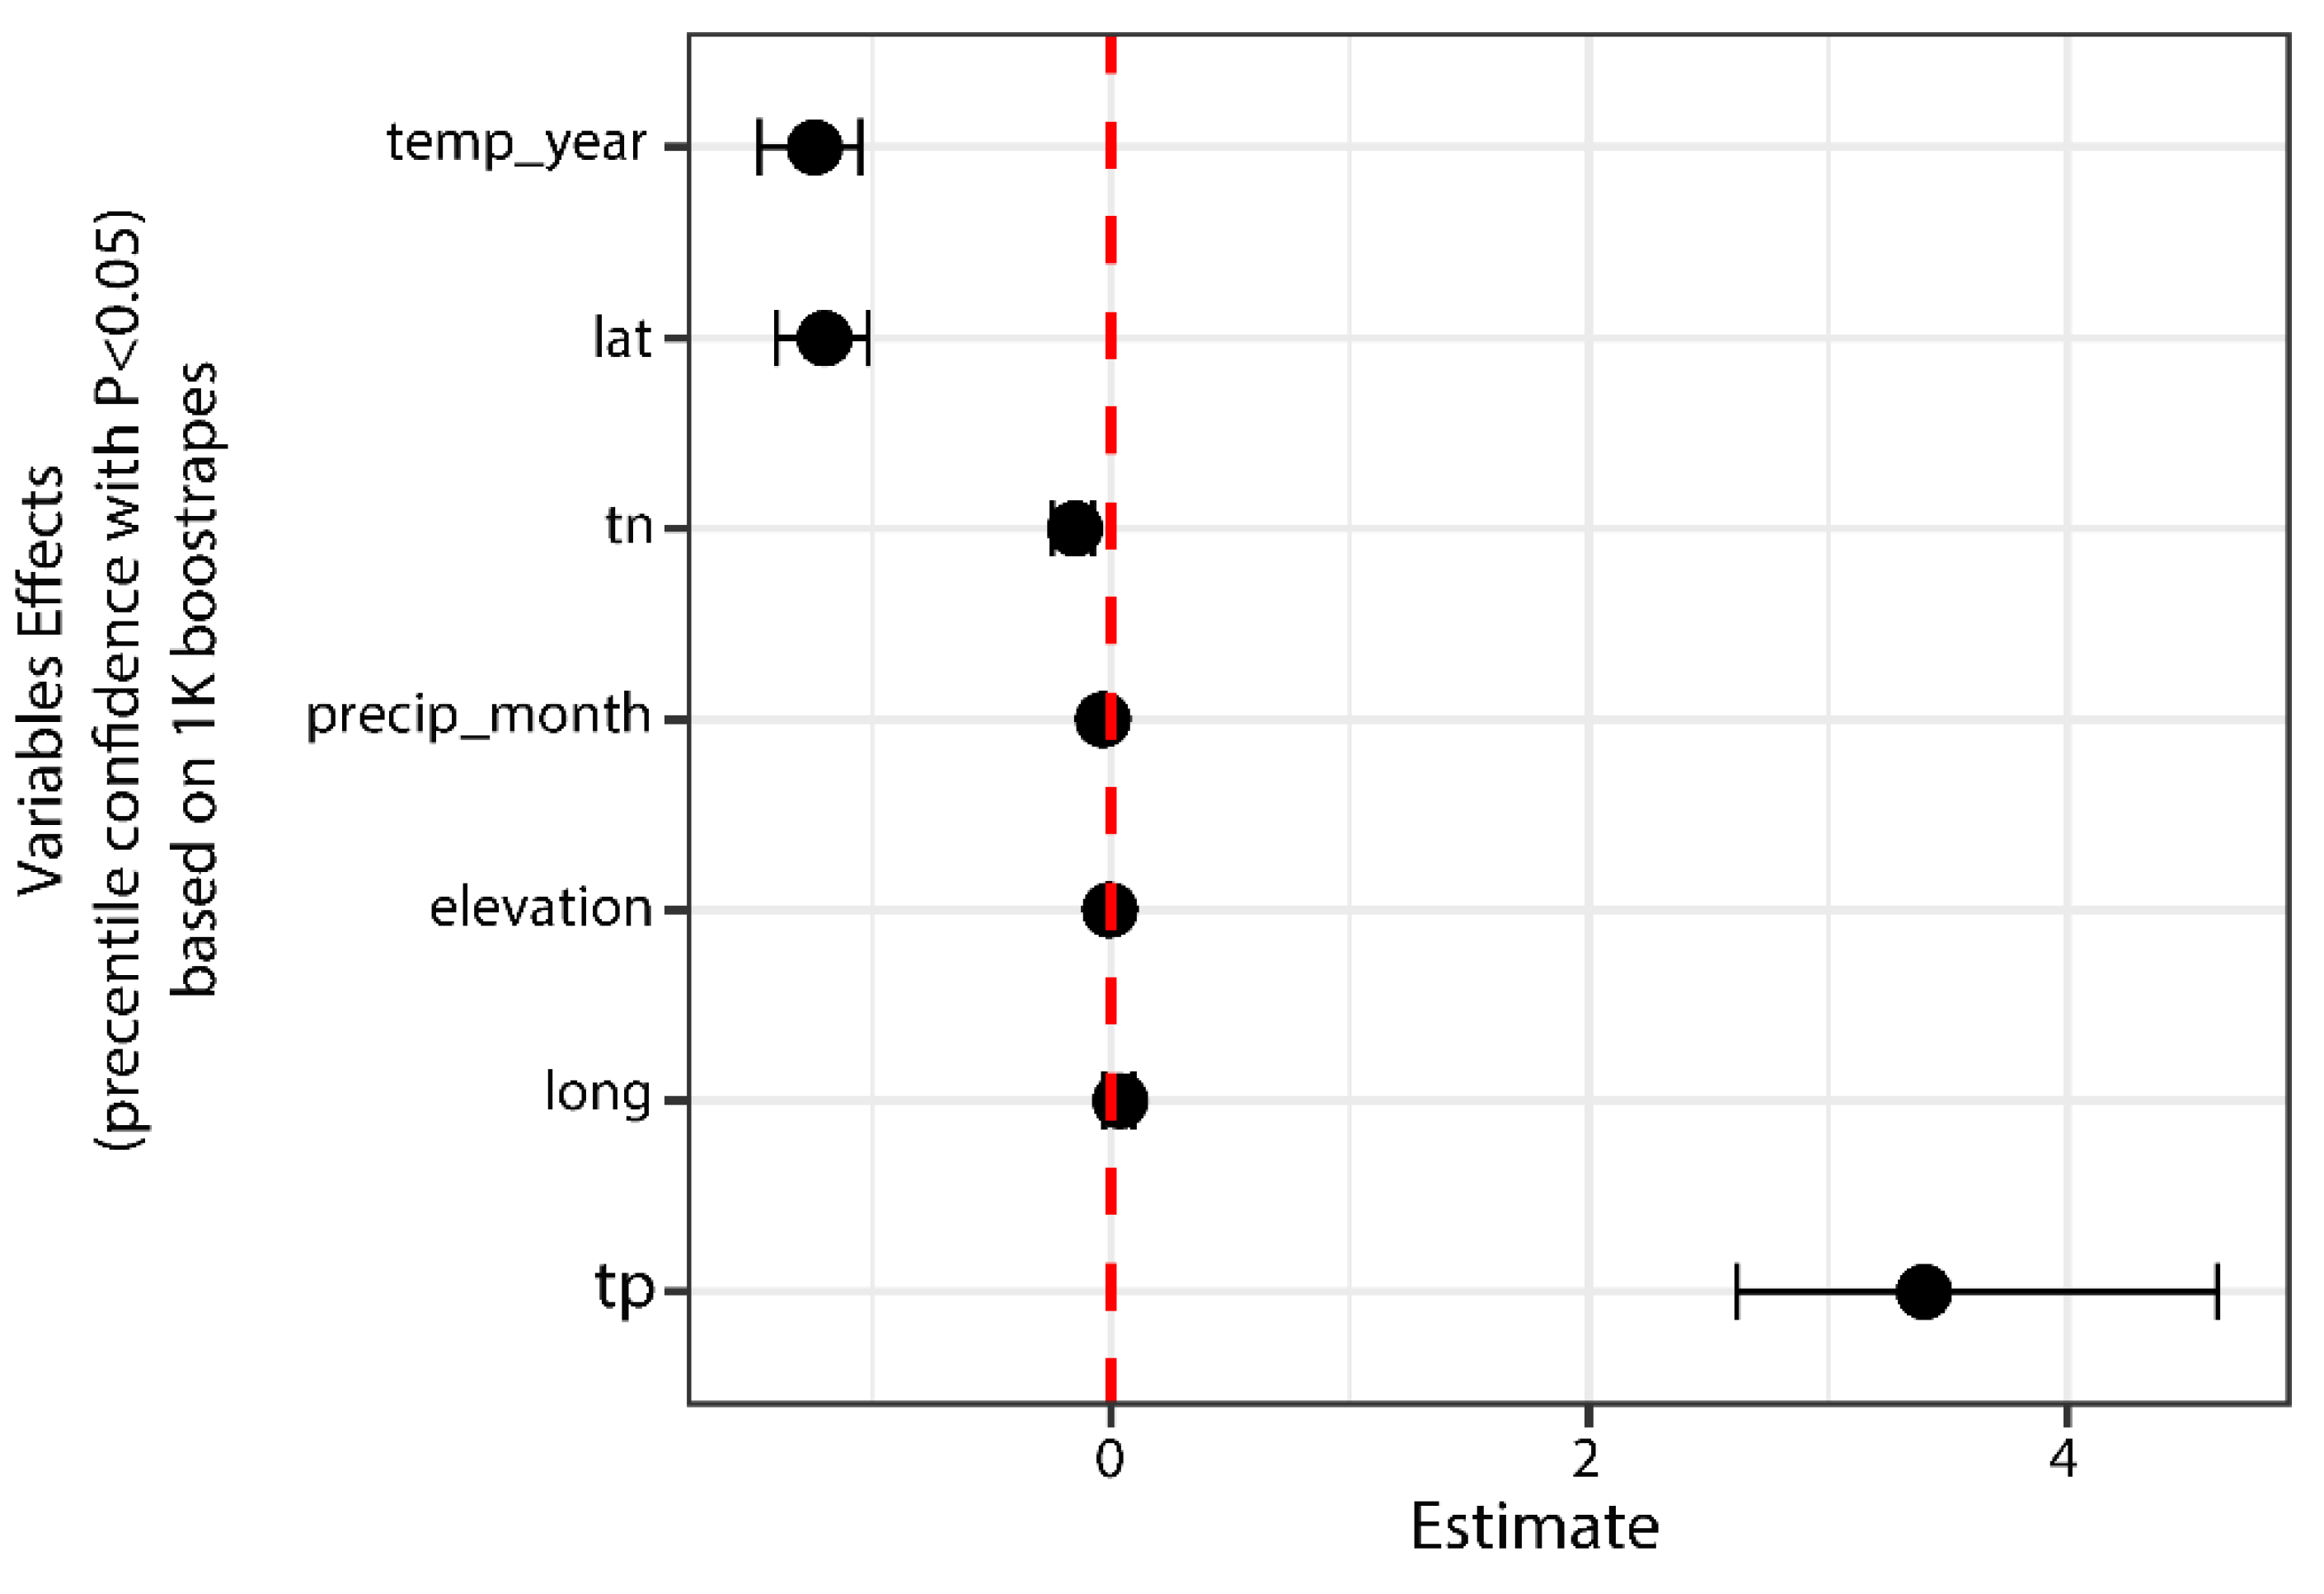
The GLM data were derived from the top seven important variables in the RF model variable importance ranking, and then these seven variables and chlorophyll a concentration were extracted from the dataset (data_model.csv) to form a new dataset (data_GLM.csv) for GLM modelling. After recleaning the data, the data were resampled in the bootstrap mode and a new dataset was formed by repeating data resampling 1000 times. Because the data obtained after each 1000 times resampling were different from each other, it was not practical to calculate the AIC and BIC for each set of models, but the effect size estimates and p-values for each set of models are inferential and can be used to reveal the intervals of the effect estimates for the variables, which are typically 95% confidence intervals. The results of the generalized linear regression analysis plot at p < 0.05 showed that chlorophyll a concentration was highly significantly negatively correlated with mean annual temperature and longitude, highly significantly positively correlated with TP, negatively correlated with TN, and showed no significant correlation with altitude, latitude, or mean monthly precipitation (Figure 6).
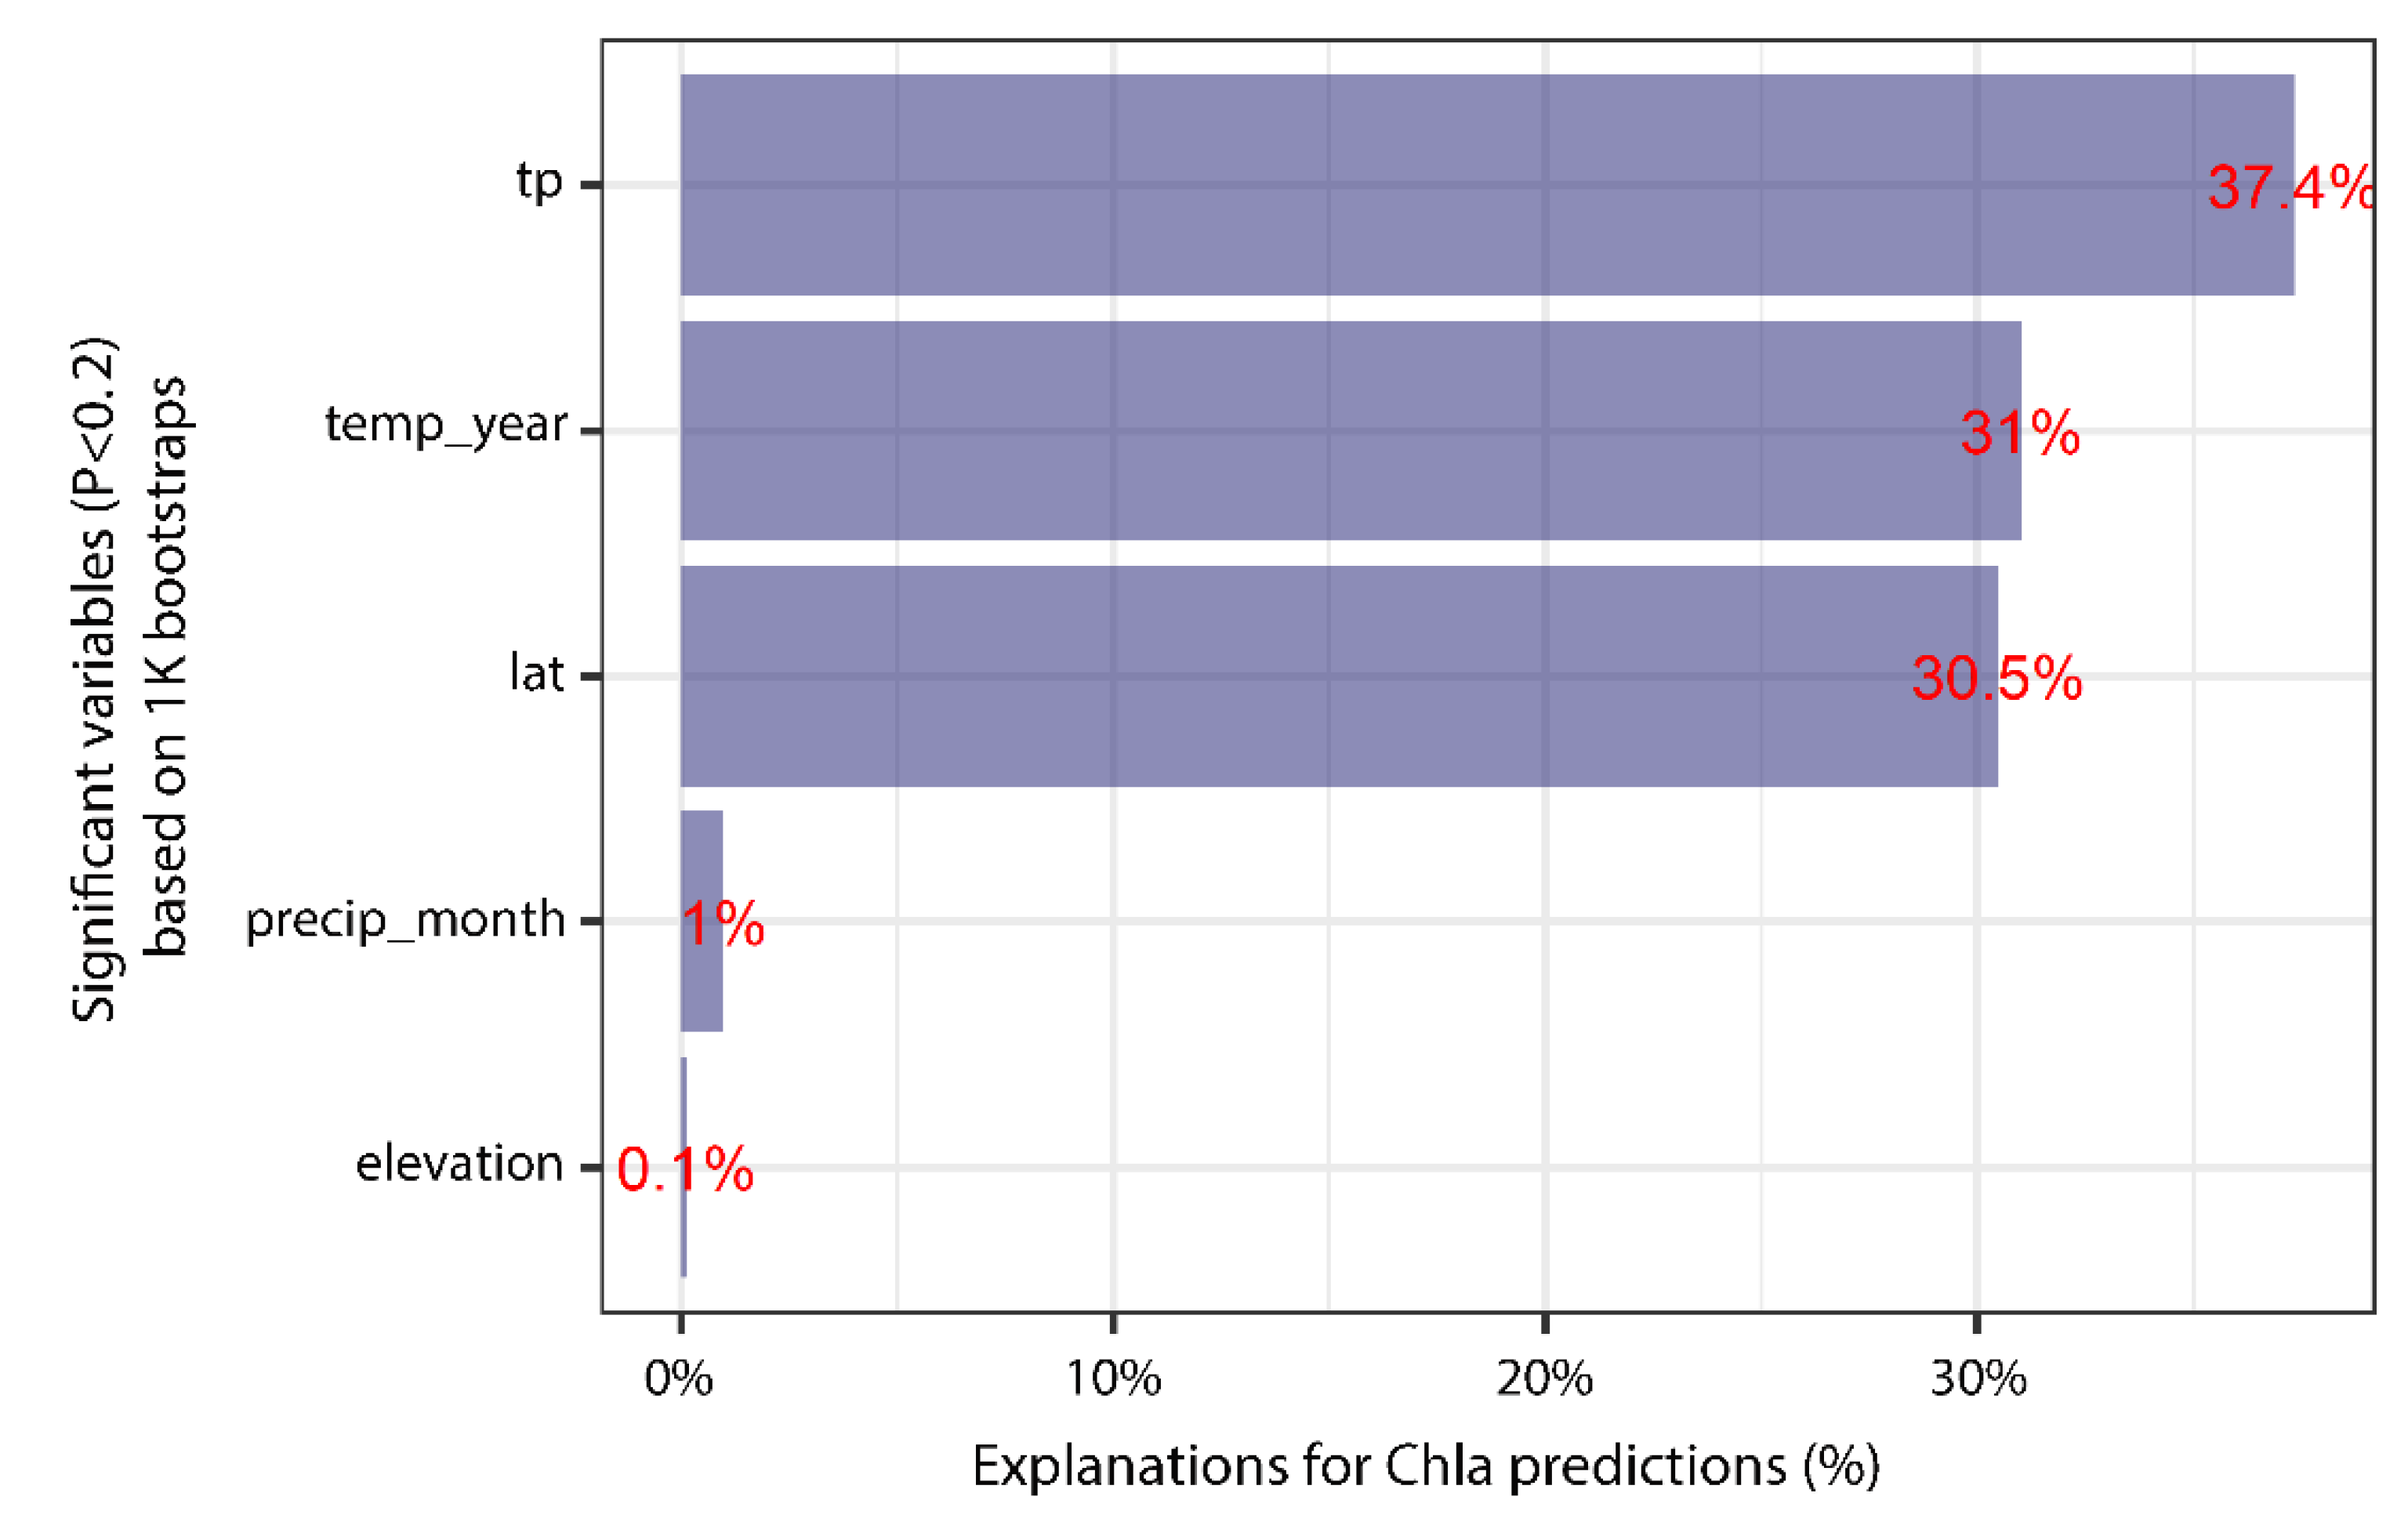
Based on 1000 times bootstrap resampling and ecological effects analysis at p < 0.2, the standardized coefficient values showed that of all the predictors affecting chlorophyll a concentration, TP was the most important and had the strongest explanatory power for chlorophyll a concentration, as it had the highest standardized coefficient (0.374), while the mean annual temperature was the second most important (0.310) and latitude was the third most important (0.305) in contrast to mean monthly precipitation which had a standardized coefficient of only 0.01 for chlorophyll a concentration and a solved standardized coefficient of only 0.001 for altitude (Figure 7).
4. Discussion
Lakes are among the most important freshwater resources on Earth. Chlorophyll a is an important indicator for primary productivity assessment, eutrophication control, and aquatic ecological restoration in lakes and chlorophyll a concentration is influenced by many factors. Further understanding of the relationship between chlorophyll a concentration and environmental factors can provide a better understanding of the state of nutrients in lake waters and a theoretical basis for the protection and management of lake waters.
The various influencing factors are not simply linearly related to each other, but show a strong correlation (Figure 3); e.g., chlorophyll a concentration and TP showed a very significant positive correlation, TP and TN showed a very significant positive correlation, but chlorophyll a concentration and TN showed a very significant negative correlation, while TN and lake average depth showed a very significant positive correlation and a very significant negative correlation with annual average temperature and a significant positive correlation with altitude; monthly average precipitation was negatively correlated with latitude and positively correlated with annual average temperature. Traditional regression analysis cannot be used to analyze the complex relationships between environmental factors and chlorophyll a concentration. In contrast, the random forest model and the GLM can be applied to nonlinear data without the requirement of relative independence between variables. Combined with the high predictive accuracy of the random forest model and its ability to filter for characteristic variables, the importance of all variables can be ranked objectively to determine the relative importance of each environmental variable on chlorophyll a concentration. In addition, the GLM was also chosen for further analysis because standardization coefficients are used to determine the degree of importance of each predictor variable for the outcome variable and can be used to determine the degree of influence of each predictor variable on the outcome variable with all other predictor variables held constant in the GLM [19].
The results of the GLM with a biological statistical effect (p < 0.05) and an ecological effect (p < 0.2) show that TP, annual average temperature, and lake latitude are the main environmental factors affecting chlorophyll a concentration, which is the same as the conclusion of the random forest model, and consistent with the results obtained by Guanggui et al. [20] and by Xia and Zeng [21]. The correlation matrix analysis, the random forest model, and the generalized linear model (p < 0.05) all indicated that TP had the strongest explanatory power for chlorophyll a concentration. which is consistent with the conclusion of Ma and Wang’s research on Chaohu Lake [22]. Phosphorus, one of the main nutrients affecting phytoplankton growth, is distributed differently in different waters. For example, in the waters where human activities are more frequent and where domestic and industrial and agricultural wastewater is discharged into the lake, phosphorus concentrations are also relatively high, which often results in a high frequency of water blooms. Chlorophyll a concentration was positively correlated with monthly precipitation, but the correlation was very insignificant, which is consistent with the research results of Wu et al. [23]. We believe that the effect of precipitation on chlorophyll a concentration was mediated by soil through the scouring effect of rainwater, which carries nutrients from the soil into lakes and then affects the chlorophyll a concentration. In addition, the research of Tang et al. showed that iron in the soil could regulate the concentration of TP in lakes and reservoirs by precipitation, thereby affecting the relationship between TP and chlorophyll a concentration [24]. The effect of soil on chlorophyll a concentration in lakes remains to be further investigated.
The GLM showed that TP had a highly significant positive correlation with chlorophyll a concentration and a highly significant negative correlation with TN (p < 0.05), whereas Wang et al. showed that chlorophyll a concentrations in Lake Baiyangdian waters showed a highly significant positive correlation with both TP and total nitrogen [25]. We believe that there are three reasons for this. One reason is the difference in water body types. Zou et al. classified lakes in the eastern plain of China into four types, in which different types of lakes showed different correlations between TN and chlorophyll a concentrations [26]. The second reason is the influence of human activities, agricultural land, domestic sewage, and waste liquid discharge affect the TN and other indicators in the water and indirectly affect the relationship between TN and chlorophyll a concentration. Thirdly, the explanatory power of environmental factors on chlorophyll a concentration may vary in different seasons. Liu et al. showed that TP explained more of the variation in chlorophyll a concentration in spring and summer, while TN explained more of the chlorophyll a concentration in autumn, which is one aspect of this reason [27]. In actual water bodies, nutrients are present in various forms and have different effects on chlorophyll a concentration. Kong et al. showed that PIP was more easily used by phytoplankton than POP in the study of the spatial and temporal distribution of particulate phosphorus in Taihu Lake [28]. NH4+ and NO3− as sources of nitrogen available for phytoplankton growth have a greater impact on chlorophyll a concentration compared to other forms of nitrogen sources.
This paper was based on the random forest model and the GLM to predict chlorophyll a concentration and performed well. However, using only comprehensive statistical chlorophyll a concentration data for each year does not provide a more specific and intuitive representation of the distribution in different spatial and temporal patterns, as well as in different forms of nutrients, without achieving a specific delineation. In future studies, more continuous data can be collected to further improve and optimize the model and provide a theoretical basis for the protection and management of lake waters.
5. Conclusions
- The random forest model was used to objectively screen hyperparameters to rank the degree of importance of the correlation between chlorophyll a concentration and environment-related factors, with the order of importance being TP > TN > longitude > latitude > monthly precipitation > elevation > mean annual temperature. Both the random forest model and the GLM showed that TP had the greatest effect on chlorophyll a concentration.
- The random forest model of lake chlorophyll a concentration was constructed with the coefficient of determination (R2) of 0.9997 and the root-mean-square error (RMSE) of 0.0010.
- Both the random forest model and the GLM suggest that TP is the main influence on chlorophyll a concentration, as are longitude, latitude, mean annual temperature, and mean monthly precipitation
Supplementary Materials
The following supporting information can be downloaded at: https://www.mdpi.com/article/10.3390/w14193128/s1, Table (data_all.csv and data_model.csv).
Author Contributions
Methodology, F.W., J.L., Q.L. and X.L.; software, F.W., H.H. and W.W.; writing—original draft preparation, H.H. and J.F.; writing—review and editing, F.W. and S.X.; funding acquisition, J.F. All authors have read and agreed to the published version of the manuscript.
Funding
This research was funded by the Nature Science Foundation of China (No. 31770223) and the Excellent Achievement Cultivation Project of Higher Education in Shanxi (No. 2020KJ029).
Institutional Review Board Statement
Not applicable.
Informed Consent Statement
Not applicable.
Data Availability Statement
Not applicable.
Acknowledgments
The first author thanks Jianqing Meng for assistance in the process of revising the images.
Conflicts of Interest
The authors declare no conflict of interest.
References
- Kim, H.G.; Hong, S.; Chon, T.-S.; Joo, G.-J. Spatial patterning of chlorophyll a and water-quality measurements for determining environmental thresholds for local eutrophication in the Nakdong River basin. Environ. Pollut. 2021, 268, 115701. [Google Scholar] [CrossRef] [PubMed]
- Deng, J.; Chen, F.; Hu, W.; Lu, X.; Xu, B.; Hamilton, D.P. Variations in the Distribution of Chl-a and Simulation Using a Multiple Regression Model. Int. J. Environ. Res. Public Health 2019, 16, 4553. [Google Scholar] [CrossRef] [Green Version]
- Bi, J. Spatial-temporal Characteristics of Chlorophyll-a and Its Relationship with Influence Factors in the Estuaries of South Taihu Lake. Master’s Thesis, Zhejiang University of Technology, Zhejiang, China, 2020. [Google Scholar]
- Roberto, Q.; Alessandro, F.; Octavia, M.; Arnab, S.; Kevin, B.; Carolyn, E.; Luke, M.; Gray, D.K.; O’Reilly, C.M.; Sapna, S. Relationships of total phosphorus and chlorophyll in lakes worldwide. Limnol. Oceanogr. 2020, 66, 392–404. [Google Scholar] [CrossRef]
- Zhang, Z.Y.; Niu, Y.; Yu, H.; Niu, Y. Relationship of Chloorphy-a Content and Environment Factors in Lake Taihu based on GAM Model. Res. Environ. Sci. 2018, 31, 886–892. [Google Scholar] [CrossRef]
- Nisaul, C.W.; Hone-Jay, C. Estimating chlorophyll-a concentrations in tropical reservoirs from band-ratio machine learning models. Remote Sens. Appl. Soc. Environ. 2022, 25, 100678. [Google Scholar]
- Xiaodong, T.; Mutao, H. Inversion of Chlorophyll-a Concentration in Donghu Lake Based on Machine Learning Algorithm. Water 2021, 13, 1179. [Google Scholar] [CrossRef]
- Xu, Y.; Dong, X.; Wang, J. Use of Remote Multispectral Imaging to Monitor Chlorophyll-a in Taihu Lake:A Comparison of Four Machine Learning Models. J. Hydroecology 2019, 40, 48–57. [Google Scholar] [CrossRef]
- Zhenmei, L.; Nan, Z.; Xuan, W.; Chunhui, L.; Qiang, L. Machine Learning-Based Prediction of Chlorophyll-a Variations in Receiving Reservoir of World’s Largest Water Transfer Project—A Case Study in the Miyun Reservoir, North China. Water 2021, 13, 2406. [Google Scholar] [CrossRef]
- Hang, X.; Cao, Y.; Hang, R.R.; Xu, M.; Huo, Y.; Sun, L.X.; Zhu, S.H. Estimation Model of Chlorophyll-a Concentration in Taihu Lake Based on Random Forest Algorithm and Gaofen Observations. Meteorol. Mon. 2021, 47, 1525–1536. [Google Scholar]
- Liu, Y.; Wu, H. Water Bloom Early Warning Model Based on Random Forest. Yellow River 2018, 40, 75–77+90. [Google Scholar] [CrossRef]
- Ge, J.J.; Zhang, W.H.; Peng, W.Q.; Huang, W.; Qu, X.D. A review of the construction method of flow-ecology relationships. Water Resour. Hydropower Eng. 2020, 51, 23–29. [Google Scholar] [CrossRef]
- Filazzola, A.; Mahdiyan, O.; Shuvo, A.; Ewins, C.; Moslenko, L.; Sadid, T.; Blagrave, K.; Imrit, M.A.; Gray, D.K.; Quinlan, R.; et al. A database of chlorophyll and water chemistry in freshwater lakes. Sci. Data 2020, 7, 310. [Google Scholar] [CrossRef] [PubMed]
- Meyer, M.F.; Labou, S.G.; Cramer, A.N.; Brousil, M.R.; Luff, B.T. The global lake area, climate, and population dataset. Sci. Data 2020, 7, 174. [Google Scholar] [CrossRef] [PubMed]
- Messager, M.L.; Lehner, B.; Grill, G.; Nedeva, I.; Schmitt, O. Estimating the volume and age of water stored in global lakes using a geo-statistical approach. Nat. Commun. 2016, 7, 13603. [Google Scholar] [CrossRef]
- Lv, H.Y.; Feng, Q. A review of random forests algorithm. J. Hebei Acad. Sci. 2019, 36, 37–41. [Google Scholar] [CrossRef]
- Breiman, L. Random Forests. Mach. Learn. 2001, 45, 5–32. [Google Scholar] [CrossRef] [Green Version]
- Wang, X.M.; Dong, J.J. Estimation of the Aboveground Biomass of Desert Steppe and Typical Steppe in Inner Mongolia Using Generalized Linear Model. Acta Agrestia Sin. 2020, 28, 1711–1718. [Google Scholar]
- Zuur, A.F.; Ieno, E.N. A protocol for conducting and presenting results of regression-type analyses. Methods Ecol. Evol. 2016, 7, 636–645. [Google Scholar] [CrossRef] [Green Version]
- Zhang, G.G. Spatial-Temporal Distribution of Chlorophyll-a and Its Correlation with Environment Factors in Dongting Lake. Environ. Monit. China 2016, 32, 84–90. [Google Scholar] [CrossRef]
- Xia, J.; Zeng, J. Environmental factor assisted chlorophyll-a prediction and water quality eutrophication grade classification: A comparative analysis of multiple hybrid models based on a SVM. Environ. Sci. Water Res. Technol. 2021, 7, 1040–1049. [Google Scholar] [CrossRef]
- Ma, H.; Wang, Y. Correlation between chlorophyll-a and related environmental factors based on Copula in Chaohu Lake, China. IOP Conf. Ser. Earth Environ. Sci. 2018, 108, 042076. [Google Scholar] [CrossRef]
- Wu, D.H.; Jia, G.H.; Wu, H.Y. Chlorophyll-a concentration variation characteristics of the algae-dominant and macrophyte-dominant areas in Lake Taihu and its driving factors,2007-2019. J. Lake Sci. 2021, 33, 1364–1375. [Google Scholar] [CrossRef]
- Tang, Q.; Liang, P.; Yang, Y.; Lin, Q.; Qian, S.S.; Han, B.-P. Total phosphorus-precipitation and Chlorophyll a-phosphorus relationships of lakes and reservoirs mediated by soil iron at regional scale. Water Res. 2019, 154, 136–143. [Google Scholar] [CrossRef]
- Wang, J.; Liu, C.; Bai, J. Relationship between size-fractionated Chlorophyll a and environmental factors in Lake Baiyangdian, China. Procedia Environ. Sci. 2012, 13, 1553–1558. [Google Scholar] [CrossRef] [Green Version]
- Zou, W.; Zhu, G.; Cai, Y.; Vilmi, A.; Xu, H.; Zhu, M.; Gong, Z.; Zhang, Y.; Qin, B. Relationships between nutrient, chlorophyll a and Secchi depth in lakes of the Chinese Eastern Plains ecoregion: Implications for eutrophication management. J. Environ. Manag. 2020, 260, 109923. [Google Scholar] [CrossRef]
- Liu, L.; Dong, Y.; Kong, M.; Zhou, J.; Zhao, H.; Wang, Y.; Zhang, M.; Wang, Z. Towards the comprehensive water quality control in Lake Taihu: Correlating chlorophyll a and water quality parameters with generalized additive model. Sci. Total Environ. 2020, 705, 135993. [Google Scholar] [CrossRef] [PubMed]
- Kong, M.; Chao, J.; Zhuang, W.; Wang, P.; Wang, C.; Hou, J.; Wu, Z.; Wang, L.; Gao, G.; Wang, Y. Spatial and Temporal Distribution of Particulate Phosphorus and Their Correlation with Environmental Factors in a Shallow Eutrophic Chinese Lake (Lake Taihu). Int. J. Environ. Res. Public Health 2018, 15, 2355. [Google Scholar] [CrossRef] [PubMed]
Figure 1.
Distribution of lakes with measured chlorophyll a values in China (the top and right graphs represent the distribution of the chlorophyll a concentration content at different latitudes and longitudes, respectively).
Figure 1.
Distribution of lakes with measured chlorophyll a values in China (the top and right graphs represent the distribution of the chlorophyll a concentration content at different latitudes and longitudes, respectively).

Figure 2.
Violin chart of the lake parameter data distribution.

Figure 3.
Visual graph of the correlation coefficient between parameters. The upper right is the calculated correlation between the two parameters, r > 0 represents the positive correlation, and r < 0 represents the negative correlation, indicating the degree of significance; * p < 0.05; ** p < 0.01; *** p < 0.001); the lower left is a square drawn according to the correlation degree value. Purple represents a positive correlation between variables, and green represents a negative correlation between variables. The deeper the color, the stronger the visibility between the two factors.

Figure 4.
Order of importance of the random forest model variables.

Figure 5.
Comparison of the predicted and actual chlorophyll a concentration in the random forest model (the depth of point color represents the number of the value).
Figure 5.
Comparison of the predicted and actual chlorophyll a concentration in the random forest model (the depth of point color represents the number of the value).

Figure 6.
Generalized linear regression analysis.

Figure 7.
Variable interpretation rate based on ecological effects (p < 0.2).

Publisher’s Note: MDPI stays neutral with regard to jurisdictional claims in published maps and institutional affiliations. |
© 2022 by the authors. Licensee MDPI, Basel, Switzerland. This article is an open access article distributed under the terms and conditions of the Creative Commons Attribution (CC BY) license (https://creativecommons.org/licenses/by/4.0/).
Share and Cite
MDPI and ACS Style
Huang, H.; Wang, W.; Lv, J.; Liu, Q.; Liu, X.; Xie, S.; Wang, F.; Feng, J. Relationship between Chlorophyll a and Environmental Factors in Lakes Based on the Random Forest Algorithm. Water 2022, 14, 3128. https://doi.org/10.3390/w14193128
AMA Style
Huang H, Wang W, Lv J, Liu Q, Liu X, Xie S, Wang F, Feng J. Relationship between Chlorophyll a and Environmental Factors in Lakes Based on the Random Forest Algorithm. Water. 2022; 14(19):3128. https://doi.org/10.3390/w14193128
Chicago/Turabian StyleHuang, Hanjie, Wei Wang, Junping Lv, Qi Liu, Xudong Liu, Shulian Xie, Fei Wang, and Jia Feng. 2022. "Relationship between Chlorophyll a and Environmental Factors in Lakes Based on the Random Forest Algorithm" Water 14, no. 19: 3128. https://doi.org/10.3390/w14193128
Note that from the first issue of 2016, this journal uses article numbers instead of page numbers. See further details here.